consortium on process in porous media foam experiments at high temperature and high salinity josé...
TRANSCRIPT

Consortium on Process in porous Media
Foam experiments at high temperatureAnd high salinity
José LópezMaura Puerto
Clarence MillerGeorge Hirasaki
03/14/2011
1
Outline:
•Oil properties and oil preparation:IFTViscosity of simulated live crude oil
•Salinity issues in the system:Analysis of synthetic bines
•Foam experiments: Surfactants used Apparatus description Mapping corefloods Foam results Foam with crude oil
2

OIL PROPERTIES AND OIL PREPARATION
Part I
3
Crude oil needs to be free of contaminants and should simulate live oil

4
Oil-BrineIFT range *
* John R. Fanchi Principles of Applied Reservoir Simulation 3 rd edition 2006 Elsevier** G. Hirasaki and D.L. Zhang, "Surface Chemistry of Oil Recovery from Fractured, Oil-Wet, Carbonate Formations," SPEJ (June 2004) 151-162.
The crude oils must be free of surface active materials such as emulsion breaker, scale inhibitor, or rust inhibitor. A simple test to verify contamination of the oil samples is to measure the interfacial tension (IFT) of crude oil with synthetic brine **
IFT measurements to screen contaminated samples
1.65 mm
Vdrop=0.0608 cm3
Crude 1Crude 2Crude 3Crude 4

5
Iso-octane was used for making a simulated live oil, i.e., with the same viscosity at reservoir temperature, as suggested by Nelson (1983).
However, adding isooctane to the dead crude oil produced precipitation of asphaltenes. Ratios of crude oil:isooctane ranging from 4:1 to 9:1 at room temperature show immediate precipitation of asphaltenes. Cyclohexane was mixed at room temperature with minimal precipitation of asphaltenes. Then this solvent was used to modify the viscosity of the dead crude oil to obtain simulated live crude oil with the same viscosity of the live crude oil.
Simulated live crude oil
Dead crude oil
Live crude oil
Adapted from Core Laboratories, IncPage 10 of 15, File: RFL 81350 (Dallas, TX)

6
)xx(BAxxlnxlnxln 21212211 A=2.614,B= - 0.89
Viscosity of mixtures of dead crude oil and Cyclohexane measured in the falling sphere viscometer at 113.9 °C
Every experimental point is theAverage of 20 measurements Precision error less than 3%
Dead crude Oil
Cyclohexane
= 2.8 cP
The mol fraction of (Crude 1) dead crude oil to match the viscosity of live crude oil is 0.59. This experiment was conducted in a sealed falling sphere viscometer. The mol fraction was calculated using a molecular weight for the crude oil of 303 kg/kg-mol
Lopez et al Viscometer for Opaque, Sealed Microemulsion Samples, SPE 121575 (2009) IRS : inductive ring sensors
IRS

7
Dead crude oil mass percentage 83.7%, the rest is cyclohexane.
Cyclohexane 16.3% mass = 18.7% volume = 41.25% mol
Results of the simulated live crude oil
Oil Molar mass (g/mol)
Viscosity (cP)
Pressure (Psia)
Rice Simulated live crude oil
(16.3% Cyclohexane)
212.7 2.8 14.7
Simulated 2 LCO(30% Cyclohexane)
170.2 2.0 14.7
Live crude oil 176.3 2.8 3514.7
Dead crude oil 303 (*) 8.3 14.7
(*) Via Benzene point depression (Core Labs)
Viscosities at 114 °C

Remarks of part I
8
Crude oils are free of surface active materials such as emulsion breaker, scale inhibitor, or rust inhibitor.
Dead crude oil was mixed with cyclohexane to match viscosity of the live crude oil.

SALINITY OF BRINES USED IN THE EXPERIMENT
Part II
9
Brines should be under saturated in order to prevent precipitation

•The sea water has an equivalent of 1.6147 g of CaS04 per kilogram of water (*)•The formation brine has an equivalent of 0.718 g of CaSO4 per kilogram of water (*)•Incremental solubility is the additional CaSO4 needed to saturate the brine 10
Incremental solubility of CaSO4 (ScaleChem)*For synthetic formation brine
Temperature of experiments
94°C

FOAM EXPERIMENTS
Part III
11

PE
PE
PE
PE
T
N2
Surfactant pump
Gas flowcontroller
Po
rou
s m
ed
ia
ho
lde
r
Oven Heat in
Heat out
N2
Relief valve
Thermocouple
Pressuretransducer
12
Experimental set up
First section
Second
section

Triton X-200, Alkyl Aryl poly (ethylenoxy) sulfonate
C9H19 (-O-C2H4)8.6-SO3- Na+
Hydrophilic surfactant
13
C20-24 IOS, Internal Olefine sulfonateHydroxyalkane Sulfonates + Alkene Sulfonates
SO3-Na SO3-Na │ │
R-CH2-CH2- CH –CH -CH2-CH2-R’ + R-CH2 – CH-CH= CH-CH2-R’ │ OH
Lipophilic surfactantCH3(CH2)n(CH2)2CH(SO3Na)CH(OH)(CH2)2(CH2)mCH3 n+m=14
SURFACTANTS
— (OCH2CH2) 9.5 OHH3C— C —CH2 — C —
CH3 CH3
CH3 CH3
| |
| |
Triton X-100Octylphenol ethylene oxide condensate

Initial foam experiments
14
Objective: Understand how foam performs with and without oilUsing surfactant blends with aid of mapping corefloods concept

ExpNo. Crude Oil SurfactantSolution
Injection rate of liquid (ft/day)
Foam injection (L/G) ratio
Brine Triton to IOS ratio
1No SW 100-0 27-7
2 PV of foam
Variable
Gas
2 Yes SW 70-30 203.25 PV of aqueous
surfactant 2.85
Foam
3Yes FB 60-40 20
¼ PV of aqueous surfactant
1.33
Foam
5 (*)Yes FB 90-10 3-17
¼ PV of aqueous surfactant
0.74Foam
6 Yes FB-SW50-50
70-30 3
¼ PV of aqueous surfactant
0.83Foam
Gas-Brine
7Yes SW 50-50 6-12
3/4 PV of aqueous surfactant
1.13Foam
15

0
10
20
30
40
50
60
70
80
90
1000
10
20
30
40
50
60
70
80
90
100
0 10 20 30 40 50 60 70 80 90 100
C 20-24 IOS →
Trito
n X
200
→
Formation Brine →
← Sea Water100 90 80 70 60 50 40 30 20 10 0
1
2
3
5
6
7
Type IDesirable
•Surfactant propagation• Foam formation
Type II
Undesirable
Str
onge
r
foam
Low oil recovery
High oil recovery
16
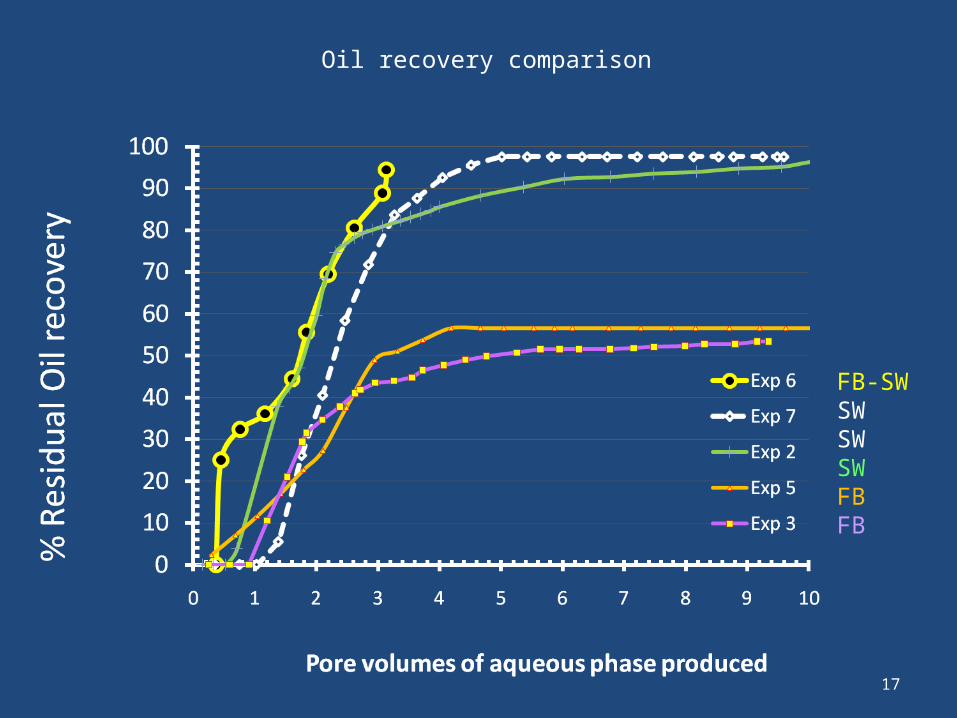
Oil recovery comparison
17
FB-SWSWSWSWFBFB

Remarks from previous foam experiments
•Stronger foam was generated when Triton X-200 to IOS ratio was higher•Stronger foam was generated at lower salinity•Higher oil recoveries were obtained when injection composition was in the Type I region and far from injecting at formation brine .•Foam is weaker when crude oil is present•Phase behavior map (surfactant blend – brine blend) can be used to plan core flood experiments 18

New foam experiments
19
Objective: Understand how foam performs with new formulations

Hydrophilic surfactant
20
C20-24 IOS, Internal Olefine sulfonateHydroxyalkane Sulfonates + Alkene Sulfonates
SO3-Na SO3-Na │ │
R-CH2-CH2- CH –CH -CH2-CH2-R’ + R-CH2 – CH-CH= CH-CH2-R’ │ OH
Lipophilic surfactantCH3(CH2)n(CH2)2CH(SO3Na)CH(OH)(CH2)2(CH2)mCH3 n+m=14
SURFACTANTS for Rice Formulation
C12-15H25-31 (-O-C2H4)7-SO3- Na+
Avanel S70

2121
Type II
90°C

22
New Rice BlendSurfactant at 1% in sea water: Avanel S70 / C20-24 IOS (60/40)
Foam was generated at selected test conditions in both zones, 94°C
First section
Second section
Inlet →←First Section
←Second section

23
Foam Experiment (Effect of liquid flow )Surfactant Avanel S70 C20-24 IOS (60:40) at 1% mass in sea water using gas N2
The first and the second sections were able to produce strong foam, the exception was for a flowrate of 0.25 cm3/min of liquid, producing only foam in the first section of the sand pack.
Gas flow rate is reported in sccm.Liquid superficial velocities were in the range from 2.8 to 11.5 ft/day

24
Foam Experiment (Effect of gas flow )Surfactant Avanel S70- C20-24 IOS (60:40) at 1% mass in sea water using gas N2
The first and the second sections were able to produce strong foam, the exception was for a flowrate of 0.25 cm3/min of liquid, producing only foam in the first section of the sand pack.

25
First section
Second section
1 Liquid PV = 116 min @ 0.5 cm3/min
Case: Cutting the liquid flow rate (verification of importance of liquid rate)

26
Effluent of the foam generated with the New Rice Blend.

Remarks from new foam experiments
•New Rice Blend produced strong foam at 1% mass in sea water through silica sand.
27

Acknowledgements
Consortium on Process in porous MediaPEMEX
Roberto Rocca FundationITESM
28

End
29

Backup slides
30

Conditions Experiment 7
• Initial residual oil (20%)• Absolute permeability 132.7 darcy• KW,RO=35.0 darcy (rel perm 0.24)
• KO,IW=86.73 darcy (rel perm 0.65)
31

Oil Recovery Exp 6
0
1000
100
0 100
C 20-24 IOS →
Trito
n X
200
→
Formation Brine →
Experiment 6
32

Experiment 6
0
1000
100
0 100
C 20-24 IOS →
Trito
n X
200
→
Formation Brine →
33

Experiment 6
34

Experiment 6
0
1000
100
0 100
C 20-24 IOS →
Trito
n X
200
→
Formation Brine →35

36
G real G L dP/dz G/(G+L) P gagecm3/min sccm cm3/min psi/ft psi
1.180 5 1 23 0.541312 691.520 5 0.5 18 0.752426 65
dP/dz
2.469 5 0.25 3 0.908066 402.469 10 0.5 26 0.831612 803.292 15 0.75 30 0.814469 904.390 20 1 28 0.814469 90
dP/dz
2.469 10 1 24 0.711761 801.317 5 1 20 0.568404 750.988 2.5 1 12 0.496915 50
InjectionVolume quality

37
P > 2 atm
Synthetic Lab Brine
pH=6.65, Alk=3.66 mg/dm3 as HCO3-
-2-1.5
-1-0.5
00.5
11.5
2
25 85 100 104 110 120
T (ºC)
SI
CaCO3
CaSO4
MgCO3
NaCl