consolidated report & accounts 1 - euronext · ii – consolidated management report appendix...
TRANSCRIPT

2013FIRSTHALFRESULTS
CONSOLIDATED REPORT & ACCOUNTS
1ST Half 2015

R&A - 1st Half 2015
Index
INDEX
I – Consolidated Management Report
Message from the Chairman and CEO - Pedro Soares dos Santos 3
1. Sales Analysis 3
2. Results Analysis 4
3. Balance Sheet 5
4. Outlook for 2015
6
II – Consolidated Management Report Appendix
1. Sales Evolution 7
2. Stores Network 7
3. EBITDA Margin Breakdown 7
4. Financial Costs Breakdown 7
5. Working Capital 8
6. Net Debt 8
7. Definitions 8
8. Information Regarding Individual Financial Statements 8
III – Other Information 9
IV – Statement of the Board of Directors 11
V – Consolidated Financial Statements
1. Financial Statements 12
2. Notes to the Financial Statements 16
3. Auditor’s Report 26

R&A - 1st Half 2015 Consolidated Management Report
3
CONSOLIDATED MANAGEMENT REPORT
Message from the Chairman and CEO – Pedro Soares dos Santos
‘As we expected, the first half year results show the positive effects of the strategy being executed in Biedronka. The Company’s performance in the period validates the effectiveness of the measures being implemented, its capacity to reinforce the leadership in the market and its relevance for consumers, even in a context of uncertainty regarding food deflation. Both Pingo Doce and Recheio continued to outperform the market in Portugal. In Colombia, a new distribution centre is being finalised and we will start operations in the second region in the third quarter of this year. Reassured by the performance of our established businesses, we will continue implementing our plan and we will deliver our targets for the year.’
1. Sales Analysis
(Million Euro) H1 15 H1 14 Q2 15 Q2 14
%
total %
total Pln Euro %
total %
total Pln Euro
Biedronka 4,499 67.7% 4,029 66.6% 10.6% 11.7% 2,327 67.3% 2,076 66.1% 9.8% 12.1%
Pingo Doce 1,623 24.4% 1,556 25.7%
4.3% 850 24.6% 812 25.9%
4.7%
Recheio 393 5.9% 374 6.2%
5.0% 213 6.2% 201 6.4%
5.8%
Mkt. Repr. and Rest. Serv. 37 0.5% 36 0.6%
1.3% 18 0.5% 19 0.6%
-1.0%
Others & Cons. Adjustments 93 1.4% 57 0.9% n.a. 48 1.4% 31 1.0% n.a.
Total JM 6,644 100% 6,052 100% 9.8% 3,457 100% 3,139 100% 10.1%
In the first half of the year, consolidated sales increased 9.8% to €6,644m (+9.1% excluding the positive currency impact).
The performance in the period reflects the good sales progression in all banners driving Group LFL growth to reach 3.1%. In Poland, the competitive landscape maintained a strong focus on promotional activities and food deflation prevailed in the market, despite softening from -3.7% in Q1 15 to -2.1% in Q2 15.
I
R&A - 1st Half 2015 Consolidated Management Report
4
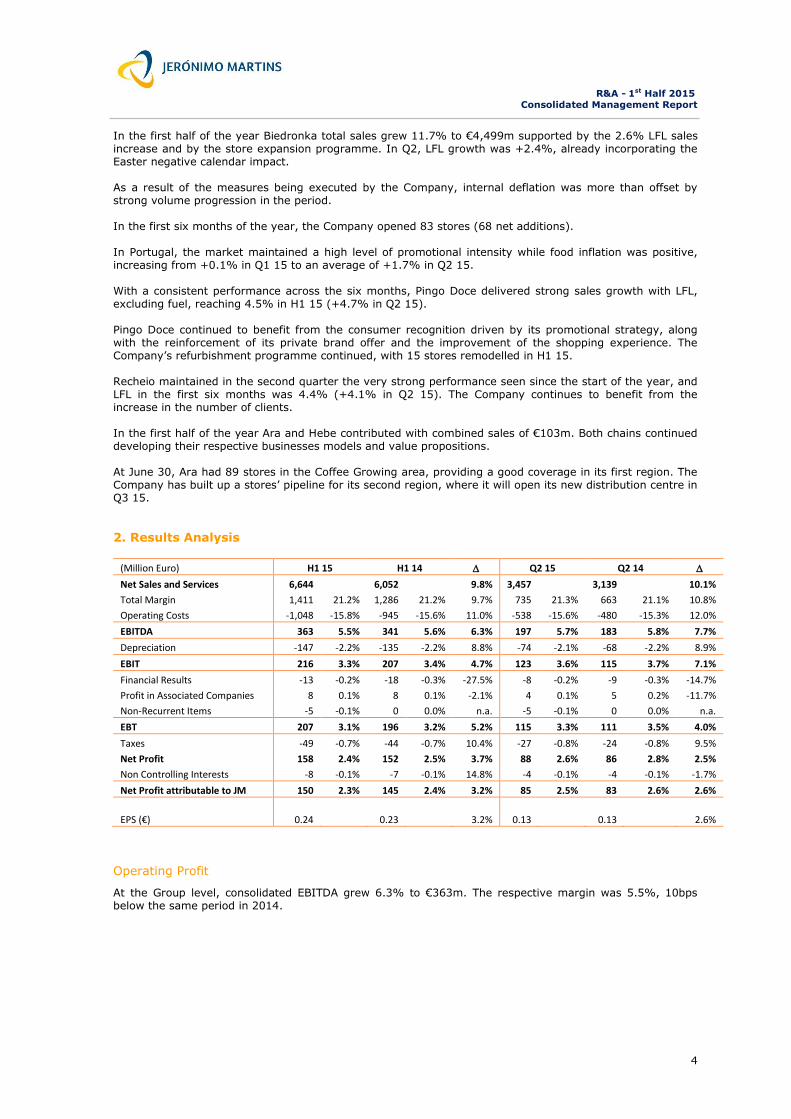
In the first half of the year Biedronka total sales grew 11.7% to €4,499m supported by the 2.6% LFL sales increase and by the store expansion programme. In Q2, LFL growth was +2.4%, already incorporating the Easter negative calendar impact. As a result of the measures being executed by the Company, internal deflation was more than offset by strong volume progression in the period. In the first six months of the year, the Company opened 83 stores (68 net additions). In Portugal, the market maintained a high level of promotional intensity while food inflation was positive, increasing from +0.1% in Q1 15 to an average of +1.7% in Q2 15. With a consistent performance across the six months, Pingo Doce delivered strong sales growth with LFL, excluding fuel, reaching 4.5% in H1 15 (+4.7% in Q2 15). Pingo Doce continued to benefit from the consumer recognition driven by its promotional strategy, along with the reinforcement of its private brand offer and the improvement of the shopping experience. The Company’s refurbishment programme continued, with 15 stores remodelled in H1 15. Recheio maintained in the second quarter the very strong performance seen since the start of the year, and LFL in the first six months was 4.4% (+4.1% in Q2 15). The Company continues to benefit from the increase in the number of clients. In the first half of the year Ara and Hebe contributed with combined sales of €103m. Both chains continued developing their respective businesses models and value propositions. At June 30, Ara had 89 stores in the Coffee Growing area, providing a good coverage in its first region. The Company has built up a stores’ pipeline for its second region, where it will open its new distribution centre in Q3 15.
2. Results Analysis
(Million Euro) H1 15 H1 14 Q2 15 Q2 14
Net Sales and Services 6,644
6,052
9.8% 3,457
3,139
10.1%
Total Margin 1,411 21.2% 1,286 21.2% 9.7% 735 21.3% 663 21.1% 10.8%
Operating Costs -1,048 -15.8% -945 -15.6% 11.0% -538 -15.6% -480 -15.3% 12.0%
EBITDA 363 5.5% 341 5.6% 6.3% 197 5.7% 183 5.8% 7.7%
Depreciation -147 -2.2% -135 -2.2% 8.8% -74 -2.1% -68 -2.2% 8.9%
EBIT 216 3.3% 207 3.4% 4.7% 123 3.6% 115 3.7% 7.1%
Financial Results -13 -0.2% -18 -0.3% -27.5% -8 -0.2% -9 -0.3% -14.7%
Profit in Associated Companies 8 0.1% 8 0.1% -2.1% 4 0.1% 5 0.2% -11.7%
Non-Recurrent Items -5 -0.1% 0 0.0% n.a. -5 -0.1% 0 0.0% n.a.
EBT 207 3.1% 196 3.2% 5.2% 115 3.3% 111 3.5% 4.0%
Taxes -49 -0.7% -44 -0.7% 10.4% -27 -0.8% -24 -0.8% 9.5%
Net Profit 158 2.4% 152 2.5% 3.7% 88 2.6% 86 2.8% 2.5%
Non Controlling Interests -8 -0.1% -7 -0.1% 14.8% -4 -0.1% -4 -0.1% -1.7%
Net Profit attributable to JM 150 2.3% 145 2.4% 3.2% 85 2.5% 83 2.6% 2.6%
EPS (€) 0.24 0.23 3.2% 0.13 0.13 2.6%
Operating Profit
At the Group level, consolidated EBITDA grew 6.3% to €363m. The respective margin was 5.5%, 10bps below the same period in 2014.

R&A - 1st Half 2015 Consolidated Management Report
5
Biedronka’s EBITDA, in the first six months, reached €305m, a growth of 8.6% on previous year (+8.6% in Q2 15). EBITDA margin stood at 6.8%, 20bps down on H1 14. The margin evolution reflected the strong food deflation together with the marketing investments made in the business. Pingo Doce delivered EBITDA of €77m, broadly in line with previous year. EBITDA margin was 20bps down on previous year, as the company focused in maintaining strong top line performance. To support its strong LFL growth, Recheio posted an EBITDA margin 10bps below previous year and delivered an EBITDA of €19m.
Financial Results
Financial charges for the Group were €13m, €5m below the same period last year due to lower average net debt and lower cost of debt.
Net Results
As a result of the solid operating performance, Net Profit attributable to Jerónimo Martins was €150m, 3.2% higher than in the prior year, already incorporating the start-up losses in Ara and Hebe of €29m at the EBITDA level, in the six months.
3. Balance Sheet
(Million Euro) H1 15 2014 H1 14 *
Net Goodwill 646 640 648
Net Fixed Assets 3,002 2,940 2,846
Total Working Capital -1,732 -1,778 -1,519
Others 110 111 114
Invested Capital 2,026 1,912 2,091
Total Borrowings 743 714 904
Leasings 0 1 3
Accrued Interest 6 4 8
Marketable Sec. & Bank Deposits -364 -446 -308
Net Debt 386 273 607
Non Controlling Interests 238 243 230
Share Capital 629 629 629
Reserves and Retained Earnings 773 767 625
Shareholders Funds 1,640 1,639 1,484
Gearing 23.5% 16.7% 40.9%
* Restated values - see note 2.3 of the Consolidated Financial Statements.
After the dividend payment of €154m in May, Net Debt for the Group was €386m and Gearing stood at 24%.
R&A - 1st Half 2015 Consolidated Management Report
6
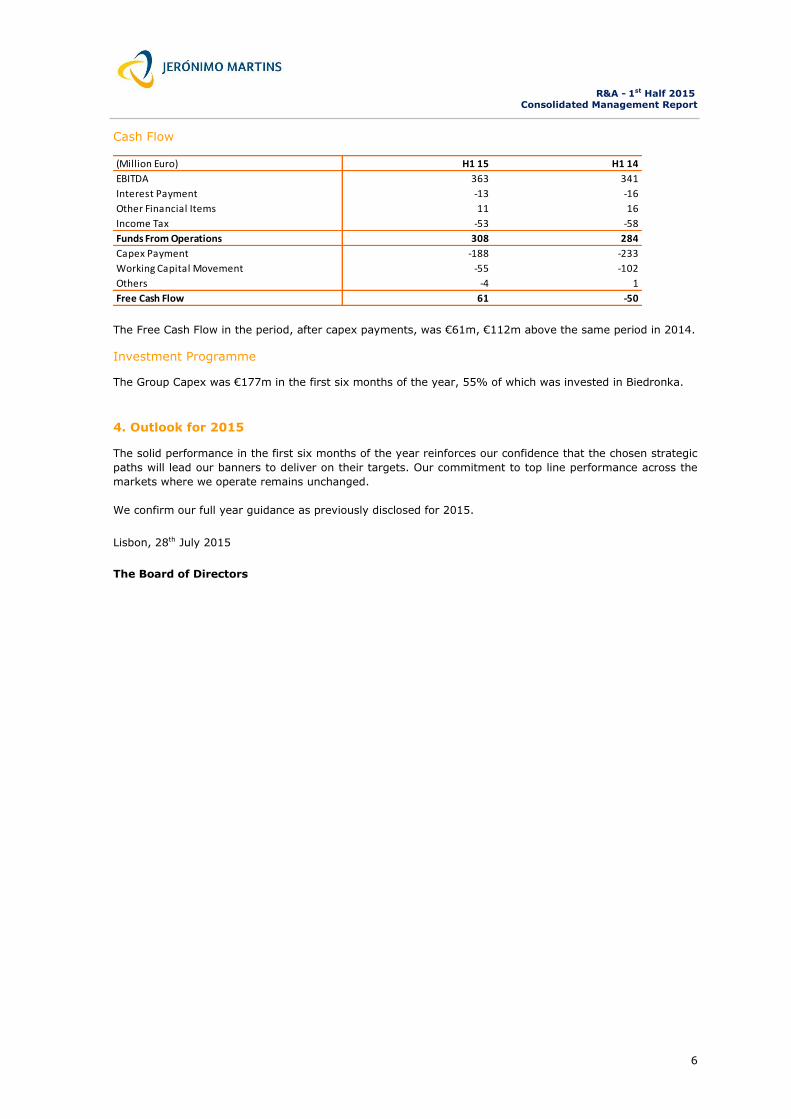
Cash Flow
(Million Euro) H1 15 H1 14
EBITDA 363 341
Interest Payment -13 -16
Other Financial Items 11 16
Income Tax -53 -58
Funds From Operations 308 284
Capex Payment -188 -233
Working Capital Movement -55 -102
Others -4 1
Free Cash Flow 61 -50
The Free Cash Flow in the period, after capex payments, was €61m, €112m above the same period in 2014.
Investment Programme
The Group Capex was €177m in the first six months of the year, 55% of which was invested in Biedronka.
4. Outlook for 2015
The solid performance in the first six months of the year reinforces our confidence that the chosen strategic
paths will lead our banners to deliver on their targets. Our commitment to top line performance across the
markets where we operate remains unchanged.
We confirm our full year guidance as previously disclosed for 2015.
Lisbon, 28th July 2015
The Board of Directors
R&A - 1st Half 2015
Consolidated Management Report Appendix
7
CONSOLIDATED MANAGEMENT REPORT APPENDIX
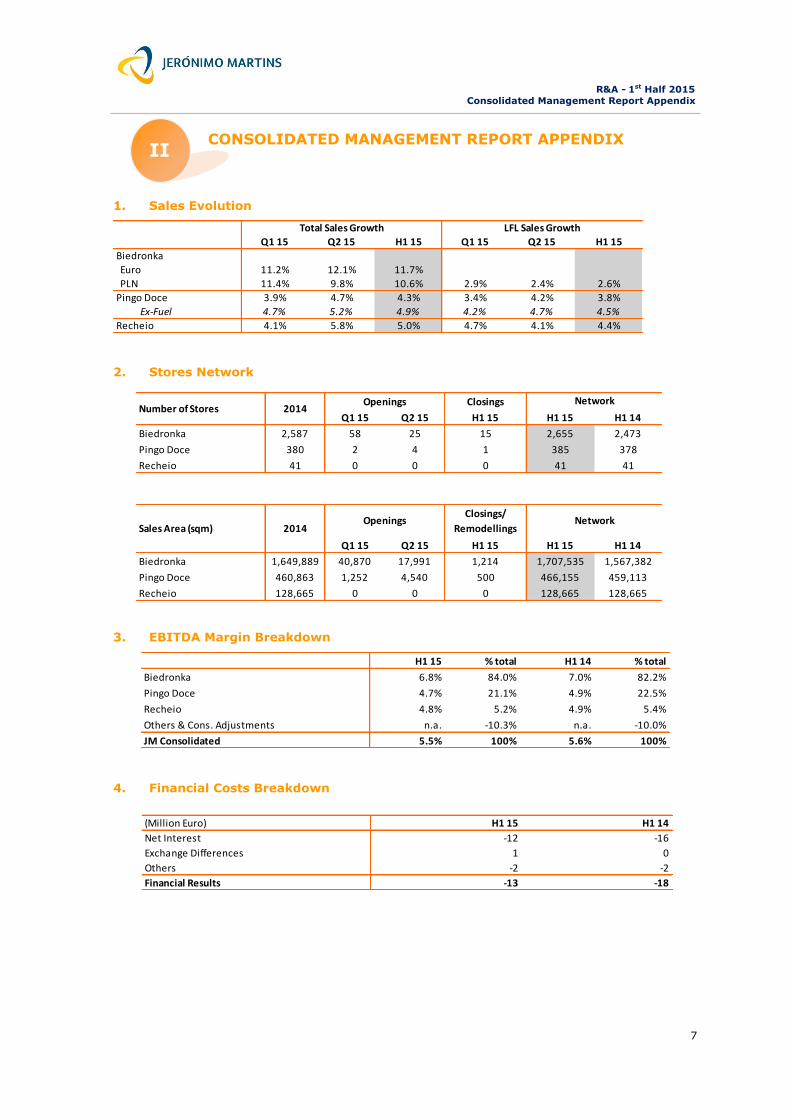
1. Sales Evolution
Q1 15 Q2 15 H1 15 Q1 15 Q2 15 H1 15
Biedronka
Euro 11.2% 12.1% 11.7%
PLN 11.4% 9.8% 10.6% 2.9% 2.4% 2.6%
Pingo Doce 3.9% 4.7% 4.3% 3.4% 4.2% 3.8%
Ex-Fuel 4.7% 5.2% 4.9% 4.2% 4.7% 4.5%
Recheio 4.1% 5.8% 5.0% 4.7% 4.1% 4.4%
Total Sales Growth LFL Sales Growth
2. Stores Network
Closings
Q1 15 Q2 15 H1 15 H1 15 H1 14
Biedronka 2,587 58 25 15 2,655 2,473
Pingo Doce 380 2 4 1 385 378
Recheio 41 0 0 0 41 41
Closings/
Remodellings
Q1 15 Q2 15 H1 15 H1 15 H1 14
Biedronka 1,649,889 40,870 17,991 1,214 1,707,535 1,567,382
Pingo Doce 460,863 1,252 4,540 500 466,155 459,113
Recheio 128,665 0 0 0 128,665 128,665
Network
NetworkNumber of Stores 2014
Openings
Sales Area (sqm) 2014Openings
3. EBITDA Margin Breakdown
H1 15 % total H1 14 % total
Biedronka 6.8% 84.0% 7.0% 82.2%
Pingo Doce 4.7% 21.1% 4.9% 22.5%
Recheio 4.8% 5.2% 4.9% 5.4%
Others & Cons. Adjustments n.a. -10.3% n.a. -10.0%
JM Consolidated 5.5% 100% 5.6% 100%
4. Financial Costs Breakdown
(Million Euro) H1 15 H1 14
Net Interest -12 -16
Exchange Differences 1 0
Others -2 -2
Financial Results -13 -18
II

R&A - 1st Half 2015
Consolidated Management Report Appendix
8
5. Working Capital
(Million Euro) H1 15 2014 H1 14
Inventories 648 578 600
in days of sales 18 17 18
Customers 56 49 54
in days of sales 2 1 2
Suppliers -2,088 -2,134 -1,961
in days of sales -57 -61 -59
Trade Working Capital -1,384 -1,507 -1,307
in days of sales -38 -43 -39
Others -348 -271 -212
Total Working Capital -1,732 -1,778 -1,519
in days of sales -47 -51 -45
6. Net Debt
(Million Euro) H1 15
Long Term Debt 334
as % of Total Borrowings 45.0%
Average Maturity (years) 3.0
Bond Loans 0
Other Debt 334
Short Term Debt 409
as % of Total Borrowings 55.0%
Total Borrowings 743
Average Maturity (years) 1.7
Leasings 0
Accrued Interest & Hedging 6
Marketable Securities & Bank Deposits -364
Net Debt 386
% Debt in Euros (Total Borrowings + Leasings) 30.3%
% Debt in Zlotys (Total Borrowings + Leasings) 58.5%
% Debt in Pesos (Total Borrowings + Leasings) 11.2% 7. Definitions
Like-for-like sales: sales made by stores that operated under the same conditions in the two periods. Excludes stores opened or closed in one of the two periods. Sales of stores that underwent profound remodelling are excluded for the remodelling period (store closure).
Gearing: Net Debt / Shareholder Funds.
8. Information Regarding Individual Financial Statements
In accordance with section b) of paragraph 3 of article 246 of the Portuguese Securities Code, the first half individual financial statements of Jerónimo Martins SGPS, S.A. will not be disclosed as they do not include additional relevant information, compared to the one presented in this report.

R&A - 1st Half 2015
Other Information
9
OTHER INFORMATION Disclosures required by sub-paras. a) and c) of no. 1 of Article 9 and no. 7 of Article 14 of Securities Market Commission (CMVM) regulation no. 5/2008 (with reference to
the first half of 2015)
1. Securities issued by the Company, Controlled or Controlling Companies or Companies in the same Group held by Company Officers
Board of Directors
Members of the Board of Directors
Held on
31.12.14
Increases
during the
period
Decreases
during the
period
Held on
30.06.15
Shares Bonds Shares Bonds Shares Bonds Shares Bonds
Pedro Manuel de Castro Soares dos Santos 274,805 - - - - - 274,805 -
Alan Johnson 30,075 - - - - - 30,075 -
Andrzej Szlezak - - - - - - - -
António Pedro de Carvalho Viana-Baptista - - - - - - - -
Artur Stefan Kirsten n.a. - - - - - - -
Clara Christina Streit n.a. - - - - - 800 -
Francisco Seixas da Costa - - - - - - - -
Hans Eggerstedt 19,700 - - - - - 19,700 -
Henrique Manuel da Silveira e Castro Soares dos Santos n.a. - - - - - 26,455 1 -
José Manuel da Silveira e Castro Soares dos Santos2 20,509 - - - - - n.a. -
Belonging to company in which is a Director 3 353,260,814 - - - - - n.a. -
Nicolaas Pronk - - - - - - - -
Belonging to company in which is a Director 4 31,464,750 - - - - - 31,464,750 -
Sérgio Tavares Rebelo - - - - - - - -
1 Of which 1,500 shares held by spouse. 2 Ceased his duties as Director on April 9, 2015. 3 Sociedade Francisco Manuel dos Santos, B.V. 4 Asteck, S.A.
Note: On April 9, 2015 the following members were appointed to the Board of Directors as Non-Executive Directors: Artur Stefan Kirsten, Clara Christina Streit and Henrique Manuel da Silveira e Castro Soares dos Santos.
Statutory Auditor
As at June 30th 2015, the Statutory Auditor PricewaterhouseCoopers & Associados, SROC, Lda., did not hold any shares and bonds of Jerónimo Martins, SGPS, S.A. and had not made any transactions in securities with Jerónimo Martins, SGPS, S.A..
III
R&A - 1st Half 2015
Other Information
10
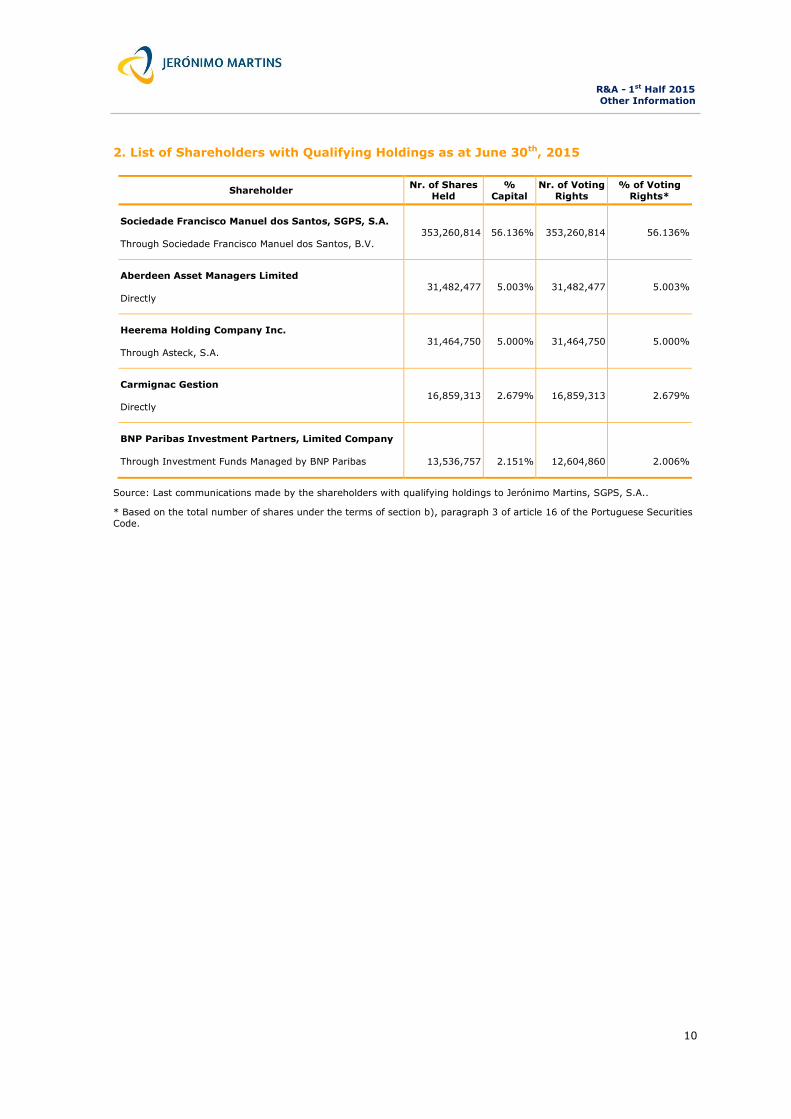
2. List of Shareholders with Qualifying Holdings as at June 30th, 2015
Shareholder Nr. of Shares
Held
%
Capital
Nr. of Voting
Rights
% of Voting
Rights*
Sociedade Francisco Manuel dos Santos, SGPS, S.A.
Through Sociedade Francisco Manuel dos Santos, B.V.
353,260,814 56.136% 353,260,814 56.136%
Aberdeen Asset Managers Limited
Directly
31,482,477 5.003% 31,482,477 5.003%
Heerema Holding Company Inc.
Through Asteck, S.A.
31,464,750 5.000% 31,464,750 5.000%
Carmignac Gestion
Directly
16,859,313 2.679% 16,859,313 2.679%
BNP Paribas Investment Partners, Limited Company
Through Investment Funds Managed by BNP Paribas
13,536,757
2.151%
12,604,860
2.006%
Source: Last communications made by the shareholders with qualifying holdings to Jerónimo Martins, SGPS, S.A..
* Based on the total number of shares under the terms of section b), paragraph 3 of article 16 of the Portuguese Securities
Code.

R&A - 1st Half 2015 Statement of the Board of Directors
11
STATEMENT OF THE BOARD OF DIRECTORS
Statement of the Board of Directors
Within the terms of paragraph c) n.º1 of article 246 of Portuguese Securities Code, we hereby inform you that to the best of our knowledge:
i) the information contained in the interim management report is a faithful statement of the
evolution of the businesses, of the performance and of the position of Jerónimo Martins, SGPS, S.A. and the companies included within the consolidation perimeter, and contains a description of the main risks and uncertainties which they face; and
ii) the information contained in the consolidated financial statements, as well as their annexes, was produced in compliance with the applicable accounting standards and gives a true and fair view of the assets and liabilities, the financial situation and the results of Jerónimo Martins, SGPS, S.A.
and the companies included in the consolidation perimeter.
Lisbon, 28th July 2015 Pedro Manuel de Castro Soares dos Santos (Chairman of the Board of Directors and Chief Executive Officer)
Alan Johnson (Member of the Board of Directors)
Andrzej Szlezak (Member of the Board of Directors)
António Pedro de Carvalho Viana-Baptista (Member of the Board of Directors and Member of the Audit Committee)
A. Stefan Kirsten (Member of the Board of Directors)
Clara Christina Streit (Member of the Board of Directors)
Francisco Seixas da Costa (Member of the Board of Directors)
Hans Eggerstedt (Member of the Board of Directors and Chairman of the Audit Committee)
Henrique Soares dos Santos (Member of the Board of Directors)
Nicolaas Pronk (Member of the Board of Directors)
Sérgio Tavares Rebelo (Member of the Board of Directors and Member of the Audit Committee)
IV

R&A - 1st Half 2015
Consolidated Financial Statements
12
CONSOLIDATED FINANCIAL STATEMENTS
CONSOLIDATED INCOME STATEMENT BY FUNCTIONS
FOR JUNE 2015 AND 2014
Euro thousand
Notes 1st Half 2015
1st Half 2014
2nd Quarter 2015
2nd Quarter 2014
Sales and services rendered 3 6,643,998 6,051,713 3,456,824 3,139,255
Cost of sales 4 (5,232,736) (4,765,732) (2,721,822) (2,475,848)
Total margin 1,411,262 1,285,981 735,002 663,407
Distribution costs 4 (1,085,703) (973,115) (557,248) (494,888)
Administrative costs 4 (109,262) (106,308) (54,437) (53,349)
Exceptional operating profits/losses 4 (4,713) (493) (4,672) (218)
Operating profit 211,584 206,065 118,645 114,952
Net financial costs 5 (12,939) (17,837) (7,836) (9,189)
Gains in joint ventures and associates 9 7,924 8,095 4,483 5,080
Profit before taxes 206,569 196,323 115,292 110,843
Income tax 6 (48,988) (44,371) (26,800) (24,471)
Profit before non-controlling interests 157,581 151,952 88,492 86,372
Attributable to:
Non-controlling interests 8,071 7,031 3,759 3,824
Jerónimo Martins Shareholders 149,510 144,921 84,733 82,548
Basic and diluted earnings per share- Euros 14 0.2379 0.2306 0.1348 0.1314
To be read with the attached notes to the consolidated financial statements
CONSOLIDATED STATEMENT OF COMPREHENSIVE INCOME
Euro thousand
To be read with the attached notes to the consolidated financial statements
(*) Restated – See note 2.3
1st Half
2015
1st Half
2014 (*)
2nd Quarter
2015
2nd Quarter
2014 (*)
Net profit 157,581 151,952 88,492 86,372
Other comprehensive income:
Items that will not be reclassified to profit or loss
- - - -
Items that may be reclassified to profit or loss
Currency translation differences 25,120 (3,913) (13,129) (735)
Change in fair value of cash flow hedges 1,578 528 1,044 (532)
Change in fair value of hedging instruments on foreign
operations (14,680) 1,036
(4,716) 1,663
Change in fair value of available-for-sale financial
assets 68 50
(100) (74)
Related tax (841) (181) (1,296) (13)
11,245 (2,480) (18,197) 309
Other comprehensive income, net of income tax 11,245 (2,480) (18,197) 309
Total comprehensive income 168,826 149,472 70,295 86,681
Attributable to:
Non-controlling interests 8,350 7,415 3,911 3,923
Jerónimo Martins Shareholders 160,476 142,057 66,384 82,758
Total comprehensive income 168,826 149,472 70,295 86,681
V
R&A - 1st Half 2015
Consolidated Financial Statements
13
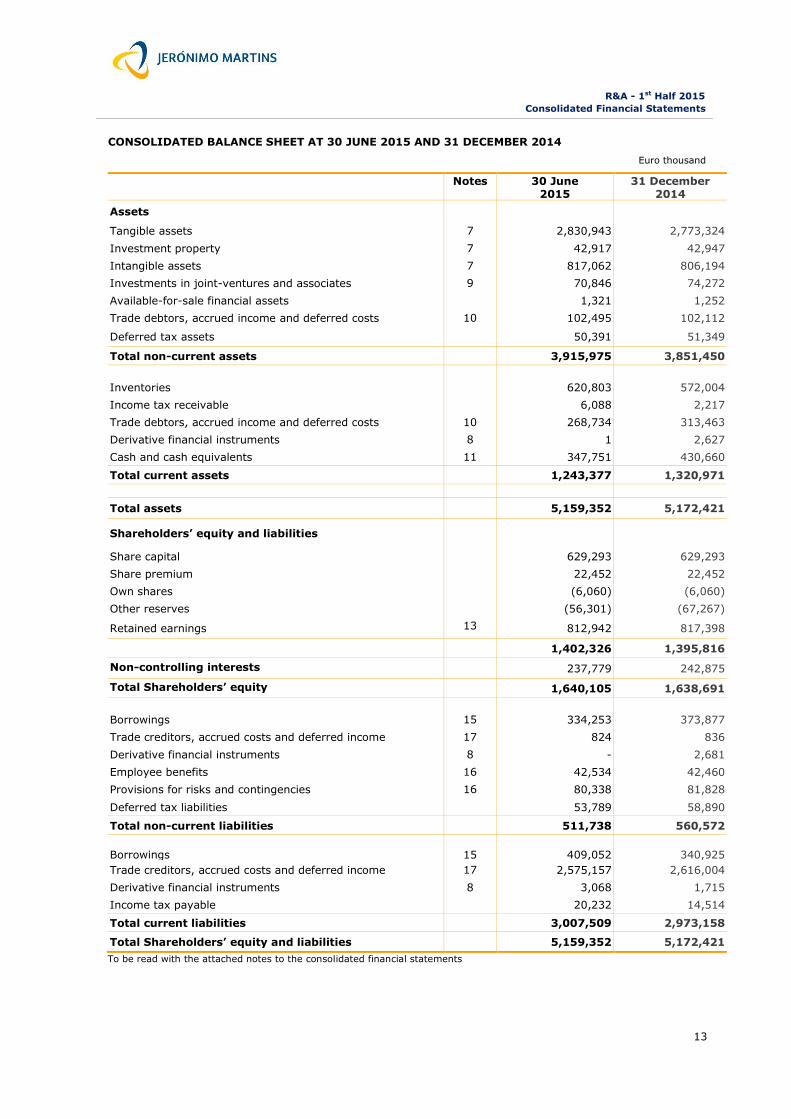
CONSOLIDATED BALANCE SHEET AT 30 JUNE 2015 AND 31 DECEMBER 2014
Euro thousand
Notes 30 June 2015
31 December 2014
Assets
Tangible assets 7 2,830,943 2,773,324
Investment property 7 42,917 42,947
Intangible assets 7 817,062 806,194
Investments in joint-ventures and associates 9 70,846 74,272
Available-for-sale financial assets 1,321 1,252
Trade debtors, accrued income and deferred costs 10 102,495 102,112
Deferred tax assets 50,391 51,349
Total non-current assets 3,915,975 3,851,450
Inventories 620,803 572,004
Income tax receivable 6,088 2,217
Trade debtors, accrued income and deferred costs 10 268,734 313,463
Derivative financial instruments 8 1 2,627
Cash and cash equivalents 11 347,751 430,660
Total current assets 1,243,377 1,320,971
Total assets 5,159,352 5,172,421
Shareholders’ equity and liabilities
Share capital 629,293 629,293
Share premium 22,452 22,452
Own shares (6,060) (6,060)
Other reserves (56,301) (67,267)
Retained earnings 13 812,942 817,398
1,402,326 1,395,816
Non-controlling interests 237,779 242,875
Total Shareholders’ equity 1,640,105 1,638,691
Borrowings 15 334,253 373,877
Trade creditors, accrued costs and deferred income 17 824 836
Derivative financial instruments 8 - 2,681
Employee benefits 16 42,534 42,460
Provisions for risks and contingencies 16 80,338 81,828
Deferred tax liabilities 53,789 58,890
Total non-current liabilities 511,738 560,572
Borrowings 15 409,052 340,925
Trade creditors, accrued costs and deferred income 17 2,575,157 2,616,004
Derivative financial instruments 8 3,068 1,715
Income tax payable 20,232 14,514
Total current liabilities 3,007,509 2,973,158
Total Shareholders’ equity and liabilities 5,159,352 5,172,421
To be read with the attached notes to the consolidated financial statements

R&A - 1st Half 2015
Consolidated Financial Statements
14
CONSOLIDATED STATEMENT OF CHANGES IN SHAREHOLDERS’ EQUITY
Euro thousand
Shareholders’ equity attributable to Shareholders of Jerónimo Martins, SGPS, S.A.
No
t
es
Share
capital
Share
premium
Own
shares
Other reserves
Retained
earnings Total
Non-
controlling
interests
Shareholders’
equity Cash flow
hedge
Available-for-
sale financial
assets
Currency
translation
reserves
Balance Sheet as at 1
January 2014 (*) 629,293 22,452 (6,060) (2,453) (1,251) (48,111) 709,661 1,303,531 235,835 1,539,366
Equity changes in the 1st
Half of 2014
Currency translation
differences 1 (3,915) (3,914) (3,914)
Change in fair value of cash
flow hedging (36) (36) 384 348
Change in fair value of
hedging instruments on foreign operations
1,036 1,036 1,036
Change in fair value of
available-for-sale financial investments
1,300 (1,250) 50 50
Other comprehensive
income - - - (35) 1,300 (2,879) (1,250) (2,864) 384 (2,480)
Net profit 144,921 144,921 7,031 151,952
Total comprehensive
income - - - (35) 1,300 (2,879) 143,671 142,057 7,415 149,472
Dividends (191,672) (191,672) (13,121) (204,793)
Balance Sheet as at 30
June 2014 (*) 629,293 22,452 (6,060) (2,488) 49 (50,990) 661,660 1,253,916 230,129 1,484,045
Balance Sheet as at 1
January 2015 629,293 22,452 (6,060) (2,548) (157) (64,562) 817,398 1,395,816 242,875 1,638,691
Equity changes in the 1st
Half of 2015
Currency translation
differences (38) 24,656 24,618 24,618
Change in fair value of cash flow hedging
975 975 279 1,254
Change in fair value of
hedging instruments on
foreign operations
(14,680) (14,680) (14,680)
Change in fair value of
available-for-sale financial
investments
53 53 53
Other comprehensive income
937 53 9,976 10,966 279 11,245
Net profit 149,510 149,510 8,071 157,581
Total comprehensive income
937 53 9,976 149,510 160,476 8,350 168,826
Dividends 13 (153,966) (153,966) (13,446) (167,412)
Balance Sheet as at 30
June 2015 629,293 22,452 (6,060) (1,611) (104) (54,586) 812,942 1,402,326 237,779 1,640,105
To be read with the attached notes to the consolidated financial statements
(*) Restated – see note 2.3

R&A - 1st Half 2015
Consolidated Financial Statements
15
CONSOLIDATED CASH FLOW STATEMENT FOR JUNE 2015 AND 2014
Euro thousand
Notes 2015 2014
Operating Activities
Cash received from Customers 7,485,487 6,821,511
Cash paid to suppliers (6,656,561) (6,109,332)
Cash paid to employees (524,375) (472,123)
Cash generated from operations 12 304,551 240,056
Interest paid (14,264) (17,165)
Income taxes paid (52,899) (57,980)
Cash Flow from operating activities 237,388 164,911
Investment activities
Disposals of tangible assets 1,705 2,239
Disposals of available-for-sale financial assets - 3,382
Interest received 953 1,118
Dividends received 11,373 16,264
Acquisition of tangible assets (179,879) (225,654)
Acquisition of financial investments and Investment property (2) -
Acquisition of intangible assets (9,508) (12,984)
Cash flow from investment activities (175,358) (215,635)
Financing activities
Received from loans 116,002 336,494
Reimbursement of loans (95,100) (136,082)
Dividends paid 13 (167,412) (204,793)
Cash Flow from financing activities (146,510) (4,381)
Net changes in cash and cash equivalents (84,480) (55,105)
Cash and cash equivalents changes
Cash and cash equivalents at the beginning of 1st Half 430,660 371,671
Net changes in cash and cash equivalents (84,480) (55,105)
Effect of currency translation differences 1,571 (4,630)
Cash and cash equivalents at the end of 1st Half 11 347,751 311,936
To be read with the attached notes to the consolidated financial statements
CONSOLIDATED CASH FLOW STATEMENT FOR THE INTERIM PERIOD
Euro thousand
1st Half 2015
1st Half 2014
2nd Quarter 2015
2nd Quarter 2014
Cash Flow from operating activities 237,388 164,911 177,877 148,627
Cash Flow from investment activities (175,358) (215,635) (81,630) (77,591)
Cash Flow from financing activities (146,510) (4,381) (227,296) (125,936)
Cash and cash equivalents changes (84,480) (55,105) (131,049) (54,900)

R&A – 1st Half 2015
Notes to the Consolidated Financial Statements
16
Index to the Notes to the Consolidated Financial Statements Page
1 Activity ................................................................................................................................................ 17
2 Accounting policies ................................................................................................................................ 17
3 Segments reporting ............................................................................................................................... 19
4 Total margin and operating costs ............................................................................................................ 20
5 Net financial costs ................................................................................................................................. 21
6 Income tax recognised in the income statement ........................................................................................ 21
7 Fixed assets, intangible assets and investment property ............................................................................ 21
8 Derivative financial instruments .............................................................................................................. 22
9 Investments in joint ventures and associates ............................................................................................ 22
10 Trade debtors, accrued income and deferred costs .................................................................................... 22
11 Cash and cash equivalents ..................................................................................................................... 23
12 Cash generated from operations ............................................................................................................. 23
13 Dividends ............................................................................................................................................. 23
14 Basic and diluted earnings per share ....................................................................................................... 23
15 Borrowings ........................................................................................................................................... 23
16 Provisions and employee benefits ............................................................................................................ 24
17 Trade creditors, accrued costs and deferred income ................................................................................... 24
18 Contingencies ....................................................................................................................................... 25
19 Related parties...................................................................................................................................... 25
20 Events after the balance sheet date ......................................................................................................... 25
R&A – 1st Half 2015
Notes to the Consolidated Financial Statements
17
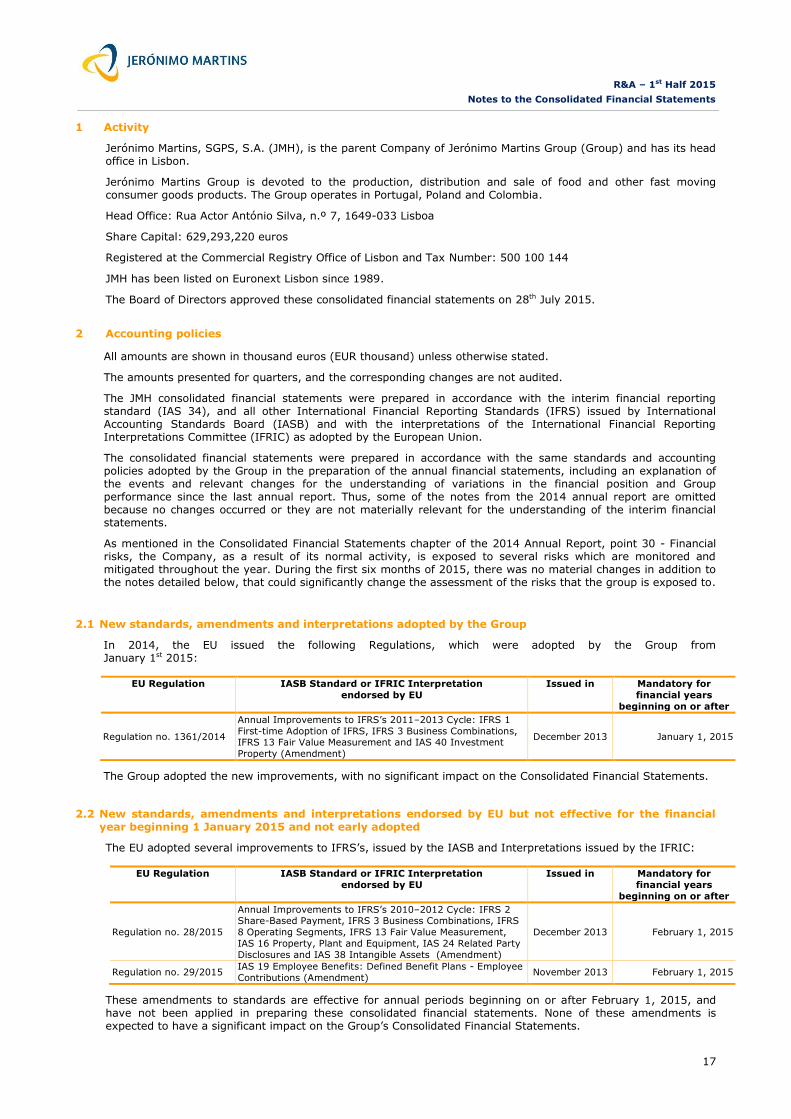
1 Activity
Jerónimo Martins, SGPS, S.A. (JMH), is the parent Company of Jerónimo Martins Group (Group) and has its head office in Lisbon.
Jerónimo Martins Group is devoted to the production, distribution and sale of food and other fast moving consumer goods products. The Group operates in Portugal, Poland and Colombia.
Head Office: Rua Actor António Silva, n.º 7, 1649-033 Lisboa
Share Capital: 629,293,220 euros
Registered at the Commercial Registry Office of Lisbon and Tax Number: 500 100 144
JMH has been listed on Euronext Lisbon since 1989.
The Board of Directors approved these consolidated financial statements on 28th July 2015.
2 Accounting policies
All amounts are shown in thousand euros (EUR thousand) unless otherwise stated.
The amounts presented for quarters, and the corresponding changes are not audited.
The JMH consolidated financial statements were prepared in accordance with the interim financial reporting standard (IAS 34), and all other International Financial Reporting Standards (IFRS) issued by International Accounting Standards Board (IASB) and with the interpretations of the International Financial Reporting Interpretations Committee (IFRIC) as adopted by the European Union.
The consolidated financial statements were prepared in accordance with the same standards and accounting policies adopted by the Group in the preparation of the annual financial statements, including an explanation of the events and relevant changes for the understanding of variations in the financial position and Group performance since the last annual report. Thus, some of the notes from the 2014 annual report are omitted because no changes occurred or they are not materially relevant for the understanding of the interim financial statements.
As mentioned in the Consolidated Financial Statements chapter of the 2014 Annual Report, point 30 - Financial risks, the Company, as a result of its normal activity, is exposed to several risks which are monitored and mitigated throughout the year. During the first six months of 2015, there was no material changes in addition to the notes detailed below, that could significantly change the assessment of the risks that the group is exposed to.
2.1 New standards, amendments and interpretations adopted by the Group
In 2014, the EU issued the following Regulations, which were adopted by the Group from January 1st 2015:
EU Regulation IASB Standard or IFRIC Interpretation
endorsed by EU
Issued in Mandatory for
financial years
beginning on or after
Regulation no. 1361/2014
Annual Improvements to IFRS’s 2011–2013 Cycle: IFRS 1
First-time Adoption of IFRS, IFRS 3 Business Combinations, IFRS 13 Fair Value Measurement and IAS 40 Investment
Property (Amendment)
December 2013 January 1, 2015
The Group adopted the new improvements, with no significant impact on the Consolidated Financial Statements.
2.2 New standards, amendments and interpretations endorsed by EU but not effective for the financial year beginning 1 January 2015 and not early adopted
The EU adopted several improvements to IFRS’s, issued by the IASB and Interpretations issued by the IFRIC:
EU Regulation IASB Standard or IFRIC Interpretation
endorsed by EU
Issued in Mandatory for
financial years
beginning on or after
Regulation no. 28/2015
Annual Improvements to IFRS’s 2010–2012 Cycle: IFRS 2 Share-Based Payment, IFRS 3 Business Combinations, IFRS
8 Operating Segments, IFRS 13 Fair Value Measurement,
IAS 16 Property, Plant and Equipment, IAS 24 Related Party
Disclosures and IAS 38 Intangible Assets (Amendment)
December 2013 February 1, 2015
Regulation no. 29/2015 IAS 19 Employee Benefits: Defined Benefit Plans - Employee
Contributions (Amendment) November 2013 February 1, 2015
These amendments to standards are effective for annual periods beginning on or after February 1, 2015, and have not been applied in preparing these consolidated financial statements. None of these amendments is expected to have a significant impact on the Group’s Consolidated Financial Statements.

R&A – 1st Half 2015
Notes to the Consolidated Financial Statements
18
2.3 Restatement of financial statements (change of accounting policies)
The Group has decided to adopt the historical cost for land (classified as tangible assets) in the financial statements prepared as at December 31, 2014, with restatement of the opening balances at January 1, 2014 and January 1, 2013. In accordance with IAS 8, the effects of the change in the accounting policy were applied retrospectively. There are no impacts on the Income Statement for the first six months of 2014. The Balance Sheet opening and closing balances for the year 2014, Statement of Comprehensive Income and Statement of Changes in Shareholders’ Equity were impacted as follows:
CONSOLIDATED BALANCE SHEET
30 June 2014
Published
Change of accounting
policies Restated
Assets
Tangible assets 2,811,908 (129,875) 2,682,033
Investment property 44,087 - 44,087
Intangible assets 812,567 - 812,567
Investments in joint ventures and associates 73,285 (2,897) 70,388
Other non-current assets 140,525 - 140,525
Total non-current assets 3,882,372 (132,772) 3,749,600
Inventories 594,167 - 594,167
Other current assets 294,257 - 294,257
Cash and cash equivalents 311,936 - 311,936
Total current assets 1,200,360 - 1,200,360
Total assets 5,082,732 (132,772) 4,949,960
Shareholders’ equity and liabilities
Attributable to Jerónimo Martins Shareholders 1,333,029 (79,113) 1,253,916
Non-controlling interests 260,898 (30,769) 230,129
Total shareholders’ equity 1,593,927 (109,882) 1,484,045
Borrowings 609,550 - 609,550
Deferred tax liabilities 80,288 (22,890) 57,398
Other non-current liabilities 120,409 - 120,409
Total non-current liabilities 810,247 (22,890) 787,357
Borrowings 297,228 - 297,228
Other current liabilities 2,381,330 - 2,381,330
Total current liabilities 2,678,558 - 2,678,558
Total shareholders’ equity and liabilities 5,082,732 (132,772) 4,949,960
CONSOLIDATED STATEMENT OF COMPREHENSIVE INCOME
30 June 2014
Published
Change of
accounting
policies
Restated
Net profit 151,952 - 151,952
Other comprehensive income:
Items that will not be reclassified to profit or loss
- - -
Items that may be reclassified to profit or loss
Currency translation differences (3,929) 16 (3,913)
Change in fair value of cash flow hedging 528 - 528
Change in fair value of hedging instruments on foreign operations 1,036 - 1,036
Change in fair value of available-for-sale financial assets 50 - 50
Related tax (179) (2) (181)
(2,494) 14 (2,480)
Other comprehensive income, net of income taxes (2,494) 14 (2,480)
Total comprehensive income 149,458 14 149,472
Attributable to:
Non-controlling interests 7,415 - 7,415
Jerónimo Martins Shareholders 142,043 14 142,057
Total comprehensive income 149,458 14 149,472

R&A – 1st Half 2015
Notes to the Consolidated Financial Statements
19
CONSOLIDATED STATEMENT OF CHANGES IN SHAREHOLDERS’ EQUITY
Shareholders’ equity attributable to Shareholders of Jerónimo Martins, SGPS, S.A.
Share
capital
Share
premium
Own
shares
Fair value and other reserves
Retained
earnings Total
Non-
controlling interests
Shareholders’
equity
Land revaluation
Cash
flow hedge
Available-
for-sale financial
assets
Adj. in
joint ventures
and
assoc.
Currency translation
reserves
Balance Sheet as at 1 January 2014 - Published
629,293 22,452 (6,060) 76,230 (2,453) (1,251) 2,897 (48,111) 709,661 1,382,658 266,604 1,649,262
Change of accounting policies - - - (76,230) - - (2,897) - - (79,127) (30,769) (109,896)
Balance Sheet at at 1 January 2014 - Restated
629,293 22,452 (6,060) - (2,453) (1,251) - (48,111) 709,661 1,303,531 235,835 1,539,366
Comprehensive income
restated - - - - (35) 1,300 - (2,879) 143,671 142,057 7,415 149,472
Dividends (191,672) (191,672) (13,121) (204,793)
Balance Sheet as at 30 June 2014 - Restated
629,293 22,452 (6,060) - (2,488) 49 - (50,990) 661,660 1,253,916 230,129 1,484,045
2.4 Transactions in foreign currencies
Transactions in foreign currencies are translated into Euros at the exchange rate prevailing on the transaction date.
On the balance sheet date, monetary assets and liabilities expressed in foreign currencies are translated at the exchange rate prevailing on that date and exchange differences arising from this conversion are recognised in the income statement. When qualifying as hedges on investments in foreign subsidiaries the exchange differences are deferred in equity.
The main exchange rates applied on the balance sheet date are as follows:
3 Segments reporting
Segment information is presented in accordance with internal reporting to Management. Based on this report, the Management evaluates the performance of each segment and allocates the available resources.
Management monitors the performance of the business based on a geographical and business perspective. In accordance with this, the segments are defined as Portugal Retail, Portugal Cash & Carry and Poland Retail. Apart from these there are also other businesses but due to their low materiality are not reported separately.
Business segments:
Portugal Retail: comprises the business unit of JMR (Pingo Doce supermarkets);
Portugal Cash & Carry: includes the wholesale business unit Recheio;
Poland Retail: the business unit with the brand Biedronka;
Others, eliminations and adjustments: includes i) the business units with reduced materiality (Marketing Services and Representations, Restaurants in Portugal, Health and Beauty Retail in Poland, retail business in Colombia); ii) the Holding companies; and iii) the Group’s consolidation adjustments.
Management evaluates the performance of segments based on the Earnings Before Interest and Taxes (EBIT). This indicator excludes the effects of exceptional operating profits/losses.
Euro foreign exchange reference rates
(foreign exchange units per 1 Euro)
Rate on
30 June
2015
Average rate for
the half year
Polish Zloty (PLN) 4.1911 4.1356
Swiss Franc (CHF) 1.0413 -
Colombian Peso (COP) 2,892.4800 2,764.0700

R&A – 1st Half 2015
Notes to the Consolidated Financial Statements
20
Detailed Information by Business Segments at June 2015 and 2014
Portugal Retail
Portugal Cash & Carry
Poland Retail Others, eliminations
and adjustments Total JM Consolidated
2015 2014 2015 2014 2015 2014 2015 2014 2015 2014
Net sales and services 1,776,493 1,706,767 392,847 374,113 4,499,036 4,029,084 (24,378) (58,251) 6,643,998 6,051,713
Inter-segments 150,226 146,919 3,028 903 765 723 (154,019) (148,545) - -
External customers 1,626,267 1,559,848 389,819 373,210 4,498,271 4,028,361 129,641 90,294 6,643,998 6,051,713
Operational cash flow (EBITDA) 76,695 76,665 18,864 18,313 304,906 280,665 (37,378) (34,208) 363,087 341,435
Depreciations and amortisations (47,359) (49,042) (5,830) (5,783) (86,793) (74,609) (6,808) (5,443) (146,790) (134,877)
Operational result (EBIT) 29,336 27,623 13,034 12,530 218,113 206,056 (44,186) (39,651) 216,297 206,558
Exceptional operating profits/losses (4,713) (493)
Financial results and gains in
investments (5,015) (9,742)
Income tax (48,988) (44,371)
Net result attributable to JM 149,510 144,921
Total assets (1) 1,685,164 1,656,090 350,645 330,131 2,755,314 2,826,930 368,229 359,270 5,159,352 5,172,421
Total liabilities (1) 1,198,779 1,158,612 308,254 281,931 2,115,802 2,100,836 (103,588) (7,649) 3,519,247 3,533,730
Investments in fixed assets 43,156 10,676 10,763 5,343 98,142 141,215 24,940 15,080 177,001 172,314
(1) The comparative report is 31th December of 2014
Reconciliation between EBIT and Operational Result
June 2015 June 2014
EBIT 216,297 206,558
Non recurrent results (4,713) (493)
Operational Result 211,584 206,065
4 Total margin and operating costs
June 2015 June 2014
Net sales and services 6,643,998 6,051,713
Net cost of products sold (5,215,211) (4,753,145)
Net cash discount and interest paid to suppliers (3,877) (2,734)
Electronic payment commissions (9,573) (6,579)
Other supplementary costs (4,075) (3,274)
Cost of sales (5,232,736) (4,765,732)
Total margin 1,411,262 1,285,981
Supplies and services (244,093) (225,349)
Advertising costs (36,617) (29,586)
Rents (164,622) (148,456)
Staff costs (523,819) (463,605)
Amortization (145,686) (133,742)
Profit/loss with tangible and intangible assets (903) (1,113)
Transportation costs (72,605) (73,069)
Other operational profit/loss (6,620) (4,503)
Distribution and administrative costs (1,194,965) (1,079,423)
Legal contingencies (162) -
Losses from organizational restructuring programmes (4,753) (469)
Assets write-offs and gains/losses in sale of tangible assets (8) (24)
Others 210 -
Exceptional operating profits/losses (4,713) (493)
Operating profit 211,584 206,065

R&A – 1st Half 2015
Notes to the Consolidated Financial Statements
21
5 Net financial costs
June 2015 June 2014
Interest expense (13,164) (16,994)
Interest received 1,080 1,141
Dividends 23 23
Net foreign exchange 1,063 (85)
Other financial costs and gains (1,942) (1,926)
Fair value of financial investments held for trade:
Derivative instruments (note 8) 1 4
(12,939) (17,837)
The interest expense heading includes the interest regarding loans measured at amortized cost, as well as interest on fair value and cash flow hedging instruments (note 8).
Other financial costs and gains include costs with debt issued by the Group.
6 Income tax recognised in the income statement
June 2015 June 2014
Current income tax
Current tax of the year (55,048) (43,715)
Adjustment to prior year estimation 356 1,167
(54,692) (42,548)
Deferred tax
Temporary differences created and reversed 5,392 (1,933)
Change to the recoverable amount of tax losses and temporary differences
from previous years (405) (606)
4,987 (2,539)
Other gains/losses related to taxes
Impact of changes in estimates for tax litigations 717 716
717 716
Total income tax (48,988) (44,371)
Income tax expense is recognised based on the weighted average annual income tax rate expected for the year 2015.
In 2015 the income tax rate for the companies operating in Portugal was reduced to 21% (23% in 2014). The estimation includes the effect of 1.5% as municipal surcharge and a state tax rate of 3% and 5% for tax profits over EUR 1,500 thousand and EUR 7,500 thousand, respectively.
7 Fixed assets, intangible assets and investment property
Tangible assets
Investment
property
Intangible
assets Total
Net value at 31 December 2014 2,773,324 42,947 806,194 3,622,465
Foreign exchange differences 31,847 - 8,883 40,730
Increases 167,493 2 9,508 177,003
Disposals and write-offs (2,316) - (90) (2,406)
Transfers 1 - (1) -
Depreciation and impairment losses (139,406) - (7,432) (146,838)
Transfers to/from investment properties - - - -
Fair value changes - (32) - (32)
Net value at 30 June 2015 2,830,943 42,917 817,062 3,690,922
As a consequence of currency translation adjustment of the assets in the Group’s businesses reported in foreign currency, the net amount of tangible and intangible assets increased by EUR 40.730 thousand, which includes an increase of EUR 6,056 thousand related to Goodwill from business in Poland.
The difference to total of amortisations stated in note 4, relates mainly to the production activities that were attributable to the cost of the goods sold.

R&A – 1st Half 2015
Notes to the Consolidated Financial Statements
22
8 Derivative financial instruments
Notional
June 2015 Notional
December 2014
Assets Liabilities Assets Liabilities
Current Non-
current Current
Non-
current Current
Non-
current Current
Non-
current
Derivatives held for trading
Currency forwards (PLN) 22.6million
PLN 1 - - - - - - - -
Cash flow hedging derivatives
Interest rate swap (EUR) 225 million
EUR - - 994 -
225 million
EUR - - 1,715 -
Interest rate swap (PLN) 500 million
PLN - - 2,074 - 500 million
PLN - - - 2,681
Investments in foreign entities
hedging derivatives
Currency forwards (PLN) - - - - 600 million
PLN 2,627 - - -
Total derivatives held for trading 1 - - - - - - -
Total hedging derivatives - - 3,068 - 2,627 - 1,715 2,681
Total assets/liabilities derivatives 1 - 3,068 - 2,627 - 1,715 2,681
In June 2015 the values shown include interest receivable or payable related with these financial instruments that are due. The net payable amount is EUR 626 thousand.
9 Investments in joint ventures and associates
During the 1st half of 2015, the movement under this heading was as follows:
Joint ventures Associates Total
Balance at 1 January 73,537 735 74,272
Equity method:
Net result 7,929 (5) 7,924
Dividends and other income received (11,350) - (11,350)
Other comprehensive income - - -
Balance at 30 June 70,116 730 70,846
10 Trade debtors, accrued income and deferred costs
June 2015 December 2014
Non-current
Other debtors 79,899 79,131
Collateral deposits associated to financial debt 19,367 19,367
Deferred costs 3,229 3,614
102,495 102,112
Current
Commercial customers 56,756 50,868
Other debtors 86,757 97,649
Other taxes receivable 8,291 16,011
Accrued income and deferred costs 116,930 148,935
268,734 313,463
Non-current debtors are mainly related to additional tax liquidation as well as pre-paid tax, which the Group has
already contested and made a legal claim for reimbursement.
The debtor’s amount is registered at the recoverable value. The Group constitutes provisions for impairment losses whenever there are signs of uncollectable amounts.

R&A – 1st Half 2015
Notes to the Consolidated Financial Statements
23
11 Cash and cash equivalents
June 2015 December 2014
Bank deposits 226,689 171,790
Short-term investments 117,464 255,043
Cash and cash equivalents 3,598 3,827
347,751 430,660
12 Cash generated from operations
June 2015 June 2014
Net results 149,510 144,921
Adjustments for:
Non-controlling interests 8,071 7,031
Income tax 48,988 44,371
Depreciations and amortisations 146,790 134,877
Provisions and other operational gains and losses 4,559 450
Net financial costs 12,939 17,837
Profit/ Losses in associated companies (7,924) (8,095)
Profit/ Losses on tangible and intangible assets 700 581
363,633 341,973
Changes in working capital:
Inventories (42,119) (18,496)
Trade debtors, accrued income and deferred costs (7,804) (6,650)
Trade creditors, accrued costs and deferred income (9,159) (76,771)
304,551 240,056
13 Dividends
Dividends distributed in 2015 in the amount of EUR 167,412 thousand, include an amount of EUR 153,962 thousand paid to JMH Shareholders, and an amount of EUR 13,446 thousand paid to non-controlling interests in the Group companies.
14 Basic and diluted earnings per share
Basic net results per share are calculated based on the net profit of EUR 149,510 thousand (2014: profit of EUR 144,921 thousand) and on the weighted average outstanding ordinary shares numbering 628,434,220 (2014: 628,434,220).
June 2015 June 2014
Ordinary shares issued at the beginning of the year 629,293,220 629,293,220
Own shares at the beginning of the year (859,000) (859,000)
Weighted average number of ordinary shares 628,434,220 628,434,220
Diluted net results of the year attributable to ordinary shares 149,510 144,921
Basic and diluted earnings per share – Euros 0.2379 0.2306
15 Borrowings
JM Nieruchomosci - Sp. Komandytowo-akcyjna contracted a loan on a total amount of PLN 415.000 thousand with maturity in 2020.

R&A – 1st Half 2015
Notes to the Consolidated Financial Statements
24
15.1 Current and non-current loans
June 2015 December 2014
Non-current loans
Bank loans 334,101 373,651
Financial lease liabilities 152 226
334,253 373,877
Current loans
Bank overdrafts 8,599 58,327
Bank loans 175,172 56,544
Bond loans 225,000 225,000
Financial lease liabilities 281 1,054
409,052 340,925
Compared to the report as at 31 December 2014 (note 19) there are no relevant changes in the Group’s average financing rate.
15.2 Financial debt
As the Group contracted several foreign exchange rate risk and interest risk hedging operations, as well as short-term investments, the net consolidated financial debt as at 30 June is as follows:
June 2015 December 2014
Non-current loans (note 15.1) 334,253 373,877
Current loans (note 15.1) 409,052 340,925
Derivative financial instruments (note 8) 3,067 1,769
Interest on accruals and deferrals 3,108 2,622
Bank deposits (note 11) (226,689) (171,790)
Short-term investments (note 11) (117,464) (255,043)
Collateral deposits (note 10) (19,367) (19,367)
385,960 272,993
16 Provisions and employee benefits
Risks and
contingencies Employee benefits
Balance at 1 January 81,828 42,460
Set up, reinforced and transfers 2,786 1,582
Unused and reversed (1,076) -
Foreign exchange difference 17 -
Used (3,217) (1,508)
Balance at 30 June 80,338 42,534
17 Trade creditors, accrued costs and deferred income
June 2015 December 2014
Non-current
Accrued costs and deferred income 824 836
824 836
Current
Other commercial creditors 2,121,542 2,182,406
Other non-commercial creditors 162,240 175,726
Other taxes payables 86,593 79,456
Accrued costs and deferred income 204,782 178,416
2,575,157 2,616,004

R&A – 1st Half 2015
Notes to the Consolidated Financial Statements
25
18 Contingencies
Following the contingencies mentioned in the 2014 Annual Report, changes occurred on the headings f) and i):
f) The Portuguese Tax Authorities carried out some corrections of VAT rates applied to certain goods sold by some Group companies. With these corrections the total amount of assessments for the years 2005 to 2012 in Pingo Doce, Feira Nova and Recheio SGPS amounted to EUR 1,814 thousand, EUR 1,300 thousand and EUR 551 thousand, respectively. The Board of Directors believes that the Tax Authorities have no grounds to request this
payment and these assessments have been challenged;
i) Sociedade Ponto Verde (SPV) claimed through a judicial proceeding against Pingo Doce, in September 2014, an amount of EUR 3,397 thousand (including outstanding interest), related to the Management of the secondary and tertiary packaging waste system. Pingo Doce contested considering that SPV does not manage that kind of waste and therefore no amount is due. The Civil Court, having the same understanding of Pingo Doce, declared itself materially incompetent to decide the case, saying that it should be judged by the administrative courts. SPV filed an appeal to the Court of Appeal. The Court of Appeal ruled in favor of SPV and the case returned to the Civil Court, where the procedure stands by.
19 Related parties
56.14% of the Group is owned by the Sociedade Francisco Manuel dos Santos, and no transactions occurred between this Company and any other company of the Group in the first half of 2015, neither were there any amounts payable or receivable between them on June 30th 2015.
Balances and transactions of Group companies with related parties are as follows:
Sales and services rendered Stocks purchased and services supplied
June 2015 June 2014 June 2015 June 2014
Joint ventures 2 220 50,430 46,130
Associates - - - 9
Other related parties (*) 49 49 73 119
Trade debtors, accrued income and
deferred costs
Trade creditors, accrued costs and
deferred income
June 2015 December 2014 June 2015 December 2014
Joint ventures 570 640 22,337 5,774
Associates - - - -
Other related parties (*) 50 17 7 -
(*) Entities controlled by the major Shareholder of Jerónimo Martins and entities owned or controlled by members of the Board of Directors.
All the transactions with these related parties were made under normal market conditions, i.e. the transaction value corresponds to prices that would be applicable between non-related parties.
Outstanding balances between Group companies and related parties, being a result of a trade agreement, are settled in cash, and are subject to the same payment terms as those applicable to other agreements celebrated between Group companies and their suppliers.
The amounts receivable are not covered by insurance and no guarantees are given or received, as the Group holds a relevant influence over these companies.
There are no adjustments for doubtful debts and no costs were recognised during the year related with bad or
doubtful debts with these related parties.
20 Events after the balance sheet date
At the conclusion of this Report there were no relevant events to highlight that are not disclosed in the Financial Statements. Lisbon, 28th July 2015
The Certified Accountant The Board of Directors

pwc
Limited Reuiew Report Prepared by Auditor Registered with theSecurities Market Commission (CMVM) on the Consolidated HalfYearInformation
(Free translationfrom the original in Portuguese)
Introduction
1 In accordance with the Portuguese Securities Market Code (CVM), we present our limitedreview report on the consolidated financial information for the six-month period ended June 30, 2015of Jerónimo Martins, SGPS, S.A. included in the consolidated Management Report, consolidatedbalance sheet (which shows total assets of Euro 5,159,352 thousand and total sharehoiders’ equity ofEuro 1,640,105 thousand, including non-controliing interests of Euro 237,779 thousand and a netprofit of Euro 149,510 thousand), consolidated income statement by functions, consolidated statementof comprehensive income, consoiidated statement of changes in shareholders’ equity and consolidatedstatement of cash flows for the period then ended, and the corresponding notes to the accounts.
2 The amounts in the consolidated financial statements, as well as those in the additionalfinancial information, are derived from the respective accounting records.
Responsibilities
3 It is the responsibility of the Board of Directors: (a) to prepare consolidated financialinformation which present fairiy, in ali material respects, the financial position of the companiesincluded in the consolidation, the consolidated results and the consoiidated comprehensive income oftheir operations, the changes in consolidated equity and the consolidated cash fiows; (b) to preparehistorical financial information in accordance with International Accounting Standard 34 — InterimFinancial Reporting as adopted by the European Union and which is complete, true, up-to-date, clear,objective and lawful as required by the CVM; (c) to adopt appropriate accounting policies and criteria;(d) to maintain appropriate systems of internal control; and (e) to disclose any significant matterswhich have influenced the activity, financial position or results.
4 Our responsibility is to verify the financial information included in the documents referred toabove, namely as to whether it is complete, true, up-to-date, clear, objective and lawful, as required bythe CVM, for the purpose of issuing an independent and professional report based on our work.
Scope
5 Our work was performed with the objective of obtaining moderate assurance about whetherthe financial information referred to above is free from material misstatement. Our work wasperformed in accordance with the Standards and Technical Recommendations issued by the Instituteof Statutory Auditors, planned according to that objective, and consisted primarily, in enquiries andanalytical procedures, to review: (i) the reliability of the assertions included in the financialinformation; (ii) the appropriateness and consistency of the accounting principles used, as applicable;(iii) the applicability, or not, of the going concern basis of accounting; (iv) the presentation of thefinancial information; (v) as to whether the consolidated financial information is complete, true, upto-date, clear, objective and lawful.
PricewaterhouseCoopers & Associados - Sociedade de Revisores Oficiais de Contas, Lda.Sede: Palácio Sottomayor, Rua Sousa Martins, 1 - 30,1069~316 Lisboa, PortugalTel +351213 599 000, Fax +351 213 599 999, www.pwc.ptMatriculada na CRC sob o NUPC 506 628 752, Capital Social Euros 314.000Inscrita na lista das Sociedades de Revisores Oficiais de Contas sob o n°183 e na CMVM sob o n° 9077
PncewatertioaseCoopers & Associados - Sociedade de Revisores Oficiais de Contas. Lda. pertence à rede de entidades que são membrosda PricewatemouneCoopers Intemational Limited, cada uma das quais é uma entidade legal autónoma e independente.
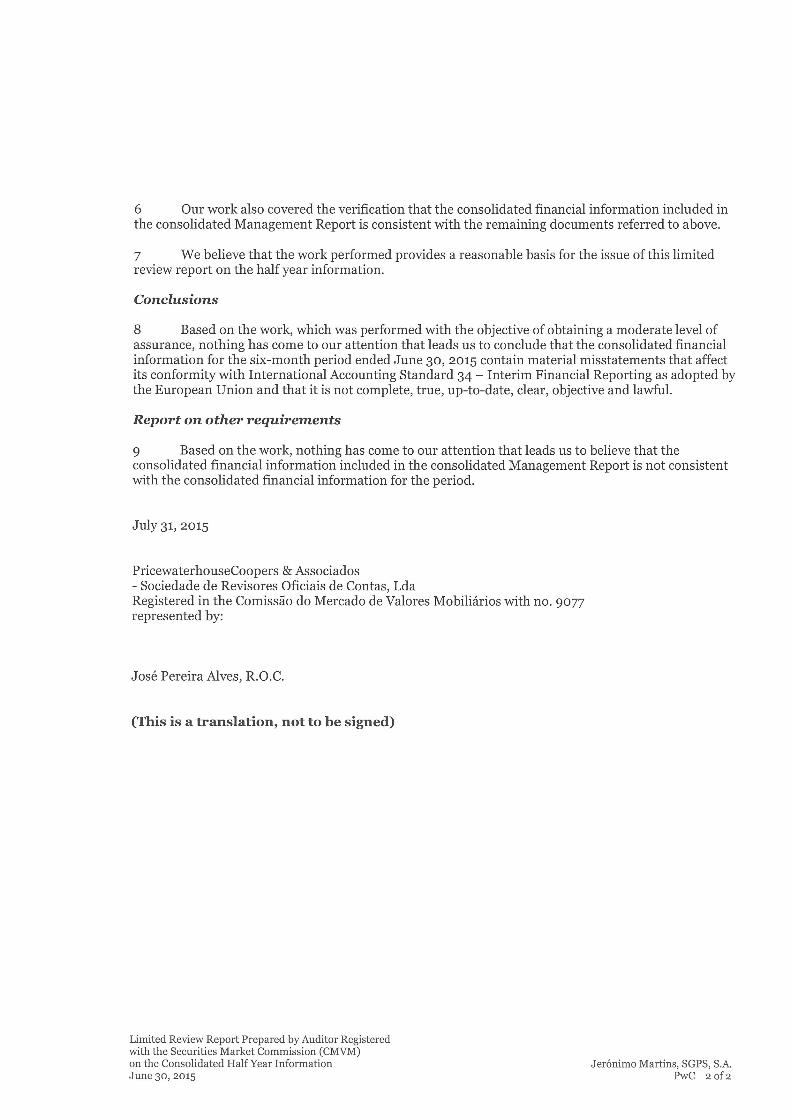
6 Our work also covered the verification that the consolidated financial information included inthe consolidated Management Report is consistent with the remaining documents referred to above.
7 We believe that the work performed provides a reasonable basis for the issue of this limitedreview report on the half year information.
Conclusions
8 Based on the work, which was performed with the objective of obtaining a moderate levei ofassurance, nothing has come to our attention that leads us to conclude that the consolidated financialinformation for the six-month period ended June 30, 2015 contam material misstatements that affectits conformity with International Accounting Standard 34 — Interim Financial Reporting as adopted bythe European Union and that it is not complete, true, up-to-date, clear, objective and lawful.
Report on other requirements
9 Based on the work, nothing has come to our attention that leads us to believe that theconsolidated financial information included in the consolidated Management Report is not consistentwith the consolidated financial information for the period.
July 31, 2015
PricewaterhouseCoopers & Associados- Sociedade de Revisores Oficiais de Contas, LdaRegistered in the Comissão do Mercado de Valores Mobiliários with no. 9077represented by:
José Pereira Alves, R.O.C.
(This is a transiation, not lo be signed)
Limited Review Report Prepared by Auditor Registeredwith the Securities Market Commission (CMVM)on the Consolidated Half Year Information Jerónimo Martins, SGPS, S.A.June 30, 2015 PwC 2 of 2