consolidated monitoring and evaluation report on the ... report.pdf · public service commission...
TRANSCRIPT

Public Service Commission
July 2010
Consolidated Monitoring and Evaluation Report on
the Departments of Housing (Human Settlements)
Evaluation Cylce 2009/2010

Vision
The Public Service Commission is an independent and impartial body created by the Constitution, 1996, to enhance excellence in governance within the Public Serv-ice by promoting a professional and ethical environment and adding value to a pub-lic administration that is accountable, equitable, efficient, effective, corruption-free and responsive to the needs of the people of South Africa.
Mission
The Public Service Commission aims to promote the constitutionally enshrined democratic principles and values of the Public Service by investigating, monitoring, evaluating, communicating and reporting on public administration. Through research processes, it will ensure the promotion of excellence in governance and the delivery of affordable and sustainable quality services.

Published in the Republic of South Africa by:
THE PUBLIC SERVICE COMMISSIONCommission House
Cnr. Hamilton & Ziervogel StreetsArcadia, 0083
Private Bag x121Pretoria, 0001
Tel: (012) 352-1000Fax: (012) 325-8382
Website: www.psc.gov.za
National Anti-Corruption Hotline Number:0800 701 701 (Toll-Free)
Compiled by Branch: Monitoring and Evaluation
Distributed by Directorate: Communication and Information ServicesPrinted by: Blackmoon Advertising
ISBN: 968-0-621-39638-6RP: 216/2010
Consolidated Monitoring and Evaluation Report on the Departments of Housing
(Human Settlements)
Evaluation Cycle 2009/2010
i
Foreword
It gives me great pleasure to present a consolidated sectoral monitoring and evaluation (M&E) report, on an evaluation of all ten housing departments. As a basic need, housing plays a critical role in addressing poverty and remains one of the key priorities of government as reflected in the Medium Term Strategic Framework and the State of the Nation Address. By focusing on a specific sector, this report allows the Public Service Commission (PSC) to compare the performance of similar departments and assess a sector as a whole. Since most of the housing departments have already been evaluated by the PSC before, we were also able to establish trends in performance.
The Transversal Public Service M&E System (System) is used by the PSC to evaluate the compliance of departments with the nine values in section 195 of the Constitution. The System focuses on governance issues and the institutionalisation of sound administrative practice. It can safely be argued that a country needs strong institutions to achieve its developmental goals. In this report the PSC makes the link between governance and the health of institutions, in this case the housing departments, and Government’s ability to achieve the objectives of the housing programme.
The PSC makes specific recommendations in this report with regard to the application of sound administrative practice. It is hoped that this report and the reports that were supplied to each individual housing department will encourage the departments to strengthen their administrative practices, and not only the few areas that the PSC has assessed.
The PSC has engaged departmental management teams and Members of the Executive Council (MECs) throughout the process, and offered them an opportunity to respond to the reports, and recorded their responses in the finalised departmental reports. It is a step towards entrenching a reflective management culture, and promoting evidence-based decision making.
The PSC wishes to thank the Executive Authorities for supporting the process, and officials in the various housing departments for their cooperation.
Dr rr MgijiMaChairperson: publiC serviCe CoMMission
ii

Table of Contents FOREWORD iiACRONYMS vEXECUTIVE SUMMARY vi
1. Introduction vi2. Description of the PSC’s System vi3. Background vii4. Summary of findings viii4.1 Performance trends viii4.2 Formal requirements for public participation ix4.3 Public sector housing model limits public participation ix4.4 The Integrated Development Planning (IDP) process ix4.5 Limited public participation had a specific negative impact on the
broader developmental objectives of the housing programme x4.6 Transparency facilitates public participation in the housing sector xi4.7 Management of misconduct cases in the public housing sector xi4.8 The management of financial resources in the public housing sector xii4.9 Monitoring and evaluation practices in the public housing sector xii4.10 Human resources and representivity in the public housing sector xii5. Conclusion xiii
CHAPTER 1: INTRODUCTION 1
1.1 Introduction 21.2 Mandate of the PSC 21.3 Performance indicators and standards 31.4 Brief overview of the housing environment 31.4.1 Legislative environment 31.4.2 Housing institutions 61.4.3 Funding 61.4.4 The administration of grants 61.4.5 Housing subsidy programme 71.4.6 Cost of building a subsidised house 71.4.7 Eligibility criteria 71.4.8 Housing need 81.5 Conclusion 9
CHAPTER 2: DISCUSSION OF FINDINGS 10
2.1 Introduction 112.2 Overview of performance per province 112.3 Comparative performance results between the first and second assessment 122.4 Overview of performance per principle 122.4.1 Average performance against the nine CVPs 132.4.2 Overview of performance against principle 1 – professional ethics 132.4.3 Overview of performance against principle 2 – efficiency, economy, and effectiveness 182.4.4 Overview of performance against principle 3 – development orientation 24
iii

2.4.5 Overview of performance against principle 4 – impartiality and fairness 312.4.6 Overview of performance against principle 5 – public participation in policy-making 342.4.7 Overview of performance against principle 6 – accountability 372.4.8 Overview of performance against principle 7 – transparency 442.4.9 Overview of performance against principle 8 – good human resource
management and career development practices 492.4.10 Overview of performance against principle 9 – representivity 52
CHAPTER 3: RECOMMENDATIONS 56
3.1 Introduction 573.2 Implementation status of first assessment’s recommendations 573.3 New recommendations for the 2009/10 evaluation cycle 583.4 Specific recommendations per principle 583.5 Conclusion 60
Appendix A: Performance indicators, standard and applicable policies/regulations per principle 65Appendix B: Subsidy types 69Appendix C: Values of subsidies 70Appendix D: Detailed cost breakdown of a 40sqm subsidised house with effect from 1 April 2009 71Appendix E: Detailed cost breakdown of a serviced stand with effect from 1 April 2009 72
iv

Acronyms and Abbreviations acronym Definition/Description
a-g Auditor-Generalapp Annual Performance Planar Annual Reportbng Breaking New GroundCvps Constitutional Values and Principles DeparTMenT(s) Housing/Human Settlement Department(s)Dio Deputy Information OfficerDpsa Department of Public Service and AdministrationeC Eastern Capeee Employment Equityene Estimates of National ExpenditureFpp Fraud Prevention PlanFs Free StategCis Government Communication and Information Systemgp GautenghoD Head of Departmenthr Human ResourceshrM Human Resource Managementhss Housing Subsidy SchemeiDp(s) Integrated Development PlansKZn KwaZulu-Natallp Limpopolru Labour Relations UnitMai Manual on Access to InformationM&e Monitoring and EvaluationMeC Member of the Executive CouncilMhDps Municipal Housing Development Plans(s)Mp MpumalanganC Northern CapenDohs National Department of Human SettlementsnhbrC National Homebuilders Registration Council nhC National Housing Coden/pee National/Provincial Estimates of ExpenditurenT National TreasurynW North Westpaia Promotion of Access to Information Act, 2000 (Act 2 of 2000)paja Promotion of Administrative Justice Act, 2000 (Act 3 of 2000)pFMa Public Finance Management Act, 1999 (Act 1 of 1999)php Peoples Housing Processpis Performance IndicatorspsC Public Service CommissionpsCbC Public Service Coordinating Bargaining CouncilrDp Reconstruction and Development Programmerp Recruitment PolicysahrC South African Human Rights Commission sMMes Small, Medium and Micro EnterprisessYsTeM Transversal Public Service Monitoring and Evaluation SystemWC Western CapeWpsp Work Place Skills Plan
v

Executive Summary1. INTRODUCTION
The aim of this sectoral consolidated M&E Report on the departments of housing/human settlements (departments) was to:
• Assess the progress that the departments have made since their last evaluation by the PSC.• Compare performance between the different departments of housing.• Establish progress with the provision of housing, the challenges encountered and how these challenges are
being addressed.
It is generally accepted that weak corporate governance impacts negatively on the effectiveness of service delivery and may create space or grounds for corruption and fraud to flourish. To measure and evaluate these governance aspects, the PSC, as a custodian of good governance, has introduced a System in 2000 that annually evaluates the performance of departments against the values and principles listed in section 195 of the Constitution, using a few selected indicators and standards. This has enabled the PSC to establish a baseline and trends in performance over time. Up to now the PSC has evaluated 131 departments using the System, which is described hereunder.
The Executive Summary is organised as follows:
2. DESCRIPTION OF THE PSC’S SySTEM
The methodology applied by the System in essence involves assessing the actual performance of a department against a set of indicators and standards. (The detailed assessment framework is available on the PSC’s web page: www.psc.gov.za and a concise document is attached as an appendix a to this report). Evidence about the actual state of practice for the nine values was obtained by collecting and assessing policy and other documents, conducting interviews with samples of relevant persons and assessing qualitative and quantitative data according to templates and measures.
By interrogating the evidence against the indicators and standards, a sense of the performance of a department against each of the nine values was arrived at. Based on the assessment, a score is awarded to a department.
Since the same indicators are used year after year, the performance of a sample of departments in a specific year can be compared with the samples of previous years, departments can be compared with each other, and a department’s performance can be compared with its own performance in a previous year when that department comes up for re-assessment.
Executive Summary
Description of the System
Background Summary of findings Conclusion
vi

3. BACkGROUND
The specific roles that the different levels of government have to play in the housing function are defined in the Housing Act of 1997, as amended. According to this Act, the National Department of Human Settlements (NDoHS) is mainly responsible for formulating a housing policy and setting up an institutional and funding framework, whilst provincial departments and local government have the responsibility to implement the policy.1
In alignment with sections 26 (1) and (3), 27 (1)(b), (1)(c) and (2) of the Constitution of South Africa2, the National Housing Act envisages a house with secure tenure, which ensures privacy, provides adequate protection against the elements and access to municipal services.3 But the housing programme also includes developmental objectives, apart from just supplying people with a house. These include that apartheid spatial planning needs to be reversed and “sustainable human settlements” needed to be created.4 Furthermore, gender and disability disparities in home ownership patterns were to be eliminated, poverty reduced, skills development programmes for unemployed beneficiaries implemented, and the ownership patterns of small businesses changed.5
The pursuit of these ambitious policy objectives took place against limited control over land and land prices, high cost of building materials, increases in the number of informal settlements and the reluctance of commercial banks to invest in certain areas and provide mortgages to households in the R3 500 – R7 000 income band.6 Adequate budgets have not been provided to meet growing housing demand. However, housing departments have, for the most part, not been able to spend their allocated budgets.7
One of the greatest changes has been the devolution of the responsibility for housing to municipalities.8 Interviews conducted with officials from the NDoHS as part of the PSC’s evaluation, revealed that a complicated intergovernmental relations system, with misaligned powers and functions, resulted in compromised service delivery, with some houses being constructed without the necessary bulk infrastructure, which could, therefore, not be transferred to qualifying beneficiaries.9
The NDoHS has made numerous policy and institutional changes in response to these challenges. The changes included, amongst others, the introduction of the National Home Builders Registration Council certification, which guarantees the quality of the product prior to releasing it to the public, signing of “happy letters” by beneficiaries, increasing the size of the houses from 30 square meters to 40 square meters; collapsing subsidy bands to allow more income groups to obtain the maximum subsidy amount; densification of housing projects to ensure greater access to well located housing opportunities10; and rental options for those who need them.11
1 Republic of South Africa. The Department of Housing. Housing Act, 1997 (Act. 107 of 1997). Sections 3 and 7.
2 Republic of South Africa. Department of Justice and Constitutional Development. The Constitution of the Republic of South Africa, 1996.
(Act 108 of 1996 as amended). Second impression. Juta & Co Ltd. Cape Town.
3 Republic of South Africa. Department of Housing. Housing Act, 1997 (Act 107 of 1997). Section 1(vi).
4 Republic of South Africa. The Department of Housing. A Comprehensive Plan for Sustainable Human Settlements (Breaking New Ground).
2004.
5 Republic of South Africa. Department of Housing. Housing Act, 1997 (Act 107 of 1997). Section 2.
6 Smith Warren & Jolene Adams. Urban Sector Network. Development Action Group. The People’s Budget Campaign: The Housing Budget.
January 2005. p. 9.
7 Ibid. pp. 15-16
8 Republic of South Africa. Department of Housing. Housing Act, 1997 (Act 107 of 1997). Section 9.
9 Van den Berg, M. Director: Gauteng Province. National Department of Human Settlements. Directorate Monitoring. Personal Interview.
10 Republic of South Africa. The Department of Housing (now Human Settlements). Social Housing Act. ( Act 16 of 2008).
11 Ibid.
vii

4. SUMMARy OF FINDINGS
The following is a summary of how the housing/human settlement departments performed during the 2009/10 evaluation cycle.
4.1 Performance trends
The departments can be ranked as follows (Figure 1) in terms of their scores.
These rankings are fairly consistent with audit findings of the Auditor-General (A-G). All the departments that scored lower than 50%, except the Free State, received qualified audit opinions or a disclaimer during the 2008/09 financial year.
Important though is that generally the performance of departments has improved from when they were first assessed by the PSC and the re-assessment done in 2009/10 – see Figure 2 below. This shows that administrative capacity is slowly being built. This also highlights the importance of ensuring some continuity in these departments and continued motivation and pressure in the form of performance monitoring and management, in order to maintain this upwards momentum.
Figure 1: Departments’ overall average performance against all nine principles for the 2009/10 evaluation cycle
% P
erfo
rman
ce
Average
Departments
0%
10%
20%
30%
40%
50%
60%
70%
80%
90%
100%
WC NDoHS GP NC KZN LP MP FS EC NW
53%
86%
76%
57% 55%50% 49%
43% 42%36%
32%
Figure 2: Comparative performance results between the 1st and 2nd assessments
Departments
1st Assessment 2nd Assessment
Average WC NDoHS NC LP MP FS NW0%
10%
20%
30%
40%
50%
60%
70%
80%
90%
100%
% P
erfo
rman
ce
33%
53%
72%
63%
36%
86%
76%
55%
52%
49%
23%
22% 31
%32
%
42%
43%
viii

Some of the issues that led to these rankings are discussed below.
4.2 Formal requirements for public participation
The evaluation standards applied by the PSC for public participation processes emphasise that a formal system must be used to solicit inputs from the public and that these inputs must be recorded, acknowledged, and considered.
In its evaluation of the housing departments the PSC found that only 4 of the 10 housing departments had a fully fledged policy on public participation, whilst 7 departments had a system in place and used for soliciting inputs from the public. Limpopo, Northern Cape and the North West were unable to produce the necessary evidence.
Feedback is one of the most important ways of learning and to make the necessary corrections based on the experience of the recipient of government services.12 KwaZulu-Natal, Western Cape and the National Department were the only departments able to demonstrate incorporation of feedback from such engagements.
4.3 Public sector housing model limits public participation
Apart from the above formal requirements other factors that influence the nature and level of beneficiary participation should also be considered, including the housing delivery model. One such model is the developer-led delivery model, which limits participation. In the last fifteen years, over 76% of housing projects were initiated and implemented by developers.13 Of concern also is the de-linking of beneficiaries from the development and construction phase in order to speed-up delivery.14 This severely limits the say beneficiaries have in projects.
4.4 The Integrated Development Planning (IDP) process
The involvement of citizens in developing IDPs remains a concern.15 A 2007 study commissioned by the Department of Housing and Local Government in the Western Cape into public awareness of IDPs16, shows the limitations of using those processes to measure/define public participation. According to the findings of the PSC’s own System, the Western Cape department has a policy on public participation, and a system for considering and using inputs from the public, yet the 2007 study17 found that:
• 80% of respondents had no knowledge of the IDP.• More than 80% of citizens felt that their needs were not reflected in their municipal IDPs.• 78% had no knowledge of their municipal budget.• 74% of respondents stated that their local councillor has never met with them on any issue related to IDP
or municipal budget.
12 Republic of South Africa. Department of Public Administration and Development. Service Delivery Review. A Learning Journal for Public
Service Managers. Vol. 4. No 2. 2005. STE Publishers. p.37.
13 Republic of South Africa. National Department of Human Settlements. Statistics obtained from the Directorate Monitoring. 2009.
14 Republic of South Africa. Public Service Commission. M&E Report on the Department of Human Settlements. Mpumalanga Ptrovince.
Evaluation Cycle 2009/10. February 2010.
15 Ibid.
16 Foundation for Contemporary Research. Report on Public Awareness of IDPs. Western Cape Province. Department of Local Government
and Housing.
17 Ibid.
ix

The housing departments do not optimally use the information derived from municipal IDPs and this needs to be strengthened.18 According to interviews by the PSC with officials of provincial housing departments, it is the role of municipalities to obtain public input. Yet, the National Department’s Resource Book on Housing Chapters encourages “provincial departments to participate in the Integrated Development Planning (IDP) process to ensure that there is alignment between its programmes and that of municipalities.”19
This view is supported by a study undertaken by the PSC in 200920 into integrated development planning. In KwaZulu-Natal the housing committee identified projects in their wards worth R800 million, whilst the budget for the province as a whole was R800 million highlighting the importance of having provincial government officials participating in municipal technical planning committees.
4.5 Limited public participation had a specific negative impact on the broader developmental objectives of the housing programme
As emphasised in the background section above, the housing programme also had broader developmental objectives, apart from just delivering a house. This accords with the constitutional principle of development orientation. Some evidence suggests that the way the housing programme is being implemented especially compromises these broader developmental objectives. Reconstruction and Development Programme (RDP) houses are perceived by beneficiaries to be of limited economic and social value and abandoned or sold below their market value.21 Furthermore, houses produced through the public sector housing system have had different outcomes for beneficiaries. In Cape Town public sector housing located in Langa (old-town-council houses) is valued at R221 000 while those situated in Delft are valued at R72 000.22 For some beneficiaries the experience of formalisation has increased their financial burden, since they must spend their limited resources paying rates and services.23 It has even been argued by some analysts that informal housing may provide financially more viable options for the poor.24
Of the more than 2 000 housing projects, the departments submitted 57 projects for review for the PSC’s 2009/10 evaluation cycle against the principle of development orientation. Only the Eastern Cape, Gauteng, Northern Cape and the Western Cape submitted projects with a socio-economic development (job creation, skills development programmes, and socio-economic amenities) component.
Of particular interest are the Women in Construction Programmes of the Gauteng department. The project aims to support ten women in construction at a cost of R200 million over a period of 3 years at a cost of R20 million each. Given the vast resource investment targeting a few beneficiaries, it would be important to measure the impact of such an investment.
18 Republic of South Africa. National Department of Housing. Annual Report 2007/08.
19 Republic of South Africa. National Department of Housing. Resource Book on Housing Chapters.
20 Republic of South Africa. Public Service Commission. An Evaluation of Integration and Coordination in the Integrated Sustainable Rural
Development Programme. October 2009.
21 Elgin, Ronald. Between a Shack and a RDP House: Alternative Forms of Tenure Security. Transformer. October/November 2009.
22 Shisaka Development Management Services (Pty)Ltd. Phase One: General Research. Annexure B: Socio Cultural Dimensions, 24 October
03.
23 Smith, Warren & Adams, Jolene. Urban Sector Network. Development Action Group. The Peoples Budget Campaign: The Housing Budget.
January 2005.
24 Elgin, Ronald. Between a Shack and a RDP House: Alternative Forms of Tenure Security. Transformer October/November 2009.
x
4.6 Transparency facilitates public participation in the housing sector
Transparency is a pre-requisite for empowered public participation. The Promotion of Access to Information Act (PAIA), 2000 (Act 2 of 2000) was enacted to give effect to these rights.25 The PSC’s assessment of departments’ compliance with PAIA has found that implementation of PAIA was poor across the board. The Eastern Cape, KwaZulu-Natal, Mpumalanga and the North West, for example, met none of the prescripts of PAIA in 2009, denying citizens of those provinces their constitutional rights.
In terms of section 32 of PAIA, departments should annually submit a report to the South African Human Rights Commission (SAHRC) indicating the extent to which they have complied with the requirements of PAIA, and, inter alia, the number of people who requested information, and the number of requests declined. None of the departments submitted their reports to the SAHRC in 2007/08.26
Accurate and timely information on performance is an important ingredient for realising the principle of transparency and accountability. In this regard the departmental annual report is the most important tool to measure the performance of a department.27 Only four departments complied with more than 90% of the requirements of the National Treasury’s guideline on annual reporting.28 Besides the areas that have to be covered, the accuracy and reliability of the information contained in the reports are points for concern.
4.7 Management of misconduct cases in the public housing sector
Housing involves substantial investment, bringing with it substantial opportunity for corruption. Despite extensive approval processes, which span several departments and levels of government, more than 6 000 officials have been found guilty of illegally benefiting from the public sector housing subsidy programme by the Special Investigations Unit in 2009.29
The PSC found that seven departments were able to finalise their cases within the 20-80 working days period prescribed by the Disciplinary Code and Procedures for the Public Service (Public Service Coordinating Bargaining Council (PSCBC) Resolution 2 of 1999, as amended). However, despite widespread reports on corruption in the public housing programme, only 57 cases were presented to the PSC for assessment.
The PSC’s assessment of senior public servants in the national and provincial departments of housing suggests that 78% of senior managers have the necessary knowledge and experience to deal with cases of misconduct, and half of the departments provide regular training sessions to senior management on the managing of cases of misconduct.30
Training programmes should also focus on changing the attitude, practice and behaviour of senior management towards misconduct in their departments and the public sector at large.
25 Republic of South Africa. Department of Justice and Constitutional Development. The Promotion of Access to Information Act, 2000 (Act
2 of 2000).
26 Republic of South Africa. South African Human Rights Commission. Audit Recommendation on the Promotion of Access to Information Act,
(PAIA) Act no 2 of 2000. 11 February 2009.
27 Republic of South Africa. The National Treasury. The Public Finance Management Act, 1999 (Act 1 of 1999 as amended). Section 40 (1)(d)(i).
28 Republic of South Africa. The National Treasury. Annual Report and a Guide on Reporting on Performance Information. 2008/09.
29 Republic of South Africa. Special Investigation Unit. Report on the Housing Subsidy Programme. 2009.
30 Republic of South Africa. The National Department of Housing. Annual Report 2007/08.
xi

4.8 The management of financial resources in the public housing sector
Limpopo and Mpumalanga were the recipients of qualified audit opinions from the A-G, while North West received a disclaimer. All provinces, except Eastern Cape, KwaZulu-Natal and the North West had performance management systems. A fraud prevention plan (FPP) was in place for all departments except the Eastern Cape and Free State. On average, the FPPs of the national and provincial housing departments met 89% of the requirements as set out in the checklist of the PSC’s System, detailing what an ideal FPP should entail. Risk assessments were conducted in all provinces, but for Mpumalanga and the Eastern Cape.
4.9 Monitoring and evaluation practices in the public housing sector
Although most departments do produce monthly management reports, few management teams provide feedback on these reports. The ability to respond to problems in a timely fashion is, therefore, severely curtailed by such an omission.
To ensure the relevance and quality of housing products, several mechanisms and institutions (National Homebuilders Registration Council (NHBRC), monitoring and evaluation units, strategic performance units, special investigation units) have been set up. Yet, the quality of outcomes of the housing departments remains unsatisfactory. One has to ask, given the limitations of the reporting mechanism, in the form of feedback on management reports, “How do monitoring and evaluation findings flow back into decision-making?” The issue of utilising performance information and promoting evidence-based decision-making, therefore, remains a challenge.
4.10 Human resources and representivity in the public housing sector
Organisational success is dependent on the skills and knowledge base of employees. Skills development needs to be thoroughly planned to be effective. Success is also dependent on the ability to recruit, develop and retain competent leaders and managers.
The absence of a Work Place Skills Plan (WPSP) in KwaZulu-Natal, Mpumalanga and Free State is, therefore, a matter of concern. Of more concern though is that there was a limited relationship between the presence of a WPSP and the implementation thereof. Only half of the departments managed to implement their planned WPSPs.
The National Department, Eastern Cape and Western Cape were the only departments where the WPSP was preceded by a thorough needs analysis. The Western Cape department was the only department to assess the impact of the skills development on service delivery.
None of the departments met the PSC’s compliance standard of 90 days to fill staff vacancies. It takes the departments of housing on average 339 calendar days to fill a vacancy. Poorly developed and implemented staff development programmes may have negatively impacted on other transformational objectives. All departments, except Western Cape, exceeded the national target of 75% for blacks at senior management level, whilst none was able to meet the national target of 50% women at senior management level. A mere 30% of the ten departments were able to meet the 2% target for people with disabilities. Yet, only three departments implemented diversity management measures.
xii

5. CONCLUSION
The picture which is emerging is one of departments struggling to institutionalise sound administrative practice, which will allow them to manage towards and realise proper policy outcomes. The challenge facing the public housing sector is not a lack of instruments, mechanisms and institutions to manage policy outcomes, but the institutionalisation of systems and a performance culture, as well as the capacity and will of all staff members to implement the policies and systems. On the positive side though, given that the performance of all except one department have improved when compared to earlier assessment by the PSC, systems and processes are slowly being built.
xiii
Cha
pter
One
Introduction
1

1.1 INTRODUCTION
This is a consolidated sectoral monitoring and evaluation report on the housing sector. The PSC annually evaluates the performance of a sample of departments against a number of governance indicators based on the values and principles of public administration contained in section 195 of the Constitution.31 As part of the PSC’s monitoring and evaluation cycle for the 2009/10 financial year, it was decided to focus on all ten departments of housing (one national and nine provincial), given the priority accorded to providing security of tenure and accommodation for citizens. The aim of the assessment was to:
• Assess the progress that the departments of housing have made since their last evaluation by the PSC.• Compare performance between the different departments of housing.• Establish progress with the provision of housing, the challenges encountered and how these challenges are
being addressed.
The Report is structured as follows:
Chapter 1 provides a brief overview of the mandate of the PSC, and explaining the performance indicators and standards against which departments are assessed by the PSC’s M&E System. The discussion then provides the context for the housing sector, by illustrating the policy instruments that were developed to help with the provision of housing, followed by the processes involved in the allocation of funding, with a set of Annexures providing the details.
1.2 MANDATE OF THE PSC
The PSC is vested with the mandate in Section 196 (4) (a) to (d) of the Constitution to promote good governance in the Public Service.32 In terms of its mandate, the PSC is empowered to investigate, monitor and evaluate the organisation and administration, and the personnel practices, of the Public Service, to advise national and provincial organs of state, and promote compliance with the nine principles and values listed in Section 195 of the Constitution.33
Chapter 1 Introduction
1. The mandate of the PSC.
2. Definition of principles, performance
indicator(s) and standards.
3. Brief overview on the housing sector.
Chapters 2 Discussion of findings
1. Overview of performance per province.
2. Overview of performance per principle.
3. Comparative performance results between
the first and re-assessment.
4. In-depth analysis of performance per
principle.
Chapter 3 Conclusion
1. Recommendations.
2. Conclusions.
Consolidated Report on the Departments of Housing
(Human Settlements)
31 Republic of South Africa. The Department of Justice and Constitutional Development. The Constitution of the Republic of South Africa,
1996. (Act 108 of 1996 as amended). Second impression. Juta & Co Ltd. Cape Town.
32 Ibid. Section 196 (4) (a) to (d).
33 Ibid.
2

The nine Constitutional Values and Principles (CVPs) are:
1. Professional Ethics2. Efficiency, Economy and Effectiveness3. Development Orientation4. Impartiality and Fairness5. Public Participation in Policy-making6. Accountability7. Transparency8. Good Human Resource Management and Career Development Practices.9. Representivity
The CVPs serve as the evaluation framework for the PSC, and the performance of the individual departments of housing is assessed against indicators and standards that have been developed for each of the CVPs.
1.3 PERFORMANCE INDICATORS AND STANDARDS
The CVPs have been concretised into indicators and standards, which give an indication of the actual state of practice and compliance against each CVP. The detailed assessment framework is available on the PSC’s web page: www.psc.gov.za and a concise document listing the performance indicator(s) and standards used for each CVP as well as the related policies and regulations are attached as appendix a.
Evidence about the actual state of practice for the nine CVPs was obtained by collecting and assessing policy and other documents, conducting interviews with samples of relevant persons and assessing qualitative and quantitative data according to templates and measures. By interrogating the evidence against the indicators and standards, a sense of the performance of the departments of housing/human settlements against each of the nine CVPs was arrived at. Based on the assessment, a score was awarded to each CVP. The rating scale, consisting of five performance bands, is captured in Table 1 below.34
Table 1: exposition of the scoring and translation into percentagesPerformance band Score description Score %
5 Excellent performance 4,25 – 5,00 81% - 100%4 Good performance 3,25 – 4,00 61% - 80%3 Adequate performance 2,25 – 3,00 41% - 60%2 Poor performance 1,25 – 2,00 21% - 40%1 No performance 0,25 - 1,00 0% - 20%
1.4 BRIEF OVERVIEW OF THE HOUSING ENVIRONMENT
This chapter provides the context of the housing sector, by illustrating the policy instruments that were developed to help with the provision of housing. Furthermore, the processes involved in the allocation of funding are indicated, with a set of Annexures providing the details.
1.4.1 Legislative environment
The following legislative frameworks (Table 2) govern the operations of these departments, and direct and guide the accountability and responsibilities of the executive authorities, and accounting officers in their capacity as political and administrative heads, respectively.
34 The detailed assessment framework is available on the PSC’s web page: www.psc.gov.za.
3

Table 2: primary legislative mandatesTitle of Act Purpose and specific provisions Implications for housing developmentThe White Paper on Housing 1994.35
The White Paper commits government to:a) Provide a permanent residential structure
with secure tenure, ensuring privacy and providing adequate protection against the elements.
b) Provide potable water, adequate sanitation facilities including waste disposal and domestic electricity supply.
c) Deliver approximately 338 000 units per annum within a five-year period.
d) Set aside at least 5% of the budget to address the housing backlog.
e) Develop reasonable legislation to achieve this particular right.
Housing needs should be met in conjunction with the provision of other social amenities and in due cognisance of available economic opportunities (calling for integrated planning across and between government departments and municipalities).
The Constitution of the Republic of South Africa, 1996.36
Section 26, of the Constitution guarantees the right of every citizen of access to adequate housing. The State is obliged to take reasonable legislative and other measures, within its available resources, to achieve the progressive realisation of this right.
This right to have access to adequate housing for all, places a responsibility on the departments to employ all the possible policy measures for meeting the housing needs of the vulnerable and previously marginalised groups.
The Housing Act, 1997.37 The Act lays down the general principles which govern housing development, defines powers and functions of national, provincial & local governments & provides for financial arrangements for housing development.
Housing as a concurrent function of national and provincial government, and where the function can best be administered locally, it can be assigned to a municipality given that the municipality has the required capacity.
Promotes the adoption of provincial legislation and the formulation of provincial policies within national policy.
The functions of the National Department of Housing are to develop policy and strategy, monitor and evaluate the housing sector’s performance and determine the allocation of the housing subsidy budget to provincial governments.
The provincial departments are responsible for developing housing policy within the national framework, and for approving housing subsidies and projects and provide support to municipalities involved in housing projects.
Upon receiving accreditation, a municipality has the right to receive, evaluate, approve or deny applications for housing subsidy support. There are three levels of accreditation.
35 Republic of South Africa. Department of Housing. White Paper on Housing. A New Housing Policy and Strategy for South Africa. 1994.
36 Republic of South Africa. The Department of Justice and Constitutional Development. The Constitution of the Republic of South Africa,
1996. (Act 108 of 1996 as amended). Second impression. Juta & Co Ltd. Cape Town.
37 Republic of South Africa. Department of Housing. Housing Act, 1997 (Act 107 of 1997).
4

Title of Act Purpose and specific provisions Implications for housing developmentA process is currently underway to accredit large municipalities to manage large scale housing programmes consistent with Section 156 of the Constitution (National Treasury, 2010/2011).
Prevention of Illegal Eviction from and Unlawful Occupation of Land Act, 1999.38
The Act makes it illegal to evict without following due process of law.
The Act makes provision for a fair and equitable process to be followed when evicting people from their homes who have unlawfully invaded land.
Rental Housing Act, 1999.39 (This Act repeals the Rent Control Act, 1976).
This Act creates mechanisms to promote the provision of rental housing and the proper functioning of the rental market.
The Act provides for the establishment of a Provincial Housing Tribunal to mediate over rental disputes.
The Home Loan and Mortgage Disclosure Act, 2000.40
This Act requires financial institutions to disclose information required to identify possible discriminatory lending practices. Although the Act was enacted in 2000, it has not yet been promulgated. The Act facilitates middle income households who cannot access sufficient finance to buy homes because of the lending practices of certain financial institutions.
The Act provides for the establishment of the Office of Disclosure and the monitoring of financial institutions that serve the housing credit need of communities.
A Comprehensive Plan for Sustainable Human Settlement41, commonly referred to as “Breaking New Ground” (BNG) – introduced by Cabinet in September 2004.
The key objective of the BNG is to eradicate all informal settlements by 2014 and to promote the achievement of a non-racial, integrated society through the development of sustainable human settlements and quality housing. While the BNG retains the principles of the Housing White Paper, it shifts focus to improving the quality of housing and housing environments by integrating communities and settlements.
The BNG further ensured that the strategic focus would now be on the delivery of affordable housing in settlements that are both sustainable and habitable (National Department of Housing, 2009). The strategic priorities of the BNG are as follows:
• Accelerate housing delivery.• Improve the quality of housing products
and environments to ensure asset creation.
• Ensure a single, efficient formal housing market.
• Restructure and integrate human settlements.
• Use the provision of housing as a job creating strategy.
• Use property as an asset for wealth creation and empowerment.
38 Republic of South Africa. Department of Housing. The Rental Housing Act, 1999 (Act 50 of 1999).
39 Republic of South Africa. Department of Housing. The Home Loan and Mortgage Disclosure Act, 2000 (Act 63 of 2000).
40 Republic of South Africa. Department of Housing. Prevention of Illegal Eviction from and Unlawful Occupation of Land Act, 1999 (Act 19
of 1999).
41 Republic of South Africa. Department of Housing. A Comprehensive Plan for Sustainable Human Settlements. September 2004. (Breaking
New Ground).
5

1.4.2 Housing institutions
In order to support the implementation of the Breaking New Ground (BNG), housing departments in all spheres of government, as well as housing support institutions, have been extensively restructured.42 The National Housing Code 2000 has been substantially revised in view of this shift in housing policy.43
1.4.3 Funding
Funds obtained by the National Department of Housing from the fiscus, are paid into the National Housing Fund and thereafter transferred to provinces in the form of a conditional grant. Provinces in return pay the conditional grant funding over to accredited municipalities. The housing formula which shares the funds among the different provinces takes the following factors into consideration:
• The needs of each province, taking into consideration the housing backlog.• Factors such as homelessness, shack dwelling, caravan dwelling, tents, and backrooms.• A poverty indicator, measured by households earning less than R3 500 per month.• A population indicator, measured by each province’s share of total population.• A population share factor, as measured by each province’s share of total poverty.44
1.4.4 The administration of grants
The National Department of Housing administers two grants, namely the Integrated Housing and Human Settlement Development Grant and the General Conditional Grant. The aim of each grant is briefly as follows:
a) Integrated Housing and Human Settlement Development Grant
The purpose of the grant is to finance the implementation of the national housing programme for the creation of quality living environments, and to facilitate the establishment and maintenance of habitable and sustainable human settlements in which all citizens will have access to selected social and economic amenities.45
b) General Conditional Grant
This grant funds the:• Housing for beneficiaries who qualify for the consolidated subsidy or existing housing subsidies and new
subsidies;• Institutional subsidies, including grant funding for setting up housing support centres, community
development associations and the proposed establishment grant for social housing institutions; and• Land acquisition to accommodate well-located housing development in cases where the province and
municipalities do not have land available.46
Several limitations exist with regard to the intergovernmental fiscal arrangements. The Integrated Housing Conditional Grant provides for money to build houses but this may not be used to fund staff salaries and operational cost associated with housing programmes.47 A municipality must fund associated costs from its share
42 Republic of South Africa. National Estimates of Expenditure. Department of Human Settlements. 2010/2011.
43 Ibid.
44 Republic of South Africa. Financial and Fiscal Commission. For an Equitable Sharing of National Revenue. 2008/2009.
45 Republic of South Africa. The National Treasury. Division of Revenue Act. 2008/2009.
46 Ibid.
47 Ibid.
6

of the equitable allocation. However, a substantial number of municipalities do not have the in-house capacity to raise revenue to acquire staff with the adequate technical skills to successfully implement and complete highly sophisticated projects. Their revenue base is severely limited by large numbers of indigent people living in the municipal area.48
1.4.5 Housing subsidy programme
The White Paper on Housing identified seven key strategies with which to attain the housing vision and goal. The provision of subsidies to qualifying households was one of the strategies. appendix b provides a summary of the different subsidies available.
1.4.6 Cost of building a subsidised house
a) Subsidy amounts
The subsidy amount is R 55 700, which is supposed to pay for a 40 sq meter house.49 A breakdown for each of the subsidies discussed in appendix b appears in appendix C. The cost indicated in appendix C excludes the contribution to the NHBRC, the relocation cost of residents of informal settlement upgrading during the construction phase and the costs of monitoring and evaluation units.50
b) Cost of services associated with public sector subsidy housing programme
The Integrated Housing and Human Settlement Development Grant is supported by spending by other departments on water and sanitation – refer to appendix D. This is critical for the establishment of sustainable human settlements. The breakdown of the construction cost and the subsidy amount of a 40 sq. metre house followed by the cost breakdown of a serviced stand effective from 1 April 2009 appears in appendix e.51
1.4.7 Eligibility criteria
The Act requires government to prioritise the needs of the poor in respect of housing development. In order to qualify for the housing subsidy prospective beneficiaries must meet the following criteria:52
Married The applicant must be married (in terms of civil law or in terms of customary union) or co-habit habitually with any other person, or have proven financial dependents. A spouse includes any partner with whom a prospective beneficiary under the scheme habitually co-habits.
Resident The applicant must lawfully reside in South Africa, i.e. he/she must be a citizen of the Republic of South Africa or in possession of a permanent residence permit.
Competent to contract
The applicant must be legally competent to contract, that is, over 21 years of age or married or divorced, and of sound mind.
Monthly household income
The applicant’s gross monthly household income should not exceed R3 500. A prospective beneficiary will be required to submit adequate proof of income and, in the case of income received through self-employment, must sign an affidavit stating the amount earned. For the purpose of assessing whether any particular person is entitled to receive a housing subsidy under this scheme, the income of his/her spouse (if any) is added to that person’s income.
48 Ibid.
49 Republic of South Africa. National Department of Human Settlements. Statistics. Interview with Director Monitoring. 2009.
50 Republic of South Africa. Public Service Commission. M&E Evaluation Cycle 2009/10. M&E Report on the Gauteng Department of Local
Government and Human Settlements. March 2010. p. 38.
51 Republic of South Africa. National Department of Human Settlements. Statistics. Interview with Director Monitoring. 2009.
52 Republic of South Africa. The Auditor-General. Report on the Findings Identified During A Performance Audit of the Approval and
Allocation of Housing Subsidies at the Department of Local Government and Housing of the Free State Provincial Administration. February
2006.
7

1.4.8 Housing need
Massive strides in the delivery of low cost housing to poor and vulnerable families have taken place over the past five years. Over 2.8 million households have had access to housing opportunities through the subsidy programme.53
Yet, approximately 1.8 million households still have inadequate access to housing. Up to 60% of the housing backlog is found in urban informal areas.54 These households are dependent on government to provide them with adequate housing.
In 2008 the Minister of Human Settlements stated that the number of informal settlements had increased from 200 in 1994 to over 2 000 in 2009.55 Given the total number of subsidies allocated on an annual basis, it is unlikely that the backlog will be resolved in the near future. Table 3 below shows the housing need per category.56
Table 3: housing need per categoryCategory 1996 Census 2001 Census 2008 Census
Household occupying shacks in informal settlements 1 049 686 1 376 705 1 239 000Household occupying backyard shacks 403 329 459 526 586 000Households occupying houses/flatlet/room in backyard or on shared property
623 092 532 981 782 000
Households living in tents or caravans 17 126 30 610Total urban 2 093 233 2 399 822 2 607 000Traditional dwellings 1 644 388 1 654 786 1 340 000Total (urban and rural) 3 737 621 4 054 608 3 947 000
More recently the National Department of Human Settlements accepted recommendations made by the Financial and Fiscal Commission which allow for a broader and inclusive definition of households and people living in inadequate dwellings. The Financial and Fiscal Commission identified the following limitations with the housing formula:57
• People living in rural areas are excluded since the Department does not view traditional housing as inadequate.
• The differences in the cost of building a house to meet the same standard in different provinces were not taken into account.
• The number of homeless people was not officially available, and was therefore excluded.
The actual number of subsidies/houses needed could therefore be increasing as the definition becomes more inclusive of people living in inadequate accommodation.
Besides the growing number of households in need of housing, the poor workmanship quality has forced the department to start a programme of rectifying 40 000 dwellings – diverting much needed resources from families living in inadequate circumstances58 (National Department of Housing, 2008).
53 Republic of South Africa. National Treasury. Provincial Budgets and Expenditure Review 2003/04 to 2009/10. September 2007. (2.4
million instead of 2.8 million have had access to housing opportunities through the subsidy programme).
54 Republic of South Africa. National Treasury. Provincial Budgets and Expenditure Review 2005/06 to 2010/11. September 2009. p. 92.
55 Ibid.
56 Ibid.
57 Republic of South Africa. Financial and Fiscal Commission. For an Equitable Sharing of National Revenue with respect to Housing.
2008/2009.
58 Ibid.
8

1.5 CONCLUSION
This chapter has indicated that enough legislative frameworks are in place to administer the mandate of departments of housing, and that several research reports with recommendations since 2003 have been produced to provide guidance on the improvement in the areas of the general conditional grants, inadequate access to and backlog in the provision of houses in urban informal areas, and limitations in respect of the housing formula. Of concern though, is the seemingly unwillingness to implement these recommendations, which could have eliminated much of the hurdles in the provisioning of houses.
Based on this background, the Report now provides a more specific assessment of the governance of the individual departments of housing.
9

Cha
pter
Tw
o
Discussion of Findings
10

2.1 INTRODUCTION
The following is a synopsis of how the departments of housing performed, during the 2009/10 evaluation cycle and previous evaluation cycles. The comparison of cycles is thus based on evaluations done prior to 2009/10, and the 2009/10 evaluations. There are thus two sets of evaluation data that are compared.
It should be understood that the assessment of departments used information from different periods for the different principles, as indicated below:
• Principles 2, 6, and 7: Information obtained from the departments’ Annual Reports (ARs) for the 2007/08 financial year.
• Principles 1, 3 to 5 and 8 to 9: The most recent information obtained from the departments during the 2009/10 financial year.
This means that an individual departmental M&E report utilises information covering more than one financial year. From a research perspective, this does not affect the validity of the findings. However, the PSC has recognised the need to use more current performance information, and will address this gap from the 2010/11 evaluation cycle onwards.
This chapter is structured as follows:
2.2 OVERVIEW OF PERFORMANCE PER PROVINCE
The average performance for the housing sector for the 2009/10 evaluation cycle was 53% (adequate performance) – refer to Figure 1 below.
2.1 Overview of performance per province.
Chapter 2: Discussion of Findings
2.2 Comparative performance results between the first and re-assessment.
2.3 Overview of performance per principle.
2.4 In-depth analysis of performance per principle.
Figure 1: Departments’ overall average performance against all nine principles for the 2009/10 evaluation cycle
Average
Departments
% P
erfo
rman
ce
0%10%20%
30%40%
50%60%70%80%90%
100%
WC NDoHS GP NC KZN LP MP FS EC NW
53%
86%76%
57% 55%50% 49%
43% 42%36%
32%
11

The best performer for the sector was the Western Cape, which attained “excellent performance” (86%), followed by the National Department of Housing, with a rating of “good performance” (76%). The Eastern Cape (36%) and North West (32%) received the lowest scores. Low ratings are indicative of systemic dysfunctionalities in the management, and poor coordination and implementation of systems and procedures within these departments.
The low scoring provinces (below 50%), with the exception of the Free State, were also recipients of disclaimers and/or qualified audit opinions from the A-G for the period under review.
2.3 COMPARATIVE PERFORMANCE RESULTS BETWEEN THE FIRST AND SECOND ASSESSMENT
In preparing the historical part of the Report, the scores of the first and second assessments were compared. The following seven housing departments were assessed for a second time during the 2009/2010 evaluation cycle, namely, the National Department, Free State, Mpumalanga, Limpopo, Northern Cape, North West and Western Cape. An overview of the trends in performance of these departments against all nine CVPs for the first assessment and the second assessment in 2009/10 appear in Figure 2 below.
A comparison of these departments’ performance for the second assessment in 2009/2010 against the first assessment shows that the overall performance has improved by 20%, from 33% (poor performance) to 53% (adequate performance). It is encouraging to note that the performance of six of the seven departments has improved. The only decline in performance occurred in the Limpopo department, which went down from 52% to 49%, which still is adequate performance for both assessments. The main reason for the decline in performance was that the department did not submit the required information to be assessed against principles 4 (impartiality and fairness) and 5 (public participation in policy-making).
2.4 OVERVIEW OF PERFORMANCE PER PRINCIPLE
This section highlights the performance against all the principles across all ten departments assessed during 2009/2010, followed by the departments’ performance against each principle.
Figure 2: Comparative performance results between the 1st and 2nd assessments
Departments
Average WC NDoHS NC LP MP FS NW0%
10%
20%
30%
40%
50%
60%
70%
80%
90%
100%
% P
erfo
rman
ce
1st Assessment 2nd Assessment
33%
53%
72%
63%
36%
86%
76%
55%
52%
49%
23%
22% 31
%32
%
42%
43%
12
2.4.1 Average performance against the nine CVPs
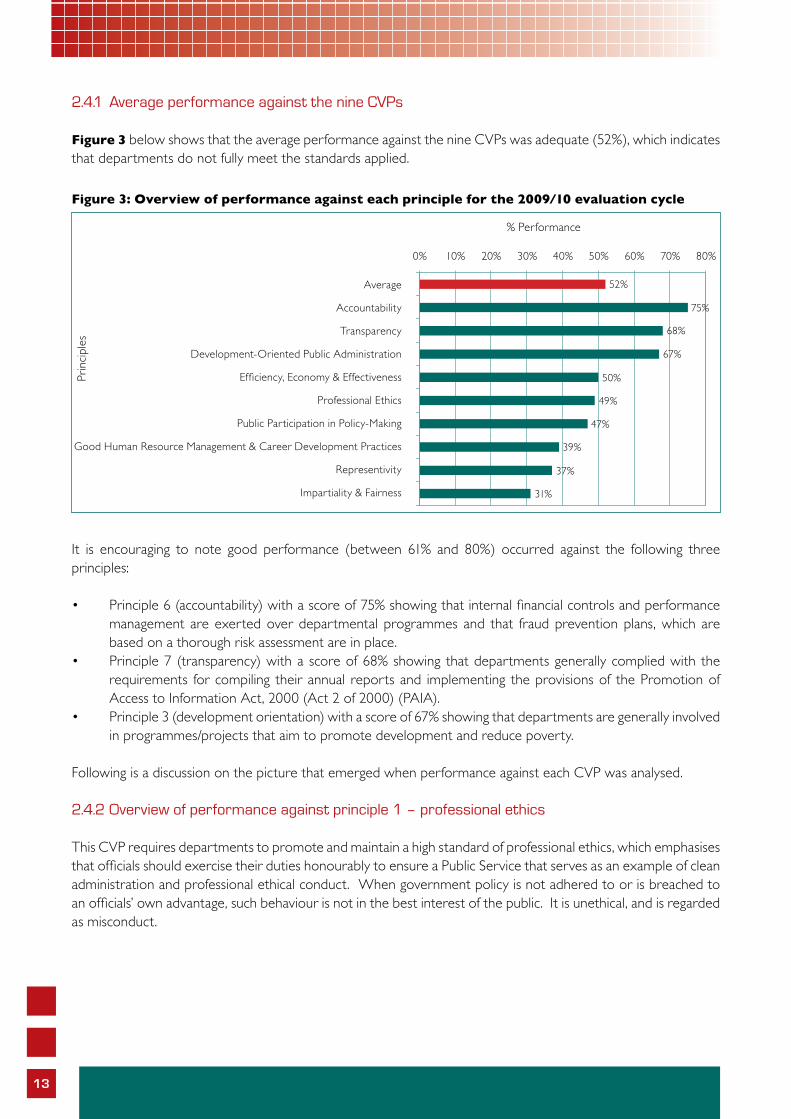
Figure 3 below shows that the average performance against the nine CVPs was adequate (52%), which indicates that departments do not fully meet the standards applied.
It is encouraging to note good performance (between 61% and 80%) occurred against the following three principles:
• Principle 6 (accountability) with a score of 75% showing that internal financial controls and performance management are exerted over departmental programmes and that fraud prevention plans, which are based on a thorough risk assessment are in place.
• Principle 7 (transparency) with a score of 68% showing that departments generally complied with the requirements for compiling their annual reports and implementing the provisions of the Promotion of Access to Information Act, 2000 (Act 2 of 2000) (PAIA).
• Principle 3 (development orientation) with a score of 67% showing that departments are generally involved in programmes/projects that aim to promote development and reduce poverty.
Following is a discussion on the picture that emerged when performance against each CVP was analysed.
2.4.2 Overview of performance against principle 1 – professional ethics
This CVP requires departments to promote and maintain a high standard of professional ethics, which emphasises that officials should exercise their duties honourably to ensure a Public Service that serves as an example of clean administration and professional ethical conduct. When government policy is not adhered to or is breached to an officials’ own advantage, such behaviour is not in the best interest of the public. It is unethical, and is regarded as misconduct.
Impartiality & Fairness
Good Human Resource Management & Career Development Practices
Representivity
Public Participation in Policy-Making
Professional Ethics
Efficiency, Economy & Effectiveness
Development-Oriented Public Administration
Transparency
Accountability
Average
80%0% 10% 20% 30% 40% 50% 60% 70%
% Performance
Prin
cipl
es
52%
75%
68%
67%
50%
49%
47%
39%
37%
31%
Figure 3: overview of performance against each principle for the 2009/10 evaluation cycle
13

The PSC assumes that departments that effectively deal with cases of misconduct are generally maintaining a higher standard of ethics than those departments that do not. Departments that deal effectively with misconduct will probably also deal effectively with other ethical issues.
The following five standards are applied to establish whether departments do in fact promote and maintain a high standard of professional ethics:
Combating corruption in the Public Service requires strong political support, systematic monitoring, and effective process for dealing with offenders.
2.4.2.1 Departments’ performance against all the standards for principle 1
The average performance was “adequate” (57%) – refer to Figure 4 below.
Five of the ten departments’ performance against this principle was above the average of 57%, with the Free State coming up with an excellent score of 90%. The performance of both Eastern Cape (10%) and KwaZulu-Natal (20%) was unacceptably low.
This low performance suggests that departments do not take cases of misconduct seriously, and this impacts on their credibility and would send an incorrect message to staff that they are not serious about addressing misconduct.
Principle 1: Standards
1. A policy on misconduct is in place.
2. Management reporting is done.
3. Cases are finalised promptly.
4. Adequate capacity to handle cases of misconduct.
5. Training is provided.
Average
% P
erfo
rman
ce
0%10%20%
30%40%
50%60%70%80%90%
100%
FS MP NDoHS WC GP NC LP NW KZN EC
Figure 4: Departments’ performance against principle 1
Departments
57%
90%85%
75% 75%65%
55% 50%40%
20%10%
14

2.4.2.2 Each department’s compliance per standard
Each department’s compliance against each standard highlighted above is summarised in Table 4 below.
Table 4: each department’s compliance per standard
Department
Policy on
managing
cases of
misconduct
is in place
Managers’
knowledge of
the Disciplinary
Code and
Procedures
for the Public
Service
Time taken
to resolve
the most
recent
cases of
misconduct
Management
reporting
on cases of
misconduct is
done
Evidence on
management’s
response/actions
on these reports
Adequate
capacity to
handle cases
of misconduct
Training is
provided on
the managing of
misconduct
EC √ X √ X X X XFS √ √ √ √ X √ √GP √ No info √ √ X √ √KZN √ √ X √ X X XLP √ √ No info √ No info No info No infoMP √ √ √ √ X √ √NC √ √ √ X X √ XNW √ X √ √ X X XWC √ √ √ √ √ X √NDoHS √ √ √ √ X √ √% Dep. complied
100% 70% 80% 80% 10% 50% 50%
% No information
0% 10% 10% 0% 10% 10% 10%
Legend: √ = met the standard: X = did not meet the standard.
2.4.2.2.1 The existence of a policy/guideline on managing cases of misconduct
Having a policy document on how to deal with cases of misconduct will ensure a common understanding of misconduct and discipline, and that discipline is applied in a fair and progressive manner. All ten departments evaluated utilise Resolution 2 of 1999 of the Public Service Co-coordinating Bargaining Council (PSCBC) as framework to deal with cases of misconduct.
2.4.2.2.2 Managers’ knowledge of the Disciplinary Code and Procedures for the Public Service (the Code)
The PSC assessed a sample of at least five senior managers per department to determine their working knowledge of the disciplinary Code. The analysis has shown that 70% of departments met this standard, and that 78% of the senior managers interviewed had a working knowledge of the Code.
2.4.2.2.3 The time taken to resolve the most recent cases of misconduct
Any alleged case of misconduct needs to be dealt with promptly to avert and correct unacceptable conduct.
15

Seven instead of ten departments submitted information on cases of misconduct where a hearing was conducted to assess the average length of time taken to resolve these cases. According to the submitted information, all seven departments were able finalise their cases on average within the PSCBC’s prescribed timeframe of 20 to 80 working days. North West was the best performer against this standard by finalising cases of misconduct within an average time of 24 working days, which is also below the overall average of 34 working days (see Figure 5 above).
The Free State did not have any reported cases of misconduct during the period for assessment, whilst KwaZulu-Natal and Limpopo failed to submit the necessary information for assessment.
Abscondment and absence without permission from the workplace contributed 29% and fraud/conflict of interest and dishonesty 25% of all misconduct cases – Figure 6 below.
Figure 5: Departments’ management of cases of misconduct
Average
Num
ber
of a
vera
ge w
orki
ng d
ays
0
10
20
30
40
50
60
70
MP NC WC GP NDoHS EC NW FS KZN LP
Departments
No
Misc
ondu
ct c
ases
for
perio
d of
ass
essm
ent
No
info
rmat
ion
subm
itted
No
info
rmat
ion
subm
itted
34
5853 52
46
36 33
24
Gross insubordination
Leave without permission from HoD
Unauthorised use of vehicle
Theft
Intoxicated/assault
Negligence
Social grants
Fraud/conflict of interest
Abscondment & absent without permission from work
Figure 6: Most common acts of misconduct of sample cases assessed in 2009/10
0% 5% 10% 15% 20% 25% 30% 35%
Act
s of
misc
ondu
ct
% Occurrence
29%
25%
9%
8%
8%
7%
6%
6%
2%
16

2.4.2.2.4 Management reporting on cases of misconduct
Management reports keep management abreast of cases of misconduct, and the time it takes to finalise cases of misconduct. The reports are also necessary for management to institute timeously corrective measures. Of concern though, is that the Eastern Cape and Northern Cape did not report cases of misconduct in management reports. Evidence of management actions on such reports could only be found in the Western Cape, which demonstrates the department’s urgency in resolving cases of misconduct speedily.
2.4.2.2.5 Capacity to handle cases of misconduct
Alleged cases of misconduct cannot be dealt with promptly if a department does not have adequate capacity to handle and finalise such cases. Considering the number of cases a department has to deal with in a particular year, the Free State, Gauteng, Mpumalanga, Northern Cape and the National Department were the only departments with sufficient capacity to manage cases of misconduct, should they occur. The lack of capacity in other provinces reflects a weakness in the system to address misconduct.
2.4.2.2.6 Training on the management of cases of misconduct
Dealing with cases of misconduct is a management responsibility, and training is necessary to equip managers with the necessary skills. The Free State, Gauteng, Mpumalanga, Western Cape and the National Department were the only departments covering the procedures and management of misconduct in their capacity building processes.
2.4.2.3 Disclosure of financial interests by senior managers
Of the 410 senior managers working for the departments of housing, 237 (or 58%) disclosed their financial interests for the financial year 2008/09 (see Table 5 below), before the deadline of 31 May 2009.59
Table 5: statistics on financial disclosures of sMs members for all housing departments as at 31 May 2009
DepartmentNo. of SMS Members
No. of forms received on 31 May 09
No. of forms outstanding on
31 May 09
Percentage forms
receivedLP: Department of Local Government and Housing 42 42 0 100%NW: Department of Developmental Local Government and Housing
21 21 0 100%
WC: Department of Local Govt. and Housing 24 24 0 100%NC: Department of Housing and Local Government 16 15 1 94%EC: Dept. Housing, Local Govt. & Traditional Affairs 82 68 14 83%KZN: Department of Housing 19 15 4 80%GP: Department of Housing 67 43 24 64%MP: Department of Local Government and Housing 26 9 17 35%Nat. Department of Housing 73 0 73 0%FS: Dept of Local Government and Housing 40 0 40 0%
Total 410 237 173 58%
59 Republic of South Africa. Public Service Commission. Fact Sheet: Monitoring Compliance with the Requirements of the Financial Disclosure
Framework for the 2008/09 Financial Year. September 2009.
17

Three of the ten departments, namely, Limpopo, North West and Western Cape showed a 100% return rate. Of concern is the National Department and Free State with a nil return rate by the due date of 31 May 2009. Not submitting their financial disclosure forms on time signals a lack of transparency among senior managers at a time of growing concern over the reported widespread corruption found in housing departments by the Special Investigation Unit (SIU).60
In March 2009, the SIU recommended that disciplinary action should be taken against 634 government officials. The SIU, for example, found that these officials were registered as the owners of subsidised housing for which they did not qualify. This constitutes corruption and manipulation of the subsidy system. The huge occurrence of corruption is despite the numerous and costly procedures that must be followed when an applicant’s eligibility for the housing subsidy is assessed.61 The box below sketches the stringent approval process.
box 1: subsidy approval process62
Once a housing subsidy application has been captured on the Housing Subsidy System (HSS), the application is sent for the following electronic searches that are conducted overnight:
• The application is compared to the Population Register to ensure the validity of applicant and spouse ID numbers, and that applicant and/or spouses are not deceased.
• The application is compared to the National Housing Subsidy Database to ensure that neither the applicant nor his/her spouse has previously benefited from government housing assistance.
• The application is compared to the Deeds Register to ensure that neither the applicant nor his/her spouse previously owned a property.
The system-wide maladministration of the subsidy grant, as illustrated by the findings of the SIU investigation into housing subsidy fraud, makes the SIU ideally placed to undertake these investigations. Clearly, more than one department is involved and the matter should not be addressed at departmental level only.
2.4.2.4 Conclusion
It can be concluded that departments have performed adequately against this principle in 2009/2010. Management reporting on cases of misconduct and sufficient capacity to handle such cases remain a challenge. However, performance with regard to the time taken to resolve cases of misconduct improved in the sense that 100% of the sampled cases assessed were finalised within the required 20 to 80 working days. However, the submission of financial disclosure forms before the deadline still needs attention.
2.4.3 Overview of performance against principle 2 – efficiency, economy, and effectiveness
This Constitutional principle relates to the area of financial management, and as such addresses a departments’ ability to ensure that their limited resources are spent in ways that achieve more value for money. The ultimate goal is to provide cost-effective services of a high quality. To assess whether government is performing efficiently, economically and effectively there should be a clear link between strategic planning, budgeting, performance management and service delivery.63
60 Architect Africa Network. Sexwale vows to stamp out corruption in Housing. July 1, 2009.
61 Republic of South Africa. Auditor-General. Report on the findings identified during a Performance Audit of the Approval and Allocation of
Housing Subsidies at the Department of Local Government and Housing of the Limpopo Provincial Administration. February 2006.
62 Ibid.
63 Republic of South Africa. Public Service Commission. 6th Consolidated M&E Report. Evaluation cycle 2008/09.
18

The following three standards are applied to establish whether departments do in fact promote efficiency, economy and effectiveness:
2.4.3.1 Departments’ performance against all the standards for principle 2
The average performance was “adequate” (50%) – refer to Figure 7 below.
Mpumalanga (80%), followed by the National Department, Eastern Cape and Western Cape (all with a score of 70%) were the top performers. The good performance of these four departments is due to performance indicators (Pls) which were formulated in measurable terms, the clear linkage between outputs reported on in the annual report and targets in annual performance plans, and the achievement of more than 60% of their planned priority outputs. Of concern is that four departments’ performance was below the overall average performance of 50%. These four departments were Limpopo and Northern Cape with a poor performance of 40% each, followed by Gauteng with 20% and North West with 10%, which is indicative of no performance against most of the standards. The main reason for the low performance of North West is that no information was submitted on the measurability of PIs and the implementation of planned outputs.
2.4.3.2 Each department’s compliance per standard
Each department’s compliance against each standard highlighted above is summarised in Table 6 on the next page.
Principle 2: Standards
1. Expenditure is as budgeted for and material variances are explained.
2. Performance Indicators (PIs) are measurable.
3. Programmes are implemented as planned.
Average
% P
erfo
rman
ce
0%
30%20%10%
40%
60%50%
70%80%90%
MP NDoHS EC WC FS KZN LP NC GP NW
Departments
Figure 7: Departments’ performance against principle 2
50%
80%70% 70% 70%
50% 50%40% 40%
20%10%
19

Table 6: each department’s compliance per standard
DepartmentExpenditure is as budgeted for.
Material variances are
explained
More than 50% of each programme’s PIs are measurable
Programmes are implemented as planned
Outputs, Pls and targets are clearly
linked
80% and more of the priority outputs have been met (Actual achievement in
brackets)EC X √ √ √ X (73%)FS X √ √ √ X (50%)GP X √ X X X (4%)KZN √ √ √ √ X (29%)LP √ √ √ X X (56%)MP X X √ √ √ (86)NC √ √ X √ X (34%)NW √ X No information No information No informationWC √ √ √ X X (71%)NDoHS X √ √ √ X (76%)% Dep. complied
50% 80% 70% 60% 10%
% No information
- - 10% 10% 10%
Legend: √ = met the standard: X = did not meet the standard.
2.4.3.2.1 Expenditure in relation to outputs produced
A department’s budget is the financial plan indicating how a department intends to spend the allocated money. In terms of Section 39 (1) (a) of the PFMA, the accounting officer is compelled to ensure that the expenditure is in accordance with the allocations.
Non-adherence to this requirement may lead to either under-, over- or unauthorised expenditure. It was found that the expenditure of eight departments was outside the generally accepted 2% margin of their respective planned budgets. A further analysis shows that there is little correlation between the departments’ total expenditure on the one hand and the achievement of their planned outputs on the other hand – refer to Figure 8 above.
Figure 8: relationship between total budget spent and total outputs achieved
Departments
Average EC GP KZN NC NDoHS LP WCMP NW FS0%
20%
40%
60%
80%
100%
120%
% o
f tot
al b
udge
t sp
ent
&
tota
l out
puts
ach
ieve
d
% of total budget spent % of total output achieved
97%
48%
105%
102%
100%
73%
4%
29%
99%
34%
96%
96%
95%
95%
91%
86%
86%
71%
0%
50%56
%
76%
20

On average the departments spent 97% of their total budget, whilst achieving on average only 48% of their total planned outputs. Of particular concern is those departments where the percentage of their total budget spent, compared to the percentage of planned outputs achieved, are below the average achievement of 48% outputs, for example, Gauteng (102 versus 4%), KwaZulu-Natal (100% versus 29%), Northern Cape (99% versus 34%), and North West (91% versus 0%). The misalignment between expenditure and outputs should be a matter of concern for Government.
The 4% achievement of housing outputs for Gauteng was because:
• The Department did not report actual achievements on any of the predetermined objectives, as required by section 40(3)(a) of the PFMA.
• All the measurable objectives reported in the AR were materially inconsistent with the predetermined objectives as per the annual performance plan.
The A-G also, was unable to obtain sufficient appropriate audit evidence in relation to the actual reported performance information for Programmes 3: Housing. The actual achievement against targets was not reported in any of the total planned indicators.
KwaZulu-Natal did not provide any reasons for not meeting planned outputs whilst the North West’s annual performance reporting did not have output performance measures/service delivery indicators and targets. It was, therefore, not possible to check which priority outputs were achieved and which ones were not.
Limpopo stated that the low achievement of outputs against the total budget spent was as a result of a directive from Treasury on austerity measures, retention fees for housing projects were completed towards the end of the financial year for which payment will be done in the new financial year, and delays from municipalities in meeting pre-conditions for transfers.
Mpumalanga identified the late identification of beneficiaries, lengthy and costly environmental assessment, and weak project management and quality assurance as obstacles for not achieving all objectives.
The Western Cape mentioned that the under-spending and low achievement of outputs were mainly due to illegal occupants of the N2 Gateway houses during December 2007 and January 2008, and contracts in respect of water waste management and other support to municipalities that were not concluded by 31 March 2008.
The Northern Cape mentioned capacity constraints as the main reason for the non-achievement of targets in respect of managing/facilitating/monitoring and providing support for the implementation of capacity building and human resource programmes in municipalities. However, no indication was provided of contingency plans to rectify performance where target outputs were not reached.
In the case of the Free State, the A-G in the 2008/09 financial year highlighted a material under-spending of R110.1 million mainly in respect of the integrated housing and human settlement grant. The Free State did not provide reasons for the under-spending. The under-spending against this grant is of concern since this was also reported in the first assessment where the under-spending on housing amounted to R112.9 million. This constant under-spending on housing is unacceptable considering the huge demand for housing.
These outcomes raise questions about departments’ ability to deliver on stated goals and objectives in a manner that is efficient and effective. This further suggests that departments do not have measures in place to ensure that the several performance monitoring instruments, including monthly expenditure reports and quarterly performance reports are used in a meaningful manner.
21

2.4.3.2.2 Material variances between planned and actual expenditure are explained
Analysing the reasons for goals not being met is pivotal to managing performance, as lessons learnt may be used to improve the successful implementation of projects. It was found that eight of the ten departments understood this principle since they have provided explanations for material variances between their planned and actual expenditure, where this exceeded the generally accepted margin of 2% as per National Treasury Guidelines (Table 6). North West was the only department that did not provide any explanation for the variances exceeding the 2% margin.
2.4.3.2.3 Performance indicators are measurable
Measurable PIs in terms of time, quantity and quality are a management tool utilised to monitor progress in the achievement of outputs, and to institute timeous corrective measures. The PIs of seven of the ten departments met the requirements against this standard (Table 6). The Northern Cape’s and Gauteng’s outputs could not be measured due to their poor formulation, whilst the North West failed to submit information in this regard.
2.4.3.2.4 Linking outputs reported on in the annual report with targets set in annual performance plans
It is a principle of performance reporting that performance should be reported against predetermined objectives.64 This means that actual performance reported in the annual report should be compared to the indicators and targets set in plans. In the case of Gauteng, no clear relationship could be established between targets, indicators and outputs as they appear in the AR, APP and PEE, whilst the North West failed to submit any information.
According to the information submitted by eight of the nine provinces, a total number of 165 661 houses were delivered during the 2007/08 financial year – refer to Table 7 below. Amongst the main constraints/challenges were the poor performance of contractors and the acquisition of suitable land.
Table 7: number of houses completed during the 2007/08 financial year
ProvinceNo. of houses completed in the 2007/08 financial
yearConstraints/challenges Contingency plans
EC 22 036 • Poor performance of contractors.• Delayed procurement processes
of municipalities due to inadequate capacity to execute the function.
• Slow implementation of projects by developers.
• Slow turnaround time of enrolment process.
• Slow reconciliation of trust accounts.
• Determine developer status before assuming duty.
• Established a legal advisory service & contract management component to ensure that effective contracts are drafted, that contractors comply with their contractual obligations and to provide legal support service to the department.
FS No information submitted
64 Republic of South Africa. National Treasury. Public Finance Management Act, 1999 (Act No. 1 of 1999) Section 40(3)(a).
22

ProvinceNo. of houses completed in the 2007/08 financial
yearConstraints/challenges Contingency plans
GP 64 064 • Finalisation of agreements in respect of the demarcation of building sites.
• Obtaining approval of house/layout plans.
• Identifying alternative land due to de-densification of informal settlements.
• Poor performance of contractors.• Lengthy subsidy approval process.
• A steering committee was established in all municipalities to address the de-densification of informal settlements.
• A task team was established to develop a clear migration business plan in collaboration with municipalities.
• Legal services were outsourced to expedite the finalisation of tri-partite agreements.
KZN 24 406 No information submitted.LP 3 870 No information submitted.MP 12 233 • Late identification of beneficiaries at
municipal level.• Delays in construction of houses
due to lengthy environmental impact assessment process.
• Project management and quality assurance.
NC 4 042 • High cost of servicing sites.• Increase in building materials and
transport.• Lack of skilled labour.
A Housing Data Base has been developed to ensure that houses are allocated according to the waiting list.
NW 18 917 • Availability of land.• Municipal infrastructure services.
On-going engagements with housing stakeholders.
WC 16 093 • Insufficient funds.• Lack of land.
• Additional funding from the National Department to address the backlog, the request was not approved.
• An amount of R161 million was paid to various municipalities for the purchase of land.
Total 165 661
The total backlog in the provision of housing in three of the provinces, which provided information, is as follows:
EC: 797 932MP: 12 520NC: 68 000WC: 409 000Total: 1 287 452
However, where outputs have been achieved, quality remains a concern. Poor workmanship, including cracks in floors and walls, leaking roofs, problems with windows and limited access to sanitation and water have been found in several projects.
23

2.4.3.3 Conclusion
The lower than adequate performance of four departments, suggests that they do not have in place a good system for budgetary control and for verifying progress against outputs. This is being confirmed by the finding that:
• Their expenditure was outside the generally accepted margin 2%, of their planned budgets. • There was limited correlation between their expenditure and outputs produced. • They were unable to achieve more than 60% of their planned outputs.
2.4.4 Overview of performance against principle 3 – development orientation
This principle requires departments to ensure that they, within their respective mandates, drive development oriented projects, and thus contribute to the national effort of government to promote development and eradicate poverty. This means that departments need to consciously build development considerations into their programmes/projects and monitor the outcome thereof.65 The net effect of a developmentally orientated Public Service will be one that meets the Millennium Development Goals.66
The following five standards are applied to establish whether departments do in fact promote development to reduce poverty:
2.4.4.1 Departments’ performance against all the standards for principle 3
The average performance was “good” (67%) – refer to Figure 9 below.
65 Republic of South Africa. Public Service Commission. 6th Consolidated M&E Report. Evaluation Cycle 2008/09.
66 Republic of South Africa. Public Service Commission. State of the Public Service Report 2008.
Principle 3: Standards
1. Beneficiaries participated in projects.
2. Project plans are of an acceptable standard.
3. IDPs are considered in the projects.
4. A system for lessons learned is in place.
5. At least half the projects achieved their objectives.
Average
% P
erfo
rman
ce
0%
20%
40%
60%
80%
100%
120%
NDoHS KZN LP NC WC GP NW FS EC MP
Departments
Figure 9: Departments’ performance against principle 3
67%
100% 100% 100%90% 90%
80%
60%
25% 20%
0%
24

The National Department, KwaZulu-Natal and Limpopo were the top performers with a compliance rate of 100%, followed closely by the Western Cape (90%) and the Northern Cape (90%). The poor and no performers were Free State 25%, Eastern Cape (20%) and Mpumalanga (0%).
2.4.4.2 Each department’s compliance per standard
The individual department’s compliance against each standard highlighted above is summarised in Table 8 below. The highest compliance (80%) was against the standard “Alignment of poverty reduction projects with Integrated Development plans (IDPs).” The high compliance rate of departments against this standard is encouraging, since it shows that departments also comply with the National Housing Code, which requires that the information in IDPs should be used in housing needs assessments, as well as for the identification, surveying and prioritisation of informal settlements.67
Table 8: each department’s compliance per standard
Department
Beneficiaries participated in 50% of the
projects
50% of the project plans are of an
acceptable standard
Poverty reduction projects are aligned with IDPs in at least 50% of the projects
A system for lessons learned
is in place
Half the projects
achieved 50% of their objectives
EC X X X X √FS X X √ X √GP √ X √ √ √KZN √ √ √ √ √LP √ √ √ X √MP X X X X XNC √ √ √ √ √NW √ X √ √ XWC √ √ √ √ √NDoHS √ √ √ √ √% Dep. complied 70% 50% 80% 60% 80%% Dep. not complied
30% 50% 20% 40% 20%
Legend: √ = met the standard: X = did not meet the standard.
2.4.4.2.1 Participation of beneficiaries in the design of projects
For a poverty reduction programme/project to be successfully implemented it is important to obtain the buy-in from the beneficiaries. It is necessary to get their active involvement in the governance, design and implementation of such programmes/ projects to ensure a higher level of client satisfaction, thereby, improving the effectiveness and efficiency of investments by the state. All departments could show beneficiary participation in the design of the projects, except for the Eastern Cape, Free State and Mpumalanga.
It was found that the most popular way of interacting with the public was Izimbizo, which is utilised by five (50%) of the ten departments, followed by ward committees, steering committees and support organisations, which are utilised by 40% of the departments (refer to Table 9 on the next page). Only 10% of the departments utilised client satisfaction surveys and Lekgotla. Although the Free State utilised the most structures (6) to interact with the public compared to the rest of the departments, the records of poverty reduction projects submitted for assessment did not contain evidence of this participation.
67 Republic of South Africa. Department of Human Settlements. The National Housing Code. A Simplified Guide to the National Housing
Code. Part A. Introduction to Simplified Guide to the National Housing Code. 2009. p. 41.
25

Table 9: systems for public participationDescription EC FS GP KZN LP MP NC NW WC % Departments
1. Izimbizo √ √ √ √ √ 50%2. Councillor and Ward
Committees√ √ √ √ 40%
3. Provincial Steering Committees
√ √ √ √ 40%
4. Support Organisations √ √ √ √ 40%5. Public meetings √ √ √ 30%6. Speakers Forum √ √ √ 30%7. Workshops √ √ √ 30%8. Traditional Leadership √ √ 20%9. Client Satisfaction Surveys √ 10%10. Lekgotla √ 10%
Total 1 6 5 3 3 1 4 4 3
A good example of successful engagement with beneficiaries was found in Gauteng. Public meetings are held in various stages of a project to ensure that communities are acquainted with all the issues and objectives of the project. In addition, communities are able to express their needs in respect of housing and social facilities, which is pivotal to the project planning process. The issues raised at these meetings are also captured in the project plan, and further discussed at the Project Steering Committee meetings to translate the inputs into overall project objectives. All projects have steering committees, which discuss the business plans of the projects, including planning, implementation and progress made. There are various meetings ranging from technical meetings to site meetings, where beneficiaries are engaged on different issues relating to the projects. The Greater Alexandra Forum (GAF) was established to represents communities living in Alexandra and surrounding areas. The GAF provides a platform to build partnerships and cooperation amongst sectors of the community.
Gauteng also ensures that beneficiaries who participate in poverty reduction projects attend beneficiary education workshops pertaining to the housing programmes. The aim of these workshops is to inform the beneficiaries of the project and also to solicit their inputs.
Limpopo has a guideline on the development of projects titled the “Project Management Guidebook for the Department of Local Government and Housing: Limpopo Province”. Participation of beneficiaries in the design, management and implementation of housing projects is limited to meetings between the Department, community members and Municipal Councillors. Participation in the implementation phase of a project depends on whether such beneficiaries actually live on the building site. Consumer education is offered through Housing Consumer Education forums and workshops to educate beneficiaries about their responsibilities for looking after their properties. Beneficiary participation is also hampered by leadership changes within communities.
In the Western Cape municipalities are the developers and are responsible for the participation of potential beneficiaries in the design and implementation of housing projects. Beneficiaries are allowed to participate in planning, meetings, formalisation of proposals regarding the servicing of erven, relocation of households, and entering into agreements with the municipalities regarding the various aspects of upgrading of the proposed areas and implementation of projects.
2.4.4.2.2 The use of good project management standards
Linked to beneficiary participation and the successful implementation of a project is the need for a project plan that complies with the basic ingredients of good project management, namely having measurable objectives, clear time frames, detailed financial projections, and review meetings. This standard, therefore, focuses on whether objectives, time frames, budget and issues such as HIV/Aids, gender and the environment are addressed in
26

departmental plans on development projects. The PSC’s assumption is that such a sound project plan will assist management to keep abreast of progress and timeously implement corrective measures.
Of the ten departments, five (50%), namely KwaZulu-Natal, Limpopo, the Northern Cape, the Western Cape and the National Department of Housing utilise good project management standards. The Northern Cape, for example, utilises the Housing Subsidy System (HSS) as a project management tool to manage housing projects, and ensures that acceptable project management standards are maintained and incorporated in site processes.
2.4.4.2.3 Projects are aligned with Integrated Development Plans (IDPs)
Another success factor for implementing poverty reduction projects is that there should be a clear link between the intended project and the IDP. The IDP is a single inclusive strategic plan for the development of a municipality that links, integrates and co-ordinates plans and takes into account proposals for the development of the municipality, aligns resources and capacity of the municipality with the implementation of the plan, and is compatible with national and provincial development plans. Provincial departments are required to ensure that housing projects appear in municipal IDPs otherwise these projects cannot be funded from the national housing programme.68 It was found that eight of the ten departments’ development plans were aligned with Integrated Development Plans. The Eastern Cape and Mpumalanga projects were found not to be aligned to the IDP process. This could impact negatively on the sustainability of these projects.
Examples of good co-operation between the provincial department and municipalities were found in Gauteng, Northern Cape, North West and Western Cape. Guateng initiated the development of Municipal Housing Development Plans (MHDPs). The objectives of the MHDPs are to:
• Bridge the gap between Municipal and Provincial Planning in providing a joint platform for housing planning, prioritisation and resource mobilisation.
• Improve and create a credible IDP at local level to reflect National and Provincial policy directives and strategies.
The MHDPs promote co-operative governance by quantifying housing needs and demands; provide a coherent framework against which projects are implemented; play a crucial role in the alignment of provincial initiatives and projects at local level; ensure that the projects are communicated to communities during the IDP’s public participation processes; and are critical tools in planning for the provision and upgrading of bulk services, and the allocation of Municipal Infrastructure Grant funding to such projects.
In the Northern Cape municipalities are responsible for ensuring that all housing projects are aligned with their IDPs. Therefore, the Department only has an overseeing role in this regard. The Department occasionally experiences such alignment processes as challenging, as IDPs do not always meet the set standards, especially in respect of qualitative and detailed financial information.
North West works closely with municipalities through ward councillors in terms of identifying projects that can benefit the communities, whilst Western Cape ensures that as part of the project approval process, the municipalities must confirm that the projects are reflected in their IDPs and that funding is available.
2.4.4.2.4 A system is in place for systematically institutionalise lessons learnt
Six of the ten departments have a system in place to record lessons learned and applying those lessons in future projects. The following departments serve as examples:
68 Republic of South Africa. Department of Human Settlements. The National Housing Code. A Simplified Guide to the National Housing
Code. Part A. Introduction to Simplified Guide to the National Housing Code. 2009. p. 41.
27

• Gauteng: There is no specific system for identifying lessons learned. However, various areas were highlighted as areas in which some lessons were learned, including allocation of houses, Backyard Rental, Urban Renewal Projects, Mixed Income Development in Cosmos City, Eradication of Informal Settlements and the Hostel Eradication Programme.
The department also compiled a report on “Study on Challenges and Lessons Learned from the Orlando East Backyard Rental Scheme”. The report captures the history of the Orlando East project. The views of various stakeholders, for example, councillors, community organisations, the Soweto Crisis Committee, the South African National Civic Organisation, the Backyard Dwellers Association, beneficiaries, tenants, and contractors form part of the report, together with findings and recommendations.
• KwaZulu-Natal: The department embarked on capacity building that focuses on capacitating all stakeholders in delivering houses in the province. These stakeholders include municipal and provincial housing officials, councillors, Amakhosi, emerging developers, social institutions, NGOs and CBOs, material suppliers, and parliamentary portfolio committee members. The aim was to enhance stakeholders’ knowledge and skills in housing related issues, which will ultimately lead to effective and efficient housing delivery.
• Northern Cape: An M&E system called Impact Assessment Framework is utilised which monitors, evaluates and assesses all projects undertaken by the department. Meetings and information sharing sessions with municipalities are also utilised to ensure that lessons learned are cascaded down to municipal level.
• North West: Tender documents include requirements that training should be provided to staff. Training includes technical, generic and management skills imparted to employees with a view to empowering them with the necessary technical skills to undertake the projects. There is a bi-monthly developers’ forum to share best project management practices and successful initiatives throughout the province. The lessons proved to be valuable because there is improved reporting, delivery of programmes and cash-flow projections; and improved National Home Builders Registration Council (NHBRC) enrolments.
2.4.4.2.5 Socio-economic outcomes (success) of the public sector housing programme
The Government has set development objectives for the public sector housing programme beyond the mere provision of a house. Of the more than 2 000 housing projects, the departments submitted 57 projects for assessment by the PSC with regard to the achievement of such developmental objectives. Only the Eastern Cape, Gauteng, Northern Cape and the Western Cape submitted projects with socio-economic outcomes such as job creation, and skills development. The following serve as examples:
• The Eastern Cape employed two women contractors in the housing consumer education project, whilst at least 100 youths were trained in various building skills, and 79 unemployed graduates were given jobs. Disabled people were included in the training of emerging contracts, whilst fifteen emerging contractors registered at the Nelson Mandela Metropolitan University for a short construction and financial management learning programme.
• Gauteng drafted a booklet on “Making Gauteng a better place for women – profiles of 10 women contractors (Women Booklet). The Women Booklet is about empowering women in the construction sector. Women in the housing and construction sector participated meaningfully in low cost housing projects. Scrutiny of a Report on the Economic Empowerment of Women, Youth and People with Disabilities in the Housing Sector (the Report) revealed that:
- R200 million was ring-fenced to empower 10 women in construction. - During the financial year 2008/09, the value of contracts awarded to women was R655 426 099.
Those awarded to youth amounted to R110 588 073 and persons living with disabilities, R184 203.
28

The programme has had different outcomes for beneficiaries in terms of security, financial value and access to employment and educational opportunities. The state subsidy housing programme’s outputs saw high density developments on the outskirts, devaluing the benefits of one of the most expensive investments in households by the state.69
Table 10 below shows that the property values of both the old township stock and the RDP houses have increased substantially between 2003 and 2008. However, the increases in value differ significantly between areas.
Table 10: The value of public sector subsidy housing stock70
Housing stockA
vera
ge p
rice
2003 2004 2005 2006 2007 2008 % changeKathlehong Phooko (Old Township Stock)
R52,425 R28,891 R65,000 R59,538 R140,000 R98,333 13%
Lamoville (Old Township Stock) R91,351 R91,810 R116,286 R135,295 R177,130 R98,629 24%Tsakane (RDP) R15,988 R26,301 R38,484 R91,237 R135,310 R150,699 57%Ntuzuma (Informal Settlement) R38, 297 R56,732 R52,889 R68,955 R77,723 R153,246 28%Westrich (RDP) R24,337 R29,540 R57,712 R87, 041 R135,607 R138,457 42%
Other important developmental objectives were the number of jobs created through the programme and the number of female headed households benefiting from the programme.
Jobs created through the housing programme
Another expected key outcome was the number of jobs that would be created through the public sector housing programme. Figure 10 below shows that an average of 35 127 jobs were created over the past ten years stretching from 1999 to 2009.
However, there is not sufficient information on the nature of the jobs created (whether they were permanent, semi-permanent or casual employment opportunities).71
69 Hoek-Smith, Marja C. and Douglas B. Diamond. The Design and Implementation of Subsidies for Housing Finance. Prepared for the World
Bank Seminar on Housing Finance. March 10-13, 2003.
70 Affordable Land and Housing Data Centre. Newsletter. Issue 1. October 2009.
71 Ibid.
Average
Num
ber
of jo
bs
0
10 000
20 000
30 000
40 000
50 000
1999/2000
2000/2001
2001/2002
2002/2003
2003/2004
2004/2005
2005/2006
2006/2007
2007/2008
2008/2009
Years
Figure 10: number of jobs created from 1999 to 2009
3512
7
2721
0
3428
6
4567
6
3210
6
3260
7
4190
9
2413
0
3639
9
3660
4
4034
0
29

Female-headed household beneficiaries compared to male beneficiaries
Female-headed households’ ownership of the public sector housing72 has increased dramatically (refer to Figure 11 below).
According to the above figures, except for Limpopo and KwaZulu-Natal, an almost equal amount of households are headed by women as by men.
2.4.4.3 Conclusion
Although departments sometimes have a narrow interpretation of what development orientation means, it was encouraging to find that seven of the ten departments could show beneficiary participation in the design of the projects. Generally project plans were of an acceptable project management standard, whilst IDPs were considered by eight of the ten departments. Gauteng, for example, initiated the development of Municipal Housing Development Plans (MHDPs) to bridge the gap between municipal and provincial planning and to improve and create a credible IDP at local level to reflect national and provincial policy directives and strategies. Six of the ten provincial departments have a system in place to record lessons learned and applying those lessons in future projects. The public sector housing programme has had different outcomes for beneficiaries in terms of security, financial value and access to employment and educational opportunities. For example, an average of 35 127 jobs were created over the past ten years stretching from 1999 to 2009. There are now almost as many female-headed households (54%) across the country as male-headed households (46%).
In the interest of a developmental State, all departments in some way should contribute to transformation and development.
72 Republic of South Africa. National Department of Human Settlements. Statistics. Chief Directorate Monitoring and Evaluation. 2009.
Province
Female
Male
1181520
Total
1000471
269891
GP
249359
204566
KZN
139776
146473
EC
116478
129041
LP
65219
123936
NW
107261
112295
WC
131818
80474
MP
70994
94566
FS
94057
20278
NC
25509
0
200000
400000
600000
800000
1000000
1200000
1400000
Num
ber
of b
enefi
ciar
ies
Figure 11: number of beneficiaries of female-headed households compared to male-headed households per province
30

2.4.5 Overview of performance against principle 4 – impartiality and fairness
This Constitutional principle states that services should be provided impartially, fairly, equitably and without bias. Government has addressed this need for fairness in service delivery in a number of ways. One such initiative was the promulgation of the Promotion of Administrative Justice Act, 2000 (PAJA), Act 3 of 2000. The PAJA promotes procedurally fair administrative actions, and gives people the right to request reasons for administrative actions.
The following three standards are applied to establish whether departments do in fact provide impartial, fair, and equitable services:
Adherence to these three standards is important since a department can expose itself in terms of Section 6 of PAJA to proceedings in a court or tribunal for judicial review, which can be instituted by any person who is convinced that his/her rights were negatively affected by a department’s administrative action(s).
2.4.5.1 Departments’ performance against all the standards for impartiality and fairness
The average performance was “poor” (31%) – refer to Figure 12 below. The reason for this poor performance was that only three of the ten departments’ performance could be assessed, namely, Northern Cape, Western Cape and Gauteng.
Principle 4: Standards
1. Duly authorised decisions.
2. Decisions are just and fair.
3. Communicating administrative decisions.
Average
% P
erfo
rman
ce
0%
20%
40%
60%
80%
100%
120%
NC WC GP NDoHS EC FS KZN LP MP NW
Departments
Figure 12: Departments’ performance against principle 4
Not
app
licab
le
Insu
ffici
ent
info
rmat
ion
Insu
ffici
ent
info
rmat
ion
No
info
rmat
ion
subm
itted
No
info
rmat
ion
subm
itted
No
info
rmat
ion
subm
itted
No
info
rmat
ion
subm
itted
31%
100% 100%
80%
31

Seven departments’ performance against this principle could not be assessed, because two, namely Eastern Cape and Free State submitted insufficient information to make a fair judgement against the standards applying to this principle, whilst KwaZulu-Natal, Limpopo, Mpumalanga and North West failed to submit the necessary information despite numerous requests do so. The national department argued that the PAJA is not applicable to them.
2.4.5.2 Each department’s compliance per standard
The individual departments’ compliance against each standard highlighted above is summarised in Table 11 below.
Table 11: each department’s compliance per standard
Province
Duly authorised decisions in terms of
Decisions are just and fair
Communication administrative decisions
legislation/ policy
Delega-tions
Prior notice to action is
given
Opportunities are given to make representations
100% of decisions are clearly
communicated
Requests for reasons for decisions
are properly answered
EC Insufficient information submitted for assessmentFS Insufficient information submitted for assessmentGP √ √ √ No info No info No info √KZN No information submitted for assessmentLP Insufficient information submitted for assessmentMP Insufficient information submitted for assessmentNC √ √ √ √ √ √ √NW Insufficient information submitted for assessmentWC √ √ √ √ √ √ √NDoHS Not applicable% Dep. complied
30% 30% 30% 20% 20% 20% 30%
% Dep. not complied
60% 60% 60% 50% 50% 60% 50%
% No information
0% 0% 0% 20% 20% 20% 10%
% Not applicable
10% 10% 10% 10% 10% 10% 10%
Legend: √ = met the standard: X = did not meet the standard.
2.4.5.2.1 Decisions taken in terms of legislation/policy and delegations
It is important for any organisation to ensure that decisions are taken in line with its policy and by officials who are authorised to do so. This will safeguard the organisation against litigation when the legitimacy of a decisions/action is questioned. This is even more so in the Public Service where almost every decision has to be taken in terms of a specific policy/guideline and by duly authorised officials. The PAJA refers to this as an “empowering provision” and defines it as “. . . a law, a rule of common law, customary law, or agreement, instrument or other document in terms of which an administrative action was purportedly taken.” It was found that the decisions of 30% of the departments were duly authorised in terms of legislation, and ensured that their decisions are taken by duly authorised officials. This implies that the majority of the departments in their submissions for the approval of decisions or in their notification letters of the decisions do not quote the relevant legislation/policy/delegation in terms of which such decisions are taken. Therefore, the legitimacy of these decisions can be questioned.
32

2.4.5.2.2 Decisions are just and fair
Any decision affecting any person or the public must adhere to the just and fair procedures prescribed in Sections 3 and 4 of PAJA.73 The assessment showed that only 30% of the departments complied with this requirement of PAJA. When it comes to communicating administrative decisions, compliance by departments varied between 10% and 30%. This means that the content of the documentation submitted for assessment indicated that not all decisions were taken in terms of the requirements in Sections 3 and 4 of PAJA.
2.4.5.2.3 Procedural fairness in the allocation of housing subsidies
The National Department developed guidelines for the allocation of housing opportunities created through the national housing subsidy scheme. The objective of the guideline is to facilitate the fair, equitable, transparent and inclusive allocation of houses to beneficiaries.74
The necessary delegations for approval of applications and funding are also provided in Section 7 of the Housing Act, 1997. This section places the authority regarding the approval of project application and the funding and individual housing subsidy applications with the Member of the Executive Council (MEC) responsible for Housing in a Provincial Government. The MECs may delegate authority to approve subsidy applications to officials in the Provincial Housing Departments. Provincial Housing Departments, in turn, delegate these functions to municipalities.75
The allocation of housing subsidies is influenced by the type of housing development – see Table 12 below.76
Table 12: allocation of housing subsidiesSubsidy Means of allocationIndividual Housing Subsidies-Credit and Non-Credit Linked and the Financed Linked Housing Subsidy Programme (FLISP).
“first come-first serve.”
Consolidation Subsidies. Allocated to existing registered owners of serviced stands.Social Housing Programme, the Community Residential Unit Programme and Institutional Housing Subsidies.
Rental housing projects are undertaken and administered by housing institutions, which are also responsible for the allocation of housing units, including the targeting of tenants.
Peoples Housing Process. PHP projects are initiated by beneficiaries. The beneficiaries are therefore known upfront and need not be identified from any housing needs registry.
Upgrading of informal settlements. Serviced stands are provided to the inhabitants of such informal settlements during the first phase of the development. All the housing needs are recorded at project initiation stage and the project is designed for the specific needs of individuals in these areas.
A qualifying beneficiary’s chance of benefiting from the public sector housing subsidy programme is dependent on the order in which his/her application is captured on the housing registry database, once their application has
73 Sections 3 and 4 of PAJA describe a just and fair procedure inter alia as giving a person adequate notice of the nature and purpose of an
proposed administrative action, giving a reasonable opportunity to make representations, giving the right of review and request reasons,
and holding a public inquiry/hearing when an administrative action affect the public.
74 Republic of South Africa. National Department of Housing. Strategy for the Allocation of Housing Opportunities in the N2 Gateway
Project in Cape Town.
75 Ibid.
76 Republic of South Africa. National Department of Human Settlements. Interview with Chief Directorate Monitoring and Evaluation
November 2009.
33

been approved. But it is also heavily dependent on whether a project (and the size of a project) is undertaken in the beneficiary’s area.77
The allocation is based on a “first come first serve” basis meaning that people longest on the waiting list (having been put on the list first) should be given priority78 - obtaining an application form and time of submission is key to becoming a homeowner – irrespective of the actual need of an applicant in relation to other beneficiaries. For example, the R3 500 cut off assumes a level of uniformity among potential beneficiaries of the housing subsidy grant. Since not all households who qualify for subsidies are likely to receive the subsidy, with some having been on the waiting list for 20 years or more, a fairer measure than the “first come first serve” approach should be considered. The special categories catering for those considered most vulnerable (aged, people with disabilities and women-headed households) is one such initiative. However, the poverty measure, in and by itself, does not consider dependency ratio (size of household), length of time on the waiting list etcetera.
This leads to high levels of dissatisfaction with the allocation process considered to be unfair. This is attested to the fact that the housing programme and fairness in the allocation of houses were in several instances the reason for service delivery protests. This is mainly due to the fact that in many areas waiting lists are not available, while others spend years on the lists without being allocated a house. The prioritisation of housing development projects located close to economic opportunities and transport facilities exacerbate the problem.
To fast track housing delivery the National Department developed an Integrated National Housing Needs Register to estimate the demand for housing, and it has de-linked the construction phase from beneficiary identification.79 This means that houses are not built for specific beneficiaries but built and then allocated to beneficiaries according to the waiting list.
2.4.5.3 Conclusion
The overall performance of the departments against this principle was poor. Seven of the departments’ performance could not be assessed and in only 33% of the cases sampled were the decisions considered to be just and fair. This neglect of the departments to adhere to the requirements of PAJA is reflected in many reports of dissatisfaction with the allocation process.
2.4.6 Overview of performance against principle 5 – public participation in policy-making
This Constitutional principle states that “people’s needs must be responded to and the public must be encouraged to participate in policy making.” It is a participative, consensus model of policy-making, which also takes into cognizance the fact that public participation is more likely to produce solutions that are sustainable.
The following three standards are applied to establish whether departments do in fact promote public participation in policy-making:
77 Republic of South Africa. National Department of Human Settlements. Interview with Chief Directorate Monitoring and Evaluation
November 2009.
78 Ibid.
79 Republic of South Africa. National Department of Housing. Annual Report 2007/08.
Principle 5: Standards
1. A policy/guideline is in place.
2. A system for participation is in place.
3. Inputs are responded to and used.
34
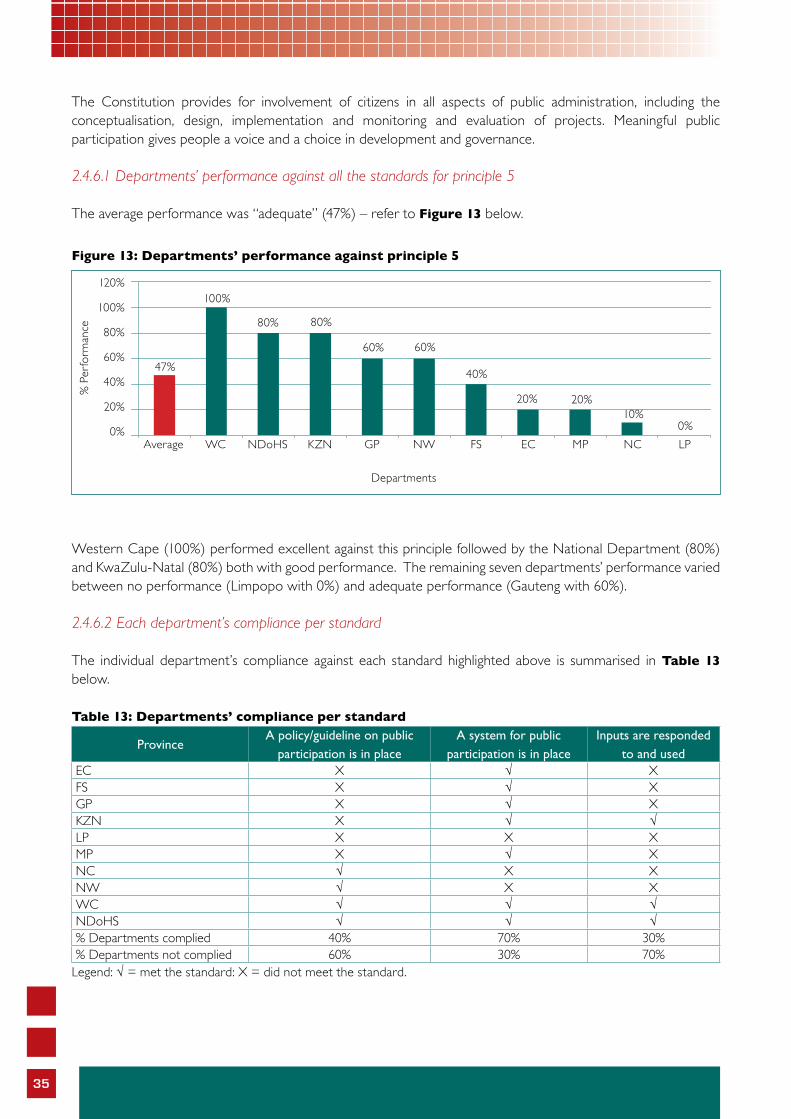
The Constitution provides for involvement of citizens in all aspects of public administration, including the conceptualisation, design, implementation and monitoring and evaluation of projects. Meaningful public participation gives people a voice and a choice in development and governance.
2.4.6.1 Departments’ performance against all the standards for principle 5
The average performance was “adequate” (47%) – refer to Figure 13 below.
Western Cape (100%) performed excellent against this principle followed by the National Department (80%) and KwaZulu-Natal (80%) both with good performance. The remaining seven departments’ performance varied between no performance (Limpopo with 0%) and adequate performance (Gauteng with 60%).
2.4.6.2 Each department’s compliance per standard
The individual department’s compliance against each standard highlighted above is summarised in Table 13 below.
Table 13: Departments’ compliance per standard
ProvinceA policy/guideline on public
participation is in placeA system for public
participation is in placeInputs are responded
to and usedEC X √ XFS X √ XGP X √ XKZN X √ √LP X X XMP X √ XNC √ X XNW √ X XWC √ √ √NDoHS √ √ √% Departments complied 40% 70% 30%% Departments not complied 60% 30% 70%
Legend: √ = met the standard: X = did not meet the standard.
Average
% P
erfo
rman
ce
0%
20%
40%
60%
80%
100%
120%
WC NDoHS KZN GP NW FS EC MP NC LP
Departments
Figure 13: Departments’ performance against principle 5
47%
100%
80% 80%
60% 60%
40%
20% 20%10%
0%
35

The analysis (Table 13 above) suggests that departments have very little public participation, since 60% of the departments do not have a policy on public participation, 30% do not have a system for soliciting public contributions, and 70% could not provide evidence that inputs from the public are formally responded to or utilised in their policy-making process.
The departments (except for KwaZulu-Natal and the Western Cape) were neither able to demonstrate the extent to which public contributions are considered in policy-making, nor were they able to show actual examples of records emanating from the various platforms. Furthermore, the recent decision by the National Department to de-link the identification of beneficiaries from the construction process is likely to decrease public participation in the implementation of housing projects.80
box 2: public participation at local government level81
A 2007 study undertaken into public participation at local government level by the Foundation for Contemporary Research on behalf of the Department of Housing and Local Government found the following:
• 80% of respondents had no knowledge of the IDP.• More than 80% of citizens felt that their needs were not reflected in their municipal IDPs.• 78% had no knowledge of their municipal budget.• 74% of respondents stated that their local councillor has never met with them on any issue related to the
IDP or municipal budget. (FCR, Report on Survey Conducted by the Provincial Government of the Western Cape on Public Participation in Municipalities’ IDPs and Municipal Budgeting Processes—June 2007).
The subsidy type could be used to infer the level of public participation enjoyed by participants in the housing programme. Project-linked subsidies make up 76% of all projects since the inception of the housing subsidy scheme.82 This type of development offers the least opportunity for public participation in the housing construction phase since the selection of beneficiaries are de-linked from the construction phase (beneficiaries do not participate in the design or layout of their homes as in the case of the Peoples Housing Process (PHP) where beneficiaries are consulted on every aspect of the project) – refer to Table 14 below.83
Table 14: subsidy type and % participation by the public84
Subsidy Type EC FS GP KZN LP MP NC NW WC AverageConsolidation 3% 4% 9% 7% 1% 4% 1% 2% 8% 4%Financial Linked Individual 0% 0% 0% 0% 0% 0% 0% 0% 0% 0%Individual 12% 7% 11% 2% 3% 11% 13% 4% 6% 8%Institutional 1% 0% 2% 6% 0% 0% 0% 0% 5% 2%Project Linked 75% 88% 77% 64% 89% 83% 84% 81% 43% 76%Rural 9% 1% 0% 21% 7% 1% 2% 13% 38% 10%Discount Benefit Scheme 0% 0% 1% 0% 0% 0% 0% 0% 0% 0%Hostel Redevelopment 0% 0% 0% 0% 0% 0% 0% 0% 0% 0%PHP 0% 0% 0% 0% 0% 1% 0% 0% 0% 0%
Total 100% 100% 100% 100% 100% 100% 100% 100% 100% 100%
80 Republic of South Africa. National Department of Housing. Annual Report 2007/08.
81 Foundation for Contemporary Research. Survey Conducted by the Provincial Government of the Western Cape on Public Participation in
Municipalities’ IDPs and Municipal Budgeting Processes. June 2007.
82 Republic of South Africa. National Department of Housing. Annual Report 2007/08.
83 Republic of South Africa. National Department of Human Settlements. Interview with Chief Directorate Monitoring and Evaluation
November 2009.
84 Ibid.
36
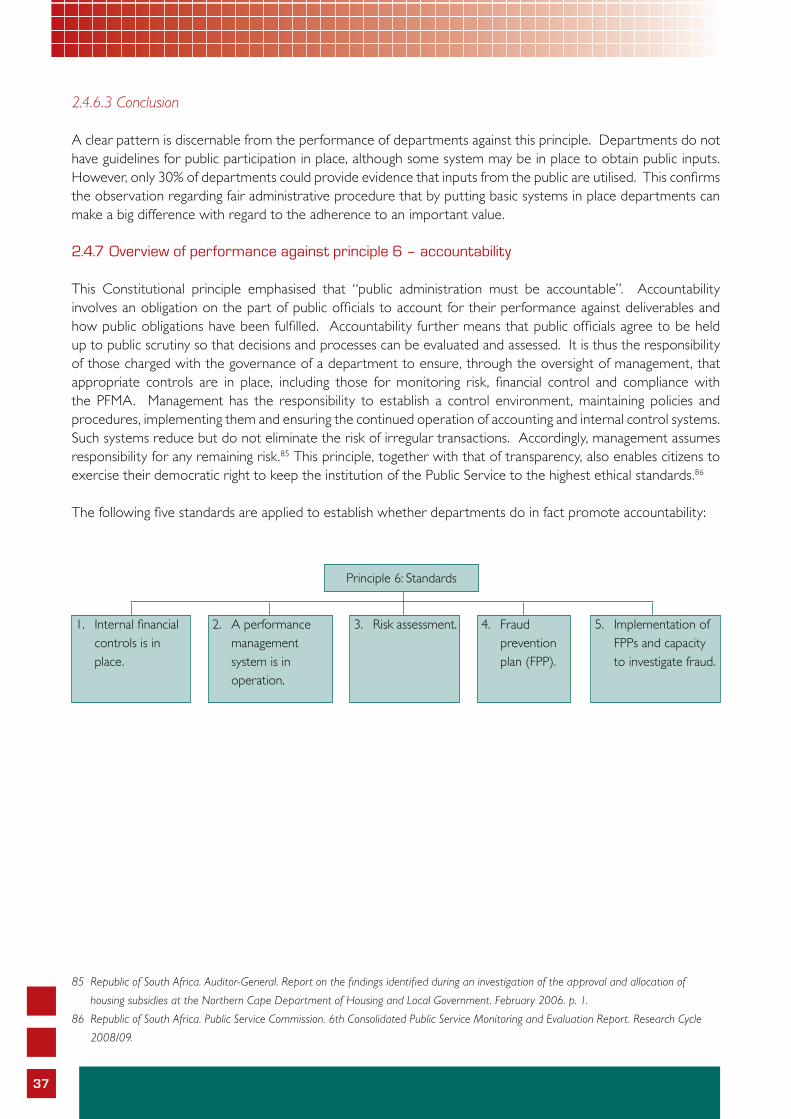
2.4.6.3 Conclusion
A clear pattern is discernable from the performance of departments against this principle. Departments do not have guidelines for public participation in place, although some system may be in place to obtain public inputs. However, only 30% of departments could provide evidence that inputs from the public are utilised. This confirms the observation regarding fair administrative procedure that by putting basic systems in place departments can make a big difference with regard to the adherence to an important value.
2.4.7 Overview of performance against principle 6 – accountability
This Constitutional principle emphasised that “public administration must be accountable”. Accountability involves an obligation on the part of public officials to account for their performance against deliverables and how public obligations have been fulfilled. Accountability further means that public officials agree to be held up to public scrutiny so that decisions and processes can be evaluated and assessed. It is thus the responsibility of those charged with the governance of a department to ensure, through the oversight of management, that appropriate controls are in place, including those for monitoring risk, financial control and compliance with the PFMA. Management has the responsibility to establish a control environment, maintaining policies and procedures, implementing them and ensuring the continued operation of accounting and internal control systems. Such systems reduce but do not eliminate the risk of irregular transactions. Accordingly, management assumes responsibility for any remaining risk.85 This principle, together with that of transparency, also enables citizens to exercise their democratic right to keep the institution of the Public Service to the highest ethical standards.86
The following five standards are applied to establish whether departments do in fact promote accountability:
85 Republic of South Africa. Auditor-General. Report on the findings identified during an investigation of the approval and allocation of
housing subsidies at the Northern Cape Department of Housing and Local Government. February 2006. p. 1.
86 Republic of South Africa. Public Service Commission. 6th Consolidated Public Service Monitoring and Evaluation Report. Research Cycle
2008/09.
1. Internal financial controls is in place.
2. A performance management system is in operation.
3. Risk assessment. 4. Fraud prevention plan (FPP).
5. Implementation of FPPs and capacity to investigate fraud.
Principle 6: Standards
37

2.4.7.1 Departments’ performance against all the standards for principle 6
The average performance was “good” (75%) – refer to Figure 14 below.
Five Departments, namely KwaZulu-Natal (100%), Gauteng (95%), Western Cape (95%), the National Department (90%), and Northern Cape (90%) performed excellently against this principle, followed by Limpopo (75%) and the Eastern Cape (65%) with good performance. The remaining three departments’ performance varied between adequate performance (Free State and Mpumalanga, both with 50%) and poor performance (North West with 35%).
2.4.7.2 Each department’s compliance per standard
The individual departments’ compliance against each standard highlighted above is discussed in more detail below.
2.4.7.2.1 Internal Control Measures
Section 38 (1) (a) (i) of the PFMA inter alia requires that accounting officers must maintain internal controls, which is linked to Section 39 (1) (b) and (2) (a), which require the prevention of unauthorised and over-expenditure by putting effective and appropriate steps in place. Adherence to these requirements means that departments must ensure that internal financial control measures are implemented with regard to all financial transactions.87
The annual financial statements are the most important record of the financial status of a department. Six of the ten departments, namely the National Department, Free State, Gauteng, KwaZulu-Natal, Northern Cape, and Western Cape received unqualified audits. Three departments either received a qualified audit opinion (Limpopo and Mpumalanga) or a disclaimer (North West) from the A-G in 2007/08 financial year. This shows basic failure in governance and administration.88 The findings are despite several internal financial control measures (audit committees, early warning systems, monthly monitoring and reporting to the National Department and National Treasury), and raise a concern about the effectiveness of these costly and time consuming measures that have been put in place to manage expenditure. The seriousness of inadequate internal financial control measures of five individual departments is reflected in Table 15 on the next page:
87 Republic of South Africa. National Treasury. The Public Finance Management Act, 1999 (Act 1 of 1999) as amended. Government Printer.
1999.
88 Centre for Development and Enterprise. South Africa’s Public Service. Learning from Success. November 2009. Number 13, Page 3.
Average
% P
erfo
rman
ce
0%
20%
40%
60%
80%
100%
120%
KZN GP WC NDoHS NC LP EC FS MP NW
Departments
Figure 14: Departments’ performance against principle 6
75%
100% 95% 95%90% 90%
75%65%
50% 50%
35%
38

Table 15: Findings on individual departments’ internal financial control measuresDepartment Findings on inter financial control measures
NDoHS Questions on internal control measures in respect of housing could not be answered due to the unavailability of relevant information and managers. This problem was also experienced by the A-G in his preparation of the 2007/08 Audit Report.
FS The Free State utilises the Housing Subsidy Scheme’s internal financial control measures with regard to all housing projects. However, the extent to which the department is successfully utilising these financial controls is questionable considering that the department, since the first evaluation in 2005/06, still does not manage to spend the money allocated for housing efficiently and effectively. This is been confirmed by the under-spending of R112.9 million in 2005/06 and again an under-spending of R110.1 million in 07/08 on housing. The under-spending in 2008/09 on housing was R4 349 million.
KZN There are not any specific internal control measures in respect of housing projects. As a result, the A-G indicated that there is a forensic investigation on the alleged misallocation of housing to beneficiaries, the sale of some of the houses and the construction of poor housing in the Hlomendlini Project in the Mandeni Municipality area.
LP Did not respond to the PSC’s questions on internal control measures in respect of housing projects.NW The A-G stated that the department has an inefficient internal control system. As a result the A-G
was unable to obtain sufficient, appropriate audit evidence for expenditure of R 785 516 336 regarding housing projects included in transfers and subsidies disclosed in the Statement of Financial Performance. The A-G further found that out of the total committed housing projects of R 8 136 645 900 approved by the end of the 2007/08 financial year, there were still committed funds of R 3 808 386 627 not yet spent. From the list of housing projects kept by the department, it was noted that 51% of the project funds approved prior to 2004 have not yet been spent during the 2007/08 financial year. The A-G stated that this is an indication of the lack of service delivery regarding housing projects in the province. The amount of R4 328 259 273 paid over to municipalities regarding these projects, has also not been properly accounted for in terms of section 10 (4) (f ) of the Housing Act, which requires that municipalities submit annual financial statements to the department. The department also did not ensure that municipalities submit progress reports for all progress payments received on a monthly basis as required by sections 12 (1) (a) and 12 (1) (b) of the Division of Revenue Act.
Some good practices amongst these departments are highlighted in box 3 below.
box 3: good internal financial control practices in respect of housing projectsGauteng
• In order to ensure that quality houses are delivered, inspections of the houses built is conducted by the National Home Builders Registration Council (NHBRC), municipalities, and engineers. If the houses built comply with industry standards, a certificate is issued.
• Payment of services rendered in respect of the houses built is authorised only after the Department’s Quality Assurance Unit has certified that the work done was satisfactory.
• A Customer Care Centre ensures that beneficiaries’ complaints are resolved timeously.• Committees were established to engage the department on the allocation of houses and deal with any
challenges encountered. • Capital projects are evaluated by the Housing Advisory Committee and approved by the Member of the
Executive Council, whilst project claims are first checked by professional resource teams and regional managers before submission to the Head Office for payment.
• Capital projects, budget and a commitment register of all claims processed are maintained in the Housing Subsidy System (HSS).
• Approval of payments is done in accordance with the Financial Delegations approved by the Head of Department.
39

Gauteng (continued)
• Expenditure on housing projects are maintained and reported separately in the Basic Accounting System (BAS).
• Weekly expenditure reports and non-financial information are submitted to the Department’s Executive Management, whilst monthly reports are submitted to the National Department, and quarterly reports to National Treasury, the Departmental Audit Committee and the Provincial Legislature.
Northern Cape
Project and house plans are evaluated to ensure that the required standards are met. Inspections take place at regular intervals during project execution. After completion, all houses are inspected and repaired where necessary before the contractor is allowed to leave the site and ‘happy letters’ are signed. Special attention is paid to houses with cracks and roofing problems. All new projects are furthermore registered with the NHBRC warranty scheme. Once handed over, maintenance becomes the responsibility of the beneficiaries. A process of consumer education has started throughout the Province to educate beneficiaries on these responsibilities. The contractor and structural engineer, who designed and checked all foundations, will, however, be held responsible for structural and roofing problems on houses for the period prescribed in the National Housing Code (NHC). Houses enrolled with the NHBRC are covered by their warranty scheme.
However, random inspections of houses carried out by the A-G completed during the year under review revealed that a significant number of houses did not meet the norms and standards set in the NHC. Title deed searches were in the case of several individual subsidy applications also not performed as required by the NHC. Steps to rectify and address the aforementioned challenges were found to be wanting as no evidence was provided of actions against service providers to remedy the identified shortcomings.
There is also a dedicated section in the Finance Directorate responsible for housing projects as well as provision in BAS to ensure adequate internal financial control of housing projects. The mentioned operational provisions were recently revisited and control measures tightened following the mentioned audit results.
North West
A quality control system exists, which is being managed by a programme management unit comprising of the requisite technical skills to monitor housing projects. Inspections are also conducted by municipal, departmental and NHBRC inspectors. Completion certificates must be certified by professional engineers. Beneficiaries are required to sign happy letters before occupation of houses.
Western Cape
A Works Inspectorate makes regular site visits and inspects the houses to ensure that the work complies with norms and standards. In addition, the projects are enrolled with the NHBRC, and their inspectors do regular site inspections and take the necessary action, if required, against the Home Builder.
40

2.4.7.2.2 Monitoring and Evaluation Systems
Having such a system will not only enable departments to improve the accuracy and reliability of performance information for reporting purposes, but also to timeously institute corrective measures. Seven of the ten departments do have a performance management system in place, whilst the Eastern Cape, KwaZulu-Natal and North West did not comply.
The majority of departments utilise the National Department’s guideline “Housing Subsidy System (HSS)” as monitoring tool since it provides specific guidance on the monitoring and evaluation of housing projects. However, some departments such as KwaZulu-Natal and Northern Cape experienced some problems with the application of the HSS. For example, KwaZulu Natal experienced challenges with the utilisation of the HSS as a housing project management tool. The National Department is currently assisting in addressing the challenges in terms of capacitating the officials of the provincial department on the functionality of the system. The Northern Cape is of the opinion that the HSS is highly bureaucratic (comprising extensive procedures, processes and measures not necessarily contributing to the efficiency and effectiveness of the system), and requires specific knowledge to utilise the system. The Department is currently working with the National Department to simplify the system and to make it more user-friendly.
Some good practices in terms of performance management systems amongst these departments are highlighted in box 4 below.
box 4: Monitoring and evaluation systemsNDoHS
The following interventions to enhance data collection, management information, M&E and performance management have been introduced:
• Monitoring of housing subsidy and expenditure data through a strategy that aims to improve data input and interpretation.
• A comprehensive housing sector monitoring, information and reporting system, based on key performance indicators, has been developed.
• A monitoring, evaluation and impact assessment policy has been developed. The policy sets the basis for the development and implementation of the system within the department. The purpose of the policy is to outline the broad activities to be carried out in relation to the development and implementation of an M&E system and to outline the administrative arrangements to support the implementation of such a system.
Gauteng
A monitoring and evaluation unit, consisting of three sub-directorates, has been established with the following functions:
• The Sub-directorate: Departmental Performance Monitoring, monitors departmental performance by comparing what the units have planned for delivery to actual delivery, identifying constraints and coming up with recommendations. The sub-directorate is also responsible for the compilation of the AR.
• The Sub-directorate: Project Level Monitoring, monitors projects implemented by the Department. The sub-unit gathers information by liaising with project managers in the regions and in municipalities; and conducts site visits.
• The Sub-directorate: Evaluation and Impact Assessment is responsible for evaluating programme performance and conducting impact assessments. The sub-unit is also responsible for the development of the M&E system of the Department.
41

Northern Cape
Two different systems are utilised for monitoring and evaluation. The one system, Impact Assessment Framework, monitors the impact of projects, and the other system, Framework for Monthly Reporting’ (FMR) monitors the progress with all departmental programmes. The aim of the FMR is to measure the performance of the Department in realising its strategic objectives. It includes an early warning system for the identification of potential challenges as well as possible strategies to address weaknesses.
2.4.7.2.3 A risk assessment has been done
Section 38 (1) (a) (i) of the PFMA requires an “effective, efficient and transparent system of . . . risk management.” A thorough risk assessment will ensure that departments can devise proper internal control measures and that their fraud prevention plans are focused on the correct risk areas.
The North West, which also received a disclaimer from the A-G for the 2007/08 financial year, did not identify or specifically address any risk factors related to housing projects in their risk assessment framework and/or fraud prevention plans.
The National Department, Gauteng, KwaZulu-Natal and Northern Cape identified the following common risks in respect of housing projects, whilst counter measures and preventative actions for all of the potential risks were identified and officials were tasked with responsibilities for each of the risks – refer to Table 16 below:
Table 16: Common risks in respect of housing projects and preventative actionsRisks in respect of housing projects Counter measures and preventative actions
1 Fraud, corruption, mismanagement & misappropriation (housing grant), which results in the granting of subsidies to non-qualifying beneficiaries, & transfer payments made to municipalities not being utilised for their intended purpose.
Implementation of internal controls as per fraud prevention strategy. Tracking monthly expenditure and delivery targets against business plans.
2 Ineffective/poor IT infrastructure and processes causing unnecessary delays, resulting in non-achievement of objectives.
Implementation of the Information Technology and Communication Strategy.
3 Cost increase and availability of building material. Intervene in the industry to regulate supply & pricing. Service Level Agreements with material suppliers to control escalation of costs. Install an alternative building technology programme to manage escalating costs.
4 Lack of and access to suitable & well located land for housing development/Failure by municipalities to make appropriate land available for housing development before disposing it to the private sector/Limited land for housing development – densification. Excessive demand placed on projects by environmental impact assessments affecting affordability and quantity of delivery.
Sustained consultation through task team. Engage with municipalities to release more land to meet 2014 targets. Approach Provincial Treasury to assist with funding in order to acquire well located land. Identify pockets of land & examine ways of shortening the planning cycle from 18 months to 9 months.
2.4.7.2.4 The existence of a fraud prevention plan
A Fraud Prevention Plan (FPP), based on a department’s risk assessment, provides the strategies for a department to curb and deal with fraud, should it occur. Though 80% of departments surveyed reported the existence of a FPP, only 48% of the strategies of the plans were implemented. The Eastern Cape, Limpopo, Mpumalanga
42

implemented their FPP in full, while the Northern Cape and Western Cape implemented between 80%-99% of their FPP strategies. Of concern though is that the FPPs of the Free State, KwaZulu-Natal, Mpumalanga, Northern Cape, and North West did not mention or devise specific strategies for housing projects.
a) The adequacy of departments’ fraud prevention plan
The adequacy of departments’ fraud prevention plans were assessed against a set of 13 standards for a good FPP – refer to Table 17 below.
Table 17: Departments’ compliance with the requirements for a good FppStandards EC FS GP KZN LP MP NC NW WC NDoHS Total
1. A comprehensive implementation plan and responsibility structure must be implemented.
√ √ √ √ √ √ √ √ √ √ 100%
2. Fraud prevention strategies must be based on a thorough risk assessment.
√ X √ √ √ X √ √ √ √ 90%
3. Fraud database should be in place. √ X √ X √ √ X X √ X 50%4. All employees have a responsibility
towards to contribute towards eliminating fraud.
√ √ √ √ √ √ √ √ √ √ 100%
5. Service users, suppliers & the broader community should be made aware of the department’s stance on fraud, corruption.
X √ √ √ √ √ X √ √ √ 80%
6. It should be clear to everybody to whom and how fraud should be reported.
√ √ √ √ √ √ √ √ √ √ 100%
7. A clear policy on protected disclosure must be in place.
√ X √ √ √ X √ √ √ √ 80%
8. Accounting officers should be clear that there is no discretion in the reporting of fraud to either the police or other independent anti-corruption agencies.
X √ √ √ √ √ X √ √ √ 80%
9. Provision must be made for the investigation of fraud once reported.
√ √ √ √ √ √ √ √ √ √ 100%
10. All instances of suspected fraud cases must be promptly examined to establish whether a basis exists for further investigation.
X √ √ √ √ √ X √ √ √ 80%
11. Fraud cases must be investigated without interference from management.
X √ X √ √ √ √ √ √ √ 80%
12. Investigation must be undertaken by skilled officers.
√ √ √ √ √ √ √ √ √ X 90%
13. The expected standards of conduct must be clear. The Code of Conduct for the Public Service must be applied.
√ √ √ √ √ √ √ √ √ √ 100%
% Compliance 69% 77% 92% 92% 100% 85% 69% 92% 100% 85% 86%Legend: √ = met the standard: X = did not meet the standard.
43

The housing sector’s FPPs complied with 86% of the requirements for a good FPP. The Western Cape and Limpopo both obtained full marks for their FPP. The FPP of both the Eastern Cape and Northern Cape complied 69% with the requirements, which is the lowest compliance rate among the ten departments. A mere 50% of departments mention a fraud database in their plans, while 20% of the FPPs do not provide for awareness campaigns aimed at the public and service providers on the departments’ stance on fraud prevention, the reporting of fraud to either the police or other independent anti-corruption agencies, the prompt investigation of alleged fraud to establish whether a basis exists for further investigation, and the investigation off all alleged fraud without interference from management. The omission of these requirements mainly occurred in the Eastern Cape and Northern Cape.
b) Implementation of fraud prevention strategies
Eight of the ten departments have indicated that they have sufficient and competent officials on the establishment to investigate fraud cases should they occur.
However, the data shows little correlation between the implementation of the FPP and opinions expressed by the A-G. Departments which have a high compliance rate against the level of implementation obtained qualified opinions or disclaimers from the A-G, as can be seen from Table 18 below.
Table 18: relationship between the audited opinion, risk assessment and implementation of Fraud prevention strategies
Department Audit opinion
Fraud Prevention
Exists of a plan
Strategies are based on a thorough risk
assessment.
Sufficient capacity to investigate fraud cases
At least 50% of the strategies were implemented.
EC Unqualified Yes Yes Yes YesFS Unqualified No Yes No NoGP Unqualified Yes Yes Yes Yes
KZN Unqualified Yes No Yes YesLP Qualified Yes Yes No YesMP Qualified No No Yes YesNC Unqualified Yes Yes Yes YesNW Disclaimer Yes Yes Yes NoWC Unqualified Yes Yes Yes Yes
NDoHS Unqualified Yes Yes Yes YesOwn calculation
2.4.7.3 Conclusion
The Departments’ compliance against this principle is good (75%). The areas where compliance are still lacking are internal financial controls, which resulted in qualified audit opinions and disclaimers from the A-G, and sufficient staff to implement their FPPs. Although the departments generally complied with the requirements set for a good FPP, it is of concern that the FPPs of the Free State, KwaZulu-Natal, Mpumalanga, Northern Cape, and North West did not mention or devise specific strategies for housing projects, which one would expect given the risks that housing projects are exposed to.
2.4.8 Overview of performance against principle 7 – transparency
Departments’ annual reports (ARs) are one of the key documents that enhance transparency, and holding government accountable for its use of state resources. A key requirement for annual reporting is that departments should report on their actual achievements against predetermined objectives as stated in their SPs and in the
44

ENE.89 Another aspect tested under this principle is accessibility to information held by departments as required by the Promotion of Access to Information Act (PAIA).90
The following standards are applied to establish whether departments do in fact promote transparency:
2.4.8.1 Performance against all the standards for principle 7
The average performance was “good” (68%) – refer to Figure 15 below.
The worst performer against this standard was North West with a rating of 10% (no compliance), followed by adequate performance for KwaZulu-Natal (50%), Mpumalanga (50%), Eastern Cape (60%), and Gauteng (60%). At the other end of the transparency spectrum were the National Department (100%), the Western Cape (100%) and Limpopo (90%), which suggests excellent performance. The performance of Free State (80%) and Northern Cape (80%) was good.
89 Republic of South Africa. National Treasury. Public Finance Management Act, 1999(Act 1 of 1999 as amended). Formeset Printers. Cape
Town.
90 Republic of South Africa. Department of Justice and Constitutional Development. Promotion of Access to Information Act, 2000. (Act 2 of
2000).
Principle 7: Standards
1. Departmental AR 2. Access to Information
1.1 Presentation of annual report.
1.2 Content of annual report.
1.3 Reporting on performance.
2.1 Appointment of deputy information officers.
2.1 Availability of a manual on access to information.
2.3 Availability of a system for managing requests for access to information.
Average
% P
erfo
rman
ce
0%
20%
40%
60%
80%
100%
120%
NDoHS WC LP FS NC EC GP KZN MP NW
Departments
Figure 15: Departments’ performance against principle 7
68%
100% 100%90%
80% 80%
60% 60%50% 50%
10%
45

2.4.8.2 Each department’s compliance per standard
The individual department’s compliance against each standard highlighted above is summarised in Table 19 below.
Table 19: Departments’ compliance per standard
Department
Annual Report Access to information
Presentation
Content covers at
least 90% of requirements
Programme performance
Appointment of DIO
Manual on access to
information
System to manage requests
EC √ √ √ X X XFS √ X √ √ X √GP √ √ X √ √ √KZN √ X √ X X XLP √ X √ √ √ √MP √ X √ X X XNC √ X √ √ X √NW √ X X X X XWC √ √ √ √ √ √NDoHS √ √ √ √ √ √% Departments complied
100% 40% 80% 60% 40% 60%
% Dep not complied
0% 60% 20% 40% 60% 40%
Legend: √ = met the standard: X = did not meet the standard.
2.4.8.2.1 Departments’ Annual Report
a) Presentation
Every department presented an attractive AR in accessible English.
b) Content
The standard set by the PSC’s System is that the content of the AR should cover in sufficient detail at least 90% of the areas prescribed by NT and the DPSA. The best performers against this standard were Eastern Cape, Gauteng, Western Cape and the National Department. The remaining six departments did not adequately report on these set of core measures as per requirement. Table 20 on the next page provides the departments’ percentage content compliance with an indication of the areas not adequately addressed.
46
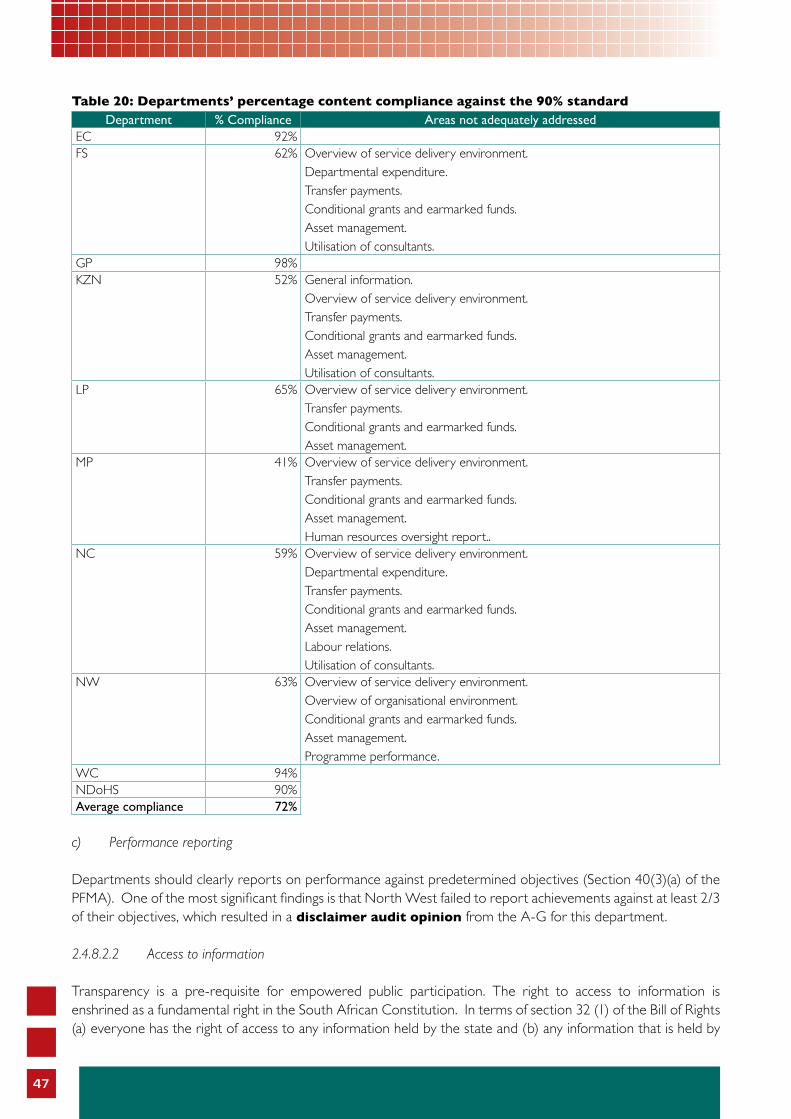
Table 20: Departments’ percentage content compliance against the 90% standardDepartment % Compliance Areas not adequately addressed
EC 92%FS 62% Overview of service delivery environment.
Departmental expenditure.Transfer payments.Conditional grants and earmarked funds.Asset management.Utilisation of consultants.
GP 98%KZN 52% General information.
Overview of service delivery environment.Transfer payments.Conditional grants and earmarked funds.Asset management.Utilisation of consultants.
LP 65% Overview of service delivery environment.Transfer payments.Conditional grants and earmarked funds.Asset management.
MP 41% Overview of service delivery environment.Transfer payments.Conditional grants and earmarked funds.Asset management.Human resources oversight report..
NC 59% Overview of service delivery environment.Departmental expenditure.Transfer payments.Conditional grants and earmarked funds.Asset management.Labour relations.Utilisation of consultants.
NW 63% Overview of service delivery environment.Overview of organisational environment.Conditional grants and earmarked funds.Asset management.Programme performance.
WC 94%NDoHS 90%Average compliance 72%
c) Performance reporting
Departments should clearly reports on performance against predetermined objectives (Section 40(3)(a) of the PFMA). One of the most significant findings is that North West failed to report achievements against at least 2/3 of their objectives, which resulted in a disclaimer audit opinion from the A-G for this department.
2.4.8.2.2 Access to information
Transparency is a pre-requisite for empowered public participation. The right to access to information is enshrined as a fundamental right in the South African Constitution. In terms of section 32 (1) of the Bill of Rights (a) everyone has the right of access to any information held by the state and (b) any information that is held by
47

another person and that is required for the exercise or protection of rights. Departments’ responsibilities for implementing the requirements of PAIA are to appoint deputy information officers (DIOs), prepare a manual on access to information (MAI) and to put in place procedures to deal with requests for access to information.
PAIA has not been implemented across the board. The Eastern Cape, KwaZulu-Natal, Mpumalanga and the North West met none of the prescripts of PAIA in 2009.
a) Appoint deputy information officer (DIO) with duly authorised authority
At the time of the survey, 40% of departments reported not to have duly appointed a Deputy Information Officer.
b) Manual on access to information
Only four departments have a MAI in place, whilst none of the departments submitted annual reports to the South African Human Rights Commission (SAHC) for the 2007/08 financial year. Section 32 of the PAIA requires departments to submit annual compliance reports to SAHC. These reports should reflect the extent to which departments have complied with the requirements of the Act. The reports should contain the number of people who requested information; and number of requests granted and declined.
c) Procedures for managing requests for access to information
Four departments did not have the necessary procedures in place to manage request for access to information from citizens.
2.4.8.2.3 Measuring Housing Delivery
The current format in which data on housing delivery is presented by the departments is not very transparent. To enable proper measurement of housing delivery, the following should be specified:91
• The number of houses completed should be reported separately from those under construction.• The proportion and number of those properties that have been transferred to their occupiers.• The value of those housing.• Norms around average construction time.
This emphasises that the mere fact that information is given, is not enough, but that the info should be as meaningful as possible.
2.4.8.3 Conclusion
Although the average performance against this principle is good (68%), departments still tend not to report on all the prescribed areas for annual reporting issued by the National Treasury and the Department of Public Service and Administration. As for access to information in terms of PAIA, four departments did not meet any of the requirements, whilst the remaining six departments only complied partially.
91 Republic of South Africa. Financial and Fiscal Commission. Government Response to the Commission’s 2008 Recommendations for the
2009/10 Division of Revenue. 2009.
48

2.4.9 Overview of performance against principle 8 – good human resource management and career development practices
This Constitutional principle states that “good human resource management and career development practices, to maximise human potential, must be cultivated”. Adherence to this principle is critical in that a competent Public Service corps is essential to ensure that the policies of government are implemented. Departments, therefore, must continuously assess employment policies, management practices and the working environment in order to comply with this principle.
The following standards are applied to establish whether departments do in fact promote good human resource management and career development practices:
2.4.9.1 Performance of departments against all the standards for principle 8
The average performance was “poor” (39%) – refer to Figure 16 below.
The best performer against this principle was Western Cape with 70% (good performance), followed by the National Department with 60% (adequate performance). The remaining eight departments’ performance was poor.
Principle 8: Standards
1. Recruitment 2. Skills development
1.1 Availability of HR policy.
1.2 Recruitment time.
1.3 Management reporting.
2.1 A plan is in place.
2.2 Plans are implemented.
Average
% P
erfo
rman
ce
0%
10%
20%
30%
50%
40%
60%
70%
80%
WC NDoHS EC GP LP MP NW FS KZN NC
Departments
Figure 16: Departments’ performance against principle 8
39%
70%
60%
40% 40% 40% 40%35%
20% 20% 20%
49

2.4.9.2 Each department’s compliance per standard
The individual departments’ compliance against each standard highlighted above is summarised in Table 21 below.
Table 21: Departments’ compliance per standard
Departments
Recruitment A skills development plan
HR policy
in place
Regular management reporting on
vacancies
Evidence on
manage-ment’s
response
Plan exists
Is based on a skills need
analysis
2/3 of plan
imple-mented
Impact on
service delivery assessed
EC √ √ X √ √ √ XFS √ X X X X X XGP √ √ X √ X √ XKZN √ X X X X X XLP √ √ √ √ X X XMP √ √ √ X X X XNC X X X √ X √ XNW * X X √ X √ XWC √ √ √ √ √ X √NDoHS * √ √ √ √ √ X% Departments complied
70% 60% 40% 70% 30% 50% 10%
% Departments not fully complied
20% 0% 0% 0% 0% 0% 0%
% Departments not complied
10% 40% 60% 30% 70% 50% 90%
Legend: √ = met the standard: X = did not meet the standard.
2.4.9.2.1 Recruitment
Having a recruitment policy will ensure a common understanding of recruitment practices and a fair and progressive application of recruitment practices. Filling vacancies within a stipulated period is essential to ensure that services are uninterrupted, whilst management reports keep management abreast of progress with the filling of vacancies, and enable them to timeously institute corrective measures.
a) The existence of a policy on recruitment
All ten departments had a recruitment and selection policy in place, which varied in quality in terms of the elements addressed – refer to Table 22 below. The quality of the North West’s policy was the worst, lacking fundamental requirements of a good policy.
Table 22: Departments’ compliance with the requirements of a good human resource policyHuman Resource Policy Elements EC FS GP KZN LP MP NC NW WC NDoHSClearly described procedure Yes Yes Yes Yes Yes Yes Yes No Yes YesResponsibility delegation Yes Yes Yes Yes Yes Yes Yes No Yes NoMatching of skills with post requirements Yes Yes Yes Yes Yes Yes No Yes Yes YesOpen processes Yes Yes Yes Yes Yes Yes No Yes Yes YesTransparent decision making Yes Yes Yes Yes Yes Yes Yes No Yes YesRecruitment strategies Yes Yes Yes Yes Yes Yes Yes Yes Yes Yes
Legend: √ = met the standard: X = did not meet the standard.
50

b) Time taken to fill a vacancy
An important standard for the PSC is the time it takes to fill a vacant post. The PSC believes that if departments are inefficient against this standard, they are probably also inefficient in many other areas.
The average time taken by departments to fill a vacancy, from the date the post became vacant to the date of appointment, appears in Figure 17 below.
The standard against which the PSC assesses recruitment times is 90 calendar days.
It is of concern that the average time taken to fill a vacancy for these ten departments was 339 calendar days, which is far beyond the PSC’s standard. The worst performance against this standard was KwaZulu-Natal with 750 days followed by Northern Cape with 628 days and Limpopo with 562 days. The main reason given for this poor performance was that provinces had put a moratorium on the filling of vacancies.
c) Regular management reporting on recruitment
It was found that six of the ten departments regularly reports to management on progress with recruitment (Table 21 on the previous page), but only four of the departments provided feedback from management in terms of guidance or actions that should be taken to speed-up the process.
2.4.9.2.2 Skills development
Having a skills development plan will assist departments in establishing current skills levels, the essential skill required to execute the activities of the department, and training needs to close the skills gap. Addressing the identified training needs and assessing the impact of the training on service delivery show that HR development is tackled in a systematic manner.
It was found that seven of the ten departments had a work place skills plan (WPSP). Four of these seven plans were, however, not based on a thorough skills need analysis. The National Department, the Eastern Cape and the Western Cape performed needs analysis prior to designing and implementing their WPSP. The Western Cape was the only department to assess the impact of skills development interventions on service delivery.
PSC
Standard
Num
ber
of d
ays
0
200
400
600
800
Average KZN NC LP GP NDoHS FS MP EC WC NW
Departments
Figure 17: average number of calender days per department to fill a vacancy
90
339
750
628562
293 274225 207 197
141 110
51

The main reasons for departments’ poor performance against this standard are that their skills development plans are not based on a skills needs analysis, the planned skills development activities were not implemented, and their impact on service delivery were not assessed.
2.4.9.3 Conclusion
The poor performance against this principle was mainly due to departments not following the most basic requirements for good human resource management, namely ensuring that:
• The recruitment and selection policy complies with good practice.• Vacancies are filled within a reasonable timeframe.• Management pro-actively put measures in place to ensure that the filling of vacancies do not take too
long.• Skills development plans or workplace skills plans are based on a thorough skills needs analysis.• Planned training needs are implemented as planned and the impact of these interventions on service
delivery is assessed.
Effective and efficient service delivery is inextricably linked to enough employees to execute the department’s functions and the skills and competencies of the department’s workforce. Departments, therefore, need to know what their specific skills needs are compared to the current skills profile of their staff, and put strategies in place to acquire the needed skills.
2.4.10 Overview of performance against principle 9 – representivity
This Constitutional principle focuses on representivity, which requires that the workforce should be broadly representative of the South African people. An objective is to ensure that a dynamic work environment is created in which the diverse workforce can reach their potential instead of just meeting numerical targets. Attending to both the representivity targets and diversity management in a department will ensure that this value is applied in a manner that benefits South African society.
The following standards are applied to establish whether departments do in fact promote representivity:
Principle 9: Standards
1. Employment Equity (EE) 2. Diversity Management
1.1 EE policy & plan are in place.
1.2 Progress on EE plan is reported.
1.3 All representivity targets are met.
2.1 Comprehensive measures are implemented.
2.2 Some measures are implemented.
52

2.4.10.1 Departments’ performance against all the standards for principle 9
The average performance was “poor” (37%) – refer to Figure 18 below.
The only good performer was the Western Cape with 70%. The remaining nine departments’ performance varied between adequate (Mpumalanga – 60% and Limpopo – 50%) and no performance (Free State – 20%, Gauteng – 10% and Northern Cape – 10%).
2.4.10.2 Each department’s compliance per standard
The individual departments’ compliance against each standard highlighted above is summarised in Table 23 below.
Table 23: Departments’ compliance per standard
Province
Employment Equity (EE)Management reporting on
EEImplementation
diversity management
measures
An approved EE policy is in
place
An approved EE plan is in
place
Meeting EE Targets
Regular reporting on
EE
Response to EE reports
E C √ √ * √ X √FS X X * X X *GP X X X √ X XKZN √ X * X X *LP √ √ * √ X XMP √ X * √ √ √NC X X * X X XNW X √ * √ X *WC √ √ * √ √ √NDoHS X √ * X X *% Dep. complied 50% 50% 0% 60% 20% 30%% Dep. not complied 50% 50% 10% 40% 80% 30%% Partially complied (*) 90% 40%
Legend: √ = met the standard: X = did not meet the standard.
Average
% P
erfo
rman
ce
0%
20%
40%
60%
80%
WC MP LP NDoHS EC NW KZN FS GP NC
Departments
Figure 18: Departments’ performance against principle 9
37%
70%
60%
50%
40% 40% 40%
30%
20%
10% 10%
53

2.4.10.2.1 Existence of an employment equity policy and plan
Sections 1 and 20 of the Employment Equity Act, 1998 (Act 55 of 1998), require departments to have an EE policy and plan, which should comply with certain criteria.92 The EE plan should assist a department in achieving reasonable progress towards EE. Management reports on progress with EE within a department will ensure that where representivity targets are not met, corrective measures can be instituted timeously.
The results have shown that five departments had an EE policy and an EE plan in place that complied with sections 1 and 20 of the EE Act of 1998 (Table 23 on the previous page).
2.410.2.2 Meeting employment equity targets
Departments were evaluated against meeting the national targets of 75% Blacks at senior management level (end of April 2005), 50% women at senior management level by 31 March 2009, and people with disabilities comprising 2% of the workforce by 31 March 2010. All departments, except Western Cape (63%), exceeded the national target of 75% for blacks at senior management level. None of the departments were able to meet the national target of 50% women at senior management level. The performance against the 2% target for people with disabilities was generally poor. Only Limpopo and Mpumalanga were able to exceed this target by having 6% and 4.5% employees with disabilities, respectively, on their establishment (Table 24 below).
Table 24: Departments’ compliance with the national representivity targets
Departments
National Representivity Targets75% Black at senior
management level at the end of April 2005.
At least 50% of senior management should be
women by 31 March 2009.
Disability target of 2% to be achieved by 31 March 2010.
E C 98% 48% 0%FS 90% 37% 1%GP No information submitted 47% 1.3%KZN 84% 42% 0.6%LP 98% 32% 6%MP 100% 40% 4.5%NC 85% 31% 0%NW 95% 33% 0%WC 63% 33% 1.4%NDoHS 82% 39% 2.7%
2.4.10.2.3 Regular management reporting on employment equity
Management reporting at least twice a year on the implementation of the EE plan is of vital importance to ensure that management can make informed decisions on the department’s progress towards representivity. It was found that seven of the ten departments do report to management on the progress made on the implementation of their EE plans. However, feedback from management on these reports is extremely poor with only two departments, namely Mpumalanga and Western Cape complying with this requirement.
2.4.10.2.4 Existence of diversity management measures
A key building block in creating tolerance for others amongst a diverse workforce, is to ensure openness towards and an understanding of different cultures, beliefs and behaviour. Departments need to accommodate these differences, which contribute to an enriched workforce. The evaluation of departments’ performance against requirements of diversity management is aimed at the practical ways in which departments integrate the rich
92 Republic of South Africa. Department of Labour. Employment Equity Act, 1998. (Act 55 of 1998).
54
diversity of cultures and management styles in a department, to improve service delivery and the team spirit amongst staff.
It was found that three departments, namely Eastern Cape, Mpumalanga and Western Cape have implemented comprehensive diversity measures, whilst five departments have implemented some diversity measures. The three departments that did not comply with this standard were Gauteng, Limpopo and Northern Cape.
2.4.10.3 Conclusion
Departments’ average performance against this principle was poor (37%) due to the absence of an EE policy and plan in most departments, and the non-reporting to management on the progress with achieving employment equity targets.
55

Cha
pter
Thr
ee
Recommendations
56

3.1 INTRODUCTION
During each evaluation cycle the PSC made specific recommendations that need to be implemented within specific timeframes. Within six months of delivery of the individual M&E Reports the PSC does a follow-up with the specific departments included in the evaluation cycle on the progress made with the implementation of these recommendations. It is believed that if departments implement these recommendations their administrative processes in these areas will be streamlined and improved for better service delivery. Following is a synopsis of the departments of housing’s progress with the implementation of recommendations made during the first assessment, followed by specific recommendations for this report.
This chapter is structured as follows:
3.2 IMPLEMENTATION STATUS OF FIRST ASSESSMENT’S RECOMMENDATIONS
When eight of the ten departments were assessed for the first time in previous cycles, 253 recommendations were made (Table 25 below). The most recommendations were made for North West (20%) and Free State (16%), whilst the highest occurrence of recommendations was against principle 8 – human resources with 20% followed by principle 6 – accountability with 15% and principle 1 – professional ethics with 14%.
Table 25: implementation status of first assessment’s recommendationsPrinciple Recommendations NDoHS EC FS LP MP NC NW WC Total % of Total
1Made 4 2 3 4 4 6 5 7 35 14%Implemented 4 - 1 2 4 3 1 6 21 60%
2Made 2 2 4 2 1 2 6 4 23 9%Implemented - 2 1 - 1 - 1 3 8 35%
3Made 1 2 * 3 - 4 2 - 12 5%Implemented 1 - 3 - 4 - - 8 67%
4Made 1 1 * 5 1 1 6 - 15 6%Implemented - - - - 1 - - 1 7%
5Made 1 3 * 3 1 2 1 1 12 5%Implemented - - - - - 1 1 2 17%
6Made 2 3 10 3 3 8 4 6 39 15%Implemented 2 3 3 1 1 7 1 6 24 62%
7Made 3 3 8 2 3 3 9 3 34 13%Implemented 3 2 4 1 2 1 2 3 18 53%
8Made 3 5 11 4 5 6 9 7 50 20%Implemented 2 1 2 1 3 2 3 6 20 40%
9Made 1 4 4 4 4 4 10 2 33 13%Implemented 1 1 1 1 1 - 5 1 11 33%
TotalMade 18 25 40 30 22 36 52 30 253Implemented 13 9 12 9 12 18 14 26 113 45%
% of totalMade 7% 10% 16% 12% 9% 14% 20% 12%Implemented 72% 36% 30% 30% 56% 50% 27% 87%
Own calculation* The department failed to submit any information on these principles during the first assessment. As a result the Department’s
performance against these principles could not be made.
Chapter 3: Recommendations
3.1 Status of previous recommendations implemented.
3.2 New recommendations.
3.3 Specific recommendations per principle.
3.4 Conclusion.
57

Hundred and thirteen, or 45%, of the recommendations made during the first assessment were implemented by the time these departments were re-assessed in the 2009/10 evaluation cycle (Table 25 above). The departments which implemented most of the recommendation made during the first assessment were the Western Cape 87% and the National Department (72%). This high percentage implementation of their recommendations are reflected in the improvement of their performance during the re-assessment in the 2009/10 evaluation cycle, namely, Western Cape from 72% (good performance) to 86% (excellent performance) and the National Department from 63% to 76% (good performance). The highest portion of recommendations not implemented per principle is principle 4 – impartiality and fairness, with 83% not implemented, principle 5 – public participation in policy-making, with 83%, principle 9 – representivity, with 67% and principle 2 – economy, effectiveness and efficiency, with 65% not implemented.
It is of interest to note that the assessment of 2009/10 has shown that the problem areas within the housing environment occur exactly in these areas, namely, unfairness in the allocation of houses, the public who are not properly consulted, and the budget spent, which does not correlate with the reported achievement of outputs.
3.3 NEW RECOMMENDATIONS FOR THE 2009/10 EVALUATION CyCLE
The PSC made 193 new recommendations in this report that need to be implemented within specific time frames (Table 26 below). The departments with the least recommendations were Western Cape (2%) followed by the National Department (5%). These two departments were also the best performers for the sector, attaining a rating of “excellent performance” (86%), and a “good performance” (76%), respectively.
Table 26: recommendations for the 2009/10 evaluation cyclePrinciple
Department1 2 3 4 5 6 7 8 9 Total
% of total
NDoHS 1 2 - - 1 - - 2 4 10 5%EC 3 - - - 2 2 1 4 3 15 8%FS 2 - 5 2 2 7 4 6 8 36 19%GP 1 2 - - 1 2 2 3 3 14 7%KZN 4 2 - 2 1 2 3 3 3 20 10%LP 2 2 - 1 3 3 2 3 3 19 9%MP 1 - - 1 2 1 2 2 2 11 6%NC 3 2 - 2 3 3 3 5 4 25 13%NW 5 5 5 - - 6 6 5 7 39 21%WC 1 1 - - - - - 1 1 4 2%
Total 23 16 10 8 15 26 23 34 38 193% Recommendations per principle 12% 8% 5% 4% 7% 13% 12% 18% 21% 100%
Own calculation
The most recommendations were made for the North West (21%) and Free State (19%), which also received the lowest scores, namely 28% and 42% respectively. The most recommendations per principle were made for principle 9 – representivity (21%), principles 8 – human resources (18%) and principle 6 – accountability (13%).
3.4 SPECIFIC RECOMMENDATIONS PER PRINCIPLE
The key recommendations per principle are highlighted below.
Principle 1
Departments should put in place measures, such as management reporting, that will ensure the finalisation of misconduct cases within the time frames set in PSCBC Resolution 2 of 1999 (as amended). Senior managers
58

should give pro-active guidance in response to these management reports, especially on cases that drag on unnecessarily.
Principle 2
Departments should in future ensure that all outputs, PIs and targets are measurable in terms of quantity and time dimensions. Further, departments should consistently report in their ARs on actual performance against the same indicators and targets predetermined in SPs. The utilisation of NT’s Framework for Managing Programme Performance Information93 will assist departments in ensuring improvement in the quality of performance data. This will also enable departments to monitor progress with implementation of programmes and timeously take corrective measures when necessary.
Principle 3
Departments should put appropriate project management measures, such as clearly defined objectives, budget projections, and service delivery indicators and targets in place for development projects. The implementation of projects should be closely monitored against these measures to ensure the achievement of objectives, and the success of projects.
Principle 4
Departments should utilise the Basic Implementation Strategy: Promotion of Administrative Justice Act as a guideline to compile a PAJA implementation plan for the department. This strategy forms part of the Training Course, “The Promotion of the Administrative Justice Act”. Departments are also referred to “The Promotion of Administrative Justice Act Benchbook” written by Iain Currie and Jonathan Klaaren, which gives practical guidance on the understanding and implementation of PAJA.
Principle 5
Departments should utilise the Step-by-Step Guide to Holding Citizens’ Forums issued by the PSC94 as a toolkit for facilitating public participation in policy-making.
Principle 6
Departments should put in place a formal performance monitoring system to monitor programme performance on a monthly basis. Challenges must be addressed by implementing corrective measures based on monitoring information. The various reporting tools such as quarterly reports should be integrated into the performance management system. This will enable departments to detect deviations timeously and thereby contribute to management and service delivery improvement.
Departments are referred to the PSC’s Basic Concepts in Monitoring and Evaluation95 as a source for understanding M&E and different perspectives of evaluation. Departments should also consult the Framework for Monitoring Programme Performance Information96 and the Policy Framework for the Government-Wide M&E System.97
93 Republic of South Africa. National Treasury. Framework for Managing Programme Performance Information. 2007.
94 Republic of South Africa: Public Service Commission. Step-By-Step Guide to Holding Citizens’ Forums. Pretoria. September 2005.
95 Republic of South Africa. Public Service Commission. Basic Concepts in Monitoring and Evaluation. Pretoria. February 2008.
96 Republic of South Africa. National Treasury. Framework for Managing Programme Performance Information. 2007.
97 Republic of South Africa. The Presidency. Policy Frame work for the Government-Wide Monitoring and Evaluation System. Sherono Printers.
November 2007.
59

Principle 7
Departments should ensure compliance with all the requirements of the Promotion of Access to Information Act, 2000 (Act 2 of 2000).
Principle 8
Departments should:
• Prioritise and monitor the filling of vacancies to ensure that vacancies are filled within an average period of twelve weeks. The PSC’s Toolkit on Recruitment and Selection can be utilised to assist departments in this regard.98
• Establish a data base that reflects accurate and credible information on training needs in the department and data on training and development activities.
• Assess the performance of all skills development activities against the skills development plan. The impact of skills development activities on service delivery should be evaluated on an annual basis. The outcome of such impact studies should be captured in the AR for the specific financial year.
Principle 9
Departments should:
• Develop a monitoring mechanism to ensure that EE targets are met.• Revisit the EE figures of all their organisational components and occupational categories, to ensure that EE
objectives are applied in all sections of the department.• Engage with organisations representing people with disabilities to consider a targeted recruitment approach
for this group.• Implement a comprehensive diversity management programme that can address diversity issues such as
culture, language, gender, disability, ethnicity, religion, and sexual orientation.
3.5 CONCLUSION
In this report the PSC made the link between governance and the health of institutions, in this case the housing departments, and Government’s ability to achieve the objectives of the housing programme.
The PSC has argued in this report that the mere introduction of systems, procedures, or IT technology will not have the desired results without people with the skills, ability and will to apply these systems and procedures. The inability of the sector to deliver on stated policy goals have had a huge impact for other social sectors such as health, education, employment creation and sustainable livelihoods with increasing social unrest in many townships in South Africa.
The PSC also made specific recommendations in this report with regard to the application of sound administrative practice. The recommendations are linked to the performance indicators we have tested for each of the constitutional principles. It is hoped, however, that this report and the reports that was supplied to each individual housing department will motivate these departments to review the whole spectrum of their administrative practices and not only the few areas that the PSC has assessed.
98 Republic of South Africa. Public Service Commission. A Toolkit on Recruitment and Selection. Pretoria. Formeset Printers Cape.
60

References
1. Affordable Land and Housing Data Centre. Newsletter. Issue 1. October 2009.
2. Architect Africa Network. Sexwale vows to stamp out corruption in Housing. July 1, 2009.
3 Centre for Development and Enterprise. South Africa’s Public Service. Learning from Success. November 2009. Number 13.
4 Development Action Group. Imizamo Yeto Survey. 2003.
5 Elgin, Ronald. Between a Shack and an RDP House: Alternative Forms of Tenure Security. Transformer October/November 2009.
6 Foundation for Contemporary Research. Survey Conducted by the Provincial Government of the Western Cape on Public Participation in Municipalities’ IDPs and Municipal Budgeting Processes. June 2007.
7 Hoek-Smith, Marja C. and Douglas B. Diamond. The Design and Implementation of Subsidies for Housing Finance. Prepared for the World Bank Seminar on Housing Finance. March 10-13, 2003.
8 Human Science Research Council. Fact Sheet on Poverty in South Africa. Fact sheet No 1. 26 July 2004.
9 Lightstone. Affordable Land and Housing Data Centre. Exploring Affordability of Re-Sale Market Transactions. News Letter. Issue 1. October 2009.
10 Republic of South Africa. Auditor-General. Report on the findings identified during a performance audit of the approval and allocation of housing subsidies at the Department of Local Government and Housing of the Free State Provincial Administration. February 2006.
11 Republic of South Africa. Auditor-General. Report on the findings identified during a Performance Audit of the Approval and Allocation of Housing Subsidies at the Department of Local Government and Housing of the Limpopo Provincial Administration. February 2006.
12 Republic of South Africa. Auditor-General. Report on the findings identified during an investigation of the approval and allocation of housing subsidies at the Northern Cape Department of Housing and Local Government. February 2006.
13 Republic of South Africa. Department of Justice and Constitutional Development. Promotion of Access to Information Act, 2000. (Act 2 of 2000).
14 Republic of South Africa. Department of Justice and Constitutional Development. Promotion of Administrative Justice Act, 2000. (Act 3 of 2000).
15 Republic of South Africa. Department of Justice and Constitutional Development. The Constitution of the Republic of South Africa, 1996. (Act 108 of 1996 as amended). Second impression. Juta & Co Ltd. Cape Town.
16 Republic of South Africa. Department of Labour. Employment Equity Act, 1998. (Act 55 of 1998).
61

17 Republic of South Africa. Department of Public Service and Administration. Service Delivery Review. A Learning Journal for Public Service Managers. Vol. 4. No. 2. 2005. STE Publishers.
18 Republic of South Africa. Eastern Cape Department of Housing and Local Government. Annual Report 2007/08.
19 Republic of South Africa. Gauteng Department of Housing. Annual Report. 2008/09 financial year.
20 Republic of South Africa. Financial and Fiscal Commission. For an Equitable Sharing of National Revenue. 2008/2009.
21 Republic of South Africa. Financial and Fiscal Commission. Government Response to the Commission’s 2008 Recommendations for the 2009/10 Division of Revenue. 2009.
22 Republic of South Africa. National Department of Housing. A Comprehensive Plan for Sustainable Human Settlement. September 2004. “Breaking New Ground”.
23 Republic of South Africa. National Department of Housing. Annual Report 2007/08.
24 Republic of South Africa. National Department of Housing. Housing Act, 1997 (Act 107 of 1997).
25 Republic of South Africa. National Department of Housing. Housing Atlas 2005. National Housing Spatial Investment Potential Atlas. 2005.
26 Republic of South Africa. National Department of Housing. Prevention of Illegal Eviction from and Unlawful Occupation of Land Act, 1999 (Act 19 of 1999).
27 Republic of South Africa. National Department of Housing. Resource Book on Housing Chapters.
28 Republic of South Africa. National Department of Housing. Strategy for the Allocation of Housing Opportunities in the N2 Gateway Project in Cape Town.
29 Republic of South Africa. National Department of Housing. The Home Loan and Mortgage Disclosure Act, 2000 (Act 63 of 2000).
30 Republic of South Africa. National Department of Housing. The Rental Housing Act, 1999 (Act 50 of 1999).
31 Republic of South Africa. National Department of Housing. White Paper on Housing, A New Housing Policy and Strategy for South Africa. 1994.
32 Republic of South Africa. National Department of Human Settlements. Statistics. Chief Directorate Monitoring and Evaluation. 2009.
33 Republic of South Africa. National Department of Human Settlements. The National Housing Code. A Simplified Guide to the National Housing Code. Part A. Introduction to Simplified Guide to the National Housing Code. 2009.
34 Republic of South Africa. The National Treasury. Annual Report and a Guide on Reporting on Performance Information. 2008/09.
35 Republic of South Africa. National Treasury. Division of Revenue Act. 2008/2009.
62

36 Republic of South Africa. National Treasury. Framework for Managing Programme Performance Information. 2007.
37 Republic of South Africa. National Treasury. National Estimates of Expenditure. Department of Human Settlements. 2010/2011.
38 Republic of South Africa. National Treasury. Provincial Budgets and Expenditure Review 2003/04 to 2009/10. September 2007.
39 Republic of South Africa. National Treasury. Provincial Budgets and Expenditure Review 2005/06 to 2010/11. September 2009.
40 Republic of South Africa. National Treasury. Public Finance Management Act, 1999. (Act 1 of 1999 as amended). Formeset Printers. Cape.
41 Republic of South Africa. Public Service Commission. A Toolkit on Recruitment and Selection. Pretoria. Formeset Printers Cape.
42 Republic of South Africa. Public Service Commission. An Evaluation of Integration and Coordination in the Integrated Sustainable Rural Development Programme. October 2009.
43 Republic of South Africa. Public Service Commission. Basic Concepts in Monitoring and Evaluation. Pretoria. February 2008.
44 Republic of South Africa. Public Service Commission. Fact Sheet: Monitoring Compliance with the Requirements of the Financial Disclosure Framework for the 2008/09 Financial Year. September 2009.
45 Republic of South Africa. Public Service Commission. M&E Report on the Department of Local Government and Human Settlements. Gauteng province. Evaluation Cycle 2009/10. March 2010.
46 Republic of South Africa. Public Service Commission. M&E Report on the Department of Human Settlements. Mpumalanga Province. Evaluation Cycle 2009/10. February 2010.
47 Republic of South Africa .Public Service Commission. M&E Report on the Department of Housing and Local Government. Northern Cape Province. Evaluation Cycle 2009/10. January 2010.
48 Republic of South Africa. Public Service Commission. State of the Public Service Report 2008.
49 Republic of South Africa: Public Service Commission. Step-By-Step Guide to Holding Citizens’ Forums. Pretoria. September 2005.
50 Republic of South Africa. Public Service Commission. The Turn-over Rate of Heads of Department and Its Implications for the Public Service. June 2008.
51 Republic of South Africa. South African Human Rights Commission. Audit Recommendation on the Promotion of Access to Information Act, 2009. (Act 2 of 2000). 11 February 2009.
52 Republic of South Africa. The Presidency. Policy Frame Work for the Government-Wide Monitoring and Evaluation System. Sherono Printers. November 2007.
63

53 Republic of South Africa. Western Cape Province. Department of Local Government Housing. Report on Public Awareness of IDPs. 2007.
54 Shisaka Development Management Services (Pty) Ltd. Phase One: General Research. Annexure B: Socio Culture Dimensions. 24 October 2003.
55 Smith, Warren & Jolene Adams. Urban Sector Network. Development Action Group. The People’s Budget Campaign: The Housing Budget. January 2005.
64

App
endi
x a
pp
en
dix
a: p
erf
orm
an
ce i
nd
icat
ors
, st
an
dard
an
d a
pp
lica
ble
po
lici
es/
regu
lati
on
s p
er
pri
nci
ple
Con
stitu
tiona
l Pri
ncip
le a
nd
Val
uePe
rfor
man
ce In
dica
tor
Stan
dard
sA
pplic
able
Leg
isla
tion
and
Reg
ulat
ions
1. p
rofe
ssio
nal
eth
ics.
Valu
e: A
hig
h st
anda
rd o
f pr
ofes
siona
l eth
ics
mus
t be
pr
omot
ed a
nd m
aint
aine
d.
Cas
es o
f m
iscon
duct
whe
re a
di
scip
linar
y he
arin
g ha
s be
en
cond
ucte
d,
com
ply
with
th
e pr
ovisi
ons
of t
he D
CPP
S.
1.
A p
roce
dure
is in
pla
ce fo
r re
port
ing,
rec
ordi
ng a
nd
man
agin
g ca
ses
of m
iscon
duct
.2.
A
ll th
e m
anag
ers s
urve
yed
have
a w
orki
ng k
now
ledg
e of
the
sys
tem
.3.
M
anag
emen
t rep
ortin
g is d
one
on ca
ses o
f misc
ondu
ct
and
acte
d up
on.
4.
All
of t
he m
ost
rece
nt c
ases
of m
iscon
duct
in w
hich
a
disc
iplin
ary
hear
ing
is co
nduc
ted
are
final
ised
with
in
the
time
fram
e of
20
– 80
wor
king
day
s.5.
A
ll th
e m
anag
ers
are
capa
ble
to d
eal w
ith c
ases
of
misc
ondu
ct.
6.
Freq
uent
trai
ning
is p
rovi
ded
on th
e ha
ndlin
g of
cas
es
of m
iscon
duct
.
• D
iscip
linar
y C
odes
and
Pro
cedu
res
for
the
Publ
ic S
ervi
ce.
• Pu
blic
Ser
vice
Coo
rdin
atin
g Ba
rgai
ning
C
ounc
il (P
SCBC
) Re
solu
tion
2 of
19
99 a
s am
ende
d by
Pub
lic S
ervi
ce
Coo
rdin
atin
g Ba
rgai
ning
C
ounc
il Re
solu
tion
1 of
200
3.•
Cod
e of
C
ondu
ct
for
the
Publ
ic
Serv
ice.
2
effi
cie
ncy
eco
no
my
an
d e
ffe
ctiv
en
ess
.
Valu
e: E
ffici
ent,
econ
omic
an
d ef
fect
ive
use
of r
esou
rces
m
ust
be p
rom
oted
.
1.
Expe
nditu
re is
in ac
cord
ance
w
ith t
he b
udge
t.2.
Pr
ogra
mm
e ou
tput
s ar
e cl
early
defi
ned
and
ther
e is
cred
ible
evi
denc
e th
at t
hey
have
bee
n ac
hiev
ed.
1.
Expe
nditu
re is
as b
udge
ted
for a
nd m
ater
ial v
aria
nces
ar
e ex
plai
ned.
2.
Mor
e th
an h
alf
of e
ach
prog
ram
me’
s Pe
rfor
man
ce
Indi
cato
rs (
PIs)
are
mea
sura
ble
in t
erm
s of
qua
ntity
, qu
ality
and
tim
e di
men
sions
.3.
O
utpu
ts,
PIs
and
targ
ets
are
clea
rly
linke
d w
ith
each
oth
er a
s th
ey a
ppea
r in
the
SP,
est
imat
es o
f ex
pend
iture
and
the
AR
for
the
year
und
er r
evie
w.
4.
Prog
ram
mes
are
impl
emen
ted
as p
lann
ed o
r cha
nges
to
impl
emen
tatio
n ar
e re
ason
ably
exp
lain
ed.
• Pu
blic
Fin
ance
Man
agem
ent
Act
, 199
9 (A
ct 1
of 1
999)
, Sec
tions
38
to 4
0.•
Trea
sury
Reg
ulat
ions
. Pa
rt 3
: Pl
anni
ng
and
Budg
etin
g.•
Publ
ic S
ervi
ce R
egul
atio
ns.
Part
III/
B.
Stra
tegi
c Pl
anni
ng.
• Tr
easu
ry
Gui
delin
es
on
prep
arin
g bu
dget
sub
miss
ions
for
the
year
und
er
revi
ew.
• Tr
easu
ry G
uide
for
the
Prep
arat
ion
of
AR
s of
dep
artm
ents
for
the
fina
ncia
l ye
ar e
nded
31
Mar
ch.
• N
atio
nal P
lann
ing
Fram
ewor
k.
65

Con
stitu
tiona
l Pri
ncip
le a
nd
Val
uePe
rfor
man
ce In
dica
tor
Stan
dard
sA
pplic
able
Leg
isla
tion
and
Reg
ulat
ions
3.
Deve
lop
me
nt
ori
en
ted
pu
bli
c a
dm
inis
trat
ion
.
Valu
e: P
ublic
adm
inist
ratio
n m
ust
be d
evel
opm
ent-
orie
nted
.
The
Dep
artm
ent
is ef
fect
ivel
y in
volv
ed
in
prog
ram
mes
/pr
ojec
ts t
hat
aim
to
prom
ote
deve
lopm
ent
and
redu
ce
pove
rty.
1.
Bene
ficia
ries
play
an
activ
e ro
le i
n th
e go
vern
ance
, de
signi
ng a
nd m
onito
ring
of p
roje
cts.
2.
A s
tand
ardi
sed
proj
ect
plan
form
at is
use
d sh
owin
g:
a) A
ll re
leva
nt d
etai
ls in
clud
ing
mea
sura
ble
obje
ctiv
es.
b) T
ime
fram
es (
targ
ets)
. c)
C
lear
gov
erna
nce
arra
ngem
ents
.d)
Det
aile
d fin
anci
al p
roje
ctio
ns.
e) R
evie
w m
eetin
gs.
f)
Con
sider
ing
issue
s su
ch a
s ge
nder
, the
env
ironm
ent
and
HIV
/AID
S.
3.
Pove
rty
redu
ctio
n pr
ojec
ts a
re a
ligne
d w
ith ID
PS.
4.
Org
anisa
tiona
l lea
rnin
g ta
kes
plac
e.5.
Pr
ojec
ts
are
succ
essf
ully
in
itiat
ed
and/
or
impl
emen
ted.
Sect
ion
195
(c)
of t
he C
onst
itutio
n.
4.
imp
art
iali
ty a
nd
fa
irn
ess
.
Valu
e: S
ervi
ces
mus
t be
pr
ovid
ed im
part
ially
, fai
rly,
equi
tabl
y an
d w
ithou
t bi
as.
The
re
is ev
iden
ce
that
th
e D
epar
tmen
t fo
llow
s th
e pr
escr
ibed
pro
cedu
res
of t
he
Prom
otio
n of
A
dmin
istra
tive
Just
ice
Act
(PA
JA) w
hen
mak
ing
adm
inist
rativ
e de
cisio
ns.
1.
All
deci
sions
are
take
n in
acc
orda
nce
with
pre
scrib
ed
legi
slatio
n/po
licie
s an
d in
te
rms
of
dele
gate
d au
thor
ity.
2.
All
deci
sions
are
jus
tified
and
fai
r co
nsid
erin
g th
e ev
iden
ce s
ubm
itted
in t
his
rega
rd.
3.
The
pro
cedu
res r
equi
red
in th
e PA
JA in
com
mun
icat
ing
adm
inist
rativ
e de
cisio
ns a
re d
uly
follo
wed
.
• Pr
omot
ion
of
Adm
inist
rativ
e Ju
stic
e A
ct, 2
000
(Act
No
3 of
200
0).
• Re
gula
tions
on
Fa
ir A
dmin
istra
tive
Proc
edur
es, 2
002.
• D
epar
tmen
tal d
eleg
atio
ns o
f au
thor
ity.
5.
pu
bli
c p
art
icip
atio
n
in p
oli
cy-m
ak
ing.
Valu
e: P
eopl
e’s
need
s m
ust
be r
espo
nded
to
and
the
publ
ic m
ust
be e
ncou
rage
d to
par
ticip
ate
in p
olic
y-m
akin
g.
The
D
epar
tmen
t fa
cilit
ates
pu
blic
par
ticip
atio
n in
pol
icy-
mak
ing.
1.
A p
olic
y an
d gu
idel
ine
on p
ublic
par
ticip
atio
n in
po
licy-
mak
ing
is in
pla
ce.
2.
A s
yste
m fo
r so
liciti
ng p
ublic
inpu
ts o
n ke
y m
atte
rs is
in
use
and
effe
ctiv
ely
impl
emen
ted.
3.
All
polic
y in
puts
re
ceiv
ed
from
th
e pu
blic
ar
e ac
know
ledg
ed a
nd fo
rmal
ly c
onsid
ered
.
Whi
te
Pape
r fo
r Tr
ansf
orm
ing
Publ
ic
Serv
ice
Del
iver
y (B
atho
Pel
e).
66

Con
stitu
tiona
l Pri
ncip
le a
nd
Val
uePe
rfor
man
ce In
dica
tor
Stan
dard
sA
pplic
able
Leg
isla
tion
and
Reg
ulat
ions
6.
acc
ou
nta
bil
ity.
Valu
e: P
ublic
adm
inist
ratio
n m
ust
be a
ccou
ntab
le.
1.
Ade
quat
e in
tern
al fi
nanc
ial
cont
rols
and
perf
orm
ance
m
anag
emen
t ar
e ex
erte
d ov
er
all
depa
rtm
enta
l pr
ogra
mm
es.
2.
FPPs
, ba
sed
on t
horo
ugh
risk a
sses
smen
ts, a
re in
pla
ce
and
are
impl
emen
ted.
1.
The
A-G
’s as
sess
men
ts o
f in
tern
al fi
nanc
ial c
ontr
ols
conc
lude
tha
t th
ey a
re a
dequ
ate
and
effe
ctiv
e.2.
A
per
form
ance
man
agem
ent
(M&
E) s
yste
m o
n al
l de
part
men
tal p
rogr
amm
es is
in o
pera
tion.
3.
FPPs
are
bas
ed o
n a
thor
ough
risk
ass
essm
ent.
4.
FPPs
ar
e in
pl
ace
and
are
com
preh
ensiv
e an
d ap
prop
riate
, and
are
impl
emen
ted.
5.
Key
staf
f fo
r en
surin
g im
plem
enta
tion
of
FPPs
, es
peci
ally
inv
estig
atio
n of
fra
ud,
are
in p
lace
and
op
erat
iona
l.
• Pu
blic
Fin
ance
Man
agem
ent A
ct, A
ct 1
of
199
9.•
Trea
sury
Reg
ulat
ions
. Pa
rt 3
: Pl
anni
ng
and
Budg
etin
g.•
Whi
te P
aper
for
Tra
nsfo
rmin
g Pu
blic
Se
rvic
e D
eliv
ery
(Bat
ho P
ele)
.•
Publ
ic S
ervi
ce R
egul
atio
ns.
Part
III/
B.
Stra
tegi
c Pl
anni
ng.
• Tr
easu
ry
Gui
delin
es
on
prep
arin
g bu
dget
sub
miss
ions
, 200
2.•
Trea
sury
Gui
de fo
r th
e Pr
epar
atio
n of
A
Rs
of d
epar
tmen
ts f
or t
he fi
nanc
ial
year
end
ed 3
1 M
arch
.•
Nat
iona
l Pla
nnin
g Fr
amew
ork.
7. T
ran
spare
ncy
.
Valu
e: T
rans
pare
ncy
mus
t be
fost
ered
by
prov
idin
g th
e pu
blic
with
tim
ely,
acce
ssib
le
and
accu
rate
info
rmat
ion.
A. D
epar
tmen
tal A
R
The
dep
artm
enta
l AR
com
plie
s w
ith N
T’s
guid
elin
e on
Ann
ual
Repo
rtin
g.
B. A
cces
s to
Info
rmat
ion
The
D
epar
tmen
t co
mpl
ies
with
th
e pr
ovisi
ons
of
the
Prom
otio
n of
A
cces
s to
In
form
atio
n A
ct (
PAIA
).
A. D
epar
tmen
tal A
R
1.
The
Rep
ort i
s at
trac
tive
and
clea
rly p
rese
nted
and
is
wel
l writ
ten
in s
impl
e ac
cess
ible
lang
uage
.2.
T
he c
onte
nt o
f th
e A
R co
vers
in s
uffic
ient
det
ail a
t le
ast
90%
of
the
area
s pr
escr
ibed
by
NT
and
the
DPS
A.
3.
The
A
R cl
early
re
port
on
pe
rfor
man
ce
agai
nst
pred
eter
min
ed o
utpu
ts in
at
leas
t tw
o th
irds
of t
he
prog
ram
mes
list
ed.
B. A
cces
s to
Info
rmat
ion
1.
The
dep
artm
ent h
as a
t lea
st o
ne d
eput
y in
form
atio
n of
ficer
with
dul
y de
lega
ted
auth
ority
.2.
A
man
ual o
n fu
nctio
ns o
f and
inde
x of
reco
rds h
eld
by
the
depa
rtm
ent t
hat c
ompl
ies
with
the
requ
irem
ents
of
the
PA
IA is
in p
lace
.3.
Sy
stem
s fo
r m
anag
ing
requ
ests
fo
r ac
cess
to
in
form
atio
n ar
e in
pla
ce.
• Pu
blic
Fin
ance
Man
agem
ent
Act
, 199
9 (A
ct 1
of 1
999)
.•
NT
’s gu
idel
ine
for
the
Prep
arat
ion
of
AR
s.•
The
D
epar
tmen
t of
Pu
blic
A
dmin
istra
tion’
s gui
de fo
r an
Ove
rsig
ht
Repo
rt o
n H
uman
Res
ourc
es.
• PS
C.
Ev
alua
tion
of
Dep
artm
ents
’ A
Rs
as a
n A
ccou
ntab
ility
Mec
hani
sm.
Oct
ober
199
9.•
Whi
te P
aper
for
Tra
nsfo
rmin
g Pu
blic
Se
rvic
e D
eliv
ery
(Bat
ho P
ele)
.•
Prom
otio
n of
Acc
ess
to I
nfor
mat
ion
Act
, 200
0 (A
ct 2
of 2
000)
.•
Dep
artm
enta
l de
lega
tions
of
au
thor
ity.
67

Con
stitu
tiona
l Pri
ncip
le a
nd
Val
uePe
rfor
man
ce In
dica
tor
Stan
dard
sA
pplic
able
Leg
isla
tion
and
Reg
ulat
ions
8.
go
od
hu
man
re
sou
rce
m
an
age
me
nt
an
d
care
er
deve
lop
me
nt
pra
ctic
es.
Valu
e: G
ood
hum
an
reso
urce
man
agem
ent
and
care
er d
evel
opm
ent
prac
tices
, to
max
imise
hum
an
pote
ntia
l, m
ust
be c
ultiv
ated
.
A. R
ecru
itmen
t
Vaca
nt
post
s ar
e fil
led
in
a tim
ely
and
effe
ctiv
e m
anne
r.
B. S
kills
Dev
elop
men
t
The
D
epar
tmen
t co
mpl
ies
with
the
prov
ision
s of
the
Skills
D
evel
opm
ent
Act
.
A. R
ecru
itmen
t
1.
A r
ecru
itmen
t po
licy
com
plyi
ng w
ith g
ood
prac
tice
stan
dard
s an
d sp
ellin
g ou
t a
deta
iled
proc
edur
e is
in
plac
e.
2.
Vaca
nt p
osts
are
fille
d w
ithin
90
days
– i
nclu
ding
ad
vert
isem
ent
time.
3.
Regu
lar
man
agem
ent
repo
rtin
g on
rec
ruitm
ent
is do
ne.
B. S
kills
dev
elop
men
t
1.
A s
kills
dev
elop
men
t pla
n, b
ased
on
a th
orou
gh s
kills
ne
eds
anal
ysis,
is in
pla
ce
2.
Act
iviti
es p
lann
ed fo
r ar
e im
plem
ente
d 3.
T
he r
esul
ts a
chie
ved
thro
ugh
skills
dev
elop
men
t ar
e m
onito
red
and
reco
rded
.
• Pu
blic
Se
rvic
e Re
gula
tions
, 20
01
as
amen
ded.
• Pu
blic
Ser
vice
Act
.
9. r
ep
rese
nti
vit
y.
Valu
e: P
ublic
adm
inist
ratio
n m
ust
be b
road
ly
repr
esen
tativ
e of
SA
peo
ple,
w
ith e
mpl
oym
ent
and
pers
onne
l man
agem
ent
prac
tices
bas
ed o
n ab
ility
ob
ject
ivity
fairn
ess
and
the
need
to
redr
ess
the
imba
lanc
es o
f the
pa
st t
o ac
hiev
e br
oad
repr
esen
tatio
n.
The
D
epar
tmen
t is
repr
esen
tativ
e of
th
e So
uth
Afr
ican
pe
ople
an
d is
impl
emen
ting
dive
rsity
m
anag
emen
t m
easu
res.
1.
EE p
olic
ies
and
plan
s ar
e in
pla
ce a
nd r
epor
ted
upon
.2.
A
ll re
pres
entiv
ity t
arge
ts a
re m
et.
3.
Div
ersit
y m
anag
emen
t m
easu
res
are
impl
emen
ted.
• Pa
rt
VI
Publ
ic
Serv
ice
Regu
latio
ns,
2001
as
amen
ded.
• EE
Act
, Act
55
of 1
998.
• W
hite
Pap
er o
n th
e Tr
ansf
orm
atio
n on
Pub
lic S
ervi
ce –
15/
11/1
995.
• W
hite
Pap
er o
n A
ffirm
ativ
e A
ctio
n in
th
e Pu
blic
Ser
vice
, 200
1.
68

appendix b: subsidy Types
Subsidy Type Subsidy description1. Integrated
Settlement Development
The main instrument for delivery in integrated human settlements and provides a vehicle to support inclusionary housing. It provides for the development of integrated projects in a number of phases providing for a range of socio-economic uses and income groups.
2. Informal Settlements Upgrading
Emphasise the need for relocation of households to take place where development conditions require it.
3. Emergency Housing Assistance
Provides for cases where households are to be relocated to enable service provision and upgrading projects to proceed. The programme also provides assistance in disaster circumstances for persons living in dangerous circumstances and the totally destitute.
4. Community Residential Units
Represents government’s rental intervention to persons in the lowest income categories and the upgrading of all existing state owned rental stock, including public sector hostel redevelopment.
5. Social Housing Represents government’s contribution towards social integration, urban redevelopment and rental housing provision for the middle to higher income groups.
6. Costs in Transitional Residential Areas
The allocation of funds to provinces could also be utilised to fund the service delivery and services consumption cost in areas where emergency units have been delivered where municipalities are unable to finance such.
7. Social and Economic Amenities
Is aimed at facilitating the provision of basic social and economic amenities in new and existing residential areas and in upgraded informal settlement areas where other funding is not available.
8. Farm Residents Housing Assistance
Provides for a range of development options to accommodate the diversity of needs and opportunities that exist in the farming community.
9. Finance Linked Individual Subsidy
Provides mortgage finance down-payment assistance to persons in the income category R3 501 to R7 000 per month. The extension of the upper income level of R10 000 may be considered.
10. Inclusionary Housing This programme provides policy prescripts backed by legislation, for the conditional approval of new residential developments by private sector developers, to ensure and integrated development approach across income groups and product cost estimates.
11. Rectification of houses delivered between 16/03/1994 & 31/03/2002
Municipal Services• Inappropriate township layout and design, whereby a house may, for example,
be subject to flooding, to the extent that its structural integrity has been compromised.
• Inappropriate storm water drainage systems.
Top Structure Defects• Defective or substandard materials that were used during construction;• Insufficient foundation design, where the seriousness of such structural defects
compromises the overall structural integrity of the house; • Defective construction practices, such as failure to secure roof ties properly or
incorrect roof construction practices;• Incidents of major structural defects which have not been repaired due to the
inability of the registered property owner to finance such repairs;• Structural faults caused as a result of inappropriate soil conditions for house
building purposes; and• Houses which have been vandalised after completion, but before occupation by
the rightful subsidy owner.
69

appendix C: values of subsidies
Subsidy Amounts Per ProgrammeTop
structure funding
Own contribution
Product price
Project linked (IRDP) Subsidies:R0 to R1 500 55,706.00 None 55,706.00R1 501 to R3 500 53,227.00 2,479.00 55,706.00Indigent: Aged, disabled and health stricken R0 to R3 500 55,706.00 None 55,706.00Consolidation Subsidies:R0 to R1 500 54,650.00 None 54,650.00R1 501 to R3 500 52,471.00 2,479.00 54,950.00Indigent: Aged, disabled and health stricken R0 to R3 500 54,650.00 None 54,650.00Institutional subsidies:R0 to R3 500 52,471.00 Institution must
add capitalAt least
54,650.00Individual Subsidies:R0 to R1 500 55,706.00 None 55,706.00R1 501 to R3 500 53,227.00 2,479.00Indigent: Aged, disabled and health stricken R1 501 to R3 500 55,706.00 None 55,706.00Rural subsidies:R0 to R3 500 55,706.00 None 55,706.00People’s Housing Process: R0 to R3 500 55,706.00 None 55,706.00
Source: National Department of Housing 2009/10
70

appendix D: Detailed cost breakdown of a 40sqm subsidised house with effect from 1 april 2009
Description of cost driver Cost in REarthworks (provisional) 790Concrete, Formwork and Reinforcement 4,291Brickwork 14,236Roof structure 3,736Windows 1,388Doors and Frames 1,657Finishing and Paintwork 2,212Electrical 1,100Plumbing and Toilet 6,607Material 36,017Labour 9,732Sub Total 45,749P & G 4,968Overheads 2,095Transfer costs 800Beneficiary Administration 255Profit 1,833Total Cost 55,700
Source: National department of Housing 2009/10
71

appendix e: Detailed cost breakdown of a serviced stand with effect from 1 april 2009
Cost Cost in RProfessional fees – Indirect CostSafety Inspector (DoL) 68Environmental Control Officer 54Pre-planning Studies 365Project Management 749Geotechnical Evaluation 89Contour Survey 59Land Surveying and Site Pegging 299Land Survey examination fee 92Town Planning 404Civil Engineer : Services 898Site Supervision : Clerk of Works – Civil 227Social Facilitation 299Legal Fees 20Sub Total : Indirect Cost 3,623Direct CostWater Reticulation (including meter) 4,614Sanitation Reticulation 5,363Roads 3,445Storm Water 4,988Street Lighting 119Sub Total Direct Cost 18,529Total Cost of a Serviced Stand:Sub Total : Indirect Cost 3,623Sub Total : Direct Cost 18,529Total Cost: 22,152
72

Notes
73

Notes
74

Notes
75

Eastern Cape
91 Alexandra RoadKing William’s Town 5601
Tel: (043) 643-4704Fax: (043) 642-1371
Gauteng
Ten Sixty-Six Building16th Floor, 35 Pritchard StreetJohannesburg 2001
Tel: (011) 833-5721Fax: (011) 834-1200
Mpumalanga
19 Russel StreetNelspruit 1200
Tel: (013) 755-4070Fax: (013) 752-5814
Limpopo
Kirk Patrick Building40 Schoeman StreetPolokwane 0699
Tel: (015) 291-4783Fax: (015) 291-4683
Western Cape
Sanlam Golden Acre Building21st Floor, Adderley StreetCape Town8000
Tel: (021) 421-3980Fax: (021) 421-4060
PUBLIC SERVICE COMMISSION REGIONAL OFFICES
Free State
62 Fedsure Building3rd Floor, St Andrew StreetBloemfontein9300
Tel: (051) 448-8696Fax: (051) 448-4135 KwaZulu-Natal
249 Burger StreetIdube Building, Ground FloorPietermaritzburg 3201
Tel: (033) 345-9998Fax: (033) 345-8505 Northern Cape
1st Floor,Woolworths Buildingcnr Lennox & Chapel StreetsKimberley 8300
Tel: (053) 832-6222Fax: (053) 832-6225 North West
Mmabatho Post Office BuildingGround FloorUniversity DriveMmabatho 2735
Tel: (018) 384-1000Fax: (018) 384-1012 Parliamentary Office
Sanlam Golden Acre Building21st Floor, Adderley StreetCape Town8000
Tel: (021) 418-4940Fax: (021) 418-1362

Public Service Commission
Tel: +27 12 352-1000Fax: +27 12 325-8382Website: www.psc.gov.za
National Anti-Corruption Hotline for the Public Service: 0800 701 701
Republic of South Africa