consolidated half-year financial report - datalogic group consolidated half-year financial report at...
TRANSCRIPT

Consolidated Half-Year Financial Report
30 June 2011

DATALOGIC GROUP Consolidated Half-Year Financial Report at 30 June 2011 GROUP STRUCTURE pag. 1 COMPOSITION OF CORPORATE BODIES pag. 2 REPORT ON OPERATIONS pag. 3
CONSOLIDATED FINANCIAL STATEMENTS Statement of financial position - assets pag. 11 Statement of financial position - liabilities pag. 12 Consolidated statement of income pag. 13 Statement of comprehensive income pag. 14 Statement of cash flow pag. 15 Statement of shareholders’ equity pag. 16 EXPLANATORY NOTES TO THE CONSOLIDATED FINANCIAL STATEMENTS
Presentation and content pag. 17 Information on the statement of financial position pag. 24 Information on the statement of income pag. 41 ANNEXES
1. Declaration pursuant to Art. 154-bis, pars. 3 and 4, Legislative Decree 58/1998

DATALOGIC SpAItaly
DATALOGIC SpAItaly
Datalogic Automation SrlItaly
(100%)
Datalogic Automation SrlItaly
(100%)
Datalogic Mobile SrlItaly
(100%)
Datalogic Mobile SrlItaly
(100%)Datalogic Scanning Group Srl
Italy(100%)
Datalogic Scanning Group SrlItaly
(100%)
Idec Datalogic Co LtdJapan(50%)
Idec Datalogic Co LtdJapan(50%)
Datalogic Automation Pty LtdAustralia(100%)
Datalogic Automation Pty LtdAustralia(100%)
Datalogic Automation Asia LtdHk
(100%)
Datalogic Automation Asia LtdHk
(100%)
Datalogic Automation IncUsa
(100%)
Datalogic Automation IncUsa
(100%)
Datalogic Automation UkUk
Datalogic Automation UkUk
Datalogic Mobile Asia LtdHk
(100%)
Datalogic Mobile Asia LtdHk
(100%)
Datalogic Mobile Pty LtdAustralia(100%)
Datalogic Mobile Pty LtdAustralia(100%)
Datalogic Scanning Slovakia SroSlovakia(100%)
Datalogic Scanning Slovakia SroSlovakia(100%)
Datalogic Scanning Holdings, IncUsa
(100%)
Datalogic Scanning Holdings, IncUsa
(100%)
Datalogic Scanning IncUsa
(100%)
Datalogic Scanning IncUsa
(100%)
Datalogic Scanning GmbhGermany(100%)
Datalogic Scanning GmbhGermany(100%)
Datalogic Scanning LtdUk
(100%)
Datalogic Scanning LtdUk
(100%)
Datalogic Scanning SpaItaly
(100%)
Datalogic Scanning SpaItaly
(100%)Datalogic Scanning Kk
Japan(100%)
Datalogic Scanning KkJapan(100%)
Datalogic Scanning do Brasil LtdBrasil
(100%)
Datalogic Scanning do Brasil LtdBrasil
(100%)
Datalogic Scanning Singapore Pte LtdSingapore
(100%)
Datalogic Scanning Singapore Pte LtdSingapore
(100%)
Datalogic Scanning Pty LtdAustralia(100%)
Datalogic Scanning Pty LtdAustralia(100%)
Datalogic Scanning de Mexico S. de Rl de CvMexico(100%)
Datalogic Scanning de Mexico S. de Rl de CvMexico(100%)
Datalogic Scanning SasFrance(100%)
Datalogic Scanning SasFrance(100%)
Datalogic Scanning Eastern Europe GmbhGermany(100%)
Datalogic Scanning Eastern Europe GmbhGermany(100%)
Datalogic Automation SrlItalien filialSweden
Datalogic Automation SrlItalien filialSweden
Datalogic Automation SrlNiederlassung Central Europe
Germany
Datalogic Automation SrlNiederlassung Central Europe
Germany
Datalogic Automation BeneluxNetherlands
Datalogic Automation BeneluxNetherlands
Datalogic Automation SrlSuccursale en France
Datalogic Automation SrlSuccursale en France
Datalogic Automation IberiaSucursal en Espagne
Datalogic Automation IberiaSucursal en Espagne
Datalogic Mobile AustriaZweigniederlassung der Datalogic Mobile Srl
Austria
Datalogic Mobile AustriaZweigniederlassung der Datalogic Mobile Srl
Austria
Datalogic Mobile CecZweigniederlassung der Datalogic Mobile Srl
Germany
Datalogic Mobile CecZweigniederlassung der Datalogic Mobile Srl
Germany
Datalogic Mobile SrlSucursal en Espana
Datalogic Mobile SrlSucursal en Espana
Datalogic Mobile SrlSuccursale en France
Datalogic Mobile SrlSuccursale en France
Datalogic Mobile SrlItalien Filial
Sweden
Datalogic Mobile SrlItalien Filial
Sweden
Datalogic Scanning LtdStorbritannien filial
Sweden
Datalogic Scanning LtdStorbritannien filial
Sweden
Datalogic Scanning SasSucursal en Espana
Datalogic Scanning SasSucursal en Espana
Datalogic Mobile IncUsa
(100%)
Datalogic Mobile IncUsa
(100%)
Datalogic Mobile SrlItalien Filial
Finland
Datalogic Mobile SrlItalien Filial
Finland
Datalogic Real Estate SrlItaly
(100%)
Datalogic Real Estate SrlItaly
(100%)
Datalogic Mobile BeneluxNetherlands
Datalogic Mobile BeneluxNetherlands
Informatics IncUsa
(100%)
Informatics IncUsa
(100%)
Datalogic Mobile DenmarkDenmark
Datalogic Mobile DenmarkDenmark
Datalogic Scanning Vietnam LlcVietnam(100%)
Datalogic Scanning Vietnam LlcVietnam(100%)
Datafoton KftHungary(51%)
Datafoton KftHungary(51%)
1
Datalogic Holding AB(100%)
Datalogic Holding AB(100%)
Datalogic Mobile SrlItalien Filial
UK
Datalogic Mobile SrlItalien Filial
UK
Evolution Robotics Retail IncUsa
(100%)
Evolution Robotics Retail IncUsa
(100%)
Datalogic Real Estate Uk LtdUK
(100%)
Datalogic Real Estate Uk LtdUK
(100%)
Datalogic Real Estate France SaFrance(100%)
Datalogic Real Estate France SaFrance(100%)
Datalogic Real Estate Germany GmbhGermany(100%)
Datalogic Real Estate Germany GmbhGermany(100%)
Legal entity
Branch
Laservall Asia Co LtdHk
(50%)
Laservall Asia Co LtdHk
(50%)
Laservall China Co LtdChina
(100%)
Laservall China Co LtdChina
(100%)
Laservall Asia Futian Co LtdChina
(100%)
Laservall Asia Futian Co LtdChina
(100%)
Datasensor UkUk
(35%)
Datasensor UkUk
(35%)
Datasensor GmbhGermany
(30%)
Datasensor GmbhGermany
(30%)
Datasensor india Ltd(20%)
Datasensor india Ltd(20%)
Specialvideo Srl(40%)
Specialvideo Srl(40%)
Datalogic Automation AB(20%)
Datalogic Automation AB(20%)

2
COMPOSITION OF CORPORATE BODIES
Board of Directors (1)
Romano Volta Chairman (2) Mauro Sacchetto Chief Executive Officer (3) Pier Paolo Caruso Director Gianluca Cristofori Independent Director Luigi Di Stefano Independent Director Angelo Manaresi Independent Director Elserino Piol Director Giovanni Tamburi Director Gabriele Volta Director Valentina Volta Director Statutory Auditors (4) Stefano Romani Chairman Mario Stefano Luigi Ravaccia Statutory Auditor Massimo Saracino Statutory Auditor Stefano Biordi Alternate Statutory Auditor Patrizia Passerini Alternate Statutory Auditor
Auditing company Reconta Ernst & Young S.p.A. (1) The Board of Directors will remain in office until the general meeting that approves the accounts for the financial year ending 31 December 2011. (2) Legal representative with respect to third parties. (3) Legal representative with respect to third parties. (4) The Statutory Auditors in office until the approval of the accounts for the financial year ending 31 December 2012.

Datalogic Group
Report on operations at 30/06/2011 3
REPORT ON OPERATIONS
To our Shareholders, The report for the period ended 30 June 2011, which we submit to you for review, has been prepared in compliance with the instructions in the Borsa Italiana S.p.A. Regulations. Specifically, consolidated financial statements apply the approach set forth by international accounting standards (IASs/IFRSs) adopted by the European Union. COMMENTS ON OPERATING AND FINANCIAL RESULTS The following table summarises the Datalogic Group’s key operating and financial results at 30 June 2011 in comparison with the same period a year earlier (figures in €’000): 30.06.2011 30.06.2010 Change % change Total revenue 210,247 190,832 19,415 10.2%EBITDA (*) 31,764 25,923 5,841 22.5%% of total revenue 15.1% 13.6%
Group net profit/loss 7,818 11,255 (3,437) -30.5%% of total revenue 3.7% 5.9%
Net financial position (NFP) (**) (71,860) (92,103) 20,243 -22.0%
(*) EBITDA is a performance indicator not defined under IFRS. However, Datalogic’s management uses it to monitor and assess the
company’s operating performance as it is not influenced by the volatility due to the various valuation criteria used to determine taxable
income, by the total amount and nature of the capital involved or by the related depreciation and amortisation policies. Datalogic defines
it as Profit/loss for the period before depreciation and amortisation of tangible and intangible assets, non-recurring costs,
financial income and expenses and income taxes. (**) For the criteria defining the net financial position please see page 8.
At 30 June 2011 the Datalogic Group reported revenue of €210,247 thousand (€190,832 thousand in the previous year), of which €200,985 thousand from the sale of products and €9,262 thousand from services. Revenues grew by 10.2% compared with the same period of the previous year. At constant euro/dollar exchange rates, the increase would have been slightly higher (13%). Group EBITDA was €31,764 thousand, corresponding to 15.1% of total revenue, an increase of €5,841 thousand compared with the same period of the previous year (€25,923 thousand at 30 June 2010).

Datalogic Group
Report on operations at 30/06/2011 4
Group net profit, which amounted to €7,818 thousand at 30 June 2011, was down compared with the €11,255 thousand posted in the same period of the previous year due to extraordinary costs for restructuring, amounting to €7,414 thousand, provisioned in the month of June. These costs, as detailed further on in this document, result from a process to optimise the distribution model and reconfigure the supply chain for the Group's Scanning and Mobile divisions. ANALYSIS OF RECLASSIFIED CONSOLIDATED STATEMENT OF INCOME The following table shows the main income statement items for the Datalogic Group compared with the same period in the previous year: (€’000) 30.06.2011 30.06.2010 Change %
changeTotal revenue 210,247 100.0% 190,832 100.0% 19,415 10.2%
Cost of sales (111,432) -53.0% (103,298) -54.1% (8,134) 7.9%
Gross profit 98,815 47.0% 87,534 45.9% 11,281 12.9%
Other revenue 1,780 0.8% 606 0.3% 1,174 193.7%
Research and development expenses (13,389) -6.4% (12,659) -6.6% (730) 5.8%
Distribution expenses (39,372) -18.7% (36,821) -19.3% (2,551) 6.9%
General & administrative expenses (20,441) -9.7% (17,587) -9.2% (2,854) 16.2%
Other operating costs (879) -0.4% (928) -0.5% 49 -5.3%
Total operating cost and other costs (74,081) -35.2% (67,995) -35.6% (6,086) 9.0%
Ordinary operating result before non-recurring costs and revenue and administrative costs arising from acquisitions (EBITANR) (*)
26,514 12.6% 20,145 10.6% 6,369 31.6%
Non-recurring costs and revenues (7,414) -3.5% 338 0.2% (7,752) n.a.
Depreciation & amortization due to acquisitions (**)
(2,176) -1.0% (1,999) -1.0% (177) 8.9%
Operating result ( EBIT) 16,924 8.0% 18,484 9.7% (1,560) -8.4%
Net financial income (expenses) (2,905) -1.4% (3,037) -1.6% 132 -4.3%
Subsidiaries' earnings/(losses) 219 0.1% 86 0.0% 133 154.7%
Foreign exchange earnings/(losses) (2,349) -1.1% 2,290 1.2% (4,639) n.a.
Pre-tax profit/(loss) 11,889 5.7% 17,823 9.3% (5,934) -33.3%
Taxes (4,071) -1.9% (6,568) -3.4% 2,497 -38.0%
GROUP NET PROFIT/LOSS 7,818 3.7% 11,255 5.9% (3,437) -30.5%
Depreciation and write-downs of property, plant and equipment
(3,661) -1.7% (3,926) -2.1% 265 -6.7%
Amortisation and write-downs of intangible assets (1,589) -0.8% (1,852) -1.0% 263 -14.2%
EBITDA (***) 31,764 15.1% 25,923 13.6% 5,841 22.5%
(*) To provide a better representation of the Group’s ordinary profitability, we chose – in all tables in this section concerning information on operating
performance – to show an operating result before the impact of non-recurring costs/income and of depreciation and amortisation due to acquisitions, which
we have called EBITANR (Earnings before interests, tax, acquisitions and not recurring), hereinafter referred to as “Ordinary operating result”. To
permit comparability with detailed official accounting statements, we have in any case included a further intermediate profit margin (called “Operating
result”) that includes non-recurring costs/income and depreciation and amortisation due to acquisitions and matches figures reported in financial
statements. (**) This item includes extraordinary costs for amortisation arising from acquisitions.
(***) EBITDA is a performance indicator not defined under IFRS. However, Datalogic’s management uses it to monitor and assess the company’s operating
performance as it is not influenced by the volatility due to the various valuation criteria used to determine taxable income, by the total amount and nature of

Datalogic Group
Report on operations at 30/06/2011 5
the capital involved or by the related depreciation and amortisation policies. Datalogic defines it as Profit/loss for the period before depreciation and
amortisation of tangible and intangible assets, non-recurring costs, financial income and expenses and income taxes. Gross profit improved compared with the same period of the previous year (from 45.9% of sales to 47%). In absolute terms, operating costs were higher than in the same period of 2010, but consistent in percentage terms. Most of the increase (in absolute terms) in operating costs is attributable to variable costs (variable fees to directors and managers, sales commissions, delivery and transport expenses, marketing expenses), which, because they relate directly to turnover volumes, were affected by the substantial increase in sales. At 30 June 2011, non-recurring costs/income (€7,414 thousand) broke down as follows: ITEM AMOUNT COST TYPE 2)" Cost of goods sold" 4,508 early retirement incentives2)" Cost of goods sold" 110 wages and salaries (bonus)2)" Cost of goods sold" 141 amortisation2)" Cost of goods sold" 30 others
Total 4,7894) R&D expenses 380 early retirement incentives
Total 3805) Distribution expenses 1,955 early retirement incentives
Total 1,9556) General & administrative expenses 190 early retirement incentives6) General & administrative expenses 100 consulting services
Total 290TOTAL NON-RECURRING COSTS 7,414
All non-recurring costs relate to the integration and restructuring project involving the Mobile and Scanning divisions. In addition to the non-recurring costs listed above, the Group incurred, for the same project, further costs totalling €1,062 thousand, primarily for consulting services. At 30 June 2011 the total cost of the project was €8,476 thousand. At 30 June 2011, depreciation and amortisation due to acquisitions (in the amount of €2,176 thousand) breaks down as follows: €648 thousand pertaining to Datalogic Automation Srl; €285 thousand pertaining to Informatics Inc.; €869 thousand pertaining to Datalogic Scanning Inc.; €249 thousand pertaining to Evolution Robotics Retail Inc., and; €125 thousand pertaining to Mobile Inc. The “Ordinary operating result” (EBITANR) was €26,514 thousand, corresponding to 12.6% of revenues, and higher (by €6,369 thousand in absolute terms) than the figure registered for the same period of the previous year (€20,145 thousand).

Datalogic Group
Report on operations at 30/06/2011 6
The table below compares the main operating results in the second quarter of 2011 with the same period of 2010 and the first quarter of 2011.
Q2 2011 Q2 2010 Change % change
TOTAL REVENUE 105,291 100.0% 101,312 100.0% 3,979 3.9%
EBITDA 16,868 16.0% 15,338 15.1% 1,530 10.0%
EBITANR (*) 14,301 13.6% 12,448 12.3% 1,853 14.9%
EBIT 5,818 5.5% 11,760 11.6% (5,942) -50.5%
Q2 2011 Q1 2011 Change % change
TOTAL REVENUE 105,291 100.0% 104,956 100.0% 335 0.3%
EBITDA 16,868 16.0% 14,896 14.2% 1,972 13.2%
EBITANR (*) 14,301 13.6% 12,213 11.6% 2,088 17.1%
EBIT 5,818 5.5% 11,106 10.6% (5,288) -47.6%
(*) see definition on page 4 PERFORMANCE BY BUSINESS SEGMENT Operating segments are identified based on the internal statements used by senior management to allocate resources and evaluate results. The Group does business in the following operating segments: Mobile – includes the Mobile Computers (MC) product lines and the self-scanning solution. Automation – includes product lines related to: fixed scanners for the industrial market (USS), industrial marking products, radio frequency scanners (RFID) and photoelectrical sensors and devices. Scanning – includes product lines related to: hand-held readers (HHR) and checkout scanners for the retail market. Business Development – includes distribution of products for automatic identification. As well as Informatics Inc., this segment includes Evolution Robotics Retail Inc., acquired on 1 July 2010. Other – includes the Group's corporate and real estate activities. Intersegment sales transactions are executed at arm's length conditions, based on the Group transfer pricing policies.

Datalogic Group
Report on operations at 30/06/2011 7
The financial information relating to operating segments at 30 June 2011 and 30 June 2010 are as follows (€'000): Mobile Automation Scanning Business
Development Other Adjustments Total group
2011 2010 2011 2010 2011 2010 2011 2010 2011 2010 2011 2010 2011 2010
External sales 41,800 41,871 48,598 43,165 101,665 89,246 18,203 16,561 (19) (11) 210,247 190,832
Intersegment sales
23 55 174 186 63 70 7,557 6,906 (7,817) (7,217) 0 0
Total revenues 41,823 41,926 48,772 43,351 101,728 89,316 18,203 16,561 7,557 6,906 (7,836) (7,228) 210,247 190,832
Ordinary operating income (EBITANR)
3,919 4,312 5,809 3,279 16,044 9,310 1,405 2,172 (650) 1,783 (13) (711) 26,514 20,145
% of revenues 9.4% 10.3% 11.9% 7.6% 15.8% 10.4% 7.7% 13.1% -8.6% 25.8% 0.2% 9.8% 12.6% 10.6%
Operating result (EBIT)
(1,704) 4,266 5,161 2,804 13,259 8,471 871 1,871 (650) 1,783 (13) (711) 16,924 18,484
% of revenues -4.1% 10.2% 10.6% 6.5% 13.0% 9.5% 4.8% 11.3% -8.6% 25.8% 0.2% 9.8% 8.0% 9.7%
Financial income/(expenses)
192 (552) (731) (179) (2,127) (1,092) (62) (86) 6,012 9,701 (8,319) (8,453) (5,035) (661)
Fiscal income/(expenses)
52 (1,488) (1,635) (1,707) (2,714) (1,722) (306) (621) 570 (1,192) (38) 162 (4,071) (6,568)
Amortisation and depreciation
(1,333) (1,297) (2,048) (2,293) (2,800) (2,992) (687) (423) (698) (772) 0 0 (7,566) (7,777)
EBITDA 4,987 5,477 7,209 4,925 17,975 11,383 1,558 2,294 48 2,555 (13) (711) 31,764 25,923
% of revenues 11.9% 13.1% 14.8% 11.4% 17.7% 12.7% 8.6% 13.9% 0.6% 37.0% 0.2% 9.8% 15.1% 13.6%
R&D expenses (2,675) (2,993) (3,304) (3,289) (6,212) (5,991) (996) (299) (230) (118) 28 31 (13,389) (12,659)
% of revenues -6.4% -7.1% -6.8% -7.6% -6.1% -6.7% -5.5% -1.8% -3.0% -1.7% -0.4% -0.4% -6.4% -6.6%
Reconciliation between EBITDA, EBITANR and profit/(loss) before tax is as follows: 30/06/2011 30/06/2010EBITDA 31,764 25,923Depreciation and write-downs of property, plant and equipment (3,661) (3,926)Amortisation and write-downs of intangible assets (1,589) (1,852)
EBTANR 26,514 20,145Non-recurring costs and revenues (7,414) 338Depreciation & amortisation due to acquisitions (*) (2,176) (1,999)
EBIT (gross earnings) 16,924 18,484Finance income 7,793 10,194Finance charges (13,047) (10,941)Profits from associated companies 219 86
Pre-tax profit/(loss) 11,889 17,823

Datalogic Group
Report on operations at 30/06/2011 8
The operating information relating to the operating segments in the first half of 2011 are compared with the data at 31 December 2010 and are as follows (€'000):
Mobile Automation Scanning Business Development
Other Adjustments
Total group
2011 2010 2011 2010 2011 2010 2011 2010 2011 2010 2011 2010 2011 2010
Total assets 74,943 68,985 74,116 78,609 239,251 240,825 40,228 41,858 390,529 371,924 (342,184) (343,933) 476,883 458,268
Non-current assets
8,642 9,582 17,362 18,437 99,775 107,947 30,332 33,430 26,426 27,007 761 725 183,298 197,128
Equity investments in associates
0 2,380 2,223 2,380 2,223
Total liabilities 53,759 43,524 66,080 73,280 150,787 150,589 10,657 9,279 226,689 203,045 (161,744) (161,613) 346,228 318,104
ANALYSIS OF FINANCIAL AND CAPITAL DATA At 30 June 2011, the net financial position was a negative €71,860 thousand, as follows: 30.06.2011 31.12.2010 30.06.2010
A. Cash and bank deposits 110,195 101,791 88,204B. Other liquidities 726 751 725 b1. restricted cash deposit 726 751 725
C. Securities held for trading 10,014 360 360 c1. Short-term 9,655 1 1
c2. Long-term 359 359 359
D. Cash and equivalents (A) + (B) + (C) 120,935 102,902 89,289E. Current financial receivables 0 120 120F. Other current financial receivables 0 256 136 f1. hedging transactions 0 256 136
G. Bank overdrafts 135 26 81H. Current portion of non-current debt 69,207 47,768 86,992I. Other current financial payables 77 69 452 I1. hedging transactions 77 69 452
J. Current financial debt (G) + (H) +(I) 69,419 47,863 87,525K. Current financial debt, net (J) - (D) - (E) - (F) (51,516) (55,415) (2,020)L. Non-current bank borrowing 122,495 130,187 91,747M. Other non-current financial receivables 0 209N. Other non-current liabilities 881 1,725 2,585 n2. Hedging instruments 881 1,725 2,585
O. Non-current financial debt (L) + (M) + (N) 123,376 131,912 94,123P. Net financial debt (K) + (O) 71,860 76,497 92,103
Note that medium-/long-term loans, classified under current liabilities at 30 June 2010 (€25,000 thousand), owing to non-compliance with the related covenants, were reclassified according to their effective maturities, both at 31 December 2010 and 30 June 2011.

Datalogic Group
Report on operations at 30/06/2011 9
Net debt at 30 June 2011 was €71,860 thousand, an improvement of €4,637 thousand compared with 31 December 2010, when it totalled €76,497 thousand. Note that the following non-recurring transactions were carried out in the period:
• the purchase of treasury shares for €2,824 thousand; • payment of dividends for €8,129 thousand.
Investments were also made in the amount of €3,993 thousand. Net working capital at 30 June 2011 was €26,564 thousand, down €683 thousand compared with 31 December 2010 (€27,247 thousand). The reconciliation between the direct Parent Company’s equity and net profit and the corresponding consolidated amounts is as shown below:
30.06.11 31.12.10 Total equity Period
results Total equity Period results
Datalogic SpA shareholders’ equity and profit 161,175 5,956 165,979 9,451Difference between consolidated companies' net equity and their carrying value in Datalogic SpA's statement; effect of equity-based valuation
8,748 10,895 12,784 24,115
Reversal of dividends 0 (8,356) 0 (14,673)Amortisation of intangible assets "business combination"
(5,827) 0 (5,827) 0
Effect of acquisition under common control (31,733) 0 (31,733) 0Elimination of capital gain on sale of business branch
(3,302) (3,302) 0
Effect of eliminating intercompany transactions (3,732) (612) (3,120) 228Reversal of write-downs and capital gains on equity investments
3,565 0 3,565 (630)
Sale of Know-how (7) 0 (7) 0Goodwill impairment (1,246) (149) (1,097) (298)Other (603) 42 (652) 112Taxes 3,617 42 3,574 (277)Group portion of shareholders' equity 130,655 7,818 140,164 18,028
Datalogic Group
Report on operations at 30/06/2011 10
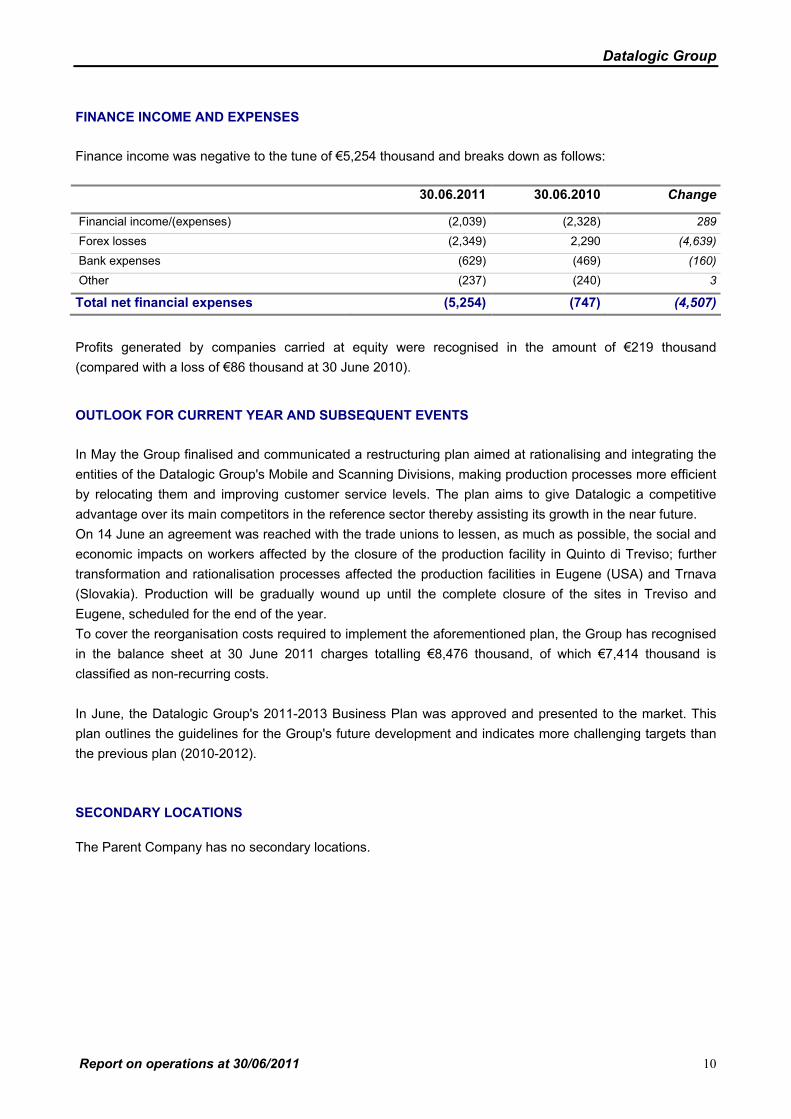
FINANCE INCOME AND EXPENSES Finance income was negative to the tune of €5,254 thousand and breaks down as follows: 30.06.2011 30.06.2010 Change
Financial income/(expenses) (2,039) (2,328) 289 Forex losses (2,349) 2,290 (4,639) Bank expenses (629) (469) (160) Other (237) (240) 3
Total net financial expenses (5,254) (747) (4,507)
Profits generated by companies carried at equity were recognised in the amount of €219 thousand (compared with a loss of €86 thousand at 30 June 2010). OUTLOOK FOR CURRENT YEAR AND SUBSEQUENT EVENTS In May the Group finalised and communicated a restructuring plan aimed at rationalising and integrating the entities of the Datalogic Group's Mobile and Scanning Divisions, making production processes more efficient by relocating them and improving customer service levels. The plan aims to give Datalogic a competitive advantage over its main competitors in the reference sector thereby assisting its growth in the near future. On 14 June an agreement was reached with the trade unions to lessen, as much as possible, the social and economic impacts on workers affected by the closure of the production facility in Quinto di Treviso; further transformation and rationalisation processes affected the production facilities in Eugene (USA) and Trnava (Slovakia). Production will be gradually wound up until the complete closure of the sites in Treviso and Eugene, scheduled for the end of the year. To cover the reorganisation costs required to implement the aforementioned plan, the Group has recognised in the balance sheet at 30 June 2011 charges totalling €8,476 thousand, of which €7,414 thousand is classified as non-recurring costs. In June, the Datalogic Group's 2011-2013 Business Plan was approved and presented to the market. This plan outlines the guidelines for the Group's future development and indicates more challenging targets than the previous plan (2010-2012). SECONDARY LOCATIONS The Parent Company has no secondary locations.

ASSETS (Euro/000) Note 30.06.2011 31.12.2010A) NON-CURRENT ASSETS (1+2+3+4+5+6+7) 211.102 223.8611) Tangible assets 48.548 50.042 Land 1 4.958 5.050 Buildings 1 23.308 23.688 Other assets 1 18.544 19.787 Assets in progress and payments on account 1 1.738 1.5172) Intangible assets 134.750 147.086 Goodwill 2 99.076 106.088 Development costs 2 71 119 Other 2 34.951 40.754 Assets in progress and payments on account 2 652 1253) Investments in associates 3 2.380 2.2234) Financial assets available for sale (AFS) 1.634 1.422 Investments in non-controlling interests 5 1.275 1.063 Securities 5 359 3595) Loans 0 06) Trade and other receivables 7 1.198 1.2917) Deferred tax assets 13 22.592 21.797B) CURRENT ASSETS (8+9+10+11+12+13+14) 265.781 234.4078) Inventories 54.520 45.308 raw and ancillary materials and consumables 8 26.022 22.663 work in progress and semi-finished products 8 9.421 7.683 finished products and goods 8 19.077 14.9629) Trade and other receivables 7 85.655 80.475Trade receivables 7 74.069 69.353 within 12 months 7 71.545 66.581 of which to associates 7 2.513 2.761 of which to the parent company 7 11 of which to related parties 7 11Other receivables - accrued income and prepayments 7 11.586 11.12210) Tax receivables 9 5.030 5.705of which to the parent company 478 1.41611) Financial assets available for sale (ST) 5 9.655 1 Securities 9.655 112) Loans 120 of which to associates 12013) Financial assets - Derivatives 6 25614) Cash and cash equivalents 10 110.921 102.542TOTAL ASSETS (A+B) 476.883 458.268
CONSOLIDATED STATEMENT OF FINANCIAL POSITION
11

LIABILITIES (Euro/000) Note 30.06.2011 31.12.2010A) TOTAL SHAREHOLDERS' EQUITY ATTRIBUTABLE TO OWNERS OF PARENT (1+2+3+4+5) 130.655 140.164
1) Share capital 11 119.875 122.6992) Reserves 11 (15.711) (9.331)3) Retained earnings 11 18.673 8.7684) Group profit (loss) for the period/year 11 7.818 18.0285) Total shareholders' equity attributable to non-controlling interests 11
B) NON-CURRENT LIABILITIES (6+7+8+9+10+11+12) 158.168 166.0006) Financial debt 12 122.495 130.1877) Financial liabilities - Derivatives 6 881 1.7258) Tax liabilities 33 1649) Deferred tax liabilities 13 14.157 15.53610) Employees termination indemnities 14 7.004 7.12111) Provisions for risks and charges 15 12.228 9.82312) Other liabilities 16 1.370 1.444C) CURRENT LIABILITIES (13+14+15+16+17) 188.060 152.10413) Trade and other payables 16 98.009 90.598 Trade payables 16 64.511 56.688 within 12 months 16 64.249 56.297 of which to associates 16 63 125 of which to related parties 16 199 265Other payables – accrued liabilities and deferred income 16 33.498 33.91014) Tax liabilities 10.176 10.028 of which to the parent company 5.222 4.23115) Provisions for risks and charges 15 10.456 3.61516) Financial liabilities - Derivatives 6 77 6917) Financial debt 12 69.342 47.794TOTAL LIABILITIES (A+B+C) 476.883 458.268
CONSOLIDATED STATEMENT OF FINANCIAL POSITION
12

(Euro/000) Note 30.06.2011 30.06.20101) TOTAL REVENUES 17 210.247 190.832Revenues from sale of products 200.985 183.393Revenues for services 9.262 7.4392) Cost of goods sold 18 116.221 103.218 of which non-recurring 18 4.789 (80)GROSS PROFIT (1-2) 94.026 87.6143) Other operating revenues 19 1.780 606 of which non-recurring 19
4) R&D expenses 18 13.769 12.659 of which non-recurring 18 3805) Distribution expenses 18 41.327 36.821 of which non-recurring 18 1.9556) General and administrative expenses 18 22.907 19.586 of which non-recurring 18 290 of which amortisation pertaining to acquisitions 18 2.176 1.9997) Other operating expenses 18 879 670 of which non-recurring 18 (258)Total operating costs 78.882 69.736OPERATING RESULT 16.924 18.4848) Financial income 20 7.793 10.1949) Financial expenses 20 13.047 10.941Financial management result (8-9) (5.254) (747)10) Share of profits of associates 3 219 86INCOME/(LOSS) BEFORE INCOME TAXES 11.889 17.823Income taxes 21 4.071 6.568Ne income/(loss) for the period 7.818 11.255Basic earnings/(loss) per share (€) 22 0,1441 0,2050
Diluted earnings/(loss) per share (€) 22 0,1441 0,2050
CONSOLIDATED STATEMENT OF INCOME
13

(Euro/000) Note 30.06.2011 30.06.2010NET INCOME/(LOSS) FOR THE PERIOD 7.818 11.255Other components of the comprehensive statement of income:Profit/(loss) on cash flow hedges 11 421 (252)Profit/(loss) due to translation of the accounts of foreign companies 11 (6.801) 14.861Profit/(loss) on exchange rate adjustments for financial assets available for sale 11 0 62
Total other profit/(loss) net of the tax effect (6.380) 14.671COMPREHENSIVE NET PROFIT/(LOSS) FOR THE PERIOD 1.438 25.926Attributable to:Owners of the parent 1.438 25.926Non-controlling interests shareholders 0 0
CONSOLIDATED STATEMENT OF COMPREHENSIVE INCOME
14

(Euro/000) 30.06.2011 30.06.2010Net income/(loss) for the period 11.889 17.823Amortisation and depreciation of tangible and intangible assets and write-downs 7.566 7.777Change in employee benefits reserve (117) (638)Provision for doubtful accounts 183 308Net financial expenses/(income) including exchange rate differences 5.254 747Adjustments to value of financial assets (219) (86)Cash flow from operations before changes in working capital 24.556 25.931Change in trade receivables (net of provisions) (4.899) (12.544)Change in inventories (9.212) (8.184)Change in other current assets (464) (1.487)Other medium-/long-term assets 93 (644)Change in trade payables 7.823 8.152Change in other current liabilities (412) 7.797Other medium-/long-term liabilities (74) 261Change in provisions for risks and charges 9.246 1.090Commercial foreign exchange gains/(losses) 71 (855)Foreign exchange effect of working capital (748) 2.209Cash flow from operations after changes in working capital 25.980 21.726Change in tax (5.553) (1.974)Foreign exchange effect of tax (302) 272Interest paid and banking expenses (2.905) (3.037)Cash flow provided by operating activities (A) 17.220 16.987(Increase)/decrease in intangible assets excluding exchange rate effect (843) (3.322)(Increase)/decrease in tangible assets excluding exchange rate effect (3.150) (576)Change in unconsolidated equity interests (150) (274)Net cash used in investing activities (B) (4.143) (4.172)Change in LT/ST financial receivables (9.253) (343)Change in short-term and medium-/long-term financial debt 27.911 9.158Financial foreign exchange gains/(losses) (2.420) 3.145Purchase of treasury shares (2.824) (569)Change in reserves and exchange rate effect of financial assets/liabilities, equity and tangible and intangible assets (*) 4.933 (6.996)
Dividend payment (8.129)Net cash provided (used in) financing activities (C) 10.218 4.395Net increase (decrease) in cash and cash equivalent (A+B+C) 23.295 17.210Net cash and cash equivalents at start of period (Note 10) 83.234 70.913Cash and cash equivalents at end of period (Note 10) 106.529 88.123
CONSOLIDATED STATEMENT OF CASH FLOW
15
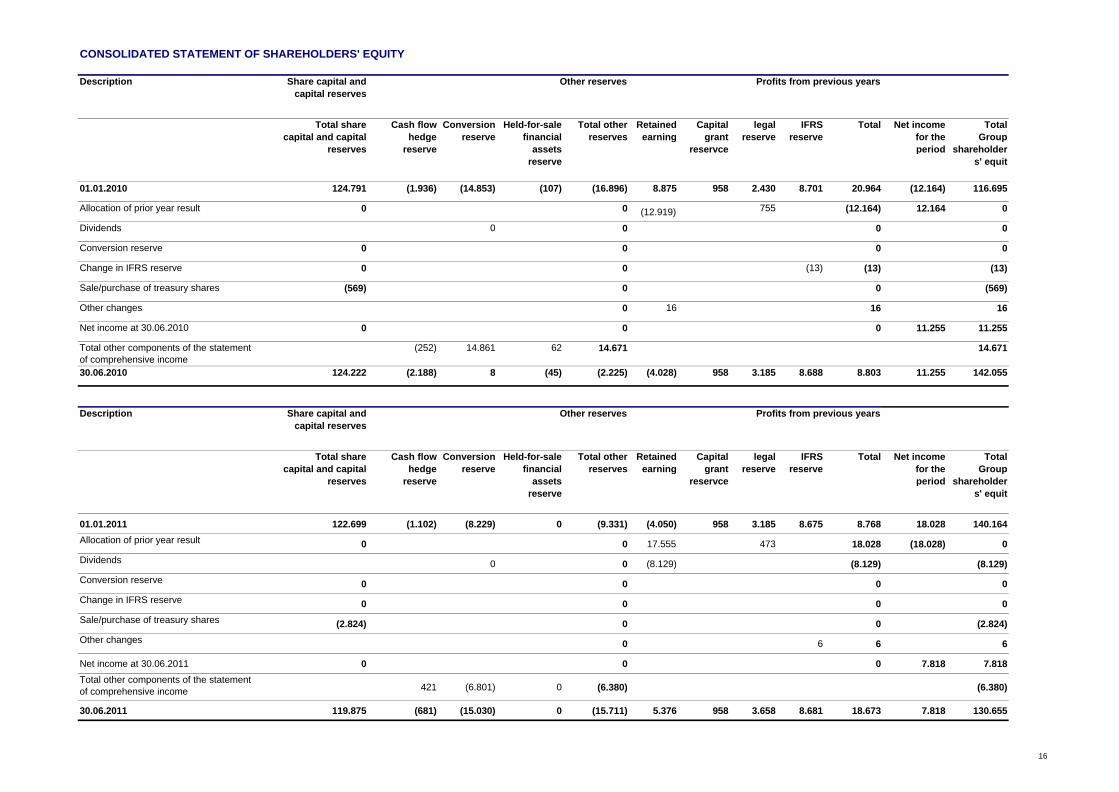
CONSOLIDATED STATEMENT OF SHAREHOLDERS' EQUITY
Description
Total share capital and capital
reserves
Cash flow hedge
reserve
Conversion reserve
Held-for-sale financial
assets reserve
Total other reserves
Retained earning
Capital grant
reservce
legal reserve
IFRS reserve
Total Net income for the period
Total Group
shareholders' equit
01.01.2010 124.791 (1.936) (14.853) (107) (16.896) 8.875 958 2.430 8.701 20.964 (12.164) 116.695
Allocation of prior year result 0 0 (12.919) 755 (12.164) 12.164 0
Dividends 0 0 0 0
Conversion reserve 0 0 0 0
Change in IFRS reserve 0 0 (13) (13) (13)
Sale/purchase of treasury shares (569) 0 0 (569)
Other changes 0 16 16 16
Net income at 30.06.2010 0 0 0 11.255 11.255
Total other components of the statement of comprehensive income
(252) 14.861 62 14.671 14.671
30.06.2010 124.222 (2.188) 8 (45) (2.225) (4.028) 958 3.185 8.688 8.803 11.255 142.055
Description
Total share capital and capital
reserves
Cash flow hedge
reserve
Conversion reserve
Held-for-sale financial
assets reserve
Total other reserves
Retained earning
Capital grant
reservce
legal reserve
IFRS reserve
Total Net income for the period
Total Group
shareholders' equit
01.01.2011 122.699 (1.102) (8.229) 0 (9.331) (4.050) 958 3.185 8.675 8.768 18.028 140.164Allocation of prior year result 0 0 17.555 473 18.028 (18.028) 0Dividends 0 0 (8.129) (8.129) (8.129)Conversion reserve 0 0 0 0Change in IFRS reserve 0 0 0 0Sale/purchase of treasury shares (2.824) 0 0 (2.824)Other changes 0 6 6 6
Net income at 30.06.2011 0 0 0 7.818 7.818Total other components of the statement of comprehensive income 421 (6.801) 0 (6.380) (6.380)
30.06.2011 119.875 (681) (15.030) 0 (15.711) 5.376 958 3.658 8.681 18.673 7.818 130.655
Share capital and capital reserves
Other reserves Profits from previous years
Share capital and capital reserves
Other reserves Profits from previous years
16

Datalogic Group
Consolidated Half-Year Financial Report at 30/06/2011 – Explanatory notes 17
EXPLANATORY NOTES TO THE CONSOLIDATED FINANCIAL STATEMENTS
INTRODUCTION The Datalogic Group deals with the production and marketing of handheld readers, fixed scanners for the industrial market, mobile computers, fixed scanners for the retail market and sensors. The Group also deals with radiofrequency readers (RFID), self-scanning solutions and products for industrial marking. Datalogic S.p.A. (hereinafter “Datalogic”, the “Parent Company” or the “Company”) is a joint-stock company listed on the STAR segment of Borsa Italiana, with its registered office in Italy. The address of the registered office is Via Candini, 2 - Lippo di Calderara (BO). The Company is a subsidiary of Hydra SpA, which is also based in Bologna and is controlled by the Volta family. This Consolidated Half-Year Financial Report at 30 June 2011 includes the figures of the Parent Company and its subsidiaries (defined hereinafter as the “Group”) and its minority interests in associated companies. These consolidated financial statements for the half year to 30 June 2011 were prepared by the Board of Directors on 29 July 2011.
PRESENTATION AND CONTENT OF THE CONSOLIDATED FINANCIAL STATEMENTS The consolidated financial statements at 30 June 2011 have been prepared in an abridged form in compliance with IAS 34 "Interim Financial Reporting", providing the summary notes set forth by the international accounting principles, integrated where possible to provide a higher level of disclosure where necessary. As such, this Half-Year Financial Report should be considered together with the consolidated financial statements and related notes presented at 31 December 2010 and prepared in accordance with International Financial Reporting Standards (IFRSs) adopted by the European Union.
Accounts The accounts used are consistent with those envisaged by IAS 1 and used in the consolidated financial statements for the year to 31 December 2010; specifically:
• in the consolidated statement of financial position, assets and liabilities are classified according to whether they are current or non-current;
• in the consolidated statement of income, operating costs are classified by function, as this presentation was deemed more suitable for representing the Group's specific businesses, complying with the internal reporting method;
• the statement of comprehensive income includes, in addition to profit for the period, as in the consolidated income statement, other changes in Shareholders' Equity excluding those with Shareholders;
• The consolidated statement of cash flow shows the cash flows resulting from operating activities using the "indirect method”, as allowed by IAS 7.
In addition, as required by Consob decision no. 15519 of 27 July 2006, in the consolidated income statement, the gains and charges from non-recurring operations have been specifically identified and the

Datalogic Group
Consolidated Half-Year Financial Report at 30/06/2011 – Explanatory notes 18
related effects on the main intermediate levels of the result have been shown separately. Non-recurring events and transactions are chiefly identified based on the type of operation. In particular, items are included in non-recurring charges/gains which, due to their nature, are not continuously checked in the course of normal operating activities (e.g. gains/charges from business combinations and charges/gains from corporate reorganisation processes).
Principles for preparation of the financial statements When preparing the interim financial statements management must make estimates and assumptions affecting the value of the revenues, costs, assets and liabilities on the balance sheet and which relate to information on potential assets and liabilities at the reporting date. The estimates are used to recognise provisions for doubtful accounts, obsolescent inventories, depreciation and amortisation and, as from the current period, the risks posed by the corporate reorganisation. If in the future these estimates and assumptions, which are based on management's best evaluations, were to differ from actual circumstances, they would be amended as appropriate in the period in which the circumstances themselves change. For a more in-depth description of the most appropriate evaluation processes for the Group, see the section entitled Use of Estimates in the Consolidated Financial Statements at 31 December 2010. It should also be noted that these evaluation processes, in particular the most complex ones, such as the determination of impairment of non-current assets, are generally only carried out in full at the time of drafting the annual report, when all the information that may be required is available, except in cases in which there are impairment indicators requiring immediate evaluation of any impairment. The actuarial valuations necessary to determine the reserves for employee benefits are also normally processed at the time of drafting the annual report. Income taxes were recognised based on the best estimate of the average weighted tax rate expected for the entire year. The accounting policies adopted in this condensed consolidated half-year financial report comply with the policies used for the consolidated financial statements at 31 December 2010, except for the adoption on 1 January 2011 of the new principles and interpretations listed below: • IAS 24 - Related Party Disclosures (Amendment) The IASB issued an amendment to IAS 24 which clarifies the definition of related parties. The new definition emphasises
the balance in identifying related subjects and defines more clearly the circumstances under which persons and
executives with strategic responsibilities must be considered to be related parties. The amendment also introduces an
exemption from the general disclosure requirements regarding related parties for transactions between a government-
controlled reporting entity and that government or other entities controlled by that government. Adoption of the
amendment has had no impact on the Group's financial position or results.
• IAS 32 – Financial Instruments: Presentation (Amendment) This standard includes an amendment to the definition of financial liabilities for the classification of rights issues in foreign
currencies (and some options and warrants) as capital instruments if these instruments are allocated pro rata to all
holders of the same class of a (non-derivative) instrument representing the entity's capital, or for the purchase of a fixed
number of instruments representing the capital of the entity for a fixed amount in any currency. The amendment has had
no impact on the Group’s financial position or results.

Datalogic Group
Consolidated Half-Year Financial Report at 30/06/2011 – Explanatory notes 19
• IFRIC 14 – Prepayments of a minimum funding requirement (Amendment) The amendment removes an unintentional consequence found when an entity is subject to minimum funding
requirements and makes an early payment of contributions to cover these requirements. The amendment permits such
an entity to treat the benefit of such an early payment as an asset. The Group is not subject to minimum funding
requirements in Europe, therefore this amendment has had no impact on the Group's financial position or results. • Improvements to IFRS (issued in May 2010) In May 2010 the IASB issued a third series of improvements to the standards, primarily to eliminate existing
inconsistencies and to clarify their terminology. There are specific transitional rules for every standard. Adoption of the
following improvements has resulted in changes to accounting policies but has had no effect on the Group's balance
sheet or results:
− IFRS 3 Business Combinations: The options available for measuring non-controlling interests have been amended. It is
possible to measure at fair value or alternatively in relation to the proportionate share of the identifiable net assets of the
purchased company only the components of the non-controlling interests which represent an effective equity stake which
guarantees the holders a proportional share of the company's net assets in the event of liquidation. All the other
components must be assessed at fair value on the purchase date.
− IFRS 7 Financial instruments: Disclosures: the amendment is aimed at simplifying and improving information by,
respectively, reducing the volume of information relating to guarantees held and requesting more qualitative information to
better contextualise the quantitative part.
− IAS 1 Presentation of Financial Statements: the amendment explains that an analysis of each of the other components of
the statement of comprehensive income can be included, as an alternative, in the statement of changes in shareholders'
equity or in the notes to the financial statements.
− IAS 34 Interim Financial Reporting: the amendment requires additional information to be given on fair value, changes in the
classification of financial assets and changes in potential assets and liabilities in interim financial reporting.
The following amendments to the standards have had no impact on the Group's accounting policies, financial position or results:
• IFRS 3 Business Combinations – the amendment explains that amounts potentially generated by business combinations prior to adoption of IFRS 3 (as amended in 2008) are recognised in accordance with IFRS 3 (2005)
• IFRS 3 Business Combinations – share-based payments (voluntarily substituted or not substituted) and their accounting treatment in the context of a business combination
• IAS 27 Consolidated and Separate Financial Statements – application of the transitional rules for IAS 27 (reviewed in 2008) to the consequently amended standards
• IFRIC 13 Customer Loyalty Programmes – in determining the fair value of awards, an entity must
consider discounts and incentives that would otherwise be offered to customers not participating in the loyalty
programme.
The Group has not chosen early adoption of any other standards, interpretations or improvements issued but not yet in force. In addition, since the Group will recognise restructuring provisions from 30 June 2011 onwards, the criterion adopted is shown below:

Datalogic Group
Consolidated Half-Year Financial Report at 30/06/2011 – Explanatory notes 20
Restructuring provision The Group recognises restructuring provisions in the event that there is an implicit restructuring obligation and there exists a formal programme for restructuring which has raised a valid expectation in those affected that the company will carry out the restructuring, or if it has already begun the restructuring, or if it has already announced the main features of the restructuring plan to those affected by it. SCOPE OF CONSOLIDATION The Consolidated Half-Year Financial Report includes the statements of the direct parent company and of the companies in which the former directly or indirectly holds the majority of voting rights. The companies consolidated on a line-by-line basis for the period ended 30 June 2011 are as follows:
Company Registered office Share capital Total shareholders’ equity (€‘000)
Profit/loss for the period
(€'000)
% ownership
Datalogic SPA holding Bologna – Italy Euro 30,392,175 161,175 5,956
Datalogic Real Estate Srl Bologna – Italy Euro 20,000 2,583 (73) 100%
Datalogic Real Estate France Sa Paris – France Euro 2,227,500 3,541 26 100%
Datalogic Real Estate Germany GmbH
Erkenbrechtsweiler – Germany
Euro 1,025,000 1,971 (40) 100%
Datalogic Real Estate UK Ltd Redbourn – England GBP 3,500,000 3,979 63 100%
Informatics Inc. Plano Texas – USA US$ 9,996,000 13,101 937 100%
Evolution Robotics Retail Inc. Pasadena – USA US$ 1 16,469 (434) 100%
Datalogic Automation Srl Monte San Pietro (BO) – Italy Euro 10,000,000 5,809 2,098 100%
Datalogic Sweden AB Malmö – Sweden KRS 200,000 275 (9) 100%
Datalogic Automation INC Hebron, KY – USA US$ 463,812 2,897 297 100%
Datalogic Automation PTY LTD Mount Waverley (Melbourne) – Australia
$AUD 2,300,000 (637) 127 100%
Datalogic Automation Asia Limited
Hong Kong - China HKD 7,000,000 (227) 130 100%
Datafoton kft Fonyod – Hungary HUF 3,000,000 167 50 51%
Datalogic Mobile Srl Bologna – Italy Euro 10,000,000 17,760 (851) 100%
Datalogic Mobile Asia Hong Kong - China HKD 100,000 76 1 100%
Datalogic Mobile INC Eugene, OR – USA US$ 1 5,983 80 100%
Datalogic Mobile PTY Mount Waverley (Melbourne) – Australia
$AUD - (849) (73) 100%
Datalogic Scanning Group Srl Bologna – Italy Euro 10,000,000 97,391 1,557 100%
Datalogic Scanning Slovakia Tvrn – Slovakia Euro 66,390 11,979 5,193 100%
Datalogic Scanning Holdings Inc. Eugene, OR – USA US$ 100 71,169 (718) 100%
Datalogic Scanning Inc. Eugene, OR – USA US$ 10 37,401 1,149 100%
Datalogic Scanning do Brasil Sao Paulo, SP - Brazil R$ 159,525 (90) (24) 100%
Datalogic Scanning Mexico Colonia Cuauhtemoc – Mexico US$ - (876) (124) 100%
Datalogic Scanning UK Ltd Watford – England GBP 191,510 (728) 285 100%
Datalogic Scanning Sarl Paris – France Euro 653,015 1,242 452 100%
Datalogic Scanning GMBH Darmstadt – Germany Euro 306,775 3,425 779 100%
Datalogic Scanning Eastern Europe Gmbh
Darmstadt – Germany Euro 30,000 302 50 100%
Datalogic Scanning SpA Milan – Italy Euro 110,000 1,302 78 100%
Datalogic Scanning PTY Sydney – Australia $AUD 2 981 (109) 100%
Datalogic Scanning Japan Tokyo – Japan JPY 151,437,000 (467) 53 100%
Datalogic Scanning Vietnam LLC Vietnam VND 27,714,555,000 1,243 967 100%
Datalogic Scanning Singapore Singapore SGD 100,000 87 9 100%

Datalogic Group
Consolidated Half-Year Financial Report at 30/06/2011 – Explanatory notes 21
The following companies were consolidated at equity at 30 June 2011:
Company Registered office
Share capital Total shareholders’ equity (€‘000)
Profit/loss for the period (€'000)
% ownership
Idec DatalogicCo. Ltd
Osaka – Japan Yen 300,000,000
1,856 88 50%
Laservall Asia Co. Ltd
Hong Kong – China HKD 460,000
2,648 350 50%
SEGMENT INFORMATION Operating segments are identified based on the internal statements used by senior management to allocate resources and evaluate results. The Group does business in the following operating segments: Mobile – includes the Mobile Computers (MC) product lines and the self-scanning solutions. Automation – includes product lines related to: fixed scanners for the industrial market (USS), industrial marking products, radio frequency scanners (RFID) and photoelectrical sensors and devices. Scanning – includes product lines related to: hand-held readers (HHR) and checkout scanners for the retail market. Business Development – includes distribution of products for automatic identification. As well as Informatics Inc., this segment includes Evolution Robotics Retail Inc., acquired on 1 July 2010. Other – includes the Group's corporate and real estate activities. Intersegment sales transactions are executed at arm's length conditions, based on the Group transfer pricing policies.

Datalogic Group
Consolidated Half-Year Financial Report at 30/06/2011 – Explanatory notes 22
The financial information relating to operating segments at 30 June 2011 and 30 June 2010 are as follows (€'000): Mobile Automation Scanning Business
Development Other Adjustments Total group
2011 2010 2011 2010 2011 2010 2011 2010 2011 2010 2011 2010 2011 2010
External sales 41,800 41,871 48,598 43,165 101,665 89,246 18,203 16,561 (19) (11) 210,247 190,832
Intersegment sales 23 55 174 186 63 70 7,557 6,906 (7,817) (7,217) 0 0
Total revenues 41,823 41,926 48,772 43,351 101,728 89,316 18,203 16,561 7,557 6,906 (7,836) (7,228) 210,247 190,832
Ordinary operating income (EBITANR)
3,919 4,312 5,809 3,279 16,044 9,310 1,405 2,172 (650) 1,783 (13) (711) 26,514 20,145
% of revenues 9.4% 10.3% 11.9% 7.6% 15.8% 10.4% 7.7% 13.1% -8.6% 25.8% 0.2% 9.8% 12.6% 10.6%
Operating result ( EBIT)
(1,704) 4,266 5,161 2,804 13,259 8,471 871 1,871 (650) 1,783 (13) (711) 16,924 18,484
% of revenues -4.1% 10.2% 10.6% 6.5% 13.0% 9.5% 4.8% 11.3% -8.6% 25.8% 0.2% 9.8% 8.0% 9.7%
Financial income/(expenses)
192 (552) (731) (179) (2,127) (1,092) (62) (86) 6,012 9,701 (8,319) (8,453) (5,035) (661)
Fiscal income/(expenses)
52 (1,488) (1,635) (1,707) (2,714) (1,722) (306) (621) 570 (1,192) (38) 162 (4,071) (6,568)
Amortisation and depreciation
(1,333) (1,297) (2,048) (2,293) (2,800) (2,992) (687) (423) (698) (772) 0 0 (7,566) (7,777)
EBITDA 4,987 5,477 7,209 4,925 17,975 11,383 1,558 2,294 48 2,555 (13) (711) 31,764 25,923
% of revenues 11.9% 13.1% 14.8% 11.4% 17.7% 12.7% 8.6% 13.9% 0.6% 37.0% 0.2% 9.8% 15.1% 13.6%
R&D expenses (2,675) (2,993) (3,304) (3,289) (6,212) (5,991) (996) (299) (230) (118) 28 31 (13,389) (12,659)
% of revenues -6.4% -7.1% -6.8% -7.6% -6.1% -6.7% -5.5% -1.8% -3.0% -1.7% -0.4% -0.4% -6.4% -6.6%
Reconciliation between EBITDA, EBITANR and profit/(loss) before tax is as follows:
30/06/2011 30/06/2010EBITDA 31,764 25,923Depreciation and write-downs of property, plant and equipment (3,661) (3,926)Amortisation and write-downs of intangible assets (1,589) (1,852)
EBITANR 26,514 20,145Non-recurring costs and revenues (7,414) 338Depreciation & amortisation due to acquisitions (*) (2,176) (1,999)
EBIT (gross earnings) 16,924 18,484Finance income 7,793 10,194Finance charges (13,047) (10,941)Profits from associated companies 219 86
Pre-tax profit/(loss) 11,889 17,823
(*) EBITDA is a performance indicator not defined under IFRS. However, Datalogic’s management uses it to monitor and assess the company’s operating
performance as it is not influenced by the volatility due to the various valuation criteria used to determine taxable income, by the total amount and nature of

Datalogic Group
Consolidated Half-Year Financial Report at 30/06/2011 – Explanatory notes 23
the capital involved or by the related depreciation and amortisation policies. Datalogic defines it as Profit/loss for the period before depreciation and
amortisation of tangible and intangible assets, non-recurring costs, financial income and expenses and income taxes. The balance sheet information relating to operating sectors at 30 June 2011 and 31 December 2010 are as follows (€'000): Mobile Automation Scanning Business
Development Other Adjustments Total group
2011 2010 2011 2010 2011 2010 2011 2010 2011 2010 2011 2010 2011 2010
Total assets 74,943 68,985 74,116 78,609 239,251 240,825 40,228 41,858 390,529 371,924 (342,184) (343,933) 476,883 458,268
Non-current assets
8,642 9,582 17,362 18,437 99,775 107,947 30,332 33,430 26,426 27,007 761 725 183,298 197,128
Equity investments in associates
0 2,380 2,223 2,380 2,223
Total liabilities 53,759 43,524 66,080 73,280 150,787 150,589 10,657 9,279 226,689 203,045 (161,744) (161,613) 346,228 318,104

Datalogic Group
Consolidated Half-Year Financial Report at 30/06/2011 – Explanatory notes 24
INFORMATION ON THE STATEMENT OF FINANCIAL POSITION
Note 1. Tangible assets The breakdown of the item at 30 June 2011 and 31 December 2010 is as follows:
30.06.2011 31.12.2010 ChangeLand 4,958 5,050 (92)Buildings 23,308 23,688 (380)Other assets 18,544 19,787 (1,243)Assets in progress and payments on account 1,738 1,517 221
Total 48,548 50,042 (1,494)
Changes at 30 June 2011 are as follows:
Land Buildings Other assets
Assets in progress and payments on
account
Total
Historical cost 5,050 26,090 94,453 1,517 127,110Accumulated amortisation 0 (2,402) (74,666) 0 (77,068)
Net initial value at 01.01.11 5,050 23,688 19,787 1,517 50,042Increases 30.06.11 Investments 139 2,789 428 3,356
Total 0 139 2,789 428 3,356Decreases 30.06.11 Disposals historical cost (1,667) (83) (1,750)Disposals accum. depreciation 1,572 1,572Amortisation (209) (3,592) (3,801)
Total 0 (209) (3,687) (83) (3,979)Reclass. & other changes 30.06.11 Incoming transfers 0(Outgoing transfers) (8) (20) (28)Forex historical cost (92) (348) (1,225) (104) (1,769)Forex accum. amortisation 38 888 926
Total (92) (310) (345) (124) (871)Historical cost 4,958 25,881 94,342 1,738 126,919Accumulated amortisation 0 (2,573) (75,798) 0 (78,371)
Net closing value at 30.06.11 4,958 23,308 18,544 1,738 48,548
The “Other assets” item at 30 June 2011 mainly includes the following categories: Plant and machinery (€6,227 thousand), Trade and industrial equipment (€4,855 thousand), Office furniture and machines (€4,811 thousand), General plant (€1,769 thousand), Motor vehicles (€220 thousand), and Maintenance on third-party assets (€398 thousand). During the half the Group made investments totalling €3,356 thousand; of these, the most significant in the "Other assets" item is mainly connected to completion of the new production lines, which have been operational since June, at the facility in Vietnam.

Datalogic Group
Consolidated Half-Year Financial Report at 30/06/2011 – Explanatory notes 25
The useful lives of some assets included in the "Other assets" category, mainly relating to the production site in Treviso, which the Group leased, have been reviewed in accordance with the reorganisation plan which will result in the closure of this site. The revised useful lives have been recognised in accordance with the provisions of IAS 8. The impact on the income statement at 30 June 2011 amounts to €141 thousand and will be used up during 2011. The balance of “Assets in progress and payments on account” mainly comprises down payments for equipment, instruments and moulds for normal production activities.
Note 2. Intangible assets The breakdown of the item at 30 June 2011 and 31 December 2010 are as follows:
30.06.2011 31.12.2010 ChangeGoodwill 99,076 106,088 (7,012)Development costs 71 119 (48)Other 34,951 40,754 (5,803)Assets in progress and payments on account 652 125 527
Total 134,750 147,086 (12,336)
Changes at 30 June 2011 are as follows:
Goodwill Development costs
Other Assets in progress and payments on
account
Total
Historical cost 106,088 6,912 85,855 125 198,980Accumulated amortisation (6,793) (45,101) (51,894)Net initial value at 01.01.11 106,088 119 40,754 125 147,086Increases 30.06.11 Investments 316 527 843Total 0 0 316 527 843Decreases 30.06.11 Disposals historical cost (390) (390)Disposals accum. depreciation 390 390Amortisation (48) (3,568) (3,616)Write-downs (149) (149)Total (149) (48) (3,568) 0 (3,765)Reclass. & other changes 30.06.11 Incoming transfers 0(Outgoing transfers) 0Forex historical cost (6,863) (17) (3,951) (10,831)Forex accum. amortisation 17 1,400 1,417Total (6,863) 0 (2,551) 0 (9,414)Historical cost 107,013 6,895 81,830 652 196,390Accumulated amortisation (7,937) (6,824) (46,879) 0 (61,640)Net closing value at 30.06.11 99,076 71 34,951 652 134,750

Datalogic Group
Consolidated Half-Year Financial Report at 30/06/2011 – Explanatory notes 26
Goodwill, totalling €99,076 thousand, consisted of the following items:
30.06.2011 31.12.2010 ChangeFormer PSC Group – Acquisition executed on 30 November 2005 64,976 70,123 (5,147)Informatics Inc. - Acquisition executed on 28 February 2005 11,096 11,777 (681)Laservall SpA - Acquisition executed on 27 August 2004 5,119 5,119 0Idware Srl – Incorporated in 1998 3,380 3,380 0Infra – Goodwill recognised following the acquisition of Datasensor 1,682 1,682 0Gruppo Minec - Acquisition executed on 15 July 2002 147 296 (149)Evolution Robotics Retail Inc. - Acquisition executed on 1 July 2010 12,676 13,711 (1,035)
Total 99,076 106,088 (7,012)
Goodwill has been allocated to the CGUs (cash generating units) corresponding to the individual companies and/or sub-groups to which they pertain. Specifically, goodwill related to the PSC Group acquisition was allocated to two different cash generating units for the purposes of impairment: Datalogic Scanning Inc., for about $78.5 million, and Datalogic Mobile Inc., for about $12.5 million. As highlighted in the paragraph included in the section on accounting standards and policies used in the financial statements for the year ended 31 December 2010, to which reference should be made, in compliance with IAS 38 goodwill has not been amortised since 1 January 2004 but is tested for impairment each year unless loss indicators suggest the need for more frequent impairment testing. The recoverable value of each CGU, associated with each Goodwill item measured, consists of its corresponding value in use. Value in use is calculated by discounting the future cash flows generated by the CGU – during production and at the time of its retirement – to present value using a certain discount rate, based on the DCF (discounted cash flow) method. At 30 June 2011, no write-downs were made, except for the goodwill of the Minec Group, written down by €149 thousand. “Development costs”, which amount to €71 thousand, consist of specific development projects capitalised when they meet IAS 38 requirements and in compliance with Group policies, which call for the capitalisation only of projects relating to development of products featuring significant innovation. The “Other intangible assets” item, which amounts to €34,951 thousand, mainly consists of intangible assets acquired as part of the business combinations completed by the Group and specifically identified and valued in purchase accounting of the deals. Details are shown in the following table:

Datalogic Group
Consolidated Half-Year Financial Report at 30/06/2011 – Explanatory notes 27
30.06.2011 31.12.2010 USEFUL LIFE
(YEARS)Acquisition of the PSC Group (executed on 30 November 2006) 22,713 25,572 PATENTS 20,296 22,710 20TRADEMARK 1,210 1,454 10CLIENT PORTFOLIO 1,207 1,408 10
Acquisition of Laservall SPA (executed on 27 August 2004) 1,325 1,972 UNPATENTED TECHNOLOGY 0 426 7COMMERCIAL STRUCTURE 1,325 1,546 10
Acquisition of Informatics Inc. (executed on 28 February 2005) 2,029 2,494 COMMERCIAL STRUCTURE 2,029 2,494 10
Acquisition of Evolution Robotics Retail Inc. (executed on 1 July 2010) 4,362 4,980 PATENTS 727 830 10TRADE SECRETS 3,635 4,150 10
Licence agreement 629 1,349 5
Other 3,893 4,387 TOTAL OTHER INTANGIBLE ASSETS 34,951 40,754
The “Others” item mainly consists of software licenses. The increase in the item “Assets in progress and down payments”, is attributable for €505 thousand to the capitalisation of costs relating to a project possessing the features required by IAS 38 and Group policies, and still being completed.
Note 3. Equity investments in associates Equity investments owned by the Group as at 30 June 2011 were as follows:
31.12.2010 Increases Decreases Forex differences
Share of profit
30.06.2011
Associate companies Idec Datalogic Co.Ltd 946 (62) 44 928Laservall Asia Co. Ltd 1,149 175 1,324Datalogic Automation AB 2 2Datasensor UK 42 42Special Video 29 29Datasensor Gmbh 45 45DL PRIVATE India 10 10
Total associates 2,223 0 0 (62) 219 2,380TOTAL 2,223 0 0 (62) 219 2,380
The change in “Associates” is due to the Group’s share of the results achieved by the associates Idec Datalogic Co. Ltd. and Laservall Asia Co. and to exchange rate adjustments.

Datalogic Group
Consolidated Half-Year Financial Report at 30/06/2011 – Explanatory notes 28
Note 4. Financial instruments by category The items on the statement of financial position coming within the scope of “financial instruments” as defined by IAS/IFRSs are as follows: 30.06.2011 Loans and
receivablesHeld for trading Availability
for sale Total
Non-current financial assets 1,198 359 1,275 2,832Financial assets – equity investments (5) 1,275 1,275Financial assets - securities 359 359Other receivables (7) 1,198 1,198
Current financial assets 194,052 9,655 0 203,707Trade receivables from third parties (7) 71,545 71,545Other receivables from third parties (7) 11,586 11,586Financial assets – securities (5) 9,655 9,655Cash & cash equivalents (10) 110,921 110,921
TOTAL 195,250 10,014 1,275 206,539
30.06.2011 Derivatives used for
hedging transactions Other financial
liabilities Total
Non-current financial liabilities 881 123,865 124,746Financial payables (12) 122,495 122,495Financial liabilities - derivative instruments (6) 881 881Other payables (16) 1,370 1,370
Current financial liabilities 77 167,089 167,166Trade payables – Third Parties (16) 64,249 64,249Other payables (16) 33,498 33,498Financial liabilities - derivative instruments (6) 77 77Short-term financial payables (12) 69,342 69,342
TOTAL 958 290,954 291,912
Fair value – hierarchy All the financial instruments posted at fair value are classified in three categories defined as follows: Level 1: market prices Level 2: valuation techniques (based on observable market data) Level 3: valuation techniques (not based on observable market data).

Datalogic Group
Consolidated Half-Year Financial Report at 30/06/2011 – Explanatory notes 29
At 30 June 2011, the Group held the following financial instruments valued at fair value:
Level 1 Level 2 Level 3 TotalAssets valued at fair value
Financial assets – Equity investments (5) 0 1,275 1,275Financial assets – Long-term securities (5) 359 0 359Financial assets – Short-term securities (5) 9,655 0 9,655
Total assets valued at fair value 10,014 0 1,275 11,289 Liabilities valued at fair value
Financial liabilities – Long-term derivative instruments (6)
881 881
Financial liabilities – Short-term derivative instruments (6)
0 77 0 77
Total liabilities valued at fair value 0 958 0 958
There were no transfers between the hierarchical fair-value levels compared with 31 December 2010 and the same period of the previous year. There were no changes in the ultimate uses of the financial assets which had a different classification from the assets themselves. The Group does not have any instruments used as guarantees for credit to mitigate the credit risk. The book value of the financial assets therefore represents the potential credit risk.
Note 5. Financial assets Financial assets includes the following items:
30.06.2011 31.12.2010 ChangeSecurities 10,014 360 9,654
Long-term government bonds 359 359 0Short-term government bonds 9,655 1 9,654
Other equity investments 1,275 1,063 212Total 11,289 1,423 9,866
The increase in the item “Financial assets – Short-term securities” for €9,654 relates to the acquisition by the Parent Company of Treasury Credit Certificates (CCTs) as a temporary liquidity investment. Positions are summarised in the table below: Long-term investment securities – Listed
Type of security
Par value Unit purchase price
Total purchase
price
Market price as at 30.06.11
Total market value as at
30.06.11
Carrying amount at
30.06.11 Government bonds
10,000,000 0,9607 9,612,000 0,9612 9,612,000 9,654,000
The difference between the market value as at 30 June 2011 (€9,612 thousand) and the carrying amount of €9,654 thousand is represented by accrued interest of €42 thousand.

Datalogic Group
Consolidated Half-Year Financial Report at 30/06/2011 – Explanatory notes 30
At 30 June 2011 the Group owned the following equity interests in other companies:
31.12.2010 Increases Forex differences
Write-downs 30.06.2011
Nomisma SpA Italia 7 7Conai 0 0Caaf Ind. Emilia Romagna - Italy 4 4Crit Srl 51 51Consorzio T3 Lab 8 8Mandarin Capital Management SA 993 212 1,205
Total equity investments 1,063 212 0 0 1,275
The largest proportion of equity investments is represented by the Parent Company’s investment in the Mandarin Fund, a private equity fund that mainly invests in Italian and Chinese small and medium-sized companies, whose primary investors and sponsors are Intesa San Paolo and two leading Chinese banks. The increase for the period is due to the purchase of a further 1,537 shares in the above-mentioned fund. Note that the Parent Company holds a non-controlling interest in Alien Technology Corporation, which was fully written down at 31 December 2010.
Note 6. Derivative financial instruments
30.06.2011 31.12.2010 Assets Liabilities Assets LiabilitiesInterest rate derivatives - cash flow hedges 933 1,725Currency derivatives - cash flow hedges 25 0Currency derivatives – fair value hedges 0 256 69
Total 0 958 256 1,794 Less non-current portion: Interest rate derivatives - cash flow hedges 881 0 1,725Currency derivatives - cash flow hedges Currency derivatives – fair value hedges 0
Current portion 0 77 256 69
Interest rate derivatives The Group has entered into interest rate derivative contracts to manage the risk stemming from changes in interest rates on bank borrowings, converting them from variable to fixed-rate via interest rate swaps having the same amortisation plan as the hedged underlying asset. As envisaged by IAS 39, the fair value of these contracts, totalling €933 thousand, is recognised in a specific equity reserve net of the tax effect, because they hedge future cash flows and meet all IAS 39 requirements for the application of hedge accounting. At 30 June 2011, the notional capital of the interest rate swaps was €42,879 thousand (€47,885 thousand at 31 December 2010) and USD 9,912 thousand (USD 11,225 thousand at 31 December 2010).

Datalogic Group
Consolidated Half-Year Financial Report at 30/06/2011 – Explanatory notes 31
Currency derivatives The existing forward contracts hedge foreign exchange risks on the US dollar for an aggregate notional amount of USD 6,900 thousand (USD 6,650 thousand at 31 December 2010) and on the Euro for a total notional amount of €5,500 thousand (€4,200 thousand at 31 December 2010), and have the same amount and maturity as the underlying hedged amount. The hedged positions comprise highly likely cash flows stemming from purchase orders and budget; since the envisaged requirements for application of hedge accounting are satisfied, the change in fair value of hedging instruments has been recognised in equity for the effective portion of the hedge (negative for €17 thousand) and expensed for the ineffective part (negative for €8 thousand). The hedging transactions classified as fair value hedges at 31 December 2010 were completed during the first half of 2011.
Note 7. Trade and other receivables Trade and other receivables
30.06.2011 31.12.2010 ChangeThird-party trade receivables 73,987 69,005 4,982Less: doubtful debt provision 2,442 2,424 18
Net third-party trade receivables 71,545 66,581 4,964Receivables from associates 2,513 2,761 (248)Idec Datalogic CO Ltd 315 413 (98)Laservall Asia 1,084 986 98Datasensor UK 266 265 1Datasensor Gmbh 437 486 (49)Special Video 3 10 (7)DS India 79 47 32Datalogic Automation AB 329 554 (225)
Receivables from the Parent Company 0 11 (11)Hydra 11 (11)
Related-party receivables 11 0 11Total trade receivables 74,069 69,353 4,716
Other receivables – accrued income and prepaid expenses 11,586 11,122 464Other receivables – non-current accrued income and prepaid expenses 1,198 1,291 (93)
Total other receivables - accrued income and prepayments 12,784 12,413 371Less: non-current portion 1,198 1,291 (93)
Trade and other receivables - current portion 85,655 80,475 5,180
Trade receivables “Trade receivables falling due within 12 months” at 30 June 2011 are equal to €74,069 thousand, up by 6.7% versus the comparable figure at 31 December 2010. Receivables from affiliates arise from commercial transactions executed at arm’s length conditions.
Datalogic Group
Consolidated Half-Year Financial Report at 30/06/2011 – Explanatory notes 32
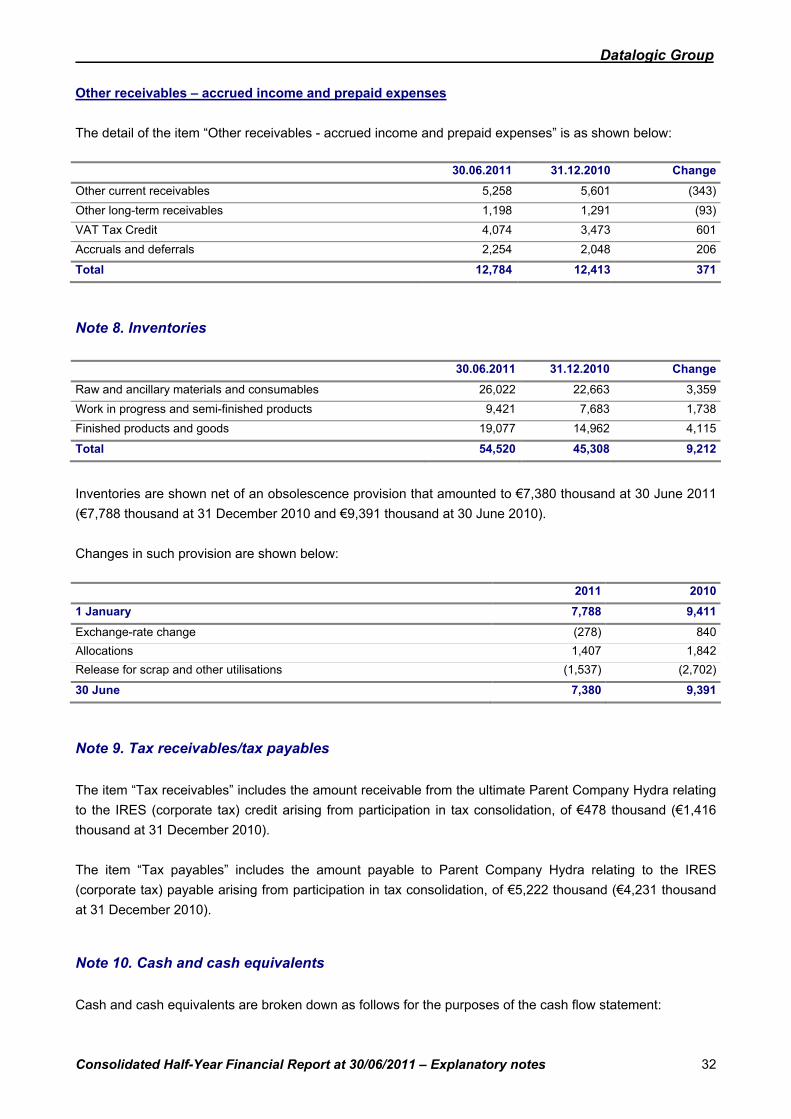
Other receivables – accrued income and prepaid expenses The detail of the item “Other receivables - accrued income and prepaid expenses” is as shown below:
30.06.2011 31.12.2010 ChangeOther current receivables 5,258 5,601 (343)Other long-term receivables 1,198 1,291 (93)VAT Tax Credit 4,074 3,473 601Accruals and deferrals 2,254 2,048 206
Total 12,784 12,413 371
Note 8. Inventories
30.06.2011 31.12.2010 ChangeRaw and ancillary materials and consumables 26,022 22,663 3,359Work in progress and semi-finished products 9,421 7,683 1,738Finished products and goods 19,077 14,962 4,115
Total 54,520 45,308 9,212
Inventories are shown net of an obsolescence provision that amounted to €7,380 thousand at 30 June 2011 (€7,788 thousand at 31 December 2010 and €9,391 thousand at 30 June 2010). Changes in such provision are shown below: 2011 20101 January 7,788 9,411Exchange-rate change (278) 840Allocations 1,407 1,842Release for scrap and other utilisations (1,537) (2,702)
30 June 7,380 9,391
Note 9. Tax receivables/tax payables The item “Tax receivables” includes the amount receivable from the ultimate Parent Company Hydra relating to the IRES (corporate tax) credit arising from participation in tax consolidation, of €478 thousand (€1,416 thousand at 31 December 2010). The item “Tax payables” includes the amount payable to Parent Company Hydra relating to the IRES (corporate tax) payable arising from participation in tax consolidation, of €5,222 thousand (€4,231 thousand at 31 December 2010).
Note 10. Cash and cash equivalents Cash and cash equivalents are broken down as follows for the purposes of the cash flow statement:

Datalogic Group
Consolidated Half-Year Financial Report at 30/06/2011 – Explanatory notes 33
30.06.2011 31.12.2010 ChangeCash and cash equivalents shown on financial statements 110,921 102,542 8,379Restricted cash (726) (751) 25Bank overdrafts (ordinary current accounts) (135) (26) (109)EU financing (531) (531) 0Loans maturing within three months (3,000) (18,000) 15,000
Cash and cash equivalents for statement 106,529 83,234 23,295
According to the requirements of CONSOB Communication no. 15519 of 28 July 2006, the Group’s financial position is reported in the following table:
30.06.2011 31.12.2010
A. Cash and bank deposits 110,195 101,791B. Other liquidities 726 751 b1. restricted cash deposit 726 751C. Securities held for trading 10,014 360 c1. Short-term 9,655 1 c2. Long-term 359 359
D. Cash and equivalents (A) + (B) + (C) 120,935 102,902E. Current financial receivables 0 120F. Other current financial receivables 0 256 f1. hedging transactions 0 256G. Bank overdrafts 135 26H. Current portion of non-current debt 69,207 47,768I. Other current financial payables 77 69 I1. hedging transactions 77 69
J. Current financial debt (G) + (H) +(I) 69,419 47,863K. Current financial debt, net (J) - (D) - (E) - (F) (51,516) (55,415)L. Non-current bank borrowing 122,495 130,187M. Other non-current liabilities 881 1,725 m1. Hedging instruments 881 1,725
O. Non-current financial debt (L) + (M) + (N) 123,376 131,912P. Net financial debt (K) + (O) 71,860 76,497
Net debt at 30 June 2011 was €71,860 thousand, an improvement of €4,637 thousand compared with 31 December 2010, when it totalled €76,497 thousand. Note that the following non-recurring transactions were carried out in the period:
• the purchase of treasury shares for €2,824 thousand; • payment of dividends for €8,129 thousand.
Investments were also made in the amount of €3,993 thousand. Net working capital at 30 June 2011 was €26,564 thousand, down €683 thousand compared with 31 December 2010 (€27,247 thousand).

Datalogic Group
Consolidated Half-Year Financial Report at 30/06/2011 – Explanatory notes 34
INFORMATION ON SHAREHOLDERS' EQUITY AND LIABILITIES
Note 11. Shareholders’ equity The detail of equity accounts is shown below, while changes in equity are reported in the specific statement:
30.06.2011 31.12.2010Share capital 30,392 30,392Share premium reserve 84,323 87,139Extraordinary share-cancellation reserve 2,813 2,813Treasury shares held (22,297) (19,473)Treasury share reserve 24,644 21,828
Share capital and capital reserves 119,875 122,699Cash-flow hedge reserve (681) (1,102)Translation reserve (15,030) (8,229)
Other reserves (15,711) (9,331)Retained earnings 18,673 8,768Earnings carried forward 5,376 (4,050)Capital grant reserve 958 958Legal reserve 3,658 3,185IFRS reserve 8,681 8,675Net profit (loss) for the period 7,818 18,028Total Group shareholders’ equity 130,655 140,164
Share capital and capital reserves Movements in share capital to 30 June 2011 are reported below (in €'000):
Number of shares
Share capital
Extraordinary share-
cancellation reserve
Share premium reserve
Treasury shares
Treasury share
reserve
Total share capital and
capital reserves
01.01.2011 54,446,556 30,392 2,813 87,139 (19,473) 21,828 122,699Purchase of treasury shares
(473,188) (2,816) (2,816) 2,816 (2,816)
Sale of treasury shares 0Costs for the purchase of treasury shares
(8) (8)
30.06.2011 53,973,368 30,392 2,813 84,323 (22,297) 24,644 119,875

Datalogic Group
Consolidated Half-Year Financial Report at 30/06/2011 – Explanatory notes 35
Ordinary shares At 30 June 2011 the total number of ordinary shares was 58,446,491, including 4,473,123 held as treasury shares, making the number of shares in circulation at that date 53,973,368. The shares have a nominal unit value of €0.52 and are fully paid up. Treasury shares The “Treasury shares” account, negative by €22,297 thousand, includes purchases and sales of treasury shares in the amount of €24,644 thousand, which have been recognised net of gains and charges realised following the sale of treasury shares and related tax effects (€2,347 thousand). In the first half of 2011, the Group acquired 473,188 treasury shares. For these purchases, in accordance with Article 2453 of the Italian civil code, capital reserves (through the treasure share reserve) in the amount of €24,644 thousand have been made unavailable. Other reserves Translation reserve In compliance with IAS 21, translation differences arising from translation of the foreign currency financial statements of consolidated companies into the Group accounting currency are classified as a separate equity component. Cash-flow hedge reserve Following adoption of IAS 39, changes in the fair value of derivative contracts designated as effective hedging instruments are recognised in accounts directly with shareholders’ equity, in the cash-flow hedge reserve. These contracts have been executed to hedge exposure to the risk of fluctuation of interest rates on floating rate loans (negative for €933 thousand) and to hedge currency exposure (negative for €17 thousand). Amounts are reported net of the tax effect (€269 thousand). Cumulative retained earnings This item includes equity changes occurring in consolidated companies after acquisition date. Dividends On 28 April 2011 the Annual General Meeting of Datalogic S.p.A. approved distribution of the ordinary dividend of €0.15 per share (no dividends were distributed in 2010). The total dividend of €8,129 thousand was paid out as from 5 May 2011 and was entirely paid at 30 June.

Datalogic Group
Consolidated Half-Year Financial Report at 30/06/2011 – Explanatory notes 36
The reconciliation between the direct Parent Company’s equity and net profit and the corresponding consolidated amounts is as shown below:
30.06.11 31.12.10 Total equity
Period results
Total equity
Period results
Datalogic SpA shareholders’ equity and profit 161,175 5,956 165,979 9,451Difference between consolidated companies' net equity and their carrying value in Datalogic SpA's statement; effect of equity-based valuation
8,748 10,895 12,784 24,115
Reversal of dividends 0 (8,356) 0 (14,673)Amortisation of intangible assets "business combination" (5,827) 0 (5,827) 0
Effect of acquisition under common control (31,733) 0 (31,733) 0Elimination of capital gain on sale of business branch (3,302) (3,302) 0Effect of eliminating intercompany transactions (3,732) (612) (3,120) 228Reversal of write-downs and capital gains on equity investments
3,565 0 3,565 (630)
Sale of Know-how (7) 0 (7) 0Goodwill impairment (1,246) (149) (1,097) (298)Other (603) 42 (652) 112Deferred tax 3,617 42 3,574 (277)Group portion of shareholders' equity 130,655 7,818 140,164 18,028
Note 12. Short- and long-term borrowings and financial liabilities The breakdown of this item is as detailed below:
30.06.2011 31.12.2010 ChangeBank loans 191,171 177,424 13,747EU financing 531 531 0Bank overdrafts (ordinary current accounts) 135 26 109
Total financial payables 191,837 177,981 13,856
The breakdown of changes in the “Bank loans” item at 30 June 2011 and 31 December 2010 is shown below:
2011 20101 January 177,424 169,887Foreign exchange differences (2,896) 2,835Increases 47,952 10,000Repayments (18,000) 0Decreases for loan repayments (13,309) (981)
30 June 191,171 181,741

Datalogic Group
Consolidated Half-Year Financial Report at 30/06/2011 – Explanatory notes 37
The “Increases” item mainly relates to the following arrangements for the Parent Company:
• a stand-by line for €20,000 thousand • two hot money contracts for €13,000 million • a medium-/long-term loan of €15,000 thousand
Bank loans have maturities until 2020 and approximate annual average interest rates of 2%. The fair value of the loans (current and non-current) coincides substantially with their book value calculated at amortized cost. Covenants As regards the following loans, the companies have been asked to respect, on a semi-annual or annual basis, some financial covenants summarised in the following table:
Company Currency Outstanding debt
Covenant Frequency On the financial statements of
Datalogic SpA € 6,000,000 DFL PN DFL / PN annual Datalogic SpA Datalogic SpA € 4,000,000 DFL PN DFL / PN annual Datalogic SpA Datalogic SpA € 15,000,000 PFN / PN PFN
/EBITDA annual Datalogic Group
Datalogic SpA € 30,000,000 EBITDA/PFN PFN /EBITDA
semi-annual Datalogic Group Datalogic SpA $ 49,400,000 PFN / PN PFN
/EBITDA semi-annual Datalogic Group
Datalogic SpA € 20,000,000 PFN / PN PFN /EBITDA
annual Datalogic Group Datalogic SpA € 15,000,000 PFN / PN PFN
/EBITDA semi-annual Datalogic Group
Datalogic Automation Srl
€ 25,000,000 PFN / PN PFN /EBITDA
semi-annual Datalogic Group Datalogic Automation Srl
€ 2,500,000 DFL PN DFL / PN annual Datalogic SpA Datalogic Automation Srl
€ 2,500,000 DFL PN DFL / PN annual Datalogic SpA
Key:
PN = Shareholders' Equity
PFN = Net financial position
DFL = Financial gross payables
Cash Flow = Profit/(loss)+depreciation and amortisation
As at 30 June 2011 all covenants were respected.
Note 13. Deferred tax assets and liabilities Deferred tax assets and liabilities stem both from (a) positive items already recognised in the income statement and subject to deferred taxation under current tax regulations and (b) temporary differences between consolidated balance-sheet assets and liabilities and their relevant taxable value.

Datalogic Group
Consolidated Half-Year Financial Report at 30/06/2011 – Explanatory notes 38
The breakdown of deferred taxes (net balance of deferred tax assets and liabilities) is illustrated as follows:
30.06.2011 31.12.2010 Change Datalogic Automation INC 202 374 (172)Datalogic Automation srl (*) 1,901 1,829 72Datalogic Mobile Asia (2) (2) 0Datalogic Mobile Inc 405 392 13Datalogic Mobile PTY 106 77 29Datalogic Mobile srl (*) 1,405 (263) 1,668Datalogic RE (9) 11 (20)Datalogic RE France Sa 52 52 0Datalogic RE Germany GmbH (75) (75) 0Datalogic RE UK Ltd 97 101 (4)Datalogic Scanning GMBH (441) (385) (56)Datalogic Scanning Group 143 73 70Datalogic Scanning Holding Inc and Datalogic Scanning Inc 2,816 2,546 270Datalogic Scanning Iberia 1 0 1Datalogic Scanning PTY 77 114 (37)Datalogic Scanning SAS 31 30 1Datalogic Scanning Slovakia 594 632 (38)Datalogic Scanning SPA 150 144 6Datalogic Scanning UK LTD 13 13 0Datalogic SpA (299) 112 (411)Evolution Robotics Retail Inc. 761 604 157Informatics (491) (727) 236
Total long-term net deferred taxes 7,437 5,652 1,785
Deferred taxes recognised due to effect of consolidation adjustments
998 609 389
Total long-term net deferred taxes 8,435 6,261 2,174
(*) they include the balances of the branches.
The most significant change is attributable to the company Mobile srl following the recognition of deferred taxes relating to provisions for restructuring costs.
Note 14. Employees termination indemnities The changes at 30 June 2011 and 2010 are as follows:
2011 20101 January 7,121 7,739Amount allocated in the period 863 888 Uses (503) (1,277)Social security receivables for the employee severance indemnity reserve
(477) (249)
30 June 7,004 7,101

Datalogic Group
Consolidated Half-Year Financial Report at 30/06/2011 – Explanatory notes 39
Note 15. Provisions for risks and charges The breakdown of the "Provisions for risks and charges” item is as follows:
30.06.2011 31.12.2010 ChangeShort-term provisions 10,456 3,615 6,841Long-term provisions 12,228 9,823 2,405
Total 22,684 13,438 9,246
Below we show the detailed breakdown of and changes in this item.
31.12.2010 Increases (Uses) and (Issues)
Forex differences
30.06.2011
Product warranty provision 4,965 492 (194) (120) 5,143Company restructuring provision 71 7,089 (26) 7,134Provision for management incentive scheme
6,788 2,248 0 (215) 8,821
Other 1,614 281 (251) (58) 1,586
Total provisions for risks and charges
13,438 10,110 (445) (419) 22,684
The “Product warranty provision” covers the estimated cost of repairing products sold as up to 30 June 2011 and covered by periodical warranty; it amounts to €5,143 thousand (of which €2,817 thousand long-term) and is considered sufficient in relation to the specific risk it covers The “Company restructuring provision” totalling €7,134 thousand was created to cover the estimated cost of corporate restructuring through implementation of a programme to reorganise the supply chain of the Mobile and Scanning divisions which has been approved by top management and announced to the entities in question; this programme will result in the closure of the production facilities in Quinto di Treviso (Italy) and Eugene (USA) and the reorganisation of the production unit in Trnava (Slovakia). With regard to the Italian companies affected by the restructuring plan, on 14 June an agreement was reached with the trade unions. The increase in the “Management incentive plan allocation” is due to the provision for a long-term plan for directors and managers for the period 2010-2012. The “Others” item consists mainly of:
€1,106 thousand for a “stock rotation” provision for the Scanning Group, Mobile Inc and Informatics; €67 thousand attributable to the Scanning Group and apportioned for the adaptation to the “Directive
2002/95/EC on the restriction on the use of certain hazardous substances in electric and electronic equipment” incorporated in Italy by Legislative Decree No. 151 of 25 July 2005;
€38 thousand for an ongoing dispute regarding the ten-year ILOR exemption, set forth by DPR 218/78 (Unified law on actions in Southern Italy), in relation to the former Datasud, for the year 2006;
€241 thousand for agent termination indemnities.

Datalogic Group
Consolidated Half-Year Financial Report at 30/06/2011 – Explanatory notes 40
Note 16. Trade and other payables This table shows the details of trade and other payables:
30.06.2011 31.12.2010 ChangeTrade payables due within 12 months 64,249 56,297 7,952
Third-party trade payables 64,249 56,297 7,952Payables to associates 63 125 (62)Idec Datalogic CO Ltd 3 31 (28)Laservall Asia 48 66 (18)Special Video 5 15 (10)Datasensor Gmbh 1 1 0Datalogic Automation AB 6 12 (6)
Payables to the Parent Company 0 1 (1)Hydra 1 (1)
Payables to related parties 199 265 (66)Total trade payables 64,511 56,688 7,823Other payables – current accrued liabilities and deferred income
33,498 33,910 (412)
Other payables – non-current accrued liabilities and deferred income
1,370 1,444 (74)
Total other payables – accrued liabilities and deferred income
34,868 35,354 (486)
Less: non-current portion 1,370 1,444 (74)
Current portion 98,009 90,598 7,411
Other payables – accrued liabilities and deferred income The detailed breakdown of this item is as follows:
30.06.2011 31.12.2010 ChangeOther current payables 16,829 19,584 (2,755)Other long-term payables 1,370 1,444 (74)VAT liabilities 3,632 2,100 1,532Accruals and deferrals 13,037 12,226 811
Total 34,868 35,354 (486)
The breakdown of the “Other current payables” item is as follows:
30.06.2011 31.12.2010 ChangePayables to pension and social security agencies 2,552 3,377 (825)Payables to employees 11,027 12,930 (1,903)Directors’ remuneration payable 2,358 2,529 (171)Other payables 892 748 144
Total 16,829 19,584 (2,755)
Amounts payable to employees represent the amount due for salaries and vacations accrued by employees as at the reporting date.

Datalogic Group
Consolidated Half-Year Financial Report at 30/06/2011 – Explanatory notes 41
INFORMATION ON THE STATEMENT OF INCOME
Note 17 - Revenues
30.06.2011 30.06.2010 ChangeRevenues from sale of products 200,985 183,393 17,592Revenues for services 9,262 7,439 1,823
Total 210,247 190,832 19,415
Revenue from sales and services increased by 10.2% year-on-year (13% at constant exchange rates). Below is the geographical breakdown of revenue in percentage terms:
30.06.2011 30.06.2010 ChangeRevenue in Italy 11% 11% 0%Revenue – EU 40% 40% 0%Revenue – Rest of World 49% 49% 0%
Note 18 - Cost of goods sold and operating costs Pursuant to the introduction of IAS principles, the following table reports non-recurring costs and amortisation arising from acquisitions as extraordinary items no longer listed separately but included in ordinary operations.
30.06.2011 30.06.2010 ChangeTOTAL COST OF GOODS SOLD (1) 116,221 103,218 13,003
of which non-recurring 4,789 (80) 4,869
TOTAL OPERATING COSTS (2) 78,882 69,736 9,146Research and development costs 13,769 12,659 1,110of which non-recurring 380 380Distribution expenses 41,327 36,821 4,506of which non-recurring 1,955 1,955General & administrative expenses 22,907 19,586 3,321of which non-recurring 290 290of which amortisation pertaining to acquisitions 2,176 1,999 177Other operating costs 879 670 209of which non-recurring (258) 258
TOTAL (1+2) 195,103 172,954 22,149of which non-recurring 7,414 (338) 7,752of which amortisation pertaining to acquisitions 2,176 1,999 177

Datalogic Group
Consolidated Half-Year Financial Report at 30/06/2011 – Explanatory notes 42
Below is the breakdown of non-recurring costs and revenue: ITEM AMOUNT COST TYPE
2)" Cost of goods sold" 4,508 early retirement incentives2)" Cost of goods sold" 110 wages and salaries (bonus)2)" Cost of goods sold" 141 amortisation2)" Cost of goods sold" 30 others
Total 4,7894) R&D expenses 380 early retirement incentives
Total 3805) Distribution expenses 1,955 early retirement incentives
Total 1,9556) General & administrative expenses 190 early retirement incentives6) General & administrative expenses 100 consulting services
Total 290TOTAL NON-RECURRING COSTS 7,414
All non-recurring costs relate to the integration and restructuring project involving the Mobile and Scanning divisions. In addition to the non-recurring costs listed above, the Group incurred, for the same project, further costs of €1,062 thousand, primarily for consulting services. At 30 June 2011 the total cost of the project was €8,476 thousand. Amortisation due to acquisitions (€2,176 thousand), included under “General & administrative expenses", is made up as follows:
1. €869 thousand pertaining to Datalogic Scanning Inc.; 2. €648 thousand pertaining to Datalogic Automation Srl; 3. €285 thousand pertaining to Informatics Inc.; 4. €250 thousand pertaining to Evolution Robotics Retail Inc., and; 5. €124 thousand pertaining to Datalogic Mobile Inc.
Total cost of goods sold (1) This item increased by 12.60% compared with the same period of 2010. At constant exchange rates and net of extraordinary costs the increase was 10.15%, substantially lower than the increase in revenues at average constant exchange rates. Total operating costs (2) Operating costs, net of non-recurrent items and amortisation and depreciation of acquisitions, rose by 8.95% from €67,995 thousand to €74,081 thousand. At constant exchange rates and stripping out extraordinary costs, the increase would have been €7,558 thousand (11.12%). More specifically,
“R&D expenses” rose, net of non-recurring costs, by €730 thousand (€1,078 thousand at constant exchange rates) versus the same period the previous year. At constant exchange rates, the increase was 8.52%; this rise is mainly attributable to the increase in payroll costs of

Datalogic Group
Consolidated Half-Year Financial Report at 30/06/2011 – Explanatory notes 43
€706 thousand (of which €477 thousand related to Evolution Robotics Inc. acquired in July 2010) and in various consulting costs (€277 thousand). Costs relating to amortisation and depreciation fell by €148 thousand.
“Distribution expenses”, net of non-recurring costs, totalled €39,372 thousand, an increase of
€2,551 thousand versus the first half of 2010 (€3,322 thousand at constant exchange rates), as a result of: − higher payroll costs, at average constant exchange rates, of €1,821 thousand, mainly attributable to the inclusion In the consolidation area of Evolution Robotics Inc. (€696 thousand), early retirement incentives, not linked to the restructuring project, (€230 thousand) and to sales commissions (€455 thousand); − an increase in costs related directly to the increase in sales volumes, including transport costs and commissions, proportional to the increase in revenues;
"General & administrative expenses” amounted to €22,907 thousand. This item, net of extraordinary items and at constant exchange rates, posted an increase of €3,176 thousand versus the same period of the previous year (18%). More specifically, at average constant exchange rates, costs for directors’ remuneration (including provisions made for the multi-year incentive plan) and for consultancy which the Group required for the integration and restructuring project affecting the Mobile and Scanning divisions.
The detailed breakdown of “Other operating costs” is as follows:
30.06.2011 30.06.2010 ChangeCapital losses on assets 28 93 (65)Contingent liabilities 42 42 0Provisions for doubtful accounts 183 308 (125)Restructuring provision allocation (258) 258Non-income taxes 380 368 12Cost charge backs 246 98 148Other 0 19 (19)
Total 879 670 209

Datalogic Group
Consolidated Half-Year Financial Report at 30/06/2011 – Explanatory notes 44
Breakdown of costs by type The following table provides the details of total costs (cost of goods sold + operating costs) by type, for the main items:
30.06.2011 30.06.2010 ChangePurchases 90,890 75,275 15,615Inventory change (10,783) (4,310) (6,473)Payroll & employee benefits 63,754 55,925 7,829Amortisation, depreciation and write-downs 7,566 7,777 (211)Goods receipt & shipment 6,904 5,884 1,020Technical, legal, and tax advisory services 4,158 2,824 1,334Directors’ remuneration 3,928 1,924 2,004Subcontracted work 3,840 3,895 (55)Marketing expenses 3,163 2,948 215Travel & accommodation 2,792 2,503 289Building expenses 2,711 2,630 81Repairs 2,076 2,167 (91)Vehicle expenses 2,036 1,667 369Material collected from the warehouse 1,022 1,690 (668)Utilities 974 920 54EDP expenses 876 596 280Telephone expenses 832 1,045 (213)Accounts certification expenses 684 690 (6)Commissions 659 448 211Consumables 590 615 (25)Entertainment expenses 527 451 76Royalties 459 362 97Patents and branding 434 518 (84)Insurance 368 408 (40)Meetings expenses 317 254 63Gifts of our products to third parties 253 313 (60)Quality certification expenses 246 264 (18)Plant and machinery leasing and maintenance 238 307 (69)Employee training 195 190 5Other 3,394 2,774 620Total cost of goods sold and other operating costs (1+2) 195,103 172,954 22,149
Most of the increase (in absolute terms) is attributable to variable costs, which, because they relate directly to turnover volumes, were affected by the substantial increase in sales. Marketing costs totalled €3,163 thousand. The main items are: €1,455 thousand for advertising and sponsorship expenses; €881 thousand for the company’s share of the marketing expenses incurred by commercial partners; and €652 thousand for trade-event costs. Goods receipt and shipment costs increased by 17.34% or €1,020 thousand. The “Other” item is made up of a number of expenses, all amounting to less than €200 thousand.

Datalogic Group
Consolidated Half-Year Financial Report at 30/06/2011 – Explanatory notes 45
The detailed breakdown of payroll and employee benefits costs is as follows:
30.06.2011 30.06.2010 Change
Wages and salaries 43,004 42,458 546
Social security charges 8,866 8,797 69
Staff leaving indemnities 863 888 (25)
Retirement and similar benefits 427 390 37
Medium- to long-term managerial incentive plan 1,127 1,861 (734)
Other costs 9,467 1,531 7,936
- of which leaving incentives 7,295 (69) 7,364
Total 63,754 55,925 7,829
"Wages and salaries” for €43,004 thousand include Sales commissions and incentives for €6,045 thousand (€5,788 thousand at 30 June 2010); it also includes €1,089 (of which €150 for sales commissions) relating to the company Evolution Robotics Inc which was purchased in July 2010. The increase in “Other costs” is attributable to early retirement incentives, of which:
• €7,033 thousand classified among non-recurring costs and revenues in that they are related to the corporate reorganisation plan,
• €262 thousand classified among non-recurring costs and revenues in that they are related to normal operations of company management,
Note 19 - Other operating revenues The detailed breakdown of this item is as follows:
30.06.2011 30.06.2010 ChangeMiscellaneous income and revenue 485 384 101Rents and lease amounts 97 93 4Capital gains on asset disposals 78 12 66Incidental income and cost cancellation 149 26 123Grants to research and development expenses 932 46 886Other 39 45 (6)
Total 1,780 606 1,174
The increase in the item “Grants to research and development expenses” was recognised in accordance with the provisions of the Decree of the Ministry of the Economy and Finance of 4 March 2011, published in the Gazzetta Ufficiale (Official Gazette) no. 89 of 18 April 2011, which introduced the possibility, for companies which started research and development activities before 29 November 2008 and which were not granted a loan after submitting Form FRS (between 6 May 2009 and 5 June 2009) due to the designated fund being used up by the "click day" procedure, to benefit from a tax credit of up to 47.53% of the amount requested.

Datalogic Group
Consolidated Half-Year Financial Report at 30/06/2011 – Explanatory notes 46
Note 20. Net financial income (expenses)
30.06.2011 30.06.2010 ChangeInterest expenses on bank current accounts/loans 2,956 2,667 289Foreign exchange losses 9,171 7,544 1,627Bank expenses 629 469 160Other 291 261 30
Total financial expenses 13,047 10,941 2,106
Interest income on bank current accounts/loans 917 339 578Foreign exchange gains 6,822 9,834 (3,012)Other 54 21 33
Total financial income 7,793 10,194 (2,401)
Net financial income (expenses) (5,254) (747) (4,507)
Total financial expenses The item “Foreign exchange losses” amounted to €9,171 thousand and refers mainly to the Parent Company (€5,431 thousand), the Scanning Group (€2,315 thousand), the Mobile Group (€765 thousand) and the Automation Group (€695 thousand). This item includes €430 thousand arising from exchange rate risk hedge transactions. Total financial income The item “Foreign exchange gains” totalled €6,822 thousand and refers mainly to the Parent Company (€3,577 thousand), the Scanning Group (€1,719 thousand), the Mobile Group (€1,089 thousand) and the Automation Group (€389 thousand). This item includes €170 thousand arising from exchange rate risk hedge transactions.
Note 21 - Taxes
30.06.2011 30.06.2010 ChangeIncome tax 6,483 6,168 315Substitute tax 229 (229)Deferred tax (2,412) 171 (2,583)
Total 4,071 6,568 (2,497)
The average tax rate was 34.24% (36.85% at 30 June 2010), consistent with the average tax rate expected for the 2011 financial year.
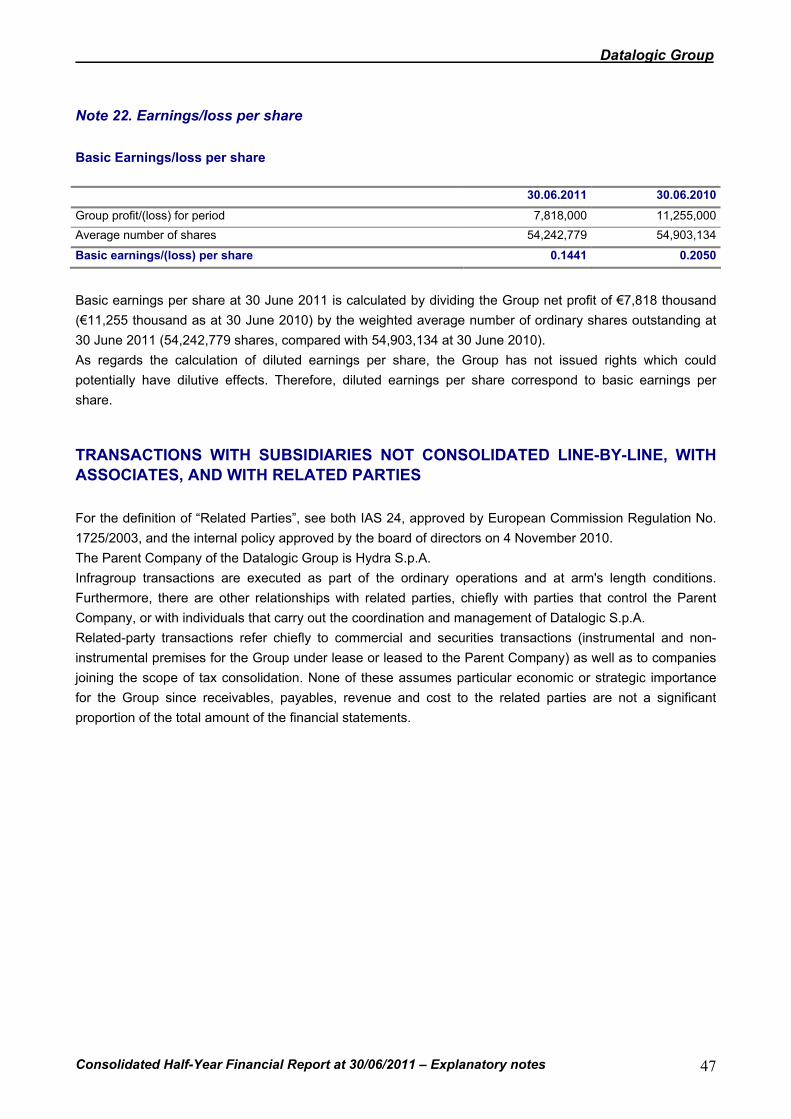
Datalogic Group
Consolidated Half-Year Financial Report at 30/06/2011 – Explanatory notes 47
Note 22. Earnings/loss per share Basic Earnings/loss per share
30.06.2011 30.06.2010Group profit/(loss) for period 7,818,000 11,255,000Average number of shares 54,242,779 54,903,134
Basic earnings/(loss) per share 0.1441 0.2050
Basic earnings per share at 30 June 2011 is calculated by dividing the Group net profit of €7,818 thousand (€11,255 thousand as at 30 June 2010) by the weighted average number of ordinary shares outstanding at 30 June 2011 (54,242,779 shares, compared with 54,903,134 at 30 June 2010). As regards the calculation of diluted earnings per share, the Group has not issued rights which could potentially have dilutive effects. Therefore, diluted earnings per share correspond to basic earnings per share.
TRANSACTIONS WITH SUBSIDIARIES NOT CONSOLIDATED LINE-BY-LINE, WITH ASSOCIATES, AND WITH RELATED PARTIES For the definition of “Related Parties”, see both IAS 24, approved by European Commission Regulation No. 1725/2003, and the internal policy approved by the board of directors on 4 November 2010. The Parent Company of the Datalogic Group is Hydra S.p.A. Infragroup transactions are executed as part of the ordinary operations and at arm's length conditions. Furthermore, there are other relationships with related parties, chiefly with parties that control the Parent Company, or with individuals that carry out the coordination and management of Datalogic S.p.A. Related-party transactions refer chiefly to commercial and securities transactions (instrumental and non-instrumental premises for the Group under lease or leased to the Parent Company) as well as to companies joining the scope of tax consolidation. None of these assumes particular economic or strategic importance for the Group since receivables, payables, revenue and cost to the related parties are not a significant proportion of the total amount of the financial statements.

Datalogic Group
Consolidated Half-Year Financial Report at 30/06/2011 – Explanatory notes 48
RELATED PARTIES Idec Dl Co. Ltd.
Hydra (Parent Company)
Hydra Immobiliare
Non consolidated Automation
Group companies
Studio Associato
Caruso Tamburi
Investment Partners
SpA
Laservall Asia
TOTAL 30.06.11
associate parent company
company headed by
Chairman of BoD
associates, associated companies
controlled by a
company director
controlled by a
company director
associate
Equity investments 928 - - 128 - - 1,324 2,380 Automation Group 928 128 1,324 2,380 Trade receivables 315 - 11 1,114 - - 1,084 2,524 Automation Group 315 1,114 1,084 2,513 Real Estate 11 11 Receivables pursuant to tax consolidation
- 478 - - - - - 478
Dl Automation Srl 304 304 Dl SpA 174 174 Liabilities pursuant to tax consolidation
- 5,222 - - - - - 5,222
Dl Mobile Srl 3,197 3,197 Datalogic Real Estate Srl 26 26 Dl Scanning SpA 166 166 Dl Scanning Group Srl 1,833 1,833 Trade payables 3 - 104 12 69 26 48 262 Dl SpA 46 26 72 Datalogic Real Estate Srl 2 2 Automation Group 3 104 12 16 48 183 Dl Mobile Srl 5 5 Distribution / service expenses
27 - 230 56 155 55 89 612
Dl SpA 93 55 148 Datalogic Real Estate Srl 4 4 Automation Group 27 230 56 33 89 435 Dl Scanning Group Srl 5 5 Dl Scanning SpA 9 9 Dl Mobile Srl 11 11 Commercial revenue 913 - - 2,244 - - 2,726 5,883 Automation Group 913 2,244 2,726 5,883 Profits from associated companies
44 - - - - - 175 219
Automation Group 44 175 219
NUMBER OF EMPLOYEES
30.06.2011 30.06.2010 ChangeAutomation Group 602 595 7Mobile Group 331 331 0Datalogic SpA 49 45 4Scanning Group 1,070 921 149Business Development 135 100 35Real Estate Group 6 7 (1)
Total 2,193 1,999 194
Chairman of the Board of Directors Romano Volta
