consolidated gross profit operational and financial … · 1 / 22 1q10 earnings growth of 12.7% in...
TRANSCRIPT

1 / 22
1Q10 EARNINGS
GROWTH OF 12.7% IN “SAME STORES” NET REVENUES IN THE FIRST FOUR MONTHS AND 3.4 P.P. INCREASE IN PARENT COMPANY’S NET MARGIN IN 1Q10
(RESTATEMENT)
Rio de Janeiro, May 13, 2010 – Lojas Americanas S.A. [BOVESPA: LAME3 (common) and LAME4 (preferred)], the company that is one of the leading retail chains in Brazil, with 478 stores (until the present date) and a presence in 23 states plus the Federal District, today announced its results for the 1st quarter (1Q10). The accounting information included in the Quarterly Information that follows, except where otherwise indicated, is presented according to the rules of the Brazilian Securities Exchange Commission (CVM) and in Reais (R$), and the comparisons refer to the first quarter of 2009 (1Q09). It should be noted that in 2010, the Easter event occurred on April 4, whereas in the previous year it occurred one week later, on April 12. Therefore, the sales related to this important event, had a bigger impact in 1Q10 when compared to the same period of 2009.
224.2
535.9634.9
390.5
142.9 182.1
499.4
1Q04 1Q05 1Q06 1Q07 1Q08 1Q09 1Q10
Consolidated Gross Profit(R$ M illion)
31.229.3 30.5
32.430.5
33.830.5
1Q04 1Q05 1Q06 1Q07 1Q08 1Q09 1Q10
Consolidated Gross Margin (%NR)
20.3
22.1
19.119.918.6
20.821.9
1Q04 1Q05 1Q06 1Q07 1Q08 1Q09 1Q10
Consolidated Operational Expenseswithout Depreciation & Amortization
(%NR)
47.8 66.7 75.1126.1
174.2 185.8237.8
11.4%10.4%10.7% 10.2% 10.5% 10.6% 11.7%
1Q04 1Q05 1Q06 1Q07 1Q08 1Q09 1Q10EBITDA (R$ M M ) EBITDA (%NR)
Consolidated EBITDA
CAGR = 30.7%
OPERATIONAL AND FINANCIAL HIGHLIGHTS
Restatement1Q10 1Q09 Var. (%) Financial Highlights (R$ MM) 1Q10 1Q09 Var. (%)
2,391.1 1,968.2 21.5% Gross Revenues 1,377.8 1,121.1 22.9%2,083.4 1,585.2 31.4% Net Revenues 1,164.2 909.5 28.0%634.9 535.9 18.5% Gross Profit 337.5 283.3 19.1%30.5% 33.8% -3,3 pp Gross Margin (%NR) 29.0% 31.1% -2,1 pp237.8 185.8 28.0% EBITDA 136.8 103.5 32.2%11.4% 11.7% -0,3 pp EBITDA Margin (%NR) 11.8% 11.4% +0,4 pp48.7 9.1 435.2% Net Income 43.0 2.3 1769.6%2.3% 0.6% +1,7 pp Net Margin (%NR) 3.7% 0.3% +3,4 pp
Parent CompanyConsolidated
Executive Summary 1Q10 – Comparison to 1Q09:
• Growth of “same stores” net revenues (NR) of 12.7% in the first four months
of the year;
• Reduction of 3.0 percentage points (pp) (%NR) in the consolidated
operating expenses (with selling and general/administrative expenses) reaching
19.1% of NR, and a reduction of 2.6 pp (%NR) for the Parent Company, reaching
17.2% of NR;
• Consolidated EBITDA of R$ 237.8 million or 11.4% of NR, equivalent to growth of 28.0% and, for the Parent Company, of R$ 136.8 million, representing an
increase of 32.2%;
• Consolidated Net income of R$ 48.7 million, compared to net income of R$ 9.1 million in 1Q09, equivalent to an increase of 1.7 pp in the net margin. Parent Company’s net income of R$ 43.0 million, compared to net income of R$ 2.3 million in 1Q09, equivalent to an increase of 3.4 pp in the net margin;
• Working Capital (Parent Company) - improvements of 22 days in net working capital;
• B2W - Growth of 16% in consolidated gross revenues in 1Q10; International
expansion of online tickets sales to Argentina, in partnership with Cinemark;
• FAI - Financeira Americanas Itaú (FAI) closed the first quarter of 2010 with
about 2.6 million cards issued and R$ 827 million in volume of receivables. At
the end of March, the share of FAI cards (private label and co-branded) represented
14% of the parent company’s sales;
• “SEMPRE MAIS BRASIL” program – 400 new stores in the next 4 years. • Charts – “1Q” means the 1st quarter of each year. • Only the 1Q09 and 1Q10 data are presented according the IFRS. • The historic data are in compliance with the corporate norms in effect for each period.

2 / 22
Multi-channel Retail Structure:
Clients are served the bricks-and-mortar stores, Internet, telephone, catalogues, TV and kiosks. Financial services are offered through FAI.
MULTI-CHANNEL RETAIL STRUCTURE Lojas Americanas operates through a multichannel service structure. In addition to the bricks-and-mortar store chain, the Company reaches customers with a wide range of products and services sold via Internet, telephone, catalogues, TV and kiosks. B2W – Companhia Global do Varejo, the result of the merger of Americanas.com and Submarino in 2006, has a portfolio that includes the Americanas.com, Submarino, Shoptime, Blockbuster Online, Ingresso.com, Submarino Finance and B2W Viagens brands, which offer more than 30 categories of products and services through the Internet, telephone sales, catalogues, TV and kiosk distribution channels. Lojas Americanas’ stake in B2W at the close of the third quarter of 2010 was 56.62%. It is also worth mentioning the participation in Financeira Americanas Itaú (FAI), a joint venture with Banco Itaú, responsible for offering credit and financial products to clients. The following organizational chart illustrates the integrated approach of Lojas Americanas:
Multichannel Retailer
Bricks-and-Mortar Ecommerce, Telephone Sales, Catalogues,
TV and kiosks.
Participation: 56.62%
Results Consolidation: 100%
Participation: 50%Results Consolidation: 50%
Financial Products
3 / 22
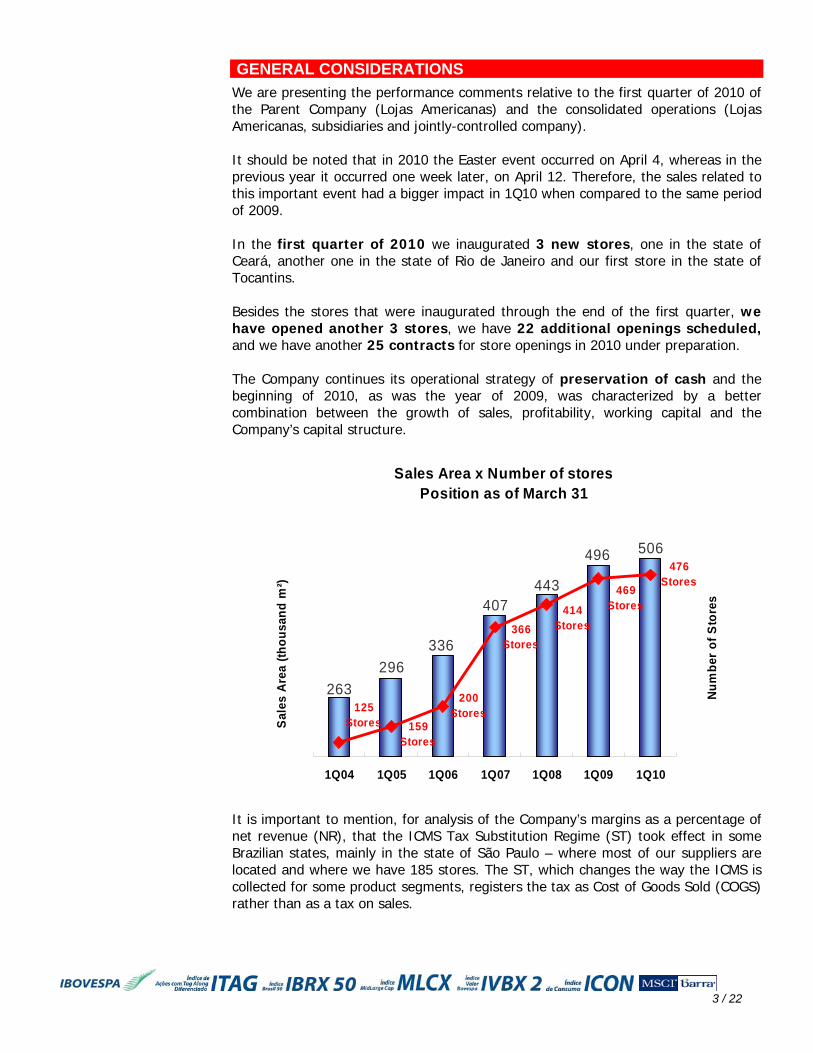
GENERAL CONSIDERATIONS We are presenting the performance comments relative to the first quarter of 2010 of the Parent Company (Lojas Americanas) and the consolidated operations (Lojas Americanas, subsidiaries and jointly-controlled company). It should be noted that in 2010 the Easter event occurred on April 4, whereas in the previous year it occurred one week later, on April 12. Therefore, the sales related to this important event had a bigger impact in 1Q10 when compared to the same period of 2009. In the first quarter of 2010 we inaugurated 3 new stores, one in the state of Ceará, another one in the state of Rio de Janeiro and our first store in the state of Tocantins. Besides the stores that were inaugurated through the end of the first quarter, we have opened another 3 stores, we have 22 additional openings scheduled, and we have another 25 contracts for store openings in 2010 under preparation. The Company continues its operational strategy of preservation of cash and the beginning of 2010, as was the year of 2009, was characterized by a better combination between the growth of sales, profitability, working capital and the Company’s capital structure.
Sales Area x Number of storesPosition as of March 31
506496
443407
296336
263125
Stores 159Stores
200Stores
366Stores
414Stores
469Stores
476Stores
1Q04 1Q05 1Q06 1Q07 1Q08 1Q09 1Q10
Sale
s A
rea
(thou
sand
m²)
Num
ber o
f Sto
res
It is important to mention, for analysis of the Company’s margins as a percentage of net revenue (NR), that the ICMS Tax Substitution Regime (ST) took effect in some Brazilian states, mainly in the state of São Paulo – where most of our suppliers are located and where we have 185 stores. The ST, which changes the way the ICMS is collected for some product segments, registers the tax as Cost of Goods Sold (COGS) rather than as a tax on sales.

4 / 22
Consolidated Gross Revenues of R$ 2.391 billion in 1Q10
12.7% growth of “same stores” Net Revenues in the Jan-Apr’10 period vs. ’09
OPERATING PERFORMANCE Gross Revenues
In the first quarter of 2010 (1Q10), the Company’s consolidated gross revenues totaled R$ 2.391 billion, representing an increase of 21.5% compared to the same period of 2009 (1Q09). From the Parent Company’s point of view, gross revenues for 1Q10 totaled R$ 1.378 billion, compared to the R$ 1.121 billion registered in 1Q09, the equivalent to growth of 22.9%. It is important to note that there is a mismatch in the Company’s sales, in view of the Easter event in 2010, which had a bigger impact in the first quarter when compared to the same period of 2009.
Consolidated Gross Revenues per Associate
In 1Q10, consolidated gross revenues per Associate was R$ 150,000, an increase of 16% compared to 1Q09.
Consolidated Gross Revenues per Associate (R$ thousand)
92129
150139
8565
120
1Q04 1Q05 1Q06 1Q07 1Q08 1Q09 1Q10
Net Revenues
In 1Q10, Lojas Americanas’ consolidated net revenues totaled R$ 2.083 billion, compared to the R$ 1.585 billion registered in 1Q09. The Parent Company’s net revenues in 1Q10 totaled R$ 1,164.2 million, compared to the R$ 909.5 million registered in 1Q09. In order to eliminate the effect of the Easter event, we are exceptionally reporting growth of net revenues in the “same stores” concept (excluding new stores opened less than one year ago) for the four-month period comprising January to April. During this period, growth was 12.7% compared to the first four months of 2009. Gross Profit
The consolidated gross profit for 1Q10 totaled R$ 634.9 million. The consolidated gross margin in 1Q10 was 30.5% of net revenues (NR), compared to the 33.8% margin registered in 1Q09. The Parent Company’s gross margin in 1Q10 was 29.0% of NR, versus gross margin of 31.1% in 1Q09.

5 / 22
This decline in part was due to the Easter event mismatch, which in 2010 had a bigger impact in the first quarter when compared to 2009. At the beginning of 2010, as well as during 2009, new categories were introduced into the tax substitution regime, mainly in the state of São Paulo, which affects the gross margin because under the tax substitution regime, the ICMS tax incurs on the Cost of Goods Sold (COGS) and no longer on tax on sales.
224.2
535.9634.9
390.5
142.9 182.1
499.4
1Q04 1Q05 1Q06 1Q07 1Q08 1Q09 1Q10
Consolidated Gross Profit(R$ M illion)
154.4
283.3337.5
264.8
142.8118.9195.6
1Q04 1Q05 1Q06 1Q07 1Q08 1Q09 1Q10
Parent Com pany Gross Profit(R$ M illion)
31.229.3 30.5
32.430.5
33.830.5
1Q04 1Q05 1Q06 1Q07 1Q08 1Q09 1Q10
Consolidated Gross Margin (%NR)
31.1 29.030.2 30.230.428.6 28.9
1Q04 1Q05 1Q06 1Q07 1Q08 1Q09 1Q10
Parent Com pany Gross Margin (%NR)
Operating Expenses
In 1Q10, the consolidated operating expenses (with selling and general/administrative expenses) totaled R$ 397.1 million, or 19.1% of net revenues (NR), compared to R$ 350.1 million, or 22.1% of NR in 1Q09. It must be taken into consideration in this analysis the opening of 13 stores over the past four quarters; the evolution of sales through our e-commerce operations, which grew 16% in the first quarter of 2010; and Financeira Americanas Itaú, which grew its receivables portfolio by 56%, reaching a level of R$ 827 million (50% consolidated in Lojas Americanas). From the Parent Company point of view, the operating expenses (with selling and general/administrative expenses) in 1Q10 totaled R$ 200.7 million, or 17.2% of NR, compared to R$ 179.8 million, or 19.8% of NR in 1Q09.

6 / 22
1Q10 vs. 1Q09 – Growth of 37.8% in the consolidated operating income
20.3
22.1
19.119.918.6
20.821.9
1Q04 1Q05 1Q06 1Q07 1Q08 1Q09 1Q10
Consolidated Operational Expensesw ithout Depreciation & Am ortization
(%NR)
20.9 19.817.220.320.6
18.8 18.5
1Q04 1Q05 1Q06 1Q07 1Q08 1Q09 1Q10
Parent Com pany Operational Expensesw ithout Depreciation & Am ortization
(%NR)
Operating Income*
In 1Q10, the consolidated operating income* was R$ 210.9 million, representing an increase of 37.8% over 1Q09. 1Q10’s operating margin (%NR) reached 10.1%, comparing to 9.7% in 1Q09. The evolution of the operating performance of Lojas Americanas and its subsidiaries over the past six years presented a compound annual growth rate (CAGR) of 34.4%, which indicates that the Company’s strategy is converging towards the consolidation of the competitive advantages and has been adding opportunities for increasing profitability in the long-term. The parent company’s operating income in 1Q10 was R$ 115.3 million, the equivalent to an increase of 53.7% when compared to 1Q09. The operating margin (%NR) presented a growth of 1.7 pp over 1Q09 (%NR).
Consolidated Operating Incom e(R$ m illion)
55.5
153.0210.9
123.0
51.735.890.7
1Q04 1Q05 1Q06 1Q07 1Q08 1Q09 1Q10
CAGR = 34.4%
Parent Company Operating Income(R$ million)
33.1
75.0
115.3
43.227.7 36.5
68.4
1Q04 1Q05 1Q06 1Q07 1Q08 1Q09 1Q10
CAGR = 26.8%
* Operating Income before Financial Income, Equity Accounting and Other operating revenues (expenses). EBITDA In 1Q10, consolidated EBITDA1 totaled R$ 237.8 million, representing 28.0% growth over the same period of 2009. The consolidated EBITDA margin was 11.4% of net revenues in 1Q10, compared to 11.7% of NR in 1Q09. The Parent Company’s EBITDA in 1Q10 totaled R$ 136.8 million, the equivalent to an increase of 32.2% compared to the same period of the previous year. The Parent Company’s EBITDA margin during the period was 11.8% of the NR, a growth of 0.4 pp compared to 1Q09. The EBITDA by company is presented in the following table:

7 / 22
Restatement 1Q10 %NR 1Q09 %NR Var. ($) Var. (%)
EBITDA 237.8 11.4% 185.8 11.7% 52.0 28.0%
LOJAS AMERICANAS 136.8 11.8% 103.5 11.4% 33.3 32.2%B2W 103.2 11.3% 92.1 13.3% 11.1 12.1%FAI, BWU AND OTHERS (2.2) - (9.8) - 7.6 -77.6%
It is important to note that the EBITDA has grown constantly at a pace that is higher than the increase registered by gross revenues. During the period comprising 1Q04 and 1Q10, the rate made up of annual growth (CAGR) in the consolidated EBITDA was 30.7%, compared to a rate of 26.9% in consolidated gross revenues. For the Parent Company, the CAGR was 23.6% in the EBITDA and 19.0% in the Gross Revenues.
1) EBITDA – Earnings before interest, taxes, depreciation and amortization and excluding other operating revenues/expenses – is presented as additional information because we believe it represents an important indicator of our operating performance, as well as being useful for the purpose of comparison of our performance with that of other retail sector companies. However, no number should be considered by itself as a substitute for net income calculated according to Brazilian Corporate Law and the rules of the Brazilian Securities Exchange Commission (CVM) or, furthermore, as a measure of the profitability of the Company. Moreover, our calculations may not be compatible with similar measures adopted by other companies. Sales by Means of Payment
The sales by means of payment from the first quarters of 2010 and 2009 are shown in the following table:
1Q10 1Q09 Chg. 1Q10 1Q09 Chg.Cash 55% 53% +2 pp 41% 40% +1 ppCheck 1% 1% - 1% 1% -Credit Card 30% 33% -3 pp 45% 49% -4 ppPrivate Label Cards* 14% 13% +1 pp 13% 10% +3 pp*Considers the Financeira Americanas Itaú and Submarino Finance private label cards.
Sales by Means of Payment
Mean of Payment Parent Company Consolidated
47.8 66.7 75.1126.1
174.2 185.8237.8
11.4 %10 .4 % 10 .7 % 10 .2 % 10 .5 % 10 .6 % 11.7 %
1Q04 1Q05 1Q06 1Q07 1Q08 1Q09 1Q10EBITDA (R$ M M ) EBITDA (%NR)
Consolidated EBITDA
CAGR = 30.7%
38.3 48.9 47.763.8
94.7 103.5
136.8
11.4 %
10 .3 %9 .8 %
9 .3 %9 .8 %9 .8 %
11.8 %
1Q04 1Q05 1Q06 1Q07 1Q08 1Q09 1Q10EBITDA (R$ M M ) EBITDA (%NR)
Parent Com pany EBITDA
CAGR = 23.6%
8 / 22
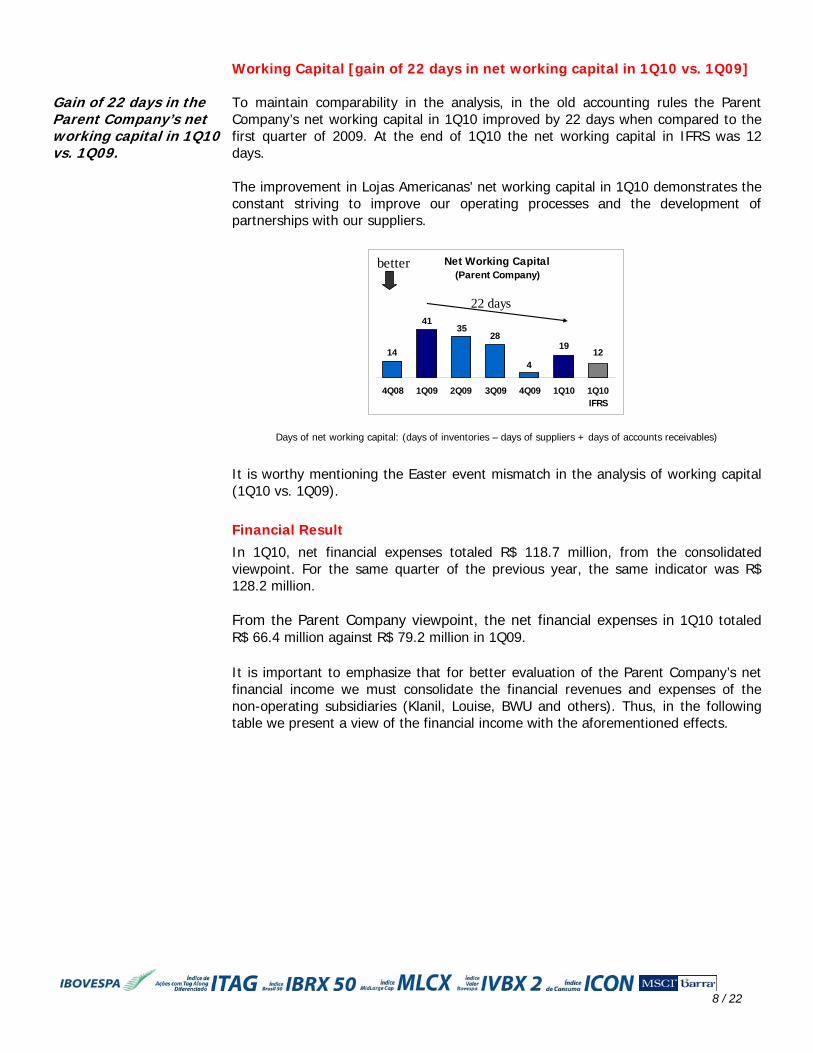
Gain of 22 days in the Parent Company’s net working capital in 1Q10 vs. 1Q09.
Working Capital [gain of 22 days in net working capital in 1Q10 vs. 1Q09] To maintain comparability in the analysis, in the old accounting rules the Parent Company’s net working capital in 1Q10 improved by 22 days when compared to the first quarter of 2009. At the end of 1Q10 the net working capital in IFRS was 12 days. The improvement in Lojas Americanas’ net working capital in 1Q10 demonstrates the constant striving to improve our operating processes and the development of partnerships with our suppliers.
Net Working Capital(Parent Company)
1219
4
2835
14
41
4Q08 1Q09 2Q09 3Q09 4Q09 1Q10 1Q10IFRS
better
22 days
Days of net working capital: (days of inventories – days of suppliers + days of accounts receivables) It is worthy mentioning the Easter event mismatch in the analysis of working capital (1Q10 vs. 1Q09). Financial Result
In 1Q10, net financial expenses totaled R$ 118.7 million, from the consolidated viewpoint. For the same quarter of the previous year, the same indicator was R$ 128.2 million. From the Parent Company viewpoint, the net financial expenses in 1Q10 totaled R$ 66.4 million against R$ 79.2 million in 1Q09. It is important to emphasize that for better evaluation of the Parent Company’s net financial income we must consolidate the financial revenues and expenses of the non-operating subsidiaries (Klanil, Louise, BWU and others). Thus, in the following table we present a view of the financial income with the aforementioned effects.

9 / 22
Breakdown of the Net Financial Result - R$MM 1Q10 1Q09R$ MM %
(+) Interest and monetary variation on money market investments 19.3 19.4 (0.1) -0.5%
(+) PV adjustment on sales 5.3 13.6 (8.3) -61.0%
(=) Total Financial Revenues 24.6 33.0 (8.4) -25.5%
(+) Interest and monetary variation on loans and financing (62.6) (80.2) 17.6 -21.9%(+) Monetary variation on tax liabilities (2.3) (3.1) 0.8 -25.8%(+) Bank charges and taxes on financial transactions (3.8) (3.3) (0.5) 15.2%
(+) PV adjustment on suppliers (22.3) (25.6) 3.3 -12.9%
(=) Total Financial Expenses (91.0) (112.2) 21.2 -18.9%
Parent Company Net Financial Result (before non-operating subsidiaries and FAI) (66.4) (79.2) 12.8 -16.2%
(+) Net Financial Result of Non-Operating Subsidiaries and FAI 10.0 9.0 1.0 11.1%
Parent Company Net Financial Result (after non-operating subsidiaries and FAI) (56.4) (70.2) 13.8 -19.7%
(+) B2W Net Financial Result - consolidated (62.3) (58.0) (4.3) 7.4%
Consolidated Net Financial Result (118.7) (128.2) 9.5 -7.4%
VariationRestatement
The net financial expenses of the Parent Company in the first quarter of 2010, taking into account the aforementioned effects and before B2W, totaled R$ 56.4 million, presenting a reduction of 19.7%. The Company continues to reaffirm its commitment to a conservative cash investment policy, manifested through the utilization of hedge instruments, in foreign currencies, to offset eventual foreign exchange rate fluctuations, whether relative to financial liabilities or total cash position. These instruments offset the foreign exchange risk, transforming the cost of the debt to local currency and interest rates (as a percentage of the CDI*). Similarly, it is worth mentioning that the Company’s cash is invested with Brazil’s largest financial institutions.
* CDI – Interbank Deposit Certificate: average rate of funding through the interbank market. Net Income and Earnings per Share Consolidated net income for the first quarter of 2010 totaled R$ 48.7 million, compared to R$ 9.1 million reported for the same period of 2009. The parent income net income in 1Q10 was R$ 43.0 million, compared to the result of R$ 2.3 million, registered in 1Q09. It is important to emphasize that in 1Q10, net income per outstanding share (excluding shares in treasury), was R$ 0.06712, significantly higher than the amount presented the previous year, of R$ 0.01205. The parent company net income per share in circulation (excluding shares in treasury), was R$ 0.05917, significantly higher than the R$ 0.00316 presented in the previous year. The following table presents the main variations from EBITDA to net income, in the Parent Company:

10 / 22
RECONCILIATION OF THE NET INCOMER$MM
1Q10 1Q09 Var. ($) Var. (%)
EBITDA 136.8 103.5 33.3 32.2%(+) Depreciation/Amortization (21.5) (28.5) 7.0 -24.6%(+) Financial Result Parent Company (66.4) (79.2) 12.8 -16.2%(+) Equity Accounting (B2W) 6.4 5.5 0.9 16.4%(+) Equity Accounting (FAI) (2.2) (7.6) 5.4 -71.1%(+) Equity Accounting (other subsidiaries) / Other Operating Income* 7.4 6.8 0.6 8.8%(+) Income Tax and social contribution (17.5) 1.8 (19.3) -1072.2%
NET INCOME 43.0 2.3 40.7 1769.6%
EARNINGS PER SHARE R$ 0.05917 R$ 0.00316 R$ 0.05601 -
OUTSTANDING SHARES 725,918 728,629* In the old accounting rules, considered as "non-operating income".
Lojas Americanas (Parent Company)Restatement
INDEBTEDNESS Lojas Americanas uses its cash flow to prioritize its investments that generate the best returns for shareholders. Thus, we have listed below the main actions carried out in the April 1, 2009 to March 31, 2010 period: • Investments made by Lojas Americanas and B2W in property and intangible
assets (development of websites and systems) in the amount of R$ 236.1 million;• Payment of dividends in the amount of R$ 68.8 million, of which R$ 38.4 million
were paid on April 12, 2010 referring to 2009’s earnings; • The buy-back of own shares (LAME3 and LAME4) in the amount of R$ 2.5 million; Lojas Americanas’ consolidated short- and long-term loans on March 31, 2010 totaled R$ 3,767.4 million. If we deduct the cash position of R$ 2,581.2 million (cash + money market investments + accounts receivable from credit and debit cards + 50% of FAI’s consumer financing) from total loans, we arrive at a net debt position of R$ 1,186.2 million.
Consolidated Indebtedness
03/31/10 12/31/09 03/31/09Short-term loans and financing 946.8 869.2 1,806.2 Short-term debentures 86.9 30.0 95.0
Short-term indebtedness 1,033.7 899.2 1,901.2 Long-term loans and financing 2,069.6 2,225.3 1,282.4 Long-term debentures 664.1 729.5 664.0
Long-term indebtedness 2,733.7 2,954.8 1,946.4 Gross indebtedness 3,767.4 3,854.0 3,847.6
Cash and banks 86.7 141.8 188.3 Money market investments 1,302.5 2,072.5 1,575.1 Receivables from clients (credit/debit cards) 775.9 469.3 302.3 Customers financing - FAI (50%) 416.1 403.7 266.7 Total Cash and Cash Equivalents 2,581.2 3,087.3 2,332.4 Net Cash (Debt) (1,186.2) (766.7) (1,515.2)Average Maturing Term of the Debt 717 800 575
In the analysis of the total cash and cash equivalents presented in the indebtedness table, one must take into account the seasonal effects of sales between the fourth quarter 2009 and the first quarter 2010.

11 / 22
Capital expenditures from the Parent Company’s viewpoint totaled R$ 14.6 million in 1Q10, focused on the opening and refurbishment of stores. Opening of 6 stores as of today – 4 in the Traditional model and 2 in the Express model.
In order to face the uncertainties and volatility of the financial market, Lojas Americanas is guided by the principle of preserving cash and extending its debt profile. During 2009 and the beginning of 2010, a number of measures were taken with this objective in mind, permitting us to consolidate the Company’s growth plan over the long-term. As can be seen in the previous table, gross consolidated short-term debt declined by R$ 867.5 million from March 31, 2009 to the same period of 2010. In counterpart, the long-term debt rose R$ 787.3 million. In the same period, there was a reduction of R$ 80.2 million in the gross debt and an improvement of the average debt maturity from 575 days to 717 days (from 19 to 23 months), extending the average maturity by 24.7%. CAPITAL EXPENDITURES AND EXPANSION Parent Company Investments Lojas Americanas, from the Parent Company’s viewpoint, invested through 1Q10 a total of R$ 14.6 million, with emphasis on: expansion and refurbishment of the store network and technological upgrade. Included in this total our investments in goods for rental in the amount of R$ 3.4 million. The following table shows the details of Lojas Americanas’ Parent Company investments in 1Q10:
R$ million %Openings and Refurbishment 7.2 49%Goods for rental 3.4 23%Technological upgrade 4.0 28%TOTAL 14.6 100%
Expansion of the Chain of Stores
We intend to create value for our shareholders, following our internal motto “We Always Want More”. The Lojas Americanas’ expansion project takes place on three main fronts: Lojas Americanas (brick-and-mortar retail), B2W (Internet, telephone sales, catalogues, TV and kiosks) and Financeira Americanas Itaú (financial products). In the past nine years, Lojas Americanas increased its network five times through its organic expansion program and the acquisition of BWU, the company that owned the ca BLOCKBUSTER® trademark in Brazil. In 2010, until today, in step with our “SEMPRE MAIS BRASIL” program, we inaugurated 6 new stores and decided to transfer three BLOCKBUSTER® stores to Lojas Americanas. Besides the stores that were opened, we have another 22 openings scheduled and another 25 contracts for store openings in 2010 under preparation.

12 / 22
State Traditional Stores Express Stores Sales Area(m²)
Ceará 1 - 1,091Rio de Janeiro - 1 588Tocantins 1 - 1,166Total 2 1 2,845
Openings in the 1 st Quarter/2010:
State Traditional Stores Express Stores Sales Area(m²)
Ceará 1 - 821Maranhão 1 - 1,147São Paulo - 1 651Total 2 1 2,619
Openings after the 1 st Quarter/2010:
Expansion Plan for the next four years – “SEMPRE MAIS BRASIL” For the next four years (period between 2010 and 2013), we are planning to open 400 new stores in Brazil. Currently, all of the Company’s stores are located in only 153 of the more than 5,500 cities in the country, which demonstrates the opportunity Lojas Americanas has for opening new stores in cities that are at a greater distance from Brazil’s large urban centers. As illustrated in the following chart, based on economic feasibility studies and analysis conducted internally using the EVA® (Economic Value Added) tool, together with socio-economic data (population, income, access to basic services, access to consumer goods, among others), we believe that at this moment the possibility exists that our brick-and-mortar retail stores could be present in another 200 cities, besides the ones in which we already have operations.
5,150
153 197Current cities with Lojas Americanas
Cities with potential for opening a new store
Nationwide distribution
At the end of 2009 our stores were located in 22 states of the country plus the Federal District, with distribution as follows: 66% in the Southeast region, 19% in the

13 / 22
South/Midwest and 15% in the North/Northeast. Coupled with our confidence in the development of the country, the expansion plan for these new cities could especially benefit the North/Northeast/Midwest regions, as demonstrated in the projection of our openings that follows.
Dec/2009 %Openings
2010 - 2013% Dec/2013* %
Southeast 316 66% 200 50% 516 59%Northeast 61 13% 90 22% 151 17%North 9 2% 40 10% 49 6%Midwest 38 8% 40 10% 78 9%South 52 11% 30 8% 82 9%TOTAL 476 100% 400 100% 876 100%*Estimate of the number of stores by region by the end of 2013.
Store Distribution by Region
As occurred historically, the growth should be in the proportion of 70% Traditional stores (average sales area between 1,300 m2 and 1,500 m2) and 30% Express stores (average sales area between 300 m2 and 500 m2). The following table shows an estimate of store openings in the next four years:
YearNumber of
Stores2010 60 to 702011 90 to 1002012 110 to 1202013 120 to 130
Moreover, in order to support the distribution of merchandise to the stores, we are preparing the opening of two new Distribution Centers, to be located in the Midwest and South regions. It is important to mention that the Company’s current cash position and the future cash generation, pegged to the elongation of the debt profile, let us in a comfortable position to make the expected investments, which should be approximately R$ 1.0 billion.
Investment (2010 to 2013) - R$MMOpenings/Refurbishment 720Technology/Logistics/Operation 280Total 1,000
In 2006, a loan for approximately R$ 220 million was approved by the BNDES, earmarked for expansion, refurbishment and standardization of the store network along with technological modernization during the last three years. As we have done in the past, we are presenting a project to the BNDES for our expansion program for the 2010 – 2013 period, which we are calling “SEMPRE MAIS BRASIL.” Finally, we would like to reinforce that, “We will continue to pursue our learning path and to overcome obstacles, and this makes us enthusiastic since it will enable us to achieve new levels of results, always seeking to better meet our customer’s needs.”

14 / 22
B2W – Growth of 16% of Gross Revenues in 1Q10 vs. 1Q09
B2W – International expansion of tickets sales in Argentina
B2W – COMPANHIA GLOBAL DO VAREJO We are presenting below the highlights of the results for the first quarter (1Q10) of our subsidiary B2W - Companhia Global do Varejo (BOVESPA: BTOW3). The financial statements that serve as the basis for the following comments were prepared in accordance with the norms issued by the Securities Exchange Commission (CVM), as well as the Novo Mercado. Except when otherwise specified, the analyses refer to the consolidated results.
Gross Revenue: growth of 16% in 1Q10 In 1Q10, Gross Revenue reached R$1,012.2 million, representing a 16% growth in comparison with 1Q09.
Net Revenue: Growth of 32% in 1Q10 Net Revenue increased from R$694.5 million in 1Q09 to R$913.3 million in 1Q10, a growth of 32%.
EBITDA: R$103.2MM in 1Q10 EBITDA reached R$103.2 million in 1Q10, representing a 12% growth, with margin of 11.3% of Net Revenue.
Net Income: R$14.0MM in 1Q10 In 1Q10, Net Income reached R$14.0 million versus R$12.1 million in 1Q09.
Cash Conversion Cycle: increase of 5 days in 1Q10 In 1Q10, Parent Company’s cash conversion cycle was 106 days.
International expansion of tickets sales in Argentina
B2W is expanding its business model for online sales of movie tickets in Argentina, in partnership with Cinemark.
Best Price Guarantee for Travel Submarino Viagens launches the campaign "Melhor Preço Garantido", which guarantees best prices in airline tickets.
Submarino Card: penetration higher than 26% The participation on sales made on the Submarino website surpassed 26% in March’10.
Parent Company Results: • Gross Revenue: Reached R$937.1 million in 1Q10, with growth of 18% in
relation to 1Q09.
• Net Revenue: Reached R$852.1 million in 1Q10, with growth of 35% in relation to 1Q09.
• EBITDA: reached R$93.6 million in 1Q10, with growth of 12% in relation to
1Q09.

15 / 22
Share of FAI cards (private label and co-branded) was 14% of the Parent Company’s sales at the close of March 2010. Financeira Americanas Itaú closed 1Q10 with about 2.6 million cards issued and R$ 827 million in receivables.
FINANCEIRA AMERICANAS ITAÚ - FAI Financeira Americanas Itaú (FAI) is dedicated to the financing of purchases via private label and co-branded (Visa and Mastercard) credit cards, the supply of personal credit and other financial products and services (insurance and extended guarantees). It operates through points of sale in the Lojas Americanas stores, through the Internet (Americanas.com and Shoptime) and the Shoptime TV channel. During the second half of 2008, a new strategy was implemented for offering the private label and co-branded credit cards as being the best means of payment in Lojas Americanas stores and Internet operations, as well as slowing down the offer of personal loans. This new way of operating led to a need for investing in the client base (private label and co-branded cards), and in the first quarter of 2010, FAI already had issued about 2.6 million cards, of which 2.2 million were private label, 416,000 were co-branded and 40,000 were for personal loans. By the end of the first quarter of 2010, the share of FAI cards reached 14% of the Parent Company’s sales. The receivables portfolio in March 2010 was R$ 827 million, representing a 56% increase over March 2009. The mix of the current portfolio is composed of 6% personal loans and 94% credit cards, which in the same period of the previous year was 27% personal loans and 73% credit cards. This transformation helped to improve the portfolio’s losses index, which went from 8% to 6% between the two periods under analysis. Gross Financial Revenues added to Service Revenues in 1Q10 rose 102% compared to the same period the previous year. The current strategy of focusing on consumer products will be maintained and we will continue to offer private label cards and to “brand” the performed base, besides increasing sales through co-branded cards. Insurance and extended warranty sales will be intensified, both through the Internet as well as in our brick-and-mortar stores.
Portfolio of R ec eivables F AI(R $ million )
64 89 107 145 230349 387 469 561
736 777
177 179 179 185175
164 144114
88
62 50
3Q07 4Q07 1Q08 2Q08 3Q08 4Q08 1Q09 2Q09 3Q09 4Q09 1Q10
P rivate L abel + C o‐B randed P ers onal L oans
56%

16 / 22
Glossary: Revenues: Purchases conducted using Americanas cards, either cash or installments, and liberation of personal loans. Receivables portfolio: Amounts to receive from sales. Gross financial and services revenues: Revenues from the receivables portfolio stemming from the allocation of interest, and services and insurance tariffs, net of financial mediation expenses and the provision for doubtful accounts.
About Lojas Americanas S.A.
Lojas Americanas was founded in 1929, in Niterói, Rio de Janeiro, and is presently in all of the regions of the country (23 states plus the Federal District), with 478 stores — 284 in the Traditional format, 192 in the Express format, and 2 in the BLOCKBUSTER® format — equivalent to 509 thousand square meters of sales space. The average sales space of traditional stores is 1,500 square meters, with daily stock replacement and an offer of approximately 60,000 items. The Express model follows the smaller store concept, with an average size of 400 square meters, just-in-time logistics and a selected product range of about 15,000 items, appropriate for each location and client profile of these stores. Lojas Americanas assures its clients competitive prices with respect to its competition and offers quality products in its Home, Leisure, Beauty, Children’s, Confectionary and Convenience Foods worlds. Lojas Americanas’ brick-and-mortar stores are serviced by three distribution centers, located in São Paulo, Rio de Janeiro and Pernambuco.
Lojas Americanas’ shares are listed on the BOVESPA through ticker symbols LAME3 (common) and LAME4 (preferred).
“We always want more”

17 / 22
ATTACHMENTS
INCOME STATEMENTSPERIODS ENDED ON MARCH 31PARENT COMPANY(R$ MM)
1Q10
Restatement
1Q09
Restatement
Var %
Gross Sales and Services Revenues 1,377.8 1,121.1 22.9%Taxes, returns and discounts on sales (213.6) (211.6) 0.9%
Net Sales and Services Revenues 1,164.2 909.5 28.0%Cost of goods and services sold (826.7) (626.2) 32.0%
Gross Profit 337.5 283.3 19.1%Gross Margin (% of Net Revenues) 29.0% 31.1% -2.1 pp
Operating Revenues (expenses) (222.2) (208.3) 6.7%Sales (185.5) (165.7) 11.9%General and administrative (15.2) (14.1) 7.8%Depreciation/Amortization (21.5) (28.5) -24.6%
Operating Expenses (% of Net Revenues) 19.1% 22.9% -3.8 pp
Operating Income before financial expenses and equity accounting 115.3 75.0 53.7%
Operating Margin (% of Net Revenues) 9.9% 8.2% +1.7 pp
Financial Expenses - Net (66.4) (79.2) -16.2%Equity Accounting 11.6 4.7 146.8%Other operating Income (expenses)* 0.0 0.0 -Income Tax and Social Contribution (17.5) 1.8 -1072.2%
Net Income 43.0 2.3 1769.6%Net Margin (% of Net Revenues) 3.7% 0.3% +3.4 pp
EBITDA 136.8 103.5 32.2%EBITDA Margin (% of Net Revenues) 11.8% 11.4% +0.4 pp
* Under the former accounting system, called “non-operating income”.
18 / 22
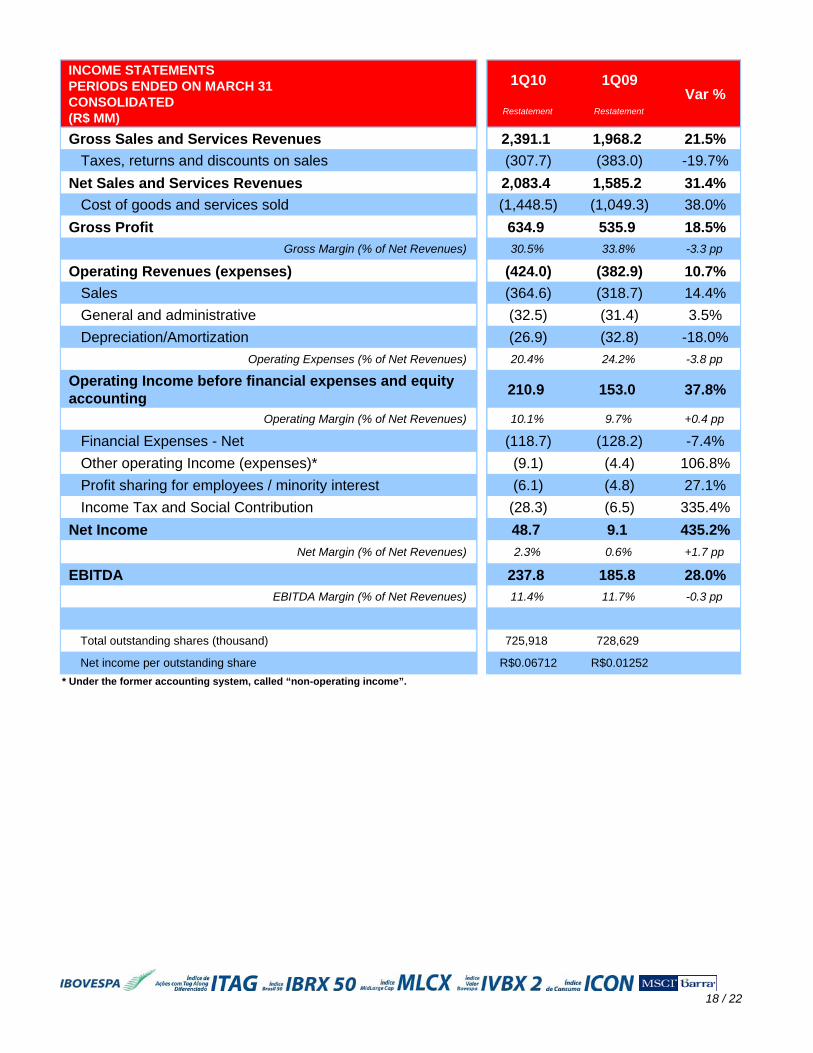
INCOME STATEMENTSPERIODS ENDED ON MARCH 31CONSOLIDATED(R$ MM)
1Q10
Restatement
1Q09
Restatement
Var %
Gross Sales and Services Revenues 2,391.1 1,968.2 21.5%Taxes, returns and discounts on sales (307.7) (383.0) -19.7%
Net Sales and Services Revenues 2,083.4 1,585.2 31.4%Cost of goods and services sold (1,448.5) (1,049.3) 38.0%
Gross Profit 634.9 535.9 18.5%Gross Margin (% of Net Revenues) 30.5% 33.8% -3.3 pp
Operating Revenues (expenses) (424.0) (382.9) 10.7%Sales (364.6) (318.7) 14.4%General and administrative (32.5) (31.4) 3.5%Depreciation/Amortization (26.9) (32.8) -18.0%
Operating Expenses (% of Net Revenues) 20.4% 24.2% -3.8 pp
Operating Income before financial expenses and equity accounting 210.9 153.0 37.8%
Operating Margin (% of Net Revenues) 10.1% 9.7% +0.4 pp
Financial Expenses - Net (118.7) (128.2) -7.4%Other operating Income (expenses)* (9.1) (4.4) 106.8%Profit sharing for employees / minority interest (6.1) (4.8) 27.1%Income Tax and Social Contribution (28.3) (6.5) 335.4%
Net Income 48.7 9.1 435.2%Net Margin (% of Net Revenues) 2.3% 0.6% +1.7 pp
EBITDA 237.8 185.8 28.0%EBITDA Margin (% of Net Revenues) 11.4% 11.7% -0.3 pp
Total outstanding shares (thousand) 725,918 728,629
Net income per outstanding share R$0.06712 R$0.01252* Under the former accounting system, called “non-operating income”.

19 / 22
Balance Sheets LOJAS AMERICANAS S.A.BALANCE SHEETSON MARCH 31, 2010 AND 2009 03/31/2010 03/31/2009 03/31/2010 03/31/2009In Thousand Reais Restatement Restatement Restatement Restatement
TOTAL ASSETS
CURRENT H J L N
Cash and banks 63,339 122,403 86,657 188,339Temporary cash investments 575,279 461,568 1,296,782 1,570,670Trade accounts receivable 574,627 116,959 1,329,825 725,909Inventories 790,476 789,276 1,199,086 1,113,298Recoverable taxes 145,378 131,069 205,174 168,296Deferred income tax and social contribution - - - -Dividends and Interest on own capital receivable 6,403 10,378 - -Prepaid expenses 11,813 7,766 26,993 38,227Other accounts receivable 137,206 150,104 217,482 198,863
2,304,521 1,789,523 4,361,999 4,003,602NON-CURRENT
Long-Term AssetsTemporary cash investments - - 5,678 4,469Loans and advances to subsidiary companies 4,378 2,361 - -Receivables from stockholders - Stock Option Plan 35,273 82,400 35,273 82,400Deferred income tax and social contribution 42,565 58,535 306,204 328,230Escrow deposits 40,499 41,581 63,011 57,640Prepaid expenses - - - 6,272Recoverable taxes and other accounts receivable 9,458 13,395 9,498 19,817
132,173 198,272 419,664 498,828
Investments 534,063 478,381 - -Property and equipment 390,888 415,732 493,898 501,336Intangible 443,996 453,308 833,942 749,375Deferred assets 68,056 95,431 - -
1,569,176 1,641,124 1,747,504 1,749,539
3,873,697 3,430,647 6,109,503 5,753,141The accompanying notes are an integral part of these financial statements
Parent Company Consolidated
03/31/2010 03/31/2009 03/31/2010 03/31/2009Restatement Restatement Restatement Restatement
LIABILITIES
CURRENT T V X Z
Suppliers 1,086,296 878,660 1,416,715 1,301,197Loans and financing 376,454 696,872 946,789 1,806,229Debentures 79,093 84,737 86,887 95,043Payroll and related charges 22,667 19,724 34,576 21,436Taxes payable 77,780 48,613 105,230 68,045Dividends and participations proposed 43,466 34,850 48,623 42,540Provisions for contingencies 10,281 16,472 15,408 19,445Other current liabilities 61,949 43,200 206,300 138,619
1,757,986 1,823,128 2,860,528 3,492,554
NON-CURRENT
Long-Term Liabilities:
Loans and advances from subsidiaries 2,567 2,567 - -Loans and financing 1,370,782 1,005,777 2,069,642 1,282,403Debentures 300,772 300,899 664,127 663,953Taxes payable 53,708 54,523 89,589 78,096Provision for contingencies 57,852 46,219 78,202 53,462Allowance for Loss on Investments 17,037 386 - -Advance for cession in mining usage rights 26,393 27,923 21,994 23,269Other accounts payable - - 15,508 15,019
1,829,111 1,438,294 2,939,062 2,116,202
Capital 242,845 273,718 242,845 273,718Capital reserves 5,903 3,703 5,903 3,703Income reserves 181,806 68,210 181,806 68,210Treasury stock's (157,885) (155,353) (157,885) (155,353)Equity valuation adjustments 359 139 359 139Retained earnings 13,572 (21,192) (53,098) (139,665)Comprehensive income - - - -Capital transactions goodwill - - - -Retained losses - - - -Minority Interest - - 89,983 93,633
286,600 169,225 309,913 144,385
3,873,697 3,430,647 6,109,503 5,753,141
Parent Company Consolidated

20 / 22
Cash Flow Statements
LOJAS AMERICANAS S.A. CASH FLOW STATEMENT - INDIRECT METHOD QUARTERS ENDED ON MARCH 31 1Q10 1Q09 1Q10 1Q09 In Million Reais Restatement Restatement Restatement Restatement
Cash Flow From Operating Activities
Net Income for the period 42,952 2,303 48,722 9,123
Adjustments to net income:Depreciation and Amortization 26,395 28,457 32,369 32,781 Write-off of the residual and deferred value of fixed assets 1,297 1,089 1,513 1,911 Equity in subsidiaries and affiliates (11,642) (4,744) - - Deferred income tax and social contribution 10,990 (1,741) 16,217 2,373 Interest on credits (515) (1,144) (515) (1,144) Interest and variations on financing and other debt 58,202 21,557 98,161 103,081 Provision for contigencies adjustment - - 3,123 - Stock Option Plan 363 322 600 768 Allowance for doubtful accounts 957 214 28,225 20,353 Others (711) (868) (670) (11,575) Minority interest - - 6,091 3,482
Adjusted Net Income 128,288 45,445 233,836 161,153
Decrease (increase) in Operating Assets:Trade accounts receivable 96,555 181,675 24,387 380,980 Inventories (27,068) (146,434) 50,038 (89,573) Recoverable taxes (28,229) (43,794) (22,392) (44,467) Prepaid expenses (current and non-current) (7,796) (3,236) (28,124) 7,595 Escrow deposits 22 (1,666) (421) (2,173) Other accounts receivable (current and non-current) (1,280) (66) (17,533) 11,170
32,204 (13,521) 5,955 263,532
Increase (decrease) in Operating Liabilities:Suppliers (166,431) (150,107) (372,519) (299,234) Payroll and related charges (551) (2,137) (181) (5,594) Taxes payable (current and non-current) (62,295) (75,076) (64,848) (63,240) Contingencies payments (current and non-current) (653) (1,732) (738) (1,732) Loans and advances from subsidiaries 3,205 (41) - - Other accounts payable (current and non-current) (33,737) (18,364) (44,546) (21,792)
(260,462) (247,457) (482,832) (391,592)
Net Cash provided (or used) by Operating Activities (99,970) (215,533) (243,041) 33,093
Cash Flows from Investing ActivitiesTemporary cash investments 562,357 566,301 768,582 602,923 Property and equipment (12,868) (12,776) (19,553) (23,634) Intangible (1,756) (1,144) (42,600) (44,452) Dividends received - - - 4,288
Net Cash Flow provided (or used) by Investing Activities 547,733 552,381 706,429 539,125
Cash Flow from Financing ActivitiesLoans and Financing (current and non-current):
Borrowings - 172,603 58,081 101,133 Liquidation (142,887) (278,850) (214,169) (350,627)
(142,887) (106,247) (156,088) (249,494) Debentures (current and non-current) (7,188) (80,348) (26,403) (94,769) Accounts Receivable Discounts (309,235) (99,007) (336,905) (149,350) Receivables from Stock Option Plan 977 - 977 - Capital Increase - - - - Dividends and participations paid - - - (2,845) Share buy-back (92) (111) (92) (111)
Net Cash provided (or used) by Financing Activities (458,425) (285,713) (518,511) (496,569)
Net increase (decrease) in Cash (10,662) 51,135 (55,123) 75,649
Cash at the beginning of the period 74,001 55,741 141,780 112,690 Cash at the end of the period 63,339 106,876 86,657 188,339
Net Increase (decrease) in Cash (10,662) 51,135 (55,123) 75,649 The accompanying notes are an integral part of these financial statements
Parent Company Consolidated

21 / 22
Evolution of the number of stores, associates and sales areas - Lojas Americanas
Number of Stores Sales Area Number of Associates
March 31, 2009 469 496,000 m² 12,987 Opened Closed/Transferred
10 (3)
December 31, 2009 476 504,000 m² 13,425
Opened Closed/Transferred
3 (3)
March 31, 2010 476 506,000 m² 13,441 This table contemplates the number of stores, sales areas and number of associates of the Parent Company and BWU. Stores transferred: the product assortment of the stores in the BLOCKBUSTER® format were transferred to the nearest Lojas Americanas stores.

22 / 22
EARNINGS CONFERENCE CALL
Statements relating to the prospects of the business, estimates for operating and financial results, and those related to growth prospects of Lojas Americanas, eventually expressed in this report are merely projections and, as such, are based exclusively on the expectations of Lojas Americanas’ management concerning the future of the business and its continued access to capital to fund the Company’s business plan. Such statements depend, substantially, on changes in market conditions, government regulations, competitive pressures, the performance of the Brazilian economy and the industry, among other factors and are, therefore, subject to change without prior notice.
MSCI Brand logo: The use of Morgan Stanley Capital International Inc. registered trademarks and indices ("MSCI") does not constitute any type of sponsorship, endorsement or promotion on the part of MSCI, its affiliates, its suppliers or other parties involved or related in the compilation, computation or creation of any MSCI index. MSCI’s indices are registered trademarks of MSCI or its affiliates and Lojas Americanas S.A. has been granted a license to use these trademarks for given purposes.