consolidated full-year report of the pgnig … · consolidated full-year report of the pgnig group...
TRANSCRIPT

Page 1 of 119
CONSOLIDATED FULL-YEAR REPORT
OF THE PGNiG GROUP
FOR THE YEAR 2014


PGNiG Group Consolidated full-year report for the year ended December 31st 2014
(PLNm)
Page 3 of 119
CONSOLIDATED FULL-YEAR REPORT
FOR THE YEAR ENDED DECEMBER 31ST 2014 COMPRISES:
1. LETTER FROM THE PRESIDENT OF THE MANAGEMENT BOARD
2. AUDITOR’S OPINION AND REPORT FROM THE AUDIT OF THE CONSOLIDATED FINANCIAL STATEMENTS
3. FINANCIAL HIGHLIGHTS
4. CONSOLIDATED FINANCIAL STATEMENTS OF THE PGNiG GROUP FOR THE YEAR
ENDED DECEMBER 31ST 2014
5. DIRECTORS’ REPORT ON THE PGNiG GROUP’S OPERATIONS IN THE YEAR ENDED DECEMBER 31ST 2014
6. REPRESENTATION OF THE MANAGEMENT BOARD ON RELIABILITY OF THE
CONSOLIDATED FINANCIAL STATEMENTS OF THE PGNiG GROUP FOR THE YEAR ENDED DECEMBER 31ST 2014
7. REPRESENTATION OF THE MANAGEMENT BOARD ON APPOINTMENT OF THE ENTITY
QUALIFIED TO AUDIT THE CONSOLIDATED FINANCIAL STATEMENTS OF THE PGNiG GROUP FOR THE YEAR ENDED DECEMBER 31ST 2014

PGNiG Group Consolidated full-year report for the year ended December 31st 2014
(PLNm)
Page 4 of 119
FINANCIAL HIGHLIGHTS
for the year ended December 31st 2014
PLNm EURm
Consolidated financial data Year ended
Dec 31 2014
Year ended
Dec 31 2013
Year ended
Dec 31 2014
Year ended
Dec 31 2013
Revenue 34,304 32,044 8,188 7,610
Operating profit/(loss) 3,843 3,149 917 748
Profit/(loss) before tax 3,626 2,709 866 643
Net profit/(loss) attributable to owners of the parent 2,823 1,918 674 455
Net profit/(loss) 2,822 1,920 674 456
Comprehensive income attributable to owners of the parent 2,602 2,021 621 480
Total comprehensive income 2,601 2,023 621 480
Net cash generated by operating activities 6,979 7,813 1,666 1,855
Net cash (used in)/generated by investing activities (3,680) (3,060) (878) (727)
Net cash used in/(generated by) financing activities (3,169) (3,874) (756) (920)
Net increase/(decrease) in cash and cash equivalents 130 879 31 209
Earnings/(loss) and diluted earnings/(loss) per share attributable to holders of ordinary shares of the parent (in PLN and EUR)
0.48 0.33 0.11 0.08
As at Dec 31
2014
As at Dec 31
2013
As at Dec 31
2014
As at Dec 31
2013
Total assets 48,926 48,384 11,479 11,667
Total liabilities 18,757 19,931 4,401 4,806
Total non-current liabilities 12,384 12,093 2,905 2,916
Total current liabilities 6,373 7,838 1,496 1,890
Total equity 30,169 28,453 7,078 6,861
Share capital 5,900 5,900 1,384 1,423
Weighted average number of shares (million) 5,900 5,900 5,900 5,900
Book value per share and diluted book value per share (in PLN and EUR)
5.11 4.82 1.20 1.16
Dividend per share declared or paid (in PLN and EUR, respectively) 0.15 0.13 0.04 0.03
Items of the statement of profit or loss, statement of comprehensive income and statement of cash
flows were translated at the EUR/PLN exchange rate computed as the arithmetic mean of mid rates
quoted by the National Bank of Poland (NBP) for the last day of each calendar month in a given
reporting period.
Items of the statement of financial position were translated at the average EUR/PLN exchange rate
quoted by the NBP at the end of a given period.
Average EUR/PLN exchange rates quoted by the NBP
Dec 31 2014 Dec 31 2013 -
Average exchange rate in the period 4.1893 4.2110 -
Exchange rate at end of the period 4.2623 4.1472

PGNiG Group Consolidated full-year report for the year ended December 31st 2014
(PLNm)
Page 5 of 119
CONSOLIDATED FINANCIAL STATEMENTS
OF THE PGNiG GROUP
FOR THE YEAR 2014
prepared in accordance with the International
Financial Reporting Standards
endorsed by the European Union

PGNiG Group Consolidated financial statements for the year ended 31 grudnia 2014
(PLNm)
Page 6 of 119
TABLE OF CONTENTS
CONSOLIDATED STATEMENT OF PROFIT OR LOSS .......................................................................................................... 7
CONSOLIDATED STATEMENT OF COMPREHENSIVE INCOME ........................................................................................ 8
CONSOLIDATED STATEMENT OF FINANCIAL POSITION ................................................................................................. 9
CONSOLIDATED STATEMENT OF CASH FLOWS .............................................................................................................. 10
CONSOLIDATED STATEMENT OF CHANGES IN EQUITY ................................................................................................ 11
NOTES TO THE CONSOLIDATED FINANCIAL STATEMENTS ........................................................................................... 12
1. GENERAL INFORMATION ......................................................................................................................................................... 12
2. APPLIED ACCOUNTING POLICIES .......................................................................................................................................... 18
3. OPERATING SEGMENTS ........................................................................................................................................................... 48
4. OPERATING EXPENSES.............................................................................................................................................................. 51
5. FINANCE INCOME AND COSTS ............................................................................................................................................... 52
6. EQUITY ACCOUNTING FOR INVESTEES ............................................................................................................................... 52
7. INCOME TAX ................................................................................................................................................................................ 54
8. DISCONTINUED OPERATIONS ................................................................................................................................................ 57
9. EARNINGS/(LOSS) PER SHARE ................................................................................................................................................ 57
10. DIVIDEND PAID AND PROPOSED ........................................................................................................................................... 59
11. PROPERTY, PLANT AND EQUIPMENT .................................................................................................................................. 59
12. INVESTMENT PROPERTY .......................................................................................................................................................... 63
13. INTANGIBLE ASSETS .................................................................................................................................................................. 64
14. OTHER FINANCIAL ASSETS ....................................................................................................................................................... 67
15. DEFERRED TAX ASSETS ............................................................................................................................................................. 67
16. OTHER NON-CURRENT ASSETS .............................................................................................................................................. 67
17. INVENTORIES ............................................................................................................................................................................... 68
18. TRADE AND OTHER RECEIVABLES ......................................................................................................................................... 69
19. CURRENT INCOME TAX ............................................................................................................................................................ 70
20. OTHER ASSETS ............................................................................................................................................................................. 70
21. CASH AND CASH EQUIVALENTS ............................................................................................................................................. 70
22. ASSETS HELD FOR SALE ............................................................................................................................................................. 71
23. SHARE CAPITAL ........................................................................................................................................................................... 71
24. BORROWINGS AND DEBT SECURITIES ................................................................................................................................. 72
25. EMPLOYEE BENEFIT OBLIGATIONS ....................................................................................................................................... 75
26. PROVISIONS ................................................................................................................................................................................. 76
27. DEFERRED REVENUE ................................................................................................................................................................. 77
28. DEFERRED TAX LIABILITIES ...................................................................................................................................................... 77
29. OTHER NON-CURRENT LIABILITIES ....................................................................................................................................... 77
30. TRADE AND OTHER PAYABLES ............................................................................................................................................... 78
31. CAUSES OF DIFFERENCES BETWEEN ITEMS OF THE STATEMENT OF FINANCIAL POSITION AND
CHANGES WHICH ARE DUE TO CHANGES IN CERTAIN ITEMS OF THE STATEMENT OF CASH FLOWS, AND
BREAK-DOWN OF “OTHER ADJUSTMENTS” UNDER OPERATING ACTIVITY ........................................................... 79
32. FINANCIAL INSTRUMENTS AND FINANCIAL RISK MANAGEMENT POLICY .............................................................. 82
33. DERIVATIVE FINANCIAL INSTRUMENTS ............................................................................................................................100
34. CONTINGENT LIABILITIES AND RECEIVABLES .................................................................................................................105
35. OFF-BALANCE SHEET LIABILITIES ........................................................................................................................................107
36. RELATED ENTITIES ....................................................................................................................................................................108
37. EMPLOYEES (NUMBER OF STAFF) .......................................................................................................................................114
38. RESTRUCTURING PROCESS WITHIN THE GROUP ...........................................................................................................114
39. CAPITAL MANAGEMENT ........................................................................................................................................................115
40. OTHER IMPORTANT INFORMATION ..................................................................................................................................115
41. EVENTS SUBSEQUENT TO THE END OF THE REPORTING PERIOD.............................................................................118

PGNiG Group Consolidated financial statements for the year ended 31 grudnia 2014
(PLNm)
Page 7 of 119
CONSOLIDATED STATEMENT OF PROFIT OR LOSS for the year ended December 31st 2014
Note
3 months ended Dec 31 2014
Year ended Dec 31 2014
3 months ended Dec 31 2013
Year ended Dec 31 2013
restated restated
audited audited audited audited
Revenue 3 11,485 34,304 9,101 32,044
Raw materials and consumables used 4.1 (7,943) (21,229) (5,495) (19,873)
Employee benefits expense 4.2 (823) (2,827) (1,099) (3,214)
Depreciation and amortisation expense
(600) (2,502) (710) (2,463)
Services 4.3 (818) (2,843) (916) (2,808)
Work performed by the entity and capitalised
313 980 319 983
Other income and expenses 4.4 (855) (2,040) (1,106) (1,520)
Total operating expenses 3 (10,726) (30,461) (9,007) (28,895)
Operating profit/(loss)
759 3,843 94 3,149
Finance income 5 18 86 (7) 69
Finance costs 5 (149) (432) (79) (465)
Share in net profit/(loss) of equity-accounted entities 6 129 129 (8) (44)
Profit/(loss) before tax
757 3,626 - 2,709
Income tax 7 (71) (804) (162) (789)
Net profit/(loss)
686 2,822 (162) 1,920
Attributable to:
Owners of the parent
688 2,823 (161) 1,918
Non-controlling interests
(2) (1) (1) 2
Earnings/(loss) and diluted earnings/(loss) per share attributable to holders of ordinary shares of the parent (PLN)
9 0.12 0.48 (0.03) 0.33

PGNiG Group Consolidated financial statements for the year ended 31 grudnia 2014
(PLNm)
Page 8 of 119
CONSOLIDATED STATEMENT OF COMPREHENSIVE INCOME for the year ended December 31st 2014
3 months ended
Dec 31 2014 Year ended Dec 31 2014
3 months ended Dec 31 2013
Year ended Dec 31 2013
restated restated
audited audited audited audited
Net profit/(loss)
686 2,822 (162) 1,920
Other comprehensive income that will be reclassified to
profit or loss if specific conditions are met, relating to:
(193) (197) (29) 5
Exchange differences on translating foreign operations
(34) 18 (47) (53)
Hedge accounting
(196) (265) 22 72
Deferred tax
37 50 (4) (14)
Other comprehensive income that will not be reclassified
to profit or loss, relating to: (13) (24) 104 98
Actuarial gains/(losses) on employee benefits (19) (32) 124 117
Deferred tax
6 8 (20) (19)
Other comprehensive income, net
(206) (221) 75 103
Total comprehensive income 480 2,601 (87) 2,023
Attributable to:
Owners of the parent
482 2,602 (86) 2,021
Non-controlling interests
(2) (1) (1) 2

PGNiG Group Consolidated financial statements for the year ended 31 grudnia 2014
(PLNm)
Page 9 of 119
CONSOLIDATED STATEMENT OF FINANCIAL POSITION as at December 31st 2014
Note As at Dec 31 2014 As at Dec 31 2013 As at Jan 1 2013
restated restated
audited audited audited
ASSETS
Non-current assets
Property, plant and equipment 11 33,528 33,033 33,784
Investment property 12 9 9 11
Intangible assets 13 1,113 1,164 1,146
Investments in equity-accounted entities 6 856 727 771
Other financial assets 14 243 242 172
Deferred tax assets 15 1,783 2,233 2,383
Other non-current assets 16 160 71 76
Total non-current assets
37,692 37,479 38,343
Current assets
Inventories 17 3,189 3,378 3,064
Trade and other receivables 18 4,236 4,086 5,374
Current tax assets 19 5 48 150
Other assets 20 132 171 84
Derivative financial instrument assets 33 567 307 105
Cash and cash equivalents 21 2,958 2,827 1,948
Assets held for sale 22 147 88 108
Total current assets
11,234 10,905 10,833
Total assets
48,926 48,384 49,176
EQUITY AND LIABILITIES
Equity
Share capital 23 5,900 5,900 5,900
Share premium
1,740 1,740 1,740
Accumulated other comprehensive income
(270) (49) (152)
Retained earnings/(deficit)
22,794 20,856 19,705
Equity attributable to owners of the parent
30,164 28,447 27,193
Equity attributable to non-controlling interests
5 6 4
Total equity
30,169 28,453 27,197
Non-current liabilities
Borrowings and other debt instruments 24 5,069 5,385 5,509
Employee benefit obligations 25 604 502 381
Provisions 26 1,803 1,405 1,792
Deferred revenue 27 1,581 1,533 1,448
Deferred tax liabilities 28 3,250 3,210 3,183
Other non-current liabilities 29 77 58 53
Total non-current liabilities
12,384 12,093 12,366
Current liabilities
Trade and other payables 30 3,589 4,033 3,667
Borrowings and other debt instruments 24 769 2,276 4,702
Derivative financial instrument liabilities 33 593 124 393
Current tax liabilities 19 191 184 24
Employee benefit obligations 25 284 375 356
Provisions 26 720 645 350
Deferred revenue 27 227 186 101
Liabilities associated with assets held for sale 22 - 15 20
Total current liabilities
6,373 7,838 9,613
Total liabilities
18,757 19,931 21,979
Total equity and liabilities
48,926 48,384 49,176

PGNiG Group Consolidated financial statements for the year ended 31 grudnia 2014
(PLNm)
Page 10 of 119
CONSOLIDATED STATEMENT OF CASH FLOWS for the year ended December 31st 2014
Not
e Year ended Dec 31 2014
Year ended Dec 31 2013
restated
audited audited
Cash flows from operating activities
Net profit/(loss)
2,822 1,920
Adjustments:
Share in net profit/(loss) of equity-accounted entities
(129) 44
Depreciation and amortisation expense
2,502 2,463
Net foreign exchange gains/(losses)
201 169
Net interest and dividend
127 207
Gain/(loss) on investing activities
739 568
Current tax expense
804 789
Other items, net 31 910 430
Income tax paid
(677) (495)
Cash flows from operating activities before movements in working capital
7,299 6,095
Movements in working capital:
Increase/(decrease) in trade and other receivables 31 (128) 1,310
(Increase)/decrease in inventories 31 189 (321)
(Decrease)/increase in employee benefit obligations 31 11 140
Increase/(decrease) in provisions 31 130 299
Decrease/(increase) in current liabilities 31 (477) 394
(Increase)/decrease in other assets 31 (31) (89)
(Decrease)/increase in deferred revenue 31 (14) (15)
Net cash generated by operating activities
6,979 7,813
Cash flows from investing activities
Proceeds from disposal of property, plant and equipment and intangible assets
30 130
Proceeds from disposal of shares in non-related entities
1 1
Payments for property, plant and equipment and intangible assets
(3,781) (3,290)
Payments for shares in related entities
(1) (2)
Interest received
4 1
Dividends received
3 3
Other items, net
64 97
Net cash (used in)/generated by investing activities
(3,680) (3,060)
Cash flows from financing activities
Proceeds from borrowings
152 763
Proceeds from issue of debt securities
377 1,475
Repayment of borrowings
(1,096) (696)
Repayment of debt securities
(1,429) (4,273)
Payment of finance lease liabilities
(50) (53)
Proceeds from derivative financial instruments
84 83
Payment for derivative financial instruments
(98) (116)
Dividends paid
(885) (767)
Interest paid
(218) (265)
Other items, net
(6) (25)
Net cash used in/(generated by) financing activities
(3,169) (3,874)
Net increase/(decrease) in cash and cash equivalents
130 879
Effects of exchange rate changes on the balance of cash held in foreign currencies 31 1 -
Cash and cash equivalents at beginning of the period 31 2,826 1,947
Cash and cash equivalents at end of the period 31 2,956 2,826

PGNiG Group Consolidated financial statements for the year ended 31 grudnia 2014
(PLNm)
Page 11 of 119
CONSOLIDATED STATEMENT OF CHANGES IN EQUITY for the year ended December 31st 2014
Equity (attributable to owners of the parent)
Equity (attributable
to non-controlling
interests)
Total equity
Share capital Share
premium
Accumulated other comprehensive income, including:
Retained earnings/ (deficit)
Total
Exchange differences
on translating foreign
operations
Hedging reserve
Actuarial gains/(losses) on employee
benefits
As at Jan 1 2014 (audited) 5,900 1,740 (84) (1) 36 20,856 28,447 6 28,453
Transferred - - - - - - - - -
Dividend - - - - - (885) (885) - (885)
Total comprehensive income - - 18 (215) (24) 2,823 2,602 (1) 2,601
Net profit/(loss) - - - - - 2,823 2,823 (1) 2,822
Other comprehensive income, net - - 18 (215) (24) - (221) - (221)
As at Dec 31 2014 (audited) 5,900 1,740 (66) (216) 12 22,794 30,164 5 30,169
As at Jan 1 2013 (audited) 5,900 1,740 (31) (59) (62) 19,705 27,193 4 27,197
Dividend - - - - - (767) (767) - (767)
Total comprehensive income - - (53) 58 98 1,918 2,021 2 2,023
Net profit/(loss) - - - - - 1,918 1,918 2 1,920
Other comprehensive income, net - - (53) 58 98 - 103 - 103
As at Dec 31 2013 (audited) 5,900 1,740 (84) (1) 36 20,856 28,447 6 28,453

PGNiG Group Consolidated financial statements for the year ended 31 grudnia 2014
(PLNm)
Page 12 of 119
NOTES TO THE CONSOLIDATED FINANCIAL STATEMENTS as at December 31st 2014
1. GENERAL INFORMATION
1.1. Company name, principal business activity and key registry data
Polskie Górnictwo Naftowe i Gazownictwo Spółka Akcyjna (“PGNiG S.A.”, “the Company”, “the
Parent”), registered office at ul. Marcina Kasprzaka 25, 01-224 Warsaw, Poland, is the Parent of the
PGNiG Group (“the PGNiG Group”, “the Group”).
On October 30th 1996, the Company was entered in the commercial register maintained by the
District Court for the Capital City of Warsaw, 14th Commercial Division, under No. RHB 48382.
Currently, the Company is entered in the Register of Entrepreneurs maintained by the District Court
for the Capital City of Warsaw, 12th Commercial Division of the National Court Register, under No.
KRS 0000059492. The Company’s Industry Identification Number REGON is 012216736 and its Tax
Identification Number NIP is 525-000-80-28.
PGNiG S.A. shares are listed on the Warsaw Stock Exchange ("WSE"). The Company’s principal
business activity includes exploration for and production of crude oil and natural gas, import, storage
and sale of gas fuels, as well as trade in electricity.
The PGNiG Group is the only vertically integrated company in the Polish gas sector, holding the
leading position in all segments of the country’s gas industry. It is also a significant domestic
producer of heat and electricity. The scope of the PGNiG Group’s business comprises exploration for
mineral deposits, oil and gas exploration and production, import, storage and distribution of and
trade in gas fuels. The PGNiG Group is the main importer of gas fuel from Russia, Germany and
Switzerland and the main producer of natural gas from Polish deposits. The Group’s upstream
operations are one of the key contributors to PGNiG’s competitive position on the liberalised gas
market in Poland.
The trade in and distribution of natural gas as well as the generation and sale of heat, which together
with natural gas and crude oil production constitute the core business of the PGNiG Group, are
regulated by the Polish Energy Law. For this reason, the Group’s operations require licence and a
significant portion of its revenue depends on the tariff rates for gas fuels approved by the President
of the Energy Regulatory Office. Exploration and production activities are licensed and are governed
by the provisions of the Polish Geological and Mining Law.
1.2. Duration of the PGNiG Group
The Parent and the Group subsidiaries were incorporated for an unspecified time.
1.3. Reporting period of these consolidated financial statements
These consolidated financial statements present data as at December 31st 2014 and for the period
January 1st–December 31st 2014, with comparative financial data for the relevant periods of 2013.

PGNiG Group Consolidated financial statements for the year ended 31 grudnia 2014
(PLNm)
Page 13 of 119
1.4. Consolidated data
These financial statements contain consolidated data of the Parent, its 15 subsidiaries (of which
three are parents of their own groups), one associated entity and one joint venture. In the tables
below are listed equity-accounted entities as well as PGNiG Group companies.
Equity-accounted joint ventures and associated entities
Company name Country % ownership interest
Dec 31 2014 Dec 31 2013
1 GAS - TRADING S.A. Poland 43.41% 43.41%
2 SGT EUROPOL GAZ S.A. 1) Poland 49.74% 49.74%
1) Including a 48.00% direct interest and a 1.74% interest held indirectly through GAS-TRADING S.A.

PGNiG Group Consolidated financial statements for the year ended 31 grudnia 2014
(PLNm)
Page 14 of 119
No. Company name Country Parent Ownership interest (%):
Consolidation method as at share capital voting rights
PGNiG S.A.’s direct subsidiaries Dec 31 2014 Dec 31 2013
1 BSiPG Gazoprojekt S.A. Poland PGNiG S.A. 22,5%1) 22,5%1) full full
2 Exalo Drilling S.A. Poland PGNiG S.A. 100% 100% full full
3 GEOFIZYKA Kraków S.A. Poland PGNiG S.A. 100% 100% full full
4 GEOFIZYKA Toruń S.A. Poland PGNiG S.A. 100% 100% full full
5 Geovita S.A. Poland PGNiG S.A. 100% 100% full full
6 Operator Systemu Magazynowania Sp. z o.o. Poland PGNiG S.A. 100% 100% full full
7 PGNiG Obrót Detaliczny Sp. z o.o. Poland PGNiG S.A. 100% 100% full -
8 PGNiG Serwis Sp. z o.o. Poland PGNiG S.A. 100% 100% full full
9 PGNiG Technologie S.A. Poland PGNiG S.A. 100% 100% full full
10 PGNiG TERMIKA S.A. Poland PGNiG S.A. 100% 100% full full
11 Polska Spółka Gazownictwa Sp. z o.o. Poland PGNiG S.A. 100% 100% full full
12 PGNiG Finance AB Sweden PGNiG S.A. 100% 100% full full
13 PGNiG Sales & Trading GmbH Germany PGNiG S.A. 100% 100% full full
14 PGNiG Upstream International AS Norway PGNiG S.A. 100% 100% full full
15 Polish Oil and Gas Company - Libya B.V. The Netherlands PGNiG S.A. 100% 100% full full
16 Biogazownia Ostrowiec Sp. z o.o. w likwidacji (in liquidation) Poland PGNiG S.A. 100% 100% - -
17 BUD-GAZ P.P.U.H. Sp. z o.o. w likwidacji (in liquidation) Poland PGNiG S.A. 100% 100% - -
18 NYSAGAZ Sp. z o.o. Poland PGNiG S.A. 66.28% 66.28% - -
19 PGNiG SPV 5 Sp. z o.o. Poland PGNiG S.A. 100% 100% - -
20 PGNiG SPV 6 Sp. z o.o. Poland PGNiG S.A. 100% 100% - -
21 PGNiG SPV 7 Sp. z o.o. Poland PGNiG S.A. 100% 100% - -
22 Polskie Elektrownie Gazowe Sp. z o.o. w likwidacji (in liquidation) Poland PGNiG S.A. 100% 100% - -
PGNiG S.A.’s indirect subsidiaries
23 CHEMKOP Sp. z o.o. Poland Operator Systemu Magazynowania Sp. z o.o. 85.51% 85.51% - -
24 Gas Assets Management Sp. z o.o. w organizacji (in formation) Poland PGNiG SPV 6 Sp. z o.o. 99%2) 99%2) - -
25 GAZ Sp. z o.o. Poland Polska Spółka Gazownictwa Sp. z o.o. 80% 80% full full
26 Powiśle Park Sp. z o.o. Poland Polska Spółka Gazownictwa Sp. z o.o. 100% 100% full full
27 Zakład Gospodarki Mieszkaniowej Sp. z o.o. Poland Exalo Drilling S.A. 100% 100% - -
28 Zakład Separacji Popiołów Siekierki Sp. z o.o. Poland PGNiG TERMIKA S.A. 70% 70% - -
29 Oil Tech International F.Z.E. United Arab
Emirates Exalo Drilling S.A. 100% 100% full full
30 Poltava Services LLC Ukraine Exalo Drilling S.A. 99% 99% full full
31 XOOL GmbH Germany PGNiG Sales & Trading GmbH 100% 100% full full
1) PGNiG's direct interest is 22.5%, with a 52.5% interest held indirectly through PGNiG Technologie S.A. PGNiG S.A. has the right to appoint the majority of the company's Supervisory Board members.
2) PGNiG S.A.'s indirect interest in Gas Assets Management Sp. z o.o. w organizacji (in formation) is 100%, with 99% held through PGNiG SPV 6 Sp. z o.o. and 1% held through PGNiG SPV 5 Sp. z o.o.

PGNiG Group Consolidated financial statements for the year ended 31 grudnia 2014
(PLNm)
Page 15 of 119
1.5. Changes in the Group’s structure, including changes resulting from mergers, acquisitions or
disposals of Group entities
The most important changes in the structure of the PGNiG Group in 2014 included:
• On January 20th 2014, GEOFIZYKA Toruń S.A. reported that its subsidiary, PT Geofizyka Toruń
Indonezja LLC w likwidacji (in liquidation), was deleted from the business register after the
company liquidation process had been completed.
• On May 22nd 2014, a new company with a share capital of PLN 1,000,000 was incorporated
under the name of Zakład Separacji Popiołów Siekierki Spółka z ograniczoną odpowiedzialnością;
PGNiG TERMIKA S.A. acquired a 70% equity interest, valued at PLN 700,000, in the newly
established entity. The company was registered with the National Court Register on June 17th
2014.
• On August 1st 2014, PGNiG Obrót Detaliczny Sp. z o.o.'s share capital was increased by PLN
1,090,000,000, from PLN 1,000,000 to PLN 1,091,000,000, through an issue of 10,900,000 new
equal and indivisible shares with a par value of PLN 100 per share and a total par value of PLN
1,090,000,000. All new shares in the share capital of PGNiG Obrót Detaliczny Sp. z o.o. were
subscribed for by the company's sole shareholder, PGNiG S.A., and paid for with non-cash
contribution in the form of an organised part of business. The share capital increase was
registered with the National Court Register on September 9th 2014.
• On August 18th 2014, the District Court for the Capital City of Warsaw, 12th Commercial
Division of the National Court Register, deleted Biogazownia Ostrowiec Sp. z o.o. w likwidacji (in
liquidation) from the National Court Register.
• On November 28th 2014, the winding up of Polskie Elektrownie Gazowe Sp. z o.o. was
completed. A request was filed with the National Court Register (a registry court) to delete the
company from the register. By the date of preparation of these financial statements, the registry
court had not issue a decision to delete the company from the register.
• On December 15th 2014, PGNiG SPV 6 Sp. z o.o. and PGNiG SPV 5 Sp. z o.o. incorporated Gas
Assets Management Sp. z o.o. w organizacji (in formation) with a share capital of PLN 20,000.
PGNiG SPV 6 Sp. z o.o. and PGNiG SPV 5 Sp. z o.o. acquired capital interests of PLN 19,800 and
PLN 200, respectively, in the newly incorporated company. The company's share capital was
paid up with cash. On February 17th 2015, the company was registered with the National Court
Register.
1.6. Composition of the PGNiG Management Board
As at December 31st 2014, the PGNiG Management Board consisted of four members:
- Mr Mariusz Zawisza − President
- Mr Jarosław Bauc – Vice-President, Finance
- Mr Zbigniew Skrzypkiewicz – Vice-President, Exploration & Production
- Mr Waldemar Wójcik – Vice-President.
In the period from January 1st to December 31st 2014, the following changes occurred in the
composition of the PGNiG Management Board:
• With effect from January 1st 2014, Mr Mariusz Zawisza was appointed President of the PGNiG
Management Board, pursuant to a decision by the Supervisory Board of December 30th 2013.
• On April 3rd 2014, the Supervisory Board of PGNiG S.A. appointed Mr Waldemar Wójcik as
member of the PGNiG Management Board elected by the employees, for the joint three-year

PGNiG Group Consolidated financial statements for the year ended 31 grudnia 2014
(PLNm)
Page 16 of 119
term of office commencing December 30th 2013. Mr Wójcik assumed his position on April 3rd
2014.
• On June 18th 2014, the Supervisory Board of PGNiG S.A. resolved to suspend Mr Andrzej
Parafianowicz from duties as Vice-President of the PGNiG Management Board for Corporate
Affairs.
• On August 7th 2014, Mr Andrzej Parafianowicz tendered his resignation as Member of the
PGNiG Management Board, with effect as of that date.
• Also on August 7th 2014, the Supervisory Board appointed Mr Waldemar Wójcik as Vice-
President of the Management Board of PGNiG S.A.
• On December 29th 2014, the Supervisory Board of PGNiG S.A. removed Mr Jerzy Kurella from
the PGNiG Management Board and the position of Vice-President for Trade. The resolution
became effective as of its date.
Subsequent to December 31st 2014, until the date of preparation of these financial statements,
there were no changes in the composition of the PGNiG Management Board.
1.7. Commercial proxies
As at December 31st 2014, Ms Violetta Jasińska-Jaśkowiak served as commercial proxy for PGNiG
S.A., appointed by the Management Board on December 20th 2013.
She was granted a joint power of proxy, which means that the actions taken by the commercial proxy
will only be legally effective if she acts jointly with a Member of the PGNiG Management Board.
Subsequent to December 31st 2014, until the date of issue of these financial statements, there were
no changes with respect to commercial proxies for PGNiG S.A.
1.8. Composition of the PGNiG Supervisory Board
As at December 31st 2014, the Supervisory Board consisted of seven members:
• Wojciech Chmielewski – Chairman of the Supervisory Board
• Agnieszka Woś – Deputy Chairperson
• Magdalena Zegarska – Secretary
• Sławomir Borowiec – Member
• Ryszard Wąsowicz – Member
• Janusz Pilitowski – Member
• Andrzej Janiak – Member
In the period from January 1st 2014 to the date of preparation of these financial statements, the
following changes occurred in the composition of the PGNiG Supervisory Board:
• On March 26th 2014, the Extraordinary General Meeting of PGNiG S.A. appointed Mr Andrzej
Janiak as member of the Company's Supervisory Board. Mr Andrzej Janiak meets the
independence criteria defined in the Company's Articles of Association.
• On May 15th 2014, the Annual General Meeting of PGNiG S.A. removed Ms Agnieszka
Chmielarz, Mr Wojciech Chmielewski, Mr Józef Głowacki, Mr Andrzej Janiak, Mr Mieczysław
Kawecki, Mr Marcin Moryń, Mr Janusz Pilitowski, Ms Ewa Sibrecht-Ośka and Ms Jolanta Siergiej
from the PGNiG Supervisory Board, with effect from May 15th 2014.
On the same day, Mr Wojciech Chmielewski, Mr Sławomir Borowiec, Mr Andrzej Janiak, Mr
Bogusław Nadolnik, Mr Janusz Pilitowski, Ms Agnieszka Trzaskalska, Mr Ryszard Wąsowicz, Ms
Agnieszka Woś and Ms Magdalena Zegarska were appointed as members of the PGNiG
Supervisory Board, with effect from May 15th 2014.

PGNiG Group Consolidated financial statements for the year ended 31 grudnia 2014
(PLNm)
Page 17 of 119
• On June 30th 2014, Ms Agnieszka Trzaskalska resigned as member of the PGNiG Supervisory
Board with effect from that date.
• On November 5th 2014, PGNiG S.A. received a letter of resignation from Mr Bogusław
Nadolnik, whereby Mr Nadolnik resigned as member of the PGNiG Supervisory Board with
effect from November 6th 2014.
1.9. Shareholding structure of PGNiG S.A.
As at the date of issue of these consolidated financial statements for 2014, the State Treasury was
the only shareholder holding 5% or more of total voting rights at the General Meeting of PGNiG S.A.
PGNIG S.A.’s shareholding structure was as follows:
Shareholder
Number of shares as at the date of issue of
the previous interim report*
% share in total voting rights as at the date of issue of the
previous interim report*
% change in the period
% share in total voting rights at GM as at the
date of issue of this report**
Number of shares as at the date of issue of
this report**
State Treasury 4,271,717,836 72.402% 0.000% 72.402% 4,271,717,836
Other shareholders 1,628,282,164 27.598% 0.000% 27.598% 1,628,282,164
Total 5,900,000,000 100.00% 0.00% 100.00% 5,900,000,000
*As at September 30 2014.
**As at December 31st 2014.
1.10. Going-concern assumption
These consolidated financial statements have been prepared based on the assumption that the
Group will continue as a going concern in the foreseeable future. As at the date of approval of these
financial statements, no circumstances were identified which would indicate any threat to the
Group’s continuing as a going concern.
1.11. Business combinations
In the reporting period, there were no business combinations involving the Group and any other
companies under commercial law.
1.12. Approval of the financial statements
These financial statements will be submitted to the Parent's Management Board for approval and
issue on March 5th 2015.

PGNiG Group Consolidated financial statements for the year ended 31 grudnia 2014
(PLNm)
Page 18 of 119
2. APPLIED ACCOUNTING POLICIES
2.1. Basis of preparation
These consolidated financial statements have been prepared in accordance with the historical cost
convention, except with respect to financial assets available for sale, financial derivatives measured
at fair value, and loans and receivables measured at adjusted cost.
The reporting currency used in these consolidated financial statements is the Polish złoty (PLN).
Unless stated otherwise, all amounts are given in PLN million. Differences, if any, between the totals
and the sum of particular items are due to rounding off.
2.1.1. Statement of compliance
These consolidated financial statements have been prepared in accordance with the International
Financial Reporting Standards (IFRS) as endorsed by the European Union (“EU”) as at December 31st
2014.
According to IAS 1 'Presentation of Financial Statements', the IFRSs comprise the International
Financial Reporting Standards (IFRS), the International Accounting Standards (IAS) and the
Interpretations issued by the International Financial Reporting Interpretations Committee (IFRIC).
The scope of information disclosed in these consolidated financial statements is consistent with the
provisions of the IFRS and the Regulation of the Minister of Finance on current and periodic
information to be published by issuers of securities and conditions for recognition as equivalent of
information whose disclosure is required under the laws of a non-member state, dated February
19th 2009 (Dz. U. No. 33, item 259, as amended).
2.2. Changes in applied accounting policies and changes to the scope of disclosure
2.2.1. First-time adoption of standards and interpretations
In the reporting period, the Group adopted all new and revised standards and interpretations issued
by the International Accounting Standards Board and the International Financial Reporting
Interpretations Committee, and endorsed by the EU, which apply to the Group’s business and are
effective for annual reporting periods beginning on or after January 1st 2014.
• IFRS 10 Consolidated Financial Statements, endorsed by the European Commission on December 11th 2012,
• IFRS 11 Joint Arrangements, endorsed by the European Commission on December 11th 2012,
• IFRS 12 Disclosure of Interests in Other Entities, endorsed by the European Commission on December 11th 2012,
• IAS 27 (revised 2011) Separate Financial Statements, endorsed by the European Commission on December 11th 2012,
• IAS 28 (revised 2011) Investments in Associates and Joint Ventures, endorsed by the European Commission on December 11th 2012,
• Amendments to IAS 32 Financial Instruments: Presentation– Offsetting Financial Assets and Financial Liabilities, endorsed by the European Commission on December 13th 2012,
• Amendments to IFRS 10 Consolidated Financial Statements, IFRS 12 Disclosure of Interests in Other Entities, and IAS 27 Separate Financial Statements – Investment Entities, endorsed by the European Commission on November 20th 2013,

PGNiG Group Consolidated financial statements for the year ended 31 grudnia 2014
(PLNm)
Page 19 of 119
• Amendments to IAS 36 Impairment of Assets – Recoverable Amount Disclosures for Non-Financial Assets, endorsed by the European Commission on December 19th 2013,
• Amendments to IAS 39 Financial Instruments: Recognition and Measurement – Novation of Derivatives and Continuation of Hedge Accounting, endorsed by the European Commission on December 19th 2013,
• IFRIC 21 Levies – endorsed by the European Commission on June 13th 2014.
Application of the above amendments to standards has not caused any material changes in the accounting policies of the Group or in the presentation of data in its financial statements.
2.2.2. Standards and interpretations published and endorsed for application in the EU but not yet
effective
As at the date of these consolidated financial statements, the Group did not apply the following
standards, amendments and interpretations which have been published and endorsed for application
in the EU but have not yet become effective:
• Amendments to IFRS (2010−2012) – changes in the procedure of introducing annual amendments to IFRS – effective for reporting periods beginning on or after July 1st 2014,
• Amendments to IFRS (2011−2013) – changes in the procedure of introducing annual amendments to IFRS – effective for reporting periods beginning on or after July 1st 2014,
• Amendments to IAS 19 Defined Benefit Plans: Employee Contributions – effective for reporting periods beginning on or after July 1st 2014.
The Group decided not to elect the option to early adopt the above amendments.
The Group estimates that the above standards, interpretations and amendments to standards
would not have had a material effect on the financial statements if they had been applied by the
Group as at the end of the reporting period.
2.2.3. Standards and interpretations adopted by the International Accounting Standards Board
which as at December 31st 2014 were not endorsed for use by the European Commission
and therefore have not yet been applied in these financial statements
Standards which as at December 31st 2014 were not endorsed for use by the European Commission:
• IFRS 9 Financial Instruments – effective for reporting periods beginning on or after January 1st 2018,
• Amendments to IFRS (2012−2014) – changes in the procedure of introducing annual amendments to IFRS – planned to be effective for reporting periods beginning on or after July 1st 2016,
• Amendments to IFRS 10 and IAS 28 Sales or Contributions of Assets between an Investor and Its Associate/Joint Venture – effective for reporting periods beginning on or after January 1st 2016,
• IFRS 14 Regulatory Deferral Accounts – effective for reporting periods beginning on or after January 1st 2016,
• IFRS 15 Revenue from Contracts with Customers – effective for reporting periods beginning on or after January 1st 2017,
• Amendments to IAS 16 Property, Plant and Equipment – effective for reporting periods beginning on or after January 1st 2016,
• Amendments to IAS 16 Property, Plant and Equipment, and IAS 38 Intangible Assets: Clarification of Acceptable Methods of Depreciation and Amortisation – effective for reporting periods beginning on or after January 1st 2016,

PGNiG Group Consolidated financial statements for the year ended 31 grudnia 2014
(PLNm)
Page 20 of 119
• Amendments to IFRS 11 Joint Arrangements: Accounting for Acquisitions of Interests in Joint Operations – effective for reporting periods beginning on or after January 1st 2016.
• Amendments to IAS 1 Disclosure Initiative – effective for reporting periods beginning on or after January 1st 2016,
• Amendments to IFRS 10, IFRS 12 and IAS 28 Investment Entities: Applying the Consolidation Exception – effective for reporting periods beginning on or after January 1st 2016,
• Amendments to IAS 27 Equity Method in Separate Financial Statements – effective for reporting periods beginning on or after January 1st 2016,
The Group estimates that the above standards and amendments to standards would not have had a
material effect on the financial statements if they had been applied by the Group as at the end of the
reporting period.
2.3. Accounting policies
Below are presented the principal accounting policies applied by the PGNiG Group.
2.3.1. Consolidation methods
The consolidated financial statements have been prepared based on the financial statements of the
Parent, its subsidiaries, the associated entity and the joint venture.
Financial statements of the consolidated entities are prepared for the same reporting period, based
on uniform accounting policies. If necessary, adjustments are made to the financial statements of
subsidiaries or associates to ensure consistency between the accounting policies applied by a given
entity and those applied by the Group.
In line with the materiality principle prescribed in the IAS conceptual framework, those controlled
subsidiaries whose financial statements reveal values immaterial to the performance of obligation of
fair and clear presentation of the Group's financial standing and assets have not been consolidated.
2.3.1.1. Investments in subsidiaries
Subsidiaries are consolidated with the full method from their acquisition date (the date of assuming
control of the company) until the date the control is lost. Control is exercised when the parent, due
to its involvement with the subsidiary, is exposed to gains and losses from variable financial
performance and has the power to influence such financial performance by exercising governance
over the subsidiary.
Information in the consolidated financial statements is presented as if it concerned a single entity.
Consequently, in the consolidated financial statements:
• similar items of assets, liabilities, equity, revenue, costs and cash flows of the parent and its
subsidiaries are presented jointly;
• the carrying amount of parent’s investment in each subsidiary and the parent’s share in
subsidiaries’ equity is offset (under IFRS 3);
• the Group’s assets, liabilities, equity, revenue, costs and cash flows from transactions between
Group entities are eliminated in full (gains and losses on intra-group transactions, recognised as
assets such as inventories and tangible assets are eliminated in full).
Identifiable acquired assets and assumed liabilities of the acquiree are recognised as at the
acquisition date and are measured at fair value. The excess of the acquisition cost (consideration
transferred measured in accordance with IFRS 3, any non-controlling interest in the acquiree
measured in accordance with IFRS 3, and - in a business combination achieved in stages - the
acquisition-date fair value of the acquirer’s previously held equity interest in the acquiree) over the
net fair value of identifiable acquired assets and assumed liabilities, as determined as at the

PGNiG Group Consolidated financial statements for the year ended 31 grudnia 2014
(PLNm)
Page 21 of 119
acquisition date, measured in accordance with the IFRS, is recognised as goodwill. If the acquisition
cost is lower than the net fair value of identifiable acquired assets and assumed liabilities, as
determined as at the acquisition date, the difference is recognised as gain in profit or loss as at the
acquisition date.
A non-controlling interest is an interest in profit or loss and net assets of consolidated subsidiaries
not attributable, directly or indirectly, to the parent. Non-controlling interests are presented in
separate items of the consolidated statement of profit or loss, consolidated statement of
comprehensive income, consolidated statement of financial position and consolidated statement of
changes in equity.
If the parent loses control of a subsidiary in a given reporting period, the consolidated financial
statements account for the subsidiary's results for such part of the reporting year in which control
was held by the parent.
2.3.1.2. Investments in associated entities
Associates are entities over which the parent has significant influence, but not control or joint
control, and participates in making financial and operating policy decisions.
Financial interests in associates are equity-accounted, except when an investment is classified as held
for sale. Investments in associates are measured at cost, taking into account changes in the Group’s
share in the net assets which occurred until the reporting date, less impairment of particular
investments. Losses incurred by an associated entity in excess of the value of the Group’s share in
such associated entity are not recognised.
Excess of acquisition cost over the net fair value of identifiable assets and liabilities of the associate
as at the acquisition date is included the carrying amount of the investment. If acquisition cost is
lower than net fair value of identifiable assets and liabilities of the associate as at the acquisition
date, the difference is disclosed as gain in the statement of profit or loss for the period in which the
acquisition took place.
Unrealised gains and losses on transactions between the Group and an associated entity are
eliminated on consolidation proportionately to the Group’s interest in such associated entities’
equity. Losses incurred by an associate may indicate an impairment of its assets and relevant
impairment losses would then need to be recognised.
2.3.1.3. Joint arrangements
Joint arrangements are either:
• joint operations, or
• joint ventures.
A joint operation is a joint arrangement whereby the parties that have joint control of the
arrangement have rights to the assets, and obligations for the liabilities, relating to the
arrangement. Those parties are called joint operators.
A joint operator recognises in relation to its interest in a joint operation:
• its assets, including its share of any assets held jointly,
• its liabilities, including its share of any liabilities incurred jointly,
• its revenue from the sale of its share of the output arising from the joint operation;
• its share of the revenue from the sale of the output by the joint operation; and
• its expenses, including its share of any expenses incurred jointly.
As assets, liabilities, revenues and costs relating to the joint operation are also disclosed in the
separate financial statements of the party, these items are not subject to adjustment or other
consolidation procedures when preparing consolidated financial statements of that party.

PGNiG Group Consolidated financial statements for the year ended 31 grudnia 2014
(PLNm)
Page 22 of 119
A joint venture is a joint arrangement whereby the parties that have joint control of the
arrangement have rights to the net assets of the arrangement Those parties are called joint
venturers.
In the consolidated financial statements, a joint venturer recognises its interest in a joint venture as
an investment and accounts for that investment using the equity method in accordance with IAS 28,
unless the entity is exempted from applying the equity method as specified in that standard. A party
that participates in, but does not have joint control or significant influence over, a joint venture
accounts for its interest in the arrangement in accordance with IAS 39.
2.3.2. Translation of items denominated in foreign currencies
The Polish złoty (PLN) is the functional currency (measurement currency) and the reporting currency
of PGNiG S.A. and its subsidiaries, with the exception of:
• POGC Libya B.V. – US dollar (USD),
• PGNiG Upstream International AS – Norwegian krone (NOK),
• PGNiG Sales & Trading GmbH − euro (EUR),
• PGNiG Finance AB – Swedish krona (SEK),
• the foreign branches of the Group companies.
2.3.2.1. Measurement at initial recognition
Transactions denominated in foreign currencies are initially disclosed at the exchange rate of the
functional currency effective as at the transaction date.
2.3.2.2. Measurement at the end of the reporting period
At the end of each reporting period:
• Cash items denominated in foreign currencies are translated at the exchange rate of the
functional currency effective as at the reporting date.
• Non-cash items measured at historical cost in a foreign currency are translated at the exchange
rate effective as at the date of transaction. Non-cash items valued at fair value in a foreign
currency are translated at the exchange rate effective as at the date of determining the fair
value.
2.3.2.3. Recognition of exchange differences
Exchange differences arising on the settlement of monetary items or on translating monetary items
at rates different from those at which they were translated on initial recognition during the period or
in previous financial statements is recognised in profit or loss in the period in which they arise. When
a gain or loss on a non-monetary item is recognised directly in equity, any exchange component of
that gain or loss is recognised directly in equity. Conversely, when a gain or loss on a non-monetary
item is recognised in profit or loss, any exchange component of that gain or loss is recognised by the
Group companies in profit or loss.
Foreign currency differences arising on translation of the assets and liabilities of foreign branches are
recognised in Accumulated other comprehensive income and presented in a separate item of equity.
Upon disposal of a foreign operation, accumulated foreign exchange gains or losses disclosed under
equity are recognised in profit or loss.
To hedge against foreign currency risk, the Group enters into derivatives transactions (for description
of the accounting policies applied by the Group to derivative financial instruments see Note 2.3.12).
2.3.3. Property, plant and equipment
Property, plant and equipment comprises assets which the Group intends to use in the production or
supply of merchandise or services, for rental to others (under a relevant agreement), or for
PGNiG Group Consolidated financial statements for the year ended 31 grudnia 2014
(PLNm)
Page 23 of 119
administrative purposes for more than one year, where it is probable that future economic benefits
associated with the assets will flow to the Group. The category of property, plant and equipment also
includes tangible assets under construction. The cost of property, plant and equipment includes:
• expenditure incurred at initial recognition,
• expenditure incurred on improvements (modernisation) which increase future economic
benefits.
Property, plant and equipment is initially disclosed at cost. Borrowing costs are also disclosed at cost
(for a description of the capitalisation policies applied to borrowing costs see Section 2.3.5.). Spare
parts are recorded as inventories and recognised in profit or loss as at the date of their use.
Significant spare parts and maintenance equipment may be disclosed as property, plant and
equipment if the Group expects to use such spare parts or equipment for a period longer than one
year and they may be assigned to specific items of property, plant and equipment.
The Group does not increase the carrying amount of property, plant and equipment items to account
for day-to-day maintenance costs of the assets. Such costs are recognised in profit or loss when
incurred. The costs of day-to-day maintenance of property, plant and equipment, i.e. cost of repairs
and maintenance works, include the cost of labour and materials used, and may also include the cost
of less significant spare parts.
Property, plant and equipment is recognised by the Group at historical cost. Property, plant and
equipment, initially recognised as assets, is disclosed at cost less depreciation and impairment losses.
The initially recognised value of gas pipelines and gas storage facilities includes the value of gas used
to fill the pipelines or facilities for the first time. The amount of gas required to fill a pipeline or a
storage chamber for the first time equals the amount required to obtain the minimum operating
pressure in the pipeline or chamber.
In the event of a leak, the costs of pipeline refilling or replacing lost fuel are charged to profit or loss
in the period when incurred.
Depreciable amount of property, plant and equipment, except for land and tangible assets under
construction, is allocated on a systematic basis using the straight-line method over the estimated
economic useful life of an asset:
• Buildings and structures 2-40 years
• Plant and equipment, vehicles and other tangible assets 2-35 years
Property, plant and equipment used under lease or similar contract and recognised by the Group as
its assets are depreciated over their economic useful lives, but not longer than for the term of the
contract.
On disposal or when no future economic benefits are expected from the use or disposal of an item of
property, plant and equipment, its carrying amount is derecognised from the statement of financial
position, and any gains or losses arising from the derecognition are charged to profit or loss.
Tangible assets under construction are measured at cost or aggregate cost incurred in the course of
their production or acquisition, less impairment losses. Tangible assets under construction are not
depreciated until completed and placed in service.
2.3.4. Exploration and evaluation assets
Natural gas and crude oil exploration and evaluation expenditure covers geological work performed
to discover and document deposits and is accounted for with the successful efforts method.
The cost of a licence for evaluation of natural gas and/or crude oil deposits and the cost of its
extension is the charge for operations executed under the licence, recognised in the Group’s
statement of financial position under intangible assets.

PGNiG Group Consolidated financial statements for the year ended 31 grudnia 2014
(PLNm)
Page 24 of 119
Expenses under seismic surveys are capitalised under exploration and evaluation assets and disclosed
as a separate exploration and evaluation asset.
Expenditure incurred on individual wells is first capitalised in "Tangible assets under construction" as
a separate item of exploration and evaluation assets. If exploration activities are successful and lead
to a discovery of commercial reserves, the Group assesses the areas and prospects in terms of
economic viability of production. If following the evaluation a decision is made to extract minerals,
the Group reclassifies relevant exploration and evaluation assets at the start of production into
property, plant and equipment. If exploration is unsuccessful or a Group entity does not file for a
licence for evaluation of natural gas and/or crude oil following the analysis of economic viability of
production from the areas or prospects, the entire capitalised expenses incurred in relation to the
wells drilled during exploration are recognised in profit or loss, in the period in which the decision to
discontinue exploration was made.
The Group recognises provisions for extraction and storage well decommissioning costs. The value of
the discounted provision is added to the initial value of the wells and depreciated over their useful
economic lives.
2.3.5. Borrowing costs
The Group capitalises borrowing costs.
Borrowing costs directly attributable to acquisition, construction or production of assets, which are
assets that necessarily take a substantial period of time to become ready for their intended use or
sale, are capitalised at part of cost of the asset.
Gains earned on short-term investment of particular borrowings pending their expenditure on
acquisition, construction or production of assets is deducted from the borrowing costs eligible for
capitalisation.
All other borrowing costs are recognised in profit or loss when incurred.
These cost capitalisation policies do not apply to:
• assets measured at fair value, and
• inventories produced or generated in significant volumes in the course of a repetitive process.
Borrowing costs may comprise:
• interest expense calculated using the effective interest rate method,
• financial liabilities under finance lease agreements,
• exchange differences arising on borrowings denominated in a foreign currency, to the extent
that they are regarded as an adjustment to interest expenses.
In the case of funds borrowed without a specific purpose, borrowing costs are calculated by applying
the capitalisation rate to the capital expenditure on that asset. The capitalisation rate is the weighted
average of rates applied to all borrowing costs which are recognised as the Group’s liabilities in the
period, other than funds borrowed specifically for the purpose of acquiring qualifying assets.
2.3.6. Investment property
Investment property is the property (land, buildings or parts thereof) treated by the Group, as the
owner or lessee under finance lease, as a source of rental income or held for expected capital
appreciation, or both.
Investment property is initially recognised at cost and the initial recognition includes transaction
costs. Following initial recognition of its investment property, the Group uses the cost model and
measures all its investment property in line with the requirements of IAS 16 defined for that model,
i.e. at cost less accumulated depreciation and impairment losses.

PGNiG Group Consolidated financial statements for the year ended 31 grudnia 2014
(PLNm)
Page 25 of 119
Investment property is derecognised from the statement of financial position upon its sale or
decommissioning if no benefits from its sale are expected in the future.
All gains or losses arising from the sale or discontinuation of use of investment property are
determined as the difference between net proceeds from sale and the carrying amount of the asset,
and are recognised in profit or loss in the period in which the liquidation or sale is performed.
The Group depreciates investment property with the straight-line method over useful economic life
periods of 2–40 years.
2.3.7. Intangible assets
Intangible assets are identifiable non-monetary assets without physical substance, controlled by the
Group as a result of past events. In line with the Group’s expectations, such assets will cause an
inflow of economic benefits to the Group in the future and their cost can be reliably established.
The Group identifies the following intangible assets:
• development expenses;
• goodwill;
• perpetual usufruct right to land – acquired for consideration;
• licences, mining rights and geological information;
• software;
• greenhouse gas emission allowances.
Intangible assets generated in the course of development work are recognised in the statement of
financial position only if the Group is able to demonstrate:
• the technical feasibility of completing the intangible asset so that it is fit for use or sale,
• its intention to complete and to use or sell the intangible asset,
• its ability to either use or sell the intangible asset,
• the manner in which the intangible asset will generate future economic benefits,
• the availability of appropriate technical, financial and other means which are necessary to
complete the development work and to use or sell the intangible asset,
• the feasibility of a reliable determination of the expenditure incurred in the course of
development work.
Research expense is recognised in profit or loss when incurred.
Intangible assets also include expenditure on acquisition of a perpetual usufruct right to land.
The Group holds perpetual usufruct rights:
• acquired for consideration,
• acquired free of charge.
Perpetual usufruct rights to land acquired for consideration (from other entities) are presented as
intangible assets and amortised over their useful life. The useful life of a perpetual usufruct right to
land acquired for consideration from an entity other than the State Treasury or local government
unit is equal to the period from the acquisition date of the perpetual usufruct right to the last day of
the perpetual usufruct period set out in the perpetual usufruct agreement. The useful life of the
excess of the first payment over the annual perpetual usufruct charge is equal to the perpetual
usufruct period specified in the perpetual usufruct agreement.
Perpetual usufruct rights to land acquired free of charge pursuant to an administrative decision
issued under the Amendment to the Act on Land Management and Expropriation of Real Estate of
September 20th 1990 are presented only in off-balance-sheet records.

PGNiG Group Consolidated financial statements for the year ended 31 grudnia 2014
(PLNm)
Page 26 of 119
The costs of licences for production of natural gas and/or crude oil and charges for establishment of
mining rights payable to the State Treasury are disclosed as expenditure capitalised and presented
under intangible assets.
Pursuant to the Act on Trading in Greenhouse Gas Emission Allowances, the Group holds CO2
emission allowances, allocated for individual installations.
The Group distinguishes the following emission allowances:
• purchased for redemption,
• purchased for resale,
• received free of charge.
Emission allowances purchased for redemption are recognised as intangible assets at actual
acquisition price.
Emission allowances purchased for resale are recognised as inventory and measured initially at cost.
At the end of the reporting period, they are measured at the lower of cost or net realisable value.
Emission allowances received free of charge under the National Allocation Plan are recognised as off-
balance-sheet items at nominal value (equal to zero).
The Group initially recognises intangible assets at cost and afterwards they are carried at cost less
accumulated amortisation and impairment losses. The applied amortisation method reflects the
pattern of consumption of economic benefits associated with an intangible asset by the Group. If the
pattern of consumption of such benefits cannot be reliably determined, the straight-line method is
applied. The amortisation method is applied consistently over subsequent periods, unless there is a
change in the expected pattern of consumption of economic benefits.
Intangible assets are amortised with the amortisation rates reflecting their expected useful economic
life. The estimated amortisation period and expected amortisation method are reviewed at the end
of each financial year. If the forecast useful life of an asset is significantly different from previous
estimates, the amortisation period is changed. If the expected pattern of consumption over time of
economic benefits associated with an intangible asset has altered significantly, a different
amortisation method is applied. Such transactions are recognised by the Group as revision of
estimates and are recognised in profit or loss in the period in which such estimates are revised.
Intangible assets are amortised over the following useful economic live periods:
• Acquired licences, patent rights and similar items 2-15 years
• Acquired software 2-10 years
• Perpetual usufruct right to land 40-99 years
• Licences - granted for periods specified in relevant decisions of the President of the Energy
Regulatory Office.
Intangible assets with an indefinite useful life are not amortised. Intangible assets with an indefinite
useful life and intangible assets not yet available for use are tested for impairment periodically (at
least once a year or whenever there is indication of impairment).
2.3.8. Leases
A lease is classified as a finance lease if the lease agreement provides for the transfer of substantially
all risks and benefits resulting from the ownership of the leased asset onto the lessee. All other types
of leases are treated as operating leases.
2.3.8.1. The Group as a lessor
Finance leases are disclosed in the statement of financial position as receivables, at amounts equal to
net investment in the lease. Lease payments relating to a given financial period, excluding costs of

PGNiG Group Consolidated financial statements for the year ended 31 grudnia 2014
(PLNm)
Page 27 of 119
services, reduce the value of gross investment in the lease, reducing both the principal amount and
the amount of unrealised finance income.
Finance income on a finance lease is disclosed in subsequent periods at a constant rate of return on
the net investment in the lease.
Income from operating leases is recognised in profit or loss on a straight-line basis over the lease
term, unless the application of a different method better reflects the pattern of reduction over time
of the benefits derived from a leased asset.
2.3.8.2. The Group as a lessee
Non-current assets used under finance lease are recognised as assets of the Group. As at the
commencement of the lease term, the Group discloses finance leases in the statement of financial
position under assets and liabilities at the lower of the fair value of the leased assets as at the first
day of the lease term or present value of the minimum lease payments as at the first day of the lease
term. The resultant liability to the lessor is disclosed in the statement of financial position under
"Borrowings and other debt instruments", with breakdown into current and non-current portion.
Minimum lease payments are apportioned between finance costs representing the interest portion
of lease payments, and the reduction of the outstanding lease liability. Finance costs are spread over
individual reporting periods, and represent a fixed percentage of the outstanding lease liability in
each of the reporting periods. Finance costs are determined using the internal rate of return (IRR)
method.
Lease payments under operating leases are recognised as costs on a straight-line basis over the lease
term, unless the application of a different method better reflects the pattern of spreading over time
of benefits derived by the user.
2.3.9. Impairment of property, plant and equipment and intangible assets
As at the end of each reporting period, the Group tests its property, plant and equipment and
intangible assets for impairment. If any indication of impairment is found to exist, the recoverable
amount of a particular asset is estimated in order to determine whether the asset is impaired. If a
given asset does not generate cash flows which are to a large extent independent of the cash flows
generated by other assets, the recoverable amount of the cash-generating unit to which the asset
belongs is determined.
Intangible assets with an indefinite useful life are tested for impairment on an annual basis, by way
of comparing the recoverable amount of the asset with its carrying amount, and each time there is
an indication of impairment of the asset.
The recoverable amount is determined as the higher of the fair value less cost to sell or value in use
of the asset or cash-generating unit. Value in use corresponds to the present value of estimated
future cash flows expected to be obtained from the continued use of an asset or cash-generating
unit, discounted at a discount rate reflecting the current market time value of money and the risk
specific to a particular asset.
If the recoverable amount is lower than the carrying amount of an asset (or cash-generating unit),
the carrying amount is decreased to the recoverable amount of the asset (or cash-generating unit).
An impairment loss is recognised as cost of the period in which the impairment loss arose.
If an impairment loss is reversed, the carrying amount of the asset (or cash-generating unit) is
increased to the newly estimated recoverable amount, which should not be higher than the carrying
amount that would have been determined (net of accumulated depreciation/amortisation) had no
impairment of that asset (or cash-generating unit) been recognised in previous years. Reversal of an
impairment loss is recognised in profit or loss.
PGNiG Group Consolidated financial statements for the year ended 31 grudnia 2014
(PLNm)
Page 28 of 119
2.3.10. Financial assets
Due to their nature and purpose, the Group’s financial assets are classified to the following
categories:
• financial assets measured at fair value through profit or loss (positive valuation of derivatives
which are not measured pursuant to the principles of hedge accounting),
• financial instruments hedging specific risks under hedge accounting,
• financial assets available for sale,
• loans and receivables.
2.3.10.1. Financial assets measured at fair value through profit or loss
This category comprises financial assets held for trading and financial assets designated at initial
recognition at fair value through profit or loss.
A financial asset is classified as held for trading if it is:
• acquired principally for the purpose of selling it in the near term;
• part of a portfolio of identified financial instruments that are managed together in accordance
with a recent actual pattern of short-term profit-taking;
• a derivative (except for a derivative that is a designated and effective hedging instrument).
Derivatives with positive valuation which are not measured pursuant to the principles of hedge
accounting (e.g. SWAP, CIRS, options) are classified by the Group as held for trading.
The Group did not apply hedge accounting to CIRS transactions as the valuation of both the hedged
item, i.e. exchange differences on a loan, and the hedge is reflected in profit or loss for the same
reporting period.
The item “Financial assets held for trading” includes also a positive value of commodity options with
respect to which the Group cancelled the hedging relationship.
2.3.10.2. Financial instruments hedging specific risks under hedge accounting
This category includes measurement of derivative transactions executed to hedge the Group against
the risk of fluctuations in gas and electricity prices, exchange rates and interest rates. The Group
applies hedge accounting policies with respect to derivative transactions used in managing currency
risk and the risk of gas price fluctuations. For description of the applied hedge accounting policies,
see Section 2.3.12.
2.3.10.3. Financial assets available for sale
Non-derivative financial assets that are designated as available for sale or which are not financial
assets included in any other category are classified as financial assets available for sale and are
measured at fair value. Profit gained or loss incurred as a result of changes in fair value is recognised
in equity under Accumulated other comprehensive income. Investments in equity instruments that
do not have a quoted market price on an active market and whose fair value cannot be reliably
measured are carried at cost (without remeasurement as at each reporting date to reflect changes in
currency exchange rates).
The Group classifies the following financial assets as loans and receivables:
• investments in unlisted equity instruments (other than shares in subsidiaries, associates and
joint ventures),
• investments in listed equity instruments not held for trading (other than shares in subsidiaries,
associates and joint ventures),
• investments in debt instruments that the Group does not have a firm intention to hold to
maturity.
PGNiG Group Consolidated financial statements for the year ended 31 grudnia 2014
(PLNm)
Page 29 of 119
If impairment is identified, the Group recognises an appropriate impairment charge. In the statement
of financial position, the value of the interests is presented net of impairment charges.
2.3.10.4. Loans and receivables
Loans and receivables comprise non-derivative financial assets with fixed or determinable payments
which are not quoted on an active market.
Loans and receivables are measured at amortised cost, using the effective interest rate method.
Measurement differences are recognised in profit or loss. The Group does not discount receivables
which mature in less than 12 months from the end of the reporting period and where the discounting
effect would be immaterial.
The Group classifies the following financial assets as loans and receivables:
• all receivables (excluding taxes, grants, customs duties, social security and health insurance
contributions and other benefits),
• loans advanced and bonds not quoted in an active market,
• cash and cash equivalents.
Uncollectible receivables are charged to costs when recognised as irrecoverable accounts. If
receivables are written off or cancelled due to their expiry or irrecoverability, impairment losses
recognised on such receivables, if any, are reduced.
Receivables cancelled or written off due to their expiry or irrecoverability for which no impairment
losses were recognised or the impairment losses that were recognised were lower than the full
amounts of the receivables, are charged to other expenses or finance costs.
2.3.10.4.1. Trade and other receivables
Trade receivables are initially recognised at nominal value (provided that the discounting effect is
immaterial). Following initial recognition, receivables are measured at amortised cost using the
effective interest rate method. Measurement differences are recognised in profit or loss. The Group
does not discount receivables which mature in less than 12 months from the end of the reporting
period and where the discounting effect would be immaterial. Receivables are revalued through the
recognition of impairment losses based on the probability of their recovery, if there is objective
evidence that the receivables will not be fully recovered.
Uncollectible receivables are charged to profit or loss when recognised as irrecoverable accounts. If
receivables are written off or cancelled due to their expiry or irrecoverability, impairment losses
recognised on such receivables, if any, are reduced.
Receivables cancelled or written off due to their expiry or irrecoverability with respect to which no
impairment losses were recognised or the impairment losses that were recognised were lower than
the full amounts of the receivables, are charged to other expenses or finance costs, as appropriate.
2.3.10.4.2. Cash and cash equivalents
Cash and cash equivalents disclosed in the statement of financial position include cash at bank and in
hand as well as short-term financial assets with high liquidity and the original maturity not exceeding
three months, which are readily convertible into specific cash amounts and subject to an insignificant
risk of fluctuation in value.
The balance of cash and cash equivalents disclosed in the statement of cash flows consists of the
cash and cash equivalents specified above, less outstanding overdraft facilities.

PGNiG Group Consolidated financial statements for the year ended 31 grudnia 2014
(PLNm)
Page 30 of 119
2.3.11. Impairment of financial assets
As at the end of each reporting period, the Group assesses whether there is an objective evidence of
impairment of a financial asset or a group of financial assets. A financial asset or a group of financial
assets is deemed impaired if there is objective evidence of impairment following from one or more
events which took place after initial recognition of such asset or group of financial assets, and the
event leading to impairment has an adverse effect on the estimated future cash flows related to the
asset or group of assets, which can be reliably estimated.
The value of loans and receivables measured at amortised cost takes into account the probability of
collection. The amount of impairment losses equals the difference between the carrying amount of
an asset and the present value of estimated future cash flows discounted at the asset’s original
effective interest rate.
Depending on the type of receivables, impairment losses are determined using the statistical or
individual method.
The Group recognises impairment losses on receivables using the individual method if the receivable
is past due by more than 90 days or if the receivable is at risk (e.g. the debtor has filed for
bankruptcy). Impairment loss covers 100% of the amount of such a receivable.
Impairment losses on receivables for gas deliveries to customers from tariff groups 1-4 are
determined using the statistical method. The impairment losses are determined based on the
analysis of historical data regarding the payment of past due receivables in particular maturity
groups. The results of the analysis are then used to calculate recovery ratios on the basis of which the
amounts of impairment losses on receivables in each maturity group are determined.
Impairment losses are charged to other expenses or finance costs, as appropriate, depending on the
type of receivables for which an impairment loss is recognised.
If the amount of impairment loss on financial assets, except for financial instruments available for
sale, is reduced, the previously recognised loss is reversed through profit or loss. The reversal may
not result in increasing the carrying amount of the financial asset above the amount that would have
been the amortised cost of the asset as at the date of reversal had no impairment losses been
recognised.
Impairment losses on investments in equity instruments classified as available for sale are not
reversed through profit or loss. Any increase in fair value after the recognition of impairment losses is
disclosed directly in equity.
2.3.12. Hedge accounting
Hedge accounting specifies the rules for accounting of hedging instruments and hedged items in the event these transactions are formally designated to hedge certain risks.
The Group defines hedging as designating one or more hedging instruments, in accordance with hedge accounting rules, so that the change in their fair value offsets, in full or in part, the change in fair value of the hedged item or future cash flows related to the hedged item.
Hedging instruments designated for hedge accounting are recognised in accordance with fair value or cash flow hedge accounting rules, if all of the following conditions are met:
• the hedging relationship is formally designated and documented, including the entity’s risk
management objective and strategy for the hedge, at the time when the hedge is undertaken,
• the hedge is expected to be highly effective in offsetting changes in the fair value or cash flows
attributable to the hedged risk, based on the originally documented risk management strategy
pertaining to a given hedging relationship,
PGNiG Group Consolidated financial statements for the year ended 31 grudnia 2014
(PLNm)
Page 31 of 119
• in the case of a cash flow hedge, the contemplated transaction to which the hedge relates is
highly probable and exposed to variability in cash flows, which may ultimately affect the profit
or loss,
• the effectiveness of the hedge can be reliably assessed by way of reliable measurement of the
fair value of the hedged item or of the related cash flows and fair value of the hedging
instrument,
• the hedge is assessed on an ongoing basis and determined to have been highly effective
throughout the reporting periods for which the hedge was designated.
The Group does not apply hedge accounting retroactively, that is it does not recognises hedges with past dates.
A fair value hedge is a hedge of the exposure of the financial result to changes in fair value of a recognised asset, liability or highly probable future liability (or an identified portion of such asset, liability or highly probable future liability) that is attributable to a particular risk (e.g. currency or interest rate risk).
If fair value hedge accounting is applied:
• the Group charges gain or loss on remeasurement of fair value of hedging instrument to profit
or loss; and
• gains or losses connected with the hedged item and resulting from the risk hedged adjust the
carrying amount of the hedged item and are charged to profit or loss. This principle applies to
the hedged item which under different circumstances is measured at cost.
Cash flow hedging consists in mitigating the effect on profit or loss of changes in cash flows attributable to certain risks (exchange rate risk, interest rate risks, price risk etc.) related to assets and liabilities recognised in the accounting records, probable future liabilities or highly probable planned transactions.
The portion of gains or losses on the hedging instrument that is determined to be an effective hedge is recognised in other comprehensive income. The non-effective value is charged to profit or loss.
The Group ceases to apply hedge accounting if the derivative expires or is sold, terminated or exercised, if the Group revokes its designation as a hedge, the hedge no longer meets the criteria of hedge accounting, or if the hedged transaction is no longer expected to be executed.
2.3.13. Inventories
Inventories comprise assets intended to be sold in the ordinary course of business, assets in the
process of production intended to be sold, and assets in the form of raw materials or consumables
used in the production process or in the course of rendering of services. The Group’s inventories
comprise materials and consumables, merchandise, finished goods, work in progress and certificates
of origin for electricity.
The value of inventories is established at the lower of cost and net realisable value. Cost comprises
all costs of purchase and processing, as well as other costs incurred to bring the inventories to their
present location and condition.
Gas fuel at storage facilities is measured jointly for all storage units, at the average weighted cost.
Changes in the inventories of gas fuel stored in the Underground Gas Storage Facilities for sale and
own consumption, as well as balance-sheet differences, are measured at the average actual cost,
which comprises costs of purchase of gas fuel from all foreign sources, actual costs of its production
from domestic sources, costs of nitrogen removal and costs of its acquisition from other domestic
sources.
The Group companies are obliged to obtain and surrender for cancellation certificates of origin for
electricity corresponding to the volume of electricity sold to end customers.

PGNiG Group Consolidated financial statements for the year ended 31 grudnia 2014
(PLNm)
Page 32 of 119
Under inventories, the Group recognises certificates of origin for electricity obtained in connection
with electricity production and certificates of origin for electricity purchased in order to be
surrendered for cancellation.
The certificates of origin obtained in connection with the production of electricity are recognised at
market value when their grant becomes probable. Purchased certificates of origin are recognised at
cost. Decreases in the purchased certificates of origin are measured using the weighted average
method.
Upon sale of electricity, a provision is recognised for the certificates of origin to be surrendered for
cancellation in connection with the sale of electricity to end customers. The provision and the
registered certificates of origin disclosed under inventories are accounted for at the time of
registering their cancellation in the Register of Certificates of Origin maintained by the Polish Power
Exchange (“TGE”).
If the cost of inventories is not recoverable, the Group recognises an impairment loss bringing the
value of such inventories to the net realisable amount. Impairment losses on inventories bringing
their value to the net realisable amount and all losses on inventories are recognised as cost in the
period when the loss occurred.
Impairment losses on inventories are determined by way of a case-by-case assessment of the
usefulness of inventories, based on the following assumptions:
• For inventory of purchased materials which are idle for a period of 1–5 years, the Group
generally recognises an impairment loss of 20% of their value; Where the case-by-case
usefulness assessment and the possibility of using a category of materials and their cycle
structure are taken into account, the Group may recognise impairment losses of 5% and 10% of
the value of the materials;
• For inventory of purchased materials which are idle for a period of 5–10 years, the Group
recognises an impairment loss of 20%–100% of their value;
• For materials remaining in warehouses for more than 10 years, which are completely useless
and intended for liquidation, the Group recognises an impairment loss of 100% of their value.
2.3.14. Non-current assets held for sale
The Group classifies a non-current asset (or a disposal group) as available for sale if its carrying
amount is to be recovered principally through a sale transaction rather than through continuing use.
This is the case if an asset (or a disposal group) is available for immediate sale in its present
condition, subject only to usual and customary terms applicable to the sale of such assets (or a
disposal group), and its sale is highly probable.
An asset (or a disposal group) is classified as held for sale after an appropriate decision is made by a
duly authorised body under the company's Articles of Association – the company's Management
Board, Supervisory Board or General Meeting. In addition, an asset (or a disposal group) must be
actively offered for sale at a reasonable price corresponding with its present fair value. It should also
be expected that the sale will be disclosed in the accounting books within one year from the date of
such classification.
Non-current assets available for sale are measured at the lower of their net carrying amount and fair
value less cost to sell. If the fair value is lower than the net carrying amount, the resulting difference
is recognised in profit or loss as an impairment loss. Any reversal of the difference is also recognised
in profit or loss, but only up to the amount of the previously recognised loss.
Non-current assets available for sale (or a disposal group) are not subject to depreciation or
amortisation.

PGNiG Group Consolidated financial statements for the year ended 31 grudnia 2014
(PLNm)
Page 33 of 119
In the consolidated statement of financial position, assets available for sale (or a disposal group) are
presented as a separate item of current assets.
2.3.15. Equity
Equity is disclosed in the statement of financial position by type and in accordance with the rules
stipulated by applicable laws and the entity’s Articles of Association.
Share capital is disclosed at par value and in the amount specified in the Parent’s Articles of
Association and the entry in the court register.
Declared but not made contributions to equity are disclosed under “Called-up share capital not
paid”. Treasury shares and called-up share capital not paid reduce the entity’s equity.
Share premium comprises the positive difference between the issue price of shares over the par
value of the shares which remains after covering issue costs.
Share issue costs incurred upon establishment of a joint-stock company or share capital increase
reduce the share premium account to the amount of the difference between the issue proceeds and
the par value of the shares, and their balance is charged to other capital reserves, disclosed under
Retained earnings/deficit.
The effects of adjustments related to the first-time adoption of the IAS were charged to Retained
earnings/deficit. In accordance with the IAS, net profit for the previous financial year can be allocated
by an entity only to equity or dividends to shareholders. The option provided by the Polish law,
whereby profit can be allocated to the Company Social Benefits Fund, the Restructuring Fund,
employee profit-sharing schemes or for other purposes, is not reflected in the IAS. Therefore, the
Group recognises the aforementioned reductions in profit as the cost of the period. Profit
distributions to employees are recognised as payroll cost, while funds transferred to the Company
Social Benefits Fund are disclosed under employee benefits expense.
2.3.16. Provisions
Provisions are recognised when the Group has a present obligation (legal or constructive) resulting
from past events, and when it is probable that the discharge of this obligation will cause an outflow
of resources embodying economic benefits, and a reliable estimate can be made of the amount of
the obligation (with the obligation amount and maturity date being uncertain).
The Group reviews provisions at the end of each reporting period in order to reflect the current best
estimate. If the effect of changes in the time value of money is material, provisions are discounted. If
the provisions are discounted, an increase in the provisions as a result of lapse of time is disclosed as
costs of external funding.
The Group recognises the following provisions:
• provision for well decommissioning costs,
• provision for costs of environmental liabilities,
• provision for claims under extra-contractual use of land,
• provision for the buy-out price payable under the Energy Efficiency Act,
• other provisions.
2.3.16.1. Provision for well decommissioning costs
The Group recognises a provision for future well decommissioning costs and contributions to the
Extraction Facilities Decommissioning Fund.
The provision for future well decommissioning costs is calculated based on the average cost of well
decommissioning at the individual branches of the Parent over the last three full years preceding the

PGNiG Group Consolidated financial statements for the year ended 31 grudnia 2014
(PLNm)
Page 34 of 119
reporting period, adjusted for the projected consumer price index (CPI) and changes in the time
value of money. The adoption of a three-year time horizon was due to the varied number of
decommissioned wells and their decommissioning costs in the individual years.
If a provision relates to the cost of liquidation of property, plant and equipment, the initial value of
the provision is added to the value of the property, plant and equipment. Any subsequent
adjustments to the provision resulting from changes in estimates are also treated as an adjustment
to the value of the property, plant and equipment. Changes in provisions resulting from a change of
discount are charged/credited against finance income or costs.
The Extraction Facilities Decommissioning Fund is created on the basis of Art. 26c of the Mining and
Geological Law of February 4th 1994 (Dz.U. 05.228.1947, as amended).
The funds accumulated in the Extraction Facilities Decommissioning Fund may be used only to cover
the costs of decommissioning of an extraction facility or its specific part, in particular the costs of:
• abandonment of and securing production, storage, discharge, observation and monitoring wells;
• liquidation of redundant facilities and disassembly of machinery and equipment;
• reclamation of land and development of areas after completion of extraction activities;
• maintenance of facilities intended for decommissioning in an order ensuring safety of extraction
facility operations.
The Group makes contributions to the Extraction Facilities Decommissioning Fund in the amount of
3% to 10% of the value of the annual tax depreciation of extraction property, plant and equipment
(determined in accordance with income tax laws) with a corresponding increase in other expenses.
The amount of the provision for future well decommissioning costs is adjusted for any unused
contributions to the Extraction Facilities Decommissioning Fund.
2.3.16.2. Provision for costs of environmental liabilities
Future liabilities for the reclamation of contaminated soil and water resources, if there is a relevant
legal or constructive obligation, are recognised under provisions. The provision recognised for such
liabilities reflects potential costs projected to be incurred, which are estimated and reviewed
periodically based on current prices.
2.3.16.3. Provision for claims under extra-contractual use of land
In the ordinary course of business, the Group companies install technical equipment used for
transmission and distribution of gas on land owned by third parties, which are often natural persons.
Where possible, at the time of installing the elements of the infrastructure the Group companies
entered into agreements establishing standard land easements and transmission easements.
Transmission easement is a new construct of civil law governed by the provisions of Art. 3051–3054 of
the Polish Civil Code of April 23rd 1964 (Dz.U. No. 16, item 93 as amended), introduced in 2008.
In line with the materiality principle, the Group estimates the amount of the provision for claims
under extra-contractual use of land if the exchange of correspondence with a claimant has continued
for the last three years and such claims have been confirmed to be valid.
The Group estimates the amount of the provision based on:
• an estimate survey made by an expert appraiser, or
• its own valuation, taking into account the size of the controlled area in square metres, the
amount of annual rent per square metre for similar land in a given municipality, and the period
of extra-contractual use of land (not more than ten years), or
• if it is not possible to obtain reliable data required to apply the method described above, the
Group analyses submitted claims on a case-by-case basis.

PGNiG Group Consolidated financial statements for the year ended 31 grudnia 2014
(PLNm)
Page 35 of 119
2.3.16.4. Provision for the buy-out price payable under the Energy Efficiency Act
The Energy Efficiency Act of April 15th 2011 introduces the system of white certificates, imposing an
obligation to obtain the certificates and surrender them for cancellation to the President of the Energy
Regulatory Office, or pay a buy-out price. The obligation applies to companies selling electricity, heat
and gas fuels to end users.
White certificates, i.e. energy savings certificates, may be obtained for efficiency-improving measures
implemented or planned to be implemented by a company. An energy savings certificate may be
obtained for a measure that results in annual energy savings of at least 10 tonnes of oil equivalent
(toe) or a group of such measures that results in total annual savings in excess of 10 toe.
The Group estimates the amount of the provision for the buy-out price in accordance with the
formula set forth in the Energy Efficiency Act.
2.3.16.5. Other provisions
The Group companies may also recognise other provisions for future expenses related to their
activities and operations, if such costs are so material that failure to recognise them in profit or loss
for a given period would distort the true view of the Group's assets and financial position.
2.3.17. Prepayments and accrued income
The Group recognises as prepayments those costs incurred upfront that relate to future reporting
periods.
In the consolidated statement of financial position prepayments are disclosed as non-current (under
Other non-current assets) and current (under Other assets).
Accruals are outstanding liabilities due for merchandise or services which have been
delivered/provided but have not yet been paid, invoiced or formally agreed upon with the
supplier/provider. Accruals are disclosed together with trade and other payables as an item of equity
and liabilities in the statement of financial position.
In deferred revenue, the Group recognises deferred revenue from additional charges for uncollected
gas and government grants relating to assets. Deferred revenue from additional charges for
uncollected gas is generated under take-or-pay contracts. Under this item the Group recognises the
amount of income based on the volume of ordered and uncollected gas, which is then adjusted pro
rata to the actual volume of delivered gas. If a trading partner fails to collect the declared volume of
gas by the deadline specified in the contract, deferred revenue is reclassified to income from
compensations, penalties, fines, etc.
Government grants relating to assets are recognised as deferred revenue when it is certain that they
have been awarded. They are subsequently charged to profit or loss pro rata to depreciation charges
on the corresponding assets.
The gas companies (distribution system operators) disclose as accruals and deferrals the value of gas
infrastructure accepted free of charge and connection fees (received by June 30th 2009). This income
is amortised over time, proportionately to depreciation charges on those connections.
Deferred revenue is broken down into a non-current and current portion and disclosed under equity
and liabilities in the consolidated statement of financial position.
2.3.18. Financial liabilities
Financial liabilities are classified into two categories: financial liabilities measured at fair value
through profit or loss and other financial liabilities (including trade and other payables).

PGNiG Group Consolidated financial statements for the year ended 31 grudnia 2014
(PLNm)
Page 36 of 119
Upon initial recognition, financial liabilities are measured at fair value increased, in the case of
financial liabilities not classified as measured at fair value through profit or loss, by transaction costs
which may be directly attributed to the acquisition or issue of a given financial liability.
2.3.18.1. Financial liabilities measured at fair value through profit or loss
A financial liability at fair value through profit of loss is a financial liability that meets either of the
following conditions:
• it is classified as held for trading, or
• it was designated by the Group as measured at fair value through profit or loss upon initial
recognition.
A financial liability is classified as held for trading if it is:
• incurred principally for the purpose of selling or repurchasing it in the short term;
• a derivative (except for a derivative that is a designated and effective hedging instrument).
Changes in the fair value of derivatives included in the above category of financial liabilities are
recognised as income or expense in a reporting period in which a given derivative is remeasured.
The Group classifies as liabilities at fair value through profit or loss those derivative financial
instruments that are not measured pursuant to the principles of hedge accounting and whose
measured value is negative.
2.3.18.2. Financial liabilities at amortised cost
The other financial liabilities at amortised cost category includes all liabilities with the exception of
salaries and wages, taxes, grants, customs duties, social security and health insurance contributions
and other benefits.
Upon initial recognition, liabilities included in this category are measured at fair value plus
transaction costs which may be directly attributed to the acquisition or issue of a given financial
liability.
As at the reporting date, they are measured at amortised cost with the use of the effective interest
rate method. The adjusted acquisition cost includes cost of obtaining the borrowing as well as
discounts or premiums obtained at settlement of the liability. The difference between net funding
and redemption value is disclosed under finance income or costs over the term of the borrowing.
2.3.18.3. Other financial liabilities
Other financial liabilities comprise liabilities other than those recognised at fair value through profit
or loss.
Following initial recognition, they are measured at amortised cost with the use of the effective
interest rate method. The adjusted acquisition cost includes cost of obtaining the borrowing as well
as discounts or premiums obtained at settlement of the liability.
2.3.18.4. Trade and other payables
Trade payables are liabilities due for merchandise or services which have been delivered/provided
and have been paid, invoiced or formally agreed upon with the supplier/provider.
2.3.18.5. Employee benefit obligations
Employee benefits are all forms of consideration given by the Group in exchange for services
rendered by employees or upon termination of employment.

PGNiG Group Consolidated financial statements for the year ended 31 grudnia 2014
(PLNm)
Page 37 of 119
Short-term employee benefits are employee benefits (other than termination benefits) which fall
due wholly within 12 months after the end of the annual reporting period in which the employees
render the related service.
Post-employment benefits are employee benefits (other than termination benefits and short-term
employee benefits) which are payable after the completion of employment.
Short-term employee benefits paid by the Group include:
• salaries, wages and social security contributions,
• short-term compensated absences where the absences are expected to occur within 12 months
after the end of the period in which the employees render the related employee service;
• profit-sharing and bonuses payable within 12 months after the end of the period in which the
employees render the related service,
• non-monetary benefits for current employees.
Short-term employee benefits, including payments towards defined contribution plans, are
recognised in the periods in which the employee provides the services to the entity, and in the case
of profit-sharing and bonus payments – when the following conditions are met:
• the entity has a legal or constructive obligation to make such payments as a result of past
events, and
• a reliable estimate of the expected cost can be made.
The Group recognises expected short-term employee benefit expenses related to compensated
absences in the case of accumulated compensated absences (that is absences to which the
entitlement is transferred to the future periods and can be used in the future if the absences were
not fully used in the current period), and in the case of non-accumulating absences (which cause
obligations on the part of the Group upon their occurrence).
Post-employment benefits in the form of defined benefit plans (retirement severance) and other
long-term employee benefits (e.g. “jubilee” benefits, long-term disability pensions) are determined
using the projected unit credit method, with the actuarial valuation made as at the end of the
reporting period.
Actuarial gains and losses related to post-employment benefits are presented in other
comprehensive income, whereas gains and losses related to other post-employment benefits are
charged to profit or loss of the current reporting period.
In 2014, the Group operated the “Programme for Workforce Streamlining and Redundancy Payments
to PGNiG Group Employees for 2009–2011 (Stage 3)”, (the “Programme”) under which the Parent set
up a provision in the form of the Central Restructuring Fund to guarantee funding of redundancy-
related benefits for the eligible employees. The detailed rules of operation of the Fund as well as the
list of mark-ups and expenses from the Fund were specified in the Parent’s internal regulations. The
Programme expired on December 31st 2014. For more information, see Note 38.
2.3.18.6. Other liabilities
Other liabilities include all liabilities not classified by the Group as trade and other payables, taxes,
customs duties, social security contributions, other benefits, salaries and wages.
The category of other non-current liabilities includes liabilities under bank settlements, arrangement
and recovery proceedings, liabilities under licences, property, plant and equipment assigned and still
used by the Group, which are to be repaid in instalments over a period longer than one year.

PGNiG Group Consolidated financial statements for the year ended 31 grudnia 2014
(PLNm)
Page 38 of 119
Other current liabilities include in particular liabilities towards:
• suppliers (trade and other payables related to acquisition or construction of property, plant and
equipment and intangible assets) and sellers of securities,
• insurance companies,
• employees (other than salaries and wages)
• shareholders (dividends),
• suppliers (bid bonds),
• lessors (operating leases),
• trading partners (performance bonds),
• other liabilities.
2.3.19. Revenue
The Group's business consists in production, distribution, storage and trade in high-methane and
nitrogen-rich natural gas, sale and generation of electricity and heat, as well as production and sale
of crude oil.
The Group's business consists in sales of goods, rendering of services and leasing out the Group's
assets to third parties. Goods include the Group's products intended for sale and goods purchased
for resale, e.g. merchandise, lands, and property.
Revenue comprises amounts receivable (excluding VAT and other amounts received on behalf of
third parties) for goods and services delivered in the ordinary course of business. Revenue is
measured at fair value of the consideration received or receivable, less any discounts, sales taxes
(VAT, excise duty) and other charges.
2.3.19.1. Sales of goods
Sales of goods are recognised when the goods and products are delivered to the customer and
significant risks and benefits related to their ownership are transferred.
In order to correctly recognise revenue from gas sales in appropriate reporting period, estimates are
made as at the reporting date of the quantity and value of gas delivered, but not invoiced, to retail
customers.
Estimated sales, not invoiced in a given reporting period, are determined using industry standards
based on gas off-take characteristics by retail customers in comparable reporting periods. The value
of estimated gas sales is defined as the product of quantities assigned to the individual tariff groups
and the rates defined in a current tariff.
2.3.19.2. Rendering of services
The Group's business also includes rendering of services, i.e. distribution of gas fuels, storage of gas
fuels, real estate rental, gas services, well services as well as transport, accommodation, geological,
exploration, finance lease and other services.
When the outcome of the transaction involving the rendering of services can be reliably estimated,
revenue is recognised by reference to the stage of completion of the service at the end of the
reporting period.
2.3.19.3. Revenue from construction contracts
When the outcome of a transaction involving the rendering of construction services can be reliably
estimated, revenue and costs are recognised by reference to the stage of completion of the contract
activity at the end of the reporting period.

PGNiG Group Consolidated financial statements for the year ended 31 grudnia 2014
(PLNm)
Page 39 of 119
When the stage of completion of the contract activity cannot be estimated reliably, revenue is
recognised only to the extent that contract costs incurred are expected to be recoverable.
2.3.20. Lease/rental income
Use of the Company's assets by third parties results in income in the form of interest, royalties, and
dividends. Such income is recognised when it is probable that the economic benefits associated with
the transaction will flow to the Company and the amount of income can be measured reliably.
2.3.20.1. Interest income
Interest income is recognised on a time-apportionment basis by reference to the principal due, using
the effective interest rate, i.e. the real interest rate calculated on the basis of cash flows related to a
transaction.
2.3.20.2. Royalties
Revenue from royalties is recognised on accrual basis, taking into account the substance of a relevant
agreement.
2.3.20.3. Dividends
Dividend income is recognised when the shareholders’ right to receive dividend is recorded.
2.3.21. Grants
The Group distinguishes the following types of grants:
• grants related to assets, receivable on condition that the Group purchases, produces, or
otherwise obtains plant, property and equipment.
• grants related to revenue.
A grant is recognised only when there is reasonable assurance that the Group company will comply
with any conditions attached to the grant and the grant will be received.
Grants related to assets are recognised in the statement of financial position as deferred revenue
and subsequently recognised – through equal annual write-offs – in profit or loss throughout the
expected useful life of the assets. Non-monetary grants are accounted for at fair value.
Grants, which are generally disclosed under Revenue, may also reduce relevant costs.
A grant receivable as compensation for costs or losses already incurred or as immediate financial
support for the entity, with no future related costs, should be recognised in profit or loss in the
period in which it becomes receivable.
2.3.22. Income tax
Mandatory increases in loss/decreases in profit include current income tax (CIT) and deferred tax.
Current tax is calculated based on the taxable profit/(loss) (tax base) for a given financial year.
Profit/(loss) established for tax purposes differs from net profit/(loss) established for accounting
purposes due to different time of recognising income as earned and expenses as incurred and
because of permanent differences between tax and accounting treatment of income and expenses.
Deferred tax is determined using the balance-sheet method based on temporary differences
between the carrying amounts of assets and liabilities for accounting purposes and the amounts used
for taxation purposes.
Current tax is calculated based on the tax rates effective in a given financial year.

PGNiG Group Consolidated financial statements for the year ended 31 grudnia 2014
(PLNm)
Page 40 of 119
Deferred tax liabilities are recognised for temporary differences which are taxable when realised for
tax purposes, while a deferred tax asset is recognised to the extent that it is probable that taxable
profit will be available against which deductible temporary differences, including tax losses, can be
utilised.
Deferred tax liabilities are not recognised with respect to recognised goodwill. Deferred tax liabilities
(assets) are also not recognised in connection with initial recognition of an asset or liability in a
transaction which is not a business combination and when it does not affect either the accounting or
the taxable profit at the moment of transaction.
Deferred tax liabilities are recognised for taxable temporary differences associated with investments
in subsidiaries or associates, and interests in joint ventures, unless the Group company, acting as the
parent, investor or venturer is able to control the timing of the reversal of the temporary differences
and it is probable that the temporary difference will not reverse in the foreseeable future.
The amount of deferred tax assets is reviewed at each reporting date. If future foreseen taxable
profit is insufficient for deductible temporary differences to be settled, impairment losses on
deferred tax assets are recognised.
Deferred tax assets and liabilities are measured at tax rates that are expected to apply to the period
when the asset is realised or the liability is settled.
Deferred tax assets and liabilities are offset if, and only if, the Group:
• has a legally enforceable right to set off current tax assets against current tax liabilities; and
• the deferred tax assets and the deferred tax liabilities relate to income taxes levied by the same
taxation authority on either the same taxable entity or different taxable entities.
Deferred and current tax is recognised as income or expense, except to the extent that the tax arises
from a transaction or event that is credited or charged directly to other comprehensive income or to
equity (deferred tax is then credited or charged directly to equity).
2.3.23. Operating segments
An operating segment is a component of the Group:
• that engages in business activity from which it may earn revenues and incur expenses;
• whose operating results are reviewed regularly by the Group’s chief operating decision maker,
and are used when making decisions on asset allocation to the segment and when reviewing its
performance;
• for which discrete financial information is available.
The PGNiG Group has adopted division into business segments as the basic division of its operations.
Consolidated entities operate within the following five segments:
a) Exploration and Production Segment The segment's key business is hydrocarbon extraction and
preparation of products for sale. The segment covers the process of exploring for and extracting
natural gas and crude oil from reserves, including geological surveys, geophysical research, drilling
and development of and production from the reserves. The exploration and production activities are
conducted by PGNiG S.A., POGC Libya BV, PGNiG Upstream International AS and other Group
companies rendering services within this segment.
b) Trade and Storage Segment The segment’s activities consist in sale of natural gas, either from
imports or from domestic sources, operation of underground gas storage facilities for trading
purposes, and electricity trading. Sales of natural gas are handled by PGNiG S.A. and PGNiG Obrót
Detaliczny Sp. z o.o., while Operator Systemu Magazynowania Sp. z o.o. is engaged in the provision of
gas storage services. The segment operates six underground gas storage facilities (Mogilno,
Wierzchowice, Husów, Brzeźnica, Strachocina and Swarzów). PGNiG Sales & Trading GmbH of

PGNiG Group Consolidated financial statements for the year ended 31 grudnia 2014
(PLNm)
Page 41 of 119
Munich, which conducts activities in the area of gas and electricity trading and distribution, is also
classified as the Trade and Storage segment.
Gas trading and storage business is regulated by the Energy Law, and selling prices are established on
the basis of tariffs approved by the President of URE. Wholesale transactions are executed on the
Polish Power Exchange.
c) Distribution Segment The segment’s activities consist in transmitting natural gas through the
distribution network. Natural gas distribution services are rendered by Polska Spółka Gazownictwa
Sp. z o.o., which supplies gas to individual, industrial and wholesale customers. The company is also
responsible for operation, maintenance and expansion of the distribution network.
d) Generation Segment The segment’s activities consist in generation and sale of electricity and heat.
Assets, revenues and expenses of PGNiG TERMIKA S.A. are presented in this segment.
e) Other segments. This segment comprises all Group companies whose activities cannot be classified
into any of the other segments: engineering design and construction of structures, machinery and
equipment for the extraction and energy sectors, as well as catering and hospitality services.
A segment’s assets include all operating assets used by the segment: chiefly cash, receivables,
inventories and property, plant and equipment, in each case net of depreciation and impairment
losses. Most assets can be directly allocated to particular segments, however, if assets are used by
two or more segments their value is allocated to individual segments based on the extent to which a
given segment actually uses such assets.
A segment’s liabilities comprise all operating liabilities (primarily trade payables), salaries and wages,
and tax liabilities (both due and accrued), as well as provisions for liabilities which can be assigned to
a particular segment.
A segment’s assets or liabilities do not include deferred tax.
Intercompany transactions within a segment are eliminated.
2.4. Key reasons for uncertainty of estimates
In connection with the application by the Group of the accounting policies described above, the
Group made certain assumptions as to uncertainty and estimates, which had a material effect on the
amounts disclosed in the financial statements. Accordingly, there is a risk that there might be
significant changes in the next reporting periods, mainly concerning the areas listed below.
2.4.1. Impairment of non-current assets
The Group’s key operating assets include extraction assets (for production of natural gas and crude
oil), gas distribution infrastructure and gas fuel storage facilities. These assets were tested for
impairment. The Group computed and recognised material impairment losses on the assets, based
on an assessment of their current and future usefulness or planned decommissioning or sale. The
assumptions made in connection with potential continued use, liquidation and sale of assets are
revised in individual reporting periods. For information on the value of impairment losses recognised
in 2014, see Note 11.2.
In the case of extraction assets, there is uncertainty connected with the estimates of natural gas and
crude oil resources, on the basis of which the related cash flows are calculated. Any changes in the
estimates of the resources directly affect the amount of impairment losses on the Exploration and
Production segment assets.
Another significant uncertainty is connected with the risk related to the decisions of the Energy
Regulatory Office concerning prices of the gas fuel distribution services. Because prices materially

PGNiG Group Consolidated financial statements for the year ended 31 grudnia 2014
(PLNm)
Page 42 of 119
affect the Group’s cash flows, any change could lead to the necessity to remeasure the impairment
losses on the distribution assets.
2.4.2. Useful lives of property, plant and equipment
The useful lives of the main groups of property, plant and equipment are set forth in Section 2.3.3. of
these financial statements. The useful lives of the property, plant and equipment were determined
on the basis of assessments made by the engineering personnel responsible for their operation. Any
such assessment is connected with uncertainty as to the future business environment, technology
changes and market competition, which could lead to a different assessment of the economic
usefulness of the assets and their remaining useful lives, and ultimately have a material effect on the
value of the property, plant and equipment and the future depreciation charges.
2.4.3. Estimating natural gas sales
In order to correctly recognise revenue from gas sales in appropriate reporting periods, estimates are
made – as at the end of the reporting period – of the quantity and value of gas delivered, but not
invoiced, to retail customers.
The value of natural gas which has been supplied to retail customers, but has not been invoiced, is
estimated on the basis of the customers’ consumption patterns seen to date in comparable reporting
periods. There exists a risk that the actual final volume of the gas fuel sold might differ from the
estimate. Accordingly, profit or loss for a given period may account for a portion of the estimated
sales volume which will never be realised.
2.4.4. Provisions for well decommissioning costs and environmental liabilities
The provision for well decommissioning costs and provisions for environmental liabilities presented
in Note 26 represent significant items among the provisions disclosed in the consolidated financial
statements. These provisions are based on the estimates of future asset decommissioning and land
reclamation costs, which largely depend on the applied discount rate and the estimated future cash-
flow period.
2.4.5. Provision for claims under extra-contractual use of land
In accordance with the materiality rule, the Group estimated the amount of the provision for claims
under extra-contractual use of land (see Section 2.3.16.3).
As the amounts used in the above calculations were arrived at based on a number of variables, the
actual amounts of compensation for extra-contractual use of land that the Group will be required to
pay may differ from amounts of the related provisions.
2.4.6. Impairment of SGT EUROPOL GAZ S.A. shares
The Parent tested its investment in SGT EUROPOL GAZ S.A. for impairment using the discounted cash
flow method. The valuation was based on the Inter-Governmental Protocol of October 29th 2010,
which specified the company's expected net profit. The result of impairment test is sensitive to the
adopted assumptions regarding future cash flows (which depend on implementation by the company
of the Inter-Governmental Protocol with respect to net profit to be earned in subsequent years) and
discount rate. Changes in these assumptions following from updates of the Company’s financial
forecasts and changes in the discount rate due to general or company-specific factors, may have a
material effect on the company’s future value. For more information on the valuation, see Note 6.

PGNiG Group Consolidated financial statements for the year ended 31 grudnia 2014
(PLNm)
Page 43 of 119
2.5. Contingent assets and liabilities
A contingent asset is a possible asset that arises from past events and whose existence will be
confirmed only by the occurrence or non-occurrence of one or more uncertain future events not
wholly within the control of the Company.
Contingent assets are not recognised in the consolidated statement of financial position as this might
result in recognition of income that may never be realised. However, when the realisation of income
is probable, then the Group discloses a brief description of the nature of such contingent assets at
the end of the reporting period in the notes and, where practicable, estimate their financial effects
using the principles set out for provisions.
Contingent assets are assessed continually to ensure that developments are appropriately reflected
in the financial statements. If it has become virtually certain that an inflow of economic benefits will
arise, the asset and the related income are recognised in the financial statements of the period in
which the change occurs. If an inflow of economic benefits has become probable, the Group
discloses the contingent asset.
A contingent liability is:
• a possible obligation that arises from past events and whose existence will be confirmed only by
the occurrence or non-occurrence of one or more uncertain future events not wholly within the
control of the Group; or
• a present obligation that arises from past events but is not recognised, because it is not
probable that an outflow of resources embodying economic benefits will be required to settle
the obligation, or the amount of the obligation (liability) cannot be measured with sufficient
reliability.
The Group does not recognise contingent liabilities in the consolidated statement of financial
position, except contingent liabilities assumed as a result of business combinations, which are
recognised in the statement of financial position as provisions for liabilities.
Unless the possibility of any outflow in settlement is remote, the Group discloses for each class of
contingent liability at the end of the reporting period a brief description of the nature of the
contingent liability and, where practicable:
• an estimate of its financial effect, measured using the principles set out for provisions,
• an indication of the uncertainties relating to the amount or timing of any outflow; and
• the possibility of any reimbursement.
2.6. Presentation changes in the financial statements
Change in presentation of purchase of gas fuel transmission services at entry points
The Group changed the presentation of cost of gas fuel transmission services purchased at the
system entry points (pursuant to the Regulation of the Minister of Economy on detailed rules for
determining and calculating tariffs for gas fuels and on settlement of transactions in gas fuels
trading). As of 2014, the costs are disclosed in the statement of profit or loss under “Raw materials
and consumables used” (increase in gas fuel purchase costs), and not under “Services” as was the
case previously.
Change in presentation of joint-operation transactions in which the Parent acts as the operator
Beginning from the 2014 half-year report, the Group offsets the costs representing the partner's
interest in joint operations against the corresponding revenue under the operator's charge invoice.
Such events were previously presented separately under revenue and expenses.
Change in the presentation of deferred tax assets and liabilities

PGNiG Group Consolidated financial statements for the year ended 31 grudnia 2014
(PLNm)
Page 44 of 119
The Group reviewed its presentation of deferred tax assets and liabilities. Beginning from the
periodic report for the first half of 2014, the Group stopped presenting some of the deferred tax
assets and liabilities in net amounts.
Change of presentation of capitalised interest repayment
The Group has reclassified interest amounts capitalised in interest-bearing liabilities at the beginning
of a given reporting period and paid in the current reporting period. So far, these amounts were
disclosed in the statement of cash flows under "Repayment of borrowings", "Repayment of debt
securities" and "Payment of finance lease liabilities", depending on which item the capitalised
interest related to. Starting from 2014, these amounts are disclosed under "Interest paid".
Amalgamation of items in the statement of financial position
Starting from the consolidated financial statements for 2014, the Group changed the presentation of
its “Financial assets available for sale”; the non-current portion of this item is now presented in
“Other financial assets”, whereas the current portion is carried in “Other assets”.
The purpose of these changes was to increase the transparency and usefulness of the data presented
in the financial statements.
As a result, the comparative data for 2013 were adjusted, as presented below.
2.6.1. Earnings/(loss) and diluted earnings/(loss) per share attributable to owners of the parent
(PLN) – restatement of comparative data
Year ended Dec 31 2013 before
the change
Year ended Dec 31 2013 after
the change
Earnings/(loss) and diluted earnings/(loss) per share attributable to holders of ordinary shares of the parent (PLN)
0.33 0.33
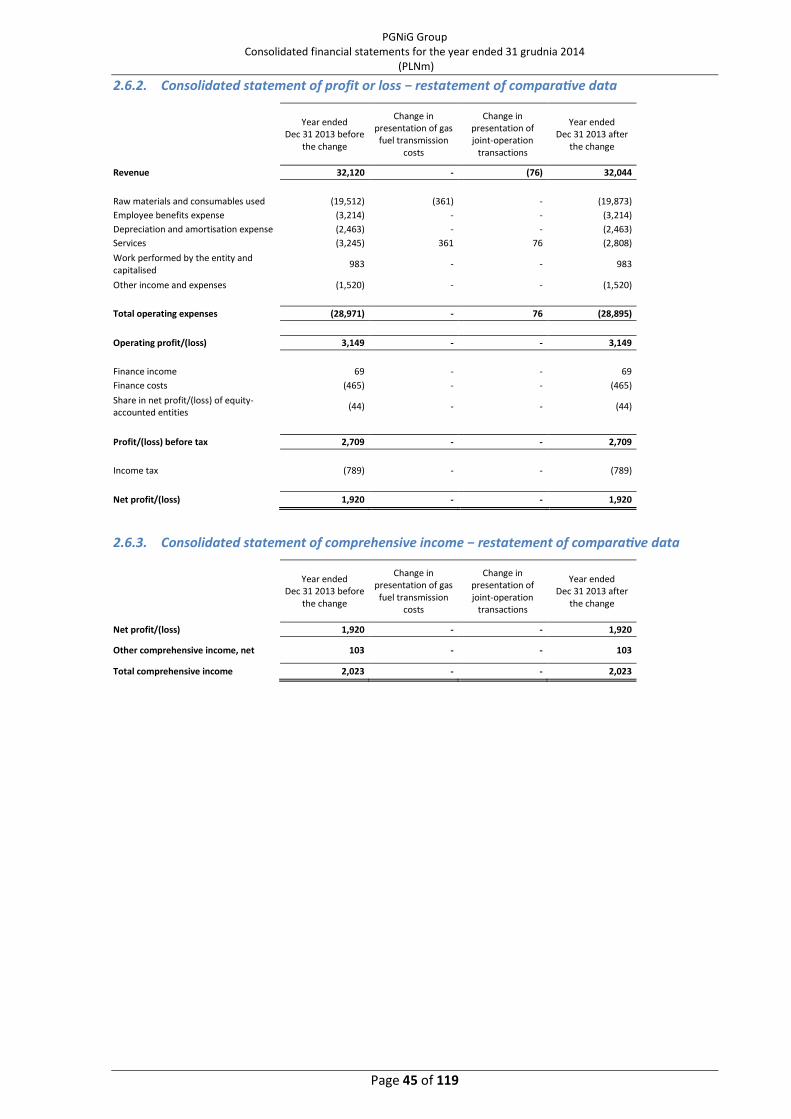
PGNiG Group Consolidated financial statements for the year ended 31 grudnia 2014
(PLNm)
Page 45 of 119
2.6.2. Consolidated statement of profit or loss − restatement of compara=ve data
Year ended Dec 31 2013 before
the change
Change in presentation of gas fuel transmission
costs
Change in presentation of joint-operation
transactions
Year ended Dec 31 2013 after
the change
Revenue 32,120 - (76) 32,044
Raw materials and consumables used (19,512) (361) - (19,873)
Employee benefits expense (3,214) - - (3,214)
Depreciation and amortisation expense (2,463) - - (2,463)
Services (3,245) 361 76 (2,808)
Work performed by the entity and capitalised
983 - - 983
Other income and expenses (1,520) - - (1,520)
Total operating expenses (28,971) - 76 (28,895)
Operating profit/(loss) 3,149 - - 3,149
Finance income 69 - - 69
Finance costs (465) - - (465)
Share in net profit/(loss) of equity-accounted entities
(44) - - (44)
Profit/(loss) before tax 2,709 - - 2,709
Income tax (789) - - (789)
Net profit/(loss) 1,920 - - 1,920
2.6.3. Consolidated statement of comprehensive income − restatement of compara=ve data
Year ended Dec 31 2013 before
the change
Change in presentation of gas fuel transmission
costs
Change in presentation of joint-operation
transactions
Year ended Dec 31 2013 after
the change
Net profit/(loss) 1,920 - - 1,920
Other comprehensive income, net 103 - - 103
Total comprehensive income 2,023 - - 2,023

PGNiG Group Consolidated financial statements for the year ended 31 grudnia 2014
(PLNm)
Page 46 of 119
2.6.4. Consolidated statement of financial position − restatement of compara=ve data
As at Dec 31 2013 before the change
Change in the presentation of
deferred tax assets and liabilities
Amalgamation of items in the statement of
financial position
As at Dec 31 2013 after the change
ASSETS
Total non-current assets 36,239 1,240 - 37,479
including:
Deferred tax assets 993 1,240 - 2,233
Financial assets available for sale 51 - (51) -
Other financial assets 191 - 51 242
Total current assets 10,905 - - 10,905
Total assets 47,144 1,240 - 48,384
EQUITY AND LIABILITIES
Total equity 28,453 - - 28,453
Total non-current liabilities 10,853 1,240 - 12,093
including:
Deferred tax liabilities 1,970 1,240 - 3,210
Total current liabilities 7,838 - - 7,838
Total liabilities 18,691 1,240 - 19,931
Total equity and liabilities 47,144 1,240 - 48,384

PGNiG Group Consolidated financial statements for the year ended 31 grudnia 2014
(PLNm)
Page 47 of 119
As at Jan 1 2013
before the change
Change in the presentation of
deferred tax assets and liabilities
Amalgamation of items in the statement of
financial position
As at Jan 1 2013 after the change
ASSETS
Total non-current assets 37,096 1,247 - 38,343
including:
Deferred tax assets 1,136 1,247 - 2,383
Financial assets available for sale 48 - (48) -
Other financial assets 124 - 48 172
Total current assets 10,833 - - 10,833
Total assets 47,929 1,247 - 49,176
EQUITY AND LIABILITIES
Total equity 27,197 -
27,197
Total non-current liabilities 11,119 1,247
12,366
including:
Deferred tax liabilities 1,936 1,247
3,183
Total current liabilities 9,613 -
9,613
Total liabilities 20,732 1,247
21,979
Total equity and liabilities 47,929 1,247
49,176
2.6.5. Consolidated statement of cash flows − restatement of compara=ve data
Year ended Dec 31 2013 before
the change
Reclassification of capitalised interest
repayment
Year ended Dec 31 2013 after
the change
Net cash generated by operating
activities 7,813 - 7,813
Net cash (used in)/generated by
investing activities (3,060) - (3,060)
Net cash used in/(generated by)
financing activities (3,874) - (3,874)
including:
Repayment of borrowings (700) 4 (696)
Repayment of debt securities (4,322) 49 (4,273)
Payment of finance lease liabilities (57) 4 (53)
Interest paid (208) (57) (265)
Net increase/(decrease) in cash and
cash equivalents 879 - 879
Cash and cash equivalents at beginning
of the period 1,947 - 1,947
Cash and cash equivalents at end of
the period 2,826 - 2,826

PGNiG Group Consolidated financial statements for the year ended 31 grudnia 2014
(PLNm)
Page 48 of 119
3. OPERATING SEGMENTS
3.1. Reportable segments
The tables below present revenue, costs and profits/losses, as well as assets, equity and liabilities of the Group’s reporting segments for the years ended
December 31st 2014 and December 31st 2013.
Year ended December 31st 2014 Exploration and
Production Trade and Storage Distribution Generation Other Segments Eliminations Total
Statement of profit or loss
Sales to third-party customers 4,346 28,367 280 1,149 162 - 34,304 Inter-segment sales 1,725 458 4,003 794 163 (7,143) -
Segment's total revenue 6,071 28,825 4,283 1,943 325 (7,143) 34,304
Depreciation and amortisation expense (1,137) (181) (864) (301) (20) 1 (2,502) Other costs (2,928) (28,061) (2,281) (1,480) (373) 7,164 (27,959)
Segment's total costs (4,065) (28,242) (3,145) (1,781) (393) 7,165 (30,461)
Operating profit/(loss) 2,006 583 1,138 162 (68) 22 3,843
Net finance costs
(346)
Share in net profit/(loss) of equity-accounted entities
129
129
Profit/(loss) before tax
3,626
Income tax
(804)
Net profit/(loss)
2,822
STATEMENT OF FINANCIAL POSITION
Segment's assets 15,442 18,299 14,142 4,184 387 (6,780) 45,674
Investments in equity-accounted entities
856
856
Unallocated assets
613 Deferred tax assets
1,783
Total assets
48,926
Total equity
30,169 Segment's liabilities 5,531 4,873 2,638 2,049 219 (6,427) 8,883 Unallocated liabilities
6,624
Deferred tax liabilities
3,250
Total equity and liabilities
48,926
Other information
Capital expenditure on property, plant and equipment and intangible assets
(2,063) (269) (1,091) (285) (10) (63) (3,781)
Impairment losses on assets (2,381) (1,590) (112) (26) (22) - (4,131)
Impairment losses on unallocated assets
(46)

PGNiG Group Consolidated financial statements for the year ended 31 grudnia 2014
(PLNm)
Page 49 of 119
Year ended December 31st 2013 Exploration and
Production Trade and Storage Distribution Generation Other Segments Eliminations Total
Statement of profit or loss
Sales to third-party customers 4,580 25,341 165 1,658 300 - 32,044 Inter-segment sales 1,605 318 4,085 405 124 (6,537) -
Segment's total revenue 6,185 25,659 4,250 2,063 424 (6,537) 32,044
Depreciation and amortisation expense (1,050) (177) (857) (359) (20) - (2,463) Other costs (2,804) (25,490) (2,654) (1,560) (469) 6,545 (26,432)
Segment's total costs (3,854) (25,667) (3,511) (1,919) (489) 6,545 (28,895)
Operating profit/(loss) 2,331 (8) 739 144 (65) 8 3,149
Net finance costs
(396)
Share in net profit/(loss) of equity-accounted entities
(44)
(44)
Profit/(loss) before tax
2,709
Income tax
(789)
Net profit/(loss)
1,920
STATEMENT OF FINANCIAL POSITION
Segment's assets 15,364 17,344 14,067 4,124 411 (6,244) 45,066
Investments in equity-accounted entities
727
727
Unallocated assets
358
Deferred tax assets
2,233
Total assets
48,384
Total equity
28,453
Segment's liabilities 4,954 4,634 2,879 1,943 187 (5,847) 8,750
Unallocated liabilities
7,971
Deferred tax liabilities
3,210
Total equity and liabilities
48,384
Other information
Capital expenditure on property, plant and equipment and intangible assets
(1,630) (341) (1,110) (203) (13) 7 (3,290)
Impairment losses on assets (1,642) (1,479) (115) (34) (20) - (3,290)
Impairment losses on unallocated assets
(45)

PGNiG Group Consolidated financial statements for the year ended 31 grudnia 2014
(PLNm)
Page 50 of 119
3.2. Geographical areas
The Group’s conducts its business activity primarily on the domestic market (Poland). In 2014,
revenue from export sales to external customers accounted for 14.89% (2013: 14.59%) of total
revenue from sales to external customers.
Year ended Dec 31 2014
Year ended Dec 31 2013
Domestic sales: 29,195 27,368
High-methane gas 23,944 21,728
Nitrogen-rich gas 1,367 1,409
Crude oil and natural gasoline 789 1,007
Helium 12 29
Electricity 910 995
Heat 1,079 1,069
Geophysical and geological services 83 103
Drilling and well services 168 192
Construction and installation services 131 229
Connection charge 112 110
Other sales 600 497
Export sales: 5,109 4,676
High-methane gas 1,782 1,812
Nitrogen-rich gas 35 21
Crude oil and natural gasoline 1,758 1,639
Helium 108 154
NGL 107 111
Electricity 785 365
Geophysical and geological services 198 136
Drilling and well services 312 402
Construction and installation services 4 14
Other sales 20 22
Total 34,304 32,044
On foreign markets the Group sells mainly to customers in Germany (56% of export sales), Norway
and Switzerland.
Most of the Group’s non-current assets (other than financial instruments) are also located in Poland.
The value of non-current assets located outside of Poland as at December 31st 2014 represented
13.13% of the Group's total assets (December 31st 2013: 13.02%).
As at Dec 31 2014 As at Dec 31 2013
Value of non-current assets other than financial instruments located in Poland
30,100 29,751
Value of non-current assets other than financial instruments located abroad*
4,550 4,455
Total 34,650 34,206
% share of assets located outside of Poland in total assets 13.13% 13.02%
* Including PGNiG Upstream International AS 4,041 3,587
3.3. Key customers
The Group does not have any single external customer which would account for 10% or more of total
revenue earned by the Group.

PGNiG Group Consolidated financial statements for the year ended 31 grudnia 2014
(PLNm)
Page 51 of 119
4. OPERATING EXPENSES
4.1. Raw materials and consumables used
Year ended Dec 31 2014
Year ended Dec 31 2013
Cost of gas sold (18,750) (17,569)
Fuels for electricity and heat generation (760) (908)
Electricity for trading (1,093) (670)
Other raw materials and consumables used (626) (726)
Total (21,229) (19,873)
4.2. Employee benefits expense
Year ended Dec 31 2014
Year ended Dec 31 2013
Salaries and wages (2,091) (2,127)
Social security contributions (460) (484)
Cost of future employee benefits 31 (355)
Other employee benefits expense (307) (248)
Total (2,827) (3,214)
4.3. Services
Year ended Dec 31 2014
Year ended Dec 31 2013
Transmission services (1,076) (1,113)
Cost of dry wells written off (282) (132)
Other services (1,485) (1,563)
Total (2,843) (2,808)
4.4. Other income and expenses
Year ended Dec 31 2014
Year ended Dec 31 2013
Compensations, penalties, fines received 50 187
Other income 169 160
Net exchange differences related to operating activities (59) (351)
Net gain/(loss) on derivative instruments related to operating activities
(79) 168
Change in products 40 22
Change in impairment losses* (863) (491)
Increase/(decrease) in provisions (319) (211)
Taxes and charges (606) (574)
Other expenses (373) (430)
Total (2,040) (1,520)
* Including changes in impairment losses on tangible assets under construction related to the exploration for and evaluation of mineral resources.
(238) (438)

PGNiG Group Consolidated financial statements for the year ended 31 grudnia 2014
(PLNm)
Page 52 of 119
5. FINANCE INCOME AND COSTS
Year ended Dec 31 2014
Year ended Dec 31 2013
Finance income 86 69
Interest income 80 65
Dividends and other profit distributions 3 3
Other finance income 3 1
Finance costs (432) (465)
Loss on measurement and realisation of derivative financial instruments
(32) (35)
Interest expense (214) (272)
Foreign exchange losses (143) (117)
Commission fees paid on bank borrowings (19) (25)
Cost of guarantees (3) (3)
Other finance costs (21) (13)
Net finance income/(cost) (346) (396)
6. EQUITY ACCOUNTING FOR INVESTEES
6.1. Condensed financial information on equity-accounted investees
As at Dec 31 2014 As at Dec 31 2013
SGT EUROPOL GAZ S.A.
PGNiG Group’s ownership interest* 49.74% 49.74%
Principal business activity Transmission of
natural gas Transmission of
natural gas
Key financial data**
Non-current assets 2,714 2,977
Current assets 1,798 1,550
Non-current liabilities 569 673
Current liabilities 303 245
Revenue 1,183 1,120
Net profit/(loss) 32 (12)
GAS-TRADING S.A.
PGNiG Group’s ownership interest 43.41% 43.41%
Principal business activity Trade Trade
Key financial data**
Non-current assets 12 12
Current assets 29 28
Non-current liabilities - -
Current liabilities 1 2
Revenue 111 46
Net profit/(loss) 0.4 (0.9)
* Including a 48% direct interest and 1.74% held indirectly through Gas-Trading S.A.
** Data from financial statements prepared in accordance with the Polish Accounting Standards.
Under the agreement of May 20th 1997, made between the Company shareholders and SGT
EUROPOL GAZ S.A. (“EUROPOL GAZ”), the parties agreed that until EUROPOL GAZ fully discharges its
liabilities under borrowings incurred in connection with construction of the gas pipeline, no decision
on payment of dividend by EUROPOL GAZ will be made. EUROPOL GAZ's liabilities under its
borrowings mature in 2018. There are no other restrictions at EUROPOL GAZ with respect to
payment of dividend or repayment of borrowings or prepayments provided to it by the Company.
At GAS-TRADING S.A., with respect to payment of dividend or repayment of borrowings or
prepayments provided to it by the Company.

PGNiG Group Consolidated financial statements for the year ended 31 grudnia 2014
(PLNm)
Page 53 of 119
6.2. Net carrying amount of interests in equity-accounted investees
As at Dec 31 2014 As at Dec 31 2013
SGT EUROPOL GAZ S.A.
Equity accounting for the investment* 1,527 1,507
Cost of acquisition of the interest 38 38
Share in changes in equity 1,565 1,545
Impairment losses (725) (834)
Net carrying amount of the investment 840 711
GAS-TRADING S.A.
Equity accounting for the investment 15 15
Cost of acquisition of the interest 1 1
Share in changes in equity 16 16
Impairment losses - -
Net carrying amount of the investment 16 16
Total net carrying amount of the investments 856 727
*After adjustment to equity to ensure compliance with the Group's accounting policies. See Note 6.3.
6.3. Reconciliation of carrying amount of interests in equity-accounted investees
Year ended Dec 31 2014
Year ended Dec 31 2013
Net carrying amount of the investments at beginning of the period
727 771
Valuation recognised in profit or loss, including: 129 (44)
Valuation of SGT EUROPOL GAZ S.A. 129 (44)
Valuation of Gas-Trading S.A. - -
Net carrying amount of the investments at end of the period 856 727
The Parent estimated the amount of its equity interest in EUROPOL GAZ on the basis of the
company’s equity disclosed in its financial statements at December 31st 2014 prepared in
accordance with the Polish Accountancy Act, adjusted for differences in the accounting policies
applied within the Group and results on intercompany transactions. The differences in the
accounting policies concerned recognition of interest expenses in the net value of property, plant
and equipment (until the end of 2008). Until the end of 2008, the Group applied the standard
approach (in accordance with IAS 23) and did not recognise borrowing costs in the initial value of
property, plant and equipment. As of the beginning of 2009, the Group capitalises borrowing costs in
the value of property, plant and equipment, therefore the adjustment consists in elimination of these
costs with respect to the previous years.
Subsequently, the Parent tested its interest in EUROPOL GAZ for impairment using the discounted
cash flow method, on the basis of information on the company's target net profit as specified in the
Inter-Governmental Protocol dated October 29th 2010. The calculations were based on the
assumption that in each year in 2011-2021 EUROPOL GAZ's net profit will be PLN 21m. The
discounted cash flows include all cash flows generated by EUROPOL GAZ, including cash flows related
to the servicing of interest-bearing borrowings (interest expenses and repayment of the principal).

PGNiG Group Consolidated financial statements for the year ended 31 grudnia 2014
(PLNm)
Page 54 of 119
As at December 31st 2014, the Parent measured the carrying amount of its equity interest in the
joint venture using the equity method at PLN 1,565m. The company's value estimated as at the same
date using the discounted cash flow method was PLN 840m.
Therefore, the Parent made a revaluation adjustment to the investment's net carrying amount to
reflect the its current valuation of PLN 840m. As at the end of 2014, the difference in valuation
relative to December 31st 2013 was PLN 129m and was recognised in the statement of profit or loss
for the current period in “Share in net profit/loss of equity-accounted entities”.
7. INCOME TAX
The PGNiG Tax Group (PTG), set up for the purpose of accounting for corporate income tax (CIT), was
registered on February 24th 2014, and commenced operations on April 1st 2014.
The PGNiG Tax Group comprises the following companies: PGNiG S.A. – specified in the agreement
on the establishment of the tax group as the Representative Company, PGNiG Obrót Detaliczny Sp. z
o.o., PSG Sp. z o.o., PGNiG Termika S.A., OSM Sp. z o.o., PGNiG SPV 5 Sp. z o.o., PGNiG SPV 6 Sp. z
o.o. and PGNiG SPV 7 Sp. z o.o.
The PTG agreement covers three consecutive tax years, i.e.:
• the first tax year − from April 1st 2014 to December 31st 2014;
• the second tax year − from January 1st 2015 to December 31st 2015;
• the third tax year − from January 1st 2016 to December 31st 2016;
Other Group companies are separate CIT taxpayers.
7.1. Income tax expense disclosed in the statement of profit or loss
Year ended Dec 31 2014
Year ended Dec 31 2013
Profit/(loss) before tax 3,626 2,709
Tax rate applicable in the period 19% 19%
Tax calculated at the applicable tax rate (689) (515)
Permanent differences between profit/(loss) before tax and taxable income and the difference in tax rates
(115) (274)
Tax expense in the consolidated statement of profit or loss (804) (789)
Current tax expense (Note 7.2) (726) (687)
Deferred tax expense (Note 7.3) (78) (102)
Effective tax rate 22% 29%

PGNiG Group Consolidated financial statements for the year ended 31 grudnia 2014
(PLNm)
Page 55 of 119
7.2. Current tax expense
Year ended Dec 31 2014
Year ended Dec 31 2013
Profit/(loss) before tax (consolidated) 3,626 2,709
Consolidation adjustments (42) 359
Differences between profit/(loss) before tax and tax base
(259) 404
Taxable income not recognised as income for accounting purposes
356 407
Tax deductible expenses not recognised as expenses for accounting purposes
(3,534) (2,464)
Income not recognised as taxable income 2,233 2,162
Non-tax deductible expenses (5,630) (4,779)
Deductions from income (478) (156)
Income tax base 3,325 3,472
Tax rate applicable in the period 19% 19%
Income tax (632) (660)
Increases, reliefs, exemptions, allowances and reductions in/of income tax
(94) (27)
Current tax expense disclosed in tax return for the period (726) (687)
Current tax expense disclosed in the consolidated statement
of profit or loss (726) (687)

PGNiG Group Consolidated financial statements for the year ended 31 grudnia 2014
(PLNm)
Page 56 of 119
7.3. Deferred tax expense
Year ended Dec 31 2014
Year ended Dec 31 2013
I. Deferred tax expense disclosed in the consolidated
statement of profit or loss (78) (102)
Recognition and reversal of deferred tax due to deductible
temporary differences
35 (85)
Impairment losses on financial assets, receivables and tangible assets under construction
58 25
Provisions for future liabilities 58 60
Costs of FX risk and interest rate risk hedges
97 (49)
Foreign exchange losses (1) -
Investment tax credit (Norway) (169) (156)
Tax loss for the period 10 20
Other deductible temporary differences (18) 15
Recognition and reversal of deferred tax due to taxable
temporary differences
(113) (17)
Difference between tax and accounting value of non-current assets
85 6
Positive valuation of FX and interest rate risk hedges
(127) (13)
Foreign exchange gains 3 -
Income on tax obligation arising in subsequent month
(13) 14
Other taxable temporary differences (61) (24)
II. Deferred tax expense disclosed in other comprehensive
income, net, including: 58 (33)
Hedge accounting 50 (14)
Actuarial gains/(losses) on employee benefits
8 (19)
III. Other changes (470) (42)
Exchange differences on translating deferred tax attributable to foreign operations
22 (40)
Tax used - investment tax credit (Norway) (492) -
Reclassification to assets held for sale - (2)
Total changes (I - III) (490) (177)
The current reporting period covered the tax period from January 1st to December 31st 2014. The
CIT rate applicable in Poland in 2014 was 19%. In the comparative period, i.e. in 2013, the rate was
also 19%.
Foreign subsidiaries and foreign branches of the Parent and of Polish subsidiaries are subject to tax
regulations in force in the countries where they conduct their business and the provisions of double
tax treaties. In the case of foreign branches of subsidiaries, the tax rates effective in 2014 ranged
from 12% to 42% (in 2013: from 11% to 41%). Foreign branches of the Parent did not generate any
taxable income in 2013 and 2012.
In the case of PGNiG Upstream International AS (“PUI”), the marginal tax rate is 78%. PUI’s activities
in the Norwegian Continental Shelf are subject to taxation under two separate tax systems:

PGNiG Group Consolidated financial statements for the year ended 31 grudnia 2014
(PLNm)
Page 57 of 119
• The corporate income tax system (tax rate of 27%);
• The petroleum tax system (additional tax rate of 51%).
Such a high tax rate in Norway comes with a wide range of investment incentives and additional
allowances.
• For instance, the company may apply a high depreciation/amortisation rate (the annual
depreciation/amortisation rate is 16.67%) and commence depreciation/amortisation
immediately after capital expenditure is incurred.
In the first year, the company is entitled to full annual depreciation/amortisation, regardless of
the date when capital expenditure is actually incurred.
• The company may benefit from an investment incentive of 5.5% per annum for the period of
four years under the petroleum tax regime. The incentive relates to capital expenditure made in
the Norwegian Continental Shelf (NCS) (excluding exploration expenditure) and amounts to 22%
of depreciable expenditure (5.5% over four years; however, for projects commenced before
May 2013 the incentive is 30%, i.e. 7.5% over four years). The incentive is deducted only from
the income taxable with the petroleum tax (51% rate) and does not apply to income tax. If the
incentive amount exceeds income generated in a given year, it becomes deductible in
subsequent years.
• Total expenditure on exploration activities may be deducted from revenue. If a company does
not generate income from which expenditure on exploration could be deducted, it is entitled to
a reimbursement of 78% of expenditure on exploration. The funds are returned in cash, by the
end of the year following the year covered by the tax return.
• Finance costs may be deducted under both taxation systems.
PUI has been amortising its investment expenditure since 2007 and has been using its investment
incentive by recognising it as deferred tax expense; such deferred tax expense is used when taxable
income is earned.
Under the Norwegian tax system the use of tax losses is not time-barred and, what is more, interest
accrues on losses incurred after 2002. The interest rate applicable to such losses is calculated as a
risk-free interest rate plus a margin, net of income tax (27%). Tax losses, including interest, incurred
by PUI since 2013 reduce its current tax expense.
The balance of deferred tax presented in the financial statements is reduced by a valuation
adjustment due to temporary differences whose realisation for tax purposes is not entirely certain.
8. DISCONTINUED OPERATIONS
The Group did not discontinue any operations in 2014.
As at December 31st 2013, the Group presented the assets, equity and liabilities of Geovita S.A. in
the consolidated statement of financial position under non-current assets held for sale and liabilities
associated with assets held for sale.
On April 8th 2014, the PGNiG Management Board abandoned plans to sell Geovita S.A. after no
satisfactory price offers were attracted in the sales process conducted by PGNiG S.A. Geovita S.A.
does not represent a material area of the Group's operations.
For more information on assets held for sale, see Note 22.
9. EARNINGS/(LOSS) PER SHARE
Basic earnings/(loss) per share are/is calculated by dividing net profit/(loss) attributable to holders of
the Parent’s ordinary shares for a given reporting period by the weighted average number of
outstanding ordinary shares in the financial year.

PGNiG Group Consolidated financial statements for the year ended 31 grudnia 2014
(PLNm)
Page 58 of 119
Diluted earnings/(loss) per share are/is calculated by dividing the net profit/(loss) attributable to
holders of the ordinary shares for a given reporting period (less interest on redeemable preference
shares convertible into ordinary shares) by the weighted average number of outstanding ordinary
shares in the reporting period (adjusted for the effect of dilutive options and dilutive redeemable
preference shares convertible into ordinary shares).
Year ended Dec 31 2014
Year ended Dec 31 2013
Net profit/(loss) attributable to owners of the parent 2,823 1,918
Net profit/(loss) attributable to owners of the parent used to calculate diluted earnings/(loss) per share
2,823 1,918
Weighted average number of outstanding ordinary shares used to calculate basic earnings/(loss) per share
5,900 5,900
Weighted average number of outstanding ordinary shares used to calculate diluted earnings/(loss) per share
5,900 5,900
Basic earnings/(loss) per share for the year, attributable to holders of ordinary shares of the parent (PLN)
0.48 0.33
Diluted earnings/(loss) per share for the period, attributable to holders of ordinary shares of the parent (PLN)
0.48 0.33
The weighted average number of shares was computed in the manner presented in the table below:
Beginning of the period End of the period Number of
outstanding ordinary shares (million)
Number of days Weighted average number of shares
(million)
Dec 31 2014
01-01-2014 Dec 31 2014 5,900 365 5,900
Total 365 5,900
Dec 31 2013
01-01-2013 Dec 31 2013 5,900 365 5,900
Total 365 5,900

PGNiG Group Consolidated financial statements for the year ended 31 grudnia 2014
(PLNm)
Page 59 of 119
10. DIVIDEND PAID AND PROPOSED
Year ended Dec 31 2014
Year ended Dec 31 2013
Dividends declared and paid in the period
Dividend per share paid (PLN) 0.15 0.13
Number of shares 5,900 5,900
Dividend paid 885 767
- dividend paid to owners of the parent
885 767
- dividend paid to non-controlling interests
- -
On May 15th 2014, the Annual General Meeting of PGNiG S.A. passed a resolution on distribution of the Company’s 2013 net profit and decided to allocate PLN 885m to dividend.
The dividend record date and the dividend payment date were set for August 14th 2014 and
September 4th 2014, respectively.
On May 22nd 2013, the Annual General Meeting of PGNiG S.A. passed a resolution on distribution of
the Company’s 2012 net profit and decided to allocate PLN 767m for payment of dividend.
The dividend record date and the dividend payment date were set for July 20th 2013 and October 3rd
2013, respectively.
11. PROPERTY, PLANT AND EQUIPMENT
As at Dec 31 2014 As at Dec 31 2013
Land 71 77
Buildings and structures 17,172 17,188
Plant and equipment 8,602 8,663
Vehicles and other 1,211 1,213
Total tangible assets 27,056 27,141
Tangible exploration and evaluation assets under construction 2,148 2,102
Other tangible assets under construction 4,324 3,790
Total property, plant and equipment 33,528 33,033

PGNiG Group Consolidated financial statements for the year ended 31 grudnia 2014
(PLNm)
Page 60 of 119
TANGIBLE ASSETS
As at Dec 31 2014 Land Buildings and
structures Plant and equipment Vehicles and other Total
Net carrying amount as at Jan 1 2014, net of accumulated depreciation and impairment losses
77 17,188 8,663 1,213 27,141
Increase - 249 1 - 250
Decrease (1) (110) (25) (4) (140)
Currency translation differences - - (165) 1 (164)
Transfers from tangible assets under construction and between asset groups - 1,271 1,238 212 2,721
Impairment losses (5) (357) (67) (8) (437)
Depreciation expense for the reporting period - (1,069) (1,043) (203) (2,315)
Net carrying amount as at Dec 31 2014, net of accumulated depreciation and
impairment losses 71 17,172 8,602 1,211 27,056
As at Jan 1 2014
Gross carrying amount 79 27,169 12,528 2,424 42,200
Accumulated depreciation and impairment losses (2) (9,981) (3,865) (1,211) (15,059)
Net carrying amount as at Jan 1 2014 77 17,188 8,663 1,213 27,141
As at Dec 31 2014
Gross carrying amount 78 28,536 13,467 2,583 44,664
Accumulated depreciation and impairment losses (7) (11,364) (4,865) (1,372) (17,608)
Net carrying amount as at Dec 31 2014 71 17,172 8,602 1,211 27,056

PGNiG Group Consolidated financial statements for the year ended 31 grudnia 2014
(PLNm)
Page 61 of 119
As at Dec 31 2013 Land Buildings and
structures Plant and equipment Vehicles and other Total
Net value as at Jan 1 2013, net of accumulated depreciation and impairment losses 70 16,522 4,530 1,244 22,366
Increase 1 36 33 4 74
Changes in the Group - - - - -
Decrease - (611) (54) (12) (677)
Currency translation differences - - (284) - (284)
Transfers from tangible assets under construction and between asset groups 6 2,376 5,409 187 7,978
Impairment losses - (37) (19) (1) (57)
Depreciation expense for the reporting period - (1,098) (952) (209) (2,259)
Net carrying amount as at Dec 31 2013, net of accumulated depreciation and
impairment losses 77 17,188 8,663 1,213 27,141
As at Jan 1 2013
Gross carrying amount 72 25,430 7,470 2,366 35,338
Accumulated depreciation and impairment losses (2) (8,908) (2,940) (1,122) (12,972)
Net carrying amount as at Jan 1 2013 70 16,522 4,530 1,244 22,366
As at Dec 31 2013
Gross carrying amount 79 27,169 12,528 2,424 42,200
Accumulated depreciation and impairment losses (2) (9,981) (3,865) (1,211) (15,059)
Net carrying amount as at Dec 31 2013 77 17,188 8,663 1,213 27,141
11.1. Property, plant and equipment used under finance lease agreements
As at Dec 31 2014 As at Dec 31 2013
Initial carrying amount of
capitalised finance lease
Accumulated depreciation
Impairment loss Net carrying
amount
Initial carrying amount of capitalised
finance lease
Accumulated depreciation
Impairment loss Net carrying
amount
Plant and equipment 215 (74) (1) 140 245 (68) (1) 176
Vehicles and other 40 (13) - 27 42 (10) - 32
Total 255 (87) (1) 167 287 (78) (1) 208

PGNiG Group Consolidated financial statements for the year ended 31 grudnia 2014
(PLNm)
Page 62 of 119
11.2. Impairment losses on property, plant and equipment
Land
Buildings and structures
Plant and equipment
Vehicles and other
Total tangible
assets
Tangible assets under
construction - exploration for
and evaluation of mineral resources
Other tangible assets under construction
Total property,
plant and
equipment
As at Jan 1 2014 2 673 166 12 853 760 65 1,678
Increase 6 735 138 15 894 414 36 1,344
Decrease (1) (389) (72) (7) (469) (182) (20) (671)
Transferred - 11 - - 11 - - 11
Currency translation differences - - 1 - 1 43 - 44
As at Dec 31 2014 7 1,030 233 20 1,290 1,035 81 2,406
As at Jan 1 2013 2 636 147 11 796 335 74 1,205
Increase 1 395 60 4 460 521 21 1,002
Decrease (1) (347) (41) (3) (392) (83) (30) (505)
Transfers - (11) - - (11) - - (11)
Currency translation differences - - - - - (13) - (13)
As at Dec 31 2013 2 673 166 12 853 760 65 1,678

PGNiG Group Consolidated financial statements for the year ended 31 grudnia 2014
(PLNm)
Page 63 of 119
As at the beginning of the period, impairment losses on tangible assets were PLN 853m, of which:
• - PLN 654m were impairment losses on assets used directly in hydrocarbon production,
• - PLN 8m were impairment losses on distribution assets,
• - PLN 1m were impairment losses on assets of underground gas storage facilities,
• - PLN 190m were impairment losses on other tangible assets.
Impairment losses recognised and reversed in the reporting period amounted to PLN 906m and PLN
469m respectively, of which PLN 776m and PLN 400m, respectively, concerned assets used directly in
hydrocarbon production, with the balance attributable to other tangible assets used by the Group.
As at the end of the period, impairment losses on tangible assets were PLN 1,290m, of which:
• - PLN 1,030m were impairment losses on assets used directly in hydrocarbon production,
• - PLN 3m were impairment losses on distribution assets,
• - PLN 257m were impairment losses on other tangible assets.
12. INVESTMENT PROPERTY
As at Dec 31 2014 As at Dec 31 2013
Net carrying amount at beginning of the period, net of accumulated depreciation and impairment losses
9 11
Transfer from/to property, plant and equipment - (1)
Depreciation expense for the reporting period - (1)
Net carrying amount at end of the period, net of accumulated
depreciation and impairment losses 9 9
At beginning of period
Gross carrying amount 13 15
Accumulated depreciation and impairment losses (4) (4)
Net carrying amount at beginning of the period 9 11
At end of the period
Gross carrying amount 13 13
Accumulated amortisation and impairment losses (4) (4)
Net carrying amount at end of the period 9 9
The Group’s investment property includes office buildings held in whole or in part for rent. As at the
end of the reporting period, the net carrying amount of the office buildings recognised as investment
property was PLN 9m (also PLN 9m at the end of 2013).
In the reporting period, the Group derived PLN 13m of rental income from investment property
(2013: PLN 3m).
Operating expenses incurred in connection with the rental of investment property were PLN 9m in
the reporting period (2013: PLN 2m).
As investment property is not a material item in the statement of financial position, the Group does
not measure its fair value.
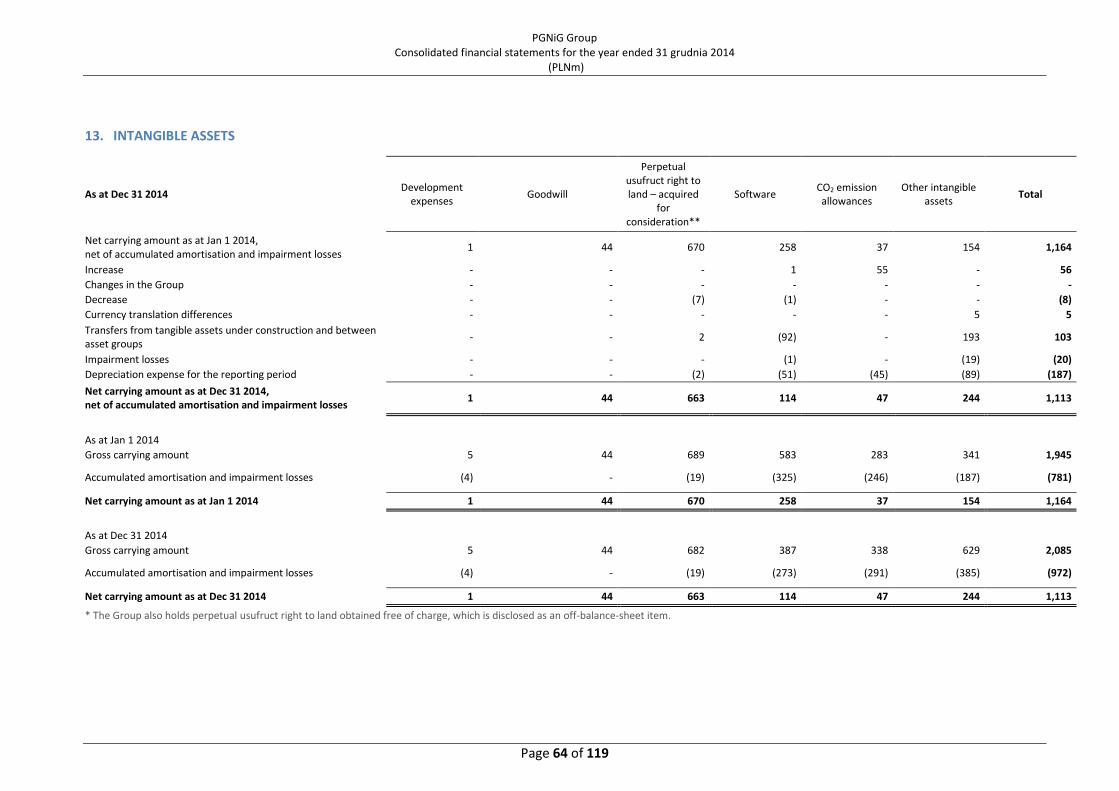
PGNiG Group Consolidated financial statements for the year ended 31 grudnia 2014
(PLNm)
Page 64 of 119
13. INTANGIBLE ASSETS
As at Dec 31 2014 Development
expenses Goodwill
Perpetual usufruct right to land – acquired
for consideration**
Software CO2 emission allowances
Other intangible assets
Total
Net carrying amount as at Jan 1 2014, net of accumulated amortisation and impairment losses
1 44 670 258 37 154 1,164
Increase - - - 1 55 - 56
Changes in the Group - - - - - - -
Decrease - - (7) (1) - - (8)
Currency translation differences - - - - - 5 5
Transfers from tangible assets under construction and between asset groups
- - 2 (92) - 193 103
Impairment losses - - - (1) - (19) (20)
Depreciation expense for the reporting period - - (2) (51) (45) (89) (187)
Net carrying amount as at Dec 31 2014,
net of accumulated amortisation and impairment losses 1 44 663 114 47 244 1,113
As at Jan 1 2014
Gross carrying amount 5 44 689 583 283 341 1,945
Accumulated amortisation and impairment losses (4) - (19) (325) (246) (187) (781)
Net carrying amount as at Jan 1 2014 1 44 670 258 37 154 1,164
As at Dec 31 2014
Gross carrying amount 5 44 682 387 338 629 2,085
Accumulated amortisation and impairment losses (4) - (19) (273) (291) (385) (972)
Net carrying amount as at Dec 31 2014 1 44 663 114 47 244 1,113
* The Group also holds perpetual usufruct right to land obtained free of charge, which is disclosed as an off-balance-sheet item.

PGNiG Group Consolidated financial statements for the year ended 31 grudnia 2014
(PLNm)
Page 65 of 119
As at Dec 31 2013 Development
expenses Goodwill
Perpetual usufruct right to land – acquired
for consideration**
Software CO2 emission allowances
Other intangible assets
Total
Net value as at Jan 1 2013, net of accumulated amortisation and impairment losses
1 44 672 213 50 166 1,146
Increase - - (1) - 71 - 70
Changes in the Group - - - - - - -
Decrease - - (2) (1) - - (3)
Currency translation differences - - - - - (1) (1)
Transfers from tangible assets under construction and between asset groups
- - 4 123 - 54 181
Impairment losses - - (1) (1) - (24) (26)
Amortisation expense for the reporting period - - (2) (76) (84) (41) (203)
Net carrying as at Dec 31 2013,
net of accumulated amortisation and impairment losses 1 44 670 258 37 154 1,164
As at Jan 1 2013
Gross carrying amount 5 44 688 438 212 318 1,705
Accumulated amortisation and impairment losses (4) - (16) (225) (162) (152) (559)
Net carrying amount as at Jan 1 2013 1 44 672 213 50 166 1,146
As at Dec 31 2013
Gross carrying amount 5 44 689 583 283 341 1,945
Accumulated amortisation and impairment losses (4) - (19) (325) (246) (187) (781)
Net carrying amount as at Dec 31 2013 1 44 670 258 37 154 1,164
* The Group also holds perpetual usufruct right to land obtained free of charge, which is disclosed exclusively as an off-balance-sheet item.
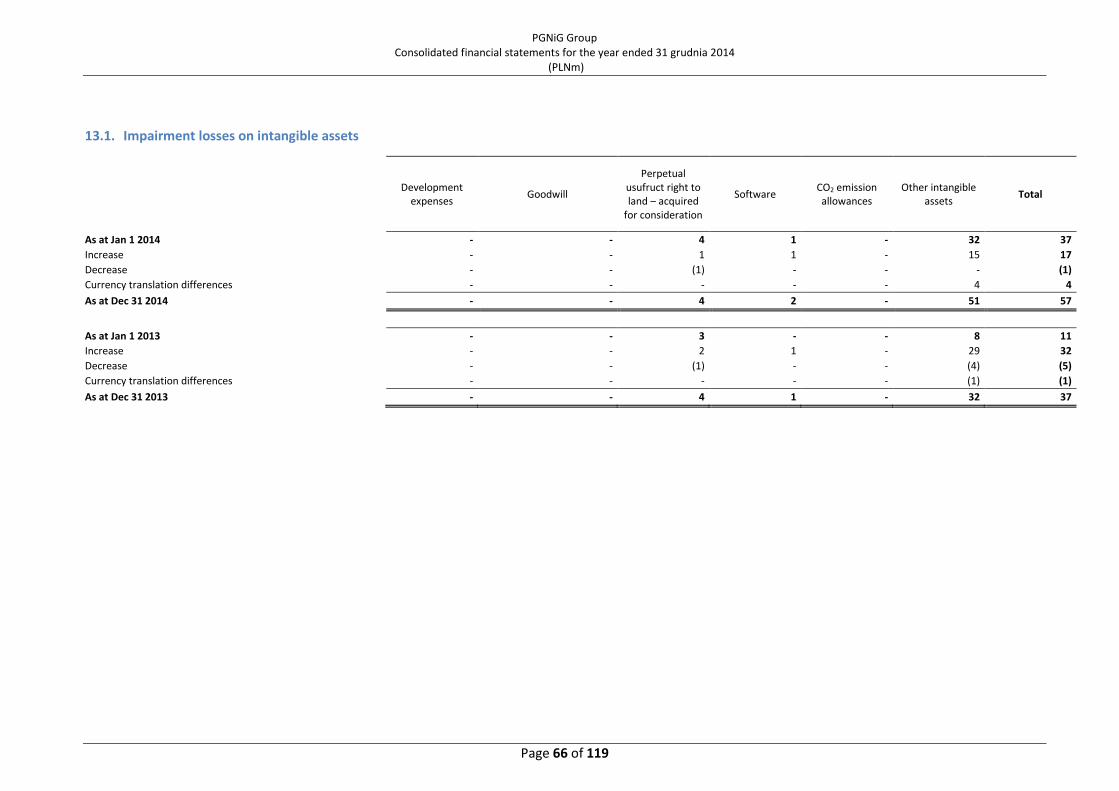
PGNiG Group Consolidated financial statements for the year ended 31 grudnia 2014
(PLNm)
Page 66 of 119
13.1. Impairment losses on intangible assets
Development
expenses Goodwill
Perpetual usufruct right to land – acquired
for consideration
Software CO2 emission allowances
Other intangible assets
Total
As at Jan 1 2014 - - 4 1 - 32 37
Increase - - 1 1 - 15 17
Decrease - - (1) - - - (1)
Currency translation differences - - - - - 4 4
As at Dec 31 2014 - - 4 2 - 51 57
As at Jan 1 2013 - - 3 - - 8 11
Increase - - 2 1 - 29 32
Decrease - - (1) - - (4) (5)
Currency translation differences - - - - - (1) (1)
As at Dec 31 2013 - - 4 1 - 32 37

PGNiG Group Consolidated financial statements for the year ended 31 grudnia 2014
(PLNm)
Page 67 of 119
14. OTHER FINANCIAL ASSETS
As at Dec 31 2014 As at Dec 31 2013
Loans advanced 191 185
Unlisted shares 88 96
Amounts receivable for sale of tangible assets 4 5
Other financial assets 2 1
Total, gross 285 287
Impairment losses (42) (45)
Total, net 243 242
Including net receivables from related entities (Note 36.1) 191 185
15. DEFERRED TAX ASSETS
As at Dec 31 2014 As at Dec 31 2013
Obligations under length-of-service awards and severance 120 98
Provision for well decommissioning costs 141 121
Other provisions 157 131
Impairment losses on property, plant and equipment 145 105
Other impairment losses/write-offs 33 12
Negative valuation of derivative financial instruments 136 38
Connection charge 57 60
Investment tax credit (Norway) 305 317
Tax loss 602 1,247
Other deferred tax assets 87 104
Total 1,783 2,233
16. OTHER NON-CURRENT ASSETS
As at Dec 31 2014 As at Dec 31 2013
Connection charge 129 58
Commission fees paid on borrowings, notes and other debt instruments
25 7
Other non-current assets 6 6
Total 160 71

PGNiG Group Consolidated financial statements for the year ended 31 grudnia 2014
(PLNm)
Page 68 of 119
17. INVENTORIES
As at Dec 31 2014 As at Dec 31 2013
Materials
At cost, including: 3,176 3,365
- gas fuel 2,389 2,513
- fuels for electricity and heat generation 331 343
At net realisable value, including: 3,064 3,338
- gas fuel 2,321 2,513
- fuels for electricity and heat generation 331 343
Semi-finished products and work in progress
At cost 47 10
At net realisable value 47 10
Finished goods
At cost 43 35
At net realisable value 42 27
Merchandise
At cost 36 3
At net realisable value 36 3
Total inventories at cost 3,302 3,413
Total inventories, at the lower of cost and net realisable
value 3,189 3,378
17.1. (Increase)/decrease in inventories in the period
Year ended Dec 31
2014 Year ended Dec 31
2013
Inventories at cost, at beginning of the period 3,413 3,093
Purchase 21,892 20,274
Other increases 215 95
Inventories recognised as expenses for the period (21,606) (19,609)
Currency translation differences 1 (2)
Other decreases (613) (438)
Inventories at cost, at end of the period 3,302 3,413
Impairment loss on inventories (113) (35)
Total net inventories at end of the period 3,189 3,378
17.2. Impairment losses on inventories
As at Dec 31 2014 As at Dec 31 2013
Impairment losses at beginning of the period (36) (29)
Increase in impairment losses (228) (18)
Reversal of impairment losses 152 12
Currency translation differences (1) -
Impairment losses at end of the period (113) (35)

PGNiG Group Consolidated financial statements for the year ended 31 grudnia 2014
(PLNm)
Page 69 of 119
18. TRADE AND OTHER RECEIVABLES
As at Dec 31 2014 As at Dec 31 2013
Trade receivables 3,944 4,044
VAT receivable 429 382
Other taxes, customs duties and social security receivable 134 37
Due and payable portion of loans advanced to related entities 45 31
Receivables from disposal of property, plant and equipment 12 1
Prepayments for tangible assets under construction 44 40
Other receivables 453 242
Total gross receivables 5,061 4,777
Including gross receivables (including due and payable portion of loans) from related entities (Note 36.1)
60 46
Impairment loss on doubtful receivables (Note 18.1) (825) (691)
Total net receivables 4,236 4,086
including:
Trade receivables 3,504 3,570
VAT receivable 429 382
Other taxes, customs duties and social security receivable 131 35
Due and payable portion of loans advanced to related entities 6 -
Receivables from disposal of property, plant and equipment 12 1
Prepayments for tangible assets under construction 44 39
Other receivables 110 59
Including net receivables (including due and payable portion of loans) from related entities (Note 36.1)
16 10
Trade receivables arise mainly in connection with sale of gas fuel.
Standard payment terms applied by the Group companies in the usual course of business are 21
days.
18.1. Impairment losses on receivables
As at Dec 31 2014 As at Dec 31 2013
Impairment losses at beginning of the period (691) (895)
Increase in impairment losses (561) (368)
Reversal of impairment losses 350 518
Use of impairment losses 77 54
Impairment losses at end of the period (825) (691)
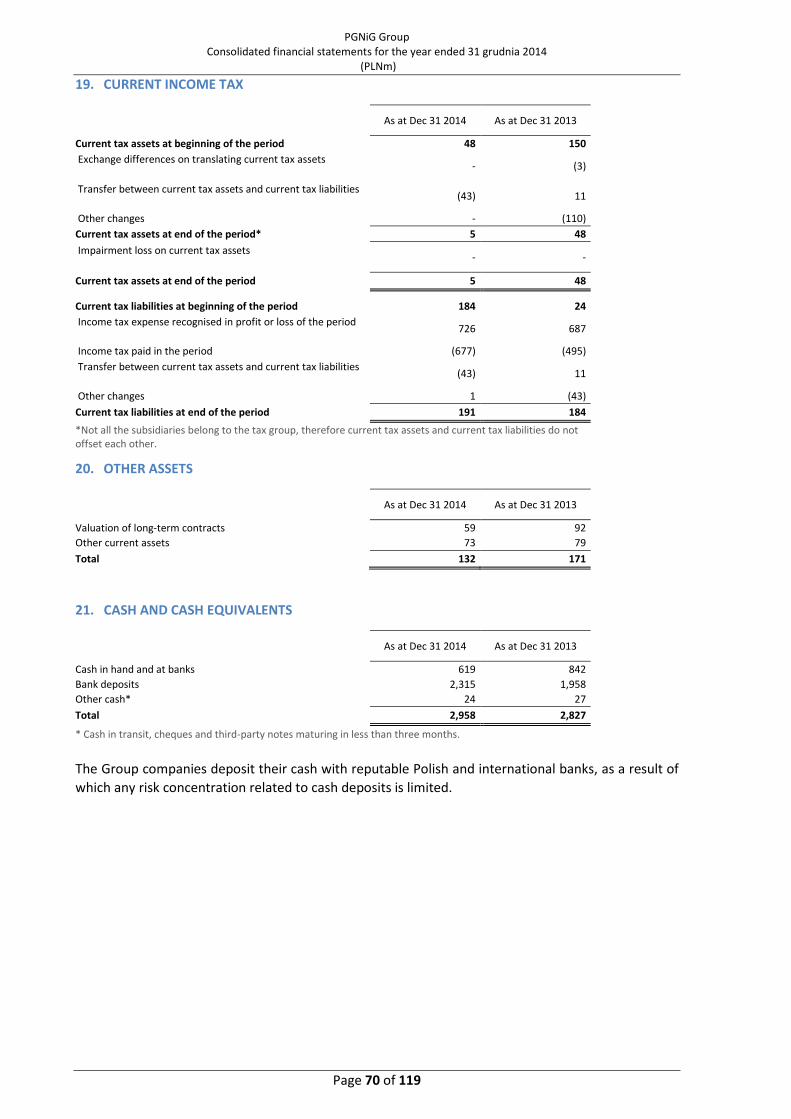
PGNiG Group Consolidated financial statements for the year ended 31 grudnia 2014
(PLNm)
Page 70 of 119
19. CURRENT INCOME TAX
As at Dec 31 2014 As at Dec 31 2013
Current tax assets at beginning of the period 48 150
Exchange differences on translating current tax assets
- (3)
Transfer between current tax assets and current tax liabilities
(43) 11
Other changes - (110)
Current tax assets at end of the period* 5 48
Impairment loss on current tax assets
- -
Current tax assets at end of the period 5 48
Current tax liabilities at beginning of the period 184 24
Income tax expense recognised in profit or loss of the period
726 687
Income tax paid in the period (677) (495)
Transfer between current tax assets and current tax liabilities
(43) 11
Other changes 1 (43)
Current tax liabilities at end of the period 191 184
*Not all the subsidiaries belong to the tax group, therefore current tax assets and current tax liabilities do not offset each other. 20. OTHER ASSETS
As at Dec 31 2014 As at Dec 31 2013
Valuation of long-term contracts 59 92
Other current assets 73 79
Total 132 171
21. CASH AND CASH EQUIVALENTS
As at Dec 31 2014 As at Dec 31 2013
Cash in hand and at banks 619 842
Bank deposits 2,315 1,958
Other cash* 24 27
Total 2,958 2,827
* Cash in transit, cheques and third-party notes maturing in less than three months.
The Group companies deposit their cash with reputable Polish and international banks, as a result of
which any risk concentration related to cash deposits is limited.

PGNiG Group Consolidated financial statements for the year ended 31 grudnia 2014
(PLNm)
Page 71 of 119
22. ASSETS HELD FOR SALE
Item (or group) of non-current assets Expected disposal
date Carrying amount as at
Dec 31 2014 Terms of disposal
Shares in Huta Stalowa Wola S.A. (unrelated company), held for sale
2015 1 public invitation to
negotiate
Other non-current assets held for sale 2015 146 tender
Total
147
Item (or group) of non-current assets Expected disposal
date Carrying amount as at
Dec 31 2013 Terms of disposal
Assets associated with subsidiary Geovita S.A., held for sale H1 2014 82 public invitation to
negotiate
Other non-current assets held for sale 2014 6 tender
Total
88
Liabilities associated with groups of assets held for sale
Carrying amount as at Dec 31 2013
Liabilities associated with subsidiary Geovita S.A., held for sale
15
Total
15
As at the end of 2013, the net carrying amount of non-current assets held for sale was PLN 88m. The
most important item was the consolidated subsidiary Geovita S.A., classified as held for sale. On April
8th 2014, the PGNiG Management Board abandoned plans to sell Geovita S.A. after no satisfactory
price offers were attracted in the sales process conducted by PGNiG S.A.
As at December 31st 2014, the net carrying amount of non-current assets held for sale was PLN
147m. The most important items included: an office building located in Warsaw, perpetual usufruct
rights to land and other buildings and structures.
23. SHARE CAPITAL
As at Dec 31 2014 As at Dec 31 2013
Total number of shares (million) 5,900 5,900
Par value per share (PLN) 1 1
Total share capital 5,900 5,900

PGNiG Group Consolidated financial statements for the year ended 31 grudnia 2014
(PLNm)
Page 72 of 119
24. BORROWINGS AND DEBT SECURITIES
Note As at Dec 31 2014 As at Dec 31 2013
Non-current 5,069 5,385
Bank borrowings 24.1., 24.2. 463 816
Debt securities 24.4. 4,533 4,460
Lease liabilities 24.5., 24.6. 73 109
Current 769 2,276
Bank borrowings 24.1., 24.2. 351 781
Borrowings 24.3% 11 22
Debt securities 24.4. 361 1,425
Lease liabilities 24.5., 24.6. 46 48
Total 5,838 7,661
24.1. Bank borrowings As at Dec 31 2014
Currency Interest rate Amount in
original currency
Carrying amount
including repayable in:
2015 2016-2020
2021 and beyond
PLN 1M WIBOR + margin
204 204 193 1 10
PLN 3M WIBOR + margin
54 54 50 1 3
USD LIBOR + margin 123 436 7 429 -
EUR Eonia+margin 20 84 84 - -
EUR EURIBOR + margin 8 36 17 7 12
Total
814 351 438 25
As at Dec 31 2013
Currency Interest rate Amount in
original currency
Carrying amount
including repayable in:
2014 2015-2019
2020 and beyond
PLN 1M WIBOR + margin
213 213 199 1 13
PLN 3M WIBOR + margin
178 178 8 167 3
USD LIBOR + margin 317 1,074 475 599 -
EUR Eonia+margin 20 83 83 - -
EUR EURIBOR + margin 25 49 16 20 13
Total
1,597 781 787 29
24.2. Obtained credit facilities and amounts available under the facilities
As at Dec 31 2014 As at Dec 31 2013
Credit facilities obtained 1,578 1,590
Amounts drawn (752) (1,263)
Undrawn amounts 826 327

PGNiG Group Consolidated financial statements for the year ended 31 grudnia 2014
(PLNm)
Page 73 of 119
24.3. Borrowings As at Dec 31 2014
Currency Interest rate Amount in
original currency
Carrying amount
including repayable in:
2015 2016-2020
2021 and beyond
PLN 1M WIBOR + margin
11 11 11 - -
Total
11 11 - -
As at Dec 31 2013
Currency Interest rate Amount in
original currency
Carrying amount
including repayable in:
2014 2015-2019
2020 and beyond
PLN 1M WIBOR + margin
22 22 22 - -
Total
22 22 - -
24.4. Debt securities As at Dec 31 2014
Currency Interest rate Amount in
original currency
Carrying amount
including repayable in:
2015 2016-2020
2021 and beyond
PLN 3M WIBOR + margin
190 190 190 - -
PLN 6M WIBOR + margin
2,478 2,478 95 2,383 -
EUR 4% 516 2,226 76 2,150 -
Total
4,894 361 4,533 -
As at Dec 31 2013
Currency Interest rate Amount in
original currency
Carrying amount
including repayable in:
2014 2015-2019
2020 and beyond
PLN 2,80%-5,38% 952 952 952 - -
PLN 1M WIBOR + margin
40 40 40 - -
PLN 3M WIBOR + margin
109 109 109 - -
PLN 6M WIBOR + margin
2,619 2,619 246 2,373 -
EUR 4% 516 2,165 78 2,087 -
Total
5,885 1,425 4,460 -

PGNiG Group Consolidated financial statements for the year ended 31 grudnia 2014
(PLNm)
Page 74 of 119
24.5. Finance lease liabilities As at Dec 31 2014
Currency Interest rate Amount in original
currency Carrying amount
PLN 3%-5% 5 5
PLN 1M WIBOR + margin 32 32
PLN 5%-8% 15 15
USD LIBOR + margin 17 60
USD 6% on average 2 6
EUR EURIBOR + margin - 1
Total
119
As at Dec 31 2013
Currency Interest rate Amount in original
currency Carrying amount
PLN 1M WIBOR + margin 40 40
PLN 5%-8% 39 39
USD LIBOR + margin 22 67
USD 6% on average 3 9
EUR EURIBOR + margin - 2
Total
157
24.6. Maturity of finance lease liabilities (disclosed in the statement of financial position)
As at Dec 31 2014
Maturing in:
Discounted payments disclosed in the
statement of financial position
Interest Actual lease
payments due
up to 1 year 46 (1) 45
from 1 to 5 years 73 (4) 69
Total 119 (5) 114
As at Dec 31 2013
Maturing in:
Discounted payments disclosed in the
statement of financial position
Interest Actual lease
payments due
up to 1 year 48 5 53
from 1 to 5 years 109 7 115
Total 157 12 168
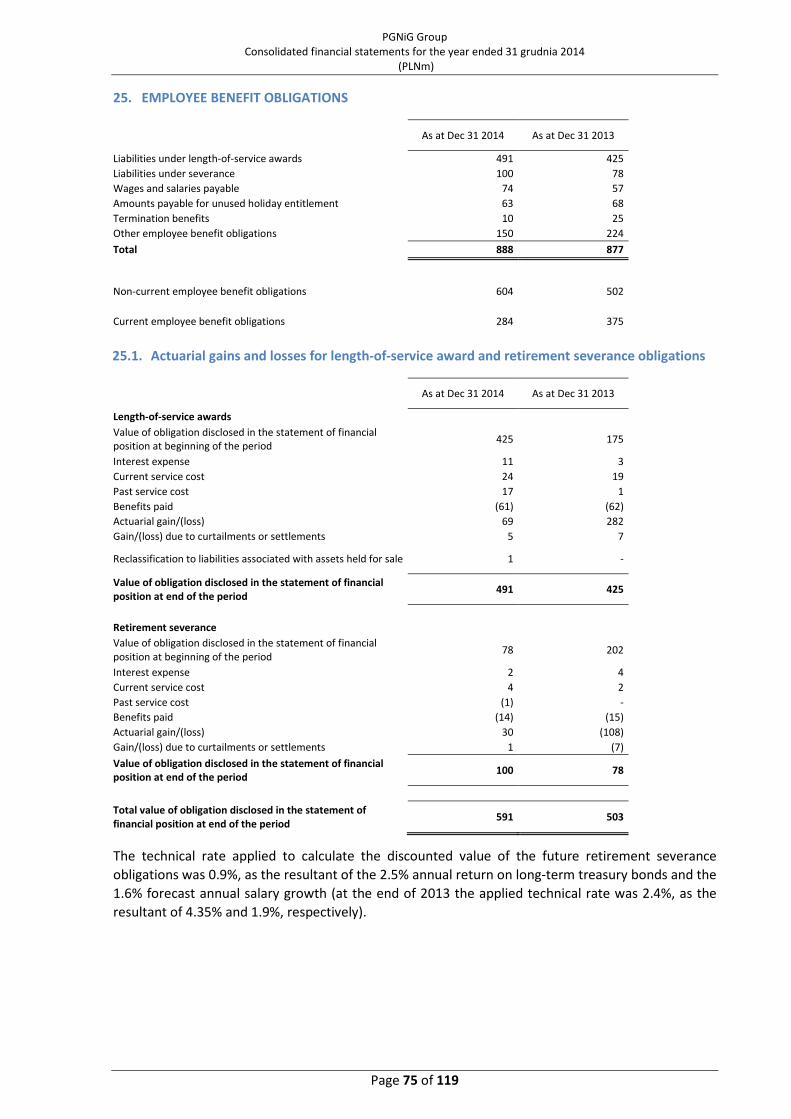
PGNiG Group Consolidated financial statements for the year ended 31 grudnia 2014
(PLNm)
Page 75 of 119
25. EMPLOYEE BENEFIT OBLIGATIONS
As at Dec 31 2014 As at Dec 31 2013
Liabilities under length-of-service awards 491 425
Liabilities under severance 100 78
Wages and salaries payable 74 57
Amounts payable for unused holiday entitlement 63 68
Termination benefits 10 25
Other employee benefit obligations 150 224
Total 888 877
Non-current employee benefit obligations 604 502
Current employee benefit obligations 284 375
25.1. Actuarial gains and losses for length-of-service award and retirement severance obligations
As at Dec 31 2014 As at Dec 31 2013
Length-of-service awards
Value of obligation disclosed in the statement of financial position at beginning of the period
425 175
Interest expense 11 3
Current service cost 24 19
Past service cost 17 1
Benefits paid (61) (62)
Actuarial gain/(loss) 69 282
Gain/(loss) due to curtailments or settlements 5 7
Reclassification to liabilities associated with assets held for sale 1 -
Value of obligation disclosed in the statement of financial
position at end of the period 491 425
Retirement severance
Value of obligation disclosed in the statement of financial position at beginning of the period
78 202
Interest expense 2 4
Current service cost 4 2
Past service cost (1) -
Benefits paid (14) (15)
Actuarial gain/(loss) 30 (108)
Gain/(loss) due to curtailments or settlements 1 (7)
Value of obligation disclosed in the statement of financial
position at end of the period 100 78
Total value of obligation disclosed in the statement of
financial position at end of the period 591 503
The technical rate applied to calculate the discounted value of the future retirement severance
obligations was 0.9%, as the resultant of the 2.5% annual return on long-term treasury bonds and the
1.6% forecast annual salary growth (at the end of 2013 the applied technical rate was 2.4%, as the
resultant of 4.35% and 1.9%, respectively).
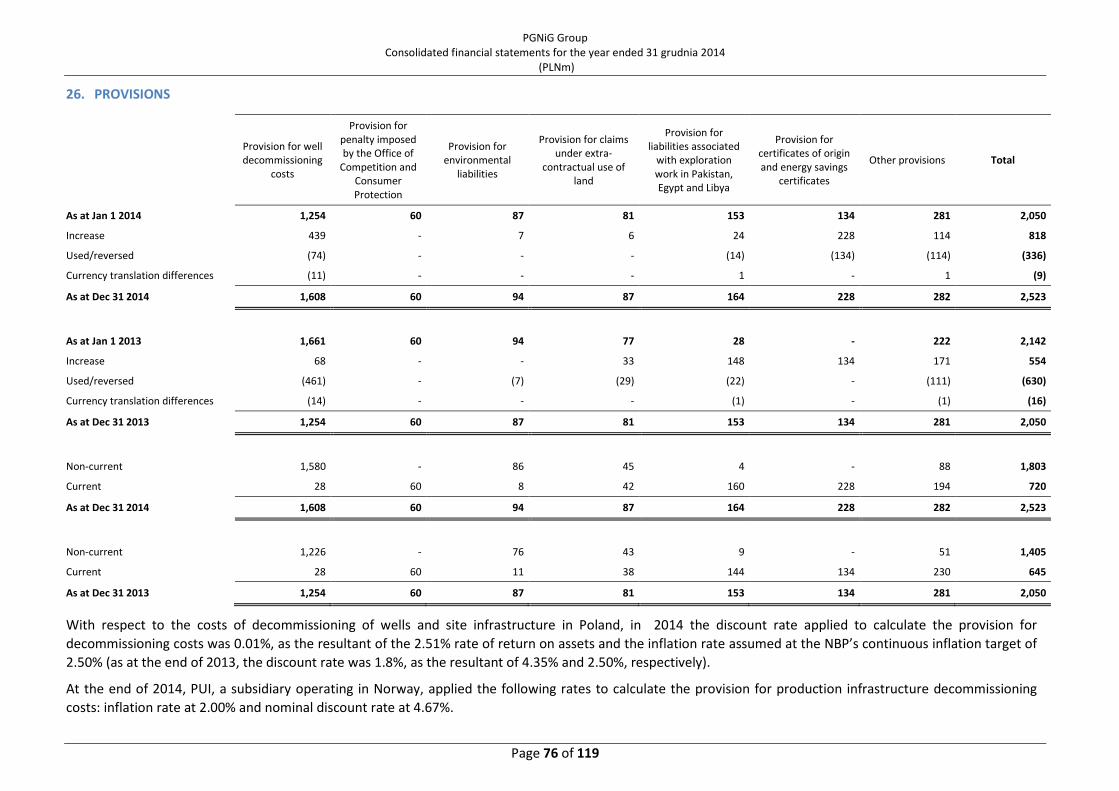
PGNiG Group Consolidated financial statements for the year ended 31 grudnia 2014
(PLNm)
Page 76 of 119
26. PROVISIONS
Provision for well decommissioning
costs
Provision for penalty imposed by the Office of
Competition and Consumer Protection
Provision for environmental
liabilities
Provision for claims under extra-
contractual use of land
Provision for liabilities associated
with exploration work in Pakistan, Egypt and Libya
Provision for certificates of origin and energy savings
certificates
Other provisions Total
As at Jan 1 2014 1,254 60 87 81 153 134 281 2,050
Increase 439 - 7 6 24 228 114 818
Used/reversed (74) - - - (14) (134) (114) (336)
Currency translation differences (11) - - - 1 - 1 (9)
As at Dec 31 2014 1,608 60 94 87 164 228 282 2,523
As at Jan 1 2013 1,661 60 94 77 28 - 222 2,142
Increase 68 - - 33 148 134 171 554
Used/reversed (461) - (7) (29) (22) - (111) (630)
Currency translation differences (14) - - - (1) - (1) (16)
As at Dec 31 2013 1,254 60 87 81 153 134 281 2,050
Non-current 1,580 - 86 45 4 - 88 1,803
Current 28 60 8 42 160 228 194 720
As at Dec 31 2014 1,608 60 94 87 164 228 282 2,523
Non-current 1,226 - 76 43 9 - 51 1,405
Current 28 60 11 38 144 134 230 645
As at Dec 31 2013 1,254 60 87 81 153 134 281 2,050
With respect to the costs of decommissioning of wells and site infrastructure in Poland, in 2014 the discount rate applied to calculate the provision for
decommissioning costs was 0.01%, as the resultant of the 2.51% rate of return on assets and the inflation rate assumed at the NBP’s continuous inflation target of
2.50% (as at the end of 2013, the discount rate was 1.8%, as the resultant of 4.35% and 2.50%, respectively).
At the end of 2014, PUI, a subsidiary operating in Norway, applied the following rates to calculate the provision for production infrastructure decommissioning
costs: inflation rate at 2.00% and nominal discount rate at 4.67%.
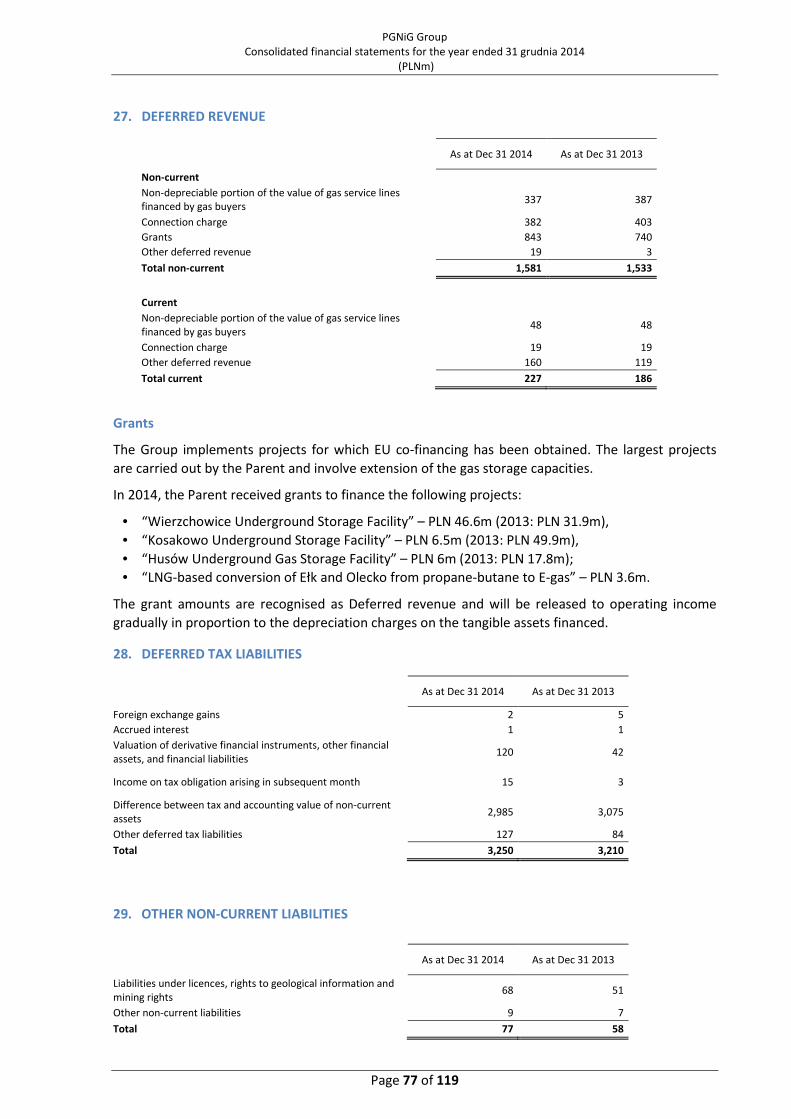
PGNiG Group Consolidated financial statements for the year ended 31 grudnia 2014
(PLNm)
Page 77 of 119
27. DEFERRED REVENUE
As at Dec 31 2014 As at Dec 31 2013
Non-current
Non-depreciable portion of the value of gas service lines financed by gas buyers
337 387
Connection charge 382 403
Grants 843 740
Other deferred revenue 19 3
Total non-current 1,581 1,533
Current
Non-depreciable portion of the value of gas service lines financed by gas buyers
48 48
Connection charge 19 19
Other deferred revenue 160 119
Total current 227 186
Grants
The Group implements projects for which EU co-financing has been obtained. The largest projects
are carried out by the Parent and involve extension of the gas storage capacities.
In 2014, the Parent received grants to finance the following projects:
• “Wierzchowice Underground Storage Facility” – PLN 46.6m (2013: PLN 31.9m),
• “Kosakowo Underground Storage Facility” – PLN 6.5m (2013: PLN 49.9m),
• “Husów Underground Gas Storage Facility” – PLN 6m (2013: PLN 17.8m);
• “LNG-based conversion of Ełk and Olecko from propane-butane to E-gas” – PLN 3.6m.
The grant amounts are recognised as Deferred revenue and will be released to operating income
gradually in proportion to the depreciation charges on the tangible assets financed.
28. DEFERRED TAX LIABILITIES
As at Dec 31 2014 As at Dec 31 2013
Foreign exchange gains 2 5
Accrued interest 1 1
Valuation of derivative financial instruments, other financial assets, and financial liabilities
120 42
Income on tax obligation arising in subsequent month 15 3
Difference between tax and accounting value of non-current assets
2,985 3,075
Other deferred tax liabilities 127 84
Total 3,250 3,210
29. OTHER NON-CURRENT LIABILITIES
As at Dec 31 2014 As at Dec 31 2013
Liabilities under licences, rights to geological information and mining rights
68 51
Other non-current liabilities 9 7
Total 77 58

PGNiG Group Consolidated financial statements for the year ended 31 grudnia 2014
(PLNm)
Page 78 of 119
30. TRADE AND OTHER PAYABLES
As at Dec 31 2014 As at Dec 31 2013
Trade payables 1,290 1 802
VAT payable 1,074 1,104
Other taxes, customs duties and social security payable 336 275
Amounts payable under purchase of non-financial non-current assets
415 363
Accruals and deferred revenue and prepaid deliveries 212 290
Other liabilities 262 199
Total 3,589 4,033
Including amounts payable to related entities (Note 36.1) 13 16

PGNiG Group Consolidated financial statements for the year ended 31 grudnia 2014
(PLNm)
Page 79 of 119
31. CAUSES OF DIFFERENCES BETWEEN ITEMS OF THE STATEMENT OF FINANCIAL POSITION AND
CHANGES WHICH ARE DUE TO CHANGES IN CERTAIN ITEMS OF THE STATEMENT OF CASH
FLOWS, AND BREAK-DOWN OF “OTHER ADJUSTMENTS” UNDER OPERATING ACTIVITY
Increase/(decrease) in cash and cash equivalents Year ended Dec 31 2014
Year ended Dec 31 2013
1) Cash and cash equivalent in the statement of financial position at beginning of the period
2,827 1,948
a) Net effect of exchange rate changes on the balance of cash held in foreign currencies at beginning of the period
1 1
Cash and cash equivalents in the statement of cash flows at
beginning of the period (1-a)
2,826 1,947
1) Cash and cash equivalents in the statement of financial position at end of the period
2,958 2,827
a) Net effect of exchange rate changes on the balance of cash held in foreign currencies end of the period
2 1
Cash and cash equivalents in the statement of cash flows at
end of the period (2-b)
2,956 2,826
I. Increase/(decrease) in cash and cash equivalents in the statement of financial position (2-1)
131 879
II. Increase/(decrease) in exchange rate changes on the balance of cash held in foreign currencies (b-a)
1 -
Increase/(decrease) in cash and cash equivalents in the
statement of cash flows (I - II)
130 879
Increase/(decrease) in trade and other receivables Year ended Dec 31 2014
Year ended Dec 31 2013
(Increase)/decrease in other financial assets in the statement
of financial position
(1) (70)
Increase/(decrease) in trade and other receivables in the
statement of financial position (150) 1,288
Increase/(decrease) in shares – adjustment to investing activities
(5) 3
Increase/(decrease) in lease receivables in financial assets – adjustment to investing activities
1 -
Increase/(decrease) in investment receivables from disposal and purchase of intangible assets and property, plant and equipment
10 (4)
Increase/(decrease) in prepayments for property, plant and equipment
5 25
Due and payable portion of loans advanced 12 68
Increase/(decrease) in trade and other receivables in the
statement of cash flows (128) 1,310

PGNiG Group Consolidated financial statements for the year ended 31 grudnia 2014
(PLNm)
Page 80 of 119
(Increase)/decrease in inventories Year ended Dec 31 2014
Year ended Dec 31 2013
(Increase)/decrease in inventories in the statement of
financial position 189 (314)
Tangible assets under construction transferred to inventories (adjustment to investing activity)
- (7)
(Increase)/decrease in inventories in the statement of cash
flows 189 (321)
(Decrease)/increase in employee benefit obligations Year ended Dec 31 2014
Year ended Dec 31 2013
(Decrease)/increase in employee benefit obligations in the
statement of financial position
11 140
(Decrease)/increase in employee benefit obligations in the
statement of cash flows
11 140
Increase/(decrease) in provisions Year ended Dec 31 2014
Year ended Dec 31 2013
Increase/(decrease) in provisions in the statement of
financial position 473 (92)
Increase/(decrease) in provision for well decommissioning costs which adjusts property, plant and equipment (adjustment to investing activity)
(343) 391
Increase/(decrease) in provisions in the statement of cash
flows 130 299
Decrease/(increase) in current liabilities current liabilities Year ended Dec 31 2014
Year ended Dec 31 2013
Decrease/(increase) in current liabilities in the statement of
financial position
(444) 366
Decrease/(increase) in investment liabilities under purchase of intangible assets and property, plant and equipment
(52) 24
Other decrease/(increase) in liabilities 19 4
Decrease/(increase) in current liabilities in the statement of
cash flows
(477) 394
(Increase)/decrease in other assets in the statement of
financial position
Year ended Dec 31 2014
Year ended Dec 31 2013
(Increase)/decrease in other assets in the statement of
financial position
(89) 5
(Increase)/decrease in other assets in the statement of
financial position
39 (87)
Expense (fees and commission) related to the note issuance programme
19 (7)
(Increase)/decrease in other assets in the statement of cash
flows
(31) (89)

PGNiG Group Consolidated financial statements for the year ended 31 grudnia 2014
(PLNm)
Page 81 of 119
(Decrease)/increase in deferred revenue Year ended Dec 31 2014
Year ended Dec 31 2013
(Decrease)/increase in deferred revenue in the statement of
financial position
89 170
Property, plant and equipment received free of charge - (18)
Grants received for property, plant and equipment (103) (162)
Other (decrease)/increase in deferred revenue - (5)
(Decrease)/increase in deferred revenue in the statement of
cash flows
(14) (15)
Other items, net, under operating activity Year ended Dec 31 2014
Year ended Dec 31 2013
Derivative financial instruments (20) (363)
Written-down expenditure on non-financial non-current assets 347 256
Acquired CO2 emission allowances (55) (72)
Other items, net, under operating activity 638 609
Total 910 430

PGNiG Group Consolidated financial statements for the year ended 31 grudnia 2014
(PLNm)
Page 82 of 119
32. FINANCIAL INSTRUMENTS AND FINANCIAL RISK MANAGEMENT POLICY
32.1. Financial instruments by category (carrying amounts)
Dec 31 2014 Categories of financial instruments
Classes of financial instruments Notes
Financial assets
available for sale
Financial assets at fair
value through
profit or loss
Financial assets held to
maturity
Loans and receivables
Financial liabilities at fair value through
profit or loss
Financial liabilities at
amortised cost
Hedging instruments
Assets and liabilities excluded from the
scope of IAS 39
Total
Total financial assets 1 497 - 6,831 - - 70 45 7,444
Unlisted shares 14, 20 1 - - - - - - 45 46
Trade and other receivables 18 - - - 3,676 - - - - 3,676
Derivative financial instrument assets 33 - 497 - - - - 70 - 567
Cash and cash equivalents 21 - - - 2,958 - - - - 2,958
Other financial assets 14, 20 - - - 197 - - - - 197
Total financial liabilities - - - - 294 7,975 299 119 8,687
Borrowings 24 - - - - - 825 - - 825
Debt securities 24 - - - - - 4,894 - - 4,894
Finance lease 24.5. - - - - - - - 119 119
Trade payables 29, 30 - - - - - 2,256 - - 2,256
Derivative financial instrument liabilities 33 - - - - 294 - 299 - 593

PGNiG Group Consolidated financial statements for the year ended 31 grudnia 2014
(PLNm)
Page 83 of 119
Dec 31 2013 Categories of financial instruments
Classes of financial instruments Notes
Financial assets
available for sale
Financial assets at fair
value through
profit or loss
Financial assets held to
maturity
Loans and receivables
Financial liabilities at fair value through
profit or loss
Financial liabilities at
amortised cost
Hedging instruments
Assets and liabilities excluded from the
scope of IAS 39
Total
Total financial assets 2 223 - 6,687 - - 84 49 7,045
Unlisted shares 14, 20 2 - - - - - - 49 51
Trade and other receivables 18 - - - 3,669 - - - - 3,669
Derivative financial instrument assets 33 - 223 - - - - 84 - 307
Cash and cash equivalents 21 - - - 2,827 - - - - 2,827
Other financial assets 14, 20 - - - 191 - - - - 191
Total financial liabilities - - - - 77 10,216 47 157 10,497
Borrowings 24 - - - - - 1,619 - - 1,619
Debt securities 24 - - - - - 5,885 - - 5,885
Finance lease 24.5. - - - - - - - 157 157
Trade payables 29, 30 - - - - - 2,712 - - 2,712
Derivative financial instrument liabilities 33 - - - - 77 - 47 - 124
32.2. Fair value hierarchy
As at Dec 31 2014 As at Dec 31 2013
Classes of financial instruments level 1 level 2 level 3 level 1 level 2 level 3
Derivative financial instrument assets - 567 - - 307 -
Derivative financial instrument liabilities - 593 - - 124 -

PGNiG Group Consolidated financial statements for the year ended 31 grudnia 2014
(PLNm)
Page 84 of 119
32.3. Fair value of financial instruments Classes of financial instruments As at Dec 31 2014 As at Dec 31 2013
Carrying amount Fair value Carrying amount Fair value
Total financial assets 7,399 7,398 6,996 6,994
Unlisted shares* 1 - 2 -
Trade and other receivables 3,676 3,676 3,669 3,669
Derivative financial instrument assets
567 567 307 307
Cash and cash equivalents 2,958 2,958 2,827 2,827
Other financial assets 197 197 191 191
Total financial liabilities 8,687 8,687 10,497 10,497
Borrowings 825 825 1,619 1,619
Debt securities 4,894 4,894 5,885 5,885
Finance lease 119 119 157 157
Trade payables 2,256 2,256 2,712 2,712
Derivative financial instrument liabilities
593 593 124 124
* Measured at cost less impairment losses.
32.4. Items of income, expenses, profit and loss related to financial assets and liabilities,
presented in the consolidated statement of comprehensive income
Year ended Dec 31 2014
Year ended Dec 31 2013
Total effect on net profit/(loss), including: (754) (152)
Financial assets available for sale (3) (4)
Impairment recognised in profit or loss for the reporting period
(3) (4)
Financial assets and financial liabilities at fair value through profit or loss
92 362
Loans and receivables 66 191
Interest on deposits 67 56
Interest on receivables 53 58
Interest on loans advanced 13 9
Impairment losses on receivables (62) 70
Impairment losses on loans (7) (2)
Foreign currency measurement of loans advanced in foreign currencies
2 -
Financial liabilities at amortised cost (376) (412)
Derivative financial instruments (518) (282)
Assets and liabilities excluded from the scope of IAS 39 (15) (7)
Total effect on other comprehensive income, net, including: (265) 72
Derivative financial instruments (265) 72
Total effect on comprehensive income (1,019) (80)
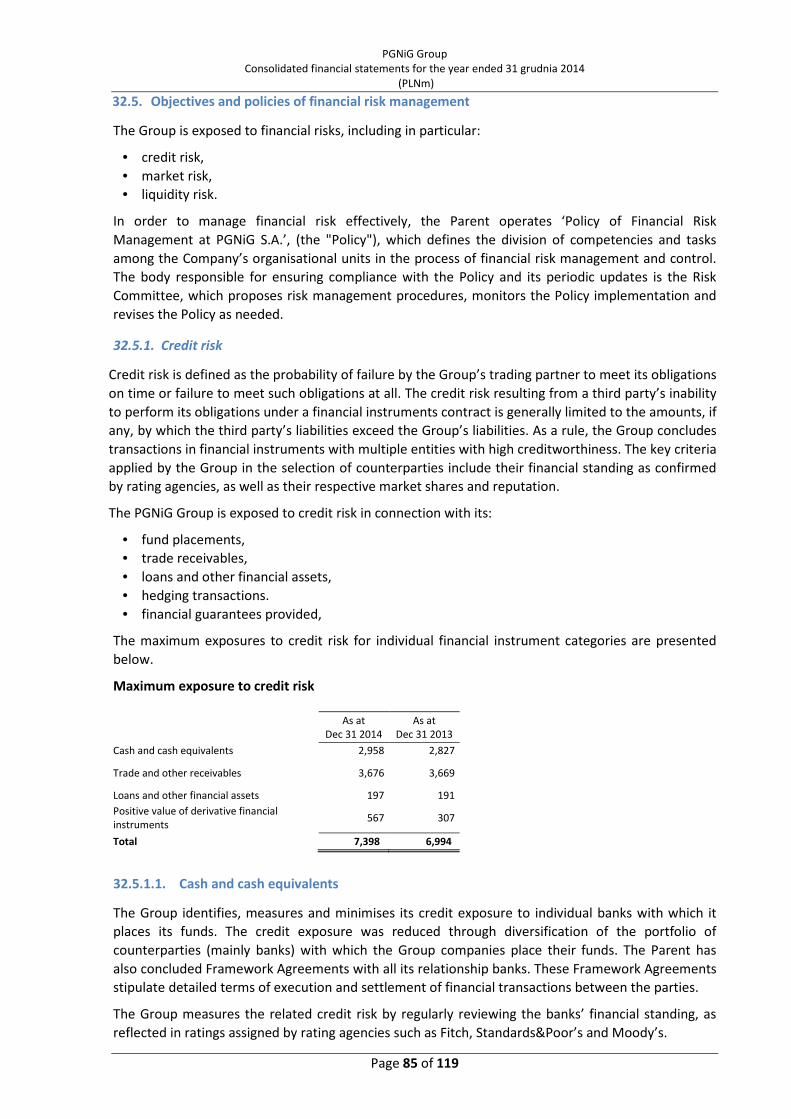
PGNiG Group Consolidated financial statements for the year ended 31 grudnia 2014
(PLNm)
Page 85 of 119
32.5. Objectives and policies of financial risk management
The Group is exposed to financial risks, including in particular:
• credit risk,
• market risk,
• liquidity risk.
In order to manage financial risk effectively, the Parent operates ‘Policy of Financial Risk
Management at PGNiG S.A.’, (the "Policy"), which defines the division of competencies and tasks
among the Company’s organisational units in the process of financial risk management and control.
The body responsible for ensuring compliance with the Policy and its periodic updates is the Risk
Committee, which proposes risk management procedures, monitors the Policy implementation and
revises the Policy as needed.
32.5.1. Credit risk
Credit risk is defined as the probability of failure by the Group’s trading partner to meet its obligations
on time or failure to meet such obligations at all. The credit risk resulting from a third party’s inability
to perform its obligations under a financial instruments contract is generally limited to the amounts, if
any, by which the third party’s liabilities exceed the Group’s liabilities. As a rule, the Group concludes
transactions in financial instruments with multiple entities with high creditworthiness. The key criteria
applied by the Group in the selection of counterparties include their financial standing as confirmed
by rating agencies, as well as their respective market shares and reputation.
The PGNiG Group is exposed to credit risk in connection with its:
• fund placements,
• trade receivables,
• loans and other financial assets,
• hedging transactions.
• financial guarantees provided,
The maximum exposures to credit risk for individual financial instrument categories are presented
below.
Maximum exposure to credit risk
As at
Dec 31 2014 As at
Dec 31 2013
Cash and cash equivalents 2,958 2,827
Trade and other receivables 3,676 3,669
Loans and other financial assets 197 191
Positive value of derivative financial instruments
567 307
Total 7,398 6,994
32.5.1.1. Cash and cash equivalents
The Group identifies, measures and minimises its credit exposure to individual banks with which it
places its funds. The credit exposure was reduced through diversification of the portfolio of
counterparties (mainly banks) with which the Group companies place their funds. The Parent has
also concluded Framework Agreements with all its relationship banks. These Framework Agreements
stipulate detailed terms of execution and settlement of financial transactions between the parties.
The Group measures the related credit risk by regularly reviewing the banks’ financial standing, as
reflected in ratings assigned by rating agencies such as Fitch, Standards&Poor’s and Moody’s.

PGNiG Group Consolidated financial statements for the year ended 31 grudnia 2014
(PLNm)
Page 86 of 119
In 2014, the Group invested its long-term cash surplus of significant value in highly liquid, credit risk-
free instruments, in particular treasury bills and bonds.
32.5.1.2. Trade and other receivables
Material credit risk (in value terms) is related to receivables, mainly receivables under gas fuel sales,
as well as electricity and related products sales, including carbon credits, and certificates of origin for
electricity.
Transactions made at the Polish Power Exchange do not generate exposure to credit risk, as the
system of guaranteed settlements through the agency of the Commodity Exchange Clearing House
provides each member of the Clearing House with the safety of settlements in the case of insolvency
of any individual market participants. In order to minimise the risk of uncollectible receivables arising
in connection with sale transactions executed outside of the PPE, uniform rules designed to secure
trade receivables are in place and must be observed while concluding general supply contracts.
Prior to the conclusion of a sale contract of significant value, the financial standing of the potential
customer is reviewed in order to assess the customer’s creditworthiness. Such assessment serves as
the basis for determining the form of security required in connection with the contract. For new
contracts, the type of security instrument used is agreed between PGNiG S.A. and the customer. As
part of the mandatory harmonisation of sale contracts with the requirements of the Polish Energy
Law, the Company enters into negotiations with certain customers with to create or strengthen
contract performance security. In 2014, the process of procuring security for receivables was
adapted to the changing conditions in the energy market, particularly with respect to securing past-
due receivables from small and medium-sized business customers.
Balances of receivables from customers are monitored on an ongoing basis, in line with the Group's
policy. If payment is not received within the contractual term, appropriate steps are taken, in line
with the Group's debt collection procedures.
32.5.1.3. Loans and other financial assets
Exposure to credit risk under loans advanced arises in connection with loans advanced by the Parent
to the PGNiG Group companies: subsidiaries not accounted for with the full method, associates and
joint ventures. Loans to those entities are advanced in line with an internal procedure, which
stipulates detailed rules governing the conclusion and monitoring of loan agreements, thus
minimising the Group’s exposure to credit risk under such agreements. Loans are advanced only if
the borrower meets a number of conditions and provides appropriate security.
32.5.1.4. Positive value of derivative financial instruments
The exposure to credit risk under financial derivatives is equal to the net carrying amount of the
positive valuation of the derivative (at fair value). As in the case of placements, transactions in
financial derivatives are executed with most reputable banks with high credit ratings. The Group
companies have also concluded either Framework Agreements or ISDA Agreements with each of
their relationship banks, stipulating detailed terms of service and limits of maximum exposure arising
from the fair value of derivatives.
The Group believes that all these measures protect it from any material credit-risk-related losses.
As at December 31st 2014, the value of unimpaired past due receivables, as disclosed in the Group’s
statement of financial position, was PLN 906m (2013: PLN 418m).

PGNiG Group Consolidated financial statements for the year ended 31 grudnia 2014
(PLNm)
Page 87 of 119
32.5.1.4.1. Receivables past due but not impaired as at the reporting date – by length of delay
Delay As at
Dec 31 2014 As at
Dec 31 2013
Up to 1 month 806 324
From 1 to 3 months 57 67
From 3 months to 1 year 21 20
from 1 to 5 years 22 5
over 5 years - 2
Total net past due receivables 906 418
32.5.1.5. Guarantees issued
The Group's credit risk exposure under provided guarantees is substantially limited to the risk of
default by the banks which, acting on the Group's instructions, issued guarantees to other external
entities. However, the banks on which the Group relies for provision of guarantees are reputable
institutions with high ratings; therefore, both the probability of their default and the associated
credit risk are insignificant. As in the case of the risk related to cash deposits, the credit risk under
provided guarantees is measured by regularly reviewing the financial standing of the banks issuing
the guarantees.
32.5.2. Market risk
Market risk is defined as the probability that the Group’s financial performance or economic value
will be adversely affected by changes in the financial and commodity markets.
The main objective of the market risk management is to identify, measure, monitor and mitigate key
sources of the risk, including:
• foreign exchange risk,
• interest rate risk,
• commodity risk (e.g. gas fuel, crude oil, energy and related products).
32.5.2.1. Sensitivity analysis
To determine a reasonable range of changes which may occur with respect to currency or interest
rate risks, the Group assumed an (implied) market volatility level for semi-annual periods, i.e. an
average change of 10% as at the end of 2014 for the analysis of exchange rate sensitivity (as at the
end of 2013:10%), +/-100 bpfor the analysis of interest rate sensitivity (as at the end of 2013, also +/-
100 bp) and 40% for energy commodity derivatives ( December 31st 2013: 15%).
32.5.2.2. Currency risk
Currency risk is defined as the probability that the Group’s financial performance will be adversely
affected by changes in the price of one currency against another.
The hedging measures implemented by the Group are mainly intended to provide protection against
the currency risk accompanying payments settled in foreign currencies (mainly payments for gas fuel
supplies). To hedge its trade payables, the Group uses call options, option strategies and forward
transactions.
The results of the analysis of sensitivity to currency risk carried out as at December 31st 2014
indicate that net profit would have been lower by PLN 306m, had the EUR/PLN, USD/PLN, NOK/PLN
and the other currencies’ exchange rates increased by 10%, ceteris paribus (net profit decrease of
PLN 249m due to stronger NOK, decrease of PLN 61m due to stronger USD, decrease of PLN 1m due
to stronger EUR, and increase of PLN 5m due to strengthening of the other currencies).

PGNiG Group Consolidated financial statements for the year ended 31 grudnia 2014
(PLNm)
Page 88 of 119
The most significant factor with a bearing on the outcome of the sensitivity analysis is higher
negative valuation of CCIRS derivatives hedging the credit facility advanced to PGNiG Upstream
International AS, which is eliminated from the consolidated financial statements.
If the credit facility was recognised in the statement of financial position (as is the case in the
Parent's separate financial statements), the cash flows related to the credit facility and the cash flows
from the hedging transactions would offset one another. As a result, the changes in positive
(negative) valuation of the credit facility would be offset by negative (positive) changes in the
valuation of CCIRS transactions. In aggregate, the items would show no sensitivity to the exchange
rate and interest rate changes.
Lower profit would be mainly attributable to an increase in the negative portion of the fair value of
financial derivatives (negative fair value of swap transactions in NOK).
The adverse effect on the net profit of NOK-denominated financial instruments would be
substantially amplified by an increase in valuation of the USD credit facility contracted by PGNiG
Upstream International AS and reduced by an increase in the valuation of assets in this currency. Any
increase in foreign exchange losses from valuation of the Euronotes in EUR would be offset by an
increase in the positive portion of the fair value of financial derivatives for EUR.
As at December 31st 2014, net profit would have been higher by PLN 282m, if the EUR, USD, NOK
and the other currencies depreciated against the złoty by 10%, ceteris paribus (net profit higher by
PLN 249m due to weaker NOK, higher by PLN 46m due to weaker USD, lower by PLN 8m due to
weaker EUR, and lower by PLN 5m due to depreciation of the other currencies). A positive result
would be mainly attributable to an increase in the positive portion of the fair value of financial
derivatives (positive fair value of swap transactions in NOK). Any increase in foreign exchange gains
from valuation of the Euronotes in EUR would be offset by an increase in the negative portion of the
fair value of financial derivatives for EUR. The result for EUR would be slightly reduced due to the
decrease in assets (receivables) measured in the same currency. On the other hand, any decrease in
the valuation of the USD-denominated credit facility contracted by PGNiG Upstream International AS
would have a positive effect on net profit, which would be partially offset by a decrease in assets
(receivables) measured in the same currency.
The results of the analysis of sensitivity to currency risk carried out as at December 31st 2013
indicate that net profit would have been lower by PLN 329m, had the EUR/PLN, USD/PLN, NOK/PLN
and other currencies’ exchange rates increased by 10%, ceteris paribus (net profit decrease of PLN
262m due to stronger NOK, decrease of PLN 58m due to stronger USD, decrease of PLN 11m due to
stronger EUR, and increase of PLN 2m due to strengthening of other currencies).
The most significant factor with a bearing on the outcome of the sensitivity analysis is higher
negative valuation of CCIRS derivatives hedging the credit facility advanced to PGNiG Upstream
International AS, which is eliminated from the consolidated financial statements.
If the credit facility was recognised in the statement of financial position (as is the case in the
Parent's separate financial statements), the cash flows related to the credit facility and the cash flows
from the hedging transactions would offset one another. As a result, the changes in positive
(negative) valuation of the credit facility would be offset by negative (positive) changes in the
valuation of CCIRS transactions. In aggregate, the items would show no sensitivity to the exchange
rate and interest rate changes.
Lower profit would be mainly attributable to an increase in the negative portion of the fair value of
financial derivatives (negative fair value of swap transactions in NOK).
The adverse effect on the net profit of NOK-denominated financial instruments would be
substantially amplified by an increase in valuation of the USD credit facility contracted by PGNiG
Upstream International AS and reduced by an increase in the valuation of assets in this currency. Any

PGNiG Group Consolidated financial statements for the year ended 31 grudnia 2014
(PLNm)
Page 89 of 119
increase in foreign exchange losses from valuation of the Euronotes in EUR would be offset by an
increase in the positive portion of the fair value of financial derivatives for EUR.
As at December 31st 2013, net profit would have been higher by PLN 325m, if the EUR, USD, NOK
and other currencies depreciated against the złoty by 10%, ceteris paribus (net profit higher by PLN
263m due to weaker NOK, higher by PLN 62m due to weaker USD, higher by PLN 2m due to weaker
EUR, and lower by PLN 2m due to depreciation of other currencies). A positive result would be mainly
attributable to an increase in the positive portion of the fair value of financial derivatives (positive
fair value of swap transactions in NOK). Any increase in foreign exchange gains from valuation of the
Euronotes in EUR would be offset by an increase in the negative portion of the fair value of financial
derivatives for EUR. On the other hand, any decrease in the valuation of the USD-denominated credit
facility contracted by PGNiG Upstream International AS would have a positive effect on net profit,
which would be partially offset by a decrease in assets (receivables) measured in the same currency.

PGNiG Group Consolidated financial statements for the year ended 31 grudnia 2014
(PLNm)
Page 90 of 119
32.5.2.2.1. Sensitivity of financial instruments denominated in foreign currencies to exchange rate fluctuations charged to profit or loss
Dec 31 2014
Carrying
amount Currency risk
Exchange
rate
change by:
10% -10%
EUR USD NOK
other
currencies EUR USD NOK
other
currencies
Financial assets
Other financial assets* - - - - - - - - -
Trade and other receivables 385 16 13 2 7 (16) (13) (2) (7)
Derivative financial instrument assets** 555 234 - - - - - 299 -
Cash and cash equivalents 382 27 9 - 2 (27) (9) - (2)
Effect on financial assets before tax 277 22 2 9 (43) (22) 297 (9)
19% tax (53) (4) (1) (2) 8 4 (56) 2
Effect on financial assets after tax
224 18 1 7 (35) (18) 241 (7)
Total currencies 250 181
Financial liabilities
Borrowings and debt securities (including finance lease) 2,849 235 50 - - (235) (50) - -
Trade and other payables 920 43 36 10 3 (43) (36) (10) (3)
Derivative financial instrument liabilities** 298 - 11 299 - 245 7 - -
Effect on financial liabilities before tax 278 97 309 3 (33) (79) (10) (3)
19% tax (53) (18) (59) (1) 6 15 2 1
Effect on financial liabilities after tax
225 79 250 2 (27) (64) (8) (2)
Total currencies 556 (101)
Total increase/decrease
(1) (61) (249) 5 (8) 46 249 (5)
Total currencies (306) 282
Exchange rates as at end of the reporting period and their changes:
EUR/PLN 4.2623 - 4.6885 4.6885 4.6885 - 3.8361 3.8361 3.8361
USD/PLN 3.5072 3.8579 - 3.8579 3.8579 3.1565 - 3.1565 3.1565
NOK/PLN 0.4735 0.5209 0.5209 - 0.5209 0.4262 0.4262 - 0.4262
** Includes shares disclosed at historical values, therefore the change in exchange rates will not affect the valuation of those assets and the profit/loss for the period.
** In the case of financial derivatives, only the effect of exchange rate fluctuations on profit or loss is presented. As the Group uses hedge accounting, part of the changes in the valuation of financial derivatives is charged to equity through other comprehensive income. The effect of fluctuations in exchange rates on this portion of financial derivatives is presented in a separate table below.

PGNiG Group Consolidated financial statements for the year ended 31 grudnia 2014
(PLNm)
Page 91 of 119
Dec 31 2013
Carrying
amount Currency risk
Exchange
rate
change by:
10% -10%
EUR USD NOK
other
currencies EUR USD NOK
other
currencies
Financial assets
Other financial assets* 9 - - - - - - - -
Trade and other receivables 317 13 14 1 3 (13) (14) (1) (3)
Derivative financial instrument assets** 251 230 15 - - - - 329 -
Cash and cash equivalents 995 20 66 11 2 (20) (66) (11) (2)
Effect on financial assets before tax 263 95 12 5 (33) (80) 317 (5)
19% tax (50) (18) (2) (1) 6 15 (60) 1
Effect on financial assets after tax
213 77 10 4 (27) (65) 257 (4)
Total currencies 304 161
Financial liabilities
Borrowings and debt securities (including finance lease) 3,449 230 115 - - (230) (115) - -
Trade and other payables 1,088 47 52 7 3 (47) (52) (7) (3)
Derivative financial instrument liabilities** 124 - - 329 - 241 10 - -
Effect on financial liabilities before tax 277 167 336 3 (36) (157) (7) (3)
19% tax (53) (32) (64) (1) 7 30 1 1
Effect on financial liabilities after tax
224 135 272 2 (29) (127) (6) (2)
Total currencies 633 (164)
Total increase/decrease
(11) (58) (262) 2 2 62 263 (2)
Total currencies (329) 325
Exchange rates as at end of the reporting period and their changes:
EUR/PLN 4.1472 - 4.5619 4.5619 4.5619 - 3.7325 3.7325 3.7325
USD/PLN 3.0120 3.3132 - 3.3132 3.3132 2.7108 - 2.7108 2.7108
NOK/PLN 0.4953 0.5448 0.5448 - 0.5448 0.4458 0.4458 - 0.4458
** Includes shares disclosed at historical values, therefore the change in exchange rates will not affect the valuation of those assets and the profit/loss for the period.
** In the case of financial derivatives, only the effect of exchange rate fluctuations on profit or loss is presented. As the Group uses hedge accounting, part of the changes in the valuation of financial derivatives is charged to equity through other comprehensive income. The effect of fluctuations in exchange rates on this portion of financial derivatives is presented in a separate table below.
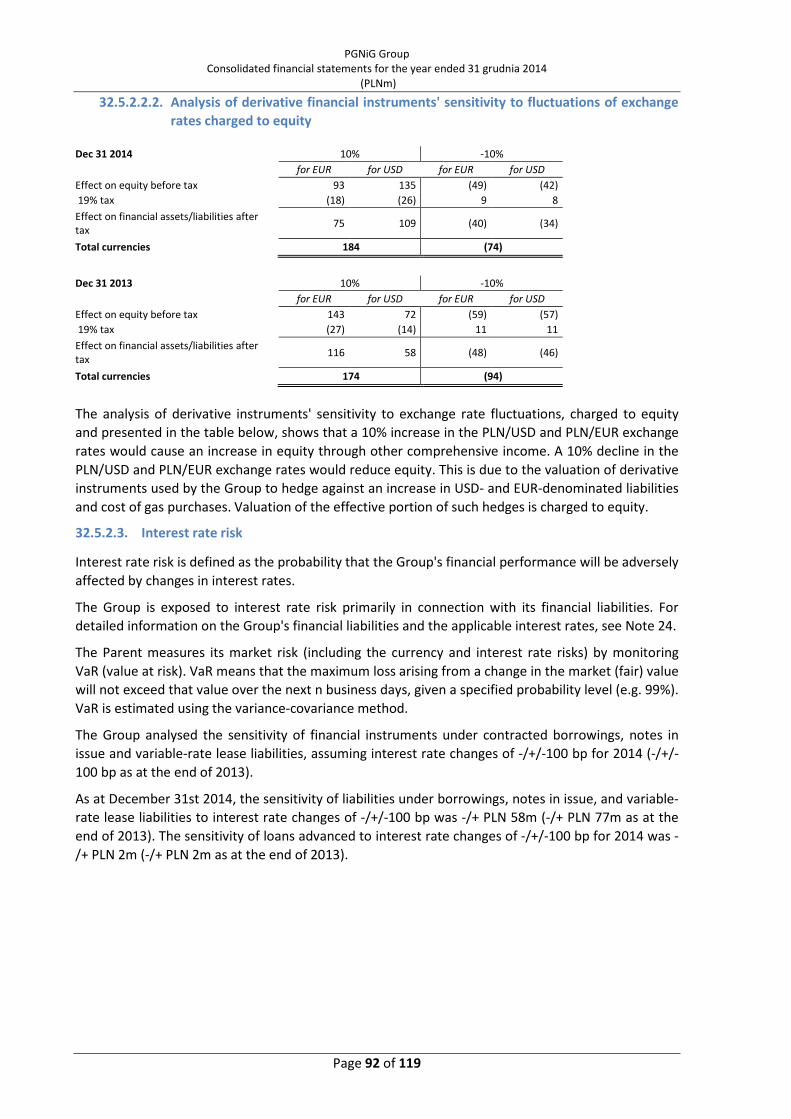
PGNiG Group Consolidated financial statements for the year ended 31 grudnia 2014
(PLNm)
Page 92 of 119
32.5.2.2.2. Analysis of derivative financial instruments' sensitivity to fluctuations of exchange
rates charged to equity
Dec 31 2014 10% -10%
for EUR for USD for EUR for USD
Effect on equity before tax 93 135 (49) (42)
19% tax (18) (26) 9 8
Effect on financial assets/liabilities after tax
75 109 (40) (34)
Total currencies 184 (74)
Dec 31 2013 10% -10%
for EUR for USD for EUR for USD
Effect on equity before tax 143 72 (59) (57)
19% tax (27) (14) 11 11
Effect on financial assets/liabilities after tax
116 58 (48) (46)
Total currencies 174 (94)
The analysis of derivative instruments' sensitivity to exchange rate fluctuations, charged to equity
and presented in the table below, shows that a 10% increase in the PLN/USD and PLN/EUR exchange
rates would cause an increase in equity through other comprehensive income. A 10% decline in the
PLN/USD and PLN/EUR exchange rates would reduce equity. This is due to the valuation of derivative
instruments used by the Group to hedge against an increase in USD- and EUR-denominated liabilities
and cost of gas purchases. Valuation of the effective portion of such hedges is charged to equity.
32.5.2.3. Interest rate risk
Interest rate risk is defined as the probability that the Group's financial performance will be adversely
affected by changes in interest rates.
The Group is exposed to interest rate risk primarily in connection with its financial liabilities. For
detailed information on the Group's financial liabilities and the applicable interest rates, see Note 24.
The Parent measures its market risk (including the currency and interest rate risks) by monitoring
VaR (value at risk). VaR means that the maximum loss arising from a change in the market (fair) value
will not exceed that value over the next n business days, given a specified probability level (e.g. 99%).
VaR is estimated using the variance-covariance method.
The Group analysed the sensitivity of financial instruments under contracted borrowings, notes in
issue and variable-rate lease liabilities, assuming interest rate changes of -/+/-100 bp for 2014 (-/+/-
100 bp as at the end of 2013).
As at December 31st 2014, the sensitivity of liabilities under borrowings, notes in issue, and variable-
rate lease liabilities to interest rate changes of -/+/-100 bp was -/+ PLN 58m (-/+ PLN 77m as at the
end of 2013). The sensitivity of loans advanced to interest rate changes of -/+/-100 bp for 2014 was -
/+ PLN 2m (-/+ PLN 2m as at the end of 2013).

PGNiG Group Consolidated financial statements for the year ended 31 grudnia 2014
(PLNm)
Page 93 of 119
32.5.2.3.1. Sensitivity of financial instruments to interest rate changes
Dec 31 2014 Carrying
amount Change by:
+100 bp -100 bp
Loans advanced 197 2 (2)
Borrowings and other debt instruments 825 8 (8)
Notes issued 4,894 49 (49)
Lease liabilities 119 1 (1)
Total liabilities 5,838 58 (58)
Dec 31 2013 Carrying
amount Change by:
+100 bp -100 bp
Loans advanced 185 2 (2)
Borrowings and other debt instruments 1,619 16 (16)
Notes issued 5,885 59 (59)
Lease liabilities 157 2 (2)
Total liabilities 7,661 77 (77)
32.5.2.4. Commodity price risk
Commodity price risk is defined as the probability that the Group’s financial performance will be
adversely affected by changes in commodity prices.
The Group's exposure to commodity price risk arises mainly in connection with its contracts for gas
fuel deliveries and sales contracts entered into through the process of daily bidding and sale of the
fuel at the PPE. It stems from volatility of prices of gas and oil products quoted on global markets.
Under some of the contracts for gas fuel deliveries, the pricing formula relies on a weighted average
of the prices from previous months, which mitigates the volatility risk.
Commodity risk is also related to electricity trading, certificates of origin and carbon credits.
Electricity trading is conducted on regulated exchange markets in Poland and abroad, but the Group
also enters into transactions outside of the regulated markets, under framework agreements. The
Group actively manages its exposure to commodity price risk using implemented VaR measures. VaR
values are measured and VaR limits are set and actively monitored to limit the potential losses
related to the exposure to commodity price risk assumed by the Company.
In addition, under the Energy Law an application for tariff adjustment may be filed if, within a
quarter, the purchase costs of gas rise by more than 5%. In 2014, the Group closely monitored and
hedged against the risk. To hedge against commodity price risk, the Group used Asian call options
settled as European options, risk reversal option strategies, commodity swaps, as well as futures and
forwards.
The Group analysed the sensitivity of energy commodity derivatives. For the sensitivity analysis for
2014, a 40% volatility was assumed for such instruments (15% as at December 31st 2013).
The tables below present an analysis of sensitivity of energy commodity derivatives to price changes
for 2014 and 2013.

PGNiG Group Consolidated financial statements for the year ended 31 grudnia 2014
(PLNm)
Page 94 of 119
32.5.2.4.1. Sensitivity of derivative financial instruments to commodity price fluctuations charged to profit or loss
Dec 31 2014 Carrying
amount Price risk
Price
change by: 40% -40%
Gasoil Fuel oil
Title Transfer Facility
Electricity Gas - trading activities in Germany
Gasoil Fuel oil Title Transfer
Facility Electricity
Gas - trading activities in
Germay
Financial assets
Energy commodity derivative assets 12 2 - - - - 1 - - - 4
Effect on financial assets before tax 2 - - - - 1 - - - 4
19% tax (0) - - - - (0) - - - (1)
Effect on financial assets after tax
2 - - - - 1 - - - 3
Total commodities 2 4
Financial liabilities
Energy commodity derivative liabilities 295 - 1 65 - 4 - - 12 - -
Effect on financial liabilities before tax - 1 65 - 4 - - 12 - -
19% tax - - (12) - (1) - - (2) - -
Effect on financial liabilities after tax
- 1 53 - 3 - - 10 - -
Total commodities 57 10
Total increase/decrease
2 (1) (53) - (3) 1 - (10) - 3
Total commodities (55) (6)

PGNiG Group Consolidated financial statements for the year ended 31 grudnia 2014
(PLNm)
Page 95 of 119
Dec 31 2013 Carrying
amount Price risk
Price
change by: 15% -15%
Gasoil Fuel oil
Title Transfer Facility
Electricity TGE Gas Gasoil Fuel oil Title Transfer
Facility Electricity TGE Gas
Financial assets
Energy commodity derivative assets 56 - 3 - 1 - - - - - 21
Effect on financial assets before tax - 3 - 1 - - - - - 21
19% tax - (1) - - - - - - - (4)
Effect on financial assets after tax
- 2 - 1 - - - - - 17
Total commodities 3 17
Financial liabilities
Energy commodity derivative liabilities - 2 - 19 - 21 5 4 22 1 -
Effect on financial liabilities before tax 2 - 19 - 21 5 4 22 1 -
19% tax - - (4) - (4) (1) (1) (4) - -
Effect on financial liabilities after tax
2 - 15 - 17 4 3 18 1 -
Total commodities 2 15 15 17 21 26 22 19 1 -
Total increase/decrease
(2) 2 (15) 1 (17) (4) (3) (18) (1) 17
Total commodities (31) (9)
The above tables present only the effect of price fluctuations on profit or loss. Some changes in the value of energy commodity derivatives affect equity directly.

PGNiG Group Consolidated financial statements for the year ended 31 grudnia 2014
(PLNm)
Page 96 of 119
The table below presents the effect of changes in energy commodity derivatives on equity.
32.5.2.4.2. Analysis of derivative financial instruments' sensitivity to fluctuations of commodity prices charged to equity
Dec 31 2014 Price
change by: 40% -40%
Gasoil Fuel oil Title Transfer Facility Gasoil Fuel oil Title Transfer Facility
Effect on equity before tax
56 43 337 (48) (35) (224)
19% tax
(11) (8) (64) 9 7 43
Effect on financial assets/liabilities after tax
45 35 273 (39) (28) (181)
Dec 31 2013 Price
change by: 15% -15%
Gasoil Fuel oil
Title Transfer Facility
Gasoil Fuel oil Title Transfer
Facility
Effect on equity before tax
73 62 411 (22) (28) (193)
19% tax
(14) (12) (78) 4 5 37
Effect on financial assets/liabilities after
tax 59 50 333 (18) (23) (156)
The analysis of derivative instruments' sensitivity to fluctuations of commodity prices, charged to equity, as presented in the table above, shows that a 40%
increase (15% increase at the end of 2013) in commodity prices would result in equity increase through other comprehensive income. A 40% decline in the prices
(15% decline at the end of 2013) would reduce equity. This is due to the fact that the Group uses derivatives to hedge against an increase in prices of energy
commodities, and the valuation of the effective portion of such hedges is charged to equity.

PGNiG Group Consolidated financial statements for the year ended 31 grudnia 2014
(PLNm)
Page 97 of 119
32.5.3. Liquidity risk
The main objective of the liquidity risk management is to monitor and plan the Company's liquidity
on a continuous basis. Liquidity is monitored through at least 12-month projections of future cash
flows, which are updated once a month. PGNiG S.A. reviews the actual cash flows against projections
at regular intervals – an exercise which comprises an analysis of unmet cash-flow targets, as well as
the related causes and effects.
The liquidity risk should not be equated exclusively with the risk of loss of liquidity by the Group. An
equally serious threat is that of having excess structural liquidity, which could adversely affect the
Group’s profitability.
The Group monitors and plans its liquidity levels on a continuous basis. As part of its strategy to
hedge against liquidity risk, as at December 31st 2014 the Group had in place the following debt
security issuance programmes:
• Under the Note Issuance Programme Agreement executed by the Parent on June 10th 2010, the
Parent may issue discount or coupon notes maturing in one to twelve months, for an aggregate
amount of up to PLN 7,000m. The Agreement was originally concluded with six banks (Bank
Pekao S.A., ING Bank Śląski S.A., PKO BP S.A., Bank Handlowy w Warszawie S.A., Societe
Generale S.A. and BNP Paribas S.A., Polish Branch). Under an annex of November 25th 2011,
BRE Bank S.A. (currently mBank S.A.), Bank Zachodni WBK S.A. and Nordea Bank Polska S.A.
acceded to the Agreement. Under an annex of August 8th 2014, Nordea Bank Polska was
excluded from the Agreement, and the Agreement's term was extended until July 31st 2020. As
at December 31st 2014, no debt was outstanding under the Agreement.
• On August 25th 2011, the Parent and PGNiG Finance AB executed documentation for a Euro
Medium Term Notes Programme with Societe Generale S.A., BNP Paribas S.A. and Unicredit
Bank AG, pursuant to which PGNiG Finance AB may issue notes with maturities of up to ten
years, up to the aggregate amount of EUR 1,200m. The first tranche of PGNiG Finance AB
securities under the Programme, comprising PLN 500m 5-year Euronotes, was issued on
February 10th 2012. As at December 31st 2014, nominal debt outstanding under the Euronotes
was PLN 2,131m (translated at the mid rate quoted by the National Bank of Poland for
December 31st 2014).
• On May 22nd 2012, the Parent executed an agreement for organisation of a note programme
for up to PLN 4,500m with Bank Pekao S.A. and ING Bank Śląski S.A. On July 30th 2012, the
issued five-year notes were floated on the Catalyst market, a multilateral trading facility
operated by BondSpot. In the reporting period no notes were issued. As at December 31st 2014,
nominal debt outstanding under the Programme was PLN 2,500m.
• On October 2nd 2014, the Parent executed an agreement for organisation of a note programme
for up to PLN 1,000m with Bank Gospodarstwa Krajowego. In 2014, no notes were issued under
the programme.
• On July 4th 2012, PGNiG Termika S.A. executed a note programme with the following banks:
ING Bank Śląski S.A., PKO Bank Polski S.A., Nordea Bank Polska S.A. and Bank Zachodni WBK S.A.
On November 1st 2014, two of the underwriters for the issue, PKO BP and Nordea Bank,
mergered. As a result of negotiations held with three banks: PKO BP, ING Bank Śląski and BZ
WBK, concerning the terms of the Note Programme, on December 15th 2014 annexes were
signed to amend the underwriting, agency and deposit agreements. Under the Programme,
PGNiG Termika S.A. may issue coupon or discount notes up to PLN 1,500m. In accordance with
the annexes, the Programme is to expire on December 29th 2019, though it may be extended
for two years, i.e. until December 29th 2021.

PGNiG Group Consolidated financial statements for the year ended 31 grudnia 2014
(PLNm)
Page 98 of 119
As at December 31st 2014, PGNiG TERMIKA S.A.'s nominal debt under notes in issue was PLN
190m.
Any surplus cash is invested, mainly in treasury securities, or deposited with reputable banks.
The liquidity risk at the Parent is significantly mitigated through the application of the “PGNiG S.A.
Liquidity Management Procedure”. This procedure has been implemented across the Company’s
organisational units. It offers a systematised set of measures designed to ensure proper liquidity
management through: settlement of payments, preparation of cash-flow projections, optimum
management of free cash flows, securing and restructuring of financing for day-to-day operations
and investment projects, protection against the risk of temporary liquidity loss due to unforeseen
disruptions, and appropriate servicing of credit agreements.
Measurement of the liquidity risk is based on an ongoing detailed monitoring of cash flows, which
takes into account the probability that specific flows will materialise, as well as the planned net cash
position.
The tables below present a breakdown of financial liabilities by maturity.
32.5.3.1. Financial liabilities at amortised cost, by maturity
As at Dec 31 2014
Liabilities under borrowings and
notes
Finance lease liabilities
Trade payables Total
up to 1 year 628 45 2,179 2,852
from 1 to 5 years 5,108 69 63 5,240
over 5 years 5 - 14 19
Total 5,741 114 2,256 8,111
As at Dec 31 2013
Liabilities under borrowings and
notes
Finance lease liabilities
Trade payables Total
up to 1 year 2,207 53 2,654 4,914
from 1 to 5 years 5,314 115 54 5,483
over 5 years - - 4 4
Total 7,521 168 2,712 10,401
The items in the above tables are presented at gross (undiscounted) amounts.
In the current and comparative periods, the Group met its liabilities under borrowings in a timely
manner. Further, there were no breaches of material provisions of any of its borrowing agreements
that would trigger accelerated repayment.

PGNiG Group Consolidated financial statements for the year ended 31 grudnia 2014
(PLNm)
Page 99 of 119
32.5.3.2. Derivative financial instruments by maturity
Dec 31 2014 Carrying
amount*
Contractual
cash flows,
including:
up to 1 year from 1 to 5
years over 5 years
Interest rate swaps (IRS) and forward contracts, used as risk hedging instruments
193 180 9 171 -
- inflows - 5,423 647 4,776 -
- outflows - (5,243) (638) (4,605) -
Forward contracts 19 (1) (15) 14 -
- inflows - 962 872 90 -
- outflows - (963) (887) (76) -
Futures contracts (5) (1) - (1) -
- inflows - 5 3 2 -
- outflows - (6) (3) (3) -
Currency options** 50 - - - -
- inflows - - - - -
- outflows - - - - -
Commodity options** (2) - - - -
- inflows - - - - -
- outflows - - - - -
Commodity swaps (281) - - - -
- inflows - - - - - - outflows - - - - -
Total (26) 178 (6) 184 -
Dec 31 2013 Carrying
amount*
Contractual
cash flows,
including:
up to 1 year from 1 to 5
years over 5 years
Interest rate swaps (IRS) and forward contracts, used as risk hedging instruments
145 (48) (10) (38) -
- inflows - 10,390 5,032 5,358 -
- outflows - (10,438) (5,042) (5,396) -
Forward contracts (31) (28) (28) - -
- inflows - 1,354 1,352 2 -
- outflows - (1,382) (1,380) (2) -
Futures contracts 1 (1) (1) - -
- inflows - 16 16 - -
- outflows - (17) (17) - -
Currency options** 12 - - - -
- inflows - - - - -
- outflows - - - - -
Commodity options** 40 - - - -
- inflows - - - - -
- outflows - - - - -
Commodity swaps 16 - - - -
- inflows - - - - - - outflows - - - - -
Total 183 (77) (39) (38) -
* Net carrying amount (positive valuation less negative valuation of assets) represents the fair value, i.e. payments under swap contracts are discounted, whereas cash flows are shown at undiscounted amounts. ** The disclosed carrying amounts of currency and commodity options include any option premiums paid; as possible cash flows depend on the exchange rates or commodity prices prevailing on the market at the time when the option is exercised, no cash flows are shown. The Group has not identified any other material risks inherent in its day-to-day operations.

PGNiG Group Consolidated financial statements for the year ended 31 grudnia 2014
(PLNm)
Page 100 of 119
33. DERIVATIVE FINANCIAL INSTRUMENTS
Measurement of derivative financial instruments
As required by the International Financial Reporting Standards, derivative financial instruments
disclosed in the financial statements are measured at fair value.
As at December 31st 2014, the Group held the following types of derivatives: Cross Currency Interest
Rate Swaps (CCIRS), Interest Rate Swaps (IRS), purchased European and Asian currency call options,
purchased and sold currency and commodity forwards (physically settled), purchased and sold
futures, as well as purchased average rate forwards. In 2014, the Group also hedged against
commodity price risk using Asian call options, risk reversal strategies (purchase of Asian commodity
call options and sale of put options) and purchased commodity swaps.
Currency call options were measured at fair value using the Garman-Kohlhagen model, whereas
Asian commodity call and put options were measured at fair value using the Espen-Levy model.
Forwards, average rate forwards, swaps, CCIRS and IRS transactions are measured at fair value using
the discount method. The measurement was based on market data such as interest rates, foreign-
exchange rates, basis spreads, commodity prices and volatility of commodity prices as at December
31st 2014.
Hedge accounting
The Parent applies cash-flow hedge accounting with respect to foreign exchange transactions and
commodity transactions, as well as fair-value hedge accounting with respect to an advanced loan. For
details, see Note 2.3.12.

PGNiG Group Consolidated financial statements for the year ended 31 grudnia 2014
(PLNm)
Page 101 of 119
33.1. Derivative financial instruments
Measurement at fair value
Hedged item Par value in
currency Currency / asset Maturity date
Exercise price (exercise price
range)
As at Dec 31 2014
As at Dec 31 2013
Hedged risk
Cross Currency Interest Rate Swap
Euronotes 500 EUR 1-3 years 4.1580 193 108 currency and interest rate risk
loan 730 NOK 1-3 months 0.5595 53 35 currency and interest rate risk
loan 4,350 NOK 1-3 years 0.5033 53 (14) currency and interest rate risk
loan 3,900 NOK 1-3 months 0.5051 - (25) currency exchange rate and interest rate
loan 1,150 NOK 1-3 months 0.5664 - 64 currency exchange rate and interest rate
299 168
Interest Rate Swap
loan 1,500 PLN more than 3
years 1 (106) (23) interest rate risk
(106) (23)
Forward
loan 850 NOK 3-12 months 0.4697 (5) - foreign exchange risk
payments for gas 35 USD 1-3 months 3.3562 5 - foreign exchange risk
trading activities 1 electricity 1–3 months 168.8870 7 - energy price risk
trading activities 1 electricity 1–3 months 171.4998 (6) - energy price risk
trading activities 1 electricity 3–12 months 171.0307 12 - energy price risk
trading activities 1.40 electricity 3–12 months 174.9214 (12) - energy price risk

PGNiG Group Consolidated financial statements for the year ended 31 grudnia 2014
(PLNm)
Page 102 of 119
payments for gas 65 EUR 1-3 months 4.2385 2 - foreign exchange risk
payments for gas 40 EUR 3-12 months 4.2732 1 - foreign exchange risk
trading activities 2 gas – OTC 1-3 months 22.5500 (3) - gas prices
trading activities 6 gas – OTC 3-6 months 25.6800 (27) - gas prices
trading activities 3 gas – OTC 6-12 months 24.2500 (11) - gas prices
trading activities 1 gas – OTC up to 1 month 21.9100 1 - gas prices
trading activities 2 gas – OTC 1-3 months 22.7100 3 - gas prices
trading activities 6 gas – OTC 3-6 months 25.0900 23 - gas prices
trading activities 3 gas – OTC 6-12 months 24.1200 11 - gas prices
trading activities - electricity – OTC 1-3 months 39.9000 (1) - energy prices
trading activities 2 electricity – OTC 6-12 months 50.7600 (33) - energy prices
trading activities - electricity – OTC 3-6 months 41.3000 1 - energy prices
trading activities 3 electricity – OTC 6-12 months 48.6000 36 - energy prices
trading activities 19 gas – OTC 1-3 years 25.0900 (69) - gas prices
trading activities 15 gas – OTC 1-3 years 24.8700 50 - gas prices
trading activities 7 gas – OTC more than 3
years 26.3100 32 - gas prices
trading activities - electricity – OTC 1-3 years 39.2200 (2) - energy prices
trading activities 1 electricity – OTC 1-3 years 40.1100 4 - energy prices
loan 333 NOK 1-3 months 0.4978 - 1 currency exchange rate
payments for gas 10 EUR 1-3 months 4.2659 - (1) currency exchange rate
payments for gas 29 EUR 3-12 months 4.2189 - (1) currency exchange rate
payments for gas 130 USD 1-3 months 3.1221 - (14) currency exchange rate
payments for gas 80 USD 3-12 months 3.1234 - (7) currency exchange rate
payments for gas 24 EUR 1-3 months 4.2889 - (3) currency exchange rate
payments for gas 78 EUR 3-12 months 4.2660 - (6) currency exchange rate
19 (31)
Futures
trading activities 1 gas – EEX AG 3-6 months 25.2100 (3) - gas prices
trading activities - gas – EEX AG 3-6 months 25.7800 2 - gas prices
trading activities - gas – EEX AG 6-12 months 24.2100 2 - gas prices
trading activities - electricity – EEX AG 3-6 months 43.6500 (1) - energy prices
trading activities 2 electricity – EEX AG 6-12 months 35.8600 (6) - energy prices

PGNiG Group Consolidated financial statements for the year ended 31 grudnia 2014
(PLNm)
Page 103 of 119
trading activities - electricity – EEX AG 1-3 months 38.9300 1 - energy prices
trading activities 1 electricity – EEX AG 6-12 months 35.1400 3 - energy prices
trading activities - gas – ICE ENDEX B.V. 3-6 months 23.4600 (1) - gas prices
trading activities 1 gas – ICE ENDEX B.V. 6-12 months 22.1500 (1) - gas prices
trading activities 1 gas – ICE ENDEX B.V. 3-6 months 25.2200 2 - gas prices
trading activities - gas – ICE ENDEX B.V. 6-12 months 22.5500 1 - gas prices
trading activities 3 gas – EEX AG 1-3 years 24.3100 (9) - gas prices
trading activities 2 gas – EEX AG 1-3 years 24.2800 6 - gas prices
trading activities 1 electricity – EEX AG 1-3 years 37.0800 (3) - energy prices
trading activities - electricity – EEX AG 1-3 years 35.9500 2 - energy prices
trading activities 1 electricity 1-3 months 151.3070 - 7 energy prices
trading activities 1 electricity 1-3 months 151.3070 - (3) energy prices
trading activities 10 electricity 3-12 months 151.8480 - 8 energy prices
trading activities 10 electricity 3-12 months 151.8480 - (12) energy prices
trading activities 0.2 TGE gas 1-3 months 116.8200 - 1 gas prices
(5) 1
Call options
payments for gas 25 EUR 1-3 months 4.3350 - - foreign exchange risk
payments for gas 72 EUR 3-12 months 4.3915 4 - foreign exchange risk
payments for gas 45 EUR 1-3 years 4.4975 5 - foreign exchange risk
payments for gas 260 USD 1-3 months 3.4221 29 - foreign exchange risk
payments for gas 90 USD 3-12 months 3.4575 12 - foreign exchange risk
payments for gas 21 EUR 3-12 months 4.3515 - 1 currency exchange rate
payments for gas 265 EUR 3-12 months 4.3848 - 6 currency exchange rate
payments for gas 180 USD 3-12 months 3.3077 - 5 currency exchange rate
50 12
Commodity call options
payments for gas 1.015 Title Transfer Facility (TTF) 3-12 months 23.67 4 - commodity price risk
payments for gas 1.091 Title Transfer Facility (TTF) 1-3 years 24.95 8 - commodity price risk
payments for gas 0.502 FO 3-12 months 643.72 - 3 commodity prices
payments for gas 0.038 FO 1-3 years 630.00 - 1 commodity prices
payments for gas 0.251 GO 3-12 months 955.38 - 8 commodity prices
payments for gas 0.020 GO 1-3 years 955.00 - 1 commodity prices
payments for gas 5.800 TTF 1-3 months 28.11 - 1 commodity prices

PGNiG Group Consolidated financial statements for the year ended 31 grudnia 2014
(PLNm)
Page 104 of 119
payments for gas 8.650 TTF 3-12 months 26.73 - 26 commodity prices
12 40
Put commodity options
payments for gas 0.024 FO 3-12 months 391.25 (7) - commodity price risk
payments for gas 0.013 GO 3-12 months 672.12 (7) - commodity price risk
(14) -
Commodity swap
payments for gas 0.087 FO 1-3 months 598.25 (18) - commodity price risk
payments for gas 0.136 FO 3-12 months 483.61 (77) - commodity price risk
payments for gas 0.052 GO 1-3 months 896.24 (15) - commodity price risk
payments for gas 0.107 GO 3-12 months 773.05 (71) - commodity price risk
payments for gas 4.301 Title Transfer Facility (TTF) 1-3 months 24.24 (41) - commodity price risk
payments for gas 4.692 Title Transfer Facility (TTF) 3-12 months 23.83 (58) - commodity price risk
payments for gas 0.186 Title Transfer Facility (TTF) 1-3 years 23.90 (1) - commodity price risk
payments for gas 0.085 FO 3-12 months 602.18 - 1 commodity prices
payments for gas 0.028 GO 1-3 months 869.77 - 4 commodity prices
payments for gas 0.049 GO 3-12 months 893.39 - 6 commodity prices
payments for gas 1.730 TTF 1-3 months 27.47 - 3 commodity prices
payments for gas 7.050 TTF 3-12 months 25.79 - 17 commodity prices
payments for gas 4.135 TTF 1-3 months 27.78 - (10) commodity prices
payments for gas 2.035 TTF 3-12 months 27.16 - (5) commodity prices
(281) 16
Total
(26) 183
including: - positive valuation (assets) 567 307
- negative valuation (liabilities) (593) (124)
GO − Gasoil
FO − Fuel Oil
HFO − Heavy Fuel Oil
TTF – Natural Gas at the Title Transfer Facility

PGNiG Group Consolidated financial statements for the year ended 31 grudnia 2014
(PLNm)
Page 105 of 119
Positive valuation of derivatives as at the end of the period is presented in the statement of financial
position as a separate item of current assets. Negative valuation of derivatives is presented in the
statement of financial position as a separate item of current liabilities. Effects of valuation of open
positions are taken to profit or loss for the period, or directly to equity if there is an effective portion
which constitutes an effective hedge of changes in fair value of financial derivatives designated as
cash flow hedges. In such a case, at the time of exercise of the derivative financial instrument and of
the hedged item, the Group’s equity is decreased or increased, and the effective portion is charged
to profit or loss at the place of origination of the hedged item’s costs. The non-effective portion and
the fair value of transactions not designated as hedges is recognised under other items of the profit
or loss of the period.
Year ended Dec 31 2014
Year ended Dec 31 2013
Net gain/(loss) on valuation of derivative financial instruments – unrealised
70 257
Net gain/(loss) on valuation of derivative financial instruments – realised
(496) (177)
Total net gain/(loss) on valuation of derivative financial
instruments recognised in profit or loss (426) 80
including:
recognised in raw materials and consumables used (315) (53)
recognised in other income and expenses (79) 168
recognised in finance income or costs (32) (35)
Net gain/(loss) on valuation of derivative financial instruments
recognised in other comprehensive income -– unrealised
(265) 72
Total net gain/(loss) on valuation of derivative financial
instruments – recognised in equity (691) 152
34. CONTINGENT LIABILITIES AND RECEIVABLES
During preparation of these consolidated financial statements of the PGNiG Group for 2014, an
analysis of individual contingent items was carried out for the following purposes:
• to assess the probability of consumption/loss of economic benefits related to contingent
receivables/liabilities held;
• to eliminate amounts pertaining to contingent receivables and liabilities disclosed in the
statement of financial position.
As a result of the analysis, as at the end of the comparative period contingent receivables fell by PLN
193m and contingent liabilities fell by PLN 2,698m compared with the data disclosed in the
consolidated financial statements of the PGNiG Group for 2013.
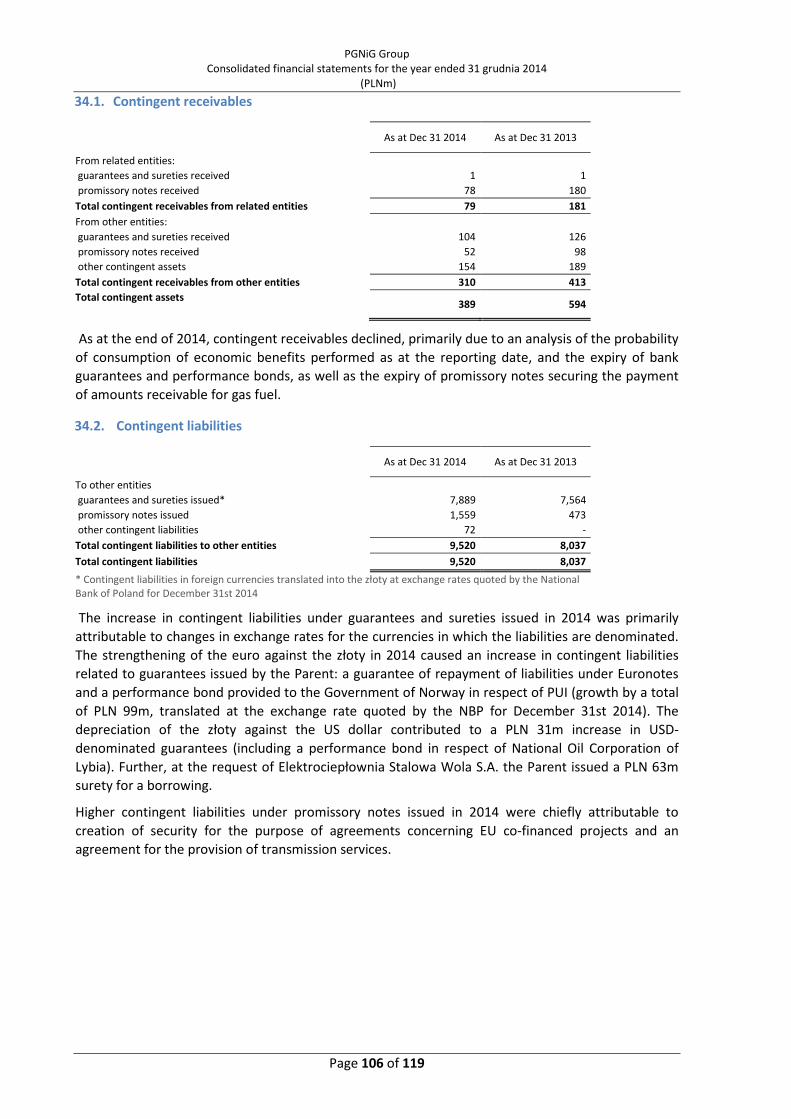
PGNiG Group Consolidated financial statements for the year ended 31 grudnia 2014
(PLNm)
Page 106 of 119
34.1. Contingent receivables
As at Dec 31 2014 As at Dec 31 2013
From related entities:
guarantees and sureties received 1 1
promissory notes received 78 180
Total contingent receivables from related entities 79 181
From other entities:
guarantees and sureties received 104 126
promissory notes received 52 98
other contingent assets 154 189
Total contingent receivables from other entities 310 413
Total contingent assets
389 594
As at the end of 2014, contingent receivables declined, primarily due to an analysis of the probability
of consumption of economic benefits performed as at the reporting date, and the expiry of bank
guarantees and performance bonds, as well as the expiry of promissory notes securing the payment
of amounts receivable for gas fuel.
34.2. Contingent liabilities
As at Dec 31 2014 As at Dec 31 2013
To other entities
guarantees and sureties issued* 7,889 7,564
promissory notes issued 1,559 473
other contingent liabilities 72 -
Total contingent liabilities to other entities 9,520 8,037
Total contingent liabilities 9,520 8,037
* Contingent liabilities in foreign currencies translated into the złoty at exchange rates quoted by the National Bank of Poland for December 31st 2014
The increase in contingent liabilities under guarantees and sureties issued in 2014 was primarily
attributable to changes in exchange rates for the currencies in which the liabilities are denominated.
The strengthening of the euro against the złoty in 2014 caused an increase in contingent liabilities
related to guarantees issued by the Parent: a guarantee of repayment of liabilities under Euronotes
and a performance bond provided to the Government of Norway in respect of PUI (growth by a total
of PLN 99m, translated at the exchange rate quoted by the NBP for December 31st 2014). The
depreciation of the złoty against the US dollar contributed to a PLN 31m increase in USD-
denominated guarantees (including a performance bond in respect of National Oil Corporation of
Lybia). Further, at the request of Elektrociepłownia Stalowa Wola S.A. the Parent issued a PLN 63m
surety for a borrowing.
Higher contingent liabilities under promissory notes issued in 2014 were chiefly attributable to
creation of security for the purpose of agreements concerning EU co-financed projects and an
agreement for the provision of transmission services.

PGNiG Group Consolidated financial statements for the year ended 31 grudnia 2014
(PLNm)
Page 107 of 119
35. OFF-BALANCE SHEET LIABILITIES
35.1. Operating lease liabilities
As at Dec 31 2014 As at Dec 31 2013
up to 1 year 4 9
from 1 to 5 years 1 4
Total 5 13
35.2. Commitments under executed agreements (not disclosed in the statement of financial
position)
As at Dec 31 2014 As at Dec 31 2013
Commitments under executed agreements 5,069 6,527
Completion of agreements as at the reporting date (3,478) (4,506)
Contractual liabilities maturing after the reporting date 1,591 2,021

PGNiG Group Consolidated financial statements for the year ended 31 grudnia 2014
(PLNm)
Page 108 of 119
36. RELATED ENTITIES
36.1. Related-party transactions
Related party
Turnover from Jan 1
to
Sales to related parties
Purchases from related
parties Balance as at
Receivables from related parties, gross
Receivables from related parties, net
Loans to related
parties, gross
Loans to related
parties, net
Liabilities to related parties
Equity-accounted associated entities and joint ventures
Dec 31 2014 40 - Dec 31 2014 5 5 - - 7
Dec 31 2013 35 - Dec 31 2013 4 4 - - 6
Non-equity-accounted non-consolidated subsidiaries and associated entities and joint ventures
Dec 31 2014 8 (44) Dec 31 2014 10 5 236 197 6
Dec 31 2013 21 (69) Dec 31 2013 11 6 216 185 10
Related entities – total Dec 31 2014 48 (44) Dec 31 2014 15 10 236 197 13
Dec 31 2013 56 (69) Dec 31 2013 15 10 216 185 16
In 2014, there were no material transactions with shareholders, other than the dividend distribution discussed in Note 10.
In 2014, neither the Parent nor its subsidiaries entered into any material transactions with related parties otherwise than on arm’s length terms.
The Group prepares documentation for related-party transactions in accordance with Art. 9a of the Corporate Income Tax Act. The procedure is applied each time
the PGNiG Group entities execute agreements, annexes to agreements, orders (detailed agreements) or orders placed under framework agreements with related
entities - if the total amounts payable/receivable (to/from one contractor under one agreement) or their equivalent in the złoty exceed in a calendar year the
equivalent of EUR 100 thousand in the case of transactions involving merchandise or EUR 30 thousand in the case of transactions involving rendering of services,
sale or provision of intangible assets.
.

PGNiG Group Consolidated financial statements for the year ended 31 grudnia 2014
(PLNm)
Page 109 of 119
For a list of non-consolidated subsidiaries, see Note 1.4. These financial statements contain
consolidated data. The table below presents non-equity-accounted associated entities and joint
ventures:
Non-equity-accounted joint ventures and associated entities
Company name Country % ownership interest
Dec 31 2014 Dec 31 2013
1. InterTransGas GmbH w likwidacji (in liquidation) Germany 50.00% 50.00%
2. Sahara Petroleum Technology Llc w likwidacji (in liquidation) Oman 49.00% 49.00%
3. PFK GASKON S.A. Poland 45.94% 45.94% 4. GAZOMONTAŻ S.A. w upadłości likwidacyjnej (in bankruptcy by liquidation) Poland 45.18% 45.18%
5. ZRUG Sp. z o.o. Poland 40.06% 40.06%
6. ZWUG INTERGAZ Sp. z o.o. Poland 38.30% 38.30%
7. Dewon ZSA Ukraine 36.38% 36.38% 8. ZRUG TORUŃ S.A. w upadłości likwidacyjnej (in bankruptcy by liquidation) Poland 25.24% 25.24%
9. Elektrociepłownia Stalowa Wola S.A. Poland 50.00% 50.00% 10% Gazobudowa Kraków Sp. z o.o. w upadłości likwidacyjnej (in bankruptcy by liquidation) Poland 47.20% 47.20%
11. Geotermia Sp. z o.o. Poland 25.00% 25.00%
12. ALFA-CENTER Sp. z o.o. Poland 45.94% 45.94%
13. Gas-Trading Podkarpacie Sp. z o.o. Poland 42.99% 42.99%

PGNiG Group Consolidated financial statements for the year ended 31 grudnia 2014
(PLNm)
Page 110 of 119
36.2. Transactions with entities in which the State Treasury holds equity interests
With respect to the required detail of presentation for transactions entered into with parties related
through the State Treasury, the Group applies the exemption provided for in paragraphs 25-27 of IAS
24. As there are no special transactions with such entities, the Company may present the minimum
scope of information required under revised IAS 24 (presented below).
The main transactions with entities in which the State Treasury holds equity interests are executed in
the course of the Group’s day-to-day operations, i.e. natural gas trading, sale of crude oil, and sale of
electricity.
In 2014, the Group generated the highest turnover with the following entities in which the State
Treasury holds (directly or indirectly) equity interests: Operator Gazociągów Przesyłowych GAZ-
SYSTEM S.A., Polski Koncern Naftowy ORLEN S.A., Orlen Południe S.A., Grupa Azoty Zakłady Azotowe
PUŁAWY S.A., Zakłady Azotowe w Tarnowie - Mościcach S.A., Grupa Azoty Zakłady Azotowe
Kędzierzyn S.A., Grupa LOTOS S.A., PGE Górnictwo i Energetyka Konwencjonalna S.A., Energa Obrót
S.A., and Polskie Sieci Elektroenergetyczne S.A.
In 2013, the Group generated the highest turnover with the following entities in which the State
Treasury holds (directly or indirectly) equity interests: Operator Gazociągów Przesyłowych GAZ-
SYSTEM S.A., Polski Koncern Naftowy ORLEN S.A., PGE Górnictwo i Energetyka Konwencjonalna S.A.,
Grupa LOTOS S.A., KGHM Polska Miedź S.A., Krośnieńskie Huty Szkła KROSNO S.A. w upadłości (in
bankruptcy), Grupa Azoty Zakłady Azotowe PUŁAWY S.A., Grupa Azoty Zakłady Chemiczne POLICE
S.A., Grupa Azoty Zakłady Azotowe Kędzierzyn S.A., Zakłady Azotowe w Tarnowie - Mościcach S.A.,
Huta Cynku "Miasteczko Śląskie" S.A., Rafineria Trzebinia S.A. and Rafineria Nafty Jedlicze S.A.
36.3. Remuneration paid to members of management and supervisory bodies of the Group
companies
Year ended Dec 31 2014
Year ended Dec 31 2013
Remuneration paid to management staff 39.69 37.29
Parent 10.65 5.20
Subsidiaries 25.58 23.02
Joint ventures 2.65 8.26
Associates 0.81 0.81
Remuneration paid to supervisory staff 7.03 5.42
Parent 0.37 0.36
Subsidiaries 4.89 3.25
Joint ventures 1.26 1.25
Associates 0.51 0.56
Total 46.72 42.71

PGNiG Group Consolidated financial statements for the year ended 31 grudnia 2014
(PLNm)
Page 111 of 119
36.4. Loans granted to the management and supervisory staff of the Group companies
As at Dec 31 2014 As at Dec 31 2013
Management staff
Interest rate (%) 1% 1%-3%
Maturing in 3 years 3–5 years
Amount of outstanding loans 0.01 0.01
Supervisory staff
Interest rate (%) - -
Maturing in - -
Amount of outstanding loans - -
Total amount of outstanding loans 0.01 0.01
36.5. Remuneration paid to members of management and supervisory bodies of the Parent
Year ended Dec 31 2014
Name
Total remuneration, additional benefits
and bonuses paid in 2014
Total remuneration for holding key
positions at subordinates in 2014
Total remuneration paid in 2014
Total remuneration paid to Management Board members,
including: 11.688 3.780 15.468
Mariusz Zawisza − President 1.178 0.757 1.935
Jarosław Bauc – Vice-President 0.971 0.674 1.645
Waldemar Wójcik – Vice-President 0.711 0.505 1.216
Zbigniew Skrzypkiewicz – Vice-President 0.965 0.608 1.573
Violetta Jasińska-Jaśkowiak – Proxy 0.499 0.101 0.600
Persons who were Management Board members in 2014 but
not as at Dec 31 2014:
Andrzej Parafianowicz 0.610 0.411 1.021
Jerzy Kurella 1.070 0.724 1.794
Persons who were Management Board members in 2013 but
not as at Dec 31 2013:
Grażyna Piotrowska-Oliwa 0.541 - 0.541
Radosław Dudziński 0.492 - 0.492
Jacek Murawski 2.339 - 2.339
Mirosław Szkałuba 2.312 - 2.312
Total remuneration paid to Supervisory Board members,
including: 0.372 0.024 0.396
Wojciech Chmielewski 0.045 - 0.045
Agnieszka Chmielarz 0.017 - 0.017
Józef Głowacki 0.017 - 0.017
Mieczysław Kawecki 0.017 0.024 0.041
Marcin Moroń 0.017 - 0.017
Janusz Pilitowski 0.045 - 0.045
Agnieszka Woś 0.029 - 0.029
Ewa Sibrecht-Ośka 0.017 - 0.017
Jolanta Siergiej 0.017 - 0.017
Magdalena Zegarska 0.029 - 0.029
Sławomir Borowiec 0.029 - 0.029
Andrzej Janiak 0.035 - 0.035
Ryszard Wąsowicz 0.029 - 0.029
Agnieszka Trzaskalska 0.010 - 0.010
Bogusław Nadolnik 0.022 - 0.022
Total 12.060 3.804 15.864

PGNiG Group Consolidated financial statements for the year ended 31 grudnia 2014
(PLNm)
Page 112 of 119
Year ended Dec 31 2013
Name
Total remuneration, additional benefits
and bonuses paid in 2013
Total remuneration for holding offices in subordinates in 2013
Total remuneration paid in 2013
Total remuneration paid to Management Board members,
including: 5.201 1.413 6.614
Jarosław Bauc - - -
Jerzy Kurella 0.550 0.255 0.805
Andrzej Parafianowicz - - -
Zbigniew Skrzypkiewicz 0.058 - 0.058
Violetta Jasińska-Jaśkowiak 0.009 0.003 0.012
Persons who were Management Board members in the
reporting period but did not hold their positions at the end of
the period
Radosław Dudziński 1.183 0.210 1.393
Sławomir Hinc 0.071 0.250 0.321
Jacek Murawski 0.966 0.283 1.249
Grażyna Piotrowska-Oliwa 1.284 0.228 1.512
Mirosław Szkałuba 1.080 0.184 1.264
Total remuneration paid to Supervisory Board members,
including: 0.359 0.060 0.419
Chmielewski Wojciech 0.041 - 0.041
Marcin Moryń 0.041 - 0.041
Mieczysław Kawecki 0.041 0.044 0.085
Agnieszka Chmielarz 0.041 0.008 0.049
Józef Głowacki 0.041 - 0.041
Janusz Pilitowski 0.041 - 0.041
Jolanta Siergiej 0.041 0.008 0.049
Ewa Sibrecht-Ośka 0.041 - 0.041
Persons who were Supervisory Board members during the
reporting period but did not hold their positions at the end of
the period
Mieczysław Puławski 0.020 - 0.020
Zbigniew Skrzypkiewicz 0.011 - 0.011
Total 5.560 1.473 7.033
36.6. Fees paid to the audit firm for the mandatory audit of the full-year consolidated financial
statements of the Group and for the rendering of other services
Year ended Dec 31 2014 Year ended Dec 31 2013
Audit of the full-year consolidated financial statements 0.06 0.09
Audit of the full-year separate financial statements 0.06 0.10
Other assurance services, including review of financial statements 0.47 0.50
Other services 0.01 -
Total 0.60 0.69

PGNiG Group Consolidated financial statements for the year ended 31 grudnia 2014
(PLNm)
Page 113 of 119
36.7. Joint operations
Name of joint contractual arrangement
Country where joint operation is carried out
Interests in joint operations Business of joint operations
Joint operation in four exploration areas in south-eastern Poland Poland PGNiG S.A. 50%; Chevron Polska Energy Resources Sp. z o.o.
50% First phase of joint exploration for unconventional gas deposits
Joint operation in the Górowo Iławieckie licence area Poland PGNiG S.A. 51%; LOTOS Petrobaltic S.A. 49% Oil and gas exploration and production
Joint operation in the Kamień Pomorski licence area Poland PGNiG S.A. 51%; LOTOS Petrobaltic S.A. 49% Oil and gas exploration and production
Joint operation in the Płotki licence area Poland PGNiG S.A. 51%; FX Energy 49% Oil and gas exploration and production
Joint operation in the Płotki-PTZ (the Extended Zaniemyśl Area) licence area Poland PGNiG S.A. 51%; FX Energy 24.5%; Cal Energy 24.5% Oil and gas exploration and production
Joint operation in the Poznań licence area Poland PGNiG S.A. 51%; FX Energy 49% Oil and gas exploration and production
Joint operation in the Warszawa-Południe (blocks 254 and 255) licence area Poland PGNiG S.A. 49%; FX Energy 51% Oil and gas exploration and production
Joint operation in the Ostrowiec licence area Poland PGNiG S.A. 49%; FX Energy 51% Oil and gas exploration and production
Joint operation in the Kutno licence area Poland PGNiG S.A. 50%; FX Energy 50% Oil and gas exploration and production
Joint operation in the Bieszczady licence area Poland PGNiG S.A. 51%; Eurogas Polska Sp. z o.o. 24%; Energia
Bieszczady Sp. z o.o. 25% Oil and gas exploration and production
Joint operation in the Sieraków licence area Poland PGNiG S.A. 51%; Orlen Upstream Sp. z o.o. 49% Oil and gas exploration and production
Joint operation in the Karpaty Zachodnie licence area Poland PGNiG S.A. 40%; Energia Karpaty Zachodnie Sp. z o.o. Sp. k.
60% Oil and gas exploration and production
Joint operation in the Karpaty Wschodnie licence area Poland PGNiG S.A. 20%; Energia Karpaty Wschodnie Sp. z o.o. Sp. k.
80% Oil and gas exploration and production
Joint operation in the Skarv Unit (PL212, PL212B, PL262) licence area Norway PUI 11.9175%; BP 23.835%; Statoil 36.165%; EON 28.0825% Oil and gas exploration and production
Joint operation in the PL212E licence area Norway PUI 15%; BP 30%; Statoil 30%; EON 25% Oil and gas exploration and production
Joint operation in the PL558 licence area Norway PUI 30%; EON 30%; Det norske 20%; Petoro 20% Oil and gas exploration and production
Joint operation in the PL646 licence area Norway PUI 20%; Lundin Norway 20%; Wintershall 40%; Noreco 20% Oil and gas exploration and production
Joint operation in the PL648S licence area Norway PUI 50%; OMV 50% Oil and gas exploration and production
Joint operation in the PL702 licence area Norway PUI 40%; OMV 60% Oil and gas exploration and production
Joint operation in the PL703 licence area Norway PUI 40%; OMV 60% Oil and gas exploration and production
Joint operation in the PL707 licence area Norway PUI 30%; Edison 50%; North 10%; Lime 10% Oil and gas exploration and production
Joint operation in the PL711 licence area Norway PUI 20%; Repsol 30%; OMV 20%; Idemitsu 20% Oil and gas exploration and production
Joint operation in the PL756 licence area Norway PUI 50%; Idemitsu 25%; Rocksource 25% Oil and gas exploration and production

PGNiG Group Consolidated financial statements for the year ended 31 grudnia 2014
(PLNm)
Page 114 of 119
37. EMPLOYEES (NUMBER OF STAFF)
Employees by segments as at end of the period As at Dec 31 2014 As at Dec 31 2013
Exploration and Production 10,221 10,754
Trade and Storage 4,218 4,357
including equity-accounted entities 289 287
Distribution 12,173 13,050
Generation 1,068 1,066
Other Segments 1,605 1,990
Total 29,285 31,217
38. RESTRUCTURING PROCESS WITHIN THE GROUP
In 2014, the Programme for Workforce Streamlining and Redundancy Payments to the Employees of
the PGNiG Group for 2009–2011 (Stage 3) (the “Programme”), approved by the Extraordinary
General Meeting of PGNiG S.A. on December 11th 2008, was continued. By virtue of a resolution of
the Extraordinary General Meeting of PGNiG S.A. of December 7th 2011, the term of the Central
Restructuring Fund (CRF) was extended until December 31st 2015, and the term of the Programme
was extended accordingly.
However, in accordance with the Programme terms, on August 19th 2014 the PGNiG Management
Board passed a resolution to terminate the Programme with effect from December 31st 2014, which
was approved, by virtue of a resolution, by the Extraordinary General Meeting on September 24th
2014. Thus, as of January 1st 2015 the Programme was no longer in effect.
The Programme was based on a stand-by principle, which meant that it could be launched in special
circumstances and required the entities covered by it to apply uniform procedures. Any decision to
use funds under the Programme could only be made where it was justified by the scope of planned
restructuring involving workforce downsizing and/or liquidation of jobs.
The costs of redundancy payments to which laid-off employees were entitled under the Programme
were covered from the CRF, which was at the disposal of the General Meeting of PGNiG S.A., or with
corresponding funds accumulated for that purpose by the entities participating in the Programme.
The Group discloses CRF under "Employee benefit obligations".
In the reporting period, one-off redundancy payments were made from the Central Restructuring
Fund to 15 former employees of BUD-GAZ Sp. z o.o. w likwidacji (in liquidation), for a total of PLN
1m.
In accordance with Par. 8.3 of the Programme, the contributions to the Central Restructuring Fund
were made from the Company's net profit. The total amount contributed to the CRF was PLN 43m, of
which PLN 40.6m was paid out as redundancy payments to laid-off employees of companies covered
by the Programme.
At present, the funds held under the CRF amount to PLN 2.4m.
As the capital reserve held in the CRF was used to finance redundancy payments under the
Programme which expired on December 31st 2014, on January 2nd 2015 the HR Department filed a
request to the Company's Management Board to liquidate the CFR and transfer the remaining funds
of PLN 2.4m to the Company's statutory reserve funds.
In accordance with the PGNiG Group Efficiency Improvement Programme, PGNiG Group companies
are also implementing other programmes related to workforce streamlining, including Voluntary
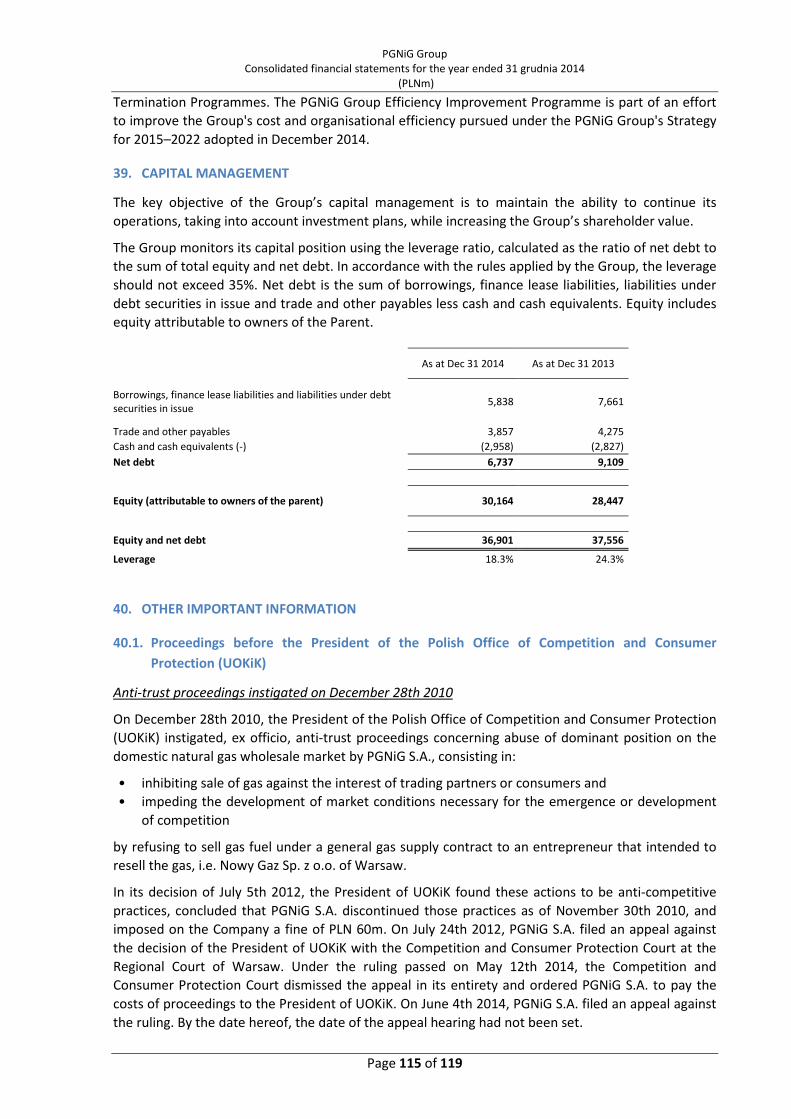
PGNiG Group Consolidated financial statements for the year ended 31 grudnia 2014
(PLNm)
Page 115 of 119
Termination Programmes. The PGNiG Group Efficiency Improvement Programme is part of an effort
to improve the Group's cost and organisational efficiency pursued under the PGNiG Group's Strategy
for 2015–2022 adopted in December 2014.
39. CAPITAL MANAGEMENT
The key objective of the Group’s capital management is to maintain the ability to continue its
operations, taking into account investment plans, while increasing the Group’s shareholder value.
The Group monitors its capital position using the leverage ratio, calculated as the ratio of net debt to
the sum of total equity and net debt. In accordance with the rules applied by the Group, the leverage
should not exceed 35%. Net debt is the sum of borrowings, finance lease liabilities, liabilities under
debt securities in issue and trade and other payables less cash and cash equivalents. Equity includes
equity attributable to owners of the Parent.
As at Dec 31 2014 As at Dec 31 2013
Borrowings, finance lease liabilities and liabilities under debt securities in issue
5,838 7,661
Trade and other payables 3,857 4,275
Cash and cash equivalents (-) (2,958) (2,827)
Net debt 6,737 9,109
Equity (attributable to owners of the parent) 30,164 28,447
Equity and net debt 36,901 37,556
Leverage 18.3% 24.3%
40. OTHER IMPORTANT INFORMATION
40.1. Proceedings before the President of the Polish Office of Competition and Consumer
Protection (UOKiK)
Anti-trust proceedings instigated on December 28th 2010
On December 28th 2010, the President of the Polish Office of Competition and Consumer Protection
(UOKiK) instigated, ex officio, anti-trust proceedings concerning abuse of dominant position on the
domestic natural gas wholesale market by PGNiG S.A., consisting in:
• inhibiting sale of gas against the interest of trading partners or consumers and
• impeding the development of market conditions necessary for the emergence or development
of competition
by refusing to sell gas fuel under a general gas supply contract to an entrepreneur that intended to
resell the gas, i.e. Nowy Gaz Sp. z o.o. of Warsaw.
In its decision of July 5th 2012, the President of UOKiK found these actions to be anti-competitive
practices, concluded that PGNiG S.A. discontinued those practices as of November 30th 2010, and
imposed on the Company a fine of PLN 60m. On July 24th 2012, PGNiG S.A. filed an appeal against
the decision of the President of UOKiK with the Competition and Consumer Protection Court at the
Regional Court of Warsaw. Under the ruling passed on May 12th 2014, the Competition and
Consumer Protection Court dismissed the appeal in its entirety and ordered PGNiG S.A. to pay the
costs of proceedings to the President of UOKiK. On June 4th 2014, PGNiG S.A. filed an appeal against
the ruling. By the date hereof, the date of the appeal hearing had not been set.

PGNiG Group Consolidated financial statements for the year ended 31 grudnia 2014
(PLNm)
Page 116 of 119
Anti-trust proceedings instigated on February 22nd 2013
On February 22nd 2013, the President of UOKiK instigated anti-trust proceedings concerning
practices employed by PGNiG S.A. which infringe collective consumer interests. The President of the
UOKiK accused PGNiG S.A. of using provisions classified as abusive clauses in contract forms based on
which comprehensive gas fuel supply contracts are concluded. PGNiG S.A. voluntarily agreed to
revise the above contract forms with respect to the questioned clauses. By virtue of a decision of
June 28th 2013, the President of UOKiK resolved not to impose a fine on PGNiG S.A. and obliged the
Company to fulfil its commitment. On July 29th 2014, PGNiG S.A. notified the President of the UOKiK
that it had fully complied with the obligation imposed on it by virtue of the above decision.
Anti-trust proceedings instigated on April 3rd 2013
On April 3rd 2013, the President of UOKiK instigated anti-trust proceedings concerning abuse of
dominant position by PGNiG S.A. on the domestic wholesale and retail natural gas market, consisting
in impeding the development of market conditions necessary for the emergence or development of
competition through:
• limiting the ability of business customers to reduce the ordered volumes of gas fuel and
contractual capacity,
• limiting the ability of business customers to resell gas fuel,
• requiring that business customers define the maximum volume of gas fuel purchased for resale
in the contract,
• refusing to grant wholesale customers the right to a partial change of supplier.
In the course of the proceedings, PGNiG S.A. submitted a motion to the President of the UOKiK for a
commitment decision, in which it voluntarily agreed to revise certain provisions in its contracts with
non-household customers. By virtue of a decision of December 31st 2013, the President of UOKiK
resolved not to impose a fine on the Company and obliged the Company to fulfil its commitment.
PGNiG S.A. performed its obligations set out in the President of UOKiK's commitment decision within
the deadlines specified therein. On August 1st 2014, PGNiG Obrót Detaliczny Sp. z o.o. (PGNiG OD)
took over the existing retail gas trading business from PGNiG S.A. and assumed all the rights and
obligations arising from the decisions issued by the President of UOKiK under the Act on Competition
and Consumer Protection in respect of agreements to which PGNiG OD became a party. PGNiG OD is
in the course of performing the obligation (in the part corresponding to its scope of business)
imposed under the decision of the President of UOKiK dated December 31st 2013.
Proceedings concerning non-compliance with the decision of December 31st 2013
On October 17th 2014, the President of UOKiK commenced administrative proceedings to impose a
fine under Art. 107 of the Act on Competition and Consumer Protection of February 16th 2007 (Dz.U.
No. 50, item 331, as amended) on PGNiG S.A. and PGNiG Obrót Detaliczny Sp. z o.o. on suspicion of a
delay in compliance with Section I).4) of the conclusion of the President of UOKiK's decision of
December 31st 2013. On the same date, PGNiG S.A. and PGNiG OD were requested to provide
explanation within 21 days. In their response, PGNiG S.A. and PGNiG OD presented grounds for their
actions and their position whereunder such actions comply with Section I).4) of the conclusion of the
President of UOKiK's decision of December 31st 2013. By the date hereof, the President of UOKiK had
not issued any final ruling on the case.
40.2. Dispute between PGNiG S.A. and PBG S.A.
On June 27th 2011, PBG S.A. filed with the Regional Court an action against PGNiG S.A. for payment
of a disputed amount, representing the equivalent of liquidated damages for delay in the
performance of a contract, deducted by PGNiG S.A. from PBG's consideration.

PGNiG Group Consolidated financial statements for the year ended 31 grudnia 2014
(PLNm)
Page 117 of 119
The Company believes that the claim is unjustified due to the fact that the deliverable under the
contract handed over by the contractor had material defects, and also due to actual significant delays
in the performance of the contract, which constituted grounds for charging the contractual penalties.
Further, according to PGNiG S.A., the plaintiff's claims became prescribed. On July 27th 2011, the
Company filed its response to the claim, requesting that the action be dismissed in its entirety.
By virtue of its decision of April 9th 2012, the Court resolved to refer the dispute between PBG S.A.
and PGNiG S.A. to mediation. On September 20th 2012, an out-of-court settlement was made
between PGNiG S.A. and PBG S.A. w upadłości układowej (in company voluntary arrangement). As a
result of the settlement, having obtained the approval of its court supervisor, PBG S.A. withdrew in
full the action pending before the Regional Court.
By virtue of its decision of October 31st 2012, the Regional Court discontinued the proceedings.
On June 13th 2012, PBG S.A. was declared insolvent in voluntary arrangement. On September 21st
2012, a Statement of Claims against the insolvent company was lodged with the District Court of
Poznań, Division for Bankruptcy and Recovery Cases, by an attorney-in-fact acting for and on behalf
of PGNiG S.A., which included a claim related to incorrect performance of the contract concerning
the Grodzisk Nitrogen Rejection Unit Construction Project. The claim related to the Grodzisk Nitrogen
Rejection Unit Construction Project was not included in the list of claims. As the date of prescription
of the claims filed to be included in the bankruptcy estate of PBG S.A. approached, PGNiG S.A. took
due care to interrupt the operation of the prescription period related to the claims under the
contract. To this end, on November 5th 2013, the attorney-in-fact of PGNiG S.A. filed with the District
Court for Poznań-Stare Miasto in Poznań a request to call for a conciliation hearing. In this request,
all consortium members, i.e. parties to the contract concerning the Grodzisk Nitrogen Rejection Unit
Construction Project, were called to pay PLN 159m to PGNiG S.A. as compensation for the damage
resulting from improper performance of the EPC contract for delivery of the Grodzisk Nitrogen
Rejection Unit.
On February 18th 2014, PGNiG S.A. was requested to make, by February 25th 2014, a prepayment
for costs of translation of the request to call for a conciliation hearing. The date of the conciliation
hearing was set for September 16th 2014.
On September 16th 2014, the District Court for Poznań–Stare Miasto of Poznań, 10th Commercial
Division, considered PGNiG S.A.'s request to call for a conciliation hearing. Given the incorrect
representation of the party called upon, the Court decided to summon the court supervisor and
postpone the hearing until November 7th 2014.
On November 7th 2014, a hearing was held before the District Court of Poznań - Stare Miasto
concerning PGNiG S.A.'s request to call on PBG S.A. w upadłości układowej (in company voluntary
arrangement) for a conciliation hearing concerning PGNiG S.A.'s claims for compensation under the
contract for the "Grodzisk Nitrogen Rejection Unit Construction Project". Due to the absence of
representation of the court supervisor, despite effective serving of a correct notice of the date of the
hearing, the settlement was not made, which concluded the proceedings with respect to PBG S.A.
As regards the two other entities covered by the request, i.e. Chart Inc. and Thermo Design, the case
has been suspended for a year from March 17th 2014 until PGNiG S.A. makes the prepayment for
costs of translation of the request together with appendices, for the purpose of its delivery to these
entities. The proceedings will be reopened once the prepayment is made, but failure to make the
prepayment within one year from the suspension thereof will result in discontinuance of the
proceedings without interrupting the limitation period for PGNiG S.A.'s claims against the other
contractors.

PGNiG Group Consolidated financial statements for the year ended 31 grudnia 2014
(PLNm)
Page 118 of 119
41. EVENTS SUBSEQUENT TO THE END OF THE REPORTING PERIOD
On January 14th 2015, the Court of Appeal in Warsaw, 6th Civil Division, issued a ruling concerning
the Company’s breach of the terms of the Licence to trade in natural gas with foreign partners in
2007 and 2008. The Court of Appeal's ruling changes the challenged ruling of the Competition and
Consumer Protection Court of the Regional Court of Warsaw, dated October 10th 2013, issued with
respect to the decision of the President of the Energy Regulatory Office of December 16th 2010,
imposing a fine on PGNiG, which the Company subsequently challenged.
The fine was imposed on PGNiG for breach of the terms of the Licence to trade in natural gas with
foreign partners. The breach consisted in failure to observe, in 2007 and 2008, the minimum level of
diversification of foreign sources of gas supplies defined in the Council of Ministers’ Regulation of
October 24th 2000, as a result of which in that period the Company exceeded the maximum share of
gas imported from a single country in total gas imports for each of the two years.
The Court of Appeal decided to change the challenged Decision by reducing the fine imposed on the
Company to PLN 500 thousand, given the small extent of the breach, steps taken by PGNiG to meet
the obligation to diversify gas supply sources, limited diversification opportunities and little harm
involved in the breach. In the remaining part, the appeal was dismissed.
Following the receipt of the written statement of reasons from the Court of Appeal, the Company
will consider further action, if any. By the date hereof, the Company had not received the statement
of reasons.

PGNiG Group Consolidated financial statements for the year ended 31 grudnia 2014
(PLNm)
Page 119 of 119
PGNiG Management Board:
President of the
Management Board Mariusz Zawisza
Vice-President of the
Management Board Jarosław Bauc
Vice-President of the
Management Board Zbigniew Skrzypkiewicz
Vice-President of the
Management Board Waldemar Wójcik
Warsaw, February 19th 2015