consolidated financial statements - 任天 … co., ltd. company group information distribution...
TRANSCRIPT

earnings releases May 27, 2004
CONSOLIDATED FINANCIAL STATEMENTSNintendo Co., Ltd. and Consolidated Subsidiaries
FINANCIAL HIGHLIGHTSYears ended March 31, 2003 and 2004The amounts presented herein are rounded down under one million yen except as otherwise denominated.Numbers in parentheses are negative.
Yen in Millions2003 2004
Net sales 504,135 514,805 Percentage change from previous year (9.1%) 2.1%
Operating income 100,120 107,683 Percentage change from previous year (16.0%) 7.6%
Income before income taxes and extraordinary items 95,040 50,140 Percentage change from previous year (49.1%) (47.2%)
Net income 67,267 33,194 Percentage change from previous year (36.8%) (50.7%)
Net income per share ---------------------------------------------------¥482.15 ¥246.93
Ratio of net income to net worth ------------------------------------------------------7.4% 3.7% Ratio of income before income taxes and extraordinary items to total assets ---------- 8.5% 4.8% Ratio of income before income taxes and extraordinary items to net sales ----------- 18.9% 9.7%
Financial positionTotal assets (1) ----------------------------------------------------------1,085,519 1,010,031Shareholders' equity (2) ---------------------------------------------890,369 890,247Ratio of net worth to total assets (2) / (1) -----------------------------82.0% 88.1% Shareholders' equity per share -------------------------------------------¥6,626.74 ¥6,658.05
Cash flowsCash flows from operating activities ----------------------------------(23,557) 120,072Cash flows from investing activities -----------------------------------36,088 (67,025)Cash flows from financing activities -----------------------------------(102,620) (24,088)Cash and cash equivalents - Ending ----------------------------------748,600 720,114
Scope of consolidation and equity method applicationConsolidated subsidiaries -------------------------------------------------------------------------------19
(of which, newly added … 0 excluded … 0)
Non-consolidated subsidiary with equity method applied ------------------------------------------------1
Affiliates with equity method applied ------------------------------------------------------------------7
(of which, newly added … 1 excluded … 1)
Nintendo Co., Ltd.11-1 Kamitoba hokotate-cho,Minami-ku, Kyoto 601-8501Japan

Nintendo Co., Ltd.
COMPANY GROUP INFORMATION
Distribution channelOther channel
The number of companies(a) Consolidated subsidiaries --------------------------------------------(b) Non-consolidated subsidiary with equity method applied ---------------(c) Non-consolidated subsidiary with equity method non-applied -----------(d) Affiliates with equity method applied ---------------------------------(e) Affiliates with equity method non-applied ----------------------------- 2
19117
C u s t o m e r s
Others(c) Fukuei Co., Ltd.(d) WARPSTAR, Inc.
Entertainment Products (R&D, etc.)(a) ND CUBE Co., Ltd.(a) Brownie Brown Inc.(e) Ape inc.
Entertainment Products (Distribution)(a) Nintendo of America Inc.(a) Nintendo of Canada Ltd.(a) Nintendo of Europe GmbH(a) Nintendo France S.A.R.L.(a) Nintendo Benelux B.V.(a) Nintendo España, S.A.(a) Nintendo Australia Pty. Ltd.(a) Nintendo Phuten Co., Ltd.(a) Nintendo Services USA, Inc.(d) Pokémon USA, Inc.(d) iQue Ltd.(d) iQue (China) Ltd.
Others(a) NES Merchandising, Inc.(a) NHR Inc.(a) HFI Inc.(a) SiRAS.com Inc.
Entertainment Products (R&D, etc.)(a) Nintendo Technology Development Inc.(a) Nintendo Software Technology Corporation(a) Rare Acquisition Inc.(a) Retro Studios, Inc.(b) A/N Software Inc.(d) Silicon Knights Inc.(d) iKuni Inc.(e) Midway/Nintendo Inc.
N i n t e n d o C o . , L t d .
Nintendo Co., Ltd. ("the Company") and its related companies, which are composed of the Company, twenty-onesubsidiaries, and nine affiliates as of March 31, 2004, operate manufacturing and distribution of electronicentertainment products as a major business. Chart of business by the Company and its related companies are asfollows.
Entertainment Products & Others(Distribution)(d) The Pokémon Company
- 1 -

Nintendo Co., Ltd.
MANAGEMENT POLICY
1. Basic management policy
2. Basic policy of profit distribution
3. View and policy of stock trading unit reduction
4. Targeted management index
Nintendo Co., Ltd. ("the Company") and its consolidated subsidiaries (together with the Company, "Nintendo")
strive to create new and unique hardware systems and interactive video games, in both the home entertainment and
handheld gaming environments while maintaining a robust business structure. Nintendo seeks to provide
consumers with a "world of entertainment", which is both innovative and fun with creative elements they have
never experienced.
It is the Company's basic policy to internally provide the capital necessary to fund future growth, including capital
investments, and to maintain a strong and liquid financial position in preperation for sudden changes in the
business environment and intensified competition, while in regard to direct profit returns to our shareholders,
stable dividend payouts are to be sustained, taking into account profit levels and payout ratios of each accounting
period.
Estimated year-end cash dividend per share for the year ended March 31, 2004 is 70 yen (annual cash dividend at
140 yen). In terms of profit appropriation for the upcoming period, in accordance with the policy stated above,
cash dividend per share is estimated to be within the range of 140 yen and 270 yen (payout ratio of 50% based on
projected consolidated net income per share). Note that it will fluctuate within this range based on actual
consolidated net income.
Retained earnings are maintained for effective use in research of new technology and development of new
products, capital investments, enhancement of selling power, and common stock buyback whenever necessary.
To expand the number of private investors and to make the Company's common stocks more widely available, the
Company changed the number of stock trading units from 1,000 shares to 100 shares in 1991. A further reduction
of stock trading units would require a significant amount of cost and will require in-depth consideration from cost-
effectiveness and stock liquidity viewpoints.
In the video game industry, it is essential to provide new and entertaining products consistently. Upon
accomplishing this, the Company aims to improve its corporate value by sustaining robust growth and increasing
profit.
Because the Company deals with entertainment products, which by nature hold many uncertainties in terms of
development, and operates amid intense competition, flexible business decisions are made without being
constrained by any specific management index.
- 2 -

Nintendo Co., Ltd.
5. Medium and long term management strategy and challenges
6. Corporate governance
(1) Basic perspective on corporate governance
It has been twenty years since Nintendo's "Family Computer System" was first introduced in Japan. Today, it has
become significantly more difficult than before to develop software that can satisfy demanding users around the
world. Nintendo, which engages in a software driven software-hardware combined business, will strive to develop
software which is easily accessible to anyone even without prior experience or knowledge and, at the same time,
which includes profound game plays so that all players, regardless of their game skills, can play to their heart's
content. To achieve that goal, Nintendo will utilize the wide variety of franchise characters and excellence in
development built up over the years, strengthen the R&D framework including collaboration with third party
developers, seek out new talent through the Nintendo Game Seminar, and devote itself to expand future revenue
by creating more unique products that cannot be characterized as mere extensions of existing concepts such as
"NINTENDO DS" (tentative), a new handheld console that is completely fresh in terms of idea, designed to
provide an innovated gaming experience like never before.
The Company must be governed continuously for the long term in a manner that will maximize corporate
value, and at the same time, take into consideration not only the shareholders' best interests but also the
interests of other stakeholders such as customers, business partners, employees, and local communities. In
addition, it strives to establish and make enhancements to corporate ethics and the corporate governance
system for higher transparency and soundness.
As a management organization system, the Company adopts the Board of Auditors system which has been
specified in the commercial code. Due to the fact that the Company engages in an unique business, this present
system is believed optimal in terms of carrying out operations.
- 3 -
Nintendo Co., Ltd.
(2) Implemented measures
In order for the Company to respond promptly to changes in the business environment, the term for directors is
set at one year. The candidates are appropriately selected by the Board of Directors, which serves as a decision
making body concerning significant matters including business judgements. Furthermore, the Management
Committee which is comprised of six representative directors has been established, enabling swift decision
making to enforce administrative action. The Board of Auditors serves as an auditing body. The Audit Office
is established to assist and support this body. In addition, no business relationships exist between the Company
and outside auditors.
Regarding internal auditing, the Internal Auditing Department is established directly under the president's
jurisdiction. From a fair and unbiased standpoint that is independent from the operating division, it verifies the
adequacy and effectiveness of the internal management framework of the Company's departments and its
consolidated subsidiaries, and advises or proposes measures to modify or amend any significant issues. In
addition, it adequately grasps the present state of any modification process and audits post-modified conditions.
As for the activities of the Internal Auditing Department in the recent year, study sessions were held to
communicate awareness relating to the necessity of internal control, internal auditing of each of the Company's
departments and its consolidated subsidiaries was carried out, and a management system has been established
in which audit reports received from Internal Auditing Departments of subsidiaries can be validated.
Significant legal issues and events concerning compliance are consulted with lawyers or other professionals in
order to conduct necessary review. Furthermore, in addition to ordinary auditing, significant accounting issues
are consulted and reviewed with accounting auditors whenever necessary.
As part of risk management, the Compliance Committee, an organization with the general manager of the
General Affairs Division as chairperson, has been established. Efforts are made to promote ethics, fairness and
compliance with regard to business activities which include inviting professionals from outside the company as
lecturers to host company seminars designed for members of the board and employees.
- 4 -
Nintendo Co., Ltd.
OPERATING RESULTS
1. Review of operations
During the fiscal year ended March 31, 2004, the Japanese economy began to show indications of an upturn.
Steady exports to the United States and China contributed to the improvement in corporate revenue and increase
in capital investments. As for consumer spending, despite an overall lack of momentum, there was strong demand
for digital home electric appliances. Relating to overseas economies, in the wake of the conflict in Iraq, the U.S.
economy continued to expand steadily due to major tax cuts, low interest rates, and steady consumer spending
resulting in part from the recovery of stock prices. In Europe, the appreciated Euro and record high temperatures
throughout the continent last summer caused a temporary economic downward trend. Although, since the
beginning of 2004, the economy gradually started to turnaround as production began to pick up in response to
worldwide economic recovery.
In the video game industry, while hardware pricing competitions continue to take place globally, software unit
sales in the domestic market continued to show a tendancy to decline. Furthermore, the U.S. market, which
maintained a high growth rate throughout the past, began to show signs of a slowdown, leaving the business
environment in a crucial situation.
Under such circumstances, Nintendo has focused on expanding sales of its home entertainment console
NINTENDO GAMECUBE, while introducing new gaming ideas under the theme "connectivity and integration"
with its handheld system GAME BOY ADVANCE, as well as developing fascinating software that can be
enjoyed by anyone around the world regardless of age, sex, or cultural background.
As a result, consolidated net sales for the fiscal year ended March 31, 2004 were 514.8 billion yen, including
overseas sales of 382.4 billion yen, which accounted for 74.3% of total sales. Income before income taxes and
extraordinary items was 50.1 billion yen resulting from revaluation of foreign currency assets inflicting 67.8
billion yen in foreign exchange loss. Net income was 33.1 billion yen.
With respect to sales by business category, in the electronic entertainment products division, the GAME BOY
ADVANCE software titles "Super Mario Advance 4" and "Donkey Kong Country" were appreciated by a wide
range of users and sold more than a million copies each this period. "Pok é mon Ruby/Sapphire" which were
released in Europe last July following their release in the United States and Japan, sold more than 6 million
copies worldwide during the previous period and has surpassed the 6 million mark in worldwide unit sales this
period as well. In Japan, "Pokémon Fire Red/Leaf Green", which provide a whole new gaming experience through
wireless communication only available on handheld consoles, and the "FAMICOM MINI" series, which enables
users to enjoy FAMICOM software on the GAME BOY ADVANCE, selling more than a million copies soon
after launch, both became sensations. As a result, hardware sold excellently worldwide, particularly GAME BOY
ADVANCE SP, which was released last spring.
As for console related products, despite facing a crucial situation in the first half of the period, steady sales were
reported as a result of the markdown initiated on hardware worldwide since last September and the launch of
various titles during the Christmas shopping season where demand is expected to be at its highest, including latest
titles from popular franchises such as "Mario Kart: Double Dash!!" and "Mario Party 5", "Pokémon Colosseum",
which offers players to experience vigorous battles with Pokémon they have nurtured in exclusive GAME BOY
ADVANCE "Pokémon" titles, and "Donkey Konga", a family oriented rhythm action game that is played with
"Taru-Konga" (an instrument style game controller).
- 5 -

Nintendo Co., Ltd.
2. Annual Outlook
FINANCIAL POSITION
In the future video game industry, it is likely that software development dependant on advancements in audio-
visual technology will no longer be a key element in creating new and exciting video game software that
mesmerizes people around the world.
Under such circumstances, Nintendo will continue to focus on developing software that can be enjoyed by a broad
audience. In addition, aiming for a launch by the end of the year, development is underway for a new handheld
device equiped with two LCD screens, two CPUs, multi-protocol wireless communication, touch screen, and
voice recognition. "NINTENDO DS" (tentative) holds a completely different conception which will provide an
unprecidented interactive entertainment experience that cannot be matched by existing systems. Furthermore,
"club.nintendo", an online membership site introduced in Japan last October, with many users already signed up,
will be actively utilized alongside elaborate sales promotion activities to expand revenue.
Total consolidated net sales in the electronic entertainment products division were 512.2 billion yen, while sales
in the other products division (playing cards, karuta, etc.) were 2.5 billion yen.
With respect to geographic segment information, sales in Japan were 361.7 billion yen including inter-segment
sales of 224.0 billion yen. Operating income was 92.9 billion yen. Sales in the Americas were 252.0 billion yen
including inter-segment sales of 1.7 billion yen. Operating income was 13.1 billion yen. Sales in Europe were
120.1 billion yen including inter-segment sales of 0.0 billion yen. Operating income was 2.9 billion yen.
During the fiscal year ended March 31, 2004, the Company bought back 645,200 shares of treasury stocks worth
5.3 billion yen.
Inventory significantly decreased while cash and deposits, and investments in securities increased. Revaluation offoreign currencies resulting from the appreciated yen mainly caused total assets to decrease by 75.4 billion yencompared to the previous fiscal year-end to 1,010 billion yen. Total liabilities decreased by 75.4 billion yencompared to the previous fiscal year-end due to decrease in accounts payable and accrued income taxes.Shareholders' equity decreased by 0.1 billion yen compared to the previous fiscal year-end as translationadjustments served as a counterbalance to profit.
The ending balance of Cash and cash equivalents (collectively, Cash) as of March 31, 2004 was 720.1 billion yen(748.6 billion yen as of March 31, 2003). Net increase (decrease) of Cash and contributing factors during thefiscal year ended March 31, 2004 are as follows:
- 6 -
Nintendo Co., Ltd.
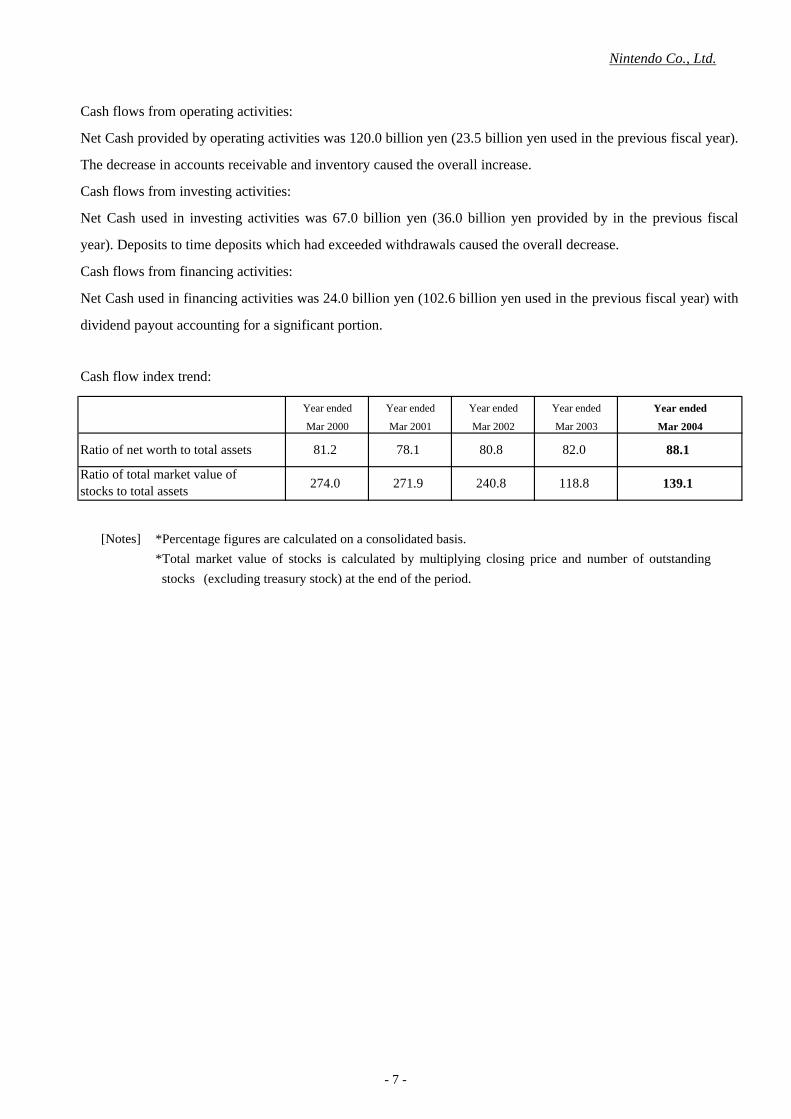
Cash flow index trend:
Year ended
271.9 139.1
78.1
Mar 2001
80.8
Mar 2004
118.8
88.1
Year ended
Ratio of net worth to total assets
Mar 2003
82.0
Mar 2000
81.2
Mar 2002
Year ended Year ended
[Notes]
240.8
Year ended
274.0Ratio of total market value ofstocks to total assets
*Percentage figures are calculated on a consolidated basis.*Total market value of stocks is calculated by multiplying closing price and number of outstanding*stocks (excluding treasury stock) at the end of the period.
Cash flows from operating activities:
Net Cash provided by operating activities was 120.0 billion yen (23.5 billion yen used in the previous fiscal year).
The decrease in accounts receivable and inventory caused the overall increase.
Cash flows from investing activities:
Net Cash used in investing activities was 67.0 billion yen (36.0 billion yen provided by in the previous fiscal
year). Deposits to time deposits which had exceeded withdrawals caused the overall decrease.
Cash flows from financing activities:
Net Cash used in financing activities was 24.0 billion yen (102.6 billion yen used in the previous fiscal year) with
dividend payout accounting for a significant portion.
- 7 -

Nintendo Co., Ltd.
CONSOLIDATED BALANCE SHEETS As of March 31, 2003 and 2004
Yen in Millions
Change[Assets]
Current assets: % %
Cash and deposits ------------------------------------748,650 767,270 18,619
Notes and trade accounts receivable -------------------49,085 28,493 (20,591)
Marketable securities --------------------------------8,266 17,375 9,108
Inventories ----------------------------------------104,524 30,955 (73,569)
Deferred income taxes -----------------------------------------31,158 24,911 (6,246)
Other current assets ----------------------------------------------33,088 24,784 (8,303)
Allowance for doubtful accounts -----------------------(5,463) (3,028) 2,435
969,309 89.3 890,761 88.2 (78,547)
Fixed assets:
Property, plant and equipment
Buildings and structures -----------------------------21,959 19,918 (2,040)
Machinery, equipment and automobiles -----------------------------1,804 1,292 (512)
Furniture and fixtures -----------------------------2,463 1,948 (514)
Land --------------------------------------------------33,134 31,925 (1,209)
Construction in progress ------------------------- 7 - (7)
59,369 5.5 55,084 5.5 (4,284)
Intangible assets
Software etc. ------------------------------------- 225 0.0 245 0.0 20
Investments and other assets
Investments in securities ----------------------------38,551 53,866 15,315
Deferred income taxes ----------------------------------14,712 9,189 (5,522)
Other investments and other assets -------------------------------------------------3,407 926 (2,481)
Allowance for doubtful accounts -------------------- (55) (43) 12
56,616 5.2 63,939 6.3 7,323
116,210 10.7 119,269 11.8 3,059
Total -------------------------------------------------1,085,519 100.0 1,010,031 100.0 (75,488)
2003 2004
- 8 -

Nintendo Co., Ltd.
As of March 31, 2003 and 2004
Yen in Millions
Change[Liabilities]
Current liabilities: % %
Notes and trade accounts payable ----------------------------96,475 57,945 (38,530)
Accrued income taxes ----------------------------------------38,913 11,165 (27,748)
Reserve for bonuses --------------------------------------------1,672 1,712 39
Other current liabilities ---------------------------------------------------------48,988 42,423 (6,564)
186,050 17.2 113,246 11.3 (72,803)
Non-current liabilities:
Non-current accounts payable --------------------------------135 602 467
Reserve for employee retirement and severance benefits Reserve for directors retirement and severance benefits
8,946 0.8 6,304 0.6 (2,642)
Total liabilities --------------------------------------------194,996 18.0 119,550 11.9 (75,445)
153 0.0 232 0.0 79
[Shareholders' equity]
Common stock ---------------------------------------------10,065 0.9 10,065 1.0 -
Additional paid-in capital -----------------------------------------11,584 1.1 11,584 1.1 -
Retained earnings ---------------------------------950,262 87.5 964,524 95.5 14,262
Unrealized gains on other securities ------------------------------2,254 0.2 6,650 0.7 4,395
Translation adjustments -------------------------------------------(2,275) (0.2) (15,677) (1.6) (13,402)
Treasury stock, at cost ---------------------------------------------(81,521) (7.5) (86,898) (8.6) (5,377)
Total shareholders' equity ------------------------------890,369 82.0 890,247 88.1 (121)
Total --------------------------------------------------------1,085,519 100.0 1,010,031 100.0 (75,488)
2003 2004
(31)
Minority interests --------------------------------------------[Minority interests]
7,070
1,740
3,992
1,709
(3,078)
- 9 -

Nintendo Co., Ltd.
CONSOLIDATED STATEMENTS OF INCOME Years ended March 31, 2003 and 2004
Yen in Millions
% % %
Net sales -----------------------------------------------504,135 100.0 514,805 100.0 10,669 2.1
Cost of sales -------------------------------------------308,525 61.2 307,233 59.7 (1,292) (0.4)
Gross margin --------------------------------------195,609 38.8 207,572 40.3 11,962 6.1
Selling general and administrative expenses
Operating income -----------------------------------100,120 19.9 107,683 20.9 7,562 7.6
Other income
Interest income --------------------------------------15,942 8,999 (6,942)
Other ------------------------------------------------2,340 2,391 50
Total other income --------------------------------18,283 3.6 11,391 2.2 (6,892) (37.7)
Other expenses
Sales discount ---------------------------------------387 396 9
Equity in losses of non-consolidated subsidiary and affiliates
Foreign exchange loss --------------------------------22,620 67,876 45,256
Other ---------------------------------------------------278 661 382
Total other expenses ---------------------------------23,363 4.6 68,934 13.4 45,570 195.0
Income before income taxes and extraordinary items
Extraordinary income ------------------------------------19,218 3.8 3,499 0.7 (15,719) (81.8)
Extraordinary loss ---------------------------------------943 0.2 674 0.1 (269) (28.5)
Income before income taxes and minority interests
Provision for income taxes and enterprise taxesIncome taxes deferred ------------------------------------------------954 0.2 7,393 1.5 6,438 674.3
Minority interests -------------------------------------------74 0.0 79 0.0 4 5.6
Net income ----------------------------------------------67,267 13.3 33,194 6.4 (34,073) (50.7)
(32,719) (72.7)
113,315 22.5
45,018 9.0 12,298 2.4
52,965 10.3
19.4
(44,900) (47.2)
(60,350) (53.3)
95,040 18.9 9.750,140
77 - (77)
4,399 4.6
2003 2004 Change
95,488 18.9 99,888
- 10 -
Nintendo Co., Ltd.
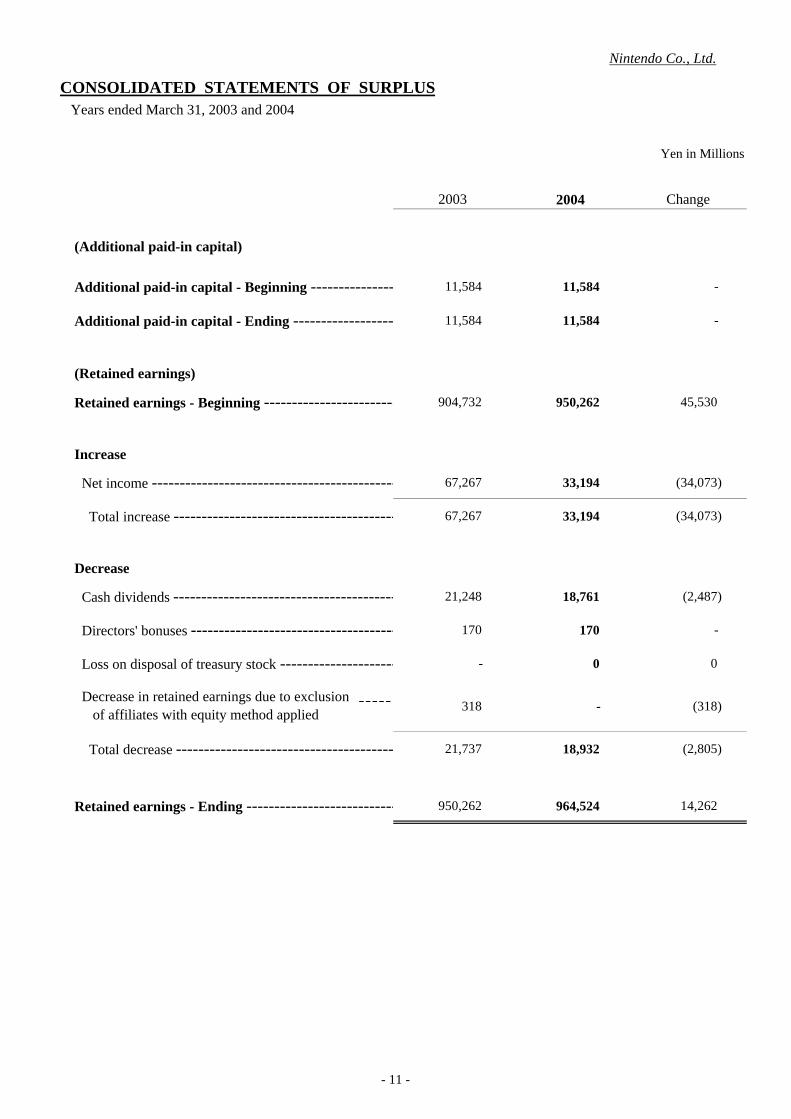
CONSOLIDATED STATEMENTS OF SURPLUS Years ended March 31, 2003 and 2004
Yen in Millions
(Additional paid-in capital)
Additional paid-in capital - Beginning --------------------------11,584 11,584 -
Additional paid-in capital - Ending ----------------------------------11,584 11,584 -
(Retained earnings)
Retained earnings - Beginning ---------------------------- 904,732 950,262 45,530
Increase
Net income ----------------------------------------------------------67,267 33,194 (34,073)
Total increase ------------------------------------------------------67,267 33,194 (34,073)
Decrease
Cash dividends -----------------------------------------------------------21,248 18,761 (2,487)
Directors' bonuses --------------------------------------------------170 170 -
Loss on disposal of treasury stock ----------------------------------------------------------- - 0 0
318 - (318)
Total decrease ----------------------------------------------------21,737 18,932 (2,805)
Retained earnings - Ending -----------------------------------950,262 964,524 14,262
2003 2004 Change
Decrease in retained earnings due to exclusion of affiliates with equity method applied
- 11 -

Nintendo Co., Ltd.
CONSOLIDATED STATEMENTS OF CASH FLOWS
Yen in Millions
2003 2004Ⅰ Cash flows from operating activities:
Income before income taxes and minority interests -------------------------------------------------- 113,315 52,965Depreciation and amortization ----------------------------------------------- 4,712 3,328Increase (decrease) in allowance for doubtful accounts ----------------------------------- 105 (1,955)Increase (decrease) in reserve for employee retirement and severance benefits 2,884 (2,708)
Interest and dividends income ----------------------------------------------- (16,352) (9,514)Interest expenses ------------------------------------------------------------- 1 0Foreign exchange loss (gain) -------------------------------------------------- 20,225 54,166Unrealized loss on investments in securities ----------------------------------------------------- 864 573Equity in losses (earnings) of non-consolidated subsidiary and affiliates ------------------------------------ 77 (181)Gain on sales of investments in affiliates -------------------------------------------- (19,082) - Decrease (increase) in notes and trade accounts receivable ------------------------------------- (4,841) 16,070Decrease (increase) in inventories -------------------------------------------- (58,671) 70,805Increase (decrease) in notes and trade accounts payable -------------------------------------- (15,445) (33,527)Increase (decrease) in consumption taxes payable ---------------------------------------- 592 (221)Directors' bonuses paid ------------------------------------------------------ (170) (170)Other, net ------------------------------------------------------------------- (31,738) 822 Sub-total (3,520) 150,452Interest and dividends received ---------------------------------------------- 16,500 9,566Interest paid ----------------------------------------------------------------- (1) (0)Income taxes paid ----------------------------------------------------------- (36,536) (39,945) Net cash provided by (used in) operating activities (23,557) 120,072
Ⅱ Cash flows from investing activities:
Increase in time deposits ----------------------------------------------------- (161,848) (106,587)Decrease in time deposits ---------------------------------------------------- 190,693 56,192Payments for acquisition of marketable securities ------------------------------ (37,300) (21,446)Proceeds from sale of marketable securities ----------------------------------- 38,535 10,650Payments for acquisition of property, plant and equipment ---------------------- (2,138) (1,909)Proceeds from sale of property, plant and equipment ------------------------ 364 1,680Payments for investments in securities --------------------------------------- (17,527) (13,500)Proceeds from investments in securities --------------------------------------- 8,659 5,014Sales of business entities ------------------------------------------------------ 17,265 1,008Other, net ------------------------------------------------------------------- (614) 1,873 Net cash provided by (used in) investing activities 36,088 (67,025)
Ⅲ Cash flows from financing activities:
Payments for acquisition of treasury stock ------------------------------------- (81,387) (5,346)Cash dividends paid --------------------------------------------------------- (21,232) (18,745)Other, net ---------------------------------------------------------------------- - 3 Net cash provided by (used in) financing activities (102,620) (24,088)
(24,206) (57,444)
Ⅴ Net increase (decrease) of cash and cash equivalents ------------------- (114,295) (28,486)
Ⅵ Cash and cash equivalents - Beginning ---------------------------------------- 863,116 748,600
(220) -
Ⅷ Cash and cash equivalents - Ending ------------------------------------- 748,600 720,114
Ⅶ Decrease in cash and cash equivalents due to change in scope of consolidation
Ⅳ Effect of exchange rate changes on cash and cash equivalents
Years ended March 31, 2003 and 2004
- 12 -

Nintendo Co., Ltd.
BASIS OF CONSOLIDATED FINANCIAL STATEMENTS
1. Scope of consolidation
Consolidated Nintendo of America Inc. NES Merchandising, Inc. NHR Inc. HFI Inc.
subsidiaries Nintendo of Canada Ltd. Nintendo of Europe GmbH Nintendo France S.A.R.L.
Nintendo España, S.A. Nintendo Benelux B.V. Nintendo Australia Pty. Ltd.
Rare Acquisition Inc. Nintendo Phuten Co., Ltd.
Nintendo Technology Development Inc. Nintendo Software Technology Corporation
SiRAS.com Inc. Nintendo Services USA, Inc. Retro Studios, Inc.
ND CUBE Co., Ltd. Brownie Brown Inc.
Non-consolidated Fukuei Co., Ltd. A/N Software Inc.
subsidiaries
2. Scope of equity method companiesNon-consolidated A/N Software Inc.
subsidiary withequity method applied
Affiliates with The Pokémon Company WARPSTAR, Inc. Silicon Knights Inc.
equity method applied iKuni Inc. Pokémon USA, Inc. iQue Ltd.
iQue (China) Ltd.
3. Annual consolidated accounting period
4. Accounting policiesA valuation basis and method of important assets(A) Securities
Held-to-maturity bonds Amortized cost method (by straight-line method)Other securities
Marketable other securities Market price method, based on the market value at balance sheet date
Non-marketable other securities Cost, determined by the moving average method
(B) DerivativesMarket price method
(C) InventoriesLower of cost, determined by the moving average method, or market
(1)
19
2
(Losses are charged to income, and unrealized gains, net of tax arecharged to shareholders' equity.)
1
7
Above two subsidiaries are both small in size and are excluded from consolidation as they do not have asignificant impact on the consolidated financial statements in respect of combined assets, sales, net profit,and retained earnings.
iQue (China) Ltd. which was established during the previous fiscal year is included within the scope ofequity method affiliates because it has begun operating as of this consolidated accounting period. MarigulManagement Inc., because of liquidation, is excluded from the scope of equity method affiliates.
With respect to (equity method applied) companies with different year-end from consolidated year-end(i.e., March 31), their financial statements are used as they are.
Although fiscal year-end of Nintendo Phuten Co., Ltd. and Retro Studios, Inc. is December 31, which is different from consolidatedyear-end, their financial statements through that period are used for consolidation as the variance of year-end is within three months(so-called three month rule applied). Important transactions between their year-end and March 31 are reconciled for consolidation.
- 13 -

Nintendo Co., Ltd.
Depreciation method for fixed assets(A) Tangible assets
The Company and itsdomestic consolidated subsidiaries
Overseas consolidated subsidiaries
(B) Intangible assets
Allowance and reserve(A) Allowance for doubtful accounts
(B) Reserve for bonuses
(C) Reserve for employee retirement and severance benefits
(D) Reserve for directors retirement and severance benefits
Translation basis of assets and/or liabilities denominated in foreign currencies
Lease transactions
Other(A) Consumption tax
(5)
(4)
(6)
(2)
(3)
Declining balance method (Some equipment are depreciated overeconomic useful lives.)Buildings (exclusive of structures) acquired on or after April 1,1998 aredepreciated using the straight-line method.
Straight-line method over the estimated useful lives of the assetsEstimated useful lives of the principal assets: Buildings and structures: 3 to 60 years
Straight-line methodAs for software for the in-house use, straight-line method based on usableperiod (mainly five years) is applied.
The Company and its domestic consolidated subsidiaries are calculating the allowance for general accounts receivables withactual percentage of credit losses to provide against losses on bad debts, as well as calculating the allowance for eachdoubtful account with an estimated amount of probable bad debts. Overseas consolidated subsidiaries are calculating theallowance for each doubtful account with an estimated amount of probable bad debts.
The Company is calculating the reserve for bonuses with estimated prorated amounts to be paid.
The Company and certain consolidated subsidiaries are calculating the reserve for employee retirement and severancebenefits with actuarially calculated amounts at the end of the consolidated accounting period, on the basis of the cost ofretirement benefits and plan assets at the end of the fiscal year.Prior service cost and actuarial calculation difference are processed collectively, mainly in the accrued year.
The Company is calculating the reserve for directors retirement and severance benefits with estimated amounts to be paid atthe year-end, based on the Company's internal rules.
Receivables and/or payables denominated in foreign currencies are translated into Japanese yen by the spot exchange rates at theend of the fiscal year. Exchange gains or losses are charged to income. With respect to financial statements of overseasconsolidated subsidiaries, balance sheets are translated into Japanese yen at exchange rates in effect at the balance sheet date forassets and liabilities. The average exchange rates for the fiscal year are used for translation of revenue and expenses. Thedifference resulting from translation in this manner are shown as Minority Interests and Translation Adjustments in Shareholders'equity.
Finance leases that are deemed to transfer ownership of the leased assets to lessees are to be capitalized, while other financeleases are accounted for as operating lease transactions.
The consumption tax and the provincial consumption tax are recorded as asset / liability when they are paid / received.
- 14 -

Nintendo Co., Ltd.
(B) Impairment on Fixed Assets
5. Valuation of assets and liabilities of consolidated subsidiaries
6. Profit appropriation
7. Funds in consolidated statements of cash flows
NOTES
Consolidated balance sheets information; Yen in Millions
Accumulated depreciation of tangible assets
Consolidated statements of income information; Yen in Millions
Research and development costs
Consolidated statements of cash flows information;Reconciliation between cash and cash equivalents - ending and the amount shown on consolidated balance sheets
Yen in Millions
Cash and deposits accountTime deposits (over 3 months)Cash and cash equivalents - Ending
2003
2003 2004
34,988 35,775
2004
14,598 15,825
2003 2004
748,650 767,270(47,156)720,114
(50)748,600
The Company adopted the Financial Accounting Standard on Impairment on Fixed Assets ("Views on Establishment ofAccounting Standards for Impairment on Fixed Assets," issued by the Business Accounting Council on August 9, 2002) andits application guidelines No.6 issued on October 31, 2003. As these Accounting Standards may be applied to consolidatedfinancial statements from the consolidated accounting year ending March 31, 2004, we are applying the standards and theguidelines from the year under review. Upon adopting these accounting standards, impairment losses are included in"Other" of Other expenses, and the effect on Income before income taxes and extraordinary items, and Income beforeincome taxes and minority interests is minor.In addition, total impairment losses have been directly deducted from the figures of each asset category based on the revisedConsolidated Financial Statement Regulations.
Valuation of assets and liabilities of consolidated subsidiaries are under market price method.
The consolidated statements of surplus in respect of appropriated profit of consolidated companies are created accordingly toappropriated profit which has settled during the annual accounting period.
Funds (cash and cash equivalents) in consolidated statements of cash flows cover cash on hand, deposits which are able to bewithdrawn at any time, and short-term investments which are able to be cashed easily, with little risk of value fluctuation, for which theterm of redemption come within three months from the acquisition date.
- 15 -

Nintendo Co., Ltd.
SEGMENT INFORMATION
1. Segment information by business categories
2. Segment information by seller's locationYen in Millions
3. Sales to overseas customersYen in Millions
23 109,107 107,683(1,423) Operating income 92,924 13,172 2,987
514,805(225,839) Cost of sales and selling, general and administrative expenses
268,797 238,851 117,145 6,742 631,536 407,121(224,415)
(225,839)
Total 361,721 252,024 120,132 6,765 740,644
6,765 514,805 514,805
(2) Inter segment sales 224,084 1,750 4 - 225,839 -
(1) Sales to third parties 137,636 250,273 120,128
Net sales
DomesticThe
Americas Europe1. Net sales and operating income
10,458
11,208251,143 120,136
Domestic
131,768
Year ended March 31, 2003
1. Net sales and operating income
Cost of sales and selling, general and administrative expenses
Total
(2) Inter segment sales
Net sales
(1) Sales to third parties
ConsolidatedThe
Americas Europe Other Total
Eliminationsor unallocated
assets
Other Total
Eliminationsor unallocated
assets Consolidated
- 353,328
85,750
245,723
2,397
248,120
237,662
Operating income (loss)
Year ended March 31, 2004
Sales to overseas customers
Europe
121,197 9,177246,879
Year ended March 31, 2003 The Americas
382,488
Year ended March 31, 2004 The Americas
49.0%
Consolidated net sales
Percentage of sales to overseas customers to consolidated net sales
Sales to overseas customers
Europe Other
Total
Total
377,254
504,135
24.0% 1.8% 74.8%
Other
Consolidated net salesPercentage of sales to overseas customers to consolidated net sales
514,805
48.8% 23.3% 2.2% 74.3%
350,911
482,680
396,929
504,135
5,885 761,474
5,454121,188
19 -
121,208 857,463
120,997
5,454
3,908 1,179,609
211
404,014
100,12095,989(431)
2. Assets 924,055 166,493 85,152
2,374 1,046,101 1,010,031(36,070)2. Assets 854,881 145,820 43,025
-
-
(353,328)
1,085,519(94,089)
(353,328)
(357,459)
4,131
504,135
504,135
Because the company operates predominantly in one industry segment which is accounted for over 90% of total sales, operating incomeand total assets, this information is not applicable to our business.
- 16 -

Nintendo Co., Ltd.
LEASE TRANSACTIONS INFORMATION
This information is excluded, since it is disclosed on EDINET.
TAX EFFECT ACCOUNTING INFORMATION
Year ended March 31, 2004Yen in Millions
1. Significant components of deferred tax assets and liabilities are summarized as follows
Deferred tax assets:
Inventory - write-downs and elimination of unrealized profit
Other A/P and accrued expenses
Research and development costs
Unrealized loss on land
Reserve for employee retirement and severance benefits
Unrealized loss on investments in securities
Depreciation
Allowance for doubtful accounts
Other
Gross deferred tax assets
Valuation allowance
Total deferred tax assets
Deferred tax liabilities:
Unrealized gains on other securities
Undistributed retained earnings on overseas subsidiaries
Other
Total deferred tax liabilities
Net deferred tax assets
2. Reconciliation of the statutory tax rate and the effective tax rate
Statutory tax rate
Increase (decrease) in taxes resulting from:
Expenses not deductible for tax purposes
Extra tax deduction on expenses for research
Differences in consolidated foreign subsidiaries' tax rate
Other
Effective tax rate
2004
8,149
34,041
11,3519,2634,941
1,021
1,4171,6572,571
1,350
41,723
(4,545)
(747)
(6,406)
(1,113)
(1,276)
40,447
(1.2%)37.2%
42.0%
0.4% (1.4%) (2.6%)
- 17 -

Nintendo Co., Ltd.
SECURITIES INFORMATION
Ⅰ As of March 31, 2003Yen in Millions
1. Marketable other securities
(book value exceeds acquisition cost)Stocks
(book value does not exceed acquisition cost)Stocks
Total
2. Contents and book value of major non-marketable securities
(1) Held-to-maturity bonds Commercial paper
(2) Other securitiesPreferred subscription certificateUnlisted bonds
3. Held-to-maturity securities and held-to-maturity bonds
Commercial paperCorporate bonds
Total
Ⅱ As of March 31, 2004Yen in Millions
1. Marketable other securities
(book value exceeds acquisition cost)StocksBonds
Sub-Total
(book value does not exceed acquisition cost)StocksBonds
Sub-Total Total
2. Contents and book value of major non-marketable securities
(1) Held-to-maturity bonds Commercial paper
(2) Other securitiesPreferred subscription certificateUnlisted bonds
3. Held-to-maturity securities and held-to-maturity bonds
Commercial paperGovernment bonds, etc.
Total
3,293 3,281 (12)
20,498 31,694 11,195
Difference
3,78911,727
11,000
1,445
Acquisition Cost Book Value
(306)3,482
Due in one yearor less
Due after one yearthrough five years
DifferenceAcquisition Cost
8,266
8,266
19,427
248
1,070
Book Value
1,07230,621
220
11,193
(27)
1
17,375
Due in one yearor less
Due after one yearthrough five years
3,536
- 17,375
- 7,8907,890
13,172
6,000
8,266
- 6,0006,000
-
15,516
1,13816,654
11,000
3,541 3,501 (39)
17,375
24,039 35,195 11,156
- 18 -

Nintendo Co., Ltd.
DERIVATIVE TRANSACTIONS INFORMATION
This information is excluded, since it is disclosed on EDINET.
RETIREMENT AND SEVERANCE BENEFITS INFORMATION
Outline of retirement benefit plan
Ⅰ As of March 31, 2003 Yen in Millions
1. Retirement benefit obligation at the end of yeara. Retirement benefit obligation
b. Plan assets
c. Unfunded retirement benefit obligation
d. Unrecognized actuarial difference
e. Unrecognized prior service cost (decrease of obligation)
f. Net pension liability recognized in the consolidated balance sheet
g. Reserve for employee retirement and severance benefits
2. Retirement benefit cost for the yeara. Service cost
b. Interest cost
c. Expected return on plan assets
d. Amortization of actuarial difference
e. Amortization of prior service cost
f. Retirement benefit cost
g. Other
h. Total
3. Basis of calculationa. Method of attributing benefits to years of service Straight-line basis
b. Discount rate 1.0% to 6.5%
c. Expected return rate on plan assets 0.0% to 8.0%
d. Amortization years of prior service cost one to ten years
e. Amortization years of actuarial difference
1,118
812
(7,070)
(7,070)
547
(255)
217
Mainly fully amortized in the same fiscal year as incurred
521
4,863
2003
1,124
(18,055)
9,053
(9,002)
4,341
2,706
The Company to file consolidated financial statements has approved pension scheme and lump-sum severance payments plan asdefined benefit plan. Certain consolidated subsidiaries have defined contribution plan as well as defined benefit plan. It may alsopay extra retirement allowance to employees who have distinguished services.
- 19 -

Nintendo Co., Ltd.
Ⅱ As of March 31, 2004 Yen in Millions
1. Retirement benefit obligation at the end of yeara. Retirement benefit obligation
b. Plan assets
c. Unfunded retirement benefit obligation
d. Unrecognized actuarial difference
e. Unrecognized prior service cost (decrease of obligation)
f. Net pension liability recognized in the consolidated balance sheet
g. Reserve for employee retirement and severance benefits
2. Retirement benefit cost for the yeara. Service cost
b. Interest cost
c. Expected return on plan assets
d. Amortization of actuarial difference
e. Amortization of prior service cost
f. Retirement benefit cost
g. Other
h. Total
3. Basis of calculationa. Method of attributing benefits to years of service Straight-line basis
b. Discount rate 1.0% to 6.1%
c. Expected return rate on plan assets 0.0% to 8.0%
d. Amortization years of prior service cost
e. Amortization years of actuarial difference
Mainly fully amortized in the same fiscal year as incurred
472
622
(1,267)
1,698
69
(3,992)
Mainly fully amortized in the same fiscal year as incurred
(17,188)
11,428
(210)
150
(3,992)
1,252
525
(149)
2004
(5,759)
- 20 -

Nintendo Co., Ltd.
PRODUCTION, ORDER AND SALES INFORMATION Years ended March 31, 2003 and 2004
Yen in Millions1. Production
2. Order
3. Sales
Electronic entertainment products2003 2004
132,246 185,175 Handheld -------------------------------------------------------------- (Hardware)
161Total 3,531
22,72773,580
33,96289,096
5963,398
3,369Electronic entertainment products
50,85255,133 2,802
455,687
2003 2004Orders
receivedOrders
received Orders in hand
Orders in hand
Sub-Total
Other productsTotal 577,528
576,824
704
454,181
1,506
128,902171,730
39,156339,789
129,830107,204237,034
Electronic entertainment products (Hardware)
(Software)
2003 2004
TotalOther products
Sub-Total Others -------------------------------------------------------------- Royalty income and contents income --------------------------------------------------------------
(Software)
101,55441,453
275,254
123,36999,325
3,978476
227,149502,404
1,730504,135
200,50214,36824,835
239,707
119,74694,727
214,474
54,36649,679
289,220
132,91186,262
3,015881
223,070512,291
2,513514,805
Handheld -------------------------------------------------------------- Console -------------------------------------------------------------- Others --------------------------------------------------------------
Handheld -------------------------------------------------------------- Console --------------------------------------------------------------
Handheld -------------------------------------------------------------- Console --------------------------------------------------------------
Console -------------------------------------------------------------- Others --------------------------------------------------------------
Handheld -------------------------------------------------------------- Console --------------------------------------------------------------
- 21 -
earnings releases May 27, 2004
Nintendo Co., Ltd.11-1 Kamitoba hokotate-cho,Minami-ku, Kyoto 601-8501Japan
NON-CONSOLIDATED FINANCIAL STATEMENTS
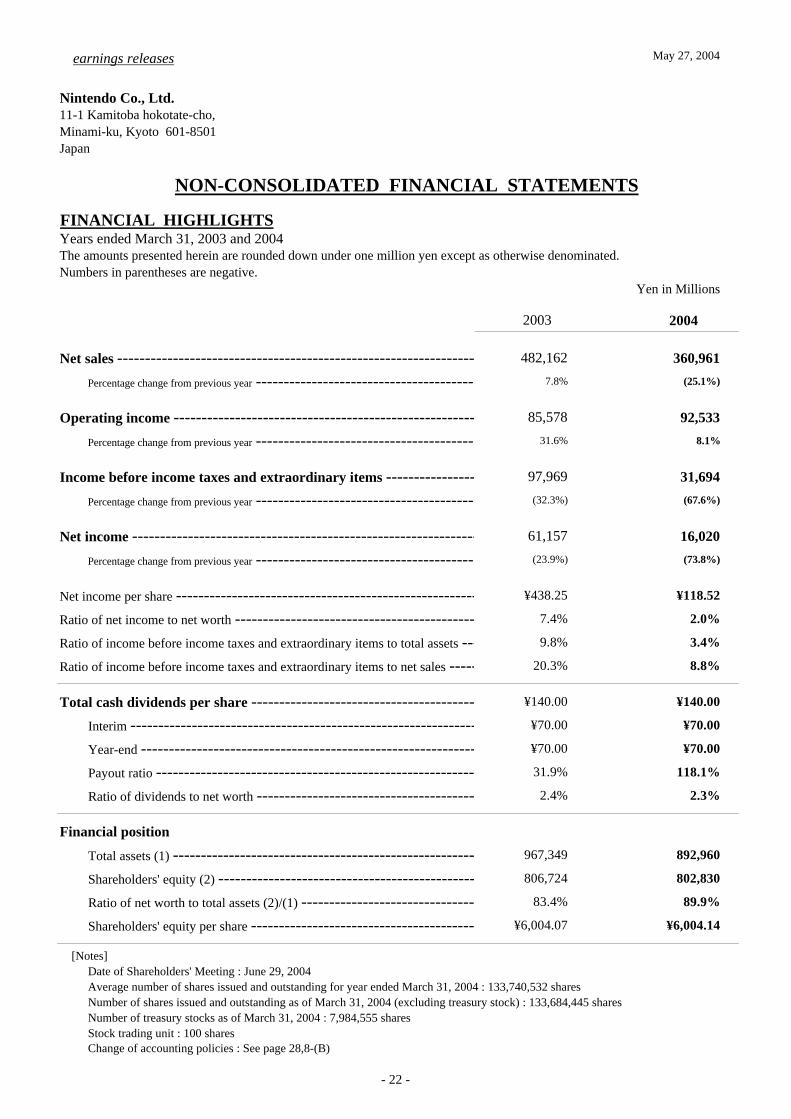
FINANCIAL HIGHLIGHTSYears ended March 31, 2003 and 2004The amounts presented herein are rounded down under one million yen except as otherwise denominated.Numbers in parentheses are negative.
Yen in Millions
2003 2004
Net sales -------------------------------------------------------------------------------482,162 360,961
Percentage change from previous year --------------------------------------------------------------7.8% (25.1%)
Operating income ------------------------------------------------------------------85,578 92,533
Percentage change from previous year --------------------------------------------------------------31.6% 8.1%
Income before income taxes and extraordinary items ---------------------------97,969 31,694
Percentage change from previous year ---------------------------------------------------------(32.3%) (67.6%)
Net income ------------------------------------------------------------------------61,157 16,020
Percentage change from previous year -------------------------------------------------------------(23.9%) (73.8%)
Net income per share ---------------------------------------------------------------¥438.25 ¥118.52
Ratio of net income to net worth ---------------------------------------------------------------7.4% 2.0%
Ratio of income before income taxes and extraordinary items to total assets --------------------9.8% 3.4%
Ratio of income before income taxes and extraordinary items to net sales --------------------20.3% 8.8%
Total cash dividends per share -----------------------------------------------------------------------¥140.00 ¥140.00
Interim --------------------------------------------------------------------------¥70.00 ¥70.00
Year-end ------------------------------------------------------------------------¥70.00 ¥70.00
Payout ratio ------------------------------------------------------------------------31.9% 118.1%
Ratio of dividends to net worth -----------------------------------------------------2.4% 2.3%
Financial position
Total assets (1) ------------------------------------------------------------------967,349 892,960
Shareholders' equity (2) --------------------------------------------------------806,724 802,830
Ratio of net worth to total assets (2)/(1) -----------------------------------------------------83.4% 89.9%
Shareholders' equity per share -----------------------------------------------------¥6,004.07 ¥6,004.14
[Notes]Date of Shareholders' Meeting : June 29, 2004Average number of shares issued and outstanding for year ended March 31, 2004 : 133,740,532 sharesNumber of shares issued and outstanding as of March 31, 2004 (excluding treasury stock) : 133,684,445 sharesNumber of treasury stocks as of March 31, 2004 : 7,984,555 sharesStock trading unit : 100 sharesChange of accounting policies : See page 28,8-(B)
- 22 -
Nintendo Co., Ltd.
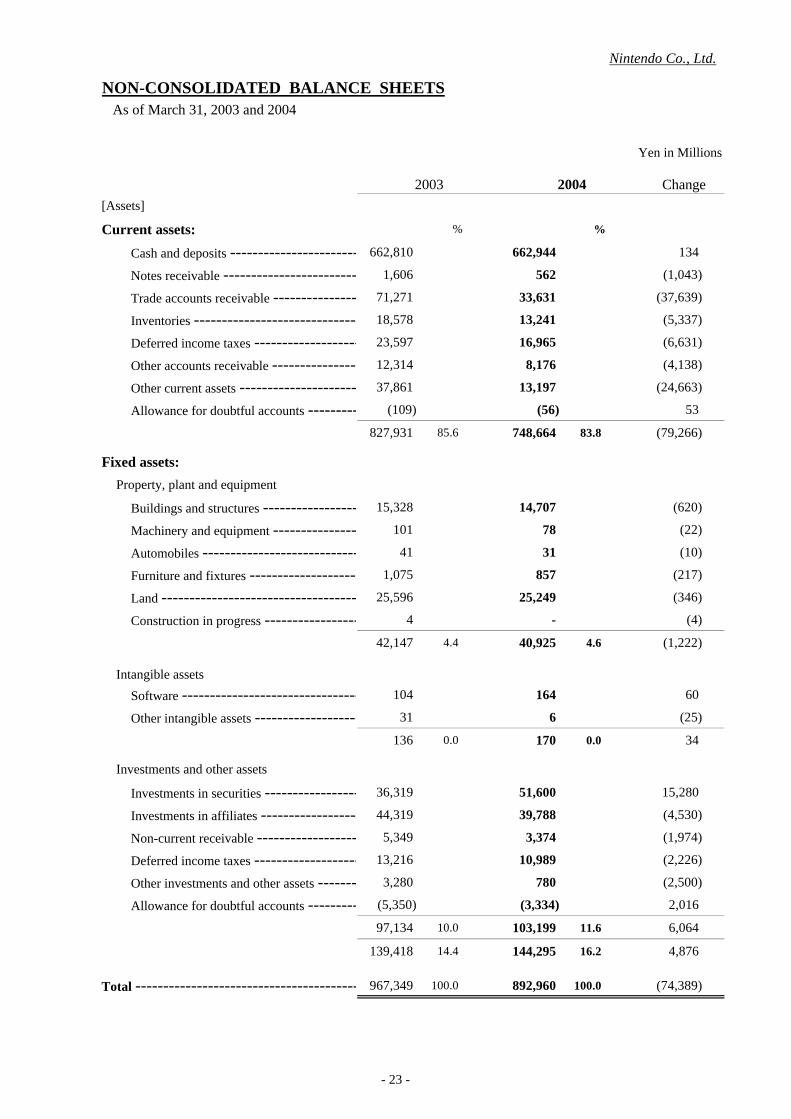
NON-CONSOLIDATED BALANCE SHEETS As of March 31, 2003 and 2004
Yen in Millions
2003 2004 Change[Assets]
Current assets: % %
Cash and deposits ------------------------------662,810 662,944 134
Notes receivable --------------------------------1,606 562 (1,043)
Trade accounts receivable ---------------------71,271 33,631 (37,639)
Inventories --------------------------------------18,578 13,241 (5,337)
Deferred income taxes ----------------------23,597 16,965 (6,631)
Other accounts receivable ---------------------12,314 8,176 (4,138)
Other current assets ----------------------------37,861 13,197 (24,663)
Allowance for doubtful accounts ------------- (109) (56) 53
827,931 85.6 748,664 83.8 (79,266)
Fixed assets:
Property, plant and equipment
Buildings and structures ----------------------------------15,328 14,707 (620)
Machinery and equipment -----------------------101 78 (22)
Automobiles -------------------------------------41 31 (10)
Furniture and fixtures -----------------------------1,075 857 (217)
Land ----------------------------------------------25,596 25,249 (346)
Construction in progress ----------------------- 4 - (4)
42,147 4.4 40,925 4.6 (1,222)
Intangible assets
Software -----------------------------------------104 164 60
Other intangible assets ------------------------- 31 6 (25)
136 0.0 170 0.0 34
Investments and other assets
Investments in securities -----------------------36,319 51,600 15,280
Investments in affiliates ------------------------44,319 39,788 (4,530)
Non-current receivable -------------------------5,349 3,374 (1,974)
Deferred income taxes ------------------------13,216 10,989 (2,226)
Other investments and other assets ------------3,280 780 (2,500)
Allowance for doubtful accounts -------------(5,350) (3,334) 2,016
97,134 10.0 103,199 11.6 6,064
139,418 14.4 144,295 16.2 4,876
Total ----------------------------------------------------967,349 100.0 892,960 100.0 (74,389)
- 23 -

Nintendo Co., Ltd.
As of March 31, 2003 and 2004
Yen in Millions
2003 2004 Change[Liabilities]
Current liabilities: % %
Notes payable -----------------------------------6,922 4,868 (2,054)
Trade accounts payable ------------------------84,920 51,644 (33,276)
Other accounts payable ------------------------13,643 8,934 (4,708)
Accrued income taxes -------------------------31,686 4,123 (27,563)
Advances received -----------------------------628 542 (86)
Reserve for bonuses ----------------------------1,672 1,712 39
Other current liabilities -------------------------16,064 14,520 (1,544)
155,538 16.1 86,345 9.7 (69,193)
Non-current liabilities:
Non-current accounts payable -------------- 135 602 467
Reserve for employee retirement and severance benefits
3,211 1,472 (1,738)
Reserve for directors retirement and severance benefits
1,740 1,709 (31)
5,086 0.5 3,784 0.4 (1,302)
Total liabilities ----------------------------160,625 16.6 90,129 10.1 (70,496)
[Shareholders' equity]
Common stock ---------------------------- 10,065 1.0 10,065 1.1 -
Additional paid-in capital -------------------11,584 1.2 11,584 1.3 -
Retained earnings ------------------------------864,341 89.4 861,429 96.5 (2,911)
Legal reserve ------------------------------2,516 2,516 -
Optional reserve ------------------------560,050 660,049 99,998
Special reserve ------------------------ 50 49 (1)
General reserve ------------------------560,000 660,000 100,000
Unappropriated -------------------------301,774 198,864 (102,910)
Unrealized gains on other securities --------- 2,254 0.2 6,650 0.7 4,395
Treasury stock, at cost ---------------------(81,521) (8.4) (86,898) (9.7) (5,377)
Total shareholders' equity --------------- 806,724 83.4 802,830 89.9 (3,893)
Total ------------------------------------------------------967,349 100.0 892,960 100.0 (74,389)
- 24 -
Nintendo Co., Ltd.
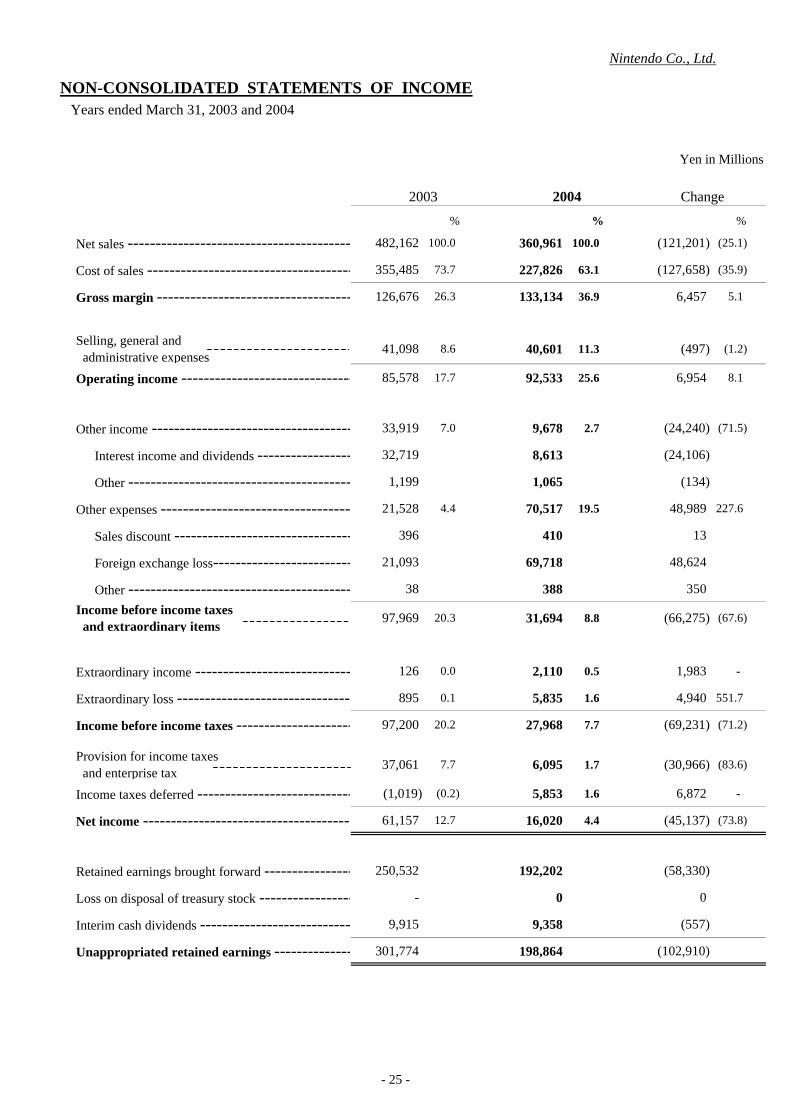
NON-CONSOLIDATED STATEMENTS OF INCOME Years ended March 31, 2003 and 2004
Yen in Millions
2003 2004 Change
% % %
Net sales ---------------------------------------------------482,162 100.0 360,961 100.0 (121,201) (25.1)
Cost of sales -----------------------------------------------355,485 73.7 227,826 63.1 (127,658) (35.9)
Gross margin ---------------------------------------------126,676 26.3 133,134 36.9 6,457 5.1
Selling, general and administrative expenses
41,098 8.6 40,601 11.3 (497) (1.2)
Operating income ---------------------------------------85,578 17.7 92,533 25.6 6,954 8.1
Other income ----------------------------------------------33,919 7.0 9,678 2.7 (24,240) (71.5)
Interest income and dividends ------------------------32,719 8,613 (24,106)
Other ---------------------------------------------------1,199 1,065 (134)
Other expenses --------------------------------------------21,528 4.4 70,517 19.5 48,989 227.6
Sales discount -----------------------------------------396 410 13
Foreign exchange loss-----------------------------------------21,093 69,718 48,624
Other ---------------------------------------------------38 388 350
Income before income taxes and extraordinary items
97,969 20.3 31,694 8.8 (66,275) (67.6)
Extraordinary income -------------------------------------126 0.0 2,110 0.5 1,983 -
Extraordinary loss -----------------------------------------895 0.1 5,835 1.6 4,940 551.7
Income before income taxes ------------------------- 97,200 20.2 27,968 7.7 (69,231) (71.2)
Provision for income taxes and enterprise tax
37,061 7.7 6,095 1.7 (30,966) (83.6)
Income taxes deferred ------------------------------------(1,019) (0.2) 5,853 1.6 6,872 -
Net income -----------------------------------------------61,157 12.7 16,020 4.4 (45,137) (73.8)
Retained earnings brought forward ---------------------250,532 192,202 (58,330)
Loss on disposal of treasury stock --------------------------- - 0 0
Interim cash dividends ------------------------------------9,915 9,358 (557)
Unappropriated retained earnings ------------------301,774 198,864 (102,910)
- 25 -

Nintendo Co., Ltd.
PROPOSAL OF APPROPRIATIONS Years ended March 31, 2003 and 2004
Yen in Millions
2003 2004 Change
Unappropriated retained earnings ------------- (102,910)
Reversal of special reserve ------------------------- (0)
Total -------------------------------------------- (102,910)
Cash dividends ------------------------------------- (45)
Directors' bonuses --------------------------------- -
Special reserve ---------------------------- (1)
General reserve ---------------------------- -
Retained earnings - carried forward ---------------------------------- (102,863)
[Notes]
Interim cash dividends (9,358 million yen, ¥70 per share) were paid on December 10, 2003.
301,774 198,864
2 2
301,776 198,866
9,403 9,357
(¥70.00 per share) (¥70.00 per share)
170 170
192,202 89,338
1 -
100,000 100,000
- 26 -

Nintendo Co., Ltd.
BASIS OF NON-CONSOLIDATED FINANCIAL STATEMENTS
1. A valuation basis and method of securitiesHeld-to-maturity bonds Amortized cost method (by straight-line method)Securities of subsidiaries and affiliates Cost, determined by the moving average methodOther securities
Marketable other securities Market price method, based on the market value at balance sheet date
Non-marketable other securities Cost, determined by the moving average method
2. A valuation basis and method of derivativesMarket price method
3. A valuation basis and method of inventoriesLower of cost, determined by the moving average method, or market
4. Depreciation method of fixed assets(A) Tangible assets
(B) Intangible assets
5. Translation basis of assets and/or liabilities denominated in foreign currencies
6. Allowance and reserve(A) Allowance for doubtful accounts
(B) Reserve for bonusesThe reserve for bonuses is calculated with estimated prorated amounts to be paid.
(C) Reserve for employee retirement and severance benefits
(D) Reserve for directors retirement and severance benefits
(Losses are charged to income, and unrealized gains, net of tax arecharged to shareholders' equity.)
Declining balance method (Some equipment are depreciated over economic useful lives.)Buildings (exclusive of structures) acquired on or after April 1, 1998 are depreciated using the straight-line method.Estimated useful lives of the principal assets are as follows: Buildings : 3 to 50 years
Straight-line methodAs for software for the in-house use, straight-line method based on usable period (mainly five years) is applied.
Receivables and/or payables denominated in foreign currencies are translated into Japanese yen by the spot exchange ratesat the end of the fiscal year. Exchange gains or losses are charged to income.
The allowance for general accounts receivables is calculated with actual percentage of credit losses to provide against losseson bad debts, as well as calculating the allowance for each doubtful account with an estimated amount of probable baddebts.
The reserve for employee retirement and severance benefits is calculated with actuarially calculated amountsat the end of the accounting period, on the basis of the cost of retirement benefits and plan assets at the end of thefiscal year.Prior service cost and actuarial calculation difference is processed collectively in the accrued year.
The reserve for directors retirement and severance benefits is calculated with estimated amounts to be paid at theyear-end, based on the Company's internal rules.
- 27 -

Nintendo Co., Ltd.
7. Lease transactions
8. Other (A) Consumption tax
The consumption tax and the provincial consumption tax are recorded as asset / liability when they are paid / received.
(B) Impairment on Fixed Assets
Finance leases that are deemed to transfer ownership of the leased assets to lessees are to be capitalized, while other finance leasesare accounted for as operating lease transactions.
The Company adopted the Financial Accounting Standard on Impairment on Fixed Assets ("Views on Establishment ofAccounting Standards for Impairment on Fixed Assets," issued by the Business Accounting Council on August 9, 2002)and its application guidelines No.6 issued on October 31, 2003. As these Accounting Standards may be applied tofinancial statements from the accounting year ending March 31, 2004, we are applying the standards and the guidelinesfrom the year under review. Upon adopting these accounting standards, impairment losses are included in "Other" ofOther expenses, and the effect on Income before income taxes and extraordinary items and Income before income taxes isminor.In addition, total impairment losses have been directly deducted from the figures of each asset category based on therevised Financial Statement Regulations.
- 28 -

Nintendo Co., Ltd.
NOTES TO NON-CONSOLIDATED FINANCIAL STATEMENTS
Yen in MillionsBalance sheets information; Shares in thousands
2003 20041. Accumulated depreciation of tangible assets 22,590 23,540
2. Receivable from affiliatesTrade accounts receivable 64,028 30,962
3. Guaranteed liabilities 389 386 <EUR in thousands> <EUR3,000> <EUR3,000>
4. Number of authorized shares 400,000 400,000
5. Number of issued and outstanding shares 141,669 141,669
6. The increase of net assets due to the increase of fair value of assetsNet assets provided in the Commercial Code 290-1-6 2,069 - Net assets provided in the Implementing Regulations 124-3 - 6,502
Statements of income information; Yen in Millions
2003 20041. Research and development costs 14,556 15,717
2. Transactions with affiliatesNet sales 352,091 226,387
Lease transaction information;
Securities information;
Any securities of subsidiaries and affiliates do not have market value in this fiscal year and the previousfiscal year.
This information is excluded, since it is disclosed on EDINET.
- 29 -

Nintendo Co., Ltd.
Tax effect accounting information;
Year ended March 31, 20041. Significant components of deferred tax assets and liabilities are summarized as follows
Yen in Millions
Deferred tax assets:Inventory - write-downsOther A/P and accrued expensesResearch and development costsLoss on investments in affiliatesUnrealized loss on land Unrealized loss on investment in securitiesAllowance for doubtful accountsDepreciationOther
Total deferred tax assetsDeferred tax liabilities:
Unrealized gains on other securitiesOther
Total deferred tax liabilitiesNet deferred tax assets
2. Reconciliation of the statutory tax rate and the effective tax rate
27,955(4,998)
1,333
4,89932,954
(453)(4,545)
1,119
5,717
1,417
4,7482,571
4,912
2004
6,235
This information is excluded, since the difference is not more than five one hundredth of the statutory tax rate.
- 30 -
Nintendo Co., Ltd.
DIRECTORS' CHANGE(Scheduled date: June 29, 2004)
1. Representative director to be inaugurated (including promotion):
Representative DirectorSenior Managing Director/General Manager, Research & Engineering Division
Nobuo Nagai (present position: Managing Director/General Manager, Research & Engineering Division )
2. Director to be retired:
Corporate Adviser
Akira Iijima (present position: Director, Marketing Division)
3. New auditor candidate:
Statutory auditor
Minoru Ueda (present position: Deputy General Manager, Administration Department of Tokyo Branch Office)
4. Auditor to be retired:
Takayasu Kojima (present position: Statutory auditor)
- 31 -
Supplementary Information Nintendo Co., Ltd.
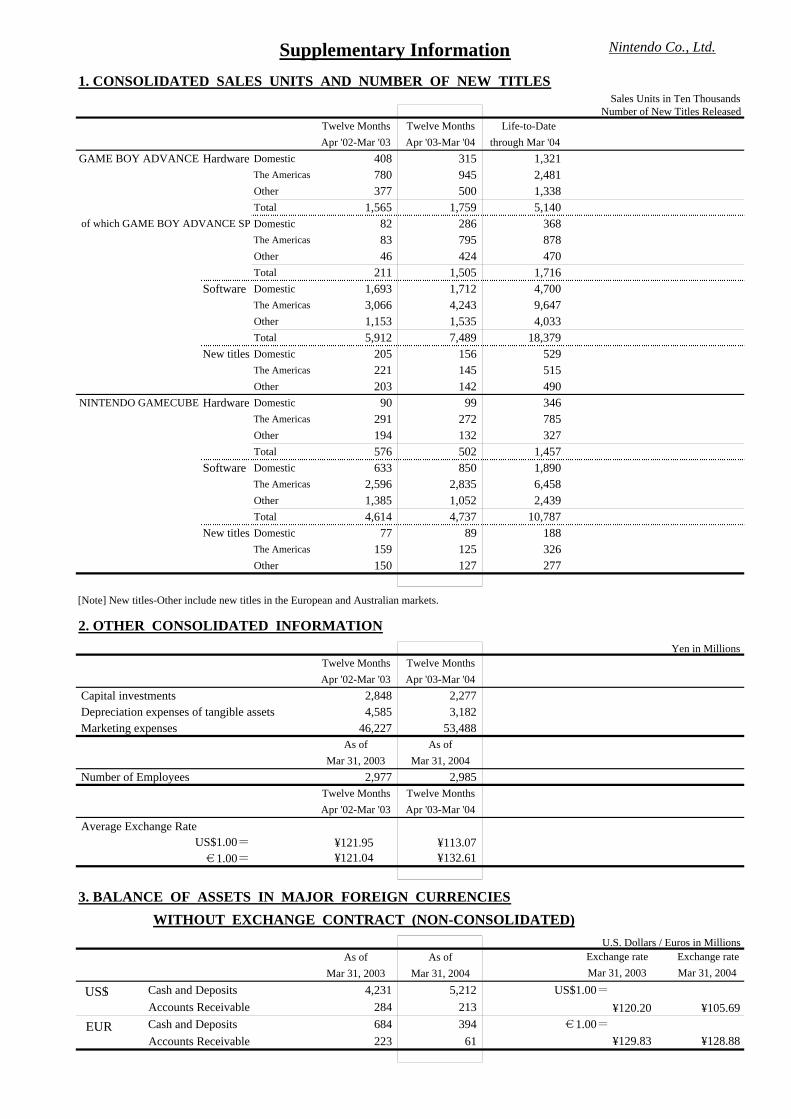
1. CONSOLIDATED SALES UNITS AND NUMBER OF NEW TITLESSales Units in Ten Thousands
Number of New Titles Released Twelve Months Twelve Months Life-to-DateApr '02-Mar '03 Apr '03-Mar '04 through Mar '04
GAME BOY ADVANCE Hardware Domestic 408 315 1,321 The Americas 780 945 2,481 Other 377 500 1,338 Total 1,565 1,759 5,140
of which GAME BOY ADVANCE SP Domestic 82 286 368 The Americas 83 795 878 Other 46 424 470 Total 211 1,505 1,716
Software Domestic 1,693 1,712 4,700 The Americas 3,066 4,243 9,647 Other 1,153 1,535 4,033 Total 5,912 7,489 18,379
New titles Domestic 205 156 529 The Americas 221 145 515 Other 203 142 490
NINTENDO GAMECUBE Hardware Domestic 90 99 346 The Americas 291 272 785 Other 194 132 327 Total 576 502 1,457
Software Domestic 633 850 1,890 The Americas 2,596 2,835 6,458 Other 1,385 1,052 2,439 Total 4,614 4,737 10,787
New titles Domestic 77 89 188 The Americas 159 125 326 Other 150 127 277
[Note] New titles-Other include new titles in the European and Australian markets.
2. OTHER CONSOLIDATED INFORMATIONYen in Millions
Twelve Months Twelve MonthsApr '02-Mar '03 Apr '03-Mar '04
Capital investments 2,848 2,277 Depreciation expenses of tangible assets 4,585 3,182 Marketing expenses 46,227 53,488
As of As ofMar 31, 2003 Mar 31, 2004
Number of Employees 2,977 2,985 Twelve Months Twelve MonthsApr '02-Mar '03 Apr '03-Mar '04
Average Exchange RateUS$1.00= ¥121.95 ¥113.07 1.00= ¥121.04 ¥132.61
3. BALANCE OF ASSETS IN MAJOR FOREIGN CURRENCIES
WITHOUT EXCHANGE CONTRACT (NON-CONSOLIDATED)U.S. Dollars / Euros in Millions
As of As ofMar 31, 2003 Mar 31, 2004
Cash and Deposits 4,231 5,212 US$1.00= Accounts Receivable 284 213 ¥120.20 ¥105.69 Cash and Deposits 684 394 1.00= Accounts Receivable 223 61 ¥129.83 ¥128.88
Exchange rate Mar 31, 2003 Mar 31, 2004
Exchange rate
US$
EUR