consolidated financial statements as of december 31, 2010
TRANSCRIPT

Verizon New York Inc.
Consolidated Financial Statements
As of December 31, 2010 and 2009
and for the years then ended

Verizon New York Inc.
1
Index to Consolidated Financial Statements
Page
Report of Independent Auditors – Ernst & Young LLP ..................................................................... 2
Consolidated Statements of Operations
For the years ended December 31, 2010 and 2009 ......................................................................... 3
Consolidated Balance Sheets
At December 31, 2010 and 2009 .................................................................................................... 4
Consolidated Statements of Changes in Shareowner’s Investment (Deficit)
For the years ended December 31, 2010 and 2009 ......................................................................... 5
Consolidated Statements of Cash Flows
For the years ended December 31, 2010 and 2009 ......................................................................... 6
Notes to Consolidated Financial Statements ....................................................................................... 7
Verizon New York Inc.
2
REPORT OF INDEPENDENT AUDITORS
To The Board of Directors and Shareowner of Verizon New York Inc.
We have audited the accompanying consolidated balance sheets of Verizon New York Inc. (“the Company”), a subsidiary of
Verizon Communications Inc., as of December 31, 2010 and 2009, and the related consolidated statements of operations,
changes in shareowner’s investment, and cash flows for the years then ended. These financial statements are the
responsibility of the Company’s management. Our responsibility is to express an opinion on these financial statements based
on our audits.
We conducted our audits in accordance with auditing standards generally accepted in the United States. Those standards
require that we plan and perform the audit to obtain reasonable assurance about whether the financial statements are free of
material misstatement. We were not engaged to perform an audit of the Company’s internal control over financial reporting.
Our audits included consideration of internal control over financial reporting as a basis for designing audit procedures that are
appropriate in the circumstances, but not for the purpose of expressing an opinion on the effectiveness of the Company’s
internal control over financial reporting. Accordingly, we express no such opinion. An audit also includes examining, on a
test basis, evidence supporting the amounts and disclosures in the financial statements, assessing the accounting principles
used and significant estimates made by management, and evaluating the overall financial statement presentation. We believe
that our audits provide a reasonable basis for our opinion.
In our opinion, the financial statements referred to above present fairly, in all material respects, the consolidated financial
position of Verizon New York Inc. at December 31, 2010 and 2009, and the consolidated results of its operations and its cash
flows for the years then ended in conformity with U.S. generally accepted accounting principles.
New York, New York
March 30, 2011
Verizon New York Inc.
3
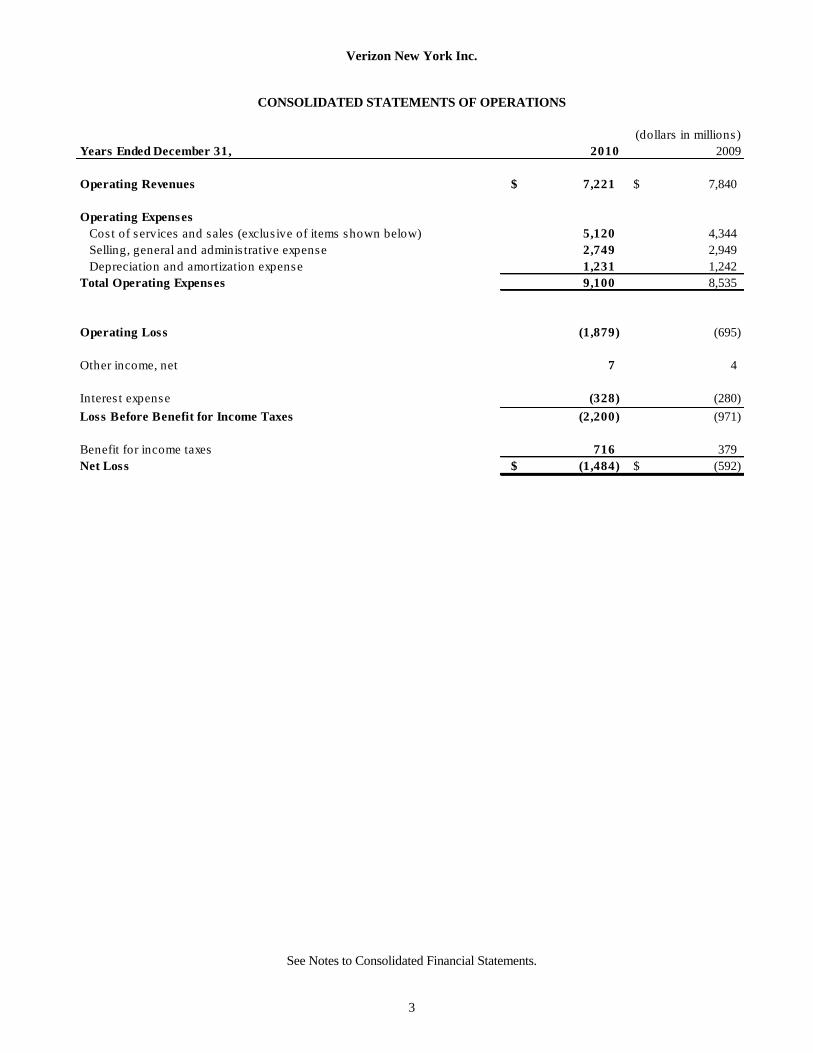
CONSOLIDATED STATEMENTS OF OPERATIONS
(dollars in millions)
Years Ended December 31, 2010 2009
Operating Revenues $ 7,221 $ 7,840
Operating Expenses
Cos t of services and sales (exclus ive of items shown below) 5,120 4,344
Selling, general and adminis trative expense 2,749 2,949
Depreciation and amortization expense 1,231 1,242
Total Operating Expenses 9,100 8,535
Operating Loss (1,879) (695)
Other income, net 7 4
Interes t expense (328) (280)
Loss Before Benefit for Income Taxes (2,200) (971)
Benefit for income taxes 716 379
Net Loss $ (1,484) $ (592)
See Notes to Consolidated Financial Statements.

Verizon New York Inc.
4
CONSOLIDATED BALANCE SHEETS
(dollars in millions)
At December 31, 2010 2009
Assets
Current assets
Notes receivable from affiliate $ 18 $ 168
Accounts receivable:
Trade and other, net of allowances for uncollectibles of $103 and $103 724 745
Affiliates 269 342
Prepaid expenses 98 83
Deferred income taxes 111 101
Deferred charges and other 75 132
Total current assets 1,295 1,571
Plant, property and equipment 30,053 31,674
Less accumulated depreciation 19,269 20,969
10,784 10,705
Intangible assets, net 52 51
Prepaid pension assets 408 436
Deferred income tax assets --- 12
Other assets 365 364
Total assets $ 12,904 $ 13,139
Liabilities and Shareowner's Investment (Deficit)
Current liabilities
Debt maturing within one year:
Notes payable to affiliates $ 3,692 $ 3,402
Other 1 400
Accounts payable and accrued liabilities:
Affiliates 445 494
Other 368 450
Other current liabilities 364 422
Total current liabilities 4,870 5,168
Long-term debt 2,251 2,251
Employee benefit obligations 5,934 4,440
Deferred credits and other liabilities:
Deferred income taxes 327 239
Unamortized investment tax credits 19 20
Other 355 335
701 594
Shareowner's investments (deficit)
Common stock - one share, without par value 1 1
Contributed capital 4,359 4,413
Accumulated deficit (5,212) (3,728)
Total shareowner's investment (deficit) (852) 686
Total liabilities and shareowner's investment (deficit) $ 12,904 $ 13,139
See Notes to Consolidated Financial Statements.

Verizon New York Inc.
5
CONSOLIDATED STATEMENTS OF CHANGES IN SHAREOWNER’S INVESTMENT (DEFICIT)
(dollars in millions)
Years Ended December 31, 2010 2009
Common Stock
Balance at beginning of year $ 1 $ 1
Balance at end of year 1 1
Contributed Capital
Balance at beginning of year 4,413 4,413
Return of capital to parent (54) ---
Balance at end of year 4,359 4,413
Accumulated Deficit
Balance at beginning of year (3,728) (3,136)
Net loss (1,484) (592)
Balance at end of year (5,212) (3,728)
Total Shareowner's Investment (Deficit) $ (852) $ 686
See Notes to Consolidated Financial Statements.

Verizon New York Inc.
6
CONSOLIDATED STATEMENTS OF CASH FLOWS
(dollars in millions)
Years Ended December 31, 2010 2009
Cash Flow from Operating Activities
Net loss $ (1,484) $ (592)
Adjustments to reconcile net loss to net cash provided by operating activities:
Depreciation and amortization 1,231 1,242
Deferred income taxes, net 88 122
Employee retirement benefits 1,784 792
Provision for uncollectible accounts 105 130
Equity income from affiliates --- (3)
Dividends received from equity affiliates --- 22
Gain on sale of land (62) (37)
Changes in current assets and liabilities:
Accounts receivable (54) 234
Other current assets (4) 87
Accounts payable and accrued liabilities (147) (441)
Other current liabilities (46) (5)
Employee retirement benefits paid (292) (562)
Other, net 10 (64)
Net cash provided by operating activities 1,129 925
Cash Flows from Investing Activities
Capital expenditures (including capitalized network and non-network software) (1,216) (1,315)
Purchases of short-term investments --- (3)
Proceeds from sale of short-term investments 1 4
Net change in notes receivable from affiliate 150 (55)
Proceeds from sales of assets 64 50
Other, net (11) (80)
Net cash used in investing activities (1,012) (1,399)
Cash Flows from Financing Activities
Principal repayments of borrowings and capital lease obligations (401) (1)
Net change in current notes payable to affiliate 290 473
Net change in outstanding checks drawn on controlled disbursement accounts (6) 2
Net cash provided by (used in) financing activities (117) 474
Net change in cash --- ---
Cash, beginning of year --- ---
Cash, end of year $ --- $ ---
See Notes to Consolidated Financial Statements.

Verizon New York Inc.
7
NOTES TO CONSOLIDATED FINANCIAL STATEMENTS
1. DESCRIPTION OF BUSINESS AND SUMMARY OF SIGNIFICANT ACCOUNTING POLICIES
Description of Business
Verizon New York Inc. (Verizon New York or the Company) and its wholly owned subsidiaries, Empire City Subway Ltd, Bell
Atlantic Communications and NYNEX Long Distance Company are wholly owned subsidiaries of NYNEX Corporation
(NYNEX), which is a wholly owned subsidiary of Verizon Communications Inc. (Verizon). Empire City Subway Ltd is primarily
in the business of leasing underground conduit in Manhattan, New York (NY) and the Bronx, NY, principally to us, but also to
other companies in the telecommunications business. NYNEX Long Distance is a provider of regional toll and long distance
services. We currently serve a territory consisting of Local Access and Transport Areas (LATA) in New York, as well as a
small portion of Connecticut (Greenwich and Byram only). We have one reportable segment which provides domestic wireline
telecommunications services. We currently provide three basic types of telecommunications services:
Exchange telecommunication service is the transmission of telecommunications among customers located within a
local calling area within a LATA. Examples of exchange telecommunications services include switched local
residential and business services, local private line voice and data services and Centrex services. We also provide toll
services within and outside both LATA (intraLATA and interLATA long distance).
Exchange access service links a customer’s premises and the transmission facilities of other telecommunications
carriers, generally interLATA carriers. Examples of exchange access services include switched access and special
access services.
In addition, we also provide fiber-to-the-premises services, operated under the FiOS service mark (FiOS TV), for
residential and small business subscribers in certain areas.
The communications services we provide are subject to regulation by the New York State Public Service Commission and the
Connecticut Department of Public Utility Control with respect to intrastate rates and services and other matters. The Federal
Communications Commission regulates rates that we charge long distance carriers and end-user subscribers for interstate
access services.
On May 13, 2009, Verizon announced a definitive agreement with Frontier Communications Corporation (Frontier) that
resulted in Verizon establishing a separate entity, known as New Communications Holdings Inc. (Spinco), for the purpose of
holding defined assets and liabilities of Verizon’s local exchange business and related landline activities in 13 states and
portions of California. On July 1, 2010, after receiving regulatory approval, Verizon completed the spin-off of the shares of
Spinco to Verizon stockholders and the merger of Spinco with Frontier (Frontier Merger).
Certain subsidiaries of Verizon New York provide long distance services in areas served by Verizon New York as well as in
areas served by other Verizon telephone operating company subsidiaries, including the territories that became part of the
Spinco operating areas at the closing of the Frontier Merger. The long distance traffic generated within the territories that
became part of the Spinco operating areas generated approximately 4% of Verizon New York’s consolidated revenues in the
six months ended June 30, 2010 and contributed $50 million and $59 million to its operating income in the six months period
ended June 30, 2010 and 2009, respectively.
At the closing of the Frontier merger, Verizon New York decreased its contributed capital by $54 million to account for assets
contributed to Spinco, and subsequently to Frontier. The long-term debt that was previously issued by Verizon New York
was not affected by the Frontier Merger and remains the obligation of Verizon New York.
During 2010 and 2009, Verizon recorded pre-tax charges of $0.5 billion and $0.2 billion, respectively, primarily for costs
incurred related to network, non-network software and other activities to enable all of the divested markets in the transaction
with Frontier to operate on a stand-alone basis subsequent to the closing of the transaction, and professional advisory and
legal fees in connection with this transaction. Also included during 2010 are fees related to early extinguishment of debt. The
portion of these charges recorded by Verizon New York was immaterial.

Verizon New York Inc.
8
Basis of Presentation
We prepare our financial statements using U.S. generally accepted accounting principles (GAAP) which require management
to make estimates and assumptions that affect reported amounts and disclosures. Actual results could differ from those
estimates. Examples of significant estimates include: the allowance for doubtful accounts, the recoverability of intangible
assets and other long-lived assets, unbilled revenues, fair value of financial instruments, unrecognized tax benefits, valuation
allowances on tax assets, accrued expenses and postretirement benefit assumptions.
The consolidated financial statements include the accounts of Verizon New York Inc. and its subsidiaries. All significant
intercompany accounts and transactions have been eliminated. We have a 66-2/3% ownership interest in Telesector Resources
Group, Inc. (d/b/a Verizon Services Group) and share voting rights equally with the other owner, Verizon New England Inc.
(Verizon New England), which is a wholly owned subsidiary of NYNEX. Verizon Services Group operates in conjunction with
Verizon Services Corp. and Verizon Corporate Services Group Inc. (collectively known as Verizon Services) to provide various
centralized services on behalf of Verizon’s subsidiaries. We use the equity method of accounting for our investment in Verizon
Services Group.
We also have an 8.49% ownership interest in SMS/800, a venture that is jointly owned by the Bell Operating Companies.
SMS/800 administers the centralized national database system associated with toll free numbers. We use the equity method
of accounting for our investment in SMS/800. All significant intercompany accounts and transactions have been eliminated. We have evaluated subsequent events through March 30, 2011, the date these consolidated financial statements were available to be issued. We have reclassified certain amounts from prior periods to conform with our current presentation.
Revenue Recognition
We earn revenue based upon usage of our network and facilities and contract fees. In general, fixed monthly fees for voice,
video, long distance and certain other services are billed one month in advance and recognized when earned. Revenue from
services that are not fixed in amount and are based on usage is generally billed in arrears and recognized when such services
are provided. When we bundle the equipment with maintenance and monitoring services, we recognize equipment revenue
when the equipment is installed in accordance with contractual specifications and ready for the customer’s use. Revenue
associated with maintenance and monitoring service contracts is accounted for using the percentage-of-completion method
based on the ratio of actual costs incurred to total estimated costs of the contract. Expenses associated with each contract are
recognized as incurred in connection with the installation of equipment. We use the completed contract method if we cannot
estimate the costs with a reasonable degree of reliability.
Installation related fees, along with the associated costs up to, but not exceeding these fees, are deferred and amortized over
the customer relationship period.
We report taxes imposed by governmental authorities on revenue-producing transactions between us and our customers on a
net basis.
Maintenance and Repairs
We charge the cost of maintenance and repairs, including the cost of replacing minor items not constituting substantial
betterments, principally to Cost of services and sales as these costs are incurred.
Trade and Other Accounts Receivable
Trade and other accounts receivable are stated at the amount we expect to collect. We maintain allowances for uncollectible
accounts for estimated losses resulting from the inability of our customers to make required payments. In determining these
estimates, we consider historical write-offs, the aging of the receivables, and other factors, such as overall economic
conditions.

Verizon New York Inc.
9
Concentrations of Credit Risk
Financial instruments that subject us to concentrations of credit risk consist primarily of trade receivables. Concentrations of
credit risk with respect to trade receivables, other than those from AT&T Inc. (AT&T) and Sprint Nextel Corporation
(Sprint), are limited due to the large number of customers. We generated revenues from services provided to AT&T and
Sprint (primarily network access and billing and collection) of $237 million and $104 million in 2010 and $279 million and
$119 million in 2009, respectively.
While we may be exposed to credit losses due to the nonperformance of our counterparties, we consider this risk remote and
do not expect the settlement of these transactions to have a material effect on our results of operations or financial position.
Notes Receivable
The Financial Services agreements with Verizon Network Funding Corp. (VNFC) and Verizon Financial Services LLC
(FSLLC), and us allow VNFC and FSLLC to collect funds on our behalf. These funds are assigned a variable interest rate and
are payable on demand, therefore, the carrying value of the notes receivable approximates their fair market value. As of
December 31, 2010 and 2009, we had notes receivable in the amounts of $18 million and $168 million from VNFC,
respectively.
Plant and Depreciation
We record our plant, property and equipment at cost. Depreciation expense is principally based on the composite group
remaining life method and straight-line composite rates. This method provides for the recognition of the cost of the
remaining net investment in local telephone plant, less anticipated net salvage value, over the remaining asset lives. This
method requires the periodic revision of depreciation rates.
The asset lives used by our operations are presented in the following table:
Average Useful Lives (in years)
Buildings 45
Central office equipment 5-11
Outside communications plant
Copper cable 15
Fiber cable 25
Poles and conduit 30-50
Furniture, vehicles and other 5-15
When we replace, retire or otherwise dispose of depreciable plant used in our local telephone network, we deduct the carrying
amount of such plant from the respective accounts and charge it to accumulated depreciation.
We capitalize and depreciate network software purchased or developed along with related plant assets. We also capitalize
interest associated with the acquisition or construction of network-related assets. Capitalized interest is reported as a reduction
in interest expense and depreciated as part of the cost of network-related assets.
In connection with our ongoing review of the estimated remaining average useful lives of plant, property and equipment, we
determined that there were no changes necessary to average useful lives in 2010. We determined effective January 1, 2009
that the average useful lives of copper cable would be changed to 15 years from 13 to 15 years. As a result, 2009 depreciation
expense decreased by $50 million.
We believe that the current estimated useful asset lives are reasonable, although they are subject to continual review and
analysis. In the evaluation of asset lives, multiple factors are considered, including, but not limited to, technology upgrades
and enhancements, planned retirements, and the adequacy of reserves.

Verizon New York Inc.
10
Long-Lived Assets
Our plant, property and equipment and intangible assets are reviewed for impairment. These assets are tested for
recoverability whenever events or changes in circumstances indicate that their carrying amounts may not be recoverable. If
any indications were present, we would test for recoverability by comparing the carrying amount of the asset to the net
undiscounted cash flows expected to be generated from the asset. If those net undiscounted cash flows do not exceed the
carrying amount (i.e., the asset is not recoverable), we would perform the next step, which is to determine the fair value of the
asset and record an impairment, if any. An impairment charge is recognized for the amount (if any) by which the carrying
value of the asset exceeds its fair value.
Computer Software Costs
We capitalize the cost of internal-use network and non-network software which has a useful life in excess of one year.
Subsequent additions, modifications or upgrades to internal-use network and non-network software are capitalized only to the
extent that they allow the software to perform a task it previously did not perform. Software maintenance and training costs
are expensed in the period in which they are incurred. Also, we capitalize interest associated with the development of internal-
use network and non-network software. Capitalized non-network computer software costs are amortized using the straight-line
method over a period of 6 to 7 years.
Intangible Assets
Our intangible assets primarily consist of franchise fees related to obtaining the right to provide certain services in a local
area. Intangible asset amortization expense for the years ended December 31, 2010 and 2009 was not significant.
Advertising Costs
Costs for advertising products and services as well as other promotional and sponsorship costs are charged to Selling, general
and administrative expense in the periods in which they are incurred.
Stock-Based Compensation
We participate in the Verizon Communications Long Term Incentive Plan (the Plan). The Plan permits the granting of stock
options, stock appreciation rights, restricted stock, restricted stock units, performance shares, performance stock units and
other awards.
Restricted Stock Units
The Plan provides for grants of Restricted Stock Units (RSUs) that generally vest at the end of the third year after the grant.
The RSUs granted prior to January 1, 2010 are classified as liability awards because the RSUs will be paid in cash upon
vesting. The RSU award liability is measured at its fair value at the end of each reporting period and, therefore, will fluctuate
based on the performance of Verizon common stock. The RSUs granted subsequent to January 1, 2010 are classified as equity
awards because these RSUs will be paid in Verizon common stock upon vesting. The RSU equity awards are measured using
the grant date fair value of Verizon common stock and are not remeasured at the end of each reporting period. Dividend
equivalent units are also paid to participants at the time the RSU award is paid, and in the same proportion as the RSU award.
Performance Stock Units
The Plan also provides for grants of Performance Stock Units (PSUs) that generally vest at the end of the third year after the
grant. As defined by the Plan, the Human Resources Committee of the Board of Directors of Verizon determines the number
of PSUs a participant earns based on the extent to which the corresponding goal has been achieved over the three-year
performance cycle. All payments are subject to approval by the Human Resources Committee. The PSUs are classified as
liability awards because the PSU awards are paid in cash upon vesting. The PSU award liability is measured at its fair value
at the end of each reporting period and, therefore, will fluctuate based on the price of Verizon common stock as well as
performance relative to the targets. Dividend equivalent units are also paid to participants at the time that the PSU award is
determined and paid, and in the same proportion as the PSU award.
Verizon New York Inc.
11
Stock Options
The Plan provides for grants of stock options to participants at an option price per share of 100% of the fair market value of
Verizon common stock on the date of grant. Each grant has a 10-year life, vesting equally over a three-year period, starting at
the date of the grant. We have not granted new stock options since 2004.
The structure of Verizon’s stock incentive plans does not provide for the separate determination of certain disclosures for our
company. The required information is provided on a consolidated basis in Verizon’s Annual Report on Form 10-K for the
year ended December 31, 2010.
After-tax compensation expense for other stock-based compensation included in net income as reported for the years ended
December 31, 2010 and 2009 was not material.
Employee Benefit Plans We participate in Verizon’s benefit plans and the structure of these plans does not provide for the separate disclosure of the
related pension and postretirement assets and obligations at a company level. The annual income and expense related to our
employees are allocated to the Company based on employee obligations and are included in the statements of operations in
Cost of services and sales and Selling, general and administrative expenses. The related pension and postretirement benefit
asset/obligations have been accumulated over time based on accruals net of payments and termination/settlement charges and
are included in Prepaid pension assets and Employee benefit obligations in the consolidated balance sheets (see Note 5). Verizon recognizes a defined benefit postretirement plan’s funded status as either an asset or liability on the consolidated
balance sheets. Also, Verizon measures any prior service costs and credits that arise during the period as a component of
Accumulated other comprehensive income (loss), net of applicable income tax. Because of the structure of the plans, the
related adjustments recorded by Verizon to recognize the funded status are not reflected in our consolidated balance sheets as
of December 31, 2010 or 2009.
We maintain ongoing severance plans for both management and associate employees, which provide benefits to employees that
are terminated. The costs for these plans are accounted for under the accounting standards regarding employers' accounting for
postemployment benefits. We accrue for severance benefits based on the terms of our severance plan over the estimated service
periods of the employees. The accruals are also based on the historical run-rate of actual severances and expectations for future
severances. Severance costs are included in Selling, general and administrative expense in our statements of operations.
Fair Value Measurements
Fair value of financial and non-financial assets and liabilities is defined as an exit price, representing the amount that would
be received to sell an asset or paid to transfer a liability in an orderly transaction between market participants. The three-tier
hierarchy for inputs used in measuring fair value, which prioritizes the inputs used in the methodologies of measuring fair
value for assets and liabilities, is as follows:
Level 1 - Quoted prices in active markets for identical assets or liabilities
Level 2 - Observable inputs other than quoted prices in active markets for identical assets and liabilities
Level 3 - No observable pricing inputs in the market
Financial assets and financial liabilities are classified in their entirety based on the lowest level of input that is significant to the
fair value measurements. Our assessment of the significance of a particular input to the fair value measurements requires
judgment, and may affect the valuation of the assets and liabilities being measured and their placement within the fair value
hierarchy.

Verizon New York Inc.
12
Income Taxes
Verizon and its domestic subsidiaries, including us, file a consolidated federal income tax return. Additionally, we are
included in consolidated state income tax returns which are filed by Verizon. For reporting purposes, we calculate and record
current and deferred tax expense by applying the accounting standard for accounting for income taxes as if we were a separate
taxpayer, with an exception for any benefits of consolidated federal and state filings generated by net operating losses based
on our separate return calculation and/or tax credits. For separate states, the Company records valuation allowances against
the deferred tax assets and net operating losses if they are not expected to be realized. At December 31, 2010 and December
31, 2009 we had an income tax receivable/(payable) due from/to Verizon Communications Inc. of $20 million and ($40)
million, respectively.
Our effective tax rate is based on pre-tax income, statutory tax rates, tax laws and regulations and tax planning strategies
available to us in the various jurisdictions in which we operate.
Deferred income taxes are provided for temporary differences in the bases between financial statement and income tax assets
and liabilities. Deferred income taxes are recalculated annually at tax rates then in effect. We record valuation allowances to
reduce our deferred tax assets to the amount that is more likely than not to be realized.
We use the deferral method of accounting for investment tax credits earned prior to the repeal of investment tax credits by the
Tax Reform Act of 1986. We also defer certain transitional credits earned after the repeal. These credits are amortized over
the estimated service lives of the related assets as a reduction to the provision for income taxes.
We use a two-step approach for recognizing and measuring tax benefits taken or expected to be taken in a tax return. The first
step is recognition: we determine whether it is more likely than not that a tax position will be sustained upon examination,
including resolution of any related appeals or litigation processes, based on the technical merits of the position. In evaluating
whether a tax position has met the more-likely-than-not recognition threshold, we presume that the position will be examined
by the appropriate taxing authority that has full knowledge of all relevant information. The second step is measurement: a tax
position that meets the more-likely-than-not recognition threshold is measured to determine the amount of benefit to recognize
in the financial statements. The tax position is measured at the largest amount of benefit that is greater than 50 percent likely
of being realized upon ultimate settlement. Differences between tax positions taken in a tax return and amounts recognized in
the financial statements will generally result in one or more of the following: an increase in a liability for income taxes
payable, a reduction of an income tax refund receivable, a reduction in a deferred tax asset, or an increase in a deferred tax
liability.
Significant management judgment is required in evaluating our tax positions and in determining our effective tax rate.
Recent Accounting Standards
In January 1, 2011, we prospectively adopted the accounting standard update regarding revenue recognition for multiple
deliverable arrangements. This method allows a vendor to allocate revenue in an arrangement using its best estimate of
selling price if neither vendor specific objective evidence nor third party evidence of selling price exists. Accordingly, the
residual method of revenue allocation is no longer permissible. We are currently evaluating the impact that this standard
update will have in our consolidated financial statements.
In January 1, 2011, we prospectively adopted the accounting standard update regarding revenue recognition for arrangements
that include software elements. This update requires tangible products that contain software and non-software elements that
work together to deliver the products’ essential functionality to be evaluated under the accounting standard regarding multiple
deliverable arrangements. We are currently evaluating the impact that this standard update will have in our consolidated
financial statements.
Verizon New York Inc.
13
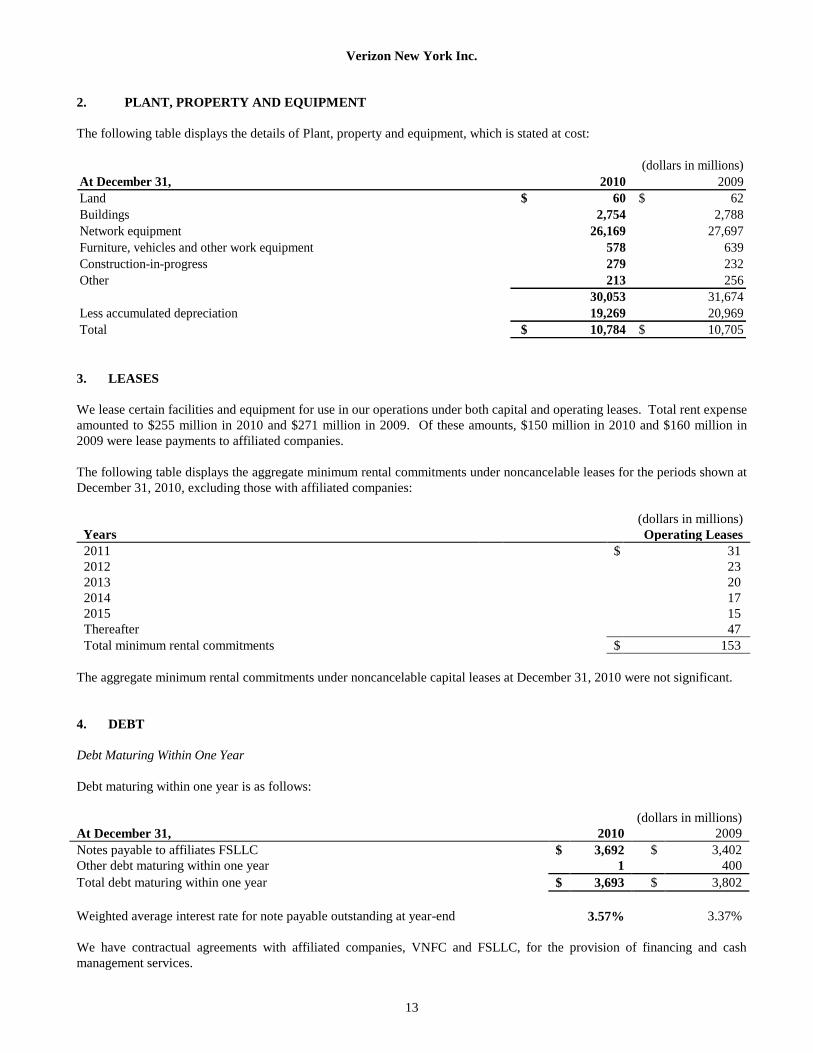
2. PLANT, PROPERTY AND EQUIPMENT
The following table displays the details of Plant, property and equipment, which is stated at cost:
(dollars in millions)
At December 31, 2010 2009
Land $ 60 $ 62
Buildings 2,754 2,788
Network equipment 26,169 27,697
Furniture, vehicles and other work equipment 578 639
Construction-in-progress 279 232
Other 213 256
30,053 31,674
Less accumulated depreciation 19,269 20,969
Total $ 10,784 $ 10,705
3. LEASES
We lease certain facilities and equipment for use in our operations under both capital and operating leases. Total rent expense
amounted to $255 million in 2010 and $271 million in 2009. Of these amounts, $150 million in 2010 and $160 million in
2009 were lease payments to affiliated companies.
The following table displays the aggregate minimum rental commitments under noncancelable leases for the periods shown at
December 31, 2010, excluding those with affiliated companies:
Years
(dollars in millions)
Operating Leases
2011 $ 31
2012 23
2013 20
2014 17
2015 15
Thereafter 47
Total minimum rental commitments $ 153
The aggregate minimum rental commitments under noncancelable capital leases at December 31, 2010 were not significant.
4. DEBT
Debt Maturing Within One Year
Debt maturing within one year is as follows:
(dollars in millions)
At December 31, 2010 2009
Notes payable to affiliates FSLLC $ 3,692 $ 3,402
Other debt maturing within one year 1 400
Total debt maturing within one year $ 3,693 $ 3,802
Weighted average interest rate for note payable outstanding at year-end
3.57%
3.37%
We have contractual agreements with affiliated companies, VNFC and FSLLC, for the provision of financing and cash
management services.

Verizon New York Inc.
14
The fair value of debt, excluding capital leases, is determined based on market quotes for similar terms and maturities or
future cash flows discounted at current rates. The fair value of debt, excluding capital leases, was $6,106 million and $6,190
million at December 31, 2010 and 2009, respectively, as compared to the carrying value of $5,934 million and $6,043
million, respectively at December 31, 2010 and 2009.
Long-Term Debt
Outstanding long-term debt consists of the following:
(dollars in millions)
At December 31, Interest Rate Maturity 2010 2009
Ten year debenture 6.875% 2012 $ 1,000 $ 1,000
Twenty year debenture 7.000 2013 100 100
Twenty year debenture 7.000 2013 100 100
Thirty year debenture 6.700 2023 250 250
Thirty year debenture 6.500 2028 100 100
Thirty year debenture 7.375 2032 500 500
Forty year debenture 7.000 2033 200 200
Twelve year debenture 6.125 2010 --- 250
Twenty-one year debenture 8.625 2010 --- 150
2,250 2,650
Other (primarily capital lease obligations) 2 1
Total long-term debt, including current maturities 2,252 2,651
Less other debt maturing within one year 1 400
Total long-term debt $ 2,251 $ 2,251
The aggregate principal amount of bonds and debentures that may be issued is subject to the restrictions and provisions of our
indentures. None of the securities shown above were held in sinking or other special funds or pledged by us. Debt discounts
and premiums on our outstanding long-term debt are amortized over the lives of the respective issues.
During 2010, a $250 million 6.125% twelve year debenture and a $150 million 8.625% twenty-one year debenture were
repaid.
We are in compliance with all of our debt covenants.
Maturities of long-term debt outstanding at December 31, 2010, excluding primarily capital lease obligations are as follows:
Years (dollars in millions)
2011 $ ---
2012 1,000
2013 200
2014 ---
2015 ---
Thereafter 1,050
Total long-term debt outstanding $ 2,250
Verizon New York Inc.
15
5. EMPLOYEE BENEFITS
We participate in Verizon’s benefit plans. Verizon maintains noncontributory defined benefit pension plans for many of our
employees. The postretirement health care and life insurance plans for our retirees and their dependents are both contributory
and noncontributory and include a limit on the Company’s share of cost for certain recent and future retirees. Verizon also
sponsors defined contribution savings plans to provide opportunities for eligible employees to save for retirement on a tax-
deferred basis. We use a measurement date of December 31 for our pension and postretirement health care and life insurance
plans.
The structure of Verizon’s benefit plans does not provide for the separate determination of certain disclosures for our
company. The required information is provided on a consolidated basis in Verizon’s Annual Report on Form 10-K for the
year ended December 31, 2010.
Pension and Other Postretirement Benefits
Pension and other postretirement benefits for the majority of our employees are subject to collective bargaining agreements.
Approximately 90% of our employees (associates) are covered by collective bargaining agreements which expire in August
2011. Modifications in benefits have been bargained from time to time, and Verizon may also periodically amend the
benefits in the management plans.
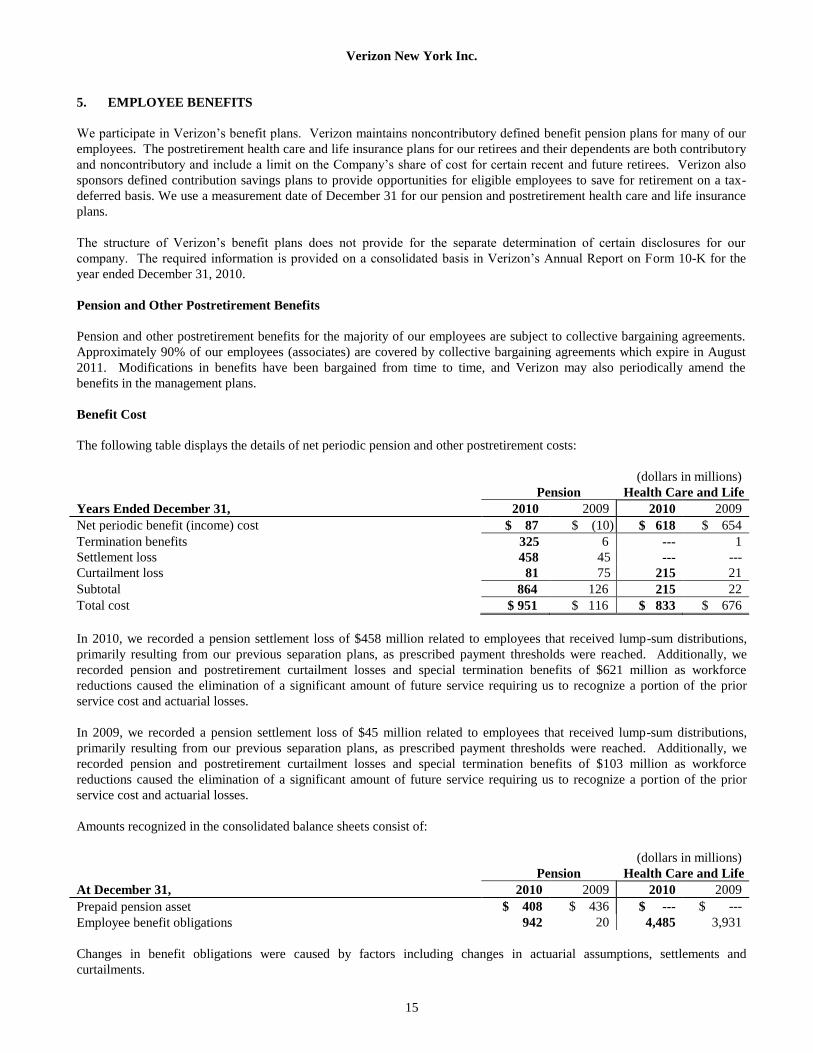
Benefit Cost
The following table displays the details of net periodic pension and other postretirement costs:
(dollars in millions)
Pension Health Care and Life
Years Ended December 31, 2010 2009 2010 2009
Net periodic benefit (income) cost $ 87 $ (10) $ 618 $ 654
Termination benefits 325 6 --- 1
Settlement loss 458 45 --- ---
Curtailment loss 81 75 215 21
Subtotal 864 126 215 22
Total cost $ 951 $ 116 $ 833 $ 676
In 2010, we recorded a pension settlement loss of $458 million related to employees that received lump-sum distributions,
primarily resulting from our previous separation plans, as prescribed payment thresholds were reached. Additionally, we
recorded pension and postretirement curtailment losses and special termination benefits of $621 million as workforce
reductions caused the elimination of a significant amount of future service requiring us to recognize a portion of the prior
service cost and actuarial losses.
In 2009, we recorded a pension settlement loss of $45 million related to employees that received lump-sum distributions,
primarily resulting from our previous separation plans, as prescribed payment thresholds were reached. Additionally, we
recorded pension and postretirement curtailment losses and special termination benefits of $103 million as workforce
reductions caused the elimination of a significant amount of future service requiring us to recognize a portion of the prior
service cost and actuarial losses.
Amounts recognized in the consolidated balance sheets consist of:
(dollars in millions)
Pension Health Care and Life
At December 31, 2010 2009 2010 2009
Prepaid pension asset $ 408 $ 436 $ --- $ ---
Employee benefit obligations 942 20 4,485 3,931
Changes in benefit obligations were caused by factors including changes in actuarial assumptions, settlements and
curtailments.

Verizon New York Inc.
16
Beginning in 2013, as a result of federal health care reform, Verizon will no longer file for the Retiree Drug Subsidy (RDS)
and will instead contract with a Medicare Part D plan on a group basis to provide prescription drug benefits to Medicare
eligible retirees. This change to our Medicare Part D strategy, resulted in the adoption of plan amendments during the fourth
quarter of 2010, which will allow the company to be eligible for greater Medicare Part D plan subsidies over time.
Assumptions
The weighted-average assumptions used in determining benefit obligations follow:
Pension Health Care and Life
At December 31, 2010 2009 2010 2009
Discount rate 5.75% 6.25% 5.75% 6.25%
Rate of compensation increases 3.00 4.00 N/A N/A
The weighted-average assumptions used in determining net periodic cost follow:
Pension Health Care and Life
Years Ended December 31, 2010 2009 2010 2009
Discount rate 6.25% 6.75% 6.25% 6.75%
Expected return on plan assets 8.50 8.50 8.25 8.25
Rate of compensation increases 4.00 4.00 N/A N/A
In order to project the long-term target investment return for the total portfolio, estimates are prepared for the total return of
each major asset class over the subsequent 10-year period, or longer. Those estimates are based on a combination of factors
including the current market interest rates and valuation levels, consensus earnings expectations, historical long-term risk
premiums and value-added. To determine the aggregate return for the pension trust, the projected return of each individual
asset class is then weighted according to the allocation to that investment area in the Trust’s long-term asset allocation policy.
The assumed Health Care Cost Trend Rates follow:
Health Care and Life
At December 31, 2010 2009
Health care cost trend rate assumed for next year 7.75% 8.00%
Rate to which cost trend rate gradually declines 5.00 5.00
Year the rate reaches level it is assumed to remain thereafter 2016 2014
Savings Plans and Employee Stock Ownership Plans
Substantially all of our employees are eligible to participate in savings plans maintained by Verizon. Verizon maintains four
leveraged employee stock ownership plans (ESOPs). Only one plan currently has unallocated shares. Under this plan, a certain
percentage of eligible employee contributions are matched with shares of Verizon’s common stock. We recognize savings plan
cost based on our matching obligation attributed to our participating employees. In addition to the ESOPs, Verizon also maintains
a savings plan for associate employees. We recorded total savings plan costs of $61 million in 2010 and $67 million in 2009.
Verizon New York Inc.
17
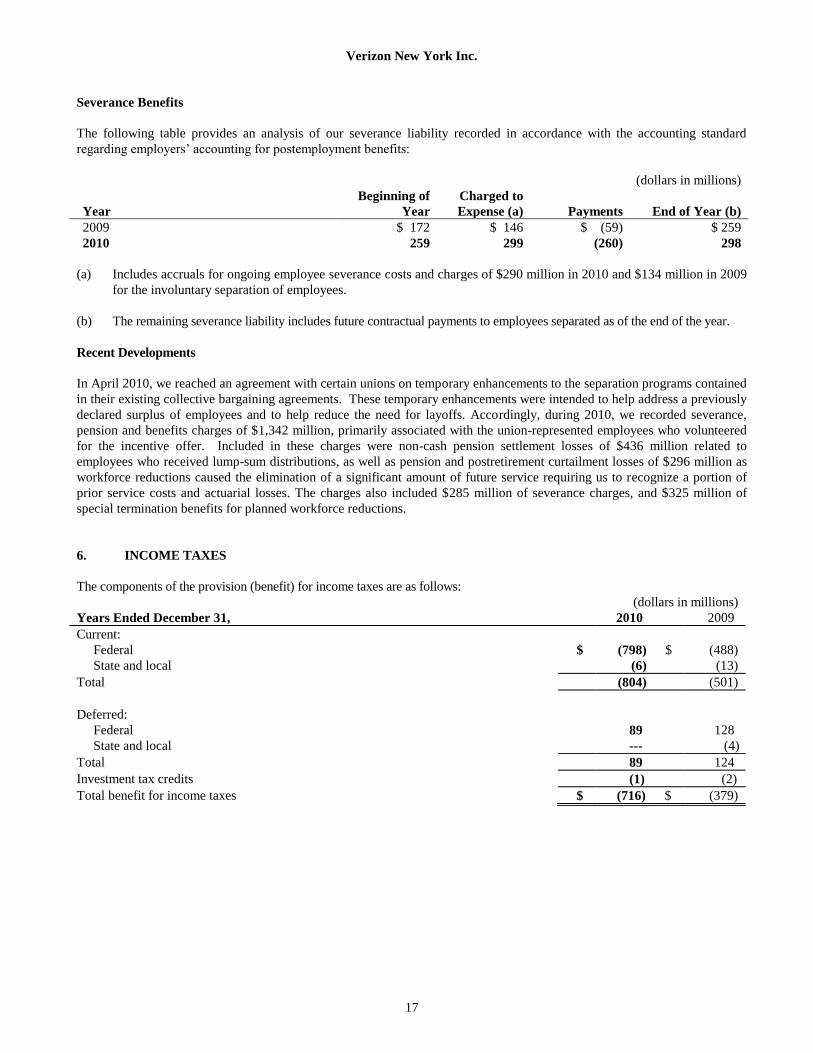
Severance Benefits
The following table provides an analysis of our severance liability recorded in accordance with the accounting standard
regarding employers’ accounting for postemployment benefits:
(dollars in millions)
Year
Beginning of
Year
Charged to
Expense (a) Payments End of Year (b)
2009 $ 172 $ 146 $ (59) $ 259
2010 259 299 (260) 298
(a) Includes accruals for ongoing employee severance costs and charges of $290 million in 2010 and $134 million in 2009
for the involuntary separation of employees.
(b) The remaining severance liability includes future contractual payments to employees separated as of the end of the year.
Recent Developments
In April 2010, we reached an agreement with certain unions on temporary enhancements to the separation programs contained
in their existing collective bargaining agreements. These temporary enhancements were intended to help address a previously
declared surplus of employees and to help reduce the need for layoffs. Accordingly, during 2010, we recorded severance,
pension and benefits charges of $1,342 million, primarily associated with the union-represented employees who volunteered
for the incentive offer. Included in these charges were non-cash pension settlement losses of $436 million related to
employees who received lump-sum distributions, as well as pension and postretirement curtailment losses of $296 million as
workforce reductions caused the elimination of a significant amount of future service requiring us to recognize a portion of
prior service costs and actuarial losses. The charges also included $285 million of severance charges, and $325 million of
special termination benefits for planned workforce reductions.
6. INCOME TAXES
The components of the provision (benefit) for income taxes are as follows:
(dollars in millions)
Years Ended December 31, 2010 2009
Current:
Federal $ (798) $ (488)
State and local (6) (13)
Total (804) (501)
Deferred:
Federal 89 128
State and local --- (4)
Total 89 124
Investment tax credits (1) (2)
Total benefit for income taxes $ (716) $ (379)
Verizon New York Inc.
18
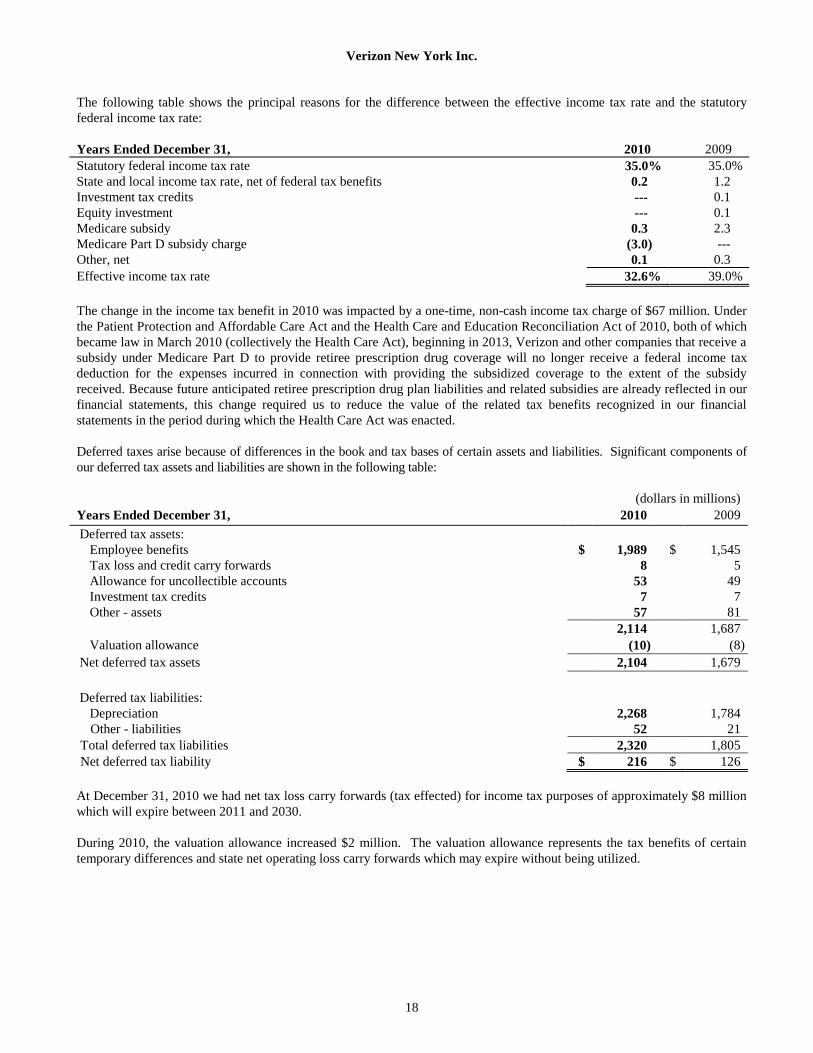
The following table shows the principal reasons for the difference between the effective income tax rate and the statutory
federal income tax rate:
Years Ended December 31, 2010 2009
Statutory federal income tax rate 35.0% 35.0%
State and local income tax rate, net of federal tax benefits 0.2 1.2
Investment tax credits --- 0.1
Equity investment --- 0.1
Medicare subsidy 0.3 2.3
Medicare Part D subsidy charge (3.0) ---
Other, net 0.1 0.3
Effective income tax rate 32.6% 39.0%
The change in the income tax benefit in 2010 was impacted by a one-time, non-cash income tax charge of $67 million. Under
the Patient Protection and Affordable Care Act and the Health Care and Education Reconciliation Act of 2010, both of which
became law in March 2010 (collectively the Health Care Act), beginning in 2013, Verizon and other companies that receive a
subsidy under Medicare Part D to provide retiree prescription drug coverage will no longer receive a federal income tax
deduction for the expenses incurred in connection with providing the subsidized coverage to the extent of the subsidy
received. Because future anticipated retiree prescription drug plan liabilities and related subsidies are already reflected in our
financial statements, this change required us to reduce the value of the related tax benefits recognized in our financial
statements in the period during which the Health Care Act was enacted.
Deferred taxes arise because of differences in the book and tax bases of certain assets and liabilities. Significant components of
our deferred tax assets and liabilities are shown in the following table:
(dollars in millions)
Years Ended December 31, 2010 2009
Deferred tax assets:
Employee benefits $ 1,989 $ 1,545
Tax loss and credit carry forwards 8 5
Allowance for uncollectible accounts 53 49
Investment tax credits 7 7
Other - assets 57 81
2,114 1,687
Valuation allowance (10) (8)
Net deferred tax assets 2,104 1,679
Deferred tax liabilities:
Depreciation 2,268 1,784
Other - liabilities 52 21
Total deferred tax liabilities 2,320 1,805
Net deferred tax liability $ 216 $ 126
At December 31, 2010 we had net tax loss carry forwards (tax effected) for income tax purposes of approximately $8 million
which will expire between 2011 and 2030.
During 2010, the valuation allowance increased $2 million. The valuation allowance represents the tax benefits of certain
temporary differences and state net operating loss carry forwards which may expire without being utilized.
Verizon New York Inc.
19
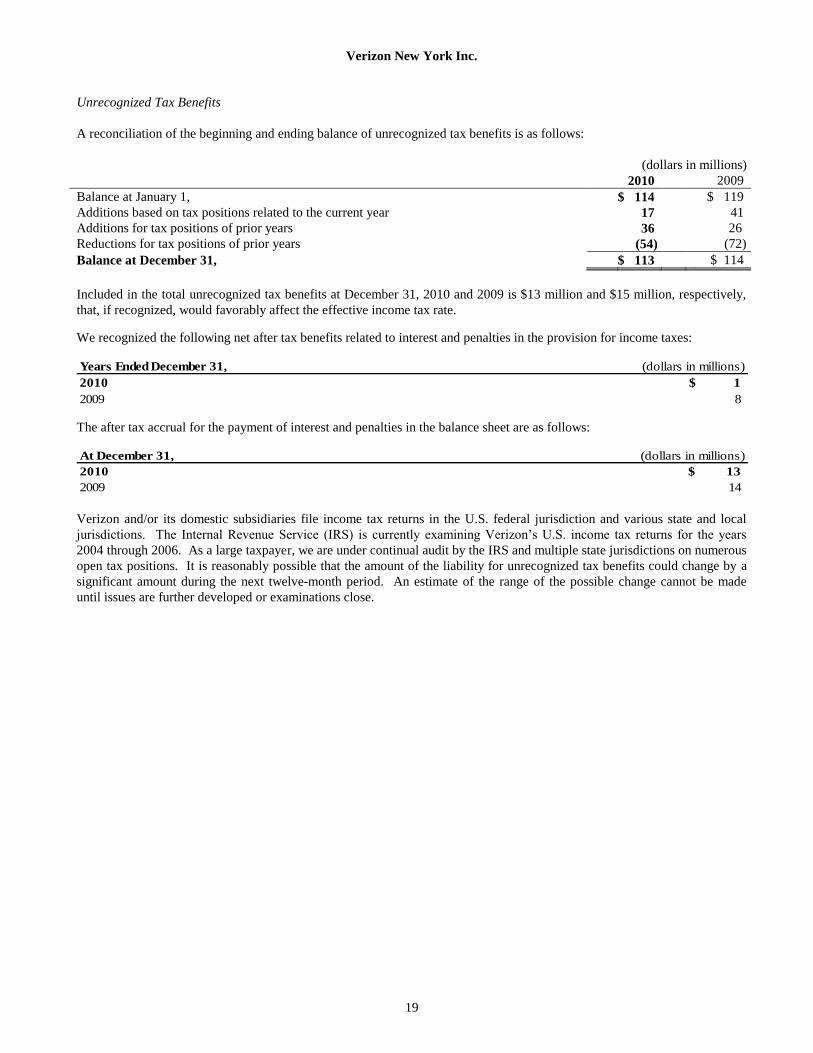
Unrecognized Tax Benefits
A reconciliation of the beginning and ending balance of unrecognized tax benefits is as follows:
(dollars in millions)
2010 2009
Balance at January 1, $ 114 $ 119
Additions based on tax positions related to the current year 17 41
Additions for tax positions of prior years 36 26
Reductions for tax positions of prior years (54) (72)
Balance at December 31, $ 113 $ 114
Included in the total unrecognized tax benefits at December 31, 2010 and 2009 is $13 million and $15 million, respectively,
that, if recognized, would favorably affect the effective income tax rate.
We recognized the following net after tax benefits related to interest and penalties in the provision for income taxes:
Years Ended December 31, (dollars in millions)
2010 1$
2009 8
The after tax accrual for the payment of interest and penalties in the balance sheet are as follows:
At December 31, (dollars in millions)
2010 13$
2009 14
Verizon and/or its domestic subsidiaries file income tax returns in the U.S. federal jurisdiction and various state and local
jurisdictions. The Internal Revenue Service (IRS) is currently examining Verizon’s U.S. income tax returns for the years
2004 through 2006. As a large taxpayer, we are under continual audit by the IRS and multiple state jurisdictions on numerous
open tax positions. It is reasonably possible that the amount of the liability for unrecognized tax benefits could change by a
significant amount during the next twelve-month period. An estimate of the range of the possible change cannot be made
until issues are further developed or examinations close.

Verizon New York Inc.
20
7. TRANSACTIONS WITH AFFILIATES
Our consolidated financial statements include transactions with the following affiliates:
(dollars in millions)
At December 31, 2010 2009
Operating revenues:
Verizon Internet Services Inc. $ 706 $ 648
Verizon Business 275 351
Verizon Wireless Inc. 95 78
Verizon Services 59 56
Verizon Operating Telephone Companies 1 2
Other --- 1
$ 1,136 $ 1,136
Operating expenses:
Verizon Services $ 1,710 $ 2,036
Verizon Operating Telephone Companies 637 835
Verizon Data Services Inc. 249 240
Verizon Wireless Inc. 4 5
Verizon Business 4 4
$ 2,604 $ 3,120
Other income (expense), net:
Equity income from investees $ 2 $ 3
Interest income from Verizon Network Funding Corp. 1 1
$ 3 $ 4
Interest expense:
Interest expense to Verizon Financial Services LLC $ 169 $ 105
Dividends received from affiliates $ --- $ 22
Outstanding balances with affiliates are reported on the balance sheets at December 31, 2010 and 2009 as Notes receivable
from affiliates, Accounts receivable - affiliates, Notes payable to affiliates, and Accounts payable and accrued liabilities -
affiliates.
Verizon Internet Services Inc.
Our operating revenues include transactions with Verizon Internet Services Inc. (Verizon Internet Services) associated with
the provision of network access and billing and collection services. These revenues are earned from Verizon Internet Services
who utilizes our facilities to provide Internet access services to their customers.
Verizon Business
Our operating revenues include transactions with Verizon Business associated with the provision of network access services,
wholesale interconnection service agreements and from billing and collection services.
Our operating expenses also include transactions with Verizon Business. We recognize costs associated with interconnection
agreements and capacity services agreements.

Verizon New York Inc.
21
Verizon Wireless Inc.
Our operating revenues include transactions with Verizon Wireless Inc. (Verizon Wireless) associated with the provision of
local and network access services, billing and collection services and from interconnection agreements. These revenues are
earned from Verizon Wireless who provides wireless voice and data services, paging services and equipment sales to their
customers.
Our operating expenses also include transactions with Verizon Wireless. We recognize costs associated with wireless voice
and data services and for interconnection agreements.
Verizon Services
Our operating revenues include transactions with Verizon Services (including Verizon Services Corp., Verizon Services
Group and Verizon Corporate Services Group Inc., and Verizon Long Distance) for the provision of local telephone service
and for the rental of facilities and equipment.
We have contractual arrangements with Verizon Services for the provision of various centralized services. These services are
divided into two broad categories. The first category is comprised of network related services which generally benefit only
Verizon’s operating telephone subsidiaries. These services include marketing, sales, legal, accounting, finance, data
processing, materials management, procurement, labor relations, and staff support for various network operations. The
second category is comprised of overhead and support services which generally benefit all subsidiaries of Verizon. Such
services include corporate governance, corporate finance, external affairs, legal, media relations, employee communications,
corporate advertising, human resources, treasury, and rent expenses associated with the rental of facilities and equipment.
Costs may be either directly assigned to one subsidiary or allocated to more than one subsidiary based on functional reviews
of the work performed.
Verizon Operating Telephone Companies
Our operating revenues and expenses include transactions with other Verizon operating telephone companies. Revenues and
expenses associated with transactions with these affiliates are primarily earned from the rental of facilities and equipment.
Verizon Data Services Inc.
Verizon Data Services Inc. provides data processing services, software application development and maintenance, which
generally benefit Verizon’s operating telephone subsidiaries, including us. We are charged for these affiliated transactions
based on proportional cost allocation methodologies.
Other Affiliates
Other operating revenues primarily include miscellaneous items of income resulting from transactions with other affiliates.
These transactions include primarily the provision of local and network access services and rental of facilities and equipment.
Verizon Network Funding Corp. and Verizon Financial Services LLC
We recognize interest expense/income in connection with contractual agreements with affiliated companies, Verizon Network
Funding Corp. and Verizon Financial Services LLC, for the provision of short-term financing and cash management services.

Verizon New York Inc.
22
8. ADDITIONAL FINANCIAL INFORMATION
The tables below provide additional financial information related to our consolidated financial statements:
(dollars in millions)
Years Ended December 31, 2010 2009
Cash Flow Information:
Cash paid (refunded) during the year for:
Income taxes refunded, net $ (720) $ (456)
Interest, net of amounts capitalized (excluding affiliates) 166 178
Income Statement Information:
Depreciation expense 1,222 1,234
Interest costs incurred 342 296
Capitalized interest (14) (16)
Advertising expense (allocated to us by Verizon Services) 152 114
9. COMMITMENTS AND CONTINGENCIES
Various legal actions and regulatory proceedings are pending to which we are a party and claims which, if asserted, may lead to
other legal actions. We have established reserves for specific liabilities in connection with regulatory and legal matters that we
currently deem to be probable and estimable. We do not expect that the ultimate resolution of pending regulatory and legal
matters in future periods will have a material effect on our financial condition, but it could have a material effect on our results of
operations.
From time to time, state regulatory decisions require us to assure customers that we will provide a level of service
performance that falls within prescribed parameters. There are penalties associated with failing to meet those service
parameters and we, from time to time, pay such penalties. We do not expect these penalties to have a material effect on our
financial condition, but they could have a material effect on our results of operations.