consolidated financial statements 2014 - rabobank · pdf filenotes to the consolidated...
TRANSCRIPT

Consolidated Financial Statements 2014 Rabobank GroupMarch 2015www.rabobank.com/annualreports
Rabobank Group
Consolidated Financial Statements 2014

Contents
General information 3
Consolidated statement of financial position 4
Consolidated statement of income 6
Consolidated statement of comprehensive income 7
Consolidated statement of changes in equity 8
Consolidated statement of cash flows 9
Notes to the consolidated Financial statements 10
1 Basis of consolidation 10
2 Accounting policies 10
3 Solvency and capital management 28
4 Risk exposure of financial instruments 30
5 Business segments 51
6 Cash and cash equivalents 57
7 Due from other banks 57
8 Financial assets held for trading 57
9 Other financial assets at fair value through profit or loss 58
10 Derivative financial instruments and other trade liabilities 58
11 Loans to customers 63
12 Available-for-sale financial assets 65
13 Investments in associates and joint ventures 65
14 Intangible assets 67
15 Property and equipment 68
16 Investment properties 69
17 Other assets 69
18 Due to other banks 71
19 Due to customers 71
20 Debt securities in issue 71
21 Other liabilities 71
22 Other financial liabilities at fair value through profit or loss 72
23 Provisions 72
24 Deferred tax 73
25 Employee benefits 74
26 Subordinated debt 76
27 Contingencies and commitments 76
28 Equity of Rabobank Nederland and local Rabobanks 77
29 Rabobank Certificates 78
30 Capital Securities and Trust Preferred Securities III to VI 79
31 Other non-controlling interests 82
32 Interest 83
33 Commissions 84
34 Income from associates 84
35 Net income from financial assets and liabilities
at fair value through profit or loss 84
36 Other income 85
37 Staff costs 85
38 Other administrative expenses 86
39 Depreciation and amortisation 87
40 Value adjustments 87
41 Bank tax and resolution levy 87
42 Taxation 87
43 Non-current assets and liabilities held for sale 88
44 Acquisitions and disposals 89
45 Transactions with related parties 89
46 Costs of external auditor 90
47 Remuneration of members of the Supervisory Board
and Executive Board 90
48 Principal subsidiaries and associates 92
49 Joint ventures 93
50 Transfer of financial assets and financial assets
provided as collateral 94
51 Structured entities 95
52 Events after the reporting date 96
53 Consolidated balance sheet as at 1 January 2013 97
54 Management’s report on internal control
over financial reporting 98
55 Approval of Supervisory Board 99
Independent auditor’s report 100
Independent auditor’s assurance report 105

2 Consolidated Financial Statements 2014 Rabobank Group
3 General information
General information
Rabobank Group (Rabobank) is an international financial services provider with roots as a cooperative
organisation. Rabobank comprises 113 independent local Rabobanks (with a total of 547 branches) in the
Netherlands, members of the central organisation Coöperatieve Centrale Raiffeisen-Boerenleenbank B.A.
(Rabobank Nederland) and several specialised subsidiaries. Rabobank provides international services in retail
banking, wholesale banking, leasing and real estate. Rabobank puts the common interest of individuals and
communities first, and in our services we place a premium on adding value for customers. Our focus in the
home market is on being the general market leader, while internationally we concentrate on expanding our
leading position as a food and agri bank. Rabobank operates in a total of 40 countries and employs around
48,200 FTEs.
Rabobank Nederland is a cooperative whose capital is divided into shares. It is largely the product of a merger
on 1 December 1972 of the two largest Dutch cooperative entities at the time. Rabobank Nederland has its
registered office in Amsterdam and is established under Dutch law for an indefinite period. Rabobank
Nederland is registered at the Trade Registry of the Chamber of Commerce under number 30046259.
Membership of Rabobank Nederland is open to cooperative banks whose Articles of Association have been
approved by Rabobank Nederland; they comprise the local Rabobanks.
The operations of Rabobank Nederland can roughly be divided into three categories. For one, it acts as a
‘central bank’ for local Rabobanks, which involves facilitating the establishment, viability and development
of cooperative banks, as well as signing agreements with, negotiating about the rights of, and entering into
obligations on behalf of, local Rabobanks (to the extent that these obligations have the same impact at all
local Rabobanks). Second, by virtue of the law it has a supervisory and regulatory role in relation to the local
Rabobanks, and third, it operates its own banking business, which is both complementary to and
independent from the business operated by the local Rabobanks.
The latter constitute an organisation of cooperative entities established under and governed by Dutch law.
At 31 December 2014, the local Rabobanks had a total of around 2.0 million members.
Address:
Croeselaan 18
P.O. Box 17100
3500 HG Utrecht
The Netherlands
www.rabobank.com

4 Consolidated Financial Statements 2014 Rabobank Group
In millions of euros NoteAt 31 December
2014At 31 December
2013
Assets
Cash and cash equivalents 6 43,409 43,039
Due from other banks 7 45,302 40,787
Financial assets held for trading 8 4,279 5,289
Other financial assets at fair value through profit or loss 9 4,325 4,939
Derivative financial instruments 10 56,489 39,703
Loans to customers 11 462,447 455,909
Available-for-sale financial assets 12 39,770 46,552
Investments in associates and joint ventures 13 3,807 3,747
Intangible assets 14 2,059 1,991
Property and equipment 15 7,148 6,901
Investment properties 16 452 1,055
Current tax assets 211 170
Deferred tax assets 24 2,501 1,910
Other assets 17, 25 8,560 8,030
Non-current assets held for sale and discontinued operations 43, 44 327 9,073
Total assets 681,086 669,095
Consolidated statement of financial position

5
In millions of euros NoteAt 31 December
2014At 31 December
2013
Liabilities
Due to other banks 18 17,883 14,745
Due to customers 19 326,471 326,222
Debt securities in issue 20 189,060 195,361
Derivative financial instruments and other trade liabilities 10 67,560 50,171
Other debts 21, 25 8,047 7,749
Other financial liabilities at fair value through profit or loss 22 19,744 19,069
Provisions 23 794 1,050
Current tax liabilities 255 266
Deferred tax liabilities 24 473 288
Subordinated debt 26 11,928 7,815
Liabilities held for sale and discontinued operations 43, 44 - 7,825
Total liabilities 642,215 630,561
Equity
Equity of Rabobank Nederland and local Rabobanks 28 24,894 23,731
Equity instruments issued directly
Rabobank Certificates 29 5,931 5,823
Capital Securities 30 6,349 7,029
12,280 12,852
Equity instruments issued by subsidiaries
Capital Securities 30 181 236
Trust Preferred Securities III to VI 30 1,043 1,269
1,224 1,505
Other non-controlling interests 31 473 446
Total equity 38,871 38,534
Total equity and liabilities 681,086 669,095

6 Consolidated Financial Statements 2014 Rabobank Group
For the year ended 31 December
In millions of euros Note 2014 2013
Interest income 32 18,638 19,707
Interest expense 32 9,520 10,612
Interest 32 9,118 9,095
Commission income 33 2,075 2,189
Commission expense 33 196 188
Commission 33 1,879 2,001
Income from associates 34 81 79
Net income from financial assets and liabilities at fair value through profit or loss 35 219 232
Gains (losses) on available-for-sale financial assets 12 418 56
Other results 36 1,142 1,567
Income 12,857 13,030
Staff costs 37 5,086 5,322
Other administrative expenses 38 2,532 3,910
Depreciation 39 437 528
Operating expenses 8,055 9,760
Value adjustments 40 2,633 2,643
Bank tax and resolution levy 41 488 197
Operating profit before taxation 1,681 430
Taxation 42 (161) 88
Net profit from continuing operations 1,842 342
Net profit from discontinued operations 43 - 1,665
Net profit 1,842 2,007
Of which allocable to Rabobank Nederland and local Rabobanks 28 620 929
Of which allocable to holders of Rabobank Certificates 29 385 309
Of which allocable to Capital Securities 30 705 655
Of which allocable to Trust Preferred Securities III to VI 30 74 67
Of which allocable to other non-controlling interests 31 58 47
Net profit for the year 1,842 2,007
Consolidated statement of income

7
For the year ended 31 December
In millions of euros Note 2014 2013
Net profit 1,842 2,007
Unrealised gains and losses after taxation arising in the period that is transferred to profit or loss if specific conditions are met
Foreign currency translation reserves 28
Currency translation differences 325 (341)
Revaluation reserve - Available-for-sale financial assets 28
Currency translation differences (34) (43)
Changes in associates 86 (28)
Fair value changes 533 (34)
Amortisation of reclassified assets 13 37
Transferred to profit or loss (237) (70)
Revaluation reserve - Associates 28
Fair value changes (27) (21)
Revaluation reserve - Cash flow hedges 28
Fair value changes 548 (1,450)
Transferred to profit or loss (586) 1,459
Non-controling interests 31
Translation differences 22 (16)
Unrealised gains and losses after taxation arising in the period not transferred to profit or loss
Foreign currency translation differences 28
Currency translation differences Trust Preferred Securities III to VI 156 (71)
Revaluation reserve - Pensions 28
Fair value changes (25) (758)
Total other comprehensive income 774 (1,336)
Total comprehensive income 2,616 671
Of which allocable to Rabobank Nederland and local Rabobanks 1,372 (391)
Of which allocable to holders of Rabobank Certificates 385 309
Of which allocable to Capital Securities 705 655
Of which allocable to Trust Preferred Securities III to VI 74 67
Of which allocable to other non-controlling interests 80 31
Total comprehensive income 2,616 671
Consolidated statement of comprehensive income

8 Consolidated Financial Statements 2014 Rabobank Group
In millions of euros Note
Equity of Rabobank
Nederland andlocal Rabobanks
Equity instruments
issued directly
Equity instruments
issued by subsidiaries
Other non-
controllinginterests Total
At 1 January 2014 23,731 12,852 1,505 446 38,534
Net profit 620 1,072 92 58 1,842
Total other comprehensive income: 28
Foreign currency translation reserves 481 - - 22 503
Revaluation reserve - Available-for-sale financial assets 361 - - - 361
Revaluation reserve - Associates (27) - - - (27)
Revaluation reserve - Cash flow hedges (38) - - - (38)
Revaluation reserve - Pensions (25) - - - (25)
Total comprehensive income 1,372 1,072 92 80 2,616
Payment on Rabobank Certificates, Trust Preferred Securities III to VI and Capital Securities - (1,072) (92) - (1,164)
Redemption of Capital Securities and Trust Preferred Securities V and VI 30 (167) (648) (443) - (1,258)
Rabobank Certificates issued during the year 29 - 108 - - 108
Other (42) (32) 162 (53) 35
At 31 December 2014 24,894 12,280 1,224 473 38,871
At 1 January 2013 25,311 13,786 1,576 1,407 42,080
Change in accounting policy IFRS 10 and 11 - - - (588) (588)
Adjustment of payments on Rabobank Certificates, Trust Preferred Securities III to VI and Capital Securities (994) - - - (994)
Revised amount at 1 January 2013 24,317 13,786 1,576 819 40,498
Net profit 929 946 85 47 2,007
Total other comprehensive income: 28
Foreign currency translation reserves (412) - - (16) (428)
Revaluation reserve - Available-for-sale financial assets (138) - - - (138)
Revaluation reserve - Associates (21) - - - (21)
Revaluation reserve - Cash flow hedges 9 - - - 9
Revaluation reserve - Pensions (758) - - - (758)
Total comprehensive income (391) 946 85 31 671
Payment on Rabobank (Member) Certificates, Trust Preferred Securities III to VI and Capital Securities - (946) (85) - (1,031)
Redemption of Capital Securities 30 (14) (83) - - (97)
Exchange of Rabobank Extra Member Bonds 29 - 225 - - 225
Rabobank (Member) Certificates redeemed during the year 29 - (2,074) - - (2,074)
Rabobank (Member) Certificates issued during the year 29 - 1,000 - - 1,000
Costs of issuance of Rabobank (Member) Certificates 29 (79) - - - (79)
Premium (Discount) in relation to Rabobank (Member) Certificates 29 (133) - - - (133)
Increase of share in structured finance deal 31 - - - (360) (360)
Other 31 (2) (71) (44) (86)
At 31 December 2013 23,731 12,852 1,505 446 38,534
Consolidated statement of changes in equity

9
For the year ended 31 December
In millions of euros Note 2014 2013
Cash flows from operating activities
Operating profit before taxation from continuing operations 1,681 430
Operating profit before taxation from discontinued operations - 1,719
Adjusted for:
Non-cash items recognised in operating profit before taxation
Depreciation 39 437 528
Depreciation of operating lease assets and investment properties 15, 16 924 818
Value adjustments 40 2,633 2,643
Impairment on property activities 40 637
Result on sale of property and equipment 17 20
Income from associates 34 (81) (79)
Fair value results on financial assets and liabilities at fair value through profit or loss 35 (219) (232)
Gains (losses) on available-for-sale financial assets 12 (418) (56)
Result from termination of DB scheme - (2,022)
Provisions (256) 220
Non-cash items relating to discontinued operations - 204
Net change in operating assets
Due from and to other banks 7, 18, 40, 43 (1,513) (17,014)
Financial assets held for trading 8, 35 2,724 64
Derivative financial instruments 10 (16,676) 25,591
Net change in other financial assets and liabilities at fair value through profit or loss 9, 22, 43 57 (3,021)
Loans to customers 11, 40, 43 (2,976) 20,298
Dividends received from associates and financial assets 96 95
Net change in liabilities relating to operating activities
Derivative financial instruments and other trade liabilities 10 17,288 (24,520)
Due to customers 19, 43 (6,143) (1,642)
Debt securities in issue 20 (6,588) (27,689)
Other debts 21, 43 91 (2,818)
Income tax paid (338) (318)
Other changes (4,243) 1,451
Net cash flow from operating activities (13,463) (24,693)
Cash flows from investing activities
Acquisition of associates net of cash and cash equivalents acquired 13 (54) (58)
Disposal of associates net of cash and cash equivalents 54 1
Acquisition of subsidiaries net of cash and cash equivalents acquired - -
Disposal of subsidiaries net of cash and cash equivalents 44 591 1,788
Acquisition of property and equipment and investment properties 15, 16 (2,360) (1,791)
Proceeds from sale of property and equipment 1,609 669
Acquisition of available-for-sale financial assets and held-to-maturity financial assets 12 (9,863) (44,524)
Proceeds from sale and repayment of available-for-sale financial assets and held-to-maturity financial assets 19,528 44,167
Net cash flow from investing activities 9,505 252
Cash flows from financing activities
Acceptance of Rabobank Certificates 29 - (2,788)
Sale of Rabobank Certificates - 1,465
Issuance of Rabobank Certificates 108 -
Redemption of Trust Preferred Securities V and VI (382) -
Payments on Rabobank Certificates, Trust Preferred Securities III to VI and Capital Securities (1,164) (1,030)
Payments on Senior Contingent Notes and Rabo Extra Member Bonds (86) (86)
Redemption of Capital Securities 30 (709) (83)
Proceeds from issue of subordinated debt 3,607 3,224
Repayment of subordinated debt (9) (733)
Net cash flow from financing activities 1,365 (31)
Net change in cash and cash equivalents (2,593) (24,472)
Cash and cash equivalents at beginning of year 43,039 68,103
Foreign exchange differences on cash and cash equivalents 2,963 (592)
Cash and cash equivalents at end of year 43,409 43,039
The cash flows from interest are included in the net cash flow from operating activities
Interest income 18,877 19,928
Interest expense 9,739 9,660
Consolidated statement of cash flows

10 Consolidated Financial Statements 2014 Rabobank Group
Notes to the consolidated financial statements
1 Basis of consolidation
Rabobank Group (Rabobank) comprises the local Rabobanks (Members), the central cooperative Rabobank
Nederland and a number of specialised subsidiaries. Rabobank Nederland advises the Members and assists
them in the provision of their services. Rabobank Nederland also supervises the local Rabobanks by virtue
of the Dutch Financial Supervision Act (Wet op het financieel toezicht). Furthermore, under the same Act,
the Dutch Ministry of Finance has designated Rabobank Nederland as a holder of a collective license for
purposes of conduct-of-business supervision.
Rabobank’s cooperative structure has several executive levels, each with its own duties and responsibilities.
In annual financial reporting terms, Rabobank Nederland exercises control over the local Rabobanks.
The consolidated financial statements of Rabobank include the financial information of Rabobank Nederland
and that of the Members and other group companies.
2 Accounting policies
The main accounting policies used in preparing these consolidated financial statements are explained below.
2.1 General informationThe consolidated financial statements of Rabobank have been prepared in accordance with International
Financial Reporting Standards (IFRS) as adopted by the European Union.
New and amended standards issued by the IASB and endorsed by the European Union, applicable to the
financial year under review
IFRS 10 Consolidated Financial StatementsThis standard supersedes the consolidation rules of IAS 27 and SIC 12. IFRS 10 has important
consequences for the consideration as to when a company has control over another entity. The effect on
profit and equity is detailed in the paragraph entitled ‘Changes in accounting policies and presentation’.
The standard applies effective 1 January 2014.
IFRS 11 Joint ArrangementsThe IASB issued a standard regarding joint ventures in May 2011, which supersedes IAS 31 and SIC 13.
The proportional consolidation of joint ventures is no longer authorised. Any interests in joint ventures must
be accounted for using only the equity method. This amendment achieves closer convergence with US GAAP.
The remaining rules are largely identical to IAS 31. The effect on profit and equity is included in the paragraph
entitled ‘Changes in accounting policies and presentation’. This standard applies effective 1 January 2014.
IFRS 12 Disclosure of Interests in Other EntitiesIFRS 12 aims to enable users of financial statements to assess the purpose and associated risks of interests
held in other entities, as well as the effects of those interests on the financial position, results and cash flows.
This pertains to additional disclosures and has no effect on results or equity. The standard applies effective
1 January 2014.

11 Notes to the consolidated financial statements
Amendments to IFRS 10, IFRS 11 and IFRS 12 – Transition GuidanceThe objective of these amendments to IFRS 10 – The Consolidated Financial Statements, IFRS 11 –
Joint Arrangements and IFRS 12 – Disclosure of Interests in Other Entities, are designed to clarify the initial
publication of the transitional guideline in IFRS 10. The changes also provide additional transition support in
IFRS 10, IFRS 11 and IFRS 12 and reduce the requirement of providing only comparative information adapted
to the previous comparative period. In addition, as a result of the changes for information provision relating to
non-consolidated structured entities, the requirement of submitting comparative information for periods
prior to the initial application of IFRS 12 will be cancelled. This amendment has no impact on profit or equity
and took effect on 1 January 2014.
Amendments to IFRS 10, IFRS 12 and IAS 27 – Investment EntitiesIFRS 10 has been amended in order to better reflect the business model of investment entities. It requires that
investment entities measure their subsidiaries at fair value through profit or loss rather than consolidate them.
IFRS 12 has been amended in order to require specific disclosure about such subsidiaries of investment
entities. The amendments to IAS 27 also eliminated the option for investment entities to measure investments
in certain subsidiaries either at cost or at fair value in their separate financial statements. This amendment,
which has no impact on Rabobank, applies effective 1 January 2014.
IAS 27 Separate Financial StatementsThe consolidation requirements formerly included in IAS 27 are now included in IFRS 10. The amended IAS 27
is intended for the separate financial statements of entities also preparing consolidated financial statements.
The standard has no impact on Rabobank’s consolidated financial statements and applies effective 1 January
2014.
IAS 28 Investments in AssociatesIAS 28 lays down accounting requirements for investments in associates and describes the requirements
for recognising investments in associates and joint ventures in accordance with the equity method of
accounting. The standard has no impact on profit or equity and applies effective 1 January 2014.
IAS 32 Financial Instruments: PresentationThe objective of the amendment to IAS 32 is to provide additional guidelines, so as to ensure that the
standard is used more consistently in practice. This amendment has no impact on profit or equity and took
effect on 1 January 2014.
Amendments to IAS 39 Financial Instruments: Novation of Derivatives and Continuation of Hedge AccountingThe objective of the amendments is to provide relief in situations where a derivative, which has been
designated as a hedging instrument, is novated from one counterparty to a central counterparty as a
consequence of laws or regulations. Such a relief means that hedge accounting can continue irrespective of
the novation which, without the amendment, would not be permitted. This standard, which does not affect
profit or equity, applies effective 1 January 2014.
Amendments to IAS 36 Impairment of AssetsThe objective of these amendments is to clarify that the scope of disclosures of information about the
recoverable amount of assets, where this amount is based on fair value less costs of disposal, is limited to
impaired assets, if this recoverable amount is based on fair value less costs of disposal. This standard has
no impact on profit or equity and applies effective 1 January 2014.

12 Consolidated Financial Statements 2014 Rabobank Group
IFRIC Interpretation 21 – LeviesThis interpretation relates to the administrative processing of an obligation to pay a charge if this obligation
falls within the scope of IAS 37. In addition, it also relates to the administrative processing of an obligation to
pay a charge of which the timescale and amount have been confirmed. This standard has no impact on profit
or equity and took effect on 1 January 2014.
New and amended standards issued by the International Accounting Standards Board (IASB) and endorsed by the European Union which do not yet apply in the current financial year
Amendments to IAS 19: Defined Benefit Plans: Employee ContributionsThe objective of this amendment is to simplify and clarify the administrative processing of employee
contributions or contributions from third parties in relation to defined benefit pension schemes. This standard
has no impact on profit or equity and took effect on 1 January 2014.
Improvements to International Financial Reporting Standards cycle 2010-2012 and cycle 2011-2013The objective of the improvements is to address non-urgent, but necessary issues discussed by the IASB
during the project cycle that began in 2009 on areas of inconsistencies in IFRS or where clarification of
wording is required. The amendments to IFRS 3, 8 and 13 and IAS 16, 24 and 38 represent clarifications of,
or adjustments to, the respective standards. The amendments to IFRS 2 and 3 and IAS 40 concern changes to
the existing requirements or additional guidelines for the application of these requirements.
New standards issued by the IASB, but not yet endorsed by the European Union• IFRS 14 Regulatory Deferral Accounts
• IFRS 15 Revenue from Contracts with Customers
• Amendments to IAS 16 and IAS 38: Clarification of Acceptable Methods of Depreciation and Amortisation
• Amendments to IAS 16 and IAS 41: Bearer Plants
• Amendments to IAS 27: Equity Method in Separate Financial Statements
• Amendments to IFRS 10 and IAS 28: Sale or Contribution of Assets between an Investor and its Associate
or Joint Venture
• Amendments to IFRS 11: Accounting for Acquisitions of Interests in Joint Operations
• Improvements to International Financial Reporting Standards cycle 2012-2014
Although these new requirements are currently being analysed and their impact is not yet known, Rabobank
does not expect the implementation of these amended standards to have a significant impact on profit or equity.
IFRS 9 Financial InstrumentsThe International Accounting Standards Board published IFRS 9 Financial Instruments in July 2014. The effective
date of IFRS 9 is 1 January 2018, but this date may be changed depending on endorsement by the European
Union.
The application of IFRS 9 may have a significant impact on profit or loss and capital; this is currently being
investigated.
The consolidated financial statements have been prepared on the basis of the accounting policies mentioned
hereafter. The remaining assets and liabilities are accounted for on a historical cost basis, unless otherwise
stated. Unless otherwise stated, all amounts in these financial statements are in millions of euros.

13 Notes to the consolidated financial statements
Changes in accounting policies and presentation as a result of new guidelinesThe new standard IFRS 11 was applied for the first time in 2014, and the comparative data were modified in
accordance with IFRS 11. As a result of IFRS 11, a number of joint ventures in the Real Estate segment are no
longer consolidated on a proportional basis. These joint ventures are recognised as investments in ‘Associates
and joint ventures’. This has the following effect on the figures as shown in the 2013 consolidated financial
statements:
In millions of euros31 December
2013
Assets
Due from other banks (38)
Other financial assets at fair value through profit or loss (8)
Loans to customers 48
Investments in associates and joint ventures 102
Investment properties (18)
Current tax assets (20)
Deferred tax assets (1)
Other assets (255)
Non-current assets held for sale and discontinued operations (107)
Total assets (297)
Liabilities
Due to other banks (171)
Other debts (199)
Provisions 78
Current tax liabilities (2)
Deferred tax liabilities (2)
Total liabilities (296)
Equity (1)
Total liabilities and equity (297)
In millions of eurosFor the year ended 31 December
2013
Interest income 3
Interest charges (10)
Interest 13
Commission income (4)
Commission expense (1)
Commission (3)
Income from associates (76)
Net income from financial assets and liabilities at fair valuethrough profit or loss (2)
Gains/(losses) on available-for-sale financial assets -
Other income 85
Total income 17
Staff costs (2)
Other administrative expenses -
Depreciation -
Operating expenses (2)
Value adjustments -
Bank tax and resolution levy -
Operating profit before taxation 19
Taxation 19
Net profit from continuing operations -
Net profit from discontinued operations -
Net profit -

14 Consolidated Financial Statements 2014 Rabobank Group
The new standard IFRS 10 was applied for the first time in 2014 and has resulted in the deconsolidation of
three entities in Wholesale banking and international retail banking segment. The comparative data have been
adjusted. This has the following effect on the figures shows in the consolidated financial statements for 2013:
In millions of euros 31 December 2013
Assets
Due from other banks (19)
Other financial assets at fair value through profit or loss (24)
Loans to customers (4,341)
Available-for-sale financial assets 141
Investments in associates and joint ventures 16
Other assets (211)
Total assets (4,438)
Liabilities
Due to other banks (580)
Due to customers (3,178)
Other debts (89)
Current tax liabilities 1
Total liabilities (3,846)
Equity (592)
Total liabilities and equity (4,438)
In millions of euros For the year ended 31 December 2013
Interest income (52)
Interest charges (41)
Interest (11)
Commission income (1)
Commission expense (5)
Commission 4
Income from associates (2)
Net income from financial assets and liabilities at fair value through profit or loss 2
Gains/(losses) on available-for-sale financial assets -
Other income -
Total income (7)
Staff costs (1)
Other administrative expenses (2)
Depreciation -
Operating expenses (3)
Value adjustments -
Bank tax and resolution levy -
Operating profit before taxation (4)
Taxation 1
Net profit from continuing operations (5)
Net profit from discontinued operations -
Net profit (5)
Other changes in accounting principles and presentationFor the notes to the consolidated financial statements, write-offs on allowance for loan losses of corporate
(international) clients occurred until the end of 2013 at the moment it was clear in substance that there was
no recovery expected in a reasonable way. Starting in 2014, the data contained in the financial statements are
fully consistent with the credit administration, with the write-offs being effected at the time of final settlement.
As a result, the accountability of prudential regulations and the consolidated financial statements are consistent
with each other, resulting in greater comparability. The total value adjustments of loans to customers changed
from 3,715 to 7,655 and from 4,177 to 8,581 as of 1 January and 31 December 2013, respectively.

15 Notes to the consolidated financial statements
Upon adopting IFRS 13 ‘Fair value measurement’ in 2013, Rabobank continued to erroneously apply mid
prices for valuing derivatives for hedging interest rates and currency risks, which was allowed under the
previous standard but not under IFRS 13, unless an option under IFRS 13 was used. The effect on the 2013
and 2014 profit represented a loss of 286 and a gain of 170, respectively. Since this adjustment results in
inconsistencies in the recognition of financial assets and liabilities and derivatives for hedging risks, the option
under IFRS 13 was used in 2014 and the accounting policy was changed. As part of this change, mid prices
are used for the valuation of specific derivatives; see the accounting principles for derivative financial
instruments in paragraph 2.3.1. The effect on the profit or loss for 2013 of the new accounting policy is a gain
of 291, and for 2014 an expense of 187. The impact on the change in the accounting policy largely offsets the
effect of the adjustment. The net amount in the consolidated statement of income is 5 for 2013 and -16 for 2014.
On the implementation of IFRS in Rabobank’s consolidated financial statements, payments on equity
instruments were erroneously recognised as prepayments and recognised under ‘Other assets’, because there
is a balance sheet before profit appropriation; this occurred in the course of the year in anticipation of the
formal approval regarding profit appropriation adopted by the General Meeting during the following year.
Since amounts paid during the year effectively cannot be reclaimed, it was decided to take such amounts
directly to equity upon payment. The solvency risks are not affected by this adjustment. The equity of
Rabobank and local Rabobanks, other assets are other liabilities have been adjusted as follows:
31 December 2013 1 January 2013
Equity before adjustment of payments on equity instruments 24,640 25,311
Decrease in other assets (309) (328)
Increase in other liabilities (600) (666)
Equity after adjustments of payments on equity instruments 23,731 24,317
2.1.2 Judgements and estimatesThese financial statements were prepared on the basis of the going concern assumption, as there are no
indications of Rabobank’s inability to continue as a going concern.
The preparation of the financial statements requires management to make estimates and assumptions that
affect the amounts reported for assets and liabilities, the reporting of contingent assets and liabilities at the
date of the financial statements, as well as the amounts reported for income and expenses during the
reporting period. The situations that are assessed based on available financial data and information mainly
concern the determination of the fair value of assets and liabilities and impairments. Although management
based their estimates on the most careful assessment of the current circumstances and activities, the actual
results might deviate from these estimates. For the estimated modifications arising from the Asset Quality
Review (AQR), please refer to paragraph 4.4.9. Due to weaker market conditions for both residential and
commercial real estate and the limited number of transactions, there is increased uncertainty regarding
property valuation (i.e. land holdings, work in progress, completed developments and property investments)
and property financing. Property valuation is subject to a number of different assumptions and valuation
methods. The use of different assumptions and methods may, due to the subjective nature involved, result in
different outcomes.
2.2 Group financial statements2.2.1 SubsidiariesThe participating interests over which Rabobank maintains control are subsidiaries (including structured
entities) and are consolidated. Control is exercised over a participating interest if the investor is exposed to,
or is entitled to, fluctuating income in respect of his involvement in the participating interest and has the
opportunity to influence this income by using his control over the participating interest. The assets, liabilities
and profit/loss of these companies are fully consolidated.
Subsidiaries are consolidated as of the date on which the effective control is transferred to Rabobank and will no
longer be consolidated as of the date on which this control is terminated. All transactions, balances and unrealised
gains and losses from transactions between Rabobank Group subsidiaries have been eliminated on consolidation.

16 Consolidated Financial Statements 2014 Rabobank Group
Internal liability (cross-guarantee system)
In accordance with the Dutch Financial Supervision Act (Wet op het financieel toezicht), various legal entities
belonging to Rabobank Group are internally liable under an intragroup mutual keep well system. Under this
system the participating entities are bound, in the event of a lack of funds of a participating entity to satisfy its
creditors, to provide the funds necessary to allow such deficient participant to satisfy its creditors.
The participating entities are:
• The local Rabobanks of Coöperatieve Centrale Raiffeisen-Boerenleenbank B.A.
• Coöperatieve Centrale Raiffeisen-Boerenleenbank B.A. (Rabobank Nederland), Amsterdam
• Rabohypotheekbank N.V., Amsterdam
• Raiffeisenhypotheekbank N.V., Amsterdam
• Schretlen & Co N.V., Amsterdam
• De Lage Landen International B.V., Eindhoven
• De Lage Landen Financiering B.V., Eindhoven
• De Lage Landen Trade Finance B.V., Eindhoven
• De Lage Landen Financial Services B.V., Eindhoven
2.2.2 Investments in associates and joint venturesInvestments in associates are recognised in accordance with the equity method. With this method,
Rabobank’s share of the profits and losses of an associate – subject to Rabobank’s accounting policies –
(after the acquisition) is recognised in profit or loss, and its share of the changes in reserves after the acquisition
is recognised in reserves. The cumulative changes after acquisition are adjusted to the cost of the investment.
Associates are entities over which Rabobank has significant influence and in which it usually holds between
20% and 50% of the voting rights but over which it does not exercise control. A joint venture is an agreement
between one or more parties whereby the parties, which have shared control over the agreement, are entitled
to the net assets under the agreement. Unrealised profits on transactions between Rabobank and its associates
and joint ventures are eliminated in accordance with the size of Rabobank’s interest in the associates and joint
ventures.
Unrealised losses are also eliminated unless the transaction indicates that an impairment loss should be
recognised on the asset transferred. Investments by Rabobank in associates include the goodwill acquired.
If Rabobank’s share in the losses of an associate equals or exceeds its interest in the associate, Rabobank will
not recognise any more losses of the associate unless Rabobank has given undertakings or made payments
on behalf of this associate.
2.3 Derivative financial instruments and hedging2.3.1 General informationDerivative financial instruments generally comprise foreign exchange contracts, currency and interest rate
futures, forward rate agreements, currency and interest rate swaps, and currency and interest rate options
(written as well as acquired). Derivative financial instruments can be traded either on the stock exchange or
over the counter (OTC) between Rabobank and a client. All derivative financial instruments are recognised at
fair value. The fair value is determined using listed market prices (a small bid-ask range applies to derivatives
quoted in euros, US dollars and/or pound sterling, and mid prices are used), along with prices offered by
traders, cash flow discounting models and option valuation models based on current market prices and
contracted prices for the underlying instruments, as well as the time value of money, yield curves and the
volatility of the underlying assets and liabilities. All derivative financial instruments are included under assets
if their fair value is positive and under liabilities if their fair value is negative. Derivative financial instruments
that are embedded in other financial instruments are treated separately if their risks and characteristics are
not closely related to those of the underlying derivative contract and this contract is not classified as at fair
value through profit and loss.

17 Notes to the consolidated financial statements
2.3.2 Instruments not used for hedgingIf Rabobank enters into derivatives for trading purposes, realised and unrealised gains and losses are
accounted for under ‘Income from financial assets and liabilities at fair value through profit and loss’.
2.3.3 Hedging instrumentsRabobank also uses derivative financial instruments as part of asset and liability management to manage its
interest-rate risks, credit risks and foreign currency risks. Rabobank makes use of the possibilities provided by
the EU through the carve-out in IAS 39. The carve-out facilitates the application of fair value portfolio hedge
accounting to certain positions.
On the date of concluding a derivative contract, Rabobank can designate certain derivative financial instruments
as (1) a hedge of the fair value of an asset or liability in the statement of financial position (fair value hedge),
as (2) a hedge of future cash flows allocable to an asset or liability in the statement of financial position, an
expected transaction or a firm commitment (cash flow hedge), or as (3) a hedge of a net investment in a
foreign entity (net investment hedge). Hedge accounting can be applied for derivative financial instruments
designated in this manner if certain criteria are met:
• formal documentation of the hedging instrument, the hedged item, the objective of the hedge,
the hedging strategy and the hedge relationship before applying hedge accounting;
• the hedge is expected to be effective (in a range of 80% to 125%) in offsetting changes in the hedged
item’s fair value or cash flows allocable to the hedged risks during the entire reporting period;
• the hedge is continuously effective from inception onwards.
Changes in the fair value of derivative financial instruments that are designated as fair value hedges and are
effective in relation to the hedged risks are recognised in profit or loss, together with the corresponding
changes in the fair value of the assets or liabilities hedged against the risks in question.
If the hedge no longer meets the criteria for hedge accounting (according to the fair value hedge model),
any adjustment to the carrying amount of a hedged interest-bearing financial instrument is amortised
through profit or loss until the end of the hedged period.
For hedges of net investments in foreign entities, the derivative is stated at fair value, whereby the fair value
changes, to the extent that they are effective, are taken to equity. The change in the hedged equity
instrument as a result of exchange-rate fluctuations are also recognised under equity until the disposal of the
equity instrument.
Any adjustment to the carrying amount of a hedged equity instrument is recognised as equity until disposal
of the equity instrument (net investment hedge). Changes in the fair value of derivative financial instruments
that are designated and qualify as cash flow hedges and that are effective in relation to the hedged risks are
recognised in the hedging reserve included under ‘Equity’ (see note 10). The non-effective part of the changes
in the fair values of the derivative financial instruments is recognised in profit and loss. If the forecast
transaction or the non-current liability results in the recognition of a non-financial asset or a non-financial
liability, any deferred gain or loss included in equity is restated to the initial carrying amount (cost) of the asset
or the liability. In all other cases, deferred amounts included in equity are taken to the statement of income
and are classified as income or expenses in the periods in which the hedged noncurrent liability or the
forecast transaction had an effect on profit and loss.
Certain derivative contracts, although they are economic hedges in relation to the managed risk positions
taken by Rabobank, do not qualify for hedge accounting under the specific IFRS rules. These contracts are
therefore treated as derivative financial instruments held for trading. The fair value of derivative financial
instruments held for trading and hedging purposes is disclosed in note 10: ‘Derivative financial instruments
and other trade liabilities’.

18 Consolidated Financial Statements 2014 Rabobank Group
2.3.4 Trade liabilitiesTrade liabilities are mainly negative fair values of derivative financial instruments and delivery obligations
arising on short selling of securities. Securities are sold short to realise gains from short-term price
fluctuations. The securities needed to settle the short selling are acquired through securities leasing or sale
and securities repurchase agreements. Securities sold short are recognised at fair value at the reporting date.
2.4 Financial assets held for tradingFinancial assets held for trading are financial assets acquired with the objective of generating profit from
short-term fluctuations in prices or traders’ margins, or financial assets that form part of portfolios
characterised by patterns of short-term profit participation. Financial assets held for trading are measured
at fair value based on listed bid prices. All related comprehensive income is included under ‘Income from
financial assets and liabilities at fair value through profit or loss’. Interest earned on financial assets is
recognised as interest income. Dividends received on financial assets held for trading are recognised as
‘Income from financial assets and liabilities at fair value through profit and loss’. All acquisitions and sales
of financial assets held for trading which require delivery within a time limit prescribed under the regulations
or in accordance with market conventions are accounted for on the transaction date.
2.5 Other financial assets and liabilities at fair value through profit or lossRabobank has opted to classify financial instruments not acquired or entered into for realising gains from
short-term fluctuations in traders’ prices or margins at fair value through profit or loss. These financial assets,
including venture capital, are carried at fair value. Management designates financial assets and liabilities to
this category upon initial recognition if any or all of the following criteria are met:
• such a designation eliminates or substantially reduces any inconsistent treatment that would otherwise
have arisen upon measurement of the assets or liabilities or recognition of profits or losses on the basis of
different accounting policies;
• the assets and liabilities belong to a group of financial assets and/or financial liabilities that are managed
and assessed on the basis of their fair value in accordance with a documented risk management or
investment strategy;
• the financial instrument contains an embedded derivative financial instrument, unless the embedded
derivative financial instrument does not significantly affect the cash flows or if it is evident, after limited
analysis or no analysis at all, that separate recognition is not required.
Interest earned on assets with this classification is recognised as interest income and interest due on liabilities
with this classification is recognised as interest expense. Any other realised and unrealised gains and losses on
revaluation of these financial instruments at fair value are included under Income from other financial assets
and liabilities at fair value through profit or loss. All purchases and sales of other financial assets and liabilities
at fair value through profit or loss that have to be delivered within a period prescribed by regulations or
market convention are recognised at the transaction date.
2.6 Day 1 profitIf, at the time a financial instrument is entered into, valuation methods are used at fair value, a discrepancy
may arise between the transaction price and fair value. Such a discrepancy is referred to as ‘day 1 profit’.
Rabobank immediately accounts for this profit under ‘Income from financial assets and liabilities at fair value
through profit or loss’, if the valuation method is based on observable inputs (of active markets). If non-
observable inputs are used, the day 1 profit is amortised over the term of the transaction and accounted for
as ‘Other liabilities’. Profit is then taken at a subsequent stage if the financial instrument concerned has been
sold or the data entered has become visible at a later stage.
2.7 Available-for-sale financial assetsManagement determines the classification of financial assets on the date of acquisition, depending on the
purpose for which the investments are acquired.

19 Notes to the consolidated financial statements
Financial assets that are intended to be held indefinitely and that could be sold for liquidity purposes or in
response to changes in interest rates, exchange rates or share prices are classified as available for sale.
Available-for-sale financial assets are initially recognised at fair value, including transaction costs, based on
quoted bid prices or values derived from cash flow models. The fair values of unlisted equity instruments are
estimated based on appropriate price/earnings ratios, adjusted to reflect the specific circumstances of the
respective issuers. Any unrealised gains and losses from changes in the fair value of available-for-sale financial
assets are recognised in equity unless they relate to amortised interest or exchange-rate differences of
monetary assets. If such financial assets are disposed of, the adjustments to fair value are recognised in profit
and loss.
Debt instruments are impaired if there are objective indications that the fair value has decreased to such a
degree that no reasonable assumptions can be made that the value will recover to carrying amount in the
foreseeable future. At each reporting date, management assesses whether there are objective indications of
impairment of available-for-sale assets. Examples of objective evidence for value adjustments are:
• significant financial difficulties on the part of the issuer;
• default in making interest and/or redemption payments;
• the disappearance of active markets for the financial asset caused by financial difficulties.
In the event of impairment, the cumulative loss is determined by the difference between cost and current fair
value, less any previously recognised impairment transferred from the revaluation reserve in equity to profit or
loss. If the impairment of a debt instrument diminishes in a subsequent period and the diminution can be
objectively attributed to an event that occurred after the impairment, the impairment is reversed through
profit or loss.
Equity instruments are impaired if their cost permanently exceeds their recoverable amount, i.e. their fair
value is permanently or significantly lower than their cost. The recoverable amount of investments in unlisted
equity instruments is determined using approved valuation methods, whereas the recoverable amount of
listed financial assets is determined on the basis of market value. Impairment of equity instruments is never
subsequently reversed through profit or loss. All purchases and sales made in accordance with standard
market conventions for available-for-sale financial assets are recognised at the transaction date. All other
purchases and sales are recognised at the settlement date.
2.8 Repurchase agreements and reverse repurchase agreementsFinancial assets that are sold subject to related sale and repurchase agreements are included in the financial
statements under ‘Financial assets held for trading’ and ‘Available-for-sale financial assets’. The liability to the
counterparty is included under Due to other banks or Due to customers, depending on the application.
Financial assets acquired under reverse sale and reverse repurchase agreements are recognised as Due from
other banks, or Loans to customers, depending on the application. The difference between the selling price
and repurchasing price is recognised as interest income or interest expense over the term of the agreement,
based on the effective interest method.
2.9 Securitisations and other derecognition constructionsRabobank securitises, sells and carries various financial assets. Those assets are sometimes sold to special
purpose entities (SPEs), which then issue securities to investors. Rabobank has the option of retaining an
interest in sold securitised financial assets in the form of subordinated interest-only strips, subordinated
securities, spread accounts, servicing rights, guarantees, put options and call options, and other constructions.
A financial asset (or a portion of it) is derecognised if:
• the rights to the cash flows from the asset expire;
• the rights to the cash flows from the asset and a substantial portion of the risks and benefits of ownership
of the asset are transferred;
• a commitment to transfer the cash flows from the asset is presumed and a substantial portion of the risks
and benefits are transferred;
• not all the economic risks and benefits are retained or transferred; however, control over the asset is
transferred.

20 Consolidated Financial Statements 2014 Rabobank Group
A financial liability or part thereof is derecognised if it ceases to exist, i.e. after the contractual obligation has
been fulfilled or cancelled or has expired.
If Rabobank retains control over the asset but does not retain a substantial portion of the risks and benefits,
the asset is recognised in proportion to the continuing involvement of Rabobank. A related liability is also
recognised to the extent of Rabobank’s continuing involvement. The recognition of changes in the value of
the liability corresponds to the recognition of changes in the value of the asset.
If a transaction does not meet the above conditions for derecognition, it is recognised as a loan for which
security has been provided.
To the extent that the transfer of a financial asset does not qualify for derecognition, the transfer does not
result in Rabobank’s contractual rights being separately recognised as derivative financial instruments if
recognition of these instruments and the transferred asset, or the liability arising on the transfer, were to result
in double recognition of the same rights or obligations.
Gains and losses on securitisations and sale transactions depend partly on the previous carrying amounts of
the financial assets transferred. These are allocated to the sold and retained interests based on the relative fair
values of these interests at the date of sale. Any gains and losses are recognised through profit or loss at the
time of transfer.
The fair value of the sold and retained interests is based on quoted market prices or calculated as the present
value of the future expected cash flows, using pricing models that take into account various assumptions
such as credit losses, discount rates, yield curves, payment frequency and other factors.
Rabobank decides whether the SPE should be included in the consolidated financial statements. For this
purpose, it performs an assessment of the SPE by taking a number of factors into consideration, including the
activities, decision making powers and the allocation of the benefits and risks associated with the activities of
the SPE.
2.10 Cash and cash equivalentsCash equivalents are highly liquid short-term investments held to meet current obligations in cash, rather
than for investments or other purposes. Such investments have remaining terms of less than 90 days at
inception. Cash equivalents are readily convertible to known amounts of cash and subject to an insignificant
risk of changes in value.
2.11 Netting of financial assets and liabilitiesFinancial assets and liabilities are set off and the net amount is transferred to the statement of financial
position if a legal right to set off the recognised amounts exists and it is intended to settle the expected
future cash flows on a net basis, or to realise the asset and settle the liability simultaneously. This mainly
concerns netting of current account balances and derivative financial instruments. The set-off of taxes is
discussed in note 2.24.
2.12 Foreign currencies2.12.1 Foreign entitiesItems included in the financial statements of each entity in Rabobank Group are carried in the currency that
best reflects the economic reality of the underlying events and circumstances that are relevant for the entity
(the functional currency).
The consolidated financial statements are presented in euros, which is the parent company’s functional
currency. Gains, losses and cash flows of foreign entities are translated into the presentation currency of
Rabobank at the exchange rates ruling at the transaction dates, which is approximately equal to the average
exchange rates. Assets and liabilities are translated at closing rates. Translation differences arising on the net
investments in foreign entities and on loans and other currency instruments designated as hedges of these
investments are recognised in equity. If a foreign entity is sold, any such translation differences are recognised
in profit or loss as part of the gain or loss on the sale.
Goodwill and fair value adjustments arising on the acquisition of a foreign entity are recognised as assets and
liabilities of the foreign entity and are translated at the closing rate.

21 Notes to the consolidated financial statements
2.12.2 Foreign-currency transactionsTransactions in foreign currencies are translated into the functional currency at the exchange rates ruling at
the transaction dates. Translation differences arising on the settlement of such transactions or on the
translation of monetary a sets and liabilities denominated in foreign currencies are recognised in profit or loss.
Translation differences qualifying as net investment hedges are recognised in equity.
Translation differences on debt securities and other monetary financial assets carried at fair value are included
under foreign exchange gains and losses. Translation differences on non-monetary items such as equity
instruments held for trading are recognised as part of the fair value gains or losses. Translation differences on
available-for-sale non-monetary items are included in the revaluation reserve reported under ‘Equity’.
2.13 InterestInterest income and expense for all interest-bearing instruments is recognised in profit or loss on an accrual
basis, with the effective interest method being applied. Interest income includes coupons relating to fixed
interest financial assets and financial assets held for trading, as well as the cumulative premiums and
discounts on government treasury securities and other cash equivalent instruments. If any loans suffer
impairment losses, they are written down to their recoverable amounts and the interest income recognised
henceforth is based on the original discount rate for calculating the present value of the future cash flows
used to determine the recoverable amounts. Interest on derivatives held for economic hedging purposes is
shown separately under interest income.
2.14 CommissionIncome from asset management activities consists mainly of unit trust, fund management commission and
administration. Income from asset management and insurance brokerage is recognised as earned once the
services have been provided.
Commission is generally recognised on an accrual basis. Commission received for negotiating a transaction,
or taking part in the negotiations, on behalf of third parties, for example the acquisition of a portfolio of loans,
shares or other securities, or the sale or purchase of companies, is recognised at completion of the underlying
transactions.
2.15 Loans to customers and due from other banksLoans to customers and Due from other banks are non-derivative financial instruments with fixed or defined
payments, not listed on an active market, apart from such assets that Rabobank classifies as trading, at fair
value on initial recognition with changes recognised through profit or loss, or as available for sale. Loans to
customers and receivables are initially recognised at fair value, including transaction costs, and subsequently
carried at amortised cost, including transaction costs.
Loans are subject to either individual or collective impairment analyses. A value adjustment, a provision for
expected losses on loans, is recognised if there is objective evidence that Rabobank will not be able to collect
all amounts due under the original terms of the contract. The size of the provision is the difference between
the carrying amount and the recoverable amount, which is the present value of the expected cash flows,
including amounts recoverable under guarantees and sureties, discounted at the original (average) effective
rate of interest of the loans.
The provision for loans includes losses if there is objective evidence that losses are allocable to some
portions of the loan portfolio at the reporting date.
Examples of objective evidence for value adjustments are:
• significant financial difficulties on the part of the borrower;
• default in making interest and/or redemption payments on the part of the borrower;
• loan renegotiations;
• possibility of bankruptcy of or financial reorganisation at the borrower;
• changes in borrowers’ payment status;
• changes in economic circumstances that could cause the borrower to default.

22 Consolidated Financial Statements 2014 Rabobank Group
For each separate business unit, the losses are estimated based on the credit ratings of the borrowers and the
value of the collateral provided to the bank, and taking into account the actual economic conditions under
which the borrowers conduct their activities. The carrying amount of the loans is reduced through the use of
a provision account, based on what the bank considers the most likely scenario, and the loss is taken to the
statement of income. Write-offs of provisions for expected loan losses are made as soon as the enforcement
process is completed, the security provided has been realised, when virtually no other means of recovery are
available and in the event of a formal cancellation of a debt. Where there is virtually no perspective of the
debtor being able to continue as a going concern, a provision for expected loan losses is written off at
portfolio level, up to the amount deemed uncollectible. Any amounts subsequently collected are included
under the item ‘Value adjustments’ in the statement of income.
As soon as the prospects for continuity have recovered and arrears have been cleared as agreed, the loan is
no longer considered impaired (not fully collectible). Management continually assesses these renegotiated
loans to ensure that all criteria are satisfied with a view to expected future cash flows.
The general provision constitutes the provision adopted for the portion of the portfolio that remains
effectively impaired as at the balance sheet date but which has not yet been identified as such (IBNR; incurred
but not reported) in the bank’s risk systems. As before, Basel II parameters, adjusted to the IFRS guidelines and
to current developments, are used here in order to determine the provision. An important factor in
determining the general provision is what is known as the Loss Identification Period (LIP), i.e. the period
between the time a loss event occurs at the client’s company and the time the bank has recorded the loss
event in its risk systems. The LIP is expressed in months and varies between portfolios.
At each reporting date, management assesses whether there is objective evidence that reclassified loans
previously recognised as available-for-sale assets have been impaired. For exposures classified as corporate
exposures under CRD IV, exposures are measured in accordance with the ‘one debtor’ principle. This principle
entails that the approved limit for a debtor applies to the sum of all exposures – including derivatives,
guarantees and the like – of the debtor group in which the debtor has been classified. Debtor groups include
all debtors who form part of the economic entity in which legal entities and companies are affiliated with the
same organisation. In addition, the majority shareholders also form part of the economic entity. The ‘one debtor’
principle applies across all entities; the exposures of the debtor group must be included for all group divisions.
2.16 Intangible assets2.16.1 GoodwillGoodwill is the amount by which the acquisition price paid for a subsidiary or associate exceeds the fair value
on the acquisition date of Rabobank’s share of the net assets and the contingent liabilities of the entity
acquired. Upon each acquisition, the other minority interests are recognised at fair value or at the proportion
of the identifiable assets and liabilities of the acquired entity. Impairment tests are performed annually or –
if indications so dictate – more frequently to determine whether impairment has occurred.
2.16.2 Software development costsCosts related to the development or maintenance of software are recognised as an expense at the time they
are incurred. Costs directly incurred in connection with identifiable and unique software products over which
Rabobank has control and that will probably provide economic benefits exceeding the costs for longer than
a year are recognised as intangible assets. Direct costs include the employee expenses of the software
development team, financing and an appropriate portion of the relevant overhead.
Expenditures that improve the performance of software compared with their original specifications are added
to the original cost of the software. Software development costs are recognised as assets and amortised on
a straight-line basis over a period not exceeding five years.
2.16.3 Other intangible assetsOther intangible assets are mainly those identified upon business combinations. They are amortised over their
terms. Each year, Rabobank performs an impairment test based on expected future cash flows. An impairment
loss is recognised if the expected future profits do not justify the carrying amount of the asset.

23 Notes to the consolidated financial statements
2.16.4 Impairment losses on goodwillEach year, during the fourth quarter of the financial year, or more frequently if indications of impairment exist,
goodwill is tested for impairment by comparing the recoverable amount with the carrying amount. The highest
of value in use on the one hand and fair value less selling costs on the other determines the recoverable
amount. The definition of cash flow generating units depend on the type of company acquired. The value in
use of a cash flow generating unit is arrived at by determining the present value of the expected future cash
flows of the cash flow generating unit in question at the interest rate before tax. The major assumptions used
in the cash flow model depend on the input data which reflect different financial and economic variables,
such as the risk-free interest rate in a country and a premium reflecting the inherent risk of the entity
concerned. The variables are determined subject to review by management. Impairments of goodwill are
included in ‘Other income’ in the statement of income.
2.16.5 Impairment losses on other intangible assetsAt each reporting date, Rabobank assesses whether there are indications of impairment of other intangible
assets. If such indications exist, impairment testing is carried out to determine whether the carrying amount
of the other intangible assets is fully recoverable. An impairment loss is recognised if the carrying amount
exceeds the recoverable amount. Goodwill and software under development are tested for impairment each
year at the reporting date or more frequently if indications of impairment exist. Impairment losses and
reversed impairments of other intangible assets are included in ‘Other administrative expenses’ in the
statement of income.
2.17 Property and equipment2.17.1 Property and equipment for own useEquipment (for own use) is recognised at historical cost net of accumulated depreciation and impairments
if applicable. Property (for own use) represents mainly offices and is also recognised at cost less accumulated
depreciation and impairments if applicable.
Straight-line deprecation is applied to these assets in accordance with the schedule below. Each asset is
depreciated to its residual value over its estimated useful life:
- Land Not depreciated
- Buildings 25 - 40 years
Equipment, including
- Computer equipment 1 - 5 years
- Other equipment and vehicles 3 - 8 years
Each year, Rabobank assesses whether there are indications of impairment of property and equipment. If the
carrying amount of an asset exceeds its estimated recoverable amount, the carrying amount is written down
immediately to the recoverable amount. Impairment losses and reversed impairments of property and
equipment are included in Other administrative expenses in the statement of income. Gains and losses on the
disposal of items of property and equipment are determined in proportion to their carrying amounts and
taken into account when determining the operating result.
Repair and maintenance work is charged to profit or loss at the time the relevant costs are incurred.
Expenditures on extending or increasing the benefits from land and buildings compared with their original
benefits are capitalised and subsequently depreciated.
2.18 Investment propertiesInvestment properties, mainly office buildings, are held for their long-term rental income and are not used by
Rabobank or its subsidiaries. Investment properties are recognised as long-term investments and included in
the statement of financial position at cost, net of accumulated depreciation and impairment.
Investment properties are depreciated over a term of 40 years.

24 Consolidated Financial Statements 2014 Rabobank Group
2.19 Other assets2.19.1 Work in progressWork in progress is included in Other assets. Work in progress relates to commercial real estate projects as well
as sold and unsold housing projects under construction or planned and is carried at cost plus allocated interest,
net of provisions as necessary. Instalments invoiced to buyers and customers are deducted from work in
progress. If the balance for a project is negative (the amount of the invoiced instalments exceeds the
capitalised costs), the balance of that project is recognised as Other liabilities.
Gains and losses are recognised based on the percentage of completion method given the continuous
transfer of ownership involved. In the course of the construction work, Rabobank transfers the control and the
material risks and benefits of the ownership of the work in progress in its current state to the buyer as
construction progresses.
2.19.2 Building sitesBuilding sites are valued at cost, including interest allocated and additional costs relating to site acquisition
and preparation. No interest is allocated for land which has no specific designation under the zoning plan,
if there is no certainty that the land will be developed. The price of land does not include the conditional
requirement which depends on a future reclassification of the land in question. For losses expected upon the
sale of the land, the carrying amount of the site is subject to impairment.
2.20 Leasing2.20.1 Rabobank as lesseeLeases relating to property and equipment under which virtually all risks and benefits of ownership are
transferred to Rabobank are classified as finance leases. Finance leases are capitalised at the inception of the
lease at the fair value of the leased assets or at the present value of the minimum lease payments if the
present value is lower. Lease payments are apportioned between the lease liability and the finance charges,
so as to achieve a constant rate of interest on the remaining balance of the liability. The corresponding lease
liabilities are included under Other liabilities, after deduction of finance charges. The interest components of
the finance charges are recognised in profit or loss over the term of the lease. An item of property and
equipment acquired under a lease agreement is depreciated over the useful life of the asset or, if shorter,
the term of the lease.
Leases under which a considerable portion of the risks and benefits of ownership of the assets is retained by
the lessor are classified as operating leases. Operating lease payments (less any discounts by the lessor) are
charged to profit or loss on a straight-line basis over the term of the lease.
2.20.2 Rabobank as lessorFinance leases
If assets are leased under a finance lease, the present value of the lease payments is recognised as a receivable
under Due from other banks or Loans to customers. The difference between the gross receivable and the
present value of the receivable is recognised as unearned finance income. Lease income is recognised as
interest income over the term of the lease using the net investment method, which results in a constant rate
of return on the investment.
Operating leases
Assets leased under operating leases are included in the statement of financial position under Property and
equipment. The assets are depreciated over their expected useful lives in line with those of comparable items
of property and equipment. Rental income (less discounts granted to lessees and write-downs) is recognised
under Other income on a straight-line basis over the term of the lease.

25 Notes to the consolidated financial statements
2.21 ProvisionsProvisions are recognised if Rabobank has a present obligation (legal or constructive) as a result of a past
event, if it is probable that an outflow of resources will be required to settle the obligation and if a reliable
estimate can be made of the amount of the obligation. If Rabobank expects a provision to be reimbursed,
for example under an insurance contract, the reimbursement is recognised as a separate asset but only if the
reimbursement is virtually certain. The provisions are carried at the discounted value of the expected future
cash flows.
2.21.1 RestructuringRestructuring provisions comprise payments under redundancy schemes and other costs directly allocable to
restructuring programmes. These costs are accounted for during the period in which a legal or actual payment
obligation arises for Rabobank, a detailed plan has been prepared for redundancy pay, and there are realistic
expectations among the parties concerned that the reorganisation will be implemented.
2.21.2 Tax and legal issuesThe provision for tax and legal issues is based on the best possible estimates available at the balance sheet
date, taking into account legal and tax advice. The timing of the cash outflow of these provisions is uncertain
because the outcome of the disputes and the time involved are unpredictable.
2.21.3 Other provisionsThis item includes provisions for onerous contracts, credit guarantees and obligations under the terms of the
deposit guarantee scheme.
2.22 Employee benefitsRabobank has various pension schemes in place based on the local conditions and practices of the countries
in which it operates. In general, the plans are financed by payments to insurance companies or trustee
administered funds. The payments are calculated actuarially at regular intervals. A defined benefit plan is one
that incorporates a promise to pay an amount of pension benefit, which is usually based on several factors
such as age, number of years in service and remuneration. A defined contribution plan is one in the context
of which Rabobank pays fixed contributions to a separate entity (a pension fund) and acquires no legal or
constructive obligation if the fund has insufficient assets to pay all the benefits to employee-members of the
plan in respect of service in current and past periods.
2.22.1 Pension obligationsThe obligation under the defined-benefit pension schemes is the present value of the defined-benefit
pension obligation on the balance sheet date after deduction of the fair value of fund investments. The defined-
benefit obligation is calculated annually by independent actuaries based on the projected unit credit method.
The present value of the defined-benefit obligation is determined by the estimated future outflow of cash
funds based on the interest rates of high-quality corporate bonds with terms which approach that of the
corresponding obligation. The majority of pension schemes are career-average schemes, and the costs of
these schemes – i.e. the net pension charges for the period less employee contributions and interest,
is included under ‘Staff costs’. Net interest expenses or income are calculated by applying the discount rate at
the beginning of the year for the asset or liability based on the defined-benefit pension scheme. Actuarial gains
and losses arising from actual developments or actuarial assumptions are recognised in the consolidated
statement of comprehensive income.
2.22.2 Defined contribution plansUnder defined contribution plans, Rabobank pays contributions to publicly or privately managed insured
pension schemes on a compulsory, contractual or voluntary basis. Once the contributions have been made,
Rabobank has no further payment obligations. The regular contributions are net period costs for the year in
which they are due and are included on this basis under Staff costs.

26 Consolidated Financial Statements 2014 Rabobank Group
2.22.3 Other post-employment obligationsSome Rabobank business units provide other post-employment benefits. To become eligible for such
benefits, the usual requirement is that the employee remains in service until retirement and has been with
the company a minimum number of years. The expected costs of these benefits are accrued during the years
of service, based on a system similar to that for defined benefit plans. The obligations are valued each year by
independent actuaries.
2.22.4 Variable remunerationThe costs of variable remuneration paid unconditionally and in cash are recognised in the year in which the
employee renders the services. The costs of conditional payments in cash are included in staff costs in the
statement of income in the period during which the employee’s services are received, which equals the
vesting period of the cash payment. The liability is recognised in other liabilities. The accounting treatment
of equity instrument-based payments is disclosed in note 2.23.
2.23 Equity instrument-based paymentsRemuneration for services rendered by identified staff is made in the form of cash-settled payments based on
equity instruments that are similar to, and have the same characteristics as, Rabobank Certificates. The costs of
the services received are based on the awarded equity instruments’ fair value on the award date and are
recalculated annually at the value applicable at the time. The costs of the awarded equity instruments are
included in staff costs in the statement of income in the period during which the employee’s services are
received, which equals the vesting period of the equity instruments. The liability is recognised in other
liabilities.
2.24 TaxCurrent tax receivables and payables are set off if there is a legally enforceable right to set off such items and
if simultaneous treatment or settlement is intended. Deferred tax assets and liabilities are set off if there is a
legally enforceable right to set off such items and if they relate to the same tax authority and arise from the
same tax group.
Provisions are formed in full for deferred tax liabilities, using the liability method, arising from temporary
differences at the reporting date between the tax bases of assets and liabilities and their carrying amounts for
financial reporting purposes.
The main temporary differences relate to the depreciation of property and equipment, the revaluation of
certain financial assets and liabilities, including derivative financial instruments, provisions for pensions and
other post-employment benefits, provisions for loan losses and other impairment and tax losses, and,
in connection with business combinations, the fair values of the net assets acquired and their tax bases.
Deferred income tax assets and liabilities are measured at the tax rates that have been enacted or
substantively enacted at the reporting date.
Deferred tax assets are recognised to the extent that it is probable that future taxable profits will be available,
against which the temporary differences can be utilised.
Provisions are formed in respect of taxable temporary differences associated with investments in subsidiaries,
associates and interests in joint ventures, unless the timing of the reversal of the temporary differences can be
controlled and it is probable that the temporary differences will not reverse in the foreseeable future. Taxes on
profit are calculated in accordance with the tax legislation of the relevant jurisdiction and recognised as an
expense in the period in which the profit is realised. The tax effects of the carry-forward of unused tax losses
are recognised as an asset if it is probable that future taxable profits will be available against which the losses
can be utilised.
Deferred tax assets or deferred tax liabilities are included for the revaluation of available-for-sale financial
assets and cash flow hedges that are directly taken to equity. Upon realisation, they are recognised in profit or
loss together with the respective deferred gain or loss.

27 Notes to the consolidated financial statements
2.25 Due to other banks, due to customers and debt securities in issueThese borrowings are initially recognised at fair value, i.e. the issue price less directly allocable and non-
recurring transaction costs, and subsequently carried at amortised cost, including transaction costs. If Rabobank
repurchases one of its own debt instruments, it is derecognised, with the difference between the carrying
amount of a liability and the consideration paid being recognised as profit or loss.
2.26 Rabobank CertificatesThe proceeds of the issue of Rabobank Certificates are available to Rabobank Group on a perpetual basis,
subordinated to all liabilities (also subordinate to the Trust Preferred Securities and the Capital Securities).
As the payment of planned distributions is fully discretionary, the proceeds of the issue of Rabobank Certificates
are recognised as equity. Accordingly, planned distributions are accounted for in the profit appropriation.
2.27 Trust Preferred Securities and Capital SecuritiesTrust Preferred Securities, which pay a non-discretionary dividend and are redeemable on a specific date or
at the option of the holder, are classified as financial liabilities and included under Subordinated debt.
The distributions on these preferred securities are recognised in profit or loss as interest expense based on
amortised cost using the effective interest method.
The remaining Trust Preferred Securities and Capital Securities are recognised as ‘Equity’, as there is no formal
obligation to repay the principal or to pay the dividend.
2.28 Financial guaranteesFinancial guarantee contracts require that the issuer compensate the holder for a loss the latter incurs
because a specified debtor fails to meet its obligations in accordance with the terms of a debt security.
Such financial guarantees are initially measured at fair value and subsequently measured at the value of the
discounted liability under the guarantee or the higher initially measured value less the amount of previously
recognised cumulative gains or losses, thus reflecting the revenue recognition principles.
2.29 Segment informationA segment is a distinguishable component of Rabobank that engages in providing products or services and is
subject to risks and returns that are different from those of other segments. The business segments Rabobank
uses in its reporting are defined from a management viewpoint. This means they are the segments that are
reviewed as part of Rabobank’s strategic management and for the purpose of making business decisions,
and have different risks and returns. Rabobank’s primary segment reporting format is by business segment;
the secondary format is by geographical segment.
2.30 Business combinationsBusiness combinations are accounted for on the basis of the acquisition method. The price of an acquisition
is determined as the monetary amount or equivalent agreed for the acquisition of the business combination,
if applicable plus costs directly relating to the acquisition. Goodwill represents the difference between the
price of the acquisition and Rabobank’s interest in the fair value of the assets, liabilities and conditional
liabilities acquired. Goodwill is capitalised and recognised as an intangible asset. For each business
combination, the minority interests are valued against the share of the company acquired in the identifiable
net assets. Direct acquisition costs are directly taken to the profit or loss account.
2.31 Disposals groups classified as held for sale and discontinued operationsDisposal groups classified as held for sale are valued at carrying amount or, if lower, fair value less estimated
cost of sale. A group of assets (or a fixed asset) sold is classified as held for sale if the carrying amount will be
realised primarily by means of a sales transaction as opposed to continued use. This is solely the case if the
sale is extremely likely and the group of assets (or a fixed asset) hived off is immediately available for sale in its
current condition. In addition, the management must have committed to the sale, which is expected to be

28 Consolidated Financial Statements 2014 Rabobank Group
completed within one year after the time of classification as held for sale. If a group of assets classified as held
for sale represents a key business activity or key geographic region, it is classified as discontinued operations.
The latter are presented separately from comprehensive income arising from continuing operations.
2.32 Statement of cash flowsCash and cash equivalents comprises cash resources, money market deposits and deposits at central banks.
The statement of cash flows is prepared in accordance with the indirect method of calculation and provides
details of the source of the cash and cash equivalents that became available during the year as well as their
application during the year. Operating profit before taxation in the net cash flow from operating activities is
adjusted for items in the statement of income and changes in items in the statement of financial position
which do not actually generate cash flows during the year.
The cash flows from operating, investing and financing activities are stated separately. Changes in loans and
receivables, interbank deposits, due to customers and debt securities in issue are accounted for under cash
flows from operating activities. Investing activities relate to acquisitions and disposals and repayments on
financial investments, as well as the acquisition and disposal of subsidiaries and property and equipment.
The proceeds from the issue of and payments on Rabobank Certificates, Trust Preferred Securities, Capital
Securities, Senior Contingent Notes, Rabo Extra Member Notes and subordinated debts qualify as financing
activities. Changes on account of currency translation differences are eliminated, as are the consolidation
effects of acquisitions of associates.
The difference between the net change presented in the statement of cash flows and the change in cash and
cash equivalents presented in the statement of financial position is due to currency translation differences.
These are presented separately as part of the reconciliation between those two amounts.
3 Solvency and capital management
In its objective of securing an adequate cash position, Rabobank aims to achieve a number of solvency ratios,
with the main ones being the common equity tier 1 ratio, the tier 1 ratio, the capital ratio and the equity
capital ratio.
Rabobank’s internal targets exceed the regulators’ minimum requirements as it anticipates market
expectations and developments in laws and regulations. Rabobank seeks to stand out from other financial
institutions, managing its solvency position based on policy documents. The Balance Sheet and Risk
Management Committee Rabobank Group (Effective 1 January 2015, this was divided into the Risk
Management Committee and the Asset and Liability Committee). The Executive Board and the Supervisory
Board periodically discuss the solvency position and the targets to be used.
The Capital Requirements Regulation (CRR) and Capital Requirements Directive IV (CRD IV) together constitute
the European implementation of the Basel Capital and Liquidity Accord of 2010. These rules, which became
effective on 1 January 2014, apply to Rabobank’s financial reporting. The 2013 figures are based on CRD III,
as applicable at that time.
Rabobank must comply with a number of minimum solvency positions stipulated under the law. The solvency
position is determined based on ratios. These ratios compare Rabobank’s BIS ratio (capital ratio) and core tier 1
ratio with the total amount of the risk-weighted assets.
The minimum required percentages under the CRD III are 8% and 4% of the risk-weighted assets, respectively.
Effective 1 January 2014, the minimum required percentages are determined based on CRD IV/CRR.
The regulatory capital and core capital remain subject to the minimum of 8% and 6% respectively in 2014.
The minimum required percentages will gradually be increased between now and the year 2019; Rabobank
taken this into account in its capital plan. The table below shows the minimum buffers in accordance with
CRD III and according to the final situation of CRD IV/CRR.

29 Notes to the consolidated financial statements
Minimum capital buffer from 2019
CET 1 Tier 1Total
capital
CRD III Minimum 2013 2.0% 4.0% 8.0%
CRD IV/CRR Minimum1 2014 4.5% 6.0% 8.0%
Capital conservation buffer2 2016-2019 2.5% 2.5% 2.5%
Minimum + capital conservation buffer 7.0% 8.5% 10.5%
Countercyclical buffer2 2016-2019 0% - 2.5%
SIFI buffer2 2016-2019 3.0% 3.0% 3.0%
The determination of the risk-weighted assets is based on separate methods for credit risk, operational risk
and market risk. The risk-weighted assets are determined for credit risk purposes in many different ways.
For most assets the risk weight is determined with reference to internal ratings and a number of characteristics
specific to the asset concerned. For off-balance sheet items the balance sheet equivalent is calculated first, on
the basis of internal conversion factors. The resulting equivalent amounts are then also assigned risk-weightings.
An Advanced Measurement Approach model is used to determine the amount with respect to the risk-weighted
assets for operational risk. With the market risk approach, the general market risk is hedged, as well as the risk
of open positions in foreign currencies, debt and equity instruments, as well as commodities.
Rabobank Group’s ratios
CRD IV CRD III
In millions of euros 2014 2013
Retained earnings (note: 28) 24,528 27,197
Expected dividends (119) (119)
Rabobank Certificates 5,931 5,823
Part of non-controlling interest treated as qualifying capital 28 437
Reserves 365 (1,089)
Deductions (5,248) (3,698)
Transition guidance 3,229 -
Common equity tier 1 capital 28,714 28,551
Trust-Preferred Securities III to VI (note: 30) - 1,269
Capital Securities (note: 30) - 7,265
Grandfathered instruments 7,283 -
Non-controlling interests 6 -
Deductions (3) (1,993)
Transition guidance (2,126) -
Tier 1 capital 33,874 35,092
Part of reserves treated as qualifying capital - (301)
Part of subordinated debt treated as qualifying capital 11,738 7,744
Minority interests 8 -
Deductions - (885)
Transition guidance (481) -
Qualifying capital (BIS capital) 45,139 41,650
Risk-weighted assets 211,870 210,829
Common equity tier 1 ratio 13.6% 13.5%
Tier 1 ratio 16.0% 16.6%
BIS ratio 21.3% 19.8%
Equity capital ratio 14.4% 16.1%
1 In 2014, the minimum for
CET 1 was 4%; effective
2015, it is 4.5%.
2 These percentages apply
with effect from 2019, to
be phased in over a 4-year
period starting in 2016.

30 Consolidated Financial Statements 2014 Rabobank Group
The deductions consist mostly of goodwill, other intangible non-current assets, deferred tax liabilities which
depend on future profit and non-temporary differences, the IRB shortfall for credit risk adjustments and
adjustments relating to cumulative profits due to changes in the bank’s credit risk on instruments issued at
market value (FVPL). In accordance with CRR, a number of deductions are adjusted for the ‘transition guidance’
line, as these adjustments are set to be phased in after five years for the period 2014-2018. The ‘transition
guidance’ line consists mainly of goodwill, other intangible non-current assets, deferred tax liabilities
depending on future profit (i.e. non-temporary differences) and the IRB shortfall for credit-risk adjustments.
The tier instruments issued by Rabobank prior to 2015 do not satisfy the new requirements under the CRR;
these instruments are subject to grandfathering, which means that they will be phased out in accordance
with the statutory requirements.
4 Risk exposure of financial instruments
4.1 Risk governanceRabobank Group manages risks at various levels. At the highest level, the Executive Board determines the risk
strategy it will pursue, the policy framework as well as the limits, under the supervision of the Supervisory
Board and on the recommendation of the Rabobank Group Balance Sheet and Risk Management Committee
and Rabobank Group Credit Management Committee. The Supervisory Board regularly assesses the risks
attached to the activities and portfolio of Rabobank Group. The Chief Financial Officer, who is also a member
of the Executive Board, is responsible for the risk management policy within Rabobank Group.
Responsibility for the risk policy within Rabobank Group is spread across two directorates. Risk Management is
in charge of the policies for interest rate, market, liquidity, currency and operational risks, as well as for the
policy for credit risks at portfolio level. Credit Risk Management is responsible for the credit risk acceptance
policy at item level. Furthermore, the group entities practice independent risk management.
4.1.1 Risk appetiteIdentifying and managing risk for its organisation is an ongoing process at Rabobank. It uses an integrated risk
management strategy for this purpose. The risk management cycle includes determining risk appetite,
preparing integrated risk analyses, and measuring and monitoring risk. Throughout this process, Rabobank
uses a risk strategy aimed at continuity and designed to protect profit, maintain solid balance-sheet ratios and
protect identity and reputation.
4.2 Strategy for the use of financial instrumentsRabobank’s activities are inherently related to the use of financial instruments, including derivative financial
instruments. Rabobank accepts deposits from clients at fixed and variable rates of interest for a variety of
terms and aims to earn above average interest margins on these deposits by investing them in high-quality
assets. Rabobank also aims to increase these margins by means of a portfolio approach of short funds and
allocation to loans for longer terms at higher interest rates, at the same time keeping sufficient cash resources
to meet all payments that might become due.
A further objective of Rabobank is to increase its interest rate result by obtaining above-average margins, after
deduction of provisions, and by granting loans to commercial and retail borrowers with various credit ratings.
These risks apply not only to loans recognised in the statement of financial position; Rabobank also gives
guarantees, such as letters of credit and performance and other guarantee documents.
Rabobank also trades in financial instruments when it takes positions in tradable and unlisted instruments
(OTCs), including derivative financial instruments, in order to profit from short-term movements on the share
and bond markets and in exchange rates, interest rates and commodity prices.

31 Notes to the consolidated financial statements
4.3 Interest-rate risk in the banking environment‘Interest-rate risk in the banking environment’ refers to the risk that the profit/loss and/or the economic value
of bank books, investment books and capital books is adversely affected by changes in the money-market and
capital-market interest rates. Bank books contain financial products and related derivatives which are held in
order to generate interest-rate income and the stable growth thereof. Investment books consist of financial
instruments which are held for strategic purposes, including for the management of solvency risk, interest-
rate risk and liquidity risk. Capital books contain financial instruments financed with the bank’s own capital.
Rabobank accepts a certain amount of interest-rate risk in the banking environment, as this constitutes
a fundamental part of banking, but at the same time the bank also aims to avoid unexpected material
fluctuations in the profit/loss and the economic value as a result of interest-rate fluctuations. The Executive
Board, overseen by the Supervisory Board, therefore annually approves the risk appetite for interest-rate risk
and the corresponding interest-rate risk limits.
As part of its interest-rate risk policy, Rabobank uses the following two key criteria:
• Equity at risk, duration of equity; and
• Income at risk; the vulnerability of the interest income to a gradual increase or decrease in interest rates
over the next 12 months.
Interest-rate risk at Rabobank arises as a result of discrepancies in the maturities and terms of loans and funds,
option risk, basis risk and yield-curve risk. Any interest-rate risk to which clients are exposed as a result of an
increase in their obligations due to interest-rate movements has no effect on Rabobank’s level of risk exposure.
Any negative effects arising from this exposure are regarded as credit risk.
At the group level, Rabobank’s interest-rate risk is managed by the Asset and Liability Committee Rabobank
Group chaired by the Chief Financial Officer. The Central Treasury is responsible for implementing the
decisions of this committee, while Risk Management is responsible for measurement and reporting.
Rabobank’s interest-rate risk arises primarily from mortgages provided and business loans provided with
a long fixed-interest period. These mortgages and loans are financed with, among other things, customers’
savings, customers’ current account balances and in current account and with funding provided by
professional money market and capital market players. Interest-rate risk is measured not only based on
contractually recorded data; customer behaviour in the interest-rate risk models is also taken into account.
The definition used for managing interest-rate risk varies from the IFRS definition of equity.
For interest-rate risk management, the economic value of equity is defined as the present value of the assets
less the present value of the liabilities plus the present value of the off-balance-sheet items. Through the use
of hedge accounting and due to the fact that a large portion of the balance sheet is stated at amortised cost
(in IFRS terms) and therefore does not change in value, the effects of the calculated value changes on IFRS
capital will be largely restricted to an impact on interest income. Paragraphs 4.3.1 and 4.3.2 provide further
details of Income at risk and Equity at risk trends in 2014.
4.3.1 Income at riskIncome at risk is calculated once a month based on a standard interest-rate-sensitivity analysis. This analysis
shows the main deviation, in a negative sense, of the projected interest income over the next 12 months as a
result of a scenario in which all money-market and capital-market interest rates gradually increase by
2 percentage points and of a scenario in which all money-market and capital-market interest rates gradually
decrease by 2 percentage points.
The projected interest-rate income is based on a scenario in which all interest rates and other rates remain
equal. Rabobank’s profit from interest was vulnerable to an interest-rate decrease throughout the year 2014.
The maximum income at risk was 55 (data for May 2014). On 31 December 2014, the income at risk was only 15.
This low position can be attributed mainly to the assumption that the interbank money-market interest rates
and the swap interest rates cannot be lower than 0%. As a result, the estimated decline in the euro interest
rates at 31 December 2014 was 2 basis points rather than 200 basis points. At 31 December 2013 and for the
first five months of 2014, this estimated decline was still 10 basis points. The effects on interest profit may be
greater if not all interest rates increase or decrease equally.

32 Consolidated Financial Statements 2014 Rabobank Group
Income at risk
In millions of euros 31 Dec 2014 31 Dec 2013
2 bp decline 10 bp decline
(15) (50)
4.3.2 Equity at riskThe equity at risk or duration of equity indicates by what percentage the economic value of equity will fall if
the money-market and capital-market interest rates increase by one percentage point. The Executive Board
has set a lower limit of 0% and an upper limit of 6% for this purpose. Furthermore, additional limits apply for
the basis-point vulnerability of equity and the delta profile for equity. Equity at risk fell from 2.3% to 0.4% in
2014. In lending, the increase in equity at risk has been very limited. One of the reasons for this is the low
number of new mortgages and business loans. At the same time, the volume of bank savings products with
long interest rate schedules increased, which, in turn, reduces equity at risk. However, in 2014 equity at risk
declined mainly as a result of the lower market interest rates. This decline, in turn, resulted in a decline in
quotation risk and an upward effect on the economic value of equity.
Equity at risk
31 Dec 2014 31 Dec 2013
0.4% 2.3%
Periodic analyses are performed in addition to the monthly interest-rate sensitivity tests, whereby the effect
on interest income is calculated for one or more macroeconomic effects. The results of these scenario
analyses are part of Rabobank’s integrated interest-rate risk management and are included in the reports
submitted to the highest management bodies.
4.4 Credit riskCredit risk is the risk that a counterparty is unable to meet a financial or other contractual obligation vis-à-vis
the bank. Credit risk is inherent to granting loans. Positions in tradable assets such as bonds and shares are
also subject to credit risk.
Rabobank restricts its credit risk exposure by setting limits for loans to an individual counterparty, or a group
of counterparties, as well as for loans to countries. The four-eyes principle is a key factor when granting loans.
A multi-level committee structure is in place to make decisions on major loan applications, with the
competent committee being chosen based on the size of the loan. Decisions on the largest loans are made
directly by the Executive Board.
The credit risk exposure relating to each individual borrower is further restricted by the use of sub-limits to
hedge amounts at risk, not all of which are disclosed in the statement of financial position, and the use of
daily delivery risk limits for trading items such as forward currency contracts. Most actual risks are assessed
daily against the limits.
Once a loan has been granted, it is continually subject to credit management as part of which new
information – financial and other – is reviewed. Credit limits are adjusted where necessary. Rabobank obtains
collateral or guarantees for the majority of the loans.
4.4.1 Maximum credit riskThe table below sets out the maximum credit risk to which Rabobank is subject at the reporting date in
respect of the various categories, without taking into account any collateral or other measures for restricting
credit risk. It also shows the financial effect of any collateral provided or other types of credit risk reduction.
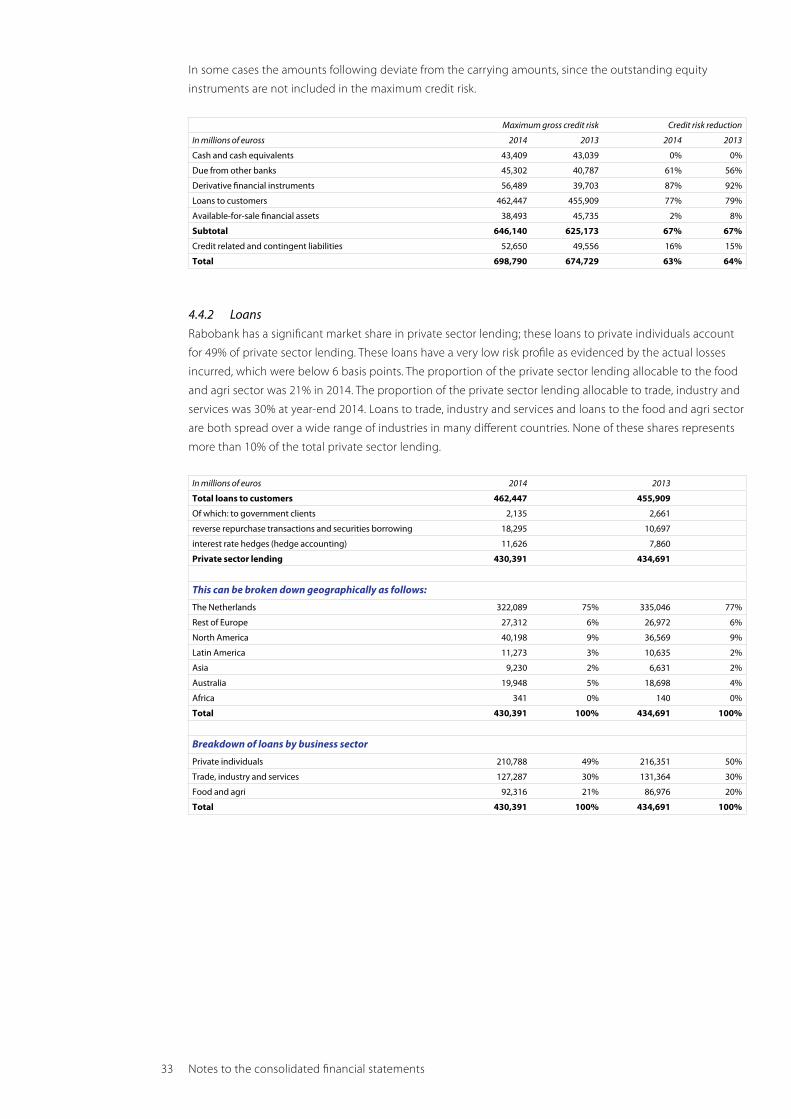
33 Notes to the consolidated financial statements
In some cases the amounts following deviate from the carrying amounts, since the outstanding equity
instruments are not included in the maximum credit risk.
Maximum gross credit risk Credit risk reduction
In millions of euross 2014 2013 2014 2013
Cash and cash equivalents 43,409 43,039 0% 0%
Due from other banks 45,302 40,787 61% 56%
Derivative financial instruments 56,489 39,703 87% 92%
Loans to customers 462,447 455,909 77% 79%
Available-for-sale financial assets 38,493 45,735 2% 8%
Subtotal 646,140 625,173 67% 67%
Credit related and contingent liabilities 52,650 49,556 16% 15%
Total 698,790 674,729 63% 64%
4.4.2 LoansRabobank has a significant market share in private sector lending; these loans to private individuals account
for 49% of private sector lending. These loans have a very low risk profile as evidenced by the actual losses
incurred, which were below 6 basis points. The proportion of the private sector lending allocable to the food
and agri sector was 21% in 2014. The proportion of the private sector lending allocable to trade, industry and
services was 30% at year-end 2014. Loans to trade, industry and services and loans to the food and agri sector
are both spread over a wide range of industries in many different countries. None of these shares represents
more than 10% of the total private sector lending.
In millions of euros 2014 2013
Total loans to customers 462,447 455,909
Of which: to government clients 2,135 2,661
reverse repurchase transactions and securities borrowing 18,295 10,697
interest rate hedges (hedge accounting) 11,626 7,860
Private sector lending 430,391 434,691
This can be broken down geographically as follows:
The Netherlands 322,089 75% 335,046 77%
Rest of Europe 27,312 6% 26,972 6%
North America 40,198 9% 36,569 9%
Latin America 11,273 3% 10,635 2%
Asia 9,230 2% 6,631 2%
Australia 19,948 5% 18,698 4%
Africa 341 0% 140 0%
Total 430,391 100% 434,691 100%
Breakdown of loans by business sector
Private individuals 210,788 49% 216,351 50%
Trade, industry and services 127,287 30% 131,364 30%
Food and agri 92,316 21% 86,976 20%
Total 430,391 100% 434,691 100%

34 Consolidated Financial Statements 2014 Rabobank Group
TIS loan portfolio analysed by industry
In millions of euros 2014 2013
Lessors of real estate 26,202 26,568
Finance and insurance (except banks) 14,091 14,565
Wholesale 11,194 14,157
Activities related to real estate 6,253 6,795
Manufacturing 10,752 8,557
Transport and warehousing 6,103 6,581
Construction 5,343 6,615
Healthcare and social assistance 5,968 6,065
Professional, scientific and technical services 9,478 5,442
Retail (except food and beverages) 4,718 4,711
Utilities 2,364 2,311
Information and communication 823 1,008
Arts, entertainment and leisure 1,340 1,310
Other TIS 22,658 26,679
Total loans granted to TIS 127,287 131,364
Food and agri loan portfolio analysed by industry
In millions of euros 2014 2013
Grain and oil seeds 17,474 14,890
Animal protein 22,977 16,716
Dairy 14,031 14,293
Fruit and vegetables 9,933 9,006
Farm inputs 7,249 6,032
Food retail 4,276 4,735
Beverages 3,823 3,683
Flowers 1,792 2,915
Sugar 2,285 1,959
Miscellaneous crop farming 1,772 1,649
Other food and agri 6,704 11,098
Total loans granted to food and agri 92,316 86,976
4.4.3 Derivative financial instrumentsRabobank sets strict limits for open positions, in amounts as well as in terms. If ISDA (International Swaps and
Derivatives Association) standards apply or a master agreement including equivalent terms has been
concluded with the counterparty, and if the jurisdiction of the counterparty permits setting off, the net open
position is monitored. This credit risk is managed as part of the general lending limits for clients. Where needed,
Rabobank obtains collateral or other safeguards with respect to credit risks inherent in these transactions.
The credit risk exposure represents the current fair value of all open derivative contracts showing a positive
market value, taking into account master netting agreements enforceable by law.
4.4.4 Credit risk management methodsRabobank’s credit risk exposure is restricted in part by obtaining collateral where necessary.
The amount and nature of the collateral required depends partly on the assessment of the credit risk of the
loan to the counterparty. Rabobank follows guidelines for the purpose of accepting and valuing different
types of collateral. The major types of collateral are:
• residential mortgage collateral;
• mortgage collateral on immovable property, pledges on movable property, inventories and receivables,
mainly for business loans;
• cash and securities, mainly for securities lending activities and reverse repurchase transactions.
The management monitors the market value of collateral obtained and requires additional collateral where
necessary. Rabobank also uses credit derivative financial instruments to manage credit risks. Rabobank further
limits its exposure to credit risk by entering into master netting arrangements with counterparties for a
significant volume of transactions. In general, master netting arrangements do not lead to the setting off of
assets and liabilities included in the statement of financial position, as transactions are usually settled gross.

35 Notes to the consolidated financial statements
The credit risk is limited by master netting arrangements, however, to the extent that, if an event or
cancellation occurs, all amounts involving the counterparty are frozen and settled net. The total credit risk
exposure of Rabobank from derivative financial instruments to which netting arrangements apply is highly
sensitive to the closing of new transactions, lapsing of existing transactions and fluctuations in market interest
and exchange rates.
The table below shows offsets which have been applied in the consolidated balance sheet (IAS 32 Offsetting)
and of sets which have not been applied in the consolidated balance sheet. The remaining offsets consist of
securities Rabobank has received from reverse buyback transactions and securities Rabobank has provided in
relation to buyback transaction loans.
Offsetting of financial instruments
In millions of eurosGross carrying
amount IAS 32 Offsetting
Net carrying amount
included inbalance sheet
Master nettingagreements
Otheroffsetting
Net value afterother offsetting
At 31 December 2014
Due from other banks 46,030 (728) 45,302 - (28,676) 16,626
Other financial assets at fair value through profit and loss 4,279 - 4,279 - - 4,279
Derivative financial instruments 124,764 (68,275) 56,489 (43,195) - 13,294
Loans to customers 483,732 (21,285) 462,447 - (18,864) 443,583
Other assets 8,917 (357) 8,560 - - 8,560
Total 667,722 (90,645) 577,077 (43,195) (47,540) 486,343
Due to other banks 20,169 (2,286) 17,883 - (721) 17,162
Due to customers 341,230 (14,759) 326,471 - (2,036) 324,435
Derivative financial instruments and other trade liabilities 140,803 (73,243) 67,560 (43,195) - 24,365
Other liabilities 8,404 (357) 8,047 - - 8,047
Total 510,606 (90,645) 419,961 (43,195) (2,757) 374,009
At 31 December 2013
Due from other banks 41,786 (999) 40,787 - (23,277) 17,510
Other financial assets at fair value through profit and loss 4,939 - 4,939 - - 4,939
Derivative financial instruments 66,836 (27,133) 39,703 (30,492) - 9,211
Loans to customers 474,001 (18,092) 455,909 - (11,265) 444,644
Other assets 8,400 (370) 8,030 - - 8,030
Total 595,962 (46,594) 549,368 (30,492) (34,542) 484,334
Due to other banks 17,384 (2,639) 14,745 - (904) 13,841
Due to customers 338,114 (11,892) 326,222 - (1,636) 324,586
Derivative financial instruments and other trade liabilities 81,864 (31,693) 50,171 (30,492) - 19,679
Other liabilities 8,119 (370) 7,749 - - 7,749
Total 445,481 (46,594) 398,887 (30,492) (2,540) 365,855
4.4.5 Off-balance-sheet financial instrumentsThe guarantees and standby letters of credit which Rabobank provides to third parties in the event a client
cannot fulfil its obligations vis-à-vis these third parties, are exposed to credit risk. Documentary and
commercial letters of credit and written undertakings by Rabobank on behalf of clients authorise third parties
to draw bills against Rabobank up to a present amount subject to specific conditions. These transactions are
backed by the delivery of the underlying goods to which they relate. Accordingly, the risk exposure of such an
instrument is less than that of a direct loan. Obligations to grant loans at specific rates of interest during a
fixed period of time are recognised under credit granting liabilities and accounted for as such unless these
commitments do not extend beyond the period expected to be needed to perform appropriate underwriting,
in which case they are considered to be transactions conforming to standard market conventions. Rabobank
is exposed to credit risk when it promises to grant lending facilities. The size of such losses is less than the
total of the unused commitments, as promises to grant credit facilities are made subject to the clients

36 Consolidated Financial Statements 2014 Rabobank Group
meeting certain conditions that apply to loans. Rabobank monitors the term to expiry of credit promises,
as long-term commitments are generally associated with a higher risk than short-term commitments.
4.4.6 Credit quality of financial assetsIn its financing approval process, Rabobank Group uses the Rabobank Risk Rating, which reflects the
counter party’s probability of default (PD) over a one-year period. The table below shows the loan quality (after
deduction of the bad-debt provision) of the loan-related balance sheet items. The loan-quality categories are
determined based on the internal Rabobank Risk Rating. The Rabobank Risk Rating consists of 21 performing
ratings (R0-R20) and four default ratings (D1-D4). The performing ratings are linked to the probability that the
client will default within a period of one year, whereby the rating is determined, as a rule, on a cyclically
neutral basis. The D1-D4 rating refers to default classifications: D1 represents 90 days’ arrears; D2 indicates
a high probability that the debtor is unable to pay.
D3 refers to the debtor’s inability to meet its commitments and that their properties will most likely be sold
off; and D4 indicates bankruptcy status. The default ratings make up the total impaired exposure.
The ‘vulnerable’ category consists of performance ratings which have been cancelled but which have not
undergone impairment.
Credit quality of financial assets
In millions of euros(Virtually)
no riskAdequate to
good Vulnerable Impaired Total
At 31 December 2014
Due from other banks 29,372 15,616 175 139 45,302
Loans to customers
Loans to government clients 1,269 777 3 71 2,120
Loans to private clients:
- overdrafts 1,544 20,185 589 1,193 23,511
- mortgages 39,411 173,101 4,327 1,391 218,230
- leases 1,344 20,424 1,845 224 23,837
- reverse repurchase transactions and securities borrowing agreements 9,848 8,447 - - 18,295
- corporate loans 13,158 147,604 3,386 4,572 168,720
- other 4,257 2,045 7 130 6,439
Total 100,203 388,199 10,332 7,720 506,454
At 31 December 2013
Due from other banks 26,742 14,041 - 4 40,787
Loans to customers
Loans to government clients 1,612 933 1 - 2,546
Loans to private clients:
- overdrafts 984 13,368 934 1,788 17,074
- mortgages 51,071 163,548 3,177 1,588 219,384
- leases 1,019 18,397 1,538 562 21,516
- reverse repurchase transactions and securities borrowing agreements 4,450 6,247 - - 10,697
- corporate loans 19,916 147,761 4,572 3,859 176,108
- other 962 7,358 110 154 8,584
Total 106,756 371,653 10,332 7,955 496,696

37 Notes to the consolidated financial statements
The table below gives an age analysis of financial assets expired (overdue) but unimpaired.
Age analysis
In millions of euros < 30 days 30 to 60 days 61 to 90 days > 90 days Total
At 31 December 2014
Due from other banks 139 - 35 1 175
Loans to customers
Loans to government clients - 1 1 1 3
Loans to private clients:
- overdrafts 300 61 28 200 589
- mortgages 2,955 549 282 541 4,327
- leases 1,171 333 116 225 1,845
- reverse repurchase transactions and securities borrowing agreements - - - - -
- corporate loans 1,883 334 178 991 3,386
- other 6 1 - - 7
Total 6,454 1,279 640 1,959 10,332
At 31 December 2013
Due from other banks - - - - -
Loans to customers
Loans to government clients 1 - - - 1
Loans to private clients:
- overdrafts 594 264 67 9 934
- mortgages 2,057 683 356 81 3,177
- leases 1,042 289 206 1 1,538
- reverse repurchase transactions and securities borrowing agreements - - - - -
- corporate loans 3,187 907 362 116 4,572
- other 84 20 6 - 110
Total 6,965 2,163 997 207 10,332
4.4.7 Clemency (forbearance)Rabobank developed a policy in 2013 for monitoring its forbearance portfolio every quarter; this policy was
implemented in 2014. ‘Forbearance’ and ‘clemency’ are related terms, and this portfolio consists of the
customers of Rabobank for whom forbearance measures have been put in place. The measures under that
name comprise concessions to debtors facing or about to face difficulties in meeting their financial
commitments. A concession refers to either of the following actions:
• A modification of the previous terms and conditions of a contract the debtor is unable to comply with due
to its financial difficulties (‘bad debt’) in order to allow for sufficient debt service ability, that would not have
been granted had the debtor not been in financial difficulty.
• A total or partial refinancing of a bad-debt contract, which would not have been granted had the debtor
not been in financial difficulty.
Examples include postponements of repayments and extensions of the term of a facility. The rationale for the
focus on this portfolio derives from the concerns of the European regulators about the deterioration of the
quality of the portfolio; it is feared that forbearance measures might camouflage this deterioration of the
portfolio as debtors are able to meet their financial obligations for longer periods as a result of the concessions.
The identification of forbearance measures for the corporate portfolio will be based on the current Loan Quality
Classification framework, with forbearance measures only applying to the classified portfolio. If forbearance
measures are applied to a debtor, the debtor will, by definition, be fall under the supervision of the Special
Asset Management department. Lastly, items in the forbearance category must be reported for up to two
years after recovery from ‘non-performing’ to ‘performing’. This period of two years is referred to as ‘Forborne
under probation’.

38 Consolidated Financial Statements 2014 Rabobank Group
4.4.8 Trends in the real estate portfolioRabobank’s portfolio of commercial real estate in the Netherlands is primarily managed by FGH Bank and the
local Rabobanks. The commercial real estate market deteriorated further in 2014, particularly in the offices and
retail segments. Long-term trends such as demographic ageing, the ‘New Way of Working’ and online
shopping are all important factors in this development. Due to the current market conditions, in which there
is a clear distinction between properties with little or no prospect of viability and those with a chance of
success, the quality of the commercial real estate loan portfolio has declined. Less marketable properties,
in particular, are declining in value. The review and appraisal policy and the non-performing loans policy are
based on a risk-oriented approach. Where reviews reveal that the assumed value may no longer reflect the
market value, the value is reassessed. Appraisals are performed by an independent appraiser. Rabobank
thereby complies with the requirements set by the Dutch Central Bank for valuation, and the age of
appraisals.
As a result of the report by the Valuers and Accountants Platform (Taxateurs en Accountants, or ‘PTA’) on real
estate appraisal, Rabobank brought its valuation process in line with the recommendations made in
connection with the banking process where this was not already the case in 2013.
Within the Rabobank Group, management of the commercial real estate portfolio in the Netherlands has
been intensified. The Commercial Real Estate Task Force was set up for this specific purpose in mid-2010.
The Task Force frequently reports to the Executive Board on changes in the size of the Dutch portfolio and the
level of risk it contains, and it will continue to keep a close eye on market trends and portfolio movements for
the next few years. Steps to tighten the financing, revision and appraisal policies have already been taken in
recent years.
The table below gives information on the commercial real estate loan portfolio in the Netherlands as of
31 December 2014. The Property Development segment is presented separately, since this segment is
experiencing longer processing times and a stagnating real estate market. Rabobank’s lending in this
segment, at EUR 0.8 billion, is relatively low.
In millions of euros Loan portfolioImpairedportfolio Provisions
Valueadjustments Write-off
At 31 December 2014
Investment property of domestic retail banking business 8,586 1,197 673 249 152
Investment property of Rabo Real Estate Group 14,676 3,059 1,104 544 333
Total investment property 23,262 4,256 1,777 793 485
Property development of domestic retail banking business 1,062 527 342 23 26
Property development of Rabo Real Estate Group 820 89 37 8 2
Total property development 1,882 616 379 31 28
In millions of euros Loan portfolioImpairedportfolio Provisions
Valueadjustments Write-off
At 31 December 2013
Investment property of domestic retail banking business 9,087 949 516 144 35
Investment property of Rabo Real Estate Group 16,163 2,632 788 485 23
Total investment property 25,250 3,581 1,304 629 58
Property development of domestic retail banking business 1,942 680 396 168 48
Property development of Rabo Real Estate Group 1,041 135 30 29 11
Total property development 2,983 815 426 197 59

39 Notes to the consolidated financial statements
Rabobank’s commercial real estate portfolio in the Netherlands declined again in 2014 due to repayments
and a lower risk appetite. The developments in the market caused a deterioration in the quality of the
portfolio, as can be seen from the higher level of impaired loans, and therefore also the costs of loan losses in
recent years. Important mitigating factors for the quality of the loan portfolio are Rabobank’s focus on
relationship banking and the fact that its financing policy is customer-driven rather than property-driven.
Since some of the difficulties in the commercial real estate market are structural in nature, loan losses in the
real estate portfolio are expected to remain high in the years to come. Nearly the entire commercial real
estate portfolio outside the Netherlands is provided by ACC Loan Management. This is a run-off portfolio.
Although property values in prime locations in Ireland are stabilising to some extent, in other locations values
are still under pressure. Further contributions amounting to EUR 111 million were accordingly made to the
allowances for this portfolio in 2014. Rabobank expects to make further contributions in the coming year,
albeit at a lower level than in previous years.
4.4.9 Asset Quality Review (AQR)The financial crisis and the huge impact of this on the banking sector led to the creation of the Single
Supervisory Mechanism (SSM) and a sector-wide review of the quality of assets by the European Central Bank
(ECB). This Asset Quality Review (AQR) concentrated on the reference date of 31 December 2013. It thus
concerned exposures and provisions already recognised in the financial statements for 2013. The findings
with respect to the various areas of the AQR and the effect of these on the common equity tier 1 capital also
relate to 31 December 2013. The review focused on a large part of the portfolio. In the Netherlands, this
involved the total loan portfolio of the local Rabobanks and subsidiaries. In Ireland, the review concerned the
funding of commercial real estate and the commercial loan portfolio, while in New York the review focused on
the portfolio of sizeable corporate finance transactions.
The review also considered the market risks, in particular with reference to the valuation of Credit Valuation
Adjustment (CVA) and the proprietary land holdings of Rabo Real Estate Group.
The effect of the AQR findings on the 2014 financial statements mainly concerns an adjustment to the
provisions for loan losses. The amount of the provisions recognised in the statement of financial position as at
31 December 2013 is the result of the methodology used by Rabobank for loan losses in 2013.
This methodology results in a specific provision, a collective provision and a general provision (also referred to
as IBNR) and was based on the information available at the time, events that could involve impairments and
the models used.
No items were found during the review that would entail changes to the comparative figures for 2013.
The total addition to the capital requirement and the provisions is, as published in October 2014, set by the
ECB at EUR 2,093 million. A significant proportion of this addition that relates to loans and land holdings has
been recognised in the profit and loss account for 2014 as part of the normal provision process. This mainly
concerns adjustments on the basis of information that only became available to the management in 2014.
The financial crisis has led to a more prudent approach to credit risk. The SSM and the AQR as carried out by
the ECB have accelerated this change. For Rabobank, it will lead to the introduction of more conservative and
stricter loss indicators. An adjustment to the related provision levels has already been made in 2014.
In addition, the more conservative approach has led to a change in the parameters for the general provision
(IBNR). For the determination of its IBNR, Rabobank uses the Expected Loss (EL) as the starting point.
An adjustment has been made for the period needed to identify a loss (the Loss Identification Period).
In view of the development of the economy and the portfolio, this period was extended in 2014. The basis
for determining the EL was also changed to more prudent principles in 2014.

40 Consolidated Financial Statements 2014 Rabobank Group
4.5 Currency risk in the banking environmentRabobank is exposed to the effect of fluctuations in exchange rates on its financial position and cash flows. In the
trading environment, currency risk – like other market risks – is managed based on the Value at Risk (VaR)
limits set by the Executive Board, as detailed in paragraph 4.7, ‘Market risk in the trading environment’. The banking
environment is affected only by translation risk; the other currency risks in the banking environment are fully
hedged. Translation risk becomes evident when the bank’s consolidated balance sheet and results are
prepared, whereby all items in foreign currencies must be valued against euros. This makes the financial data
sensitive to foreign-currency valuations. Translation risk manifests itself in different ways within Rabobank.
• Rabobank’s solvency ratios may be affected by exchange-rate fluctuations as a result of differences in the
exchange-rate composition of the capital and the RWAs.
• Exchange-rate fluctuations can potentially affect the value of (fully or partially) consolidated foreign entities
whose functional currencies are not euros.
• The value of non-euro-denominated strategic interests can be affected by exchange-rate fluctuations.
In relation to the monitoring and management of translation risk, Rabobank applies a policy designed to
protect the bank’s Core Tier 1 ratio from exchange-rate fluctuations.
4.6 Liquidity riskRabobank is exposed to liquidity risk, i.e. the risk that the bank is unable to meet all of its (re)payment
obligations, as well as the risk that the bank is unable to fund increases in assets at reasonable prices or
unable at all. This could happen if, for instance, clients or professional counterparties suddenly withdraw more
funds than expected, which cannot be met by the bank’s cash resources or by selling or pledging assets or by
borrowing funds from third parties.
For a long time now, Rabobank has recognised liquidity risk as a major risk type. Rabobank’s policy therefore is
to match the term of funding with the term of loans granted. Long-term loans must be financed through
funds entrusted by customers or long-term funding by professional markets.
Liquidity risk is managed based on three pillars. The first of these sets strict limits for the maximum outgoing
cash flows within the wholesale banking business. Among other things, Rabobank measures and reports on a
daily basis what incoming cash flows can be expected during the first twelve months. Limits have been set for
these outgoing cash flows, including for each currency and each site. In order to be as well prepared as
possible for potential crisis situations, a number of detailed contingency funding plans (CFPs) are in place
which are subjected to operational tests on a regular basis.
The second pillar is used to maintain a substantial buffer of liquid assets. In addition to the funds held at
central banks, these assets can be used to borrow from central banks, used in repo transactions or in order to
sell directly in the market in order to generate liquidities immediately. The amount of the liquidity buffer is
related to the risk to which Rabobank is exposed through its balance sheet. Rabobank Group has securitized
a portion of the loan portfolio (within the company) in recent years, which means it can be pledged from the
central bank and therefore serves as an additional liquidity buffer. Since this concerns internal securitisations,
solely for liquidity purposes, they are not visible in the economic balance sheet but are included in the
available liquidity buffer.
The third pillar entails the restriction of liquidity risk through a prudent funding policy aimed at meeting the
financing requirements of the group units at acceptable cost. Diversification of sources of funding and
currencies, flexibility of the funding instruments applied and a hands-on investor relations approach are key
factors. This prevents Rabobank Group from being overly dependent on a single source of funding.
Furthermore, scenario analyses are performed each month to simulate the possible consequences of a wide
range of stress scenarios, distinguishing between scenarios specific for the market and scenarios specific for
Rabobank, as well as a combination of them. Monthly reports on the liquidity position of the Group as a
whole are submitted to the Dutch Central Bank. These reports are prepared in accordance with the guidelines
drawn up by this supervisory authority.

41 Notes to the consolidated financial statements
The table below shows Rabobank’s non-discounted liabilities grouped by the liquidity period remaining
between the reporting date and the expected contract repayment date. The total amounts do not correspond
exactly with the amounts in the consolidated statement of financial position, since this table is based on non-
discounted cash flows, related to both principal and future interest payments. ‘Derivative financial instruments
and other trade liabilities’ have not been analysed on the basis of the contract repayment date because they
are not essential for the management of liquidity risk and for reporting to the management of Rabobank.
Contract repayment date
In millions of euros On demandLess than3 months
3 monthsto 1 year 1 - 5 years
Longer than 5 years Total
At 31 December 2014
Liabilities
Due to other banks 2,293 8,777 1,270 5,015 666 18,021
Due to customers 238,882 44,500 9,987 15,138 23,079 331,586
Debt securities in issue 229 32,350 59,775 67,318 44,938 204,610
Other debts (excluding employee benefits) 1,543 4,878 712 811 22 7,966
Other financial liabilities at fair valuethrough profit and loss 38 684 1,523 5,624 23,553 31,422
Subordinated debt - - 3 1,382 15,340 16,725
Total financial liabilities 242,985 91,189 73,270 95,288 107,598 610,330
Financial guarantees 11,826 - - - - 11,826
In millions of euros On demandLess than3 months
3 monthsto 1 year 1 - 5 years
Longer than 5 years Total
At 31 December 2013
Liabilities
Due to other banks 2,934 5,791 1,670 3,326 1,392 15,113
Due to customers 250,658 35,739 10,567 12,881 21,462 331,307
Debt securities in issue 112 31,975 63,353 74,674 42,378 212,492
Other debts (excluding employee benefits) 1,333 4,568 238 870 83 7,092
Other financial liabilities at fair valuethrough profit and loss 69 821 1,511 6,892 22,280 31,573
Subordinated debt - 5 - 94 12,055 12,154
Total financial liabilities 255,106 78,899 77,339 98,737 99,650 609,731
Financial guarantees 11,429 - - - - 11,429
The following table shows Rabobank’s assets and liabilities grouped by the period remaining between the
reporting date and the contract repayment date. These amounts correspond with the statement of financial
position.
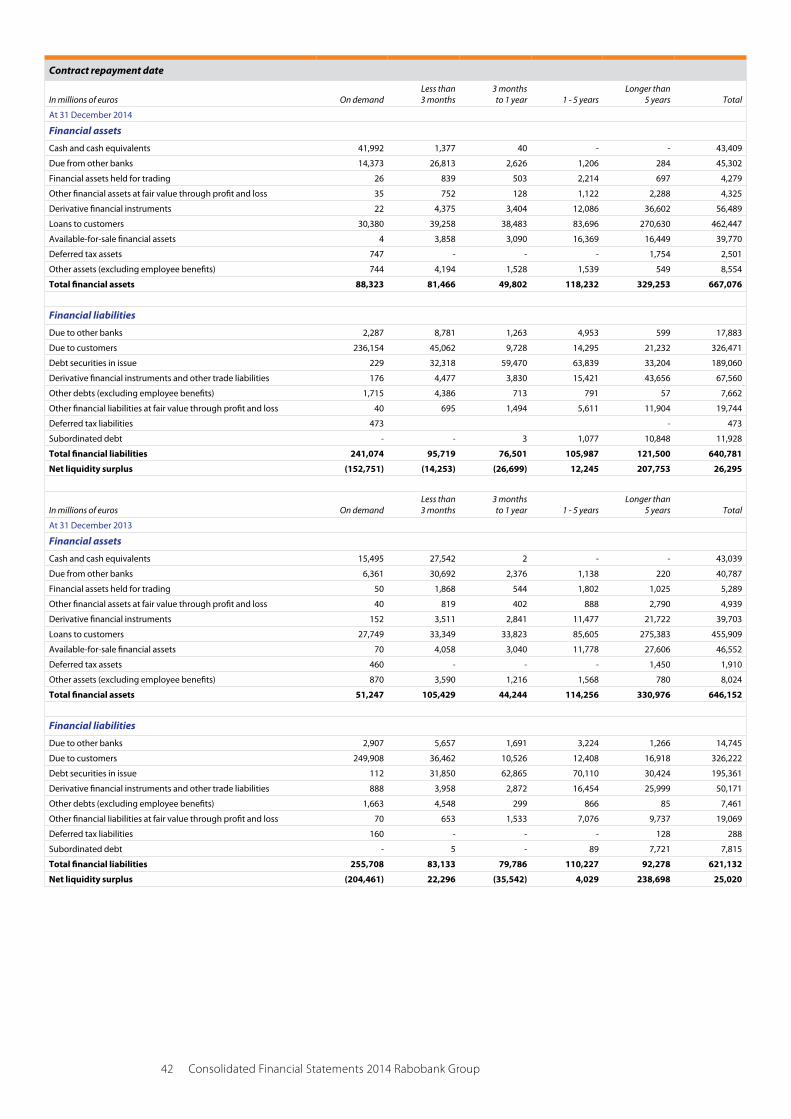
42 Consolidated Financial Statements 2014 Rabobank Group
Contract repayment date
In millions of euros On demandLess than3 months
3 monthsto 1 year 1 - 5 years
Longer than 5 years Total
At 31 December 2014
Financial assets
Cash and cash equivalents 41,992 1,377 40 - - 43,409
Due from other banks 14,373 26,813 2,626 1,206 284 45,302
Financial assets held for trading 26 839 503 2,214 697 4,279
Other financial assets at fair value through profit and loss 35 752 128 1,122 2,288 4,325
Derivative financial instruments 22 4,375 3,404 12,086 36,602 56,489
Loans to customers 30,380 39,258 38,483 83,696 270,630 462,447
Available-for-sale financial assets 4 3,858 3,090 16,369 16,449 39,770
Deferred tax assets 747 - - - 1,754 2,501
Other assets (excluding employee benefits) 744 4,194 1,528 1,539 549 8,554
Total financial assets 88,323 81,466 49,802 118,232 329,253 667,076
Financial liabilities
Due to other banks 2,287 8,781 1,263 4,953 599 17,883
Due to customers 236,154 45,062 9,728 14,295 21,232 326,471
Debt securities in issue 229 32,318 59,470 63,839 33,204 189,060
Derivative financial instruments and other trade liabilities 176 4,477 3,830 15,421 43,656 67,560
Other debts (excluding employee benefits) 1,715 4,386 713 791 57 7,662
Other financial liabilities at fair value through profit and loss 40 695 1,494 5,611 11,904 19,744
Deferred tax liabilities 473 - 473
Subordinated debt - - 3 1,077 10,848 11,928
Total financial liabilities 241,074 95,719 76,501 105,987 121,500 640,781
Net liquidity surplus (152,751) (14,253) (26,699) 12,245 207,753 26,295
In millions of euros On demandLess than3 months
3 monthsto 1 year 1 - 5 years
Longer than 5 years Total
At 31 December 2013
Financial assets
Cash and cash equivalents 15,495 27,542 2 - - 43,039
Due from other banks 6,361 30,692 2,376 1,138 220 40,787
Financial assets held for trading 50 1,868 544 1,802 1,025 5,289
Other financial assets at fair value through profit and loss 40 819 402 888 2,790 4,939
Derivative financial instruments 152 3,511 2,841 11,477 21,722 39,703
Loans to customers 27,749 33,349 33,823 85,605 275,383 455,909
Available-for-sale financial assets 70 4,058 3,040 11,778 27,606 46,552
Deferred tax assets 460 - - - 1,450 1,910
Other assets (excluding employee benefits) 870 3,590 1,216 1,568 780 8,024
Total financial assets 51,247 105,429 44,244 114,256 330,976 646,152
Financial liabilities
Due to other banks 2,907 5,657 1,691 3,224 1,266 14,745
Due to customers 249,908 36,462 10,526 12,408 16,918 326,222
Debt securities in issue 112 31,850 62,865 70,110 30,424 195,361
Derivative financial instruments and other trade liabilities 888 3,958 2,872 16,454 25,999 50,171
Other debts (excluding employee benefits) 1,663 4,548 299 866 85 7,461
Other financial liabilities at fair value through profit and loss 70 653 1,533 7,076 9,737 19,069
Deferred tax liabilities 160 - - - 128 288
Subordinated debt - 5 - 89 7,721 7,815
Total financial liabilities 255,708 83,133 79,786 110,227 92,278 621,132
Net liquidity surplus (204,461) 22,296 (35,542) 4,029 238,698 25,020

43 Notes to the consolidated financial statements
The above breakdown was compiled on the basis of contract information, without taking into account actual
changes in items in the statement of financial position. This is taken into account, however, for the day-to-day
management of the liquidity risk. Customer savings are an example. By contract, they are payable on demand.
However, experience has shown that this is a very stable source of financing at the long-term disposal of
Rabobank. The regulations of the supervisory authority also factor this in. Based on the liquidity criteria of the
Dutch Central Bank, Rabobank had a substantial liquidity surplus at 31 December 2014 and throughout 2014.
The average liquidity surplus was 26% (2013: 40%) of the total 1-month liquidity requirement. The surplus at
31 December 2014 was 23% (2013: 30%).
The liquidity requirements to meet payments under guarantees and standby letters of credit are considerably
lower than the amount of the liabilities, as Rabobank does not generally expect that third parties to such
arrangements will draw funds. The total open position relating to contractual obligations to provide credit
does not necessarily represent Rabobank’s future cash resource needs, as many of these obligations will lapse
or terminate without financing being required.
4.7 Market risk in the trading environment‘Market risk in the trading environment’ refers to changes in the value of the trading book as a result of,
among other things, changes in interest rates, credit spreads, foreign currencies and share prices. Analyses of
the market risk in the bank book are included in paragraph 4.3, ‘Interest-rate risk in the banking environment’
and paragraph 4.5, ‘Currency risk in the banking environment’.
At the consolidated level, the risk is represented by the Value at Risk (VaR), basis-point sensitivity and event risk.
The Executive Board annually ratifies the risk appetite and the corresponding limits. These limits are converted
into limits at book level and are monitored daily by the market management risk management departments.
In addition to the VaR, basis-point sensitivity and event-risk limits, an extremely detailed system of trading
controls per book is in place, including rotation risk (i.e. risk that the yield curve will shift), delta limits per
bucket, nominal limits and the maximum number of contracts. The risk position is reported to the senior
management on a daily basis and discussed in the various risk management committees on a monthly basis.
The VaR indicates, based on one year of historical market trends, the maximum loss for a given reliability level
and horizon under ‘normal’ market conditions. The internal VaR model forms an integral part of Rabobank’s
risk management framework and has also been approved by DNB for the determination of the solvency
requirement for market risk in the trading book. Rabobank has opted to use a VaR based on historical
simulation, where historical data is used for a period of one year. The VaR is calculated for a time horizon of
both one day and ten days. Rabobank has elected to apply a reliability level of 97.5% for its internal risk
management. The VaR is also calculated on a daily basis with a reliability rate of 99%.
A significant advantage of a VaR model based on historical simulation is that no assumptions need to be
made with regard to distributions of potential value changes for the various financial instruments.
A drawback, however is that a choice needs to be made with regard to the period of historical market trends
which could potentially affect the amount of the VaR as calculated. Based on the requirements imposed by
the regulator and following our own research, we decided to use an historical period of one year.
Back testing is used in order to test the actual outcomes on a regular basis in order to determine the validity
of the assumptions and parameters/factors used in calculating the VaR.
The table below shows how the VaR is composed; it is divided into various components. A diversity advantage
is achieved in this case by the opposing positions of various books which partially cancel each other out.
The average VaR fell from EUR 6 million in 2013 to EUR 4 million in 2014. The VaR briefly peaked at a level of
EUR 22 million in 2014. This one-off peak was the result of a large number of benchmark transactions and the
issue of Tier-2 bonds, short-term liquidity shortage in the market and unfavourable market trends. The resulting
market risk position was fully reduced within several days. The VaR remained within the limit of EUR 40 million
throughout 2014, also during this peak.

44 Consolidated Financial Statements 2014 Rabobank Group
VaR (1 day, 97.5%)
In millions of euros Interest CreditForeign
currencies Shares Commodities Diversification Total
2014 – 31 December 3 1 - 1 - 1 3
2014 – average 3 1 - 1 - n/a 4
2014 – highest 16 7 1 1 1 n/a 22
2014 – lowest 2 1 - - - n/a 2
2013 – 31 December 4 2 1 1 - (3) 4
2013 – average 6 2 - 1 1 n/a 6
2013 – highest 10 2 1 2 1 n/a 9
2013 – lowest 3 1 - - - n/a 4
In addition to the VaR for market risk, there are several other key risk indicators. Basis-point sensitivity, for
example, indicates how the value of the trading book positions changes if the yield curve increases, in parallel,
by 1 basis point. The table below shows these positions for each major currency.
Basis-point sensitivity
In millions of euros 2014 2013
Euro 0.6 0.6
US dollar (0.3) 1.1
Pound sterling 0.2 0.0
Other 0.0 (0.2)
Total 0.5 1.5
4.8 Operational riskRabobank defines operational risk as the risk of losses incurred as a result of inadequate or dysfunctional
internal processes, people and systems, or as a result of external trends and developments. Potential legal risks
and reputational risks are considered in the assessment and management of operational risk. In measuring and
managing operational risks, Rabobank Group operates within the parameters of the most advanced Basel II
approach, the Advanced Measurement Approach.
The bank’s operational risk policy is based on the principle that the group entities have primary responsibility
for managing operational risk and that this must be integrated into the strategic and day-to-day decision-
making processes. The purpose of operational risk management is to identify, measure, mitigate and monitor
various types of operational risks. The risk quantification process supports the management responsible in
prioritising the actions to be undertaken and the allocation of people and resources.
In order to implement this policy, Rabobank applies the ‘three lines of defence’ model. The group entities
represent the ‘first line of defence’ and are fully responsible for day-to-day risk acceptance and integrated risk
management and mitigation within the risk appetite framework determined. The risk management functions
within the group entities and within Risk Management together constitute the ‘second line of defence’. The risk
management function within the group entities acts as an adviser on risks and challenges the ‘first line of
defence’ on the risk management method used within the group entity. Risk Management is responsible for the
group picture and for challenging group entities and local risk management functions on their risk
management. Internal audit at the group level and within the group entities constitute the ‘third line of defence’.
At the group level, the Operational Risk Committee is responsible for adopting the policy and parameters.
In addition, Risk Management also reports each quarter on changes in operational risks at the group level. A
number of risk management committees have been established within the group entities, whose
responsibilities include identifying, managing and monitoring the operational risks (including system
continuity risk and fraud risks) of the relevant entity. A Risk Self Assessment is conducted within the group
entities. This process includes making an assessment of the main operational risks and identifying mitigating
measures if risks fall outside the risk appetite. This process is facilitated by Risk Management and the results
are communicated, at the group level, to the Operational Risk Committee. In addition, Risk Management
coordinates annual scenario analyses with senior management of the full Rabobank Group, which sheds light
on the group’s risk profile.

45 Notes to the consolidated financial statements
4.9 Fair value of financial assets and liabilitiesThe table on page 46 shows the fair value of financial instruments based on the valuation methods and
assumptions detailed below. This table is included because not all financial instruments are recognised at fair
value in the balance sheet. Fair value represents the price that would have been received for the sale of an
asset or that would have been paid in order to transfer a liability in a standard transaction conducted between
market participants on the valuation date.
Rabobank’s assumption for fair value measurement is that the transaction to sell the asset or transfer the
liability is conducted in the key market for the asset or liability – or, in the absence of a key market, in a market
offering favourable conditions.
Market prices are not available for a large number of the financial assets and liabilities that Rabobank holds or
issues. Hence, for financial instruments for which no market prices are available, the fair values shown in the
table on page 47 have been estimated using the present value or the results of other estimation and
valuation methods, based on the market conditions at the reporting date. The values produced using these
methods are highly sensitive to the underlying assumptions used for the amounts as well as for the timing of
future cash flows, discount rates and possible market illiquidity. The following methods and assumptions have
been used.
Cash and cash equivalents. The fair value of cash and cash equivalents is assumed to be almost equal to
their carrying amount. This assumption is also used for highly liquid investments and the current component
of all other financial assets and liabilities.
Due from other banks. Due from other banks comprise interbank placings and items to be collected. The fair
values of floating rate placings and overnight deposits are their carrying amounts. The estimated fair value of
fixed-interest deposits is based on the present value of the cash flows, calculated using appropriate money
market interest rates for debts with comparable credit risks and terms to maturity.
Financial assets and derivative financial instruments held for trading. Financial assets and derivative
financial instruments held for trading are carried at fair value based on available quoted market prices.
If quoted market prices are not available, the fair value is estimated from discounted cash flow models and
option valuation models. For derivatives, the bank factors in counterparty risk and our own creditworthiness.
In estimating counterparty risk, Rabobank uses the latest market data, including CDS curves and Monte Carlo
simulations. Another factor taken into account is funding valuation adjustments (FVA). FVA concerns the
valuation difference between transactions hedged by securities and transactions not hedged by securities.
The former are valued using a discount curve based on the overnight index spread; the latter are valued using
a discount curve based on Euribor/Libor plus a spread reflecting market conditions.
Other financial assets at fair value through profit or loss. These financial assets are carried at fair value
based on quoted market prices if available. If not, they are estimated from comparable assets on the market,
or using valuation methods, including appropriate discounted cash flow models and option valuation models.
Loans to customers. The fair value of issued loans is estimated from the present value of the cash flows,
using current market rates for similar loans. For variable-interest loans that are reviewed regularly and do not
vary significantly in terms of credit risk, the fair value is based on the carrying amount until maturity.
Available-for-sale financial assets. Available-for-sale financial assets are measured at fair value based on
listed market prices. If no listed market prices are unavailable, fair value is estimated based on models of
discounted cash flows and option valuation models.
Other financial assets. For almost all other financial assets, the carrying amount is a good approximation
of the fair value.
Due to other banks. Due to other banks comprise interbank placings, items to be delivered and deposits.
The fair values of floating rate placings and overnight deposits are their carrying amounts. The estimated fair
value of fixed-interest deposits is based on the present value of the cash flows, calculated using ruling money
market interest rates for debts with comparable credit risks and terms to maturity.
Trade liabilities. The fair value of trade liabilities is based on available quoted market prices. If quoted market
prices are not available, the fair value is estimated from valuation models.

46 Consolidated Financial Statements 2014 Rabobank Group
Other financial liabilities at fair value through profit or loss. The fair value of these liabilities is based on
available quoted market prices. If quoted market prices are not available, the fair value is estimated from
discounted cash flow models and option valuation models.
Due to customers. Due to customers include current accounts and deposits. The fair value of savings and
current accounts that have no specific termination date is assumed to be the amount payable on demand at
the reporting date, i.e. their carrying amount at that date. The fair value of the deposits is estimated from the
present value of the cash flows, based on current bid rates of interest for similar arrangements with terms to
maturity that match the items to be measured. The carrying amount of variable-interest deposits is a good
approximation of their fair value at the reporting date.
Debt and other instruments issued by Rabobank. The fair value of these instruments is calculated using
quoted market prices. For notes for which no quoted market prices are available, a discounted cash flow
model is used, based on a current yield curve appropriate for the term to maturity.
The fair value measurement in 2014 of financial assets and liabilities carried at amortised cost is more based
on market information. Consequently, the 2013 figures are adjusted and beside this correction also an effect
of hedge accounting that was taken into account in the fair value measurement of the loans to customers and
debt securities in issue in 2013 is adjusted. Ultimately, the adjustment of the 2013 figures leads to a change of
-1,345 of the loans to customers, -1,024 of due to customers and -415 for the debt securities in issue.
2014 2013
In millions of euros Carrying amount Fair value Carrying amount Fair value
Assets
Cash and cash equivalents 43,409 43,409 43,039 43,012
Due from other banks 45,302 45,312 40,787 40,859
Financial assets held for trading 4,279 4,279 5,289 5,289
Other financial assets at fair value through profit or loss 4,325 4,325 4,939 4,939
Derivative financial instruments 56,489 56,489 39,703 39,703
Loans to customers 462,447 473,920 455,909 461,056
Available-for-sale financial assets 39,770 39,770 46,552 46,552
Total financial assets 656,021 667,504 636,218 641,410
Liabilities
Due to other banks 17,883 17,912 14,745 14,879
Due to customers 326,471 331,238 326,222 327,870
Debt securities in issue 189,060 196,056 195,361 199,043
Derivative financial instruments and other trade liabilities 67,560 67,560 50,171 50,171
Other financial liabilities at fair value through profit or loss 19,744 19,744 19,069 19,069
Subordinated debt 11,928 13,111 7,815 8,103
Total financial liabilities 632,646 645,621 613,383 619,135
The above-stated figures represent the best possible estimates by management, based on a range of
methods and assumptions. If a quoted market price is available, this is the best estimate of fair value. If no
quoted market prices are available for fixed-term securities, equity instruments, derivative financial
instruments and commodity instruments, Rabobank bases the expected fair value on the present value of the
future cash flows, discounted at market rates corresponding to the credit ratings and terms to maturity of the
investments. Also, a model-based price can be used to determine fair value. Rabobank’s policy is to have all
models used for valuing financial instruments validated by expert staff who are independent of the staff who
determine the fair values of the financial instruments. In determining market values or fair values, various
factors have to be considered, such as the time value of money, volatility, underlying options, warrants and
derivative financial instruments. Other factors include liquidity and the creditworthiness of the counterparty.
The valuation process has been designed such that market prices that are available on a periodic basis are
systematically used. This systematic valuation process has proved its worth during the credit market crisis.
Modifications to assumptions might affect the fair value of trading and non-trading financial assets and liabilities.
The table on the next page illustrates the fair value hierarchy used in determining the fair value of financial
assets and liabilities. The breakdown is as follows:

47 Notes to the consolidated financial statements
• Category 1: Quoted prices in active markets for identical assets or liabilities; an ‘active market’ is a market in
which transactions relating to the asset or liability occur with sufficient frequency and at a sufficient volume
in order to provide price information on a permanent basis.
• Category 2: Inputs other than quoted prices included in category 1 that are observable for the asset or
liability, either directly (i.e. as prices) or indirectly (i.e. derived from prices);
• Category 3: Inputs for the asset or liability not based on observable market data.
Rabobank determines for recurrent valuations of financial instruments at fair value when transfers between
the various categories of the fair-value hierarchy occurred by reassessing the category during each new
reporting period.
In millions of euros Category 1 Category 2 Category 3 Total
At 31 December 2014
Assets
Cash and cash equivalents 726 42,683 - 43,409
Due from other banks - 45,312 - 45,312
Financial assets held for trading 3,059 1,091 129 4,279
Other financial assets at fair value through profit or loss 318 2,274 1,733 4,325
Derivative financial instruments 60 55,306 1,123 56,489
Loans to customers - 105,434 368,486 473,920
Available-for-sale financial assets 36,974 1,805 991 39,770
Non-current assets held for sale and discontinued operations - - 327 327
Liabilities
Due to other banks - 17,912 - 17,912
Due to customers - 73,994 257,244 331,238
Debt securities in issue 1,059 166,200 28,797 196,056
Derivative financial instruments and other trade liabilities 1,399 65,079 1,082 67,560
Other financial liabilities at fair value through profit or loss 15 19,683 46 19,744
Subordinated debt 13,082 29 - 13,111
In millions of euros
At 31 December 2013
Assets
Cash and cash equivalents 1,709 41,303 - 43,012
Due from other banks 1,790 31,799 7,270 40,859
Financial assets held for trading 2,959 2,155 175 5,289
Other financial assets at fair value through profit or loss 371 2,962 1,606 4,939
Derivative financial instruments 591 38,765 347 39,703
Loans to customers 1,001 104,560 355,495 461,056
Available-for-sale financial assets 42,597 3,645 310 46,552
Non-current assets held for sale and discontinued operations - - 9,073 9,073
Liabilities
Due to other banks 23 13,949 907 14,879
Due to customers 2 68,306 259,562 327,870
Debt securities in issue 1,380 169,684 27,979 199,043
Derivative financial instruments and other trade liabilities 2,036 48,061 74 50,171
Other financial liabilities at fair value through profit or loss 1,787 17,228 54 19,069
Subordinated debt 8,064 39 - 8,103
Liabilities held for sale and discontinued operations - - 7,825 7,825
The potential effect before taxation, if more positive reasonable assumptions are made for the valuation of
financial instruments in category 3 on the profit or loss account, is 108 (2013: 212); on equity, it is 73 (2013: nil).
The positive effect before taxation, if more negative reasonable assumptions are used for the valuation of
financial instruments in category 3 on the profit or loss account, is -101 (2013: -212) and -67 on equity (2013: nil).

48 Consolidated Financial Statements 2014 Rabobank Group
Category 3 of the other financial assets at fair value, with recognition of value changes in the profit and loss
account, includes both debt instruments and private equity interests. The latter amount to 212, and a significant
non-perceivable input for the valuation of these interests is the multiplier. The multiplier is determined at the
time the interests are acquired and is applied to the EBITDA. The average weighted multiplier is 6.0, with a
bandwidth of -1 and +1 of the multiplier. The debt instruments mainly concern structured investments (RMBS
and CDO) at an amount of 414. The main input for the valuation of these instruments is at least two broker
quotes with a range of -3.6% to 6.0% of the carrying amount.
Financial instruments at fair value in category 3
In millions of euros
At 1 January
2014
Fair value changes through
profit or loss
Fair value changes through
equity Purchases Sales Settlements
Transfers to or from
category 3
At 31 December
2014
Assets
Financial assets held for trading 175 25 - 5 (70) - (6) 129
Other financial assets at fair value through profit or loss 1,606 159 - 456 (937) (1) 450 1,733
Derivative financial instruments 347 102 - 1 - (339) 1,012 1,123
Available-for-sale financial assets 310 87 113 317 (23) - 187 991
Liabilities
Derivative financial instruments and other trade liabilities 74 73 - - - (73) 1,008 1,082
Other financial liabilities at fair value through profit or loss 54 1 - (1) - (8) - 46
The table shows movements in the financial instruments which are stated at fair value in the statement of
financial position and which are classified in category 3. The fair value adjustments in category 3 which are
included in equity are accounted for in the revaluation reserves for available-for-sale financial assets. In 2014,
derivatives in the amounts of 1,008 (active) and 1,102 (passive) were transferred from category 2 to category 3
as a result of a lack of a perceivable prepayment rate which has a significant impact on the determination of
the fair value of these derivatives. There were no significant transfers between category 1 and category 2 in 2014.
Financial instruments at fair value in category 3
In millions of euros
At 1 January
2013
Fair valuechangesthrough
profit or loss
Fair valuechangesthrough
equity Purchases Sales Settlements
Transferred toheld for sale/discontinued
operations
Transfers to or from
category 3
At 31 December
2013
Assets
Financial assets held for trading 83 (2) - 128 (24) (4) - (6) 175
Other financial assets at fair valuethrough profit or loss 1,657 (32) - 344 (488) (152) - 277 1,606
Derivative financial instruments 245 (56) - 152 - 6 (1) 1 347
Available-for-sale financial assets 98 2 8 299 (89) (2) (6) - 310
Liabilities
Derivative financial instruments and other trade liabilities 121 (62) - - - - (1) 16 74
Other financial liabilities at fair value through profit or loss 16 11 - 88 (57) (4) - - 54
The amount in total gains or losses presented in the statement of income for the period relating to the
assets and liabilities held in category 3 until the end of the reporting period is presented in the table on
the next page.

49 Notes to the consolidated financial statements
Financial instruments in category 3 – fair value changes through profit or loss
In millions of euros Recognised Derecognised Total
At 31 December 2014
Assets
Financial assets held for trading 24 1 25
Other financial assets at fair value through profit or loss 145 14 159
Derivative financial instruments 102 - 102
Available-for-sale financial assets 87 - 87
Liabilities
Derivative financial instruments and other trade liabilities 69 4 73
Other financial liabilities at fair value through profit or loss 1 - 1
At 31 December 2013
Assets
Financial assets held for trading (3) 1 (2)
Other financial assets at fair value through profit or loss (58) 26 (32)
Derivative financial instruments 78 (134) (56)
Available-for-sale financial assets 2 - 2
Liabilities
Derivative financial instruments and other trade liabilities (53) (9) (62)
Other financial liabilities at fair value through profit or loss 11 - 11
The table below shows the changes in deferred profit of the Financial assets held for trading which were
initially recognised at a value determined using a valuation technique based on data input not substantiated
by market prices.
Provision for Day 1 profit
In millions of euros 2014 2013
Opening balance 27 37
Additions - 11
Amortisation (11) (15)
Changes (10) (6)
Closing balance 6 27
4.10 Legal and arbitration proceedingsRabobank Group is involved in several legal and arbitration proceedings in the Netherlands and other
countries, including the United States, in connection with claims brought by and against the Rabobank Group
and arising from its business operations. Although it is not possible to predict or determine the eventual
outcome of all pending or imminent proceedings and processes, Rabobank Group is of the view that the final
outcomes of the various pending and/or future legal proceedings will not have a materially adverse effect on
the Rabobank Group’s financial position or profitability, given its size, strong balance sheet, steady flow of
income and provisions policy.
Libor/Euribor
Rabobank has received a number of requests in recent years from regulators in various countries to issue
information and documents in relation to various issues, including issues related to the fixing of interest rates.
Rabobank is cooperating, and will continue to cooperate, with the regulators and authorities involved in these
global investigations.
50 Consolidated Financial Statements 2014 Rabobank Group
On 29 October 2013, Rabobank entered into a settlement agreement with various authorities in relation to their
investigations into Rabobank’s historical LIBOR and EURIBOR submission processes. Additional information is
available on the bank’s corporate website. All financial fines related to this settlement agreement were fully
paid and accounted for by Rabobank in 2013. The method in which the investigation by the Dutch Public
Prosecution Service into Rabobank of the interest-rate submissions was terminated is currently being
reviewed by the Hague Court of Appeal.
Rabobank, along with a large number of other panel banks and inter-dealer brokers, has been mentioned in
connection with a large number of alleged class action suits and individual civil court cases brought before
the Federal courts in the United States. These proceedings relate to the US dollar (USD), LIBOR, Japanese yen
(JPY), LIBOR, TIBOR (note: Rabobank was never a member of the TIBOR panel) and EURIBOR.
An Argentinean consumer protection organisation brought an alleged class action suit against Rabobank in
Argentina in relation to USD LIBOR in 2014. Additionally, the bank has also been summoned to appear before
several Dutch courts in civil proceedings relating to EURIBOR. Furthermore, various individuals and entities
have made a number of allegations relating to EURIBOR in letters to, and legal proceedings against, Rabobank
and an Irish subsidiary.
Since the alleged class action suits and civil proceedings listed above which have been brought in the US or
elsewhere are, by their nature, subject to uncertainties, it is difficult to predict their outcomes. Rabobank
maintains that it has mounted compelling legal and factual defences against these claims and intends to
continue defending itself against them.
Fortis
The Dutch Investors’ Association (VEB) has issued a summons against the company formerly known as Fortis
N.V. and currently trading as Ageas N.V., the underwriters involved – including Rabobank – and the former
directors of Fortis N.V. The Dutch Investors’ Association states in this summons that investors were misled by
the prospectus published by Ageas N.V. in connection with its rights issue in September 2007. The Association
states that the impact and risks of the subprime crisis on Fortis and its cash position were mispresented in the
prospectus and has requested a declaratory judgment stating that the defendants acted illegitimately and
must therefore be held liable for the loss allegedly suffered by investors in Fortis. We maintain the view that
the above-mentioned loss of EUR 18 billion has not been properly substantiated. The proceedings concern a
settlement of the collective loss, which means that the court will only rule on the question of whether the
defendants, including Rabobank, are liable. Depending on the outcome of these proceedings, it will become
clear whether separate loss proceedings are to be expected. Rabobank is defending itself against the claim;
at present, however, the bank is unable to assess the outcome of these or any subsequent proceedings.
Interest-rate derivatives in the SME segment
Rabobank provides interest rate derivatives for business customers who wish to reduce interest rate risk
associated with variable (Euribor) loans. Such an interest rate swap protects customers from rising (Euribor)
interest rates and helps businesses to keep their interest payments at an acceptable level.
For business customers who have both a loan and an interest rate derivative, the bank assesses, or reassesses,
the individual position in 2014 (and into 2015). If a closed derivative turns out to no longer suit the customer’s
requirements, the bank and the customer set out to find a solution which is acceptable to the customer.
This solution may range from restructuring to offsetting the derivative, a combination of these two measures,
or full or partial compensation. Each of these solutions is tailor-made, which means that all the circumstances
of the business are considered in the assessment.

51 Notes to the consolidated financial statements
5 Business segments
The business segments Rabobank uses in its reporting are defined from a management viewpoint. This means
they are the segments that are reviewed as part of Rabobank’s strategic management and for the purpose of
making business decisions, and have different risks and returns.
Rabobank distinguishes five major business segments: Domestic retail banking, Wholesale banking and
international retail banking, Leasing, Real estate and Other segments. Various organisational changes were
implemented in 2014. This was the result of two trends: a) the sale or downsizing of operations and b) internal
changes, such as the integration of Rabobank International and Rabobank Nederland, the reorganisation at
the local Rabobanks, and the impending changes at FGH Bank. The effects of the reorganisation at the local
Rabobanks and the sale of Bank BGZ are discussed in Section 23, ‘Provisions’ and Section 43, ‘Fixed assets and
liabilities held for sale’, respectively.
The segment Domestic retail banking mainly comprises the activities of the local Rabobanks, Obvion and Roparco.
The segment Wholesale banking and international retail banking supports the Rabobank Group in becoming
the market leader in the Netherlands and focuses on the food and agri sector at the international level.
This segment is engaged in regional corporate banking activities, as well as managing entities with global
operations such as Global Financial Markets, Acquisition Finance, Global Client Solutions, Project Finance and
Trade & Commodity Finance. The segment is also involved in International Direct Retail Banking and Rabo
Private Equity. The international retail banking operations fall under the Rabobank label, with the exception
of ACC Loan Management. Following the sale of Robeco in the second half of 2013, the Asset management
segment is no longer displayed separately. The operations of Schretlen & Co. are currently reported in the
Other segment. The Leasing segment – DLL – is responsible for the leasing activities and offers a wide range
of leasing, trading and consumer finance products in the Dutch home market.
Manufacturers, vendors and distributors globally are supported in their sales with products related to asset
financing. DLL operates in European markets with the Athlon Car Lease leasing company. The core businesses
of the segment Real Estate – Rabo Real Estate Group, which holds investments, are residential and commercial
real estate, finance and asset management. In the Dutch market, Rabo Real Estate Group operates BPD, MAB
Development, FGH Bank and Bouwfonds Investment Management brands. The Other segments are
comprised of various sub-segments, of which no single segment should be listed separately. The Other
segments mainly include the financial results of associates (particularly Achmea B.V.) and the head office
operations. There are no customers who own a share of more than 10% in Rabobank’s total revenues.
Transactions between the various business segments are conducted at regular commercial terms and under
normal market conditions. In the segment Domestic retail banking, the dividend provided to the local
Rabobanks is included under ‘Other results’ 218 (2013: nil).
Apart from operating activities, there is no other material comprehensive income between the business
segments. A segment’s operating activities comprise business assets and liabilities, i.e. a large portion of the
balance sheet excluding items such as tax. The accounting principles used for the segments are identical to
those described in the summary of the main accounting principles.

52 Consolidated Financial Statements 2014 Rabobank Group
In millions of euros
Domestic retail
banking
Wholesale banking and international
retail banking Leasing Real estateOther
segments
Consolidation effects/hedge
accounting Total
For the year ended on 31 December 2014
Interest 5,783 2,416 1,000 313 (394) - 9,118
Commission 1,318 552 30 36 (20) (37) 1,879
Other income 349 799 548 261 (550) 453 1,860
Total income 7,450 3,767 1,578 610 (964) 416 12,857
Segment expenses 4,662 2,417 834 311 (50) (119) 8,055
Value adjustments 1,422 420 131 656 4 - 2,633
Bank tax and resolution levy 354 67 9 8 50 - 488
Operating profit before taxation 1,012 863 604 (365) (968) 535 1,681
Taxation 261 105 168 (102) (726) 133 (161)
Net profit from continuing operations 751 758 436 (263) (242) 402 1,842
Net profit from discontinued operations - - - - - - -
Net profit 751 758 436 (263) (242) 402 1,842
Business segment assets 354,315 494,452 37,226 22,953 89,072 (320,739) 677,279
Investments in associates 17 684 22 193 2,891 - 3,807
Total assets 354,332 495,136 37,248 23,146 91,963 (320,739) 681,086
Business segment liabilities 326,481 482,889 32,957 21,862 84,306 (306,280) 642,215
Total liabilities 326,481 482,889 32,957 21,862 84,306 (306,280) 642,215
Additions to property and equipment 140 39 1,509 4 59 - 1,751
Depreciation of tangible assets and amortisation of intangible assets 127 87 47 9 167 - 437
Impairment of tangible and intangible assets 9 32 1 6 24 - 73
Goodwill 322 676 455 1 - - 1,454
In millions of euros
Domestic retail
banking
Wholesale banking and international
retail banking Leasing Real estateOther
Segments
Consolidation effects/hedge
accounting Total
Value adjustments in loans to customers
At 1 January 4,561 2,672 455 842 51 - 8,581
Impairment for credit losses 1,923 785 252 678 10 - 3,648
Reversal of impairment for credit losses (454) (337) (67) (21) (7) - (886)
Defaulting loans written off during the year (1,263) (355) (268) (335) (6) - (2,227)
Interest and other adjustments 69 51 6 106 - - 232
Closing balance 4,836 2,816 378 1,270 48 - 9,348
Individual value adjustment (specific provision) 3,297 2,424 186 1,141 44 - 7,092
Collective value adjustment (collective provision) 1,014 169 101 - - - 1,284
IBNR 525 223 91 129 4 - 972
Closing balance 4,836 2,816 378 1,270 48 - 9,348

53 Notes to the consolidated financial statements
In millions of euros
Domestic retail
banking
Wholesale banking and international
retail bankingAsset
management Leasing Real estateOther
segments
Consolidation effects/hedge
accounting Total
For the year ended on 31 December 2013
Interest 5,605 2,606 (2) 973 335 (422) - 9,095
Commission 1,319 641 3 52 29 (10) (33) 2,001
Other income 616 793 2 545 (556) 1,544 (1,010) 1,934
Total income 7,540 4,040 3 1,570 (192) 1,112 (1,043) 13,030
Segment expenses 5,015 3,132 2 764 339 591 (83) 9,760
Value adjustments 1,384 568 - 170 513 8 - 2,643
Bank tax 90 75 - 9 8 14 1 197
Operating profit before taxation 1,051 265 1 627 (1,052) 499 (961) 430
Taxation 270 219 - 205 (238) (129) (239) 88
Net profit from continuing operations 781 46 1 422 (814) 628 (722) 342
Net profit from discontinued operations - - 80 - - 1,585 - 1,665
Net profit 781 46 81 422 (814) 2,213 (722) 2,007
Business segment assets 376,241 482,309 1,276 33,128 27,192 70,943 (325,741) 665,348
Investments in associates 17 643 - 25 213 2,849 - 3,747
Total assets 376,258 482,952 1,276 33,153 27,405 73,792 (325,741) 669,095
Business segment liabilities 349,172 472,329 1,051 29,267 26,344 63,995 (311,597) 630,561
Total liabilities 349,172 472,329 1,051 29,267 26,344 63,995 (311,597) 630,561
Additions to property and equipment 160 28 - 1,420 13 38 - 1,659
Depreciation of tangible assets and amortisation of intangible assets 145 127 - 50 27 179 - 528
Impairment of tangible and intangible assets 2 52 - - - 12 - 66
Goodwill 322 599 - 460 - - - 1,381
In millions of euros
Domestic retail
banking
Wholesale banking and international
retail bankingAsset
management Leasing Real estateOther
segments
Consolidation effects/hedge
accounting Total
Value adjustments in loans to customers
At 1 January 3,866 2,893 - 467 376 53 - 7,655
Impairment for credit losses 1,979 1,000 - 276 520 16 - 3,791
Reversal of impairment for credit losses (582) (408) - (40) (6) (9) - (1,045)
Defaulting loans written off during the year (826) (467) - (223) (34) (10) - (1,560)
Interest and other adjustments 124 (346) - (25) (14) 1 - (260)
Closing balance 4,561 2,672 - 455 842 51 - 8,581
Individual value adjustment (specific provision) 4,153 2,328 - 262 758 47 - 7,548
Collective value adjustment (collective provision) 256 176 - 111 - - - 543
IBNR 152 168 - 82 84 4 - 490
Closing balance 4,561 2,672 - 455 842 51 - 8,581

54 Consolidated Financial Statements 2014 Rabobank Group
Additions to propertyand equipment and
intangible assets
Additions to propertyand equipment and
intangible assets
At 31 December 2014 At 31 December 2013
In millions of euros
The Netherlands 1,483 1,091
Other eurozone 109 85
Rest of Europe (Non-eurozone) 84 53
North America 234 527
Latin America 3 6
Asia 15 3
Australia 43 13
Other and consolidation effects - -
Total 1,971 1,778
Geographic information (country-by-country reporting)Rabobank operates in seven main geographical areas; see the table below. For Rabobank, the country of
domicile is the Netherlands. The information is reported by distinguishable components of Rabobank that
provide products and/or services within a particular economic environment within particular geographical
locations/areas. The allocation is based on the location of the individual subsidiary from which the
transactions are originated.
At 31 December 2014
Geographic location Country Name of subsidiary Type of operations
Income from continuing operations
Average number of
FTEs
Operating profit before
taxation Taxes
Government subsidies received
The Netherlands
The Netherlands Local Rabobanks, Rabobank, DLL, Obvion, Friesland Zekerheden Maatschappij NV, Rabohypotheekbank, Rabo Real Estate Group
Domestic retail banking, Wholesale banking and international retail banking, Leasing, Real estate
8,959 37,553 185 (595) -
Other eurozone countries
France DLL, Rabobank, Rabo Real Estate Group
Leasing, Wholesale banking and international retail banking, Real estate 192 597 60 27 -
Belgium DLL, Rabobank, Rabo Real Estate Group
Leasing, Wholesale banking and international retail banking, Real estate 80 301 26 6 -
Germany DLL, Rabobank, Rabo Real Estate Group
Leasing, Wholesale banking and international retail banking, Real estate 212 677 135 55 -
Italy DLL, Rabobank Leasing, Wholesale banking and international retail banking 67 167 26 9 -
Luxembourg DLL, Rabobank, Rabo Real Estate Group
Leasing, Wholesale banking and international retail banking, Real estate 8 11 14 (4) -
Ireland DLL, Rabobank, ACC Loan Management
Leasing, Wholesale banking and international retail banking (54) 545 (30) - -
Finland DLL Leasing 4 5 2 1 -
Austria DLL Leasing 2 2 1 - -
Portugal DLL Leasing 5 18 (2) - -
Spain DLL, Rabobank Leasing, Wholesale banking and international retail banking 71 169 24 8 -

55 Notes to the consolidated financial statements
Geographic location Country Name of subsidiary Type of operations
Income from continuing operations
Average number of
FTEs
Operating profit before
taxation Taxes
Government subsidies received
Rest of Europe (non-eurozone)
United Kingdom DLL, Rabobank Leasing, Wholesale banking and international retail banking
240 694 (10) (7) -
Norway DLL Leasing 18 28 5 2 -
Sweden DLL, Rabo Real Estate Group Leasing, Real estate 41 115 4 - -
Denmark DLL, Rabo Real Estate Group Leasing, Real estate 13 24 4 1 -
Switzerland DLL Leasing 4 5 2 - -
Russia DLL Leasing 25 55 7 2
Poland DLL, Rabobank, Bank BGZ Leasing, Wholesale banking and international retail banking 219 2,795 2 2 -
Czech Republic Rabo Real Estate Group Real estate - 1 - - -
Hungary DLL Leasing 8 27 2 - -
Romania DLL Leasing 1 2 1 - -
Turkey DLL, Rabobank Leasing, Wholesale banking and international retail banking 21 33 5 2 -
North America
United States DLL, Rabobank, Rabo Real Estate Group
Leasing, Wholesale banking and international retail banking, Real estate 1,296 3,991 625 190 -
Canada DLL, Rabobank Leasing, Wholesale banking and international retail banking 97 201 51 12 -
Latin America
Mexico DLL, Rabobank Leasing, Wholesale banking and international retail banking 9 56 1 (1) -
Cayman Islands Rabobank Wholesale banking and international retail banking - - - - -
Curacao Rabobank Wholesale banking and international retail banking 99 13 73 2 -
Brazil DLL, Rabobank Leasing, Wholesale banking and international retail banking 294 706 71 30 -
Chile DLL, Rabobank Leasing, Wholesale banking and international retail banking 60 332 5 (2) -
Argentina DLL, Rabobank Leasing, Wholesale banking and international retail banking 4 27 2 - -
Asia India DLL, Rabobank Leasing, Wholesale banking and international retail banking 24 112 10 4 -
Singapore DLL, Rabobank Leasing, Wholesale banking and international retail banking 76 184 33 4 -
Indonesia Rabobank Wholesale banking and international retail banking 41 1,487 (11) (3) -
Malaysia Rabobank Wholesale banking and international retail banking - 2 2 - -
China DLL, Rabobank Leasing, Wholesale banking and international retail banking 169 341 81 16 -
South Korea DLL Leasing 7 26 2 - -
Japan DLL, Rabobank Leasing, Wholesale banking and international retail banking - 1 - - -
Australia Australia DLL, Rabobank Leasing, Wholesale banking and international retail banking 354 952 139 41 -
New Zealand DLL, Rabobank Leasing, Wholesale banking and international retail banking 191 307 134 37 -
Other Mauritius Rabobank Wholesale banking and international retail banking - - - - -
12,857 52,562 1,681 (161) -

56 Consolidated Financial Statements 2014 Rabobank Group
At 31 December 2013
Geographic location Country Name of subsidiary Type of operations
Income from continued
operations
Average number of employees
in FTE
The Netherlands The Netherlands Local Rabobanks, Rabobank, DLL, Obvion, Friesland Zekerheden Maatschappij NV, Rabohypotheekbank, Rabo Real Estate Group
Domestic retail banking, Wholesale banking and international retail banking, Leasing, Real estate
9,090 40,490
Other eurozone countries
France DLL, Rabobank, Rabo Real Estate Group Leasing, Wholesale banking and international retail banking, Real estate 152 577
Belgium DLL, Rabobank, Rabo Real Estate Group Leasing, Wholesale banking and international retail banking, Real estate 105 291
Germany DLL, Rabobank, Rabo Real Estate Group Leasing, Wholesale banking and international retail banking, Real estate 104 653
Italy DLL, Rabobank Leasing, Wholesale banking and international retail banking 56 169
Luxembourg DLL, Rabobank, Rabo Real Estate Group Leasing, Wholesale banking and international retail banking, Real estate 6 12
Ireland DLL, Rabobank, ACC Loan Management Leasing, Wholesale banking and international retail banking (38) 648
Finland DLL Leasing 4 6
Austria DLL Leasing 2 2
Portugal DLL Leasing 3 17
Spain DLL, Rabobank, Rabo Real Estate Group Leasing, Wholesale banking and international retail banking, Real estate 60 171
Rest of Europe (non-eurozone)
United Kingdom DLL, Rabobank, Rabo Real Estate Group Leasing, Wholesale banking and international retail banking, Real estate 297 714
Norway DLL Leasing 17 27
Sweden DLL Leasing 52 112
Denmark DLL, Rabo Real Estate Group Leasing, Real estate 9 24
Switzerland DLL Leasing 2 4
Russia DLL Leasing 20 51
Poland DLL, Rabobank, Bank BGZ Leasing, Wholesale banking and international retail banking 384 5,525
Czech Republic Rabo Real Estate Group Real estate (3) 3
Hungary DLL Leasing 7 23
Romania DLL, Rabo Real Estate Group Leasing, Real estate - 2
Turkey DLL, Rabobank Leasing, Wholesale banking and international retail banking 2 10
North America United States DLL, Rabobank, Rabo Real Estate Group Leasing, Wholesale banking and international retail banking, Real estate 1,495 3,976
Canada DLL, Rabobank Leasing, Wholesale banking and international retail banking 104 193
Latin America Mexico DLL, Rabobank Leasing, Wholesale banking and international retail banking 13 55
Cayman Islands Rabobank Wholesale banking and international retail banking - -
Curacao Rabobank Wholesale banking and international retail banking 119 14
St Maarten Rabobank Wholesale banking and international retail banking - -
Brazil DLL, Rabobank Leasing, Wholesale banking and international retail banking 310 717
Chile DLL, Rabobank Leasing, Wholesale banking and international retail banking 54 333
Argentina DLL, Rabobank, Rabo Real Estate Group Leasing, Wholesale banking and international retail banking, Real estate 8 41
Asia India DLL, Rabobank Leasing, Wholesale banking and international retail banking 20 106
Singapore DLL, Rabobank Leasing, Wholesale banking and international retail banking 83 168
Indonesia Rabobank Wholesale banking and international retail banking 15 1,464
Malaysia Rabobank Wholesale banking and international retail banking 3 3
China DLL, Rabobank Leasing, Wholesale banking and international retail banking 170 354
South Korea DLL Leasing 7 30
Japan DLL, Rabobank Leasing, Wholesale banking and international retail banking 6 11
Australia Australia DLL, Rabobank Leasing, Wholesale banking and international retail banking 199 948
New Zealand DLL, Rabobank Leasing, Wholesale banking and international retail banking 94 305
Other Mauritius Rabobank Wholesale banking and international retail banking (1) -
13,030 58,249
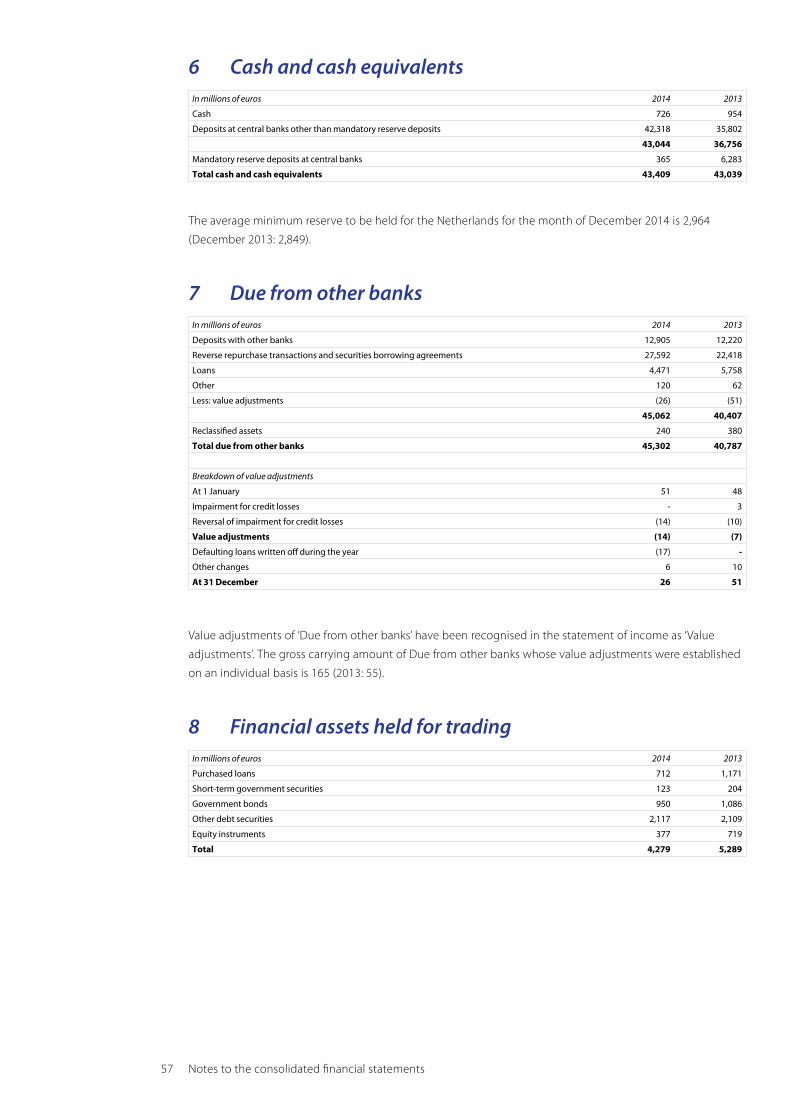
57 Notes to the consolidated financial statements
6 Cash and cash equivalentsIn millions of euros 2014 2013
Cash 726 954
Deposits at central banks other than mandatory reserve deposits 42,318 35,802
43,044 36,756
Mandatory reserve deposits at central banks 365 6,283
Total cash and cash equivalents 43,409 43,039
The average minimum reserve to be held for the Netherlands for the month of December 2014 is 2,964
(December 2013: 2,849).
7 Due from other banksIn millions of euros 2014 2013
Deposits with other banks 12,905 12,220
Reverse repurchase transactions and securities borrowing agreements 27,592 22,418
Loans 4,471 5,758
Other 120 62
Less: value adjustments (26) (51)
45,062 40,407
Reclassified assets 240 380
Total due from other banks 45,302 40,787
Breakdown of value adjustments
At 1 January 51 48
Impairment for credit losses - 3
Reversal of impairment for credit losses (14) (10)
Value adjustments (14) (7)
Defaulting loans written off during the year (17) -
Other changes 6 10
At 31 December 26 51
Value adjustments of ‘Due from other banks’ have been recognised in the statement of income as ‘Value
adjustments’. The gross carrying amount of Due from other banks whose value adjustments were established
on an individual basis is 165 (2013: 55).
8 Financial assets held for tradingIn millions of euros 2014 2013
Purchased loans 712 1,171
Short-term government securities 123 204
Government bonds 950 1,086
Other debt securities 2,117 2,109
Equity instruments 377 719
Total 4,279 5,289

58 Consolidated Financial Statements 2014 Rabobank Group
9 Other financial assets at fair value through profit or lossIn millions of euros 2014 2013
Government bonds 12 63
Other debt securities 2,494 2,885
Loans 1,090 1,056
Venture capital (equity instrument) 274 549
Other equity instruments 455 386
Total 4,325 4,939
The change in the year under review in the fair value of the loans designated as at fair value through profit or
loss that is allocable to the changes in credit risk is 14 (2013: -18). The cumulative change is -34 (2013: -48),
Any changes in fair value are calculated by discounting future cash flows. When setting the discount rate,
account is taken of expected losses, the liquidity mark-ups and the risk margin.
No credit derivative financial instruments are used to hedge the loans designated as at fair value through
profit and loss.
10 Derivative financial instruments and other trade liabilities
Derivatives are used at Rabobank for the purpose of mitigating at least a portion of the long-term market risks
arising from the bank’s various operations. Examples of this include interest-rate swaps used to hedge
interest-rate risk arising from the difference in duration between assets and liabilities. Another example are
cross-currency swaps, which are used to hedge the currency risk to which the bank is exposed after issuing
debt instruments in foreign currencies.
The bank’s hedging policy is designed to optimise its income within the risk appetite framework. In addition
to using derivatives for hedging purposes, derivatives are transacted for the bank’s customers. This includes,
for example, forward foreign exchange contracts which corporate clients enter into with Rabobank in order to
hedge their currency risks. The resulting exposures are largely mitigated by entering into reverse positions
with one or more professional counterparties, within the trading limits set.
10.1 Types of derivative instruments used by RabobankForward currency and interest rate contracts are contractual obligations to receive or pay a net amount based
on changes in exchange or interest rates, or to purchase or sell foreign currency or a financial instrument on a
future date at a fixed specified price in an organised financial market. As collateral for forward contracts is
provided in the form of cash, cash equivalents or marketable securities, and changes in the value of forward
contracts are settled daily, the credit risk is negligible.
Forward rate agreements are individually agreed forward interest rate contracts under which the difference
between a contractually agreed interest rate and the market rate on a future date has to be settled in cash,
based on a notional principal amount.
Currency and interest rate swaps are commitments to exchange one set of cash flows for another. Swaps entail
an economic exchange of currencies or interest rates (such as a fixed rate for one or more variable rates), or a
combination (i.e. a cross-currency interest-rate swap). Except for certain currency swaps, there is no transfer of
the principal amount. The credit risk exposure of Rabobank represents the potential cost of replacing the
swaps if the counterparties default. The risk is monitored continuously against current fair value, a portion of
the notional amount of the contracts and the liquidity of the markets. As part of the credit risk management
process, Rabobank employs the same methods for evaluating counterparties as it does for evaluating its own
lending activities.
Currency and interest rate options are contracts under which the seller (known as the writer) gives the buyer
(known as the holder) the right, entailing no obligation, to purchase (in the case of a call option) or sell (in the
case of a put option) a specific amount of foreign currency or a specific financial instrument on or before an
agreed date or during an agreed period at a price set in advance. As consideration for accepting the currency

59 Notes to the consolidated financial statements
or interest rate risk, the writer receives a payment (known as a premium) from the holder. Options are traded
on exchanges or between Rabobank and clients (OTC). Rabobank is exposed to credit risks only as option
holder and only up to the carrying amount, which is equal to the fair value in this case.
Credit default swaps (CDSs) are instruments by means of which the seller of a CDS undertakes to pay the
buyer an amount equal to the loss that would be incurred by holding an underlying reference asset if a
specific credit event were to occur (i.e. the materialisation of a risk). The buyer is under no obligation to hold
the underlying reference asset.
The buyer pays the seller a credit protection fee expressed in basis points, with the size of the fee depending
on the credit spread of the reference asset.
10.2 Derivative financial instruments issued or held for tradingRabobank trades in financial instruments to take positions in tradable or OTC instruments, including derivative
financial instruments, so that it can profit from short-term movements on share and bond markets and in
exchange and interest rates. For this type of trading, Rabobank sets risk limits relating to market positions at
the end of the day (overnight trades) as well as during the day (intraday trades). Except under specific hedging
arrangements, the currency and interest rate risks associated with these derivative financial instruments are
usually offset by taking counter positions in order to manage the volatility in the net amounts needed to
liquidate the market positions.
10.3 Derivative financial instruments held as hedgesRabobank concludes various financial derivative contracts that are intended as fair value, cash flow or net
investment hedges, and which accordingly qualify as such. Rabobank also concludes derivative contracts as
hedges against economic risks. It does not apply hedge accounting to these contracts.
Fair value hedges
The main components of Rabobank’s fair value hedge are interest-rate swaps and cross-currency interest-rate
swaps which serve as protection against a potential change in the fair value of fixed-income financial assets
and liabilities in both local and foreign currencies. The net fair value of these swaps at 31 December 2014 is
-12,869 (2013: -10,427).
Rabobank hedges a portion of its existing currency and interest-rate risk of securities issued by means of fair
value hedges in the form of currency swaps and cross-currency interest-rate swaps. The net fair value of these
interest-rate swaps as at 31 December is 3,908 (2013: 1,947). For the year ending on 31 December 2014,
Rabobank reported a profit of -164 (2013: 215) as a result of the portion of the fair value hedges which was
classified as ineffective hedges.
For the year ending on 31 December 2014, Rabobank reported a profit of -5,242 (2013: 2,782) for the hedging
instruments. Total profit from the hedged position, allocable to the hedged risk, totalled 5,078 (2013: -2,567).
Cash-flow hedges
Rabobank’s cash-flow hedges consist mainly of cross-currency interest-rate swaps which serve to protect
against a potential change in cash flows from financial assets in foreign currencies with floating interest rates.
The net fair value of the cross-currency interest-rate swaps, classified as cash-flow hedge at 31 December
2014 is -2,660 (2013: -2,405).
In 2014, Rabobank accounted for an amount of 548 (2013: -1,450) after taxation in equity as effective changes
in the fair value of derivatives in cash-flow hedges. In 2014, an amount of -586 (2013: 1,459) after taxation of
cash-flow hedge reserves was reclassified to the profit or loss account. The cash-flow hedge reserves as part
of equity totalled 11 (2013: 49) at 31 December 2014. This amount fluctuates along with the fair value of the
derivatives in the cash-flow hedges and is accounted for in profit over the term of the hedged positions as
trading profit. The cash-flow hedge reserve relates to a large number of derivatives and hedged positions with
different terms. The maximum term is 97 years, with the largest concentrations exceeding five years.
For the year ending on 31 December 2014, Rabobank reported a profit of 185 (2013: 225) as a result of the
portion of the cash-flow hedges classified as ineffective hedges.
60 Consolidated Financial Statements 2014 Rabobank Group
Net investment hedges
Rabobank uses foreign forward-exchange contracts to hedge a portion of the currency translation risk of
net investments in foreign entities. The net fair value of these foreign forward-exchange contracts at
31 December 2014 was 8 (2013: 29).
At 31 December 2014, futures contracts with a nominal amount of 1,797 (2013: 2,386) were designated as net
investment hedges. These resulted in exchange gains and losses of -87 for the year (2013: 279), which are
deferred in equity. A total of 106 was made in withdrawals from equity during the year (2013: nil). For the year
ending 31 December 2014, Rabobank reported no ineffectiveness resulting from the net investment hedges.
10.4 Notional amount and fair valueAlthough the notional amount of certain types of financial instruments provides a basis for comparing
instruments that are included in the statement of financial position, it does not necessarily represent the
related future cash flows or the fair values of the instruments. Hence, it does not represent the exposure of
Rabobank to credit or exchange risks. It is the amount of the asset or the reference rate or index underlying a
derivative financial instrument, representing the basis on which changes in a derivative financial instrument’s
value are measured. It provides an indication of the volume of transactions executed by Rabobank; it is not a
measure of risk exposure, however. Some derivative financial instruments are standardised in terms of
notional amount or settlement date, having been designed for trading on active markets (i.e. on stock
exchanges). Others are specifically constructed for individual clients and not for trading on an exchange,
even though they can be traded at prices negotiated by buyers and sellers (OTC instruments). The positive fair
value represents the cost for Rabobank to replace all contracts on which it will be entitled to receive payment.
Replacement would apply in the event of all counterparties remaining in default. This is the standard method
in the industry for calculating the current credit risk exposure. The negative fair value represents the cost of all
Rabobank contracts on which it will have to make payment. Replacement would apply in the event of
Rabobank remaining in default. The total of positive fair values and the total of negative fair values are
disclosed separately in the statement of financial position. Derivative financial instruments are positive (assets)
or negative (liabilities) as a result of fluctuations in market or exchange rates in relation to their contract
values. The total contract amount or notional amount of derivative financial instruments held, the degree to
which these instruments are positive or negative, and hence the total fair value of the derivative financial
assets and liabilities can sometimes fluctuate significantly. The next table shows the notional amounts and the
positive and negative fair values of Rabobank’s derivative contracts.

61 Notes to the consolidated financial statements
In millions of euros Notional amounts Fair values
At 31 December 2014 Assets Liabilities
Derivative financial instruments held for trading 2,545,638 50,172 48,298
Derivative financial instruments held as hedges 158,464 6,317 17,938
Short positions shares and bonds - - 1,324
Total derivative financial assets/liabilities recognised 2,704,102 56,489 67,560
Derivative financial instruments held for trading
Currency derivative financial instruments
Unlisted tradable contracts (OTC)
Currency swaps 362,705 5,190 6,842
Currency options 3,990 81 58
Listed tradable contracts
Currency futures 4,912 61 42
Total currency derivative financial instruments 371,607 5,332 6,942
Interest-rate derivative financial instruments
Unlisted tradable contracts (OTC)
Interest-rate swaps 1,993,667 39,016 35,237
Interest-rate options 113,689 4,897 5,199
Total OTC contracts 2,107,356 43,913 40,436
Listed tradable contracts
Interest-rate swaps 49,301 1 4
Total interest-rate derivative financial instruments 2,156,657 43,914 40,440
Credit derivative financial instruments
Credit default swaps 3,988 6 10
Total return swaps 1,996 15 49
Total credit derivative financial instruments 5,984 21 59
Equity instruments/index derivative financial instruments
Unlisted tradable contracts (OTC)
Options - purchased and sold 6,409 446 374
Listed tradable contracts
Options - purchased and sold 3,122 187 138
Total equity instruments/index derivative financial instruments 9,531 633 512
Other derivative financial instruments 1,859 272 345
Total derivative financial assets/liabilities held for trading 2,545,638 50,172 48,298
Derivative financial instruments held as hedges
Derivative financial instruments designated as fair value hedges
Currency swaps and cross-currency interest-rate swaps 92,569 3,950 50
Interest-rate swaps 44,400 1,571 14,440
Total derivative financial instruments designated as fair value hedges 136,969 5,521 14,490
Derivative financial instruments designated as cash flow hedges
Currency swaps and cross-currency interest rate swaps 19,698 788 3,448
Derivatives classified as net investment hedges
Currency futures contracts 1,797 8 -
Total derivative financial assets/liabilities designated as hedges 158,464 6,317 17,938

62 Consolidated Financial Statements 2014 Rabobank Group
In millions of euros Notional amounts Fair values
At 31 December 2013 Asset Liability
Derivative financial instruments held for trading 2,747,381 36,118 34,272
Derivative financial instruments held as hedges 133,428 3,585 14,441
Short positions shares and bonds - - 1,458
Total derivative financial assets/liabilities recognised 2,880,809 39,703 50,171
Derivative financial instruments held for trading
Currency derivative financial instruments
Unlisted tradable contracts (OTC)
Currency futures 40,423 391 339
Currency swaps 330,785 4,146 5,172
Currency options - purchased and sold 3,681 41 41
Cross-currency interest-rate swaps 17 5 1
Listed tradable contracts
Currency futures 3,808 11 5
Options - purchased and sold 257 17 8
Total currency derivative financial instruments 378,971 4,611 5,566
Interest-rate derivative financial instruments
Unlisted tradable contracts (OTC)
Interest-rate swaps 2,009,856 26,818 23,483
Forward rate agreements 166,404 - 1
Interest-rate options 113,487 3,028 3,103
Total OTC contracts 2,289,747 29,846 26,587
Listed tradable contracts
Interest-rate swaps 47,937 2 1
Total interest rate derivative financial instruments 2,337,684 29,848 26,588
Credit derivative financial instruments
Credit default swaps 3,815 23 10
Total return swaps 4,036 173 442
Total credit derivative financial instruments 7,851 196 452
Equity instruments/index derivative financial instruments
Unlisted tradable contracts (OTC)
Options - purchased and sold 2,137 340 300
Listed tradable contracts
Futures 37 - -
Options - purchased and sold 7,643 373 372
Total equity instruments/index derivative financial instruments 9,817 713 672
Other derivative financial instruments 13,058 750 994
Total derivative financial assets/liabilities held for trading 2,747,381 36,118 34,272
Derivative financial instruments held as hedges
Derivative financial instruments designated as fair value hedges
Currency swaps and cross-currency interest-rate swaps 47,264 2,019 72
Interest-rate swaps 63,733 1,071 11,498
Total derivative financial instruments designated as fair value hedges 110,997 3,090 11,570
Derivative financial instruments designated as cash flow hedges
Currency swaps and cross-currency interest rate swaps 20,045 466 2,871
Derivatives classified as net investment hedges
Currency futures contracts 2,386 29 -
Total derivative financial assets/liabilities designated as hedges 133,428 3,585 14,441

63 Notes to the consolidated financial statements
11 Loans to customersIn millions of euros 2014 2013
Loans initiated by Rabobank:
Loans to government clients:
- leases 207 634
- other 1,928 2,027
Loans to private clients:
- overdrafts 24,983 17,281
- mortgages 218,482 219,628
- leases 24,078 21,925
- reverse repurchase transactions and securities borrowing agreements 18,295 10,697
- corporate loans 175,783 182,144
- other 6,744 7,348
Gross loans to customers 470,500 461,684
Less: value adjustments in loans to customers (9,348) (8,581)
461,152 453,103
Reclassified assets 1,295 2,806
Total loans to customers 462,447 455,909
The impairment of reclassified assets is -122 (2013: -154) and is stated in the profit or loss account under
‘Income from other financial assets and liabilities through profit and loss’.
In millions of euros 2014 2013
Value adjustments in loans to customers
Value adjustments in loans to customers can be broken down as follows:
At 1 January 8,581 7,655
Impairment for credit losses 3,648 3,791
Reversal of impairment for credit losses (886) (1,045)
Defaulting loans written off during the year (2,227) (1,560)
Interest and other changes 232 (260)
Total value adjustments in loans to customers 9,348 8,581
Individual value adjustment (specific provision) 7,092 7,548
Collective value adjustment (collective provision) 1,284 543
IBNR 972 490
Total value adjustments in loans to customers 9,348 8,581
Gross carrying amount of loans whose value adjustments were established on an individual basis 15,957 16,042
Rabobank acquired financial and non-financial assets during the year by taking possession of collateral with
an estimated value of 86 (2013: 29). In general, it is Rabobank’s policy to sell these assets in the reasonably
foreseeable future. Yields are allocated to repay the outstanding amount.
Reclassified assets
Based on the amendments to IAS 39 and IFRS 7, ‘Reclassification of financial assets’, Rabobank reclassified a
number of ‘Financial assets held for trading’ and ’Available-for-sale financial assets’ to ‘Loans to customers’ and
‘Due from other banks’ in 2008. Rabobank has identified assets to which this amendment applies, with the
intention clearly shifting to holding the securities for the near future as opposed to selling or trading them in
the short term. The reclassifications were effected as from 1 July 2008 at their fair value at the time. This note
provides details on the impact of the reclassifications at Rabobank.
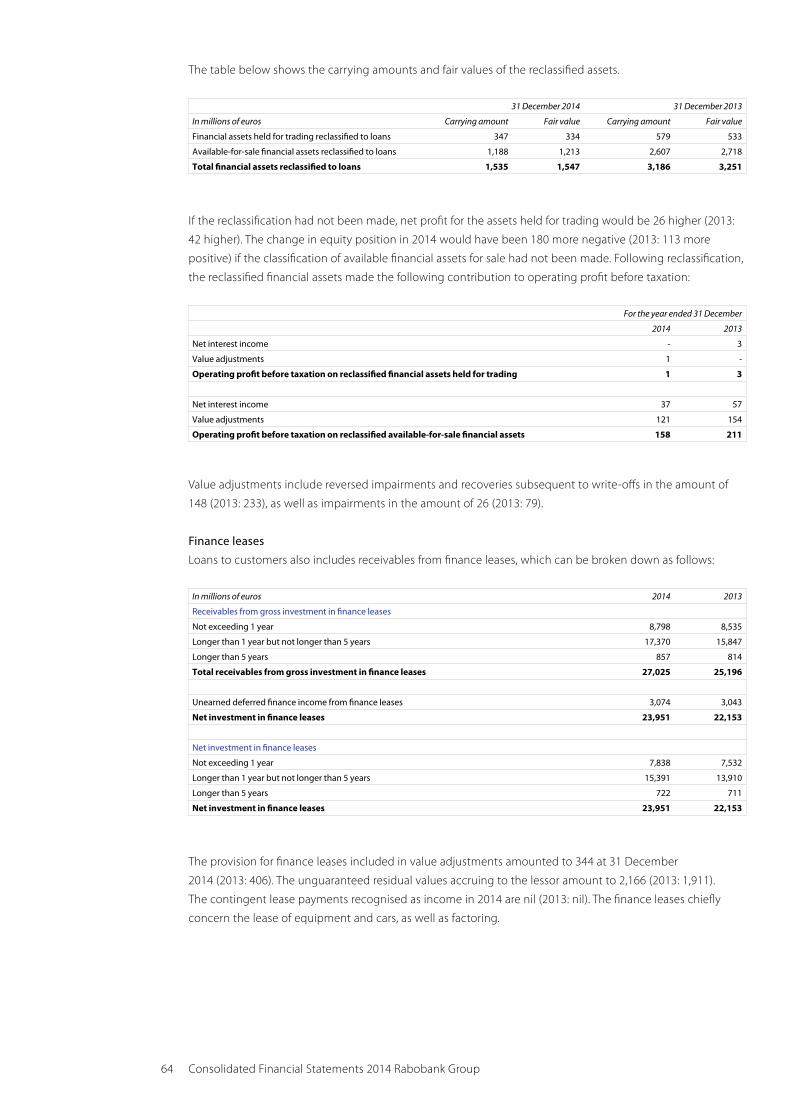
64 Consolidated Financial Statements 2014 Rabobank Group
The table below shows the carrying amounts and fair values of the reclassified assets.
31 December 2014 31 December 2013
In millions of euros Carrying amount Fair value Carrying amount Fair value
Financial assets held for trading reclassified to loans 347 334 579 533
Available-for-sale financial assets reclassified to loans 1,188 1,213 2,607 2,718
Total financial assets reclassified to loans 1,535 1,547 3,186 3,251
If the reclassification had not been made, net profit for the assets held for trading would be 26 higher (2013:
42 higher). The change in equity position in 2014 would have been 180 more negative (2013: 113 more
positive) if the classification of available financial assets for sale had not been made. Following reclassification,
the reclassified financial assets made the following contribution to operating profit before taxation:
For the year ended 31 December
2014 2013
Net interest income - 3
Value adjustments 1 -
Operating profit before taxation on reclassified financial assets held for trading 1 3
Net interest income 37 57
Value adjustments 121 154
Operating profit before taxation on reclassified available-for-sale financial assets 158 211
Value adjustments include reversed impairments and recoveries subsequent to write-offs in the amount of
148 (2013: 233), as well as impairments in the amount of 26 (2013: 79).
Finance leases
Loans to customers also includes receivables from finance leases, which can be broken down as follows:
In millions of euros 2014 2013
Receivables from gross investment in finance leases
Not exceeding 1 year 8,798 8,535
Longer than 1 year but not longer than 5 years 17,370 15,847
Longer than 5 years 857 814
Total receivables from gross investment in finance leases 27,025 25,196
Unearned deferred finance income from finance leases 3,074 3,043
Net investment in finance leases 23,951 22,153
Net investment in finance leases
Not exceeding 1 year 7,838 7,532
Longer than 1 year but not longer than 5 years 15,391 13,910
Longer than 5 years 722 711
Net investment in finance leases 23,951 22,153
The provision for finance leases included in value adjustments amounted to 344 at 31 December
2014 (2013: 406). The unguaranteed residual values accruing to the lessor amount to 2,166 (2013: 1,911).
The contingent lease payments recognised as income in 2014 are nil (2013: nil). The finance leases chiefly
concern the lease of equipment and cars, as well as factoring.

65 Notes to the consolidated financial statements
12 Available-for-sale financial assetsIn millions of euros 2014 2013
Short-term government securities 2,297 1,710
Government bonds 31,456 35,714
Other debt securities 4,740 8,170
Equity instruments 1,277 958
Total available-for-sale financial assets 39,770 46,552
The impairment of available-for-sale financial assets amounts to 60 (2013: -111) and is recognised in profit or
loss under ‘Net income from financial assets and liabilities at fair value through profit and loss’.
In millions of euros 2014 2013
Gains/(losses) on available-for-sale financial assets 418 56
The changes in available-for-sale financial assets can be broken down as follows:
In millions of euros 2014 2013
Opening balance 46,552 50,425
Foreign exchange differences 1,106 (749)
Additions 9,863 44,524
Disposals (sale and redemption) (19,528) (44,167)
Transferred to non-current assets held for sale - (1,163)
Fair value changes 1,836 (1,984)
Other changes (59) (334)
Closing balance 39,770 46,552
13 Investments in associates and joint ventures
The carrying amount of the investments in associates and joint ventures is 3,807 (2013: 3,747).
These joint ventures are addressed in Section 49, ‘Joint ventures’.
In millions of euros 2014 2013
Opening balance 3,747 3,649
IFRS 10/11 accounting policy change - 196
Purchases 54 58
Sales (54) (1)
Share of profit of associates 81 79
Dividends paid (53) (62)
Revaluation 86 (118)
Other (54) (54)
Total 3,807 3,747
The main associates in terms of the size of the capital interest held by Rabobank include:
As at 31 December 2014 Share interest Voting right
Nederland
Achmea B.V. 29% 29%
Equens N.V. 15% 15%
Gilde Venture Capital fondsen Various Various

66 Consolidated Financial Statements 2014 Rabobank Group
Rabobank holds less than 20% of the voting rights in Equens, but has significant control in Equens. For example,
two Rabobank representatives are members of the Supervisory Board, while Rabobank also supplies the
chairman of the Audit & Compliance Committee. Due to Rabobank’s substantial stake in Equens, this stake is
classified as an ‘associate’.
Achmea is a strategic partner of Rabobank for insurance products. Interpolis, a subsidiary of the Achmea Group,
works closely with the local Rabobanks. Achmea’s head office is located in Zeist, the Netherlands. The stake in
Achmea, for which no listed market price is available, is valued in accordance with the equity method.
Achmea 2014 2013
Cash and cash equivalents 1,716 3,265
Investments 65,817 66,124
Banking business loans 15,227 15,251
Other assets 10,445 9,724
Total assets 93,205 94,364
Insurance-related provisions 61,559 59,043
Loans and funds borrowed 7,011 11,133
Other liabilities 14,817 14,450
Total liabilities 83,387 84,626
Revenues 26,796 23,397
Result from continued operations 16 349
Result from discontinued operations - -
Off-balance-sheet profit for loss 288 (505)
Total of realised and unrealised results 304 (156)
Other associates 2014 2013
Income from continuing operations 111 50
Income after taxation from discontinued operations - -
Net profit 111 50
Off-balance-sheet profit or loss 28 (26)
Total of realised and unrealised results 139 24
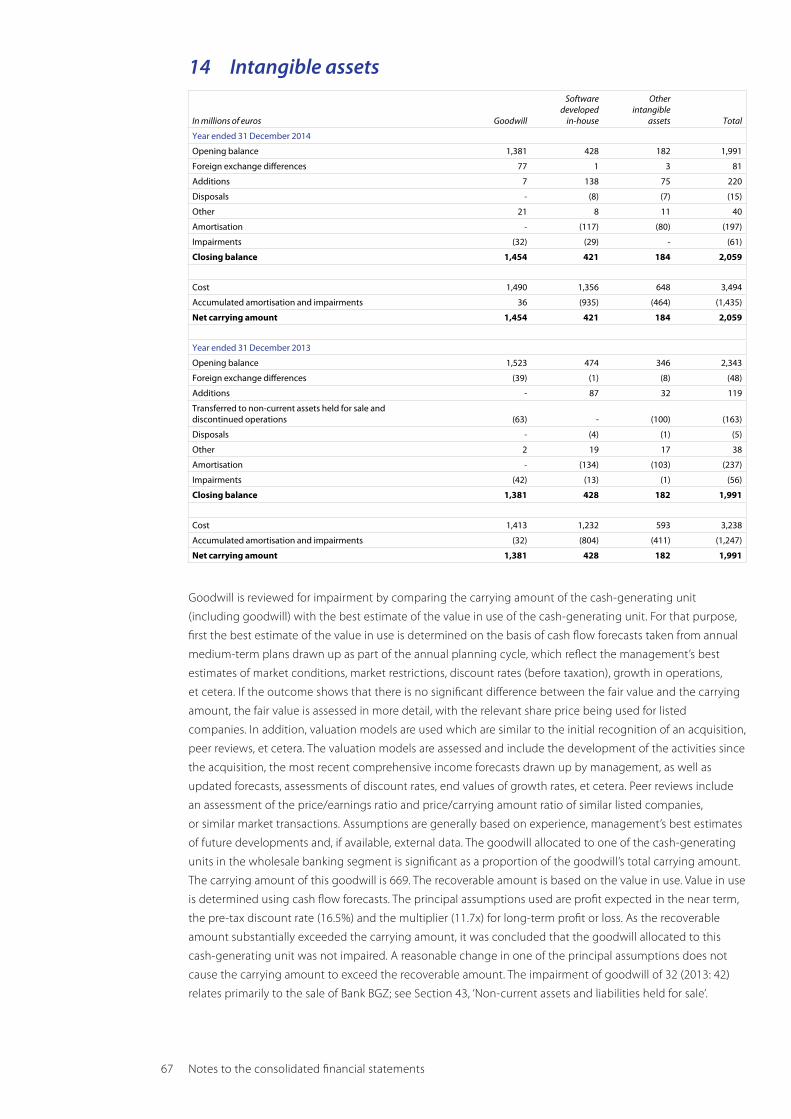
67 Notes to the consolidated financial statements
14 Intangible assets
In millions of euros Goodwill
Softwaredeveloped
in-house
Otherintangible
assets Total
Year ended 31 December 2014
Opening balance 1,381 428 182 1,991
Foreign exchange differences 77 1 3 81
Additions 7 138 75 220
Disposals - (8) (7) (15)
Other 21 8 11 40
Amortisation - (117) (80) (197)
Impairments (32) (29) - (61)
Closing balance 1,454 421 184 2,059
Cost 1,490 1,356 648 3,494
Accumulated amortisation and impairments 36 (935) (464) (1,435)
Net carrying amount 1,454 421 184 2,059
Year ended 31 December 2013
Opening balance 1,523 474 346 2,343
Foreign exchange differences (39) (1) (8) (48)
Additions - 87 32 119
Transferred to non-current assets held for sale anddiscontinued operations (63) - (100) (163)
Disposals - (4) (1) (5)
Other 2 19 17 38
Amortisation - (134) (103) (237)
Impairments (42) (13) (1) (56)
Closing balance 1,381 428 182 1,991
Cost 1,413 1,232 593 3,238
Accumulated amortisation and impairments (32) (804) (411) (1,247)
Net carrying amount 1,381 428 182 1,991
Goodwill is reviewed for impairment by comparing the carrying amount of the cash-generating unit
(including goodwill) with the best estimate of the value in use of the cash-generating unit. For that purpose,
first the best estimate of the value in use is determined on the basis of cash flow forecasts taken from annual
medium-term plans drawn up as part of the annual planning cycle, which reflect the management’s best
estimates of market conditions, market restrictions, discount rates (before taxation), growth in operations,
et cetera. If the outcome shows that there is no significant difference between the fair value and the carrying
amount, the fair value is assessed in more detail, with the relevant share price being used for listed
companies. In addition, valuation models are used which are similar to the initial recognition of an acquisition,
peer reviews, et cetera. The valuation models are assessed and include the development of the activities since
the acquisition, the most recent comprehensive income forecasts drawn up by management, as well as
updated forecasts, assessments of discount rates, end values of growth rates, et cetera. Peer reviews include
an assessment of the price/earnings ratio and price/carrying amount ratio of similar listed companies,
or similar market transactions. Assumptions are generally based on experience, management’s best estimates
of future developments and, if available, external data. The goodwill allocated to one of the cash-generating
units in the wholesale banking segment is significant as a proportion of the goodwill’s total carrying amount.
The carrying amount of this goodwill is 669. The recoverable amount is based on the value in use. Value in use
is determined using cash flow forecasts. The principal assumptions used are profit expected in the near term,
the pre-tax discount rate (16.5%) and the multiplier (11.7x) for long-term profit or loss. As the recoverable
amount substantially exceeded the carrying amount, it was concluded that the goodwill allocated to this
cash-generating unit was not impaired. A reasonable change in one of the principal assumptions does not
cause the carrying amount to exceed the recoverable amount. The impairment of goodwill of 32 (2013: 42)
relates primarily to the sale of Bank BGZ; see Section 43, ‘Non-current assets and liabilities held for sale’.
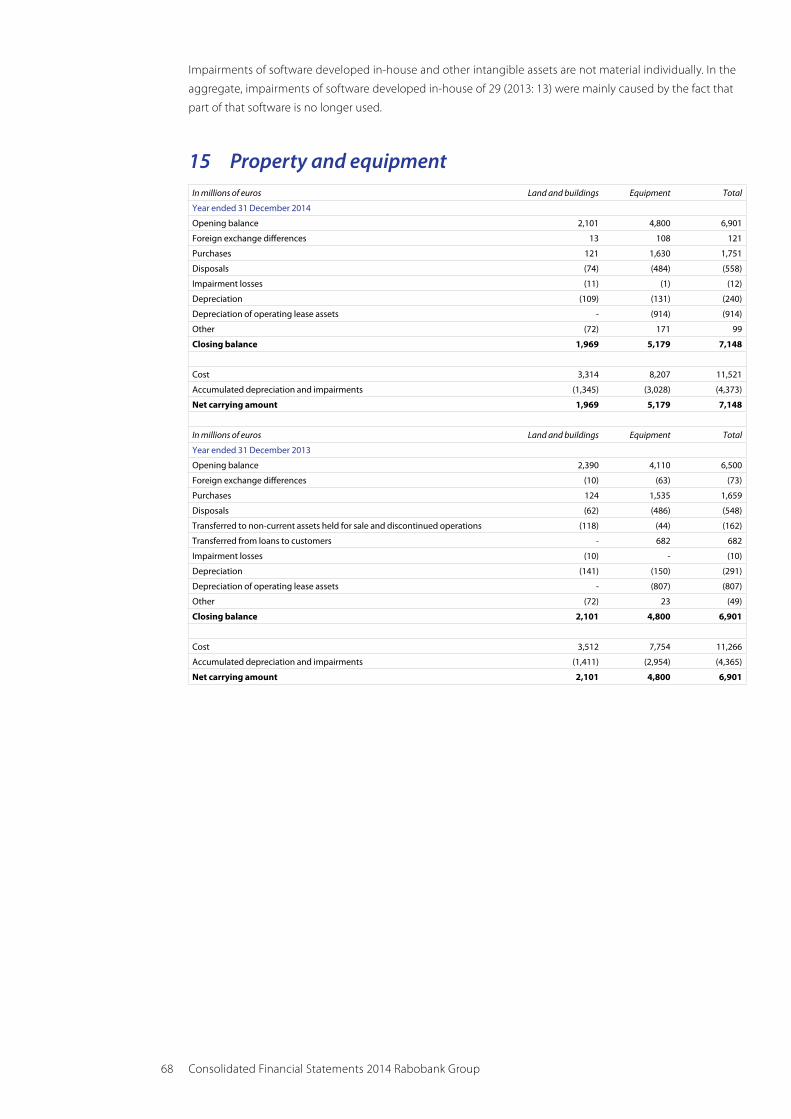
68 Consolidated Financial Statements 2014 Rabobank Group
Impairments of software developed in-house and other intangible assets are not material individually. In the
aggregate, impairments of software developed in-house of 29 (2013: 13) were mainly caused by the fact that
part of that software is no longer used.
15 Property and equipmentIn millions of euros Land and buildings Equipment Total
Year ended 31 December 2014
Opening balance 2,101 4,800 6,901
Foreign exchange differences 13 108 121
Purchases 121 1,630 1,751
Disposals (74) (484) (558)
Impairment losses (11) (1) (12)
Depreciation (109) (131) (240)
Depreciation of operating lease assets - (914) (914)
Other (72) 171 99
Closing balance 1,969 5,179 7,148
Cost 3,314 8,207 11,521
Accumulated depreciation and impairments (1,345) (3,028) (4,373)
Net carrying amount 1,969 5,179 7,148
In millions of euros Land and buildings Equipment Total
Year ended 31 December 2013
Opening balance 2,390 4,110 6,500
Foreign exchange differences (10) (63) (73)
Purchases 124 1,535 1,659
Disposals (62) (486) (548)
Transferred to non-current assets held for sale and discontinued operations (118) (44) (162)
Transferred from loans to customers - 682 682
Impairment losses (10) - (10)
Depreciation (141) (150) (291)
Depreciation of operating lease assets - (807) (807)
Other (72) 23 (49)
Closing balance 2,101 4,800 6,901
Cost 3,512 7,754 11,266
Accumulated depreciation and impairments (1,411) (2,954) (4,365)
Net carrying amount 2,101 4,800 6,901

69 Notes to the consolidated financial statements
16 Investment properties
Investment properties are stated at cost.
In millions of euros 2014 2013
Opening balance 1,055 1,489
IFRS 10/11 accounting policy change - (18)
Purchases 609 132
Sales (1,051) (75)
Transferred to non-current assets held for sale - (274)
Depreciation (10) (11)
Impairments 13 (172)
Other (164) (16)
Closing balance 452 1,055
The fair value approximates the carrying amount (2013: approximated the carrying amount)
Cost 810 1,597
Accumulated depreciation (358) (542)
Net carrying amount 452 1,055
Rabo Real Estate Group sold PalaisQuarter in 2014 for roughly 800 – the largest real estate project in its
portfolio up to that time.
Valuations
2014 2013
External valuations 44% 76%
Internal valuations 56% 24%
External valuations of the investment property were performed by duly certified external parties in accordance
with RICS valuation standards or other equivalent standards. The investment property was valued based on
the methodologies which are most appropriate for the property in question. This includes the discounted
cash-flow valuation method and the capitalisation based on net initial yields for comparable transactions.
Real estate expertise available in-house is used for internal valuations of investment properties, and
84% (2013: 87%) were valued by certified staff of Rabo Real Estate Group. Investment properties valued
internally are typically measured using a discounted cash flow valuation technique.
17 Other assetsIn millions of euros Note 2014 2013
Receivables and prepayments 590 1,701
Accrued interest 1,599 1,838
Precious metals, goods and warehouse receipts 1,495 880
Real estate projects 1,835 2,048
Accrued income 101 280
Employee benefits 25 6 6
Other assets 2,934 1,277
Total other assets 8,560 8,030
Real estate projects
In millions of euros 2014 2013
Building sites and equalisation funds 1,227 1,119
Work in progress 426 786
Trade receivables, real estate 182 143
Total real estate projects 1,835 2,048

70 Consolidated Financial Statements 2014 Rabobank Group
Real estate stocks are valued at cost or the low net recoverable value. The net recoverable value of the building
sites and equalisation funds is the highest of the direct yield amount and the indirect yield amount. The direct
yield amount is the estimated value on sale less the estimated costs of completing the sale. The indirect yield
value is the estimated yield based on ordinary business operations less the estimated costs of completion and
the estimated costs necessary to complete the sale, whereby the estimated cash flows are discounted at the
weighted average capital base. In determining the weighted average capital base, the bank factors in expected
capital, timing of cash flows, operational risk and certain conditions specific to Rabobank Real Estate Group.
In determining both direct and indirect recoverable value, Rabobank uses assessments and estimates.
In determining direct and indirect yield, risks related to current land operation, sites not subject to a zoning
plan, and equalisation funds, including demographic trends, location, use and the elaboration of
development plans and administrative decision-making, are incorporated on a location-specific basis as much
as possible. For individual locations, this results in expected movements in land and house prices, expected
margins per home, and other variables, which ultimately determine the direct and indirect yield amount.
For individual plots and sites, net recoverable value is determined by comparing the direct and indirect yield
amounts with each other. For plots of land ready for construction and the current land operation, net recoverable
value is generally equal to the indirect yield amount. For the other categories, both the direct and the indirect
yield amount may have been decisive in determining the net recoverable value, whereby the direct yield
amount is generally used more often the longer it takes to begin construction.
The risk of deviations from assessments and estimates is generally greater for sites not subject to a zoning
plan than for sites which are subject to a zoning plan, whereby the risk of deviations further increases if the
commencement of construction is expected to be delayed.
The net recoverable value of all current land operation, sites not subject to a zoning plan and equalisation
funds was calculated in 2014 and compared with the carrying amount. Overall, this resulted in a transfer to
provisions of a total of 16 (2013: 518). A negative carrying amount may arise, for example, if Rabo Real Estate
Group has committed to developing real estate, whereby the property, according to current estimates, is
loss-making and the loss is greater than the amount capitalised at that time. The lower values are caused
primarily by deteriorated market conditions for homes, which have changed the outlook of success in terms
of properties, completion time, expected profit margins and number of residential units completed.
In millions of eurosAt
1 January 2014
IFRS 11 accounting
policy changeAdditions/
releaseWithdrawals/
other changesAt
31 December 2014
Movements in provisions for property projects
Building sites and equalisation funds 850 (101) 16 (96) 669
Work in progress 266 (25) 24 (149) 116
Trade debtors – property 9 - - (1) 8
Total 1,125 (126) 40 (246) 793
In millions of eurosAt
1 January 2013 AdditionsWithdrawals/
other changesBalance at
31 December 2013
Movements in provisions for property projects
Building sites and equalisation funds 351 518 (19) 850
Work in progress 113 119 34 266
Trade debtors – property 11 - (2) 9
Total 475 637 13 1,125

71 Notes to the consolidated financial statements
Work in progress
In millions of euros 2014 2013
Homes in preparation and under construction 495 677
Commercial real estate in development and in progress 205 1,018
Pre-invoiced terms for housing construction (127) (317)
Pre-invoiced terms for commercial real estate (147) (546)
IFRS 11 accounting policy change - (46)
Total work in progress 426 786
18 Due to other banksIn millions of euros 2014 2013
Demand deposits 979 4,077
Fixed-term deposits 16,136 9,747
Repurchase agreements 708 808
Miscellaneous liabilities to other banks 60 113
Total due to other banks 17,883 14,745
19 Due to customersIn millions of euros 2014 2013
Current accounts 56,438 46,881
Deposits with agreed maturity 96,572 91,015
Deposits redeemable at notice 162,857 175,870
Repurchase agreements 2,025 1,474
Other due to customers 8,579 10,982
Total due to customers 326,471 326,222
Due to customers also includes the investments of central banks amounting to 20 (2013: 22) billion.
20 Debt securities in issueIn millions of euros 2014 2013
Certificates of deposit 41,824 42,796
Commercial paper 13,241 11,620
Bonds 127,792 137,482
Other debt securities 6,203 3,463
Total debt securities in issue 189,060 195,361
21 Other liabilitiesIn millions of euros 2014 2013
Payables 5,411 4,838
Accrued interest 2,791 3,010
Employee benefits 385 288
Other (546) (414)
Provision for day 1 profit 6 27
Total other liabilities 8,047 7,749

72 Consolidated Financial Statements 2014 Rabobank Group
22 Other financial liabilities at fair value through profit or loss
The change in the fair value of the other financial liabilities at fair value through profit or loss that is attributable
to changes in Rabobank’s credit risk is a loss of 669 (2013: gain of 363). The cumulative change in fair value
attributable to changes in Rabobank’s credit risk in relation to the credit spread at the time of issue of the
structured notes amounts to 674 before taxes (2013: 1,343). The book value of the structured notes is
5,108 (2013: 5,061) lower than the amount Rabobank is obliged to repay to the holders of the structured notes.
The change in fair value that is attributable to changes in credit risk is calculated by establishing a connection
with the change in the credit mark-up of structured notes issued by Rabobank.
In millions of euros 2014 2013
(Structured) notes 14,629 14,116
Other debt securities 688 1,928
Deposits with agreed maturity 4,427 3,025
Total other financial liabilities at fair value through profit or loss 19,744 19,069
23 ProvisionsIn millions of euros 2014 2013
Restructuring provision 315 396
Provision for tax and legal issues 267 268
Other 212 386
Total provisions 794 1,050
Changes in provisions were as follows:
Restructuring provision
Opening balance 396 120
Interest - -
Additions charged to profit 135 381
Withdrawals (172) (95)
Release (44) (10)
Closing balance 315 396
Provision for tax and legal issues
Opening balance 268 304
Additions charged to profit 68 579
Withdrawals (44) (582)
Release (25) (33)
Closing balance 267 268
Other
Opening balance 386 328
IFRS 10/11 policy change - 78
Additions charged to profit 61 75
Withdrawals (26) (61)
Release (209) (34)
Closing balance 212 386
Total provisions 794 1,050
The additions deducted from profit from the restructuring provision is an amount of 80 (2013: 283) for the
reorganisation programme for the local Rabobanks. This reorganisation provision consists of future payments
relating to redundancy pay and other costs directly attributable to the reorganisation programme. These costs
are accounted for once a detailed redundancy plan is in place. The expected outflow of funds will occur in
2015 and 2016.

73 Notes to the consolidated financial statements
Approximately 21% (2013: 32%) of the provision for tax and legal issues relates to tax claims. The provision for
tax and legal issues is based on the best possible estimates available at year-end, taking into account legal
and tax advice. The timing of the cash outflow of these provisions is uncertain because the outcome of the
disputes and the time involved are unpredictable. ‘Other’ includes provisions for onerous contracts, credit
guarantees and obligations under the terms of the deposit guarantee scheme.
Maturities of Rabobank Group (excluding provisions for employee benefits and doubtful debts)
In millions of euros Up to one year 1-5 year More than 5 years Total
At 31 December 2014 653 141 - 794
At 31 December 2013 207 843 - 1,050
24 Deferred tax
Deferred tax assets and liabilities are measured for all temporary differences using the ‘liability’ method.
The effective tax rate in the Netherlands for measuring deferred tax is 25% (2013: 25%). There were no changes
in deferred tax assets and liabilities resulting from changes in the effective tax rate in the Netherlands. No deferred
tax asset has been recognised for unused tax losses totalling 1,657 (2013: 1,738). These carry forward losses relate
to various tax authorities and their term to maturity is largely unlimited. Deferred tax assets recognised in respect
of carry forward losses can only be utilised if taxable profits are realised in the future. At 31 December 2014,
there is a realistic expectation that sufficient taxable profits will be generated within the applicable periods.
Deferred tax assets
Deferred tax liabilities
Deferred tax charges
Tax on other comprehensive
income
In millions of euros
For the year ending on 31 December 2014
Pensions and other post-employment benefits 54 1 1 (8)
Impairments 437 (13) 203 -
Financial liabilities at fair value (287) - (168) -
Other provisions 3 11 36 -
Hedging of interest rate risk 183 - 262 -
Carry forward losses 1,754 (89) (33) -
Intangible assets - 3 (58) -
Revaluation reserve for available-for-sale financial assets (112) 8 - (114)
Revaluation reserve – cash flow hedges (7) - - 9
Property and equipment, including leases 61 705 (38) -
Other temporary differences 415 (153) (349) -
Total 2,501 473 (144) (113)
Deferred tax assets
Deferred tax liabilities
Deferred tax charges
Tax on other comprehensive
income
In millions of euros
For the year ending on 31 December 2013
Pensions and other post-employment benefits 35 - 502 (252)
Impairments 641 (1) 116 -
Financial liabilities at fair value (455) - 91 -
Other provisions 75 142 77 -
Hedging of interest rate risk 445 - (278) -
Carry forward losses 1,451 128 (784) -
Intangible assets (68) - (5) -
Revaluation reserve for available-for-sale financial assets 1 7 - 34
Revaluation reserve – cash flow hedges (110) - - (4)
Property and equipment, including leases (20) 75 2 -
Other temporary differences (85) (63) (14) -
Total 1,910 288 (293) (222)

74 Consolidated Financial Statements 2014 Rabobank Group
25 Employee benefitsIn millions of euros 2014 2013
Employee benefits – assets (6) (6)
Employee benefits – liabilities 385 288
Net pension liabilities 379 282
Pension schemes 116 66
Other employee benefits 263 216
Net pension liabilities 379 282
25.1 Pension schemesIn May 2013, Rabobank reached agreement with the trade unions regarding the amendment to the Collective
Labour Agreement (CAO). The parties agreed on a new pension scheme to replace the current scheme
administered by the Rabobank Pension Fund. The new pension scheme, which became effective with
retroactive effect on 1 January 2013, is a group defined-benefit scheme based on a retirement age of 67 and
a target accrual rate of 2 percent. Each year Rabobank deposits pension contributions into the Rabobank
Pension Fund based on a fixed system in an attempt to achieve the target pension accrual for services
provided during the year of service based on a conditional career-average scheme with a conditional
indexation. In paying the annual pension contributions, Rabobank will fully and finally have satisfied all its
pension obligations and will no longer have any financial commitments in relation to the underlying years
of participation and pensions previously accrued. In the context of the risks transferred, Rabobank paid a
one-time amount of 500 towards the creation of an index deposit. In addition, Rabobank will act as a
guarantor during the period 2014-2020 for the realisation of the target pension accrual for the services
provided during this period up to a maximum amount of 250.
The new pension scheme qualifies as a defined contribution plan under IAS 19. Rabobank’s obligation is
limited to the premium payments owed, less previously made payments. Since the pension scheme
administered by Stichting Rabobank Pensioenfonds no longer qualifies as a defined-benefit pension scheme,
practically the only pension schemes that continue to qualify as defined-benefit schemes are those of
Friesland Bank and ACC Loan Management at 31 December 2014. These are career-average defined-benefit
pension schemes, administered by a fund or otherwise. The assets related to the schemes maintained in a
fund are held independently of Rabobank assets in separate funds managed by trustees. The assets are valued
each year by independent actuaries based on the method prescribed by IFRS. The most recent actuarial
valuations were performed at the end of 2014. The tables relating to the weighted averages of the main
actuarial assumptions and the future premium payments in 2014 relate to these two pension schemes.
The table showing investments in plan assets are based on the pension scheme administered by ACC Loan
Management.
In millions of euros 2014 2013
Present value of liabilities administered by funds 673 545
Fair value of plan assets 557 479
Net liabilities 116 66

75 Notes to the consolidated financial statements
Movements in plan assets and liabilities:
In millions of euros 2014 2013
Present value of liabilities administered by funds
Present value of entitlements at 1 January 545 19,464
Foreign exchange differences 9 -
Interest 21 244
Increase in entitlements during the year 3 225
Premiums contributed by the employees - 16
Benefits paid (17) (119)
Transfer of accrued benefits - -
Pension scheme termination - (20,620)
Pension scheme amendment 26 -
Curtailments (1) (6)
Other 2 (3)
Actuarial gains and losses arising from changes in demographic assumptions 39 (47)
Actuarial gains and losses arising from changes in financial assumptions 46 1,391
Present value of liabilities held in a fund at 31 December 673 545
Fair value of plan assets
Fair value of assets at 1 January 479 18,202
Foreign exchange differences 7 -
Interest 19 230
Premium contributed by the employer 8 491
Premiums contributed by the employees - 17
Benefits paid (17) (119)
Transfer of accrued benefits and costs - (5)
Pension scheme termination - (18,779)
Other (5) (3)
Actuarial result 66 445
Fair value of plan assets at 31 December 557 479
Estimated premium contributions for 2015 are approximately 6. Plan assets have been allocated as follows:
2014 2013
Shares and alternatives 24.2% 31.6%
Interest-bearing securities 31.0% 26.4%
Real Estate 4.7% 6.2%
Cash and cash equivalents 0.6% -0.4%
Other 39.5% 36.2%
Total 100% 100%
The costs recognised in the consolidated profit or loss account are shown in the table below.
In millions of euros 2014 2013
Interest on liabilities 21 244
Interest on plan assets (19) (230)
Costs based on period of employment during the year 3 225
Pension scheme changes 26 -
Losses/(gains) on discounts, settlements and costs 1 (1)
Total cost of defined benefit plans 32 238

76 Consolidated Financial Statements 2014 Rabobank Group
The weighted averages of the main actuarial assumptions for the valuation of the pension provision (defined-
benefit pension schemes) as at 31 December are shown in the table below (in % per year):
2014 2013
Discount rate 2.3% 3.8%
Wage inflation 1.6% 2.5%
Price inflation 1.6% 2.0%
25.2 Other employee benefitsOther employee benefits mainly comprise liabilities for future long-service awards for an amount of 106 (2013: 96).
26 Subordinated debtIn millions of euros 2014 2013
Rabobank Nederland 11,902 7,782
Friesland Bank - 9
Other 26 24
Total subordinated debt 11,928 7,815
Rabobank Nederland issued three subordinated bonds in 2014, one in GBP, one in EUR and one in JPY.
The EUR 2 billion bond has a maturity date of May 2026 and has a coupon rate of 2.50%. Rabobank is entitled,
but not obliged, to early repayment of this bond loan in 2019. The GBP 1 billion bond has a maturity date of
May 2028 and has a coupon rate of 4.625%.The JPY 50.8 billion bond has a maturity date of December 2024
and a coupon rate of 1.429%.
Rabobank Nederland issued three subordinated loans in 2013: a EUR 1,000 million loan with a fixed interest rate
of 3.875% and a maturity date of 2023; a USD 1,750 million loan with a fixed interest rate of 4.625% and a maturity
date of 2023; and a USD 1,250 million loan with a fixed interest rate of 5.75% and a maturity date of 2043.
Rabobank Nederland issued three subordinated loans in 2012: a EUR 1,000 million loan with a fixed interest rate
of 4.125% and a maturity date of 2022; a GBP 500 million loan with a fixed interest rate of 5.25% and a maturity
date of 2027; and a USD 1,500 million loan with a fixed interest rate of 3.95% and a maturity date of 2022.
Rabobank Nederland issued a EUR 1,000 million loan in 2010 with a fixed interest rate of 3.75% and a maturity
date of 2020. Rabobank Nederland issued a EUR 1,000 million loan in 2009 with a fixed interest rate of 5.875%
and a maturity date of 2019.
27 Contingencies and commitments
Credit related contingent liabilities
Credit granting liabilities represent the unused portions of funds authorised for the granting of credit in the
form of loans, financial guarantees, letters of credit and other lending related financial instruments.
Rabobank’s credit risk exposure from credit granting liabilities consists of potential losses amounting to the
unused portion of the authorised funds. The total expected loss is lower than the total of unused funds,
however, because credit granting liabilities are subject to the clients in question continuing to meet specific
standards of creditworthiness. Financial guarantees represent irrevocable undertakings that, provided certain
conditions are met, Rabobank will make payments on behalf of clients if they are unable to meet their
financial obligations to third parties. Rabobank also accepts credit granting liabilities in the form of credit
facilities made available to ensure that clients’ liquidity requirements can be met, but which have not yet
been drawn upon. The contingent liabilities include guarantees for providers of collective and individual
pension savings plans, as required by government authorities. The likelihood of an outflow of resources
embodying economic benefits is very low.

77 Notes to the consolidated financial statements
In millions of euros 2014 2013
Financial guarantees 11,826 11,429
Credit granting liabilities 35,432 32,126
Letters of credit 5,392 5,919
Other contingent liabilities - 82
Total credit related and contingent liabilities 52,650 49,556
The contractual commitments relating to the acquisition, construction and development of work in progress
and equipment and property investments amount to 587 (2013: 478).
Rabobank is involved in a number of legal and arbitration proceedings in the Netherlands and other
countries, including the United States, in connection with claims brought by and against Rabobank Group
arising from its operations. For additional information, please refer to paragraph 4.10 ‘Legal and arbitration
proceedings’.
Liabilities relating to operating leases
Rabobank has concluded various operating lease contracts as lessee, mainly with respect to properties,
information systems and cars. The future net minimum lease payments under non-cancellable operating
leases can be broken down as follows:
In millions of euros 2014 2013
Not exceeding 1 year 34 66
Longer than 1 year but not longer than 5 years 123 162
Longer than 5 years 128 123
Total liabilities relating to operating leases 285 351
The expected future net minimum lease payments receivable from sub-leases are 3 (2013: 16). The operating
lease expenses are 75 (2013: 90). These are included in ‘Other administrative expenses’ in the statement of income.
Payments receivable from operating leases
Rabobank has concluded various operating lease contracts as lessor. The future minimum lease payments
receivable from non-cancellable operating leases can be broken down as follows:
In millions of euros 2014 2013
Not later than 1 year 1,393 1,137
Later than 1 year but not later than 5 years 2,456 2,210
Later than 5 years 71 172
Total payments receivable from operating leases 3,920 3,519
No contingent lease payments were recognised as assets during the year under review.
28 Equity of Rabobank Nederland and local Rabobanks
This item includes equity of Rabobank Nederland and local Rabobanks.
In millions of euros 2014 2013
Foreign currency translation reserves (94) (575)
Revaluation reserve for available-for-sale financial assets 643 282
Revaluation reserve for associates 2 29
Revaluation reserve - cash flow hedges 11 49
Revaluation reserve - pensions (196) (3,251)
Retained earnings 24,528 27,197
Total reserves and retained earnings at year-end 24,894 23,731

78 Consolidated Financial Statements 2014 Rabobank Group
Changes in reserves were as follows:
In millions of euros 2014 2013
Translation differences emerging during the year
Opening balance (575) (163)
Currency translation differences emerging during the year 481 (412)
Closing balance (94) (575)
Revaluation reserve for available-for-sale financial assets
Opening balance 282 420
Foreign exchange differences (34) (43)
Changes in associates 86 (28)
Fair value changes 533 (34)
Amortisation of reclassified assets 13 37
Transferred to profit or loss (237) (70)
Closing balance 643 282
Revaluation reserve for associates
Opening balance 29 50
Fair value changes (27) (21)
Closing balance 2 29
Revaluation reserve - cash flow hedges
Opening balance 49 40
Fair value changes 548 (1,450)
Transferred to profit or loss (586) 1,459
Closing balance 11 49
Revaluation reserve – pensions
Opening balance (3,251) (2,493)
Changes in associations (11) (85)
Fair value changes (14) (673)
Reversal of revaluation reserve of Rabobank Pension Fund pensions 3,080 -
Closing balance (196) (3,251)
Retained earnings
Opening balance 27,197 26,463
Net profit attributable to Rabobank Nederland and local Rabobanks 620 929
Rebooking of revaluation reserve for Rabobank Pension Fund pensions (3,080) -
Other (209) (195)
Closing balance 24,528 27,197
Total reserves and retained earnings 24,894 23,731
29 Rabobank Certificates
As part of its member loyalty programme, Rabobank issued certificates and member certificates between
2000 and 2005. There were a total of four issues (in 2000, 2001, 2002 and 2005) and these certificates were
only available to members of local Rabobanks. In order to give members the opportunity to purchase or sell
Rabobank (Member) Certificates, Rabobank organised an internal market once a month. Until around
February 2013, when supply and demand in the internal market were virtually in balance, supply increased
and demand – in particular subordinated bonds – fell as a result of the debt crisis and market conditions and
as a result of Rabobank Nederland’s duty-of-care programme. Rabobank Nederland purchased in the internal
market Rabobank (Member) Certificates for which there was no demand. In early December 2013, Rabobank
entered into an agreement with a third party in order to transfer Rabobank (Member) Certificates to
institutional investors. At the same time, it was announced that the planned minimum distribution would be
raised from 5.2% to 6.5% on an annual basis and that Rabobank intended to list the Rabobank (Member)
Certificates on the stock exchange. The listing expanded our investor base as well as improved tradability.

79 Notes to the consolidated financial statements
On 14 January 2014, the certificate holder meeting approved the proposed change in order to facilitate a
Euronext Amsterdam listing. The Rabobank Certificates have been listed on Euronext Amsterdam since
27 January 2014. These certificates represent equity investments issued by Rabobank Nederland through
Stichting Administratie Kantoor Rabobank Certificaten. The launch price was 105.00% (EUR 26.25) and has
increased to 107.45% since the launch (EUR 26.86) at 31 December 2014. An average of 7.3 million certificates
a day were traded during this period on a total of 238 million. Since the stock exchange listing, Rabobank
Certificates are also available to non-Rabobank members. This has increased the marketability of this
instrument. The distribution paid per certificate in 2014 was EUR 1,625 (2013: EUR 1,275). The Executive Board
is entitled not to pay the distribution. Unpaid distributions will not be paid at a later date. At year-end 2014,
the total number of certificates was 237,961,365. The amounts listed in the table below are based on the
nominal value of EUR 25 per Rabobank Certificate. Premiums and discounts on Rabobank Certificates issued
and recouped and the costs of the issue after taxation are included in retained earnings (see the consolidated
statement of assets). Cash flows arising from changes during the year in the Rabobank Certificates are
included in the consolidated statement of cash flows.
Rabobank Certificates
In millions of euros 2014 2013
Changes during the year:
Opening balance 5,823 6,672
Rabobank (Member) Certificates redeemed during the year - (2,074)
Exchange of Rabobank Extra Member Notes - 225
Rabobank (Member) Certificates issued during the year 108 1,000
Closing balance 5,931 5,823
30 Capital Securities and Trust Preferred Securities III to VI
Capital Securities and Trust Preferred Securities III to VI can be broken down as follows:
In millions of euros 2014 2013
Capital Securities 6,530 7,265
Trust Preferred Securities III to VI 1,043 1,269
Total Capital Securities and Trust Preferred Securities III to VI 7,573 8,534
Capital Securities
All Capital Securities are perpetual and have no expiry date. The distribution on the Capital Securities per issue
is as follows.
Equity instruments issued directlyIssue of USD 2,000 millionThe distribution is 8.40% per year and is made payable every six months in arrears as of the issue date
(9 November 2011), for the first time on 29 December 2011. The Capital Securities are perpetual and first
redeemable on 29 June 2017. If the Capital Securities are not redeemed early, the distribution is set for a
further five-year period, without a step-up, based on the US Treasury Benchmark Rate plus a 7.49% mark-up.
Issue of USD 2,000 millionThe distribution is 8.375% per year and is made payable every six months in arrears as of the issue date
(26 January 2011), for the first time on 26 July 2011. With effect from 26 July 2016 and if the Capital Securities
are not redeemed early, the distribution is set for a further five-year period, without a step-up, based on the
US Treasury Benchmark Rate plus a 6.425% mark-up.

80 Consolidated Financial Statements 2014 Rabobank Group
Issue of EUR 500 millionThe distribution is 9.94% per year and is made payable annually in arrears as of the issue date
(27 February 2009), for the first time on 27 February 2010. As from 27 February 2019, the distribution will be
made payable every quarter based on the three-month Euribor plus an annual 7.50% mark-up.
Issue of USD 2,868 millionThe distribution is 11.0% per year and is made payable every six months in arrears as of the issue date (4 June 2009),
for the first time on 31 December 2009 (long first interest period). As from 30 June 2019 the distribution will
be made payable every quarter based on the three-month USD Libor plus an annual 10.868% mark-up.
Issue of CHF 750 millionThe distribution is 6.875% per year and is made payable annually in arrears as of the issue date (14 July 2009),
for the first time on 12 November 2009 (short first interest period). As from 12 November 2014 the distribution
will be made payable every six months based on the six-month CHF Libor plus an annual 4.965% mark-up.
The issue was redeemed on the earliest first redemption date of 12 November 2014.
Issue of GBP 250 millionThe distribution is 6.567% per year and is made payable every six months in arrears as of the issue date
(10 June 2008), for the first time on 10 December 2008. As from 10 June 2038, the distribution will be made
payable every six months based on the six-month GBP Libor plus an annual 2.825% mark-up.
Issue of CHF 350 millionThe distribution is 5.50% per year and is made payable annually in arrears as of the issue date (27 June 2008),
for the first time on 27 June 2009. As from 27 June 2018, the distribution will be made payable every six
months on 27 June and 27 December based on the six-month CHF Libor plus an annual 2.80% mark-up.
Issue of ILS 323 millionThe distribution is 4.15% per year and is made payable annually in arrears as of the issue date (14 July 2008),
for the first time on 14 July 2009. As from 14 July 2018, the distribution will be made payable annually based
on an index related to the interest rate paid on Israeli government bonds with terms between 4.5 and
5.5 years plus an annual 2.0% mark-up.
Issue of USD 225 millionThe distribution is 7.375% per year and is made payable annually in arrears from the issue date (24 September
2008) every six months, for the first time on 24 March 2009. The issue was redeemed on the earliest first
redemption date on 24 March 2014.
Issue of NZD 900 millionThe distribution on the NZD Capital Securities equals the one-year swap interest rate plus an annual 0.76%
mark-up and is made payable annually on 8 October, until 8 October 2017. As from 8 October 2017,
the distribution will be made payable every quarter based on the 90-day bank bill swap interest rate plus
the same mark-up.
The level of Rabobank Nederland’s profit may influence the distribution on the Capital Securities.
Should Rabobank Nederland become insolvent, the Capital Securities are subordinate to the rights of all other
(current and future) creditors of Rabobank Nederland, unless the rights of those other creditors substantively
determine otherwise.

81 Notes to the consolidated financial statements
Equity instruments issued by subsidiariesIssue of NZD 280 millionRabobank Capital Securities Limited has issued capital securities, the distribution of which equals the five-year
swap interest rate plus an annual 3.75% mark-up and was set at 8.7864% per year on 25 May 2009. The distribution
is made payable every quarter in arrears from the issue date (27 May 2009), for the first time on 18 June 2009
(short first interest period). As from 18 June 2014, the distribution will be made payable every quarter based
on the five-year swap interest rate plus an annual 3.75% mark-up, as determined on 18 June 2014. As from
18 June 2019, the distribution will be made payable every quarter based on the 90-day bank bill swap interest
rate plus an annual 3.75% mark-up.
Issue of EUR 125 millionFriesland Bank N.V. issued perpetual Capital Securities in November 2004. These are undated bonds, listed at
the Euronext stock exchange. The bonds are subordinated to the bank’s all other present and future liabilities.
For supervisory purposes, the bond loan qualifies as part of the bank’s core capital. The distribution on the
bond loan is linked to the yield on Dutch 10-year government bonds. A 0.125% mark-up applies, subject to a
maximum distribution of 8%. The interest rate is reset on a quarterly basis. Interest payments must be deferred
if, 20 days prior to the date of payment, it is known that payment of interest will cause the solvency ratio to
drop below the minimum capital required by the supervisory authority. In addition, the bank may decide to
defer interest payments. The bond was redeemed on the first early redemption date on 31 December 2014.
Trust Preferred Securities III to VIIn 2004, four tranches of non-cumulative Trust Preferred Securities were issued.
• Rabobank Capital Funding Trust III, Delaware, a group company of Rabobank Nederland, issued 1.50 million
non-cumulative Trust Preferred Securities. The expected distribution is 5.254% until 21 October 2016. For the
period 21 October 2016 to 31 December 2016 inclusive, the expected distribution is equal to the USD Libor
interpolated for the period, plus 1.5900%. The company has the right not to make a distribution. Thereafter,
the expected distribution is equal to the three-month USD Libor plus 1.5900%. The total proceeds from this
issue amounted to USD 1,500 million. As from 21 October 2016, these Trust Preferred Securities can be
repurchased on each distribution date (which is once a quarter) after prior written approval is received from
the Dutch Central Bank.
• Rabobank Capital Funding Trust IV, Delaware, a group company of Rabobank Nederland, issued
350 thousand non-cumulative Trust Preferred Securities. The expected distribution is 5.556% until
31 December 2019, after which the expected distribution is equal to the six-month GBP Libor plus 1.4600%.
The company has the right not to make a distribution. The total proceeds from this issue amounted to
GBP 350 million. As from 31 December 2019, these Trust Preferred Securities can be repurchased on each
distribution date (which is once every half-year) after prior written approval is received from the Dutch
Central Bank.
• Rabobank Capital Funding Trust V, Delaware, a group company of Rabobank Nederland, issued 250 thousand
non-cumulative Trust Preferred Securities. The expected distribution is three-month BBSW plus 0.6700%
until 31 December 2014, after which the expected distribution is equal to the three-month BBSW plus
1.6700%. The company has the right not to make a distribution. The total proceeds from this issue amounted
to AUD 250 million. The issue was redeemed on the earliest first redemption date, on 31 December 2014.
• Rabobank Capital Funding Trust VI, Delaware, a group company of Rabobank Nederland, issued 250
thousand non-cumulative Trust Preferred Securities. The expected distribution is 6.415% until 31 December
2014, after which the expected distribution is equal to the three-month BBSW plus 1.6700%. The company
has the right not to make a distribution. The total proceeds from this issue amounted to AUD 250 million.
As from 31 December 2014, these Trust Preferred Securities can be repurchased on each distribution date.
The bond was redeemed on the first early redemption date, on 31 December 2014.
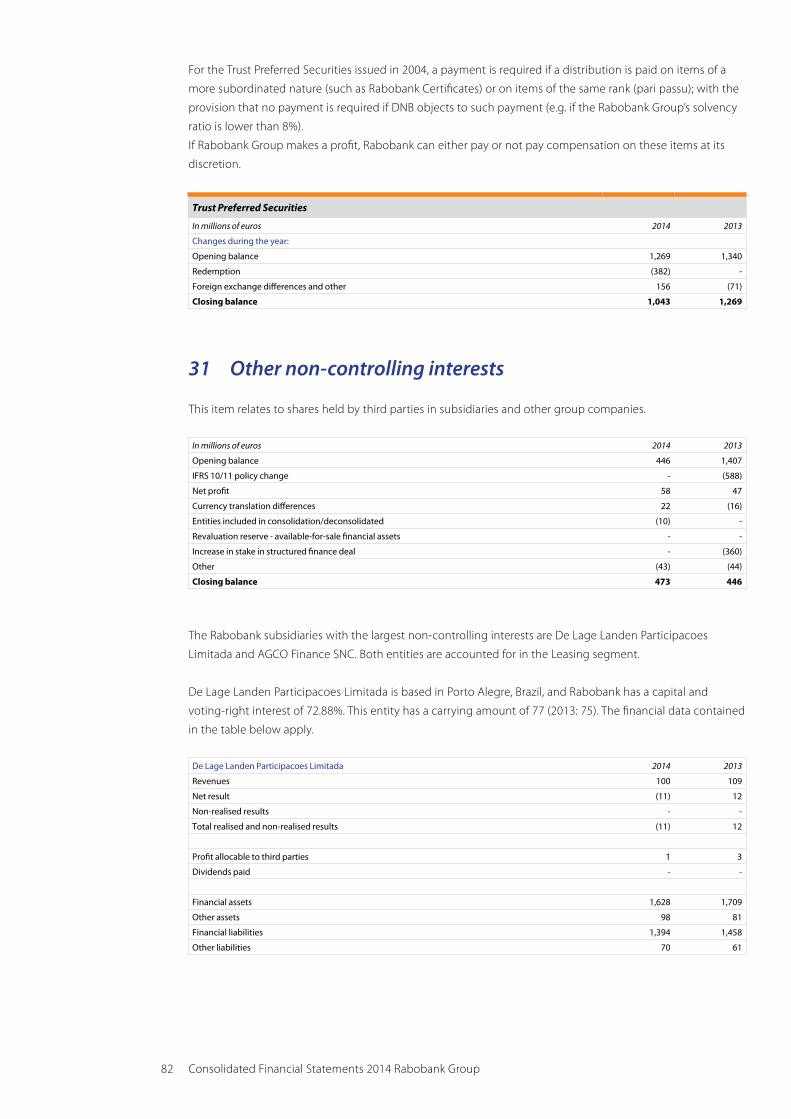
82 Consolidated Financial Statements 2014 Rabobank Group
For the Trust Preferred Securities issued in 2004, a payment is required if a distribution is paid on items of a
more subordinated nature (such as Rabobank Certificates) or on items of the same rank (pari passu); with the
provision that no payment is required if DNB objects to such payment (e.g. if the Rabobank Group’s solvency
ratio is lower than 8%).
If Rabobank Group makes a profit, Rabobank can either pay or not pay compensation on these items at its
discretion.
Trust Preferred Securities
In millions of euros 2014 2013
Changes during the year:
Opening balance 1,269 1,340
Redemption (382) -
Foreign exchange differences and other 156 (71)
Closing balance 1,043 1,269
31 Other non-controlling interests
This item relates to shares held by third parties in subsidiaries and other group companies.
In millions of euros 2014 2013
Opening balance 446 1,407
IFRS 10/11 policy change - (588)
Net profit 58 47
Currency translation differences 22 (16)
Entities included in consolidation/deconsolidated (10) -
Revaluation reserve - available-for-sale financial assets - -
Increase in stake in structured finance deal - (360)
Other (43) (44)
Closing balance 473 446
The Rabobank subsidiaries with the largest non-controlling interests are De Lage Landen Participacoes
Limitada and AGCO Finance SNC. Both entities are accounted for in the Leasing segment.
De Lage Landen Participacoes Limitada is based in Porto Alegre, Brazil, and Rabobank has a capital and
voting-right interest of 72.88%. This entity has a carrying amount of 77 (2013: 75). The financial data contained
in the table below apply.
De Lage Landen Participacoes Limitada 2014 2013
Revenues 100 109
Net result (11) 12
Non-realised results - -
Total realised and non-realised results (11) 12
Profit allocable to third parties 1 3
Dividends paid - -
Financial assets 1,628 1,709
Other assets 98 81
Financial liabilities 1,394 1,458
Other liabilities 70 61

83 Notes to the consolidated financial statements
AGCO Finance SNC is located in Beauvais, France, and Rabobank has a capital and voting-right interest in this
company of 51.0%. The carrying amount of this entity is 67 (2013: 55). The financial data contained in the table
below apply.
AGCO Finance SNC 2014 2013
Revenues 39 36
Net result 19 17
Non-realised results - -
Total realised and non-realised results 19 17
Profit allocable to third parties 9 8
Dividends paid 6 6
Financial assets 1,240 1,185
Other assets 36 87
Financial liabilities 1,128 1,141
Other liabilities 12 17
32 InterestIn millions of euros 2014 2013
Interest income
Cash and cash equivalents 112 102
Due from other banks 405 289
Financial assets held for trading 108 158
Other financial assets at fair value through profit or loss 71 86
Loans to customers 18,168 19,153
Available-for-sale financial assets 1,170 1,550
Derivative financial instruments held as economic hedges (1,535) (1,787)
Pensions 11 13
Other 128 143
Total interest income 18,638 19,707
Interest expense
Due to other banks 458 506
Other trade liabilities 20 28
Due to customers 3,719 4,417
Debt securities in issue 4,152 4,619
Other liabilities 462 248
Other financial liabilities at fair value through profit or loss 681 711
Other 28 83
Total interest expense 9,520 10,612
Interest 9,118 9,095
Capitalised interest attributable to qualifying assets amounted to 21 (2013: 36). The average interest rate
applied in determining interest charges to be capitalised ranges between 0.3% and 5.5% (2013: between 1.9%
and 5.5%).

84 Consolidated Financial Statements 2014 Rabobank Group
33 CommissionsIn millions of euros 2014 2013
Commission income
Asset management 69 65
Insurance commissions 326 341
Lending 455 503
Purchase and sale of other financial assets 275 179
Payment services 615 587
Custodial fees and securities services 10 28
Handling fees 127 157
Other transactions involving financial instruments - 81
Other commission income 198 248
Total commission income 2,075 2,189
Commission expense
Asset management - 1
Purchase and sale of other financial assets 28 65
Payment services 22 21
Custodial fees and securities services 17 10
Handling fees 40 42
Other commission expense 89 49
Total commission expense 196 188
Commission 1,879 2,001
34 Income from associatesIn millions of euros 2014 2013
Rabobank share of profit of associates 107 129
Discontinued/disposed interests of associates (26) (50)
Income from associates 81 79
35 Net income from financial assets and liabilities at fair value through profit or loss
In millions of euros 2014 2013
Income from financial assets and derivatives held for trade 1,451 (798)
Income from other financial assets and liabilities at fair value through profit or loss (1,419) 816
Other 187 214
Total income from financial assets and liabilities at fair value through profit or loss 219 232
The financial assets and liabilities listed in the above table are combined into portfolios. Profits from these
instruments must be considered in conjunction with each other.
In millions of euros 2014 2013
Profit from interest-rate instruments 173 (144)
Income from equity instruments 82 178
Income from foreign currencies (37) 89
Other 1 109
Total income from financial assets at fair value through profit or loss 219 232

85 Notes to the consolidated financial statements
36 Other incomeIn millions of euros 2014 2013
Real estate activities 184 (408)
Rental income 432 184
Termination of defined-benefit pension scheme - 1,522
Other 526 269
Total other income 1,142 1,567
Income from real estate activities includes project income of 1,344 (2013: 1,467), project charges of
1,122 (2013: 1,289) and impairments of 38 (2013: 586).
Rental income includes operating lease income and rental income from investment properties.
Operating lease income includes income of 1,972 (2013: 1,821), depreciation charges of 914 (2013: 807) and
other costs of 703 (2013: 701). Rental income from investment properties includes income of 94 (2013: 55),
depreciation charges of 10 (2013: 11) and other costs of 7 (2013: 173).
37 Staff costsIn millions of euros 2014 2013
Wages and salaries 3,331 3,455
Social security contributions and insurance costs 424 420
Pension costs for defined contribution plans 532 463
Pension costs for defined benefit plans 32 224
Other post-employment benefits 54 9
Other staff costs 713 751
Total staff costs 5,086 5,322
Expressed in FTEs, the average number of employees was 52,562 (2013: 58,249) over the year.
In 2011, following implementation of CRD III and the regulations governing a restrained remuneration policy,
Rabobank Group adopted an amended remuneration policy. A Group-wide Remuneration Policy has been in
place since 1 January 2014; this policy was further adapted to the provisions from CRD IV. To the extent that
identified staff (i.e. employees who can potentially exercise material control over Rabobank Group’s risk
profile) are eligible for variable remuneration, such remuneration must never exceed 100% of the employee’s
fixed income. In addition, variable remuneration is also awarded to identified staff for such period that the
risks associated with the underlying business activities are adequately taken into account.
Hence, payment of a significant portion of variable remuneration is deferred. The immediate portion of variable
remuneration is unconditional, whereas the deferred portion is conditional. The deferred portion vests after
three years if the conditions are met. Among other things, it is assessed whether there has been a significant
reduction in financial performance or a significant change in risk management at Rabobank Group and/or
business unit that puts the circumstances assessed when the relevant variable remuneration was awarded
in a different perspective. As a rule, the right to any outstanding deferred remuneration lapses if the staff
member’s employment ends before the deferred portion of the variable remuneration vests.
Fifty percent of both the direct and the deferred portion of the variable remuneration is allocated in cash.
The cash component of the direct portion is immediately awarded following allocation. The cash component
of the deferred portion is awarded to employees only after vesting (after a period of three years), including
a market-level interest rate.
Of both the direct and the deferred portion of the variable remuneration, 50% is allocated in the form of an
instrument (instrument component), i.e. the Deferred Remuneration Note (DRN). The amount of a DRN is
linked directly to the price of a Rabobank Certificate as listed on NYSE Euronext.

86 Consolidated Financial Statements 2014 Rabobank Group
The instrument component is converted into DRNs at the time of allocation on completion of the performance
year. The number of DRNs is based on the average closing prices for Rabobank Certificates as established on
the NYSE Euronext exchange on the first five trading days in February of each year, with the exception of
2014, during which the average closing price for Rabobank Certificates will be the average of the closing
prices of Rabobank Certificates as established on NYSE Euronext on the five trading days from
17-21 February 2014 (inclusive). Accordingly, this represents both the instrument component of the direct
and the deferred portion of the variable remuneration. The final number of DRNs relating to the deferred
portion is established on vesting (i.e. after a 3-year period).
The payment of the instrument component is subject to a 1-year retention period. On expiry of this period,
employees receive a cash amount for each DRN held (or a portion thereof ) corresponding to the amount of (I)
the DRN at that time and (II) an amount equal to the payments made for RCs during the period of allocation
until the expiry of the retention period.
Payment of the cash component of the variable remuneration is measured in accordance with IAS 19 Employee
benefits, whereas payment of the DRNs is measured in accordance with IFRS 2 Share-based Payment.
The immediate portion of the variable remuneration is recognised in the performance year, whereas the deferred
portion is recognised in the years before vesting. By and large, the same system is used for non-identified staff.
Both the immediate and the deferred portion are paid fully in cash, which means that no DRNs are awarded.
At 31 December 2014, the costs of equity instrument-based payments were 10 (2013: 8). At 31 December 2014,
a liability of 23 was recognised (2013: 18). The costs of variable remuneration paid in cash were 97 (2013: 109).
The number of DRNs outstanding is presented below.
in thousands 2014 2013
Opening date 952 986
Awarded during the year 348 308
Paid during the year (166) (223)
Changes from previous year (120) (119)
Closing date 1,014 952
The amount of a DRN is linked directly to the price of an RC. The estimated payments to be made for the
variable remuneration are shown in the table below.
At 31 December 2014 Year of payment
In millions of euros 2015 2016 2017 2018 2019 Total
Variable remuneration, not including DRNs 101.5 6.8 6.2 7.5 - 122.1
DRNs 3.6 12.0 4.4 4.2 5.3 29.5
Total 105.1 18.8 10.6 11.7 5.3 151.6
At 31 December 2013 Year of payment
In millions of euros 2014 2015 2016 2017 2018 Total
Variable remuneration, not including DRNs 102.0 13.9 7.5 7.3 - 130.7
DRNs 4.2 3.6 8.5 4.9 4.3 25.4
Total 106.2 17.5 16.0 12.2 4.3 156.1
38 Other administrative expenses
The other administrative expenses total 2,532 (2013: 3,910). The reorganisation costs fell by 280 in 2014 and a
portion of the provision created for DSB Bank in the past could be released. In 2013, the settlement amount of
EUR 774 was recognised under Other Administrative Expenses following the Libor investigations. This item also
includes travel expenses, automation costs, IT-related costs, postage costs, publicity costs, office supplies,
rents and building maintenance expenses.

87 Notes to the consolidated financial statements
39 Depreciation and amortisationIn millions of euros 2014 2013
Depreciation of property and equipment 240 291
Amortisation of intangible assets 197 237
Total depreciation and amortisation 437 528
40 Value adjustmentsIn millions of euros 2014 2013
Due from other banks (14) (7)
Loans to customers 2,762 2,746
Receipts following write-offs (117) (103)
Credit related liabilities 2 6
Other assets - 1
Total value adjustments 2,633 2,643
41 Bank tax and resolution levy
Banks operating in the Netherlands on 1 October of the year under review are required to pay bank tax.
There are two rates of bank tax: a rate of 0.044% for current liabilities and a rate of 0.022% for long-term
liabilities, based on the balance recorded in December 2013. Rabobank Group was charged a total of 167 in
bank tax in 2014 (2013: 197). The resolution levy, a one-time levy imposed by the Dutch government on the
Dutch banking industry in connection with the nationalisation of SNS Reaal, totalled 321.
42 TaxationIn millions of euros 2014 2013
Current income tax
Reporting period 79 371
Prior years (96) 10
Deferred tax (144) (293)
Income tax expense (161) 88
The taxation on operating profit before taxation of Rabobank differs from the nominal amount based on
Dutch standard tax rates as follows:
In millions of euros 2014 2013
Operating profit before taxation 1,681 430
Tax exempt income (247) (374)
Non-deductible expenses 599 1,051
Tax losses not recognised in prior years (2) (7)
Other (753) (664)
1,278 436
Income tax expense based on a rate of 25.0% (2012: 25.0%) 320 109
Effect of different tax rates and other non-recurring tax gains or losses (481) (21)
Income tax expense (161) 88
The deduction of payments, where applicable, for several capital equity instruments are included under ‘Other’.
An amount of 360 has been accounted for in the incidental tax income as a result of the application of
Section 13d of the Corporation Tax Act (liquidation loss of participating interest).

88 Consolidated Financial Statements 2014 Rabobank Group
43 Non-current assets and liabilities held for sale
Sale of Bank BGZAn agreement was reached in December 2013 regarding the sale of the 98.5% share interest in the Polish-
based Bank BGZ to BNP Paribas Group for an amount of 4 billion Polish Zloty (approx. EUR 1 billion).
The agreement regarding the sale of Bank BGZ includes the operations of Rabobank Polska. The latter merged
with Bank BGZ in the first half of 2014. The sale of Bank BGZ to BNP Paribas was completed on 23 September
2014. In addition to the goodwill of 26, the foreign-exchange hedge reserves were released and this gain was
recognised under income from financial assets and derivatives held for trade at an amount of 47 before
taxation. The other reserves recognised under equity in relation to Bank BGZ were released. This gain of 73
before taxation was included in the other results.
Cash flows on disposal
Selling price 957
Cash and cash equivalents - Bank BGZ 366
Net cash flows 591
The following assets and liabilities are included in non-current assets and liabilities held for sale at 31 December 2013:
In millions of euros 2013
Assets
Cash and cash equivalents 390
Due from other banks 121
Loans to customers 6,346
Available-for-sale financial assets 1,163
Other assets 807
Total assets 8,827
Liabilities
Due to other banks 828
Due to customers 6,408
Other liabilities 589
Total liabilities 7,825
The consolidated profit or loss account includes the following amounts:
In millions of euros 2013
Interest 243
Fees and commissions 65
Other income 31
Total income 339
Staff costs 110
Other costs 197
Operating profit before taxation 32
Taxation 7
Net profit 25
Other non-current assets held for saleThe non-current assets held for sale in the amount of 327 (2013: 246) mainly comprise various types of real
estate (including residential and commercial) in a variety of countries. The book value is expected to be
realised through sale rather than through continued operation. The real estate properties which have been
classified as ‘held for sale’ are mostly unique properties, with no active market for similar real estate in the
same location and the same condition. A large number of parameters are used for the valuations of the
various types of property investments, based on existing contracts and market data if possible. A certain level
of assessment and estimation is generally unavoidable, which is why all non-current assets classified as ‘held
for sale’ are classified in category 3. The parameters used to determine the fair value of the property

89 Notes to the consolidated financial statements
investments, depending on the type of real estate, include: the current and expected market rent per square
metre, current and expected future vacancy rates, the location of the property, the marketability of the
property, the average discount rate, development budget and any credit risk.
44 Acquisitions and disposals
For details on the sale of Bank BGZ, see note 43 non-current assets and liabilities held for sale.
45 Transactions with related parties
Two parties are considered related if one party exercises control or has significant influence over the other
party (regarding finance or operating decisions). In the normal course of business, Rabobank conducts a wide
variety of transactions with related entities, involving different types of loans, deposits and transactions in
foreign currencies. Transactions between related parties also include transactions with associates, pension
funds, joint ventures, the Executive Board and the Supervisory Board. These transactions are conducted at
arm’s length conditions and against market prices. In accordance with IAS 24.4, transactions within Rabobank
Group are not disclosed in the consolidated financial statements. In the normal course of Rabobank’s business
operations, banking transactions are carried out with related parties. These involve loans, deposits and
transactions in foreign currencies. All these transactions were conducted at arm’s length and against market
prices. The volumes of related party transactions, year-end outstanding balances and the corresponding
income and expenses during the year are presented in the following table. Transactions and balances
outstanding with members of the Executive Board and members of the Supervisory Board are disclosed in
note 47. Transactions with pension funds are disclosed in note 25. Rabobank sold mortgage loans with a par
value of approximately EUR 1 billion to an Achmea B.V. on market terms.
Investments in associates Other related parties
In millions of euros 2014 2013 2014 2013
Loans
Outstanding at beginning of year 490 465 68 13
Granted during the year 14 117 - 55
Repaid during the year (144) (5) (57) -
Other - (87) - -
Loans at end of the year 360 490 11 68
Due to other banks and due to customers
Outstanding at beginning of the year 6,544 6,228 - -
Received during the year 573 738 - -
Repaid during the year (295) (80) - -
Other - (342) - -
Deposits at end of the year 6,822 6,544 - -
Other liabilities 23 25 - 19
Credit liabilities and other guarantees issued by Rabobank 37 116 - -
Income
Interest income 84 26 - -
Commission income 234 253 - -
Trading income - 44 - -
Other 2 6 - -
Total income from transactions with related parties 320 329 - -
Expense
Interest expense 358 360 - -
Commission expense - - - -
Impairments 20 (1) - -
Total expenses from transactions with related parties 378 359 - -
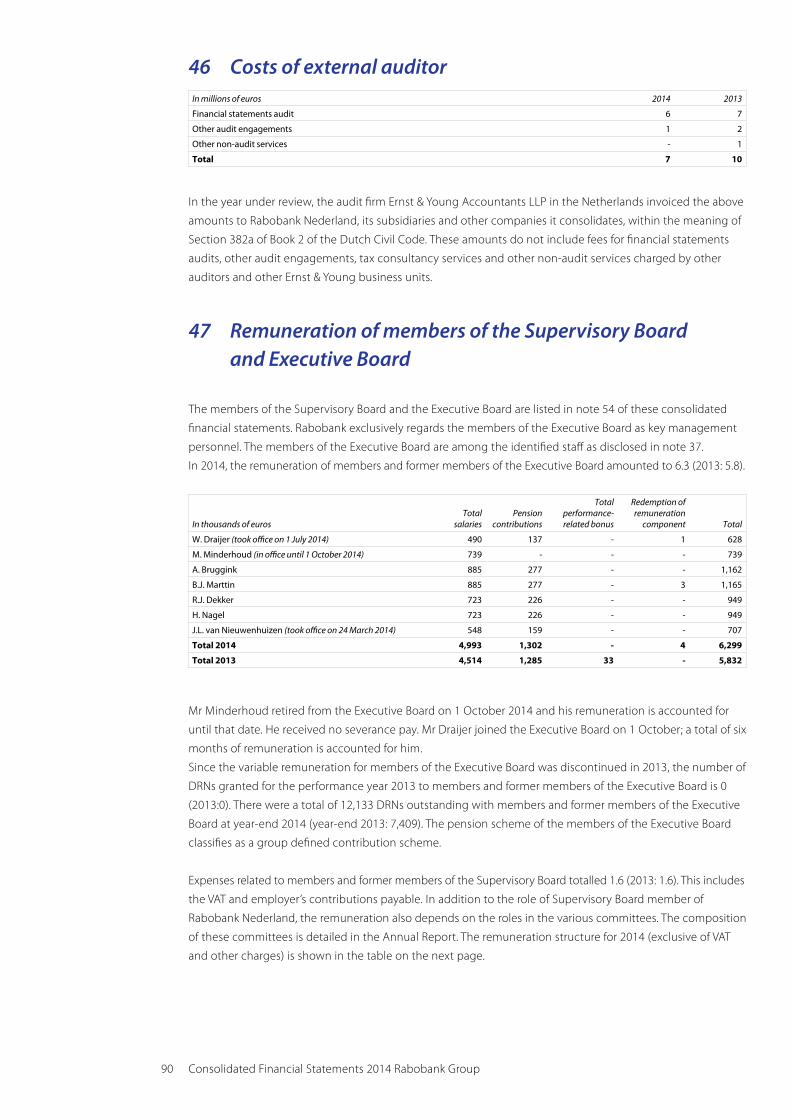
90 Consolidated Financial Statements 2014 Rabobank Group
46 Costs of external auditorIn millions of euros 2014 2013
Financial statements audit 6 7
Other audit engagements 1 2
Other non-audit services - 1
Total 7 10
In the year under review, the audit firm Ernst & Young Accountants LLP in the Netherlands invoiced the above
amounts to Rabobank Nederland, its subsidiaries and other companies it consolidates, within the meaning of
Section 382a of Book 2 of the Dutch Civil Code. These amounts do not include fees for financial statements
audits, other audit engagements, tax consultancy services and other non-audit services charged by other
auditors and other Ernst & Young business units.
47 Remuneration of members of the Supervisory Board and Executive Board
The members of the Supervisory Board and the Executive Board are listed in note 54 of these consolidated
financial statements. Rabobank exclusively regards the members of the Executive Board as key management
personnel. The members of the Executive Board are among the identified staff as disclosed in note 37.
In 2014, the remuneration of members and former members of the Executive Board amounted to 6.3 (2013: 5.8).
In thousands of eurosTotal
salariesPension
contributions
Total performance-related bonus
Redemption of remuneration
component Total
W. Draijer (took office on 1 July 2014) 490 137 - 1 628
M. Minderhoud (in office until 1 October 2014) 739 - - - 739
A. Bruggink 885 277 - - 1,162
B.J. Marttin 885 277 - 3 1,165
R.J. Dekker 723 226 - - 949
H. Nagel 723 226 - - 949
J.L. van Nieuwenhuizen (took office on 24 March 2014) 548 159 - - 707
Total 2014 4,993 1,302 - 4 6,299
Total 2013 4,514 1,285 33 - 5,832
Mr Minderhoud retired from the Executive Board on 1 October 2014 and his remuneration is accounted for
until that date. He received no severance pay. Mr Draijer joined the Executive Board on 1 October; a total of six
months of remuneration is accounted for him.
Since the variable remuneration for members of the Executive Board was discontinued in 2013, the number of
DRNs granted for the performance year 2013 to members and former members of the Executive Board is 0
(2013:0). There were a total of 12,133 DRNs outstanding with members and former members of the Executive
Board at year-end 2014 (year-end 2013: 7,409). The pension scheme of the members of the Executive Board
classifies as a group defined contribution scheme.
Expenses related to members and former members of the Supervisory Board totalled 1.6 (2013: 1.6). This includes
the VAT and employer’s contributions payable. In addition to the role of Supervisory Board member of
Rabobank Nederland, the remuneration also depends on the roles in the various committees. The composition
of these committees is detailed in the Annual Report. The remuneration structure for 2014 (exclusive of VAT
and other charges) is shown in the table on the next page.

91 Notes to the consolidated financial statements
In euros Chairperson Deputy Chairperson Member
Supervisory Board 288,750 71,500 55,000
Audit committee 32,500 15,000 15,000
Risk committee 32,500 15,000 15,000
Appeals Committee 7,500 - 7,500
Cooperative Issues Committee 15,000 - 15,000
Appointments Committee 3,750 - 3,750
Remuneration Committee 3,750 - 3,750
The table below shows the remuneration (excluding VAT and other charges) for individual Supervisory Board
members.
In thousands of euros Remuneration
W. Dekker 341
I.P. Asscher-Vonk 85
C.H. van Dalen 78
L.N. Degle 85
L.O. Fresco (in office until 19 June 2014) 39
S.L.J. Graafsma 110
A.A.J.M. Kamp (in office since 1 December 2014) 7
E.A.J. van de Merwe 103
R. Teerlink 89
C.P. Veerman 89
A.J.A.M. Vermeer (in office until 19 June 2014) 58
Total for 2014 1,084
Total for 2013 1,256
At Rabobank, the Chairman of the Supervisory Board holds a number of roles which are related to the
cooperative. These roles are specified in the Annual Report.
In millions of euros Executive Board Supervisory Board
Loans, advances and guarantees 2014 2013 2014 2013
Outstanding as at 1 January 3.4 4.8 1.5 1.1
Provided during the year - - 0.1 -
Redeemed during the year (1.1) (0.3) (0.1) (0.2)
Reduction on account of leaving office (0.2) (3.6) - (0.2)
increase on account of taking office 2.8 2.5 1.1 0.8
Outstanding as at 31 December 4.9 3.4 2.6 1.5
The loans, advances and guarantees of the members of the Supervisory Board in office at 31 December 2014
and the average interest rates are shown in the table below.
In millions of eurosOutstanding
loansAverage interest
rate (in %)
At 31 December 2014
R.J. Dekker 1.3 2.7
B.J. Marttin 0.6 4.1
H. Nagel 1.0 1.9
J.L. van Nieuwenhuizen 2.0 3.8

92 Consolidated Financial Statements 2014 Rabobank Group
The loans, advances and guarantees of the members of the Supervisory Board in office at 31 December 2014
and the average interest rates are shown in the table below.
In millions of eurosOutstanding
loansAverage interest
rate (in %)
At 31 December 2014
C.H. van Dalen 0.6 4.2
J.M. Kamp 1.1 2.8
C.P. Veerman 0.9 3.1
The Supervisory Board members not listed in the table did not receive any loans, advances or guarantees at
the end of 2014. These transactions with Executive Board members and Supervisory Board members in person
were completed based on employee terms and/or market-level rates for the Supervisory Board. The amount
of the rates depends in part on the currency, the agreed fixed-interest period and the time the transaction
was completed or the time a new fixed-interest term becomes effective.
Several members of the Executive Board and Supervisory Board have invested in Rabobank Certificates in
person and/or through their own pension B.V.s. This involved a total number of 27,110 certificates at the end
of 2014.
Number ofRabobank Certificates
At 31 December 2014
A. Bruggink 12,166
Ms I.P. Asscher-Vonk 6,894
L.N. Degle 4,000 (in pension B.V.)
S.L.J. Graafsma 4,050 (in pension B.V.)
48 Principal subsidiaries and associates
Rabobank Group consists of 113 independent local Rabobanks in the Netherlands, members of the central
organisation Coöperatieve Centrale Raiffeisen-Boerenleenbank B.A. (Rabobank Nederland) and a number of
specialised subsidiaries.
At 31 December 2014 Share Voting rights
Main subsidiaries
The Netherlands
DLL International B.V. 100% 100%
Rabo Vastgoedgroep N.V. 100% 100%
FGH Bank N.V. 100% 100%
OWM Rabobanken B.A. 100% 100%
Obvion N.V. 100% 100%
Rabohypotheekbank N.V. 100% 100%
Rabo Merchant Bank N.V. 100% 100%
Raiffeisenhypotheekbank N.V. 100% 100%
Schretlen & Co N.V. 100% 100%
Other eurozone/EU countries
ACC Loan Management Limited 100% 100%
North America
Rabobank Capital Funding LCC III to VI 100% 100%
Rabobank Capital Funding Trust III to VI 100% 100%
Utrecht America Holdings Inc. 100% 100%
Australia and New Zealand
Rabobank Australia Limited 100% 100%
Rabobank New Zealand Limited 100% 100%

93 Notes to the consolidated financial statements
All subsidiaries listed in the table are consolidated. In 2014, none of the subsidiaries experienced any
significant restrictions in the payment of dividends or the redemption of loans and repayment of advances.
The option of subsidiaries to pay dividend to Rabobank Nederland depends on various factors, including local
regulatory requirements, statutory reserves and financial performance.
Rabobank will not consolidate several structured entities in the Wholesale banking and international retail
banking business, even if it does retain more than half of the voting rights. These structured entities are not
consolidated, because the relevant activities are managed by a third party subject to a contract.
Rabobank does have control over several entities in the Leasing segment as part of its vendor leasing
operations, even though it will retain less than half of its voting rights because control is not determined
based on such rights, but rather on management participation.
49 Joint ventures
Virtually all joint ventures are entities of Rabo Real Estate Group, have a total carrying amount of 23 (2013: 26)
and are stated in accordance with the equity method.
Partnerships are common both in the development of integrated residential areas and in the development
of commercial real estate, whereby the property developer is joined by other – often local – parties, including
municipal governments, housing associations and construction companies. In the majority of cases, each
participating member of the partnership has a decisive vote, and decisions can only be passed by consensus.
The majority of these partnerships therefore qualify as joint arrangements.
Bouwfonds Investment Management (‘IM’) serves investors in a variety of sectors with real estate investment
products. Bouwfonds IM manages the portfolio and is responsible, sometimes alone and sometimes with
partners, for the fund management and asset management of the various funds.
If it works in a partnership, the individual partners generally have a decisive vote and decisions can only be
passed by consensus. As before, the majority of these partnerships qualify as joint arrangements.
Each partnership has its own legal structure, depending on the needs and requirements of the parties
concerned. The legal form (business structure) typically used is the Dutch ‘CV-BV’ structure (a limited
partnership-private limited liability company) or the ‘VOF’ structure (general partnership) or a derivative
thereof or related structure.
In the case of CV-BVs, the risk of a participating party is generally limited to the issued capital and the partners
are only entitled to the net asset from the entity. Under the VOF, all individual participating parties have,
in principle, unlimited liability and are, in principle, entitled to the assets on a proportional basis, as well as
having obligations in terms of the entity’s liabilities. Strictly on the basis of the legal form, a CV-BV structure
qualifies as a joint venture, while a VOF structure qualifies as a joint operation. However, the contractual terms
and other relevant facts and circumstances may result in a different conclusion.
Since a separate legal structure is established for each partnership in which the participating partners change
and separate products are not of a substantial size, Rabo Real Estate Group did not maintain any material joint
arrangements in 2013 and 2014.
Result from joint ventures 2014 2013
Result from continuing operations (39) (71)
Result from discontinued operations after taxation - -
Net profit (39) (71)
Off-balance-sheet profit or loss - -
Total of realised and unrealised result (39) (71)

94 Consolidated Financial Statements 2014 Rabobank Group
Off-balance-sheet assets and liabilities
Rabo Real Estate Group entered into the following off-balance-sheet commitments:
• Commitments with third parties (including subcontractors and architects) in the amount of 7 (2013: 7) for
non-commercial real estate projects at 31 December 2014,
• Commitments with subcontractors and architects for commercial real estate projects in the amount of
29 (2013: 5).
The principle joint ventures in terms of size of the capital interest held by Rabobank include:
At 31 December 2014 Share Voting rights
Nederland
Real estate development company De Westlandse Zoom CV, Monster 25% 25%
Real estate development company Waalfront CV, Nijmegen 50% 50%
FIRST Rotterdam CV, Rotterdam 50% 50%
50 Transfer of financial assets and financial assets provided as collateral
Reverse repurchase transactions and securities borrowing agreementsReverse repurchase transactions and securities borrowing agreements concluded by Rabobank are included
under ‘Due from other banks’ or ‘Loans to customers’. At 31 December, they amounted to:
In millions of euros 2014 2013
Due from other banks 27,592 22,418
Loans to customers 18,295 10,697
Total reverse repurchase transactions and securities borrowing agreements 45,887 33,115
Under the terms of the reverse repurchase transactions and securities borrowing agreements, Rabobank
receives collateral under conditions that enable it to repledge or resell the collateral to third parties. The total
fair value of the securities received under the terms of the agreements was 47,540 at 31 December
2014 (2013: 34,542). In accordance with the agreement terms, a portion of the securities was repledged or
sold as collateral. These transactions were effected subject to the normal conditions for standard reverse
repurchase transactions and securities borrowing agreements. The securities are not recognised in the
statement of financial position, given that substantially all associated risks and benefits accrue to the
counterparty. A receivable is recognised equalling the amount paid as collateral.
Repurchase transactions and securities lending agreementsRepurchase transactions and securities lending agreements concluded by Rabobank are included under
‘Due to other banks’ and ‘Due to customers’. At 31 December, they amounted to:
In millions of euros 2014 2013
Due to other banks 708 808
Due to customers 2,025 1,474
Total repurchase and securities lending 2,733 2,282
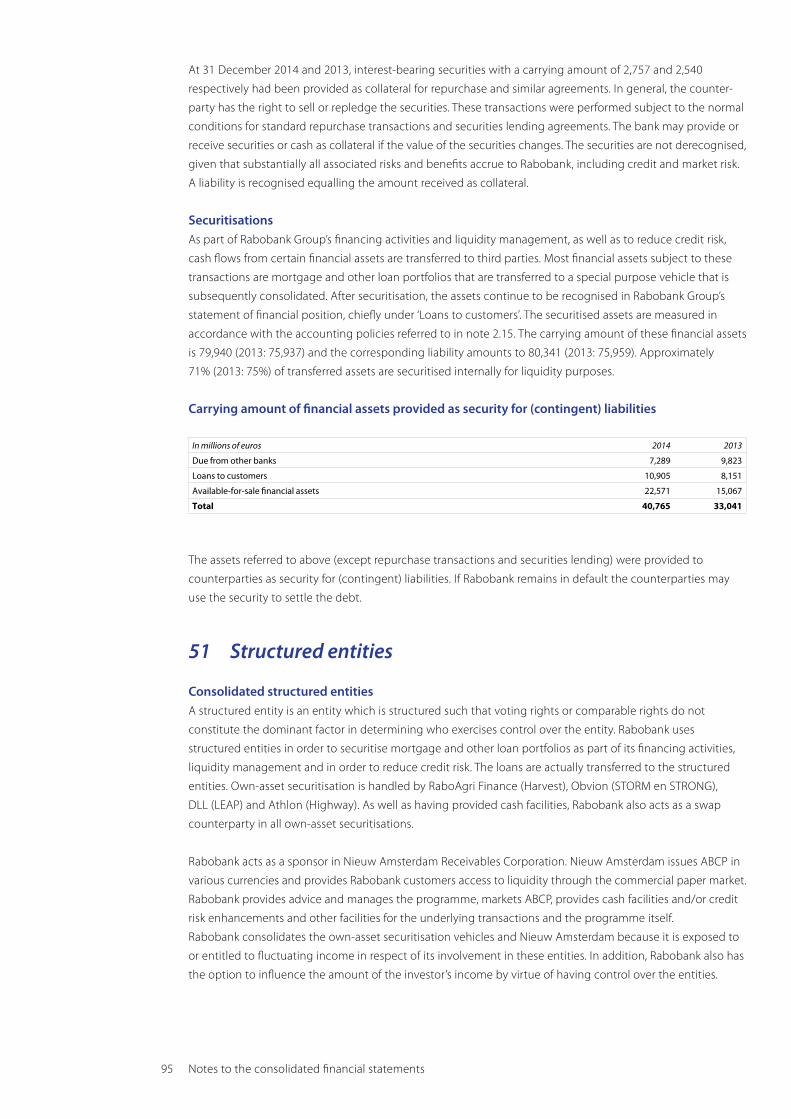
95 Notes to the consolidated financial statements
At 31 December 2014 and 2013, interest-bearing securities with a carrying amount of 2,757 and 2,540
respectively had been provided as collateral for repurchase and similar agreements. In general, the counter-
party has the right to sell or repledge the securities. These transactions were performed subject to the normal
conditions for standard repurchase transactions and securities lending agreements. The bank may provide or
receive securities or cash as collateral if the value of the securities changes. The securities are not derecognised,
given that substantially all associated risks and benefits accrue to Rabobank, including credit and market risk.
A liability is recognised equalling the amount received as collateral.
SecuritisationsAs part of Rabobank Group’s financing activities and liquidity management, as well as to reduce credit risk,
cash flows from certain financial assets are transferred to third parties. Most financial assets subject to these
transactions are mortgage and other loan portfolios that are transferred to a special purpose vehicle that is
subsequently consolidated. After securitisation, the assets continue to be recognised in Rabobank Group’s
statement of financial position, chiefly under ‘Loans to customers’. The securitised assets are measured in
accordance with the accounting policies referred to in note 2.15. The carrying amount of these financial assets
is 79,940 (2013: 75,937) and the corresponding liability amounts to 80,341 (2013: 75,959). Approximately
71% (2013: 75%) of transferred assets are securitised internally for liquidity purposes.
Carrying amount of financial assets provided as security for (contingent) liabilities
In millions of euros 2014 2013
Due from other banks 7,289 9,823
Loans to customers 10,905 8,151
Available-for-sale financial assets 22,571 15,067
Total 40,765 33,041
The assets referred to above (except repurchase transactions and securities lending) were provided to
counterparties as security for (contingent) liabilities. If Rabobank remains in default the counterparties may
use the security to settle the debt.
51 Structured entities
Consolidated structured entitiesA structured entity is an entity which is structured such that voting rights or comparable rights do not
constitute the dominant factor in determining who exercises control over the entity. Rabobank uses
structured entities in order to securitise mortgage and other loan portfolios as part of its financing activities,
liquidity management and in order to reduce credit risk. The loans are actually transferred to the structured
entities. Own-asset securitisation is handled by RaboAgri Finance (Harvest), Obvion (STORM en STRONG),
DLL (LEAP) and Athlon (Highway). As well as having provided cash facilities, Rabobank also acts as a swap
counterparty in all own-asset securitisations.
Rabobank acts as a sponsor in Nieuw Amsterdam Receivables Corporation. Nieuw Amsterdam issues ABCP in
various currencies and provides Rabobank customers access to liquidity through the commercial paper market.
Rabobank provides advice and manages the programme, markets ABCP, provides cash facilities and/or credit
risk enhancements and other facilities for the underlying transactions and the programme itself.
Rabobank consolidates the own-asset securitisation vehicles and Nieuw Amsterdam because it is exposed to
or entitled to fluctuating income in respect of its involvement in these entities. In addition, Rabobank also has
the option to influence the amount of the investor’s income by virtue of having control over the entities.

96 Consolidated Financial Statements 2014 Rabobank Group
Non-consolidated structure entitiesNon-consolidated structured entities refers to all structured entities over which Rabobank has no control.
These interests are comprised mainly of debt securities in a securitisation vehicle, including RMBS, ABS and
CDO and private equity interests. The amount of these debt securities is almost always limited compared with
the vehicle’s total assets.
The table below shows the nature and risks of Rabobank’s interests in non-consolidated structured entities.
The maximum exposure to loss in respect of the interests of non-consolidated structured entities also
includes off-balance-sheet liabilities.
Nature and risks of interests in non-consolidated structured entities*
In millions of euros Securitisations Other Total
At 31 December 2014
Assets recognised by Rabobank
Financial assets held for trading 30 107 137
Financial assets at fair value through profit and loss 377 45 422
Derivatives 622 - 622
Loans to customers 1,363 - 1,363
Financial assets available for sale 772 75 797
Investments in associates - 600 600
Total financial assets recognised by Rabobank 3,114 827 3,941
Liabilities recognised by Rabobank
Derivatives 86 - 86
Due to customers 610 - 610
Total liabilities recognised by Rabobank 696 - 696
* The maximum exposure to loss in respect of the interests in non-consolidated structured entities is 4,153.
Sponsored, non-consolidated structured entities in which Rabobank holds no interest
In millions of eurosCommission
income Other income Total income
Carrying amount of transferred
assets
At 31 December 2014
Securitisations 3 38 41 -
Asset management - 35 35 -
Other 137 - 137 -
Total 140 73 213 -
52 Events after the reporting date
No events occurred following the reporting date that provide additional information on the actual situation
on the reporting date.
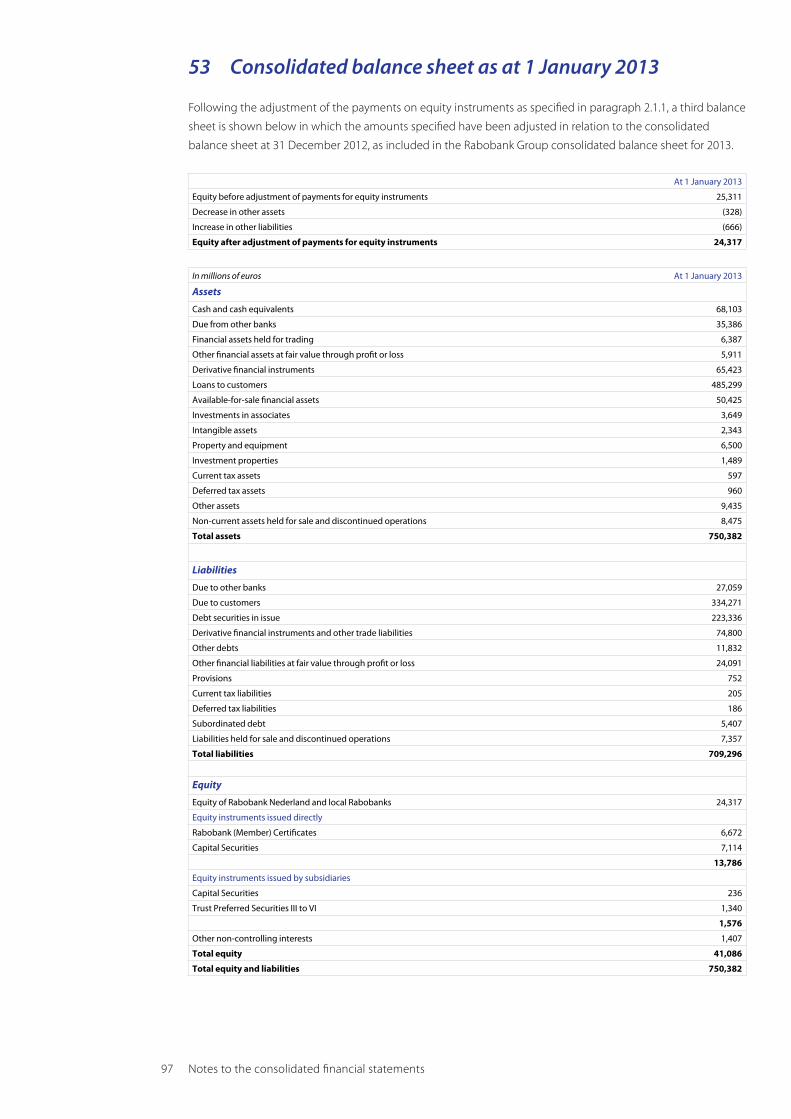
97 Notes to the consolidated financial statements
53 Consolidated balance sheet as at 1 January 2013
Following the adjustment of the payments on equity instruments as specified in paragraph 2.1.1, a third balance
sheet is shown below in which the amounts specified have been adjusted in relation to the consolidated
balance sheet at 31 December 2012, as included in the Rabobank Group consolidated balance sheet for 2013.
At 1 January 2013
Equity before adjustment of payments for equity instruments 25,311
Decrease in other assets (328)
Increase in other liabilities (666)
Equity after adjustment of payments for equity instruments 24,317
In millions of euros At 1 January 2013
Assets
Cash and cash equivalents 68,103
Due from other banks 35,386
Financial assets held for trading 6,387
Other financial assets at fair value through profit or loss 5,911
Derivative financial instruments 65,423
Loans to customers 485,299
Available-for-sale financial assets 50,425
Investments in associates 3,649
Intangible assets 2,343
Property and equipment 6,500
Investment properties 1,489
Current tax assets 597
Deferred tax assets 960
Other assets 9,435
Non-current assets held for sale and discontinued operations 8,475
Total assets 750,382
Liabilities
Due to other banks 27,059
Due to customers 334,271
Debt securities in issue 223,336
Derivative financial instruments and other trade liabilities 74,800
Other debts 11,832
Other financial liabilities at fair value through profit or loss 24,091
Provisions 752
Current tax liabilities 205
Deferred tax liabilities 186
Subordinated debt 5,407
Liabilities held for sale and discontinued operations 7,357
Total liabilities 709,296
Equity
Equity of Rabobank Nederland and local Rabobanks 24,317
Equity instruments issued directly
Rabobank (Member) Certificates 6,672
Capital Securities 7,114
13,786
Equity instruments issued by subsidiaries
Capital Securities 236
Trust Preferred Securities III to VI 1,340
1,576
Other non-controlling interests 1,407
Total equity 41,086
Total equity and liabilities 750,382

98 Consolidated Financial Statements 2014 Rabobank Group
54 Management’s report on internal control over financial reporting
The management of Coöperatieve Centrale Raiffeisen-Boerenleenbank B.A. (Rabobank Nederland) is
responsible for establishing and maintaining adequate internal control over financial reporting.
Management is also responsible for the preparation and fair presentation of the consolidated financial
statements.
Rabobank Nederland’s internal control over financial reporting is a process designed to provide reasonable
assurance regarding the reliability of financial reporting and the preparation and fair presentation of financial
statements for external purposes in accordance with International Financial Reporting Standards as adopted
by the European Union.
All internal control systems, no matter how well designed, have inherent limitations. Because of its inherent
limitations, internal control over financial reporting may not prevent or detect misstatements.
Also, projections of any evaluation of effectiveness to future periods are subject to the risk that control
measures may become inadequate, because of changes in conditions, or that the degree of compliance with
the policies or procedures may deteriorate.
Management assessed the effectiveness of Rabobank Nederland’s internal control over financial reporting as
of 31 December 2014 based on the framework 2013 set forth by the Committee of Sponsoring Organisations
of the Treadway Commission (COSO) established in Internal Control - Integrated Framework. Based on that
assessment, management concluded that, as of 31 December 2014, Rabobank Nederland’s internal control
over financial reporting is effective based on the criteria established by COSO.
Ernst & Young Accountants LLP, which has audited the consolidated financial statements of Rabobank
Nederland for the financial year ended 31 December 2014, also examined management’s assessment of
the effectiveness of Rabobank Nederland’s internal control over financial reporting; its report is included
on page 105.
W. Draijer A. Bruggink

99 Notes to the consolidated financial statements
55 Approval of Supervisory Board
The publication of these financial statements was approved by the Supervisory Board on 31 March 2015.
They will be submitted to the General Meeting for adoption in June 2014. Rabobank Nederland’s Articles of
Association provide as follows with regard to adoption of the financial statements: ‘The Annual General Meeting’s
resolution to adopt the financial statements shall be passed by an absolute majority of the votes validly cast’.
Executive BoardW. Draijer, Chairman
A. Bruggink, CFRO
R.J. Dekker
B.J. Marttin
H. Nagel
J.L. van Nieuwenhuizen
Supervisory BoardW. Dekker, Chairman
R. Teerlink, Deputy Chairman
C.P. Veerman, Deputy Chairman
Ms I.P. Asscher-Vonk, Secretary
C.H. van Dalen
L.N. Degle
S.L.J. Graafsma
A.A.J.M. Kamp
E.A.J. van de Merwe

100 Consolidated Financial Statements 2014 Rabobank Group
To: The General Meeting of Coöperatieve Centrale Raiffeisen-Boerenleenbank B.A.
Report on the audit of the consolidated financial statements 2014Our opinionWe have audited the consolidated financial statements 2014 which are part of the financial statements of
Coöperatieve Centrale Raiffeisen-Boerenleenbank B.A. (hereafter: ‘Rabobank’), based in Amsterdam.
In our opinion, the consolidated financial statements give a true and fair view of the financial position of
Rabobank as at December 31, 2014 and of its result and its cash flows for 2014 in accordance with
International Financial Reporting Standards as adopted by the European Union and with Part 9 of Book 2
of the Dutch Civil Code.
The consolidated financial statements comprise:
1 the consolidated statement of financial position as at December 31, 2014;
2 the following statements for 2014: consolidated statements of income and comprehensive income,
changes in equity and cash flows; and
3 the notes comprising a summary of the significant accounting policies and other explanatory information.
Basis for our opinionWe conducted our audit in accordance with Dutch law, including the Dutch Standards on Auditing.
Our responsibilities under those standards are further described in the ‘Our responsibilities for the audit of
the consolidated financial statements’ section of our report.
We are independent of Rabobank in accordance with the Verordening inzake de onafhankelijkheid van
accountants bij assurance-opdrachten (ViO) and other relevant independence regulations in the Netherlands.
Furthermore, we have complied with the Verordening gedrags- en beroepsregels accountants (VGBA).
We believe that the audit evidence we have obtained is sufficient and appropriate to provide a basis for our
opinion.
MaterialityMisstatements can arise from fraud or error and are considered material if, individually or in the aggregate,
they could reasonably be expected to influence the economic decisions of users taken on the basis of these
consolidated financial statements. The materiality affects the nature, timing and extent of our audit procedures
and the evaluation of the effect of identified misstatements on our opinion.
Based on our professional judgment we determined the materiality for the financial statements as a whole at
EUR 85 million. The materiality is based on 5% of operating profit before tax. We have also taken into account
misstatements and/or possible misstatements that in our opinion are material for the users of the consolidated
financial statements for qualitative reasons.
We agreed with the Supervisory Board that misstatements in earnings in excess of EUR 5 million, which are
identified during the audit, would be reported to them, as well as smaller misstatements that in our view
must be reported on qualitative grounds.
Independent auditor’s report

101 Independent auditor’s report
Scope of the group auditRabobank is for financial reporting purposes head of a group of entities. The financial information of this
group is included in the consolidated financial statements of Rabobank.
Because we are ultimately responsible for the opinion, we are also responsible for directing, supervising and
performing the group audit. In this respect we have determined the nature and extent of the audit procedures
to be carried out for group entities. Decisive were the size and / or the risk profile of the group entities or
operations. On this basis, we selected group entities for which an audit or review had to be carried out on the
complete set of financial information or specific items.
Our group audit mainly focused on significant group entities and associates in retail banking and wholesale
banking globally as well as on leasing, real estate and insurance activities. We have:
• performed audit procedures ourselves at the group entities in scope;
• used the work of other EY auditors when auditing entities outside the Netherlands, as well as the audit of
the real estate activities;
• used the work of other non-EY auditors when auditing the entities in Ireland, as well as the audit of the
leasing and insurance activities;
• performed review procedures or specific audit procedures at the other group entities in scope.
All these entities represented 96% of the consolidated pre-tax income and 96% of total assets. This provided
us with the evidence we needed for our opinion on the financial statements as a whole. The remaining
entities were considered to be immaterial.
By performing the procedures mentioned above at group entities, together with additional procedures at
group level, we have been able to obtain sufficient and appropriate audit evidence about the group’s financial
information to provide an opinion about the consolidated financial statements.
Our key audit matters Key audit matters are those matters that, in our professional judgment, were of most significance in our audit
of the consolidated financial statements. We have communicated the key audit matters to the Supervisory
Board. The key audit matters are not a comprehensive reflection of all matters discussed.
These matters were addressed in the context of our audit of the consolidated financial statements as a whole
and in forming our opinion thereon, and we do not provide a separate opinion on these matters.
Valuation of financial assets at amortized costs
Despite signs of economic recovery, the impact of the economic conditions of the last few years on the default
risk and the cost of credit losses are still high, especially in the Netherlands. In addition, the economic conditions
and the technological developments influence the need for office and retail space (commercial real estate),
resulting in increased vacancy and/or lower rental rates. Reference is made to note 4.4 in the financial
statements. The assessment processes of credit risks and the valuation of commercial real estate are complex,
include subjective elements and are based on assumptions that may come out differently than expected.
During our audit, extra attention was paid to the assessment of credit risks and the valuation of commercial
real estate. Additionally, the results and insights of the Asset Quality Review conducted by the ECB were
incorporated in our audit procedures. During our audit of the loan loss provisions and the valuation of
commercial real estate, we primarily assessed the judgments made related to the ability of the debtor to fulfil
the contractual obligations arising out of the financing agreement. If this is questionable or if shortages are
expected, judgment is made whether the value of the collateral, such as commercial real estate, can cover any
shortfalls. For commercial real estate positions, including development and land positions, we primarily
assessed the judgments made related to the value of the commercial real estate itself. The loan strategy of the

102 Consolidated Financial Statements 2014 Rabobank Group
bank is an important aspect in making the assessments of credit risks or the valuation of commercial real
estate. Our audit work included investigating the expectations and assumptions about future cash flows,
which also makes use of external data, such as accounts of debtors and valuation reports of properties.
Valuation of financial assets and liabilities at fair value
Fair value measurement and associated valuation adjustments can be a subjective area and more so for so
called areas of ‘level 3’ model based valuation or markets with weak liquidity and low frequently price
discovery. Market conditions can also be volatile due to current uncertainty and market practice continues to
evolve both in terms of quantitative adjustments and the operational suite of controls necessary to support
the valuation process. Valuation techniques can be subjective in nature and involve various assumptions
regarding pricing factors. The use of different valuation techniques and assumptions could produce
significantly different estimates of fair value. Associated risk management disclosure is complex and
dependent on quality data.
We assessed the design and operating effectiveness of the internal controls over valuation and performed
independently price verification and model approval. We performed additional procedures for areas of higher
risk and estimation with the assistance of our valuation specialists. This included, where relevant, comparison
of judgments made to current and emerging market practice and reperformance of valuations on a sample
basis. We also assessed the impact of other sources of fair value information including gains or losses on
disposal. Finally, we assessed the design and operating effectiveness of the controls over related disclosures
including the disclosure of valuation sensitivity and fair value hierarchy. Reference is made to note 4.9 in the
financial statements.
Organisational changes
During 2014, several organizational changes were made concerning the sale or downsizing of activities
and assets on the one hand and the changes in the internal structures with the integration of Rabobank
International and Rabobank Netherlands, the restructuring of the local Rabobanks on the other hand and
the recent announcement of the changes regarding FGH Bank. These changes impact the internal control
organization of the bank, presentation of discontinued activities in the financial statements and impact the
result due to restructuring provisions and transaction results. Reference is made to note 5 and 23 in the
financial statements.
Our audit work included the assessment and testing of the impact of these changes on the internal
organizational structure and effectiveness of the internal controls to conclude to which extent we can make
use of these internal controls. We have also assessed the impact of these changes on the external reporting
including the necessary restructuring provisions in accordance with IFRS.
Reliability and continuity of electronic data processing
Rabobank Group is strongly dependent on the IT-infrastructure for the continuity of their business processes.
In the last few years, Rabobank Group invested in the improvement of IT-hardware, systems and processes,
focused on the increased effectiveness of the IT-infrastructure and the reliability and continuity of electronic
data processing.
We assessed the reliability and continuity of electronic data processing only to the extent necessary within
the scope of the audit of the financial statements. Our work consisted of assessing the developments in the
IT infrastructure and analyzing the impact on the internal control organization. Additionally, we tested the
design and operating effectives of relevant internal controls related to IT systems and processes.

103 Independent auditor’s report
Consolidated financial statements as part of the (complete) financial statements The (complete) financial statements of Rabobank 2014 include the ‘Consolidated financial statement 2014
Rabobank Group’ and the ‘Financial statements 2014 Rabobank Nederland’. For a proper understanding of the
financial position and result the consolidated financial statements must be considered in connection with the
company financial statements. On 31 March 2015 we issued a separate auditor’s report on the company
financial statements.
Responsibilities of management and the Supervisory Board for the consolidated financial statements Management is responsible for the preparation and fair presentation of the consolidated financial statements
in accordance with EU-IFRS and Part 9 of Book 2 of the Dutch Civil Code, and for the preparation of the
management board report in accordance with Part 9 of Book 2 of the Dutch Civil Code. Furthermore,
management is responsible for such internal control as management determines is necessary to enable the
preparation of the consolidated financial statements that are free from material misstatement, whether due to
fraud or error.
As part of the preparation of the consolidated financial statements, management is responsible for assessing
Rabobank’s ability to continue as a going concern. Based on the financial reporting frameworks mentioned,
management should prepare the consolidated financial statements using the going concern basis of
accounting unless there is the intend either to liquidate Rabobank or to cease operations, or has no realistic
alternative but to do so. Management should disclose events and circumstances that may cast significant
doubt on Rabobank’s ability to continue as a going concern in the consolidated financial statements.
The Supervisory Board is responsible for overseeing Rabobank’s financial reporting process.
Our responsibilities for the audit of the consolidated financial statementsOur objective is to plan and perform the audit assignment in a manner that allows us to obtain sufficient and
appropriate audit evidence for our opinion.
Our audit has been performed with a high, but not absolute, level of assurance, which means we may not
have detected all errors and fraud.
We have exercised professional judgment and have maintained professional skepticism throughout the audit,
in accordance with Dutch Standards on Auditing, ethical requirements and independence requirements.
Our audit included e.g.:
• Identifying and assessing the risks of material misstatement of the consolidated financial statements,
whether due to fraud or error, designing and performing audit procedures responsive to those risks, and
obtaining audit evidence that is sufficient and appropriate to provide a basis for our opinion. The risk of not
detecting a material misstatement resulting from fraud is higher than for one resulting from error, as fraud
may involve collusion, forgery, intentional omissions, misrepresentations, or the override of internal control.
• Obtaining an understanding of internal control relevant to the audit in order to design audit procedures
that are appropriate in the circumstances, but not for the purpose of expressing an opinion on the
effectiveness of Rabobank’s internal control.
• Evaluating the appropriateness of accounting policies used and the reasonableness of accounting
estimates and related disclosures made by management.
• Concluding on the appropriateness of management’s use of the going concern basis of accounting and
based on the audit evidence obtained, whether a material uncertainty exists related to events or conditions
that may cast significant doubt on Rabobank’s ability to continue as a going concern. If we conclude that a
material uncertainty exists, we are required to draw attention in our auditor’s report to the related
disclosures in the consolidated financial statements or, if such disclosures are inadequate, to modify our
opinion. Our conclusions are based on the audit evidence obtained up to the date of our auditor’s report.
However, future events or conditions may cause Rabobank ceasing to continue as a going concern.

104 Consolidated Financial Statements 2014 Rabobank Group
• Evaluating the overall presentation, structure and content of the financial statements, including the
disclosures; and
• Evaluating whether the consolidated financial statements represent the underlying transactions and events
in a manner that achieves fair presentation.
We communicate with the Supervisory Board regarding, among other matters, the planned scope and timing
of the audit and significant audit findings, including any significant findings in internal control that we identify
during our audit.
We provide the Supervisory Board with a statement that we have complied with relevant ethical requirements
regarding independence, and to communicate with them all relationships and other matters that may
reasonably be thought to bear on our independence, and where applicable, related safeguards.
From the matters communicated with the Supervisory Board, we determine those matters that were of most
significance in the audit of the consolidated financial statements of the current period and are therefore the
key audit matters. We describe these matters in our auditor’s report unless law or regulation precludes public
disclosure about the matter or when, in extremely rare circumstances, when not communicating the matter is
in the public interest.
Report on other legal and regulatory requirementsReport on the management board report and the other information
Pursuant to legal requirements of Part 9 of Book 2 of the Dutch Civil Code (concerning our obligation to
report about the management board report and other information):
• We have no deficiencies to report as a result of our examination whether the management board report, to
the extent we can assess, has been prepared in accordance with Part 9 of Book 2 of the Dutch Civil Code,
and whether the information as required by Part 9 of Book 2 of the Dutch Civil Code has been annexed.
• We report that the management board report, to the extent we can assess, is consistent with the financial
statements.
Engagement
We were engaged as auditor of Coöperatieve Centrale Raiffeisen-Boerenleenbank B.A. as of the audit for the
year 1972 and have operated as statutory auditor ever since that date.
Amsterdam, 31 March 2015
Ernst & Young Accountants LLP
/s/ C.B. Boogaart

105 Independent auditor’s Assurance report
To the executive board and supervisory board of Coöperatieve Centrale Raiffeisen-Boerenleenbank B.A.
ScopeWe have performed an assurance engagement on the effectiveness of internal control over the consolidated
financial reporting of Coöperatieve Centrale Raiffeisen-Boerenleenbank B.A. (hereafter: ‘Rabobank’) as at
31 December 2014.
A company’s internal control over financial reporting is a process designed to provide reasonable assurance
regarding the reliability of financial reporting and the preparation of consolidated financial statements in
accordance with generally accepted accounting policies. A company’s internal control over financial reporting
includes those policies and procedures that:
1 pertain to the maintenance of records that, in reasonable detail, accurately and fairly reflect the transactions
and dispositions of the assets of the company;
2 provide reasonable assurance that transactions are recorded as necessary to permit preparation of
consolidated financial statements in accordance with International Financial Reporting Standards as
adopted in the European Union and by Part 9 of Book 2 of the Dutch Civil Code, and that receipts and
expenditures of the company are being made only in accordance with authorisations of management of
the company; and
3 provide reasonable assurance regarding prevention or timely detection of unauthorised acquisition, use, or
disposition of the company’s assets that could have a material effect on the consolidated financial
statements.
Executive Board’s responsibilityThe Executive Board of Rabobank is responsible for maintaining effective internal control over financial
reporting and for its assessment of the effectiveness of internal control over financial reporting.
The statement of the Executive Board regarding its assessment of the effectiveness of internal control over
financial reporting is included on page 98.
Auditor’s responsibilityOur responsibility is to conclude on the effectiveness of Rabobank’s internal control over the consolidated
financial reporting as at 31 December 2014, based on the procedures performed during our assurance
engagement. We conducted our assurance engagement in accordance with Dutch law, including ISAE 3000
‘Assurance engagements other than audits or reviews of historical financial information’ based on criteria
established in ‘Internal Control – Integrated Framework’, issued by the Committee of Sponsoring
Organisations of the Treadway Commission (‘2013 framework’),(‘the COSO criteria’).This requires that we
comply with ethical requirements and plan and perform the assurance engagement to obtain reasonable
assurance about whether effective internal control over financial reporting was maintained in all material
respects. Our assurance engagement included obtaining an understanding of internal control over financial
reporting, evaluating the assessment of Rabobank’s Executive Board, testing and evaluate the design and
operating effectiveness of internal control, and performing such other procedures as we considered necessary
in the circumstances. We believe that the evidence we have obtained is sufficient and appropriate to provide
a basis for our opinion.
Independent auditor’s Assurance report

106 Consolidated Financial Statements 2014 Rabobank Group
Inherent limitationsBecause of its inherent limitations, internal control over financial reporting may not prevent or detect all
misstatements or omissions. Also, projections of any evaluation of effectiveness to future periods are subject
to the risk that controls may become inadequate because of changes in conditions, or that the degree of
compliance with the policies or procedures may deteriorate.
OpinionOur opinion is formed based on the matters as explained in this assurance report.
In our opinion the internal control over the consolidated financial reporting as at 31 December 2014 by
Rabobank is in all material respects effective in accordance with the COSO criteria.
Amsterdam, 31 March 2015
Ernst & Young Accountants LLP
/s/ C.B. Boogaart

107 Independent auditor’s Assurance report
Colophon
Published byRabobank
Communications & Corporate Affairs department
DisclaimerThese Consolidated Financial Statements are a translation of the Dutch Consolidated Financial Statements.
In the event of any conflict in interpretation, the Dutch original takes precedence.
About the Consolidated Financial Statements 2014 Rabobank GroupThe Coöperatieve Centrale Raiffeisen-Boerenleenbank B.A. publishes the Annual Report 2014 Rabobank
Group, the Consolidated Financial Statements 2014 Rabobank Group, the Financial Statements 2014
Rabobank Nederland and the Capital Adequacy and Risk Management Report (Pillar 3) on 31 March 2015.
These reports will be available online from 31 March 2015 at www.rabobank.com. The printed version of the
annual report and the financial statements 2014 will be available from 13 April 2015.
The Consolidated Financial Statements 2014 Rabobank Group, the Financial Statements 2014 Rabobank
Nederland, the Annual Report 2014 Rabobank Group and other information have been/will be filed at the
offices of the Trade Registry under number 30.046.259 after the adoption by the Annual General Meeting on
18 June 2015.
An independent auditor’s report as referred to in Section 393, paragraph 5 of Book 2 of the Dutch Civil Code
has been issued for the financial statements of Rabobank Nederland. This report has been issued in the form
of an unqualified opinion. In its report, the external auditor has not emphasised any specific matters.
Annual ReportingIn 2015, Rabobank publishes the following annual reporting documents:
• Annual Summary 2014 Rabobank Group - Jaarbericht 2014 Rabobank Groep
• Annual Report 2014 Rabobank Group - Jaarverslag 2014 Rabobank Groep
• Consolidated Financial Statements 2014 Rabobank Group - Geconsolideerde jaarrekening 2014
Rabobank Groep
• Financial Statements 2014 Rabobank Nederland - Jaarrekening 2014 Rabobank Nederland
• Capital Adequacy and Risk Management Report 2014 (Pillar 3)
• Interim Report 2015 Rabobank Group - Halfjaarverslag 2015 Rabobank Groep
In the event of differences in content between the online version and the printed version, the
content of the online version shall always prevail.
Materials usedRabobank uses environmentally-friendly materials when printing this document.

108 Consolidated Financial Statements 2014 Rabobank Group
ContactRabobank has exercised the utmost care in compiling the information contained in these Consolidated
Financial Statements. If you have any questions or wish to suggest any improvements to our reporting,
please contact us at [email protected].
Coöperatieve Centrale Raiffeisen-Boerenleenbank B.A. (Rabobank Nederland)Croeselaan 18, P.O. Box 17100, 3500 HG Utrecht, The Netherlands
+31 30 216 0000.
29 a
pril
2015
- 11
:15

Consolidated Financial Statements 2014 Rabobank GroupMarch 2015www.rabobank.com/annualreports
Rabobank Group
Consolidated Financial Statements 2014