consolidated financial results for the quarterly period ended … · 2021. 3. 19. · and 31st...
TRANSCRIPT

– 1 –
This financial report is composed of two parts. The first part is an abridged translation of “Kessan Tanshin (earnings report)” for the quarterly period ended 31st December, 2015, which includes the summary and the qualitative information sections. The second part is the “Quarterly Consolidated Financial Statements,” which are basically prepared based on the “Kessan Tanshin (earnings report)” but applied for some items different presentation methods.
28th January, 2016
Consolidated Financial Results For the Quarterly Period Ended 31st December, 2015
<under Japanese GAAP> Company name: Nomura Research Institute, Ltd. Listing: First Section of the Tokyo Stock Exchange Stock code: 4307 URL: http://www.nri.com/jp/ Representative: Tadashi Shimamoto, Chairman and President & CEO, Representative Director,
Member of the Board Inquiries: Norihiro Suzuki, General Manager, Accounting & Finance Department TEL: +81-3-5533-2111 (from overseas) Scheduled date to file Quarterly Securities Report: 2nd February, 2016 Scheduled date to commence dividend payments: – Preparation of supplementary material on quarterly consolidated financial results: Yes Announcement for quarterly consolidated financial results (for institutional investors and analysts): Yes
(Millions of yen with fractional amounts discarded, unless otherwise noted) 1. Consolidated performance for the quarterly period ended 31st December, 2015
(from 1st April, 2015 to 31st December, 2015) (1) Consolidated operating results (cumulative) (Percentages indicate year-on-year changes.)
Sales Operating profit Ordinary profit Profit attributable to owners of the parent
Quarterly period ended Millions of yen % Millions of yen % Millions of yen % Millions of yen %
31st December, 2015 313,621 4.3 43,229 16.3 45,325 18.1 31,914 (5.1)
31st December, 2014 300,782 7.6 37,176 3.2 38,369 (0.5) 33,646 39.5
Note: Comprehensive income Quarterly period ended 31st December, 2015: ¥32,496 million [(38.0)%]
Quarterly period ended 31st December, 2014: ¥52,386 million [46.1%]
Earnings per share – basic
Earnings per share – diluted
Quarterly period ended Yen Yen
31st December, 2015 141.42 141.01
31st December, 2014 153.11 152.74
Note: The Company conducted a 1-for-1.1 stock split of common shares with an effective date of 1st October, 2015. Earnings per share – basic and earnings per share – diluted have been calculated assuming the stock split was conducted at the start of the previous fiscal year.

– 2 –
(2) Consolidated financial position Total assets Net assets Equity ratio
As of Millions of yen Millions of yen %
31st December, 2015 622,067 447,063 69.6
31st March, 2015 593,213 403,467 65.6
Reference: Equity As of 31st December, 2015: ¥433,045 million As of 31st March, 2015: ¥389,422 million
2. Cash dividends Annual dividends
First quarter Second quarter Third quarter Fiscal year-end Total
Yen Yen Yen Yen YenFiscal year ended 31st March, 2015 – 30.00 – 40.00 70.00
Fiscal year ending 31st March, 2016 – 40.00 –
Fiscal year ending 31st March, 2016 (Forecasts)
40.00 –
Notes: 1. Revisions to the forecasts of cash dividends most recently announced: None 2. The Company conducted a 1-for-1.1 stock split of common shares with an effective date of 1st October, 2015.
However, dividends were not adjusted to reflect the stock split. Based on the number of shares prior to the stock split, the fiscal year-end dividend forecast for the fiscal year ending 31st March, 2016 is ¥44 per share, an effective dividend increase of ¥4 per share.
3. Forecasts of financial results for the fiscal year ending 31st March, 2016 (from 1st April, 2015 to 31st March, 2016) (Percentages indicate year-on-year changes.)
Sales Operating profit Ordinary profit Profit attributable to owners of the parent
Earnings per share – basic
Millions of yen %
Millions of yen %
Millions of yen %
Millions of yen % Yen
Fiscal year ending 31st March, 2016 425,000 4.7 58,000 12.7 60,000 13.3 41,000 5.5 181.68
Notes: 1. Revisions to the forecasts of financial results most recently announced: None 2. The Company conducted a 1-for-1.1 stock split of common shares with an effective date of 1st October, 2015. The
forecast for earnings per share – basic has been calculated based on the average number of shares during the fiscal year, assuming the stock split was conducted at the start of the current fiscal year.
* Notes (1) Changes in significant subsidiaries during the current nine months (changes in specified subsidiaries
resulting in change in scope of consolidation): Yes Newly consolidated: 1 (Company name) Brierley & Partners, Inc. (2) Adoption of specific accounting in preparing quarterly consolidated financial statements: Yes (3) Changes in accounting policies, changes in accounting estimates, and restatement of prior period
financial statements after error corrections a. Changes in accounting policies due to revisions to accounting standards and other regulations:
Yes b. Changes in accounting policies due to other reasons: None c. Changes in accounting estimates: None d. Restatement of prior period financial statements after error corrections: None

– 3 –
(4) Number of shares in issue (common stock) a. Total number of shares in issue at the end of the period (including treasury stock)
As of 31st December, 2015 247,500,000 shares As of 31st March, 2015 247,500,000 shares
b. Number of shares of treasury stock at the end of the period As of 31st December, 2015 19,840,389 shares As of 31st March, 2015 26,951,153 shares
c. Average number of shares during the period (cumulative from the beginning of the fiscal year) Quarterly period ended 31st December, 2015 225,666,483 shares Quarterly period ended 31st December, 2014 219,760,352 shares Notes: 1. The NRI shares held by the trust exclusive for NRI Group Employee Stock Ownership Group are included
in treasury stock. 2. The Company conducted a 1-for-1.1 stock split of common shares with an effective date of 1st October,
2015. Number of shares has been calculated assuming the stock split was conducted at the start of the previous fiscal year.
* Indication regarding execution of quarterly review proceduresThis quarterly consolidated financial results report is exempt from the quarterly review procedures in accordance with the Financial Instruments and Exchange Law. At the time of disclosure of this quarterly consolidated financial results report, the review procedures for quarterly financial statements in accordance with the Financial Instruments and Exchange Law are incomplete.
* Proper use of forecasts of financial results, and other special matters The above forecasts are based on information available to the Company at the present time and certain assumptions judged to be rational, and these statements do not purport to be a promise by the Company to achieve such results. Actual business results, etc. may differ significantly from this forecast due to various factors.

– 4 –
Qualitative information regarding third-quarter settlement of accounts (1) Qualitative information regarding consolidated operating results
Effective from the first quarter of the current fiscal year, the Company has applied the “Accounting Standard for Business Combinations” (ASBJ Statement No. 21, 13th September, 2013) and other related accounting standards. As a result, the item “net income” has been replaced by “profit attributable to owners of the parent.” During the nine months ended 31st December, 2015 (from 1st April, 2015 to 31st December, 2015), the Japanese economy continued to recover at a moderate pace, despite some signs of weakness against a backdrop of the slowdown in China’s economy and other such developments. Investment in information systems was firm amid signs of improvement in corporate earnings. Operating in such an environment, Nomura Research Institute (“the Company”) and its consolidated subsidiaries (“the NRI Group”) carried out its business activities leveraging the combined strengths of the NRI Group, allowing it to seamlessly provide services encompassing consulting through to system development and operations. In order to realize medium- and long-term growth, the NRI Group is also forging ahead with measures geared to expanding its presence in new business fields while developing its strengths further. Japan’s national identity number system (social security and tax number system) started operation in January 2016. The Company launched a wide range of solutions from across the NRI Group with the aim of providing a suite of services, including consulting services to support the introduction of the system and an integrated service that covers all aspects of the system, from national identity number registration to system management. The Company has also added new functionality to its multi-user services in response to the full-scale launch of the new BOJ-NET (Bank of Japan Financial Network System) and a unified tax on financial products. Going forward, the NRI Group will continue steadily responding to regulatory changes such as those involving Junior NISA (individual savings accounts for investors who are younger than 20 years old that provide tax exemptions for small-scale investments) to be launched in April 2016, in order to further expand its multi-user services business. In the overseas business, the Company provided support to Japanese companies moving into overseas markets and developed businesses geared to local governments and companies. Also, in order to expand its presence in new business fields, the Company works to forge business alliances and M&A deals with companies that have advanced technologies, experience and strong networks. In order to expand the NRI Group’s business in digital marketing, the Company acquired US firm Brierley & Partners, Inc., which became a subsidiary in the first quarter of the current fiscal year. Moreover, in the third quarter of the current fiscal year, Zhiming Software Beijing, Ltd. and other Chinese operating companies were made subsidiaries of the Company in order to strengthen its system development and maintenance framework. During the nine months ended 31st December, 2015, the NRI Group’s sales totaled ¥313,621 million (up 4.3% year on year), supported by higher sales in the Consulting, Financial IT Solutions and Industrial IT Solutions segments. Personnel expenses rose due to growth in the number of employees and an increase in bonuses, reflecting an improvement in earnings performance and other factors. However, the number of unprofitable projects declined. As a result, cost of sales was ¥214,352 million (down 0.5%) and gross profit was ¥99,268 million (up 16.2%). Selling, general and administrative expenses were ¥56,039 million (up 16.2%) due to increases in personnel expenses, costs for the acquisition of new subsidiaries and subcontracting costs related to research and development. Operating profit was ¥43,229 million (up 16.3%), the operating margin was 13.8% (up 1.4 points) and ordinary profit was ¥45,325 million (up 18.1%). Profit attributable to owners of the parent was ¥31,914 million (down 5.1%), but this decline mainly reflected the absence of a gain on investment securities booked in the same period of the previous fiscal year.

– 5 –
Segment information The business results by segment (sales include intersegment sales) are as follows. The Company partially revised its segment classifications in the third quarter of the current fiscal year, and as such the figures presented below for the corresponding period of the previous fiscal year have been recalculated to reflect the reorganization. (Consulting) This segment provides policy recommendations and strategy consulting, as well as business consulting to support operational reform and system consulting for overall IT management. The government and companies are implementing structural reforms, supporting strong demand for consulting services. The NRI Group is working to accurately address these needs in order to expand its client base, including overseas. In the nine months ended 31st December, 2015, business consulting work increased, including consulting related to the introduction of the national identity number system and system consulting work to support clients in restructuring their IT divisions. However, personnel expenses rose year on year. As a result of the above, the Consulting segment posted sales of ¥20,607 million (up 2.1% year on year) and operating profit of ¥3,424 million (down 21.1%). (Financial IT Solutions) In this segment, the main clients are in the financial sector, including the securities, insurance and banking sectors. The segment provides system consulting, system development and system management and operation services, and it provides IT solutions such as multi-user systems. Japan’s national identity number system started operation in January 2016. The Company launched a wide range of solutions from across the NRI Group with the aim of providing a suite of services, including consulting services to support the introduction of the system and an integrated service that covers all aspects of the system, from national identity number registration to system management. The Company has also added new functionality to its multi-user services in response to the full-scale launch of the new BOJ-NET and a unified tax on financial products. Going forward, the Company will continue steadily responding to regulatory changes such as those involving Junior NISA to be launched in April 2016, in order to further expand its multi-user services business. During the nine months ended 31st December, 2015, the segment posted an increase in sales, mainly from system development and application sales to securities companies, where the Company booked sales on major application sales, and system development and application sales to insurance companies. Profitability improved due to a drop in the number of unprofitable projects. As a result of the above, the Financial IT Solutions segment posted sales of ¥189,066 million (up 7.4% year on year) and operating profit of ¥21,966 million (up 37.5%). (Industrial IT Solutions) This segment provides system consulting, system development, system management and operation services, and other services to the distribution, manufacturing, service and public sectors. In this segment, the Company has been making efforts to provide IT solution proposals while working closely with the Consulting segment, which has a large number of clients in the industrial sector, to expand the client base. Also, as individual companies are finding it increasingly difficult to handle IT themselves, the Company is using its system consulting and IT solutions services to help companies restructure their IT divisions. As part of efforts to expand its business, the Company made US firm Brierley & Partners, Inc. a subsidiary in the first quarter of the current fiscal year, and established PT. Nomura Research Institute Indonesia in the second quarter of the current fiscal year. During the nine months ended 31st December, 2015, sales of the segment increased with respect to system management and operation services in the distribution sector and the manufacturing and service sectors, but system development and application sales decreased in the manufacturing and service sectors. On the cost front, personnel expenses and amortization of goodwill rose, and the Company booked costs related to the acquisition of a new subsidiary. As a result of the above, the Industrial IT Solutions segment posted sales of ¥76,584 million (up 3.2% year on year) and operating profit of ¥7,738 million (down 20.3%).

– 6 –
(IT Platform Services) This segment mainly provides services such as the management and administration of data centers and IT platform and network architecture to the Financial IT Solutions and Industrial IT Solutions segments. It also provides IT platform solutions and information security services to clients of various industries. In addition, the segment conducts research for the development of new business operations and new products related to IT solutions, and research related to leading-edge information technologies, etc. In this segment, the Company has been making efforts to expand its client base by not only renewing clients’ IT platforms, but also by proposing IT platform solutions to clients that help them improve their businesses and revenues. Moreover, in the third quarter of the current fiscal year, Zhiming Software Beijing, Ltd. and other Chinese operating companies were made subsidiaries of the Company in order to strengthen its system development and maintenance framework. During the nine months ended 31st December, 2015, sales to external clients decreased, amid a decline in system development and application sales and product sales related to IT platform architecture projects. However, profitability improved due to a drop in the number of unprofitable projects. As a result of the above, the IT Platform Services segment posted sales of ¥81,336 million (down 3.0% year on year) and operating profit of ¥8,793 million (up 78.1%). (Others) The Others segment comprises subsidiaries and others that provide system development and system management and operation services not included in the other four segments. During the nine months ended 31st December, 2015, the Others segment posted sales of ¥9,321 million (down 5.4% year on year) and an operating profit of ¥529 million (down 60.2%), reflecting the booking of impairment losses on software at subsidiaries and other factors.
(2) Qualitative information regarding consolidated financial position (Assets, liabilities and net assets) At the end of the third quarter (31st December, 2015), current assets were ¥281,606 million (down 5.7% from the end of the previous fiscal year), noncurrent assets were ¥340,461 million (up 15.5%), current liabilities were ¥96,620 million (down 14.7%), noncurrent liabilities were ¥77,728 million (up 2.3%), net assets were ¥447,063 million (up 10.8%), and total assets were ¥622,067 million (up 4.9%). The main changes from the end of the previous fiscal year are as follows. Accounts receivable declined ¥23,694 million to ¥38,587 million and other receivables increased ¥14,392 million to ¥50,985 million. The NRI Group recognizes revenues based on the percentage-of-completion method. The number of projects completed at the end of the fiscal year is comparatively large, and accordingly, compared with the end of the previous fiscal year, the ends of quarterly periods tend to have small values for accounts receivable and large values for other receivables. Construction in progress increased ¥9,407 million to ¥10,378 million due to the construction of a new data center. Goodwill increased ¥7,557 million to ¥8,593 million, reflecting the acquisition of US firm Brierley & Partners, Inc., etc., which became a subsidiary. Investment securities increased ¥14,434 million to ¥130,914 million, reflecting the purchase of securities for surplus fund management purposes. In financial operations at subsidiaries, margin transaction assets declined ¥6,376 million to ¥10,387 million, short-term loans payable decreased ¥8,375 million to ¥2,270 million and margin transaction liabilities fell ¥7,569 million to ¥4,744 million. Reflecting the disposal of treasury stock through a third-party allocation to Nippon Life Insurance Company in the first quarter of the current fiscal year, treasury stock declined ¥15,155 million to ¥42,301 million and additional paid-in capital increased ¥12,860 million to ¥27,951 million. In addition, net defined benefit asset increased ¥10,376 million to ¥45,064 million, accounts payable declined ¥5,581 million to ¥18,616 million, accrued expenses increased ¥4,675 million to ¥11,337 million, income taxes payable rose ¥8,190 million to ¥10,375 million and accrued bonuses fell ¥7,638 million to ¥8,645 million.

– 7 –
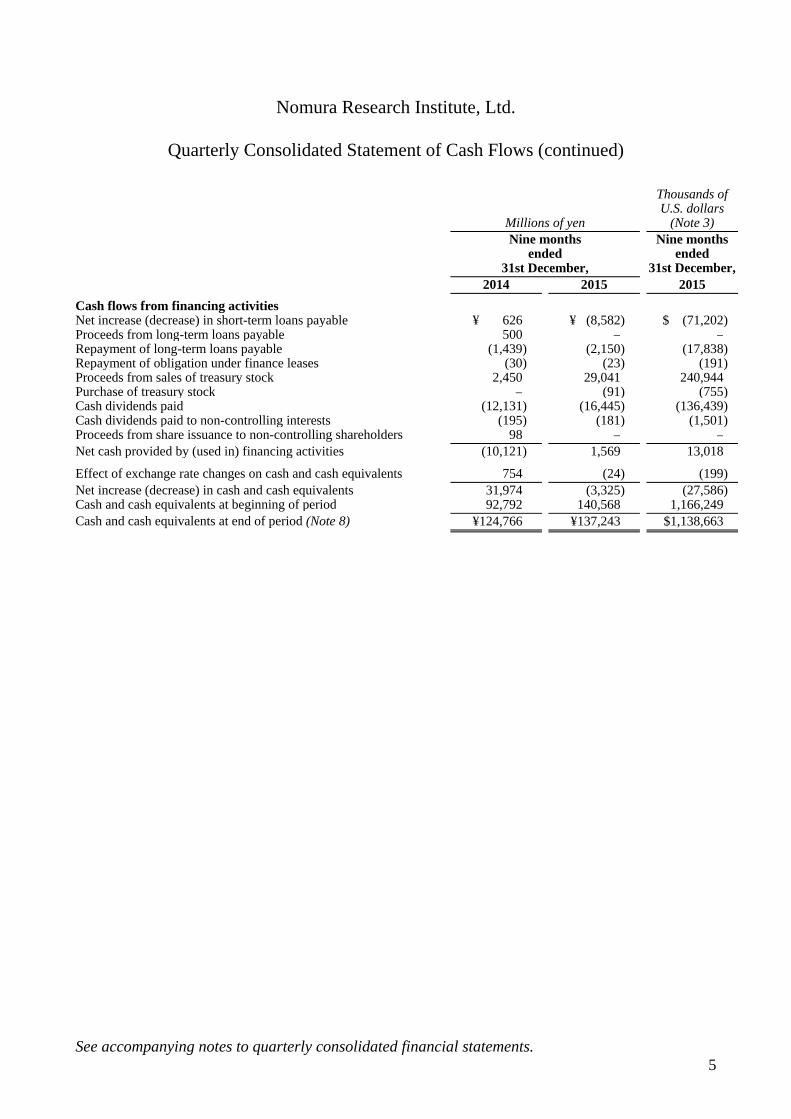
(Cash flow position) Cash and cash equivalents as of the end of the third quarter (31st December, 2015) stood at ¥137,242 million (down ¥3,325 million from the end of the previous fiscal year). Net cash provided by operating activities in the nine months ended 31st December, 2015 was ¥56,535 million, an increase of ¥13,490 million compared with the same period of the previous fiscal year. The drop in accounts receivable and other receivables was smaller than in the same period a year earlier, but income taxes paid declined substantially. Net cash used in investing activities in the nine months ended 31st December, 2015 was ¥61,405 million. In the same period of the previous fiscal year, ¥1,705 million was used in investing activities amid a situation where proceeds were gained from the sale and redemption of investment securities and also from the purchase of shares of subsidiaries resulting in a change in the scope of consolidation. In the period under review, however, net cash used for investment was ¥59,700 million higher compared with the same period of the previous fiscal year partially due to increases in funds used in purchasing securities for fund management purposes and in acquiring property and equipment due to the construction of a new data center, and also due to the use of funds for purchasing shares of subsidiaries resulting in a change in the scope of consolidation. Net cash provided by financing activities was ¥1,568 million, compared with cash used of ¥10,120 million in the same period of the previous year. There was an increase in cash used for the repayment of short-term loans payable and cash dividends paid, but this was outweighed by cash provided, including ¥26,209 million in proceeds from sales of treasury stock through a third-party allocation to Nippon Life Insurance Company.

Unless otherwise noted, the amounts included in the financial statements are expressed in millions of yen and thousands of U.S. dollars with fractional amounts rounded off.
Quarterly Consolidated Financial Statements
Nomura Research Institute, Ltd.
For the Nine-Month Period Ended 31st December, 2015 (Unaudited)

Quarterly Consolidated Financial Statements
Nomura Research Institute, Ltd.
For the Nine-Month Period Ended 31st December, 2015 (Unaudited)
Index
Page
Quarterly Consolidated Balance Sheet ............................................................................... 1
Quarterly Consolidated Statement of Income and Comprehensive Income ...................... 3
Quarterly Consolidated Statement of Cash Flows ............................................................. 4
Notes to Quarterly Consolidated Financial Statements ...................................................... 6

1
Nomura Research Institute, Ltd.
Quarterly Consolidated Balance Sheet
Millions of yen
Thousands of U.S. dollars
(Note 3) 31st March, 31st December, 31st December, 2015 2015 2015
Assets Current assets:
Cash and bank deposits (Notes 4 and 8) ¥ 26,469 ¥ 26,922 $ 223,363 Short-term investment securities (Notes 4, 5 and 8) 119,539 119,155 988,592 Accounts receivable and other receivables (Note 4) 98,875 89,573 743,159 Operating loans (Note 4) 10,770 7,240 60,068 Margin transaction assets (Note 4) 16,764 10,388 86,186 Inventories 779 1,128 9,359 Deferred income taxes 9,145 9,397 77,964 Short-term guarantee deposits (Note 4) 7,755 8,015 66,498 Other current assets 8,660 9,953 82,578 Allowance for doubtful accounts (191) (164) (1,361)
Total current assets 298,565 281,607 2,336,406 Property and equipment:
Land 7,448 7,447 61,785 Buildings, net 33,192 32,005 265,536 Machinery and equipment, net 12,293 14,964 124,151 Leased assets, net 12 6 50 Construction in progress 971 10,378 86,103
Property and equipment, net 53,916 64,800 537,625 Software and other intangibles 54,547 55,720 462,292 Goodwill 1,036 8,593 71,293 Investment securities (Notes 4 and 5) 116,481 130,915 1,086,161 Investments in affiliates (Notes 4 and 5) 2,159 2,170 18,004 Deferred income taxes 1,219 1,232 10,222 Long-term loans receivable (Note 4) 8,176 8,267 68,589 Lease investment assets 505 414 3,435 Net defined benefit asset 34,688 45,065 373,890 Other assets 22,101 23,456 194,607 Allowance for doubtful accounts (180) (171) (1,419)
Total assets ¥593,213 ¥622,068 $5,161,105

See accompanying notes to quarterly consolidated financial statements. 2
Millions of yen
Thousands of U.S. dollars
(Note 3) 31st March, 31st December, 31st December, 2015 2015 2015
Liabilities and Net Assets Current liabilities:
Accounts payable (Note 4) ¥ 24,197 ¥ 18,616 $ 154,451 Short-term loans payable (Note 4) 10,645 2,270 18,833 Current portion of long-term loans payable (Note 4) 2,148 331 2,746 Margin transaction liabilities (Note 4) 12,314 4,745 39,368 Lease obligations, current 254 243 2,016 Accrued expenses 22,947 19,983 165,793 Income taxes payable 2,186 10,376 86,086 Advance payments received 7,618 8,194 67,983 Short-term guarantee deposits received (Note 4) 8,676 9,335 77,450 Provision for loss on orders received 3,911 2,160 17,921 Other current liabilities 18,313 20,368 168,987
Total current liabilities 113,209 96,621 801,634
Bonds (Note 4) 30,000 30,000 248,901 Long-term loans payable (Note 4) 21,333 21,000 174,230 Lease obligations 290 188 1,560 Deferred income taxes 18,192 19,195 159,255 Net defined benefit liability 5,298 6,052 50,212 Asset retirement obligations 747 968 8,031 Other long-term liabilities 128 326 2,705 Reserve for financial products transaction liabilities 548 655 5,434
Net assets (Notes 7 and 9): Shareholders’ equity:
Common stock: Authorized – 825,000 thousand shares at 31st March, 2015
and 31st December, 2015 Issued – 247,500 thousand shares at 31st March, 2015
and 31st December, 2015 18,600 18,600 154,318 Additional paid-in capital 15,091 27,952 231,909 Retained earnings 352,221 367,349 3,047,782 Treasury stock, at cost:
– 26,951 thousand shares at 31st March, 2015 and 19,840 thousand shares at 31st December, 2015
(57,457)
(42,302)
(350,967)
Total shareholders’ equity 328,455 371,599 3,083,042
Accumulated other comprehensive income: Valuation difference on available-for-sale securities (Note 5) 48,915 49,094 407,318 Deferred gains or losses on hedges (Note 6) (28) (29) (241) Foreign currency translation adjustment 419 75 622 Remeasurements of defined benefit plans 11,662 12,306 102,099
Total accumulated other comprehensive income 60,968 61,446 509,798 Share subscription rights 889 893 7,409 Non-controlling interests 13,156 13,125 108,894
Total net assets 403,468 447,063 3,709,143 Total liabilities and net assets ¥593,213 ¥622,068 $5,161,105

See accompanying notes to quarterly consolidated financial statements. 3
Nomura Research Institute, Ltd.
Quarterly Consolidated Statement of Income and Comprehensive Income
Millions of yen
Thousands of U.S. dollars
(Note 3) Nine months
ended 31st December,
Nine months ended
31st December, 2014 2015 2015
Sales ¥300,783 ¥313,622 $2,602,024 Cost of sales 215,385 214,353 1,778,420
Gross profit 85,398 99,269 823,604
Selling, general and administrative expenses (Notes 10 and 11)
48,221
56,039
464,938
Operating profit 37,177 43,230 358,666
Other income (expenses): Interest and dividend income 1,293 1,874 15,548 Interest expense (101) (105) (871) Equity in earnings (losses) of affiliates (8) 83 689 Office transfer cost (170) – – Gain on investment securities 9,351 1,332 11,051 Gain on bargain purchase 3,374 – – Reversal of share-based compensation 263 9 75 Loss on step acquisitions (1,664) – – Provision of reserve for financial products transaction
liabilities (135) (108) (896) Other, net 10 243 2,015
12,213 3,328 27,611
Income before income taxes 49,390 46,558 386,277 Provision for income taxes (Note 2) 15,692 14,491 120,227
Profit ¥ 33,698 ¥ 32,067 $ 266,050
Profit attributable to owners of parent (Note 9) ¥ 33,647 ¥ 31,914 $ 264,781
Profit attributable to non-controlling interests 51 153 1,269 Other comprehensive income:
Valuation difference on available-for-sale securities 17,901 126 1,045 Deferred gains or losses on hedges (Note 6) 52 (1) (8) Foreign currency translation adjustment 1,387 (299) (2,481) Remeasurements of defined benefit plans, net of tax (469) 648 5,376 Share of other comprehensive income of affiliates (182) (45) (373)
Total other comprehensive income 18,689 429 3,559
Comprehensive income ¥ 52,387 ¥ 32,496 $ 269,609
Comprehensive income attributable to: Comprehensive income attributable to owners of parent ¥ 52,319 ¥ 32,392 $ 268,746 Comprehensive income attributable to non-controlling
interests 68 104 863

4
Nomura Research Institute, Ltd.
Quarterly Consolidated Statement of Cash Flows
Millions of yen
Thousands of U.S. dollars
(Note 3) Nine months
ended 31st December,
Nine monthsended
31st December, 2014 2015 2015
Cash flows from operating activities Income before income taxes ¥ 49,390 ¥ 46,558 $ 386,277Adjustments to reconcile income before income taxes to netcash provided by operating activities: Depreciation and amortization 19,448 23,869 198,034Interest and dividend income (1,293) (1,874) (15,548)Interest expense 101 105 871Office transfer cost 170 – –Gain on investment securities (9,351) (1,332) (11,051)Gain on bargain purchase (3,374) – –Loss on step acquisitions 1,664 – –
Changes in operating assets and liabilities: Accounts receivable and other receivables, net of advance payments received 15,909 11,374 94,367
Allowance for doubtful accounts (164) (41) (340)Accounts payable (231) (2,367) (19,638)Inventories 397 (350) (2,904)Net defined benefit asset (8,752) (9,421) (78,163)Net defined benefit liability 696 752 6,239Provision for loss on orders received 1,186 (1,751) (14,528)Operating loans 1,355 3,529 29,279Margin transaction assets (2,205) 6,376 52,900Short-term guarantee deposits (511) (260) (2,157)Margin transaction liabilities 2,771 (7,570) (62,806)Short-term guarantee deposits received 710 658 5,459Reserve for financial products transaction liabilities 134 108 896Other (2,008) (8,930) (74,090)
Subtotal 66,042 59,433 493,097Interest and dividends received 1,321 1,928 15,996Interest paid (80) (81) (672)Income taxes paid (24,237) (4,744) (39,359)Net cash provided by operating activities 43,046 56,536 469,062
Cash flows from investing activities Payments for time deposits (399) (959) (7,957)Proceeds from time deposits 638 670 5,559Purchase of short-term investment securities (4,000) (6,003) (49,805)Proceeds from sales and redemption of short-term investment securities – 3,000 24,890
Acquisition of property and equipment (7,246) (16,563) (137,418)Proceeds from sales of property and equipment 1,482 22 183Purchase of software and other intangibles (17,952) (20,081) (166,606)Proceeds from sales of software and other intangibles 4 – –Payments for asset retirement obligations (106) (25) (207)Purchase of investment securities (5,952) (27,015) (224,135)Proceeds from sales and redemption of investment securities 26,182 14,109 117,058Purchase of investments in affiliates (804) (28) (232)Purchase of shares of subsidiaries resulting in change in scopeof consolidation – (8,535) (70,812)
Proceeds from purchase of shares of subsidiaries resulting in change in scope of consolidation 6,436 – –
Other 12 2 15Net cash used in investing activities ¥ (1,705) ¥ (61,406) $ (509,467)
See accompanying notes to quarterly consolidated financial statements. 5
Nomura Research Institute, Ltd.
Quarterly Consolidated Statement of Cash Flows (continued)
Millions of yen
Thousands of U.S. dollars
(Note 3) Nine months
ended 31st December,
Nine months ended
31st December, 2014 2015 2015
Cash flows from financing activities Net increase (decrease) in short-term loans payable ¥ 626 ¥ (8,582) $ (71,202)Proceeds from long-term loans payable 500 – –Repayment of long-term loans payable (1,439) (2,150) (17,838)Repayment of obligation under finance leases (30) (23) (191)Proceeds from sales of treasury stock 2,450 29,041 240,944Purchase of treasury stock – (91) (755)Cash dividends paid (12,131) (16,445) (136,439)Cash dividends paid to non-controlling interests (195) (181) (1,501)Proceeds from share issuance to non-controlling shareholders 98 – –Net cash provided by (used in) financing activities (10,121) 1,569 13,018
Effect of exchange rate changes on cash and cash equivalents 754 (24) (199) Net increase (decrease) in cash and cash equivalents 31,974 (3,325) (27,586)Cash and cash equivalents at beginning of period 92,792 140,568 1,166,249Cash and cash equivalents at end of period (Note 8) ¥124,766 ¥137,243 $1,138,663
6
Nomura Research Institute, Ltd.
Notes to Quarterly Consolidated Financial Statements
31st December, 2015 1. Description of Business, Basis of Presentation, Accounting Change and Additional
Information Description of Business The NRI Group (Nomura Research Institute, Ltd. (the “Company”) and its 40 consolidated subsidiaries) and its affiliates (4 companies) engage in the following four business services: “consulting services,” comprised of research, management consulting and system consulting; “system development & application sales,” comprised of system development and the sales of package software products; “system management & operation services,” comprised of outsourcing services, multi-user system services, and information services; and “product sales.” Information on the NRI Group’s operations by segment is included in Note 13. During the quarterly period ended 30th June, 2015, the NRI Group acquired shares of Brierley & Partners, Inc. As a result, Brierley & Partners, Inc. and one other company are newly included in the scope of consolidation. During the quarterly period ended 30th September, 2015, the Company established two companies and acquired shares of one company. As a result, these three companies are newly included in the scope of consolidation. During the quarterly period ended 31st December, 2015, the Company acquired shares of seven companies. As a result, these seven companies are newly included in the scope of consolidation.
Basis of Presentation The accompanying quarterly consolidated financial statements of the NRI Group are prepared on the basis of accounting principles generally accepted in Japan, which are different in certain respects as to the application and disclosure requirements of International Financial Reporting Standards, and are compiled from the consolidated financial statements prepared by the Company as required by the Financial Instruments and Exchange Law. In addition, the notes to the quarterly consolidated financial statements include information which is not required under accounting principles generally accepted in Japan but is presented herein as additional information. Certain reclassifications have been made to present the accompanying quarterly consolidated financial statements in a format which is familiar to readers outside Japan.
7
1. Description of Business, Basis of Presentation, Accounting Change and Additional Information (continued)
Accounting Change The NRI Group has applied “Revised Accounting Standard for Business Combinations” (Accounting Standards Board of Japan (ASBJ) Statement No. 21 issued on 13th September, 2013), “Revised Accounting Standard for Consolidated Financial Statements” (ASBJ Statement No. 22 issued on 13th September, 2013) and “Revised Accounting Standard for Business Divestitures” (ASBJ Statement No. 7 issued on 13th September, 2013) and others from the quarterly period ended 30th June, 2015. As a result, any difference arising from changes in the Company’s ownership interest in a subsidiary when the Company retains control over the subsidiary is recognized in capital surplus, and acquisition related costs are expensed in the year in which the costs are incurred. In addition, for business combinations conducted from the beginning of the quarterly period ended 30th June, 2015, any adjustment to acquisition cost allocation arising from the finalization of provisional accounting treatment is reflected in the quarterly consolidated financial statements for the period in which the business combination occurs. Furthermore, the presentation method of net income was amended and the name “minority interests” was changed to “non-controlling interests.” To reflect these changes in presentation, certain amounts have been reclassified in the quarterly consolidated financial statements for the nine-month period ended 31st December, 2014 and the consolidated financial statements for the year ended 31st March, 2015. For the application of these accounting standards, the NRI Group adopted the transitional provisions in paragraph 58-2 (3) of the Revised Accounting Standard for Business Combinations, paragraph 44-5 (3) of the Revised Accounting Standard for Consolidated Financial Statements and paragraph 57-4 (3) of the Revised Accounting Standard for Business Divestitures, and the cumulative effects as of the beginning of the quarterly period ended 30th June, 2015 arising from the retrospective application of the new accounting policies were recognized as adjustments to capital surplus and retained earnings in the quarterly consolidated financial statements. The impact on the quarterly consolidated financial statements as of the beginning of the quarterly period ended 30th June, 2015 as a result of these changes was immaterial. Additional Information
(Transactions of Delivering the Company’s Own Stock to Employees etc. through Trusts) The Company introduced a “Trust-type Employee Stock Ownership Incentive Plan” in March 2011. The purpose of this plan is to promote the Company’s perpetual growth by providing incentives to employees for increasing the Company’s corporate value in the mid- to long-term and to enhance benefits and the welfare of employees. This is an incentive plan under which gains from the Company’s share price appreciation are distributed to all participants in the Employee Stock Ownership Group (the “ESOP Group”). The Employee Stock Ownership Trust (the “ESOP Trust”) was established exclusively for the ESOP Group to carry out this plan. The ESOP Trust acquired the number of the Company’s shares, which the ESOP Group would have acquired over a period of five years subsequent to the establishment of the ESOP Trust. Then, the ESOP Trust sells them to the ESOP Group each time the ESOP Group is to acquire of the Company’s shares. When the share price appreciates and earnings have accumulated in the ESOP Trust, upon its termination, a cash distribution of the funds will be made to beneficiaries. Since the Company guarantees the loans of the ESOP Trust taken out to purchase the Company’s shares, the Company is obligated to pay the remaining liabilities of the ESOP Trust under a guarantee agreement if any obligations remain unsettled upon termination of the ESOP Trust.

8
1. Description of Business, Basis of Presentation, Accounting Change and Additional Information (continued)
The Company includes the assets and liabilities of the ESOP Trust at the end of period in the accompanying quarterly consolidated balance sheet. The Company recognizes the transfer of treasury stock when the Company sells treasury stock to the ESOP Trust and records the acquisition costs of the Company’s shares that the ESOP Trust owns at the end of period in the net assets section as treasury stock. As for the earnings on stock in the ESOP Trust, the Company records them in the liabilities section as a suspense account to be settled. The Company records the losses on stock in the ESOP Trust in the assets section as a suspense account to be settled and also a provision when it is expected that the outstanding loans used to purchase shares will remain unsettled at the termination of the ESOP Trust. As of 31st March, 2015 and 31st December, 2015, ¥4,058 million (corresponding to 2,349 thousand* shares of the Company held by the ESOP Trust) and ¥3,176 million ($26,350 thousand) (corresponding to 1,839 thousand* shares of the Company held by the ESOP Trust) and the loan payable of the ESOP Trust of ¥1,815 million and ¥331 million ($2,746 thousand), respectively, are recorded in the accompanying quarterly consolidated balance sheet. * The number of shares of the Company’s common stock reflect the 1.1-for-1 stock split
effective 1st October, 2015. 2. Specific Accounting Policy Adopted in Preparing Quarterly Consolidated Financial
Statements Calculation of Tax Expense At the end of each interim period the NRI Group makes its best estimate of the effective tax rate expected to be applicable for the full fiscal year. Tax expenses for interim periods are computed multiplying income before income taxes by the aforementioned estimated annual effective tax rate for the annual period. Deferred income taxes are included in provision for income taxes in the quarterly consolidated statement of income and comprehensive income. 3. U.S. Dollar Amounts The Company maintains its books of account in yen. The U.S. dollar amounts included in the accompanying quarterly consolidated financial statements and the notes thereto represent the arithmetic results of translating yen into dollars at ¥120.53 = U.S.$1.00, the rate of exchange prevailing on 31st December, 2015. The U.S. dollar amounts are included solely for the convenience of the reader and the translation is not intended to imply that the assets and liabilities which originated in yen have been or could be readily converted, realized or settled in U.S. dollars at the above or any other rate.
9
4. Financial Instruments Fair value of financial instruments
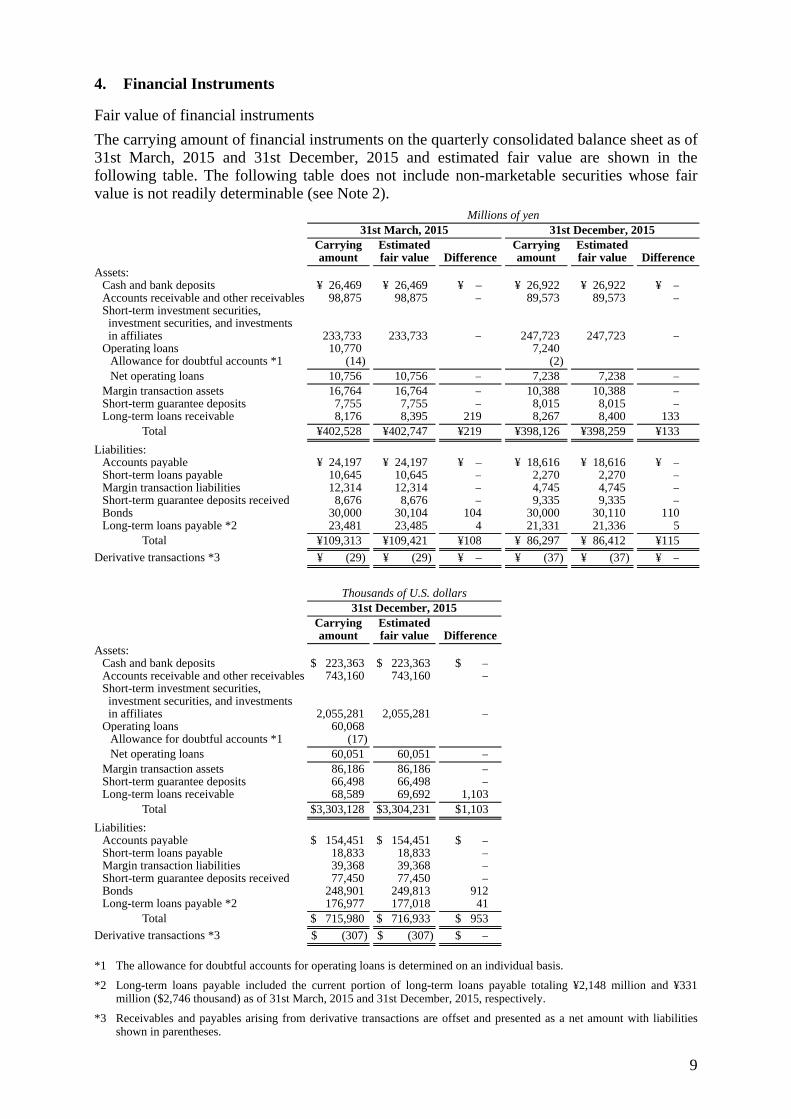
The carrying amount of financial instruments on the quarterly consolidated balance sheet as of 31st March, 2015 and 31st December, 2015 and estimated fair value are shown in the following table. The following table does not include non-marketable securities whose fair value is not readily determinable (see Note 2). Millions of yen
31st March, 2015 31st December, 2015
Carrying amount
Estimated fair value Difference
Carrying amount
Estimated fair value Difference
Assets: Cash and bank deposits ¥ 26,469 ¥ 26,469 ¥ – ¥ 26,922 ¥ 26,922 ¥ –Accounts receivable and other receivables 98,875 98,875 – 89,573 89,573 –Short-term investment securities, investment securities, and investments in affiliates 233,733 233,733 – 247,723 247,723 –
Operating loans 10,770 7,240 Allowance for doubtful accounts *1 (14) (2) Net operating loans 10,756 10,756 – 7,238 7,238 –
Margin transaction assets 16,764 16,764 – 10,388 10,388 –Short-term guarantee deposits 7,755 7,755 – 8,015 8,015 –Long-term loans receivable 8,176 8,395 219 8,267 8,400 133
Total ¥402,528 ¥402,747 ¥219 ¥398,126 ¥398,259 ¥133
Liabilities: Accounts payable ¥ 24,197 ¥ 24,197 ¥ – ¥ 18,616 ¥ 18,616 ¥ –Short-term loans payable 10,645 10,645 – 2,270 2,270 –Margin transaction liabilities 12,314 12,314 – 4,745 4,745 –Short-term guarantee deposits received 8,676 8,676 – 9,335 9,335 –Bonds 30,000 30,104 104 30,000 30,110 110Long-term loans payable *2 23,481 23,485 4 21,331 21,336 5
Total ¥109,313 ¥109,421 ¥108 ¥ 86,297 ¥ 86,412 ¥115
Derivative transactions *3 ¥ (29) ¥ (29) ¥ – ¥ (37) ¥ (37) ¥ –
Thousands of U.S. dollars
31st December, 2015
Carrying amount
Estimated fair value Difference
Assets: Cash and bank deposits $ 223,363 $ 223,363 $ –Accounts receivable and other receivables 743,160 743,160 –Short-term investment securities, investment securities, and investments in affiliates 2,055,281 2,055,281 –
Operating loans 60,068Allowance for doubtful accounts *1 (17)Net operating loans 60,051 60,051 –
Margin transaction assets 86,186 86,186 –Short-term guarantee deposits 66,498 66,498 –Long-term loans receivable 68,589 69,692 1,103
Total $3,303,128 $3,304,231 $1,103
Liabilities: Accounts payable $ 154,451 $ 154,451 $ –Short-term loans payable 18,833 18,833 –Margin transaction liabilities 39,368 39,368 –Short-term guarantee deposits received 77,450 77,450 –Bonds 248,901 249,813 912Long-term loans payable *2 176,977 177,018 41
Total $ 715,980 $ 716,933 $ 953
Derivative transactions *3 $ (307) $ (307) $ –
*1 The allowance for doubtful accounts for operating loans is determined on an individual basis.
*2 Long-term loans payable included the current portion of long-term loans payable totaling ¥2,148 million and ¥331 million ($2,746 thousand) as of 31st March, 2015 and 31st December, 2015, respectively.
*3 Receivables and payables arising from derivative transactions are offset and presented as a net amount with liabilities shown in parentheses.
10
4. Financial Instruments (continued) Fair value of financial instruments (continued) Note 1: Methods to determine the estimated fair value of financial instruments Assets
a. Cash and bank deposits and short-term guarantee deposits
Their carrying amount approximates the fair value due to the short maturity of these instruments.
b. Accounts receivable and other receivables
Their carrying amount approximates the fair value due to the generally short maturities of these instruments. For those receivables due after one year, the present value is further discounted by the rate corresponding to the credit risk and the amount is presented in the consolidated balance sheet, therefore, the carrying amount approximates fair value.
c. Short-term investment securities, investment securities and investments in affiliates
The fair value of stocks is based on quoted market prices. The fair value of bonds is based on either quoted market prices or prices provided by the financial institution making markets in these securities. The fair value of investment trusts is based on publicly available net asset values.
d. Operating loans and margin transaction assets
The fair value of these instruments, to which variable rates are applied, approximates the carrying amount because the variable rates reflect market interest rates over a short term unless the credit conditions of the counterparty change significantly after disbursement. With regard to potentially doubtful receivables, the amount of the allowance for doubtful receivables is determined based on the estimated amount collectible under collateral agreements, and their fair value approximates the carrying amount less the estimated allowance for doubtful accounts on the consolidated balance sheet.
e. Long-term loans receivable
Long-term loans receivable consists of deposits and guarantee money. The fair value of long-term receivables is based on the present value of the total future cash flows, which are the principal and the interest, discounted by the risk free rate corresponding to the time remaining until maturity.
11
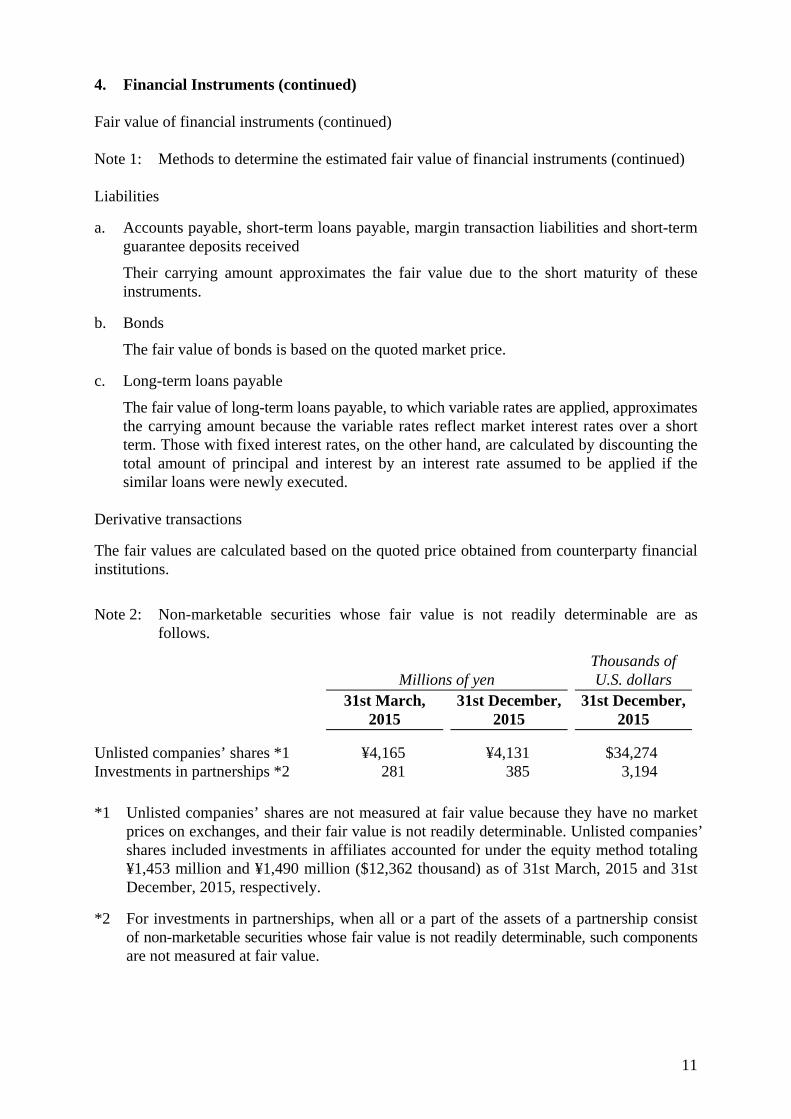
4. Financial Instruments (continued) Fair value of financial instruments (continued) Note 1: Methods to determine the estimated fair value of financial instruments (continued) Liabilities
a. Accounts payable, short-term loans payable, margin transaction liabilities and short-term guarantee deposits received
Their carrying amount approximates the fair value due to the short maturity of these instruments.
b. Bonds
The fair value of bonds is based on the quoted market price.
c. Long-term loans payable
The fair value of long-term loans payable, to which variable rates are applied, approximates the carrying amount because the variable rates reflect market interest rates over a short term. Those with fixed interest rates, on the other hand, are calculated by discounting the total amount of principal and interest by an interest rate assumed to be applied if the similar loans were newly executed.
Derivative transactions
The fair values are calculated based on the quoted price obtained from counterparty financial institutions.
Note 2: Non-marketable securities whose fair value is not readily determinable are as
follows.
Millions of yen Thousands of U.S. dollars
31st March, 2015
31st December, 2015
31st December, 2015
Unlisted companies’ shares *1 ¥4,165 ¥4,131 $34,274 Investments in partnerships *2 281 385 3,194
*1 Unlisted companies’ shares are not measured at fair value because they have no market
prices on exchanges, and their fair value is not readily determinable. Unlisted companies’ shares included investments in affiliates accounted for under the equity method totaling ¥1,453 million and ¥1,490 million ($12,362 thousand) as of 31st March, 2015 and 31st December, 2015, respectively.
*2 For investments in partnerships, when all or a part of the assets of a partnership consist of non-marketable securities whose fair value is not readily determinable, such components are not measured at fair value.
12
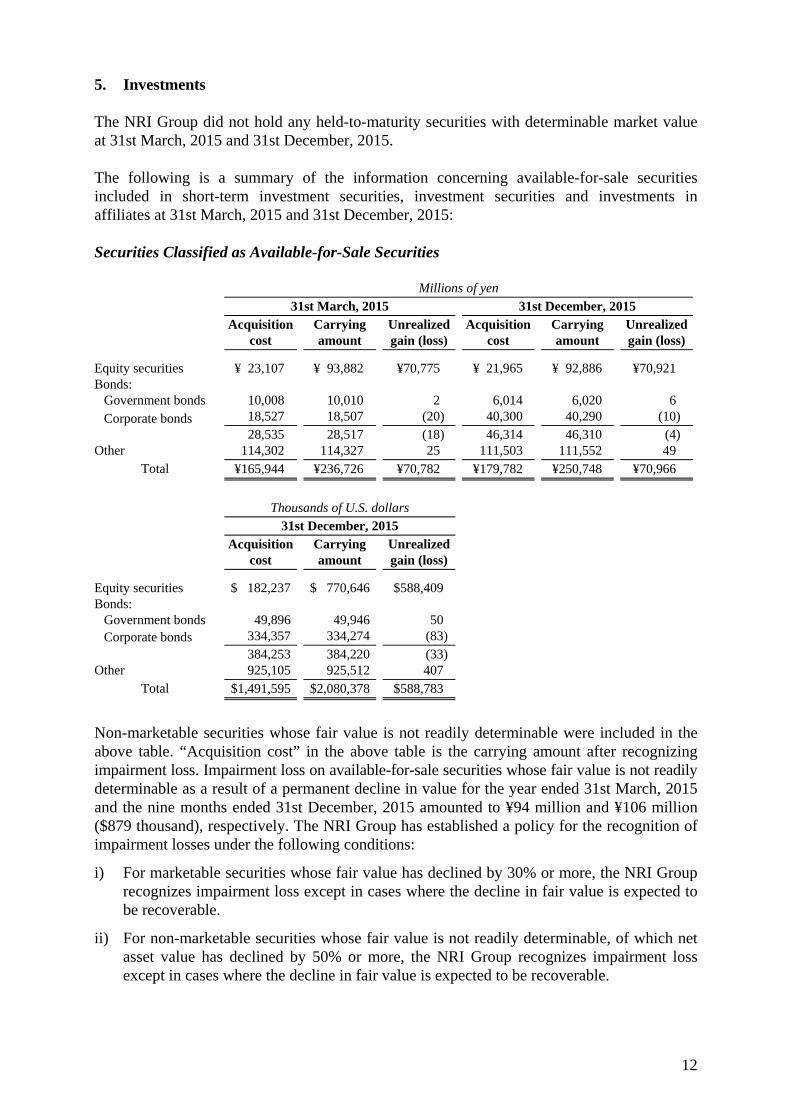
5. Investments The NRI Group did not hold any held-to-maturity securities with determinable market value at 31st March, 2015 and 31st December, 2015. The following is a summary of the information concerning available-for-sale securities included in short-term investment securities, investment securities and investments in affiliates at 31st March, 2015 and 31st December, 2015: Securities Classified as Available-for-Sale Securities Millions of yen 31st March, 2015 31st December, 2015 Acquisition
cost Carrying amount
Unrealized gain (loss)
Acquisition cost
Carrying amount
Unrealized gain (loss)
Equity securities ¥ 23,107 ¥ 93,882 ¥70,775 ¥ 21,965 ¥ 92,886 ¥70,921 Bonds:
Government bonds 10,008 10,010 2 6,014 6,020 6 Corporate bonds 18,527 18,507 (20) 40,300 40,290 (10)
28,535 28,517 (18) 46,314 46,310 (4) Other 114,302 114,327 25 111,503 111,552 49
Total ¥165,944 ¥236,726 ¥70,782 ¥179,782 ¥250,748 ¥70,966
Thousands of U.S. dollars 31st December, 2015 Acquisition
cost Carrying amount
Unrealized gain (loss)
Equity securities $ 182,237 $ 770,646 $588,409 Bonds:
Government bonds 49,896 49,946 50 Corporate bonds 334,357 334,274 (83)
384,253 384,220 (33)Other 925,105 925,512 407
Total $1,491,595 $2,080,378 $588,783
Non-marketable securities whose fair value is not readily determinable were included in the above table. “Acquisition cost” in the above table is the carrying amount after recognizing impairment loss. Impairment loss on available-for-sale securities whose fair value is not readily determinable as a result of a permanent decline in value for the year ended 31st March, 2015 and the nine months ended 31st December, 2015 amounted to ¥94 million and ¥106 million ($879 thousand), respectively. The NRI Group has established a policy for the recognition of impairment losses under the following conditions:
i) For marketable securities whose fair value has declined by 30% or more, the NRI Group recognizes impairment loss except in cases where the decline in fair value is expected to be recoverable.
ii) For non-marketable securities whose fair value is not readily determinable, of which net asset value has declined by 50% or more, the NRI Group recognizes impairment loss except in cases where the decline in fair value is expected to be recoverable.

13
6. Derivative Transactions and Hedging Activities There were no derivative transactions to which hedge accounting was not applied during the year ended 31st March, 2015 and the nine months ended 31st December, 2015. For the derivative transactions to which hedge accounting was applied as of 31st March, 2015 and 31st December, 2015, the contract amounts and estimated fair values of the hedging instruments are as follows. Millions of yen
31st March, 2015 31st December, 2015
Contract amount
Estimatedfair value *1
Contract amount
Estimatedfair value *1
Forward foreign exchange contracts for accounts payable, accounted for by deferral hedge accounting method:
Buy: CNY (Sell: JPY) ¥ 991 ¥ 12 ¥ 298 ¥ (6)
Forward foreign exchange contracts for accounts payable, accounted for by deferral hedge accounting method:
Buy: USD (Sell: JPY) – – 167 1
Forward foreign exchange contracts for accounts receivable, accounted for by deferral hedge accounting method:
Sell: USD (Buy: INR) – – 168 2
Interest rate swap contracts for bonds, accounted for by deferral hedge accounting method:
Fixed-rate receipt, fixed-rate payment *2 ¥30,000 ¥(41) ¥30,000 ¥(34)
Thousands of U.S. dollars
31st December, 2015
Contract amount
Estimatedfair value *1
Forward foreign exchange contracts for accounts payable, accounted for by deferral hedge accounting method:
Buy: CNY (Sell: JPY) $ 2,472 $ (50)
Forward foreign exchange contracts for accounts payable, accounted for by deferral hedge accounting method:
Buy: USD (Sell: JPY) 1,386 8
Forward foreign exchange contracts for accounts receivable, accounted for by deferral hedge accounting method:
Sell: USD (Buy: INR) 1,394 17
Interest rate swap contracts for bonds, accounted for by deferral hedge accounting method:
Fixed-rate receipt, fixed-rate payment *2 $248,901 $(282)
*1 The fair values are calculated based on the quoted prices obtained from the counterparty financial
institutions.
*2 These derivative transactions are used to hedge interest rate fluctuation risk until the interest determination dates, which are used as the basis of the bonds’ fixed interest payments.

14
7. Net Assets The Corporation Law of Japan provides that earnings in an amount equal to at least 10% of dividends of capital surplus and retained earnings shall be appropriated to the legal reserve until the aggregate amount of the legal reserve and additional paid-in capital equals 25% of the stated capital. The legal reserve and the additional paid-in capital account are available for appropriation by resolution of the shareholders. In accordance with the Corporation Law, the Company provides a legal reserve which is included in retained earnings. This reserve amounted to ¥570 million and ¥570 million ($4,729 thousand) at 31st March, 2015 and 31st December, 2015, respectively. For the nine months ended 31st December, 2014 1) Dividends paid
Resolution Type of shares
Total dividends
(Millions of yen)
Dividends per share
(Yen) Cut-off
date Effective
date Source of dividends
Meeting of the Board of Directors on 14th May, 2014 *1
Common Stock
¥6,065 ¥30.00 31st March, 2014
2nd June, 2014
Retained earnings
Meeting of the Board of Directors on 24th October, 2014 *2
Common Stock
¥6,072 ¥30.00 30th September, 2014
28th November, 2014
Retained earnings
*1 Dividends of ¥85 million paid to the ESOP Trust are included in the total dividends amount.
*2 Dividends of ¥74 million paid to the ESOP Trust are included in the total dividends amount.
2) Significant changes in shareholders’ equity Not applicable.
For the nine months ended 31st December, 2015 1) Dividends paid
Resolution Type of shares
Total dividends
(Millions of yen)
Total dividends
(Thousands ofU.S. dollars)
Dividends per share
(Yen)
Dividends per share
(U.S. dollars)Cut-off
date Effective
date Source of dividends
Meeting of the Board of Directors on 14th May, 2015 *1
Common Stock
¥8,105 $67,245 ¥40.00 $0.33 31st March, 2015
1st June, 2015
Retained earnings
Meeting of the Board of Directors on 23rd October, 2015 *2
Common Stock
¥8,346 $69,244 ¥40.00 $0.33 30th September, 2015
30th November, 2015
Retained earnings
*1 Dividends of ¥85 million ($705 thousand) paid to the ESOP Trust are included in the total dividends amount.
*2 Dividends of ¥74 million ($614 thousand) paid to the ESOP Trust are included in the total dividends amount.

15
7. Net Assets (continued) 2) Significant changes in shareholders’ equity
The Company concluded a capital and business alliance agreement with Nippon Life Insurance Company based on the resolution of the Board of Directors on 26th May, 2015, and disposed of a portion of its treasury stock by a third-party allotment to Nippon Life Insurance Company. Accordingly, treasury stock decreased by ¥13,411 million ($111,267 thousand) and capital surplus increased by ¥12,798 million ($106,181 thousand) during the nine months ended 31st December, 2015. As a result, treasury stock and capital surplus as of 31st December, 2015 were ¥42,302 million ($350,967 thousand) and ¥27,952 million ($231,909 thousand), respectively.
8. Cash and Cash Equivalents A reconciliation between cash and bank deposits in the accompanying quarterly consolidated balance sheet and cash and cash equivalents in the accompanying quarterly consolidated statement of cash flows at 31st December, 2014 and 2015 is as follows:
Millions of yen Thousands of U.S. dollars
31st December, 31st December, 2014 2015 2015
Cash and bank deposits ¥ 22,755 ¥ 26,922 $ 223,363 Short-term investment securities 106,787 119,155 988,592 Time deposits with maturities of more than three months when deposited (779) (833) (6,911)
Bond and other investments maturing in more than three months from the acquisition date
(3,997)
(8,001)
(66,381)
Cash and cash equivalents ¥124,766 ¥137,243 $1,138,663
9. Per Share Data Per share data is summarized as follows: Yen U.S. dollars Nine months
ended 31st December,
Nine months ended
31st December, 2014 2015 2015
Earnings per share ¥153.11 ¥141.42 $1.17 Diluted earnings per share 152.74 141.01 1.17
The computation of earnings per share is based on the weighted-average number of shares of common stock outstanding during each period.

16
9. Per Share Data (continued) The computation of earnings per share and diluted earnings per share for the nine months ended 31st December, 2014 and 2015 is as follows:
Millions of yen Thousands of U.S. dollars
Nine months ended
31st December,
Nine months ended
31st December, 2014 2015 2015
Numerator: Earnings *2 ¥33,647 ¥31,914 $264,781 Earnings not attributable to common shareholders
(–)
(–)
(–)
Earnings attributable to common shareholders ¥33,647 ¥31,914 $264,781
Thousands of Shares
Denominator: Weighted-average number of shares of common stock outstanding – basic *3 219,760 225,666
Potentially dilutive shares of common stock: Stock options 525 663
Total 525 663 Weighted-average number of shares of common stock outstanding – diluted
220,285
226,329
*1 The Company implemented a 1.1-for-1 stock split effective 1st October, 2015. To reflect
this stock split, earnings per share and diluted earnings per share are calculated as if the stock split took place on 1st April, 2014.
*2 In computing diluted earnings per share for the nine-month period ended 31st December, 2015, an adjustment due to potentially dilutive shares of affiliates in the amount of ¥(0) million ($(0) thousand) has been made to earnings in the above table.
*3 The Company’s shares owned by the ESOP Trust are included in treasury stock. The weighted-average numbers of shares the ESOP Trust owned were 2,801 thousand and 2,094 thousand during the nine-month periods ended 31st December, 2014 and 2015, respectively.

17
9. Per Share Data (continued) The following potentially issuable shares of common stock would have an antidilutive effect and thus have not been included in the diluted earnings per share calculation for the nine months ended 31st December, 2014 and 2015. The number of shares reflects the effect of the stock split: Shares Nine months ended
31st December, 2014 2015
a) 8th share subscription rights 0 *1 – b) 20th share subscription rights 423,500 – c) 22nd share subscription rights 445,500 – d) 24th share subscription rights – 486,750 *1 The exercise period expired on 30th June, 2014. 10. Selling, General and Administrative Expenses The details of selling, general and administrative expenses for the nine months ended 31st December, 2014 and 2015 are summarized as follows:
Millions of yen Thousands of U.S. dollars
Nine months ended
31st December,
Nine months ended
31st December, 2014 2015 2015
Personnel expenses ¥26,065 ¥ 29,702 $ 246,428 Rent 3,667 3,964 32,888 Subcontractor costs 8,031 10,163 84,319 Other 10,458 12,210 101,303
Total ¥48,221 ¥56,039 $464,938
11. Research and Development Expenses Research and development expenses included in selling, general and administrative expenses amounted to ¥1,569 million and ¥3,353 million ($27,819 thousand) for the nine months ended 31st December, 2014 and 2015, respectively. 12. Contingent Liabilities There were no material contingent liabilities at 31st March, 2015 and 31st December, 2015.

18
13. Segment Information 1) Net sales and profit (loss) by reportable segments Millions of yen
Nine months ended 31st December, 2014
Reportable segment
Consulting
Financial IT
Solutions
Industrial IT
Solutions
IT Platform Services Subtotal
Others *1 Total
Adjustments*2
Consolidated*3
Net sales: Sales to external
customers ¥19,930 ¥175,662 ¥73,477 ¥25,089 ¥294,158 ¥6,625 ¥300,783 ¥ – ¥300,783Intersegment sales
or transfers
246
319
729
58,762 60,056
3,225
63,281
(63,281)
–
Total 20,176 175,981 74,206 83,851 354,214 9,850 364,064 (63,281) 300,783
Segment profit ¥ 4,341 ¥ 15,977 ¥ 9,706 ¥ 4,936 ¥ 34,960 ¥1,332 ¥ 36,292 ¥ 885 ¥ 37,177
Millions of yen
Nine months ended 31st December, 2015
Reportable segment
Consulting
Financial IT
Solutions
Industrial IT
Solutions
IT Platform Services Subtotal
Others *1 Total
Adjustments*2
Consolidated*3
Net sales: Sales to external
customers ¥20,358 ¥188,503 ¥75,638 ¥22,029 ¥306,528 ¥7,094 ¥313,622 ¥ – ¥313,622Intersegment sales
or transfers
249
564
946
59,308 61,067
2,227
63,294
(63,294)
–
Total 20,607 189,067 76,584 81,337 367,595 9,321 376,916 (63,294) 313,622
Segment profit ¥ 3,425 ¥ 21,966 ¥ 7,738 ¥ 8,793 ¥ 41,922 ¥ 530 ¥ 42,452 ¥ 778 ¥ 43,230
Thousands of U.S. dollars
Nine months ended 31st December, 2015
Reportable segment
Consulting
Financial IT
Solutions
Industrial IT
Solutions
IT Platform Services Subtotal
Others *1 Total
Adjustments*2
Consolidated*3
Net sales: Sales to external
customers $168,904 $1,563,951 $627,545 $182,768 $2,543,168 $58,856 $2,602,024 $ – $2,602,024Intersegment sales
or transfers
2,066
4,679 7,849 492,060 506,654
18,477
525,131
(525,131)
–
Total 170,970 1,568,630 635,394 674,828 3,049,822 77,333 3,127,155 (525,131) 2,602,024
Segment profit $ 28,416 $ 182,245 $ 64,200 $ 72,953 $ 347,814 $ 4,397 $ 352,211 $ 6,455 $ 358,666
*1 Some subsidiaries and others provide system development and system management and operation services that are not included in the above reportable segments.
*2 Individual items included in adjustment of segment profit were immaterial.
*3 Segment profit is adjusted to operating profit in the quarterly consolidated statement of income and comprehensive income.
2) Information about changes in reportable segments During the quarterly period ended 31st December, 2015, the Company partially changed
its segment reporting structure. Subsidiaries providing system development and system management as part of the Chinese and Asian systems business previously included in “Others” were newly included in the Industrial IT Solutions segment.
Segment information for the nine months ended 31st December, 2014 in the above table
has been restated to reflect the new segment reporting structure.

19
14. Lawsuit On 30th April, 2015, a lawsuit was filed against the Company by Japan Post Information Technology Co., Ltd. (“JPiT”) and the case is currently in litigation. With an aim to migrate their communication network, connecting post offices across Japan to a new network, JPiT placed an order for the procurement and maintenance of network services with SoftBank Mobile Corp. and an order for transitional management and operational coordination of the network with the Company. In the lawsuit, JPiT is demanding that SoftBank Mobile Corp. and the Company pay ¥16.15 billion ($133.99 million) jointly as compensation for damages due to a delay in the migration. 15. Subsequent Events Not applicable.