consolidated financial results - daiichi sankyo...1. qualitative information about consolidated...
TRANSCRIPT

July 31, 2014 Consolidated Financial Results
for the First Three Months of the Fiscal Year Ending March 31, 2015 <under IFRS>
Listed company name: Daiichi Sankyo Company, Limited Listed exchange: First Section of the Tokyo Stock Exchange Stock code number: 4568 URL: http://www.daiichisankyo.com Representative: Mr. Joji Nakayama, President & CEO Contact: Mr. Noriaki Ishida, Corporate Officer, Vice President, Corporate Communications Department Telephone: +81-3-6225-1126 Scheduled date of Quarterly Report filing: August 8, 2014 Scheduled date of dividend payments: – Preparing supplementary material (Reference Data) on quarterly financial results: Yes Holding quarterly information meeting: Yes (for institutional investors, analysts and the press)
(All amounts have been rounded down to the nearest million yen.) 1. Consolidated Financial Results for the First Three Months of Fiscal 2014
(from April 1, 2014 to June 30, 2014)
(1) Consolidated Financial Results (Percentages indicate changes from the same period in the previous fiscal year.)
Revenue Operating profit Profit before tax Profit for the period
Millions of yen % Millions of yen % Millions of yen % Millions of yen %
First three months of fiscal 2014
254,449 0.7 29,430 93.9 27,925 59.4 18,546 20.5
First three months of fiscal 2013
252,637 – 15,180 – 17,514 – 15,394 –
Profit attributable to owners of the Company
Total comprehensive income
Basic earnings per share
Diluted earnings per share
Millions of yen % Millions of yen % Yen Yen
First three months of fiscal 2014
19,986 33.0 15,285 −58.4 28.39 28.34
First three months of fiscal 2013
15,024 – 36,780 – 21.34 21.31
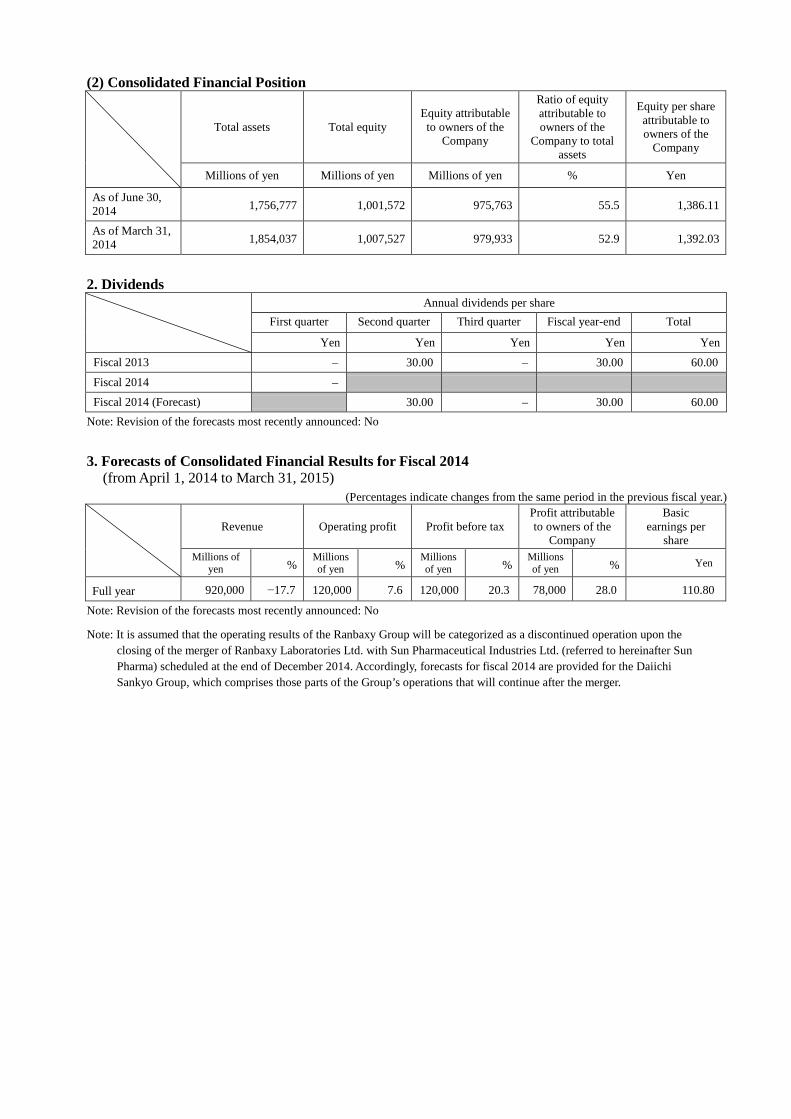
(2) Consolidated Financial Position
Total assets Total equity Equity attributable to owners of the
Company
Ratio of equity attributable to owners of the
Company to total assets
Equity per share attributable to owners of the
Company
Millions of yen Millions of yen Millions of yen % Yen
As of June 30, 2014 1,756,777 1,001,572 975,763 55.5 1,386.11
As of March 31, 2014 1,854,037 1,007,527 979,933 52.9 1,392.03
2. Dividends
Annual dividends per share
First quarter Second quarter Third quarter Fiscal year-end Total
Yen Yen Yen Yen Yen
Fiscal 2013 – 30.00 – 30.00 60.00
Fiscal 2014 –
Fiscal 2014 (Forecast) 30.00 – 30.00 60.00 Note: Revision of the forecasts most recently announced: No
3. Forecasts of Consolidated Financial Results for Fiscal 2014 (from April 1, 2014 to March 31, 2015)
(Percentages indicate changes from the same period in the previous fiscal year.)
Revenue Operating profit Profit before tax Profit attributable to owners of the
Company
Basic earnings per
share Millions of
yen % Millions of yen %
Millions of yen %
Millions of yen % Yen
Full year 920,000 −17.7 120,000 7.6 120,000 20.3 78,000 28.0 110.80
Note: Revision of the forecasts most recently announced: No
Note: It is assumed that the operating results of the Ranbaxy Group will be categorized as a discontinued operation upon the closing of the merger of Ranbaxy Laboratories Ltd. with Sun Pharmaceutical Industries Ltd. (referred to hereinafter Sun Pharma) scheduled at the end of December 2014. Accordingly, forecasts for fiscal 2014 are provided for the Daiichi Sankyo Group, which comprises those parts of the Group’s operations that will continue after the merger.

*Notes (1) Changes in significant subsidiaries during the period under review (changes in specified subsidiaries
resulting in a change in scope of consolidation): No Newly included: None Excluded: None
(2) Changes in accounting policies and changes in accounting estimates
1) Changes in accounting policies required by IFRS: Yes 2) Changes in accounting policies due to other reasons: No 3) Changes in accounting estimates: No Note: For details, please refer to “(2) Changes in Accounting Policies, Changes in Accounting Estimates, and Restatement
of Prior Period Financial Statements after Error Corrections” of “2. Summary Information (Notes)” on page 9. (3) Number of ordinary shares issued
1) Number of shares issued at the end of the period (including treasury share)
As of June 30, 2014 709,011,343 shares As of March 31, 2014 709,011,343 shares
2) Number of shares in treasury at the end of the period
As of June 30, 2014 5,050,832 shares As of March 31, 2014 5,051,576 shares
3) Average number of shares during the period (cumulative from the beginning of the fiscal year)
First three months ended June 30, 2014 703,959,021 shares First three months ended June 30, 2013 703,946,478 shares
* Indication regarding execution of quarterly review procedures
This quarterly financial results report is exempt from the quarterly review procedures in accordance with the Financial Instruments and Exchange Act. At the time of disclosure of this quarterly financial results report, the review procedures for condensed consolidated financial statements are in progress.
* Disclaimer regarding forward-looking information including appropriate use of forecasted financial results
The forecasted statements shown in these materials are based on information currently available and certain assumptions that the Company regards as reasonable. Actual performance and other results may differ from these forecasted figures due to various factors. Please see “(3) Information about Forecasts of Consolidated Financial Results and Other Forward-Looking Statements” of “1. Qualitative Information about Consolidated Results for the First Three Months” on page 8 for assumption that the above forecasts were based on and related matters.
1
Attached Material
Index
1. Qualitative Information about Consolidated Results for the First Three Months .................................. 2
Daiichi Sankyo and its consolidated subsidiaries (“the Group”) have adopted IFRS starting in the fiscal
year ended March 31, 2014. .................................................................................................................. 2 (1) Information about Operating Results ............................................................................................... 2
[Consolidated Financial Results] ..................................................................................................... 2 [Reports by Segment] ...................................................................................................................... 4 [R&D Activities] .............................................................................................................................. 7
(2) Information about Financial Position ............................................................................................... 8 (3) Information about Forecasts of Consolidated Financial Results and Other Forward-Looking
Statements ........................................................................................................................................ 8
2. Summary Information (Notes) ............................................................................................................... 9 (1) Changes in Significant Subsidiaries during the Period under Review ............................................. 9 (2) Changes in Accounting Policies, Changes in Accounting Estimates, and Restatement of Prior
Period Financial Statements after Error Corrections ........................................................................ 9 3. Condensed Consolidated Financial Statements ..................................................................................... 10
(1) Condensed Consolidated Statement of Financial Position ............................................................. 10 (2) Condensed Consolidated Statement of Profit or Loss and Condensed Consolidated Statement of
Comprehensive Income.................................................................................................................. 12 Condensed Consolidated Statement of Profit or Loss .................................................................... 12
Condensed Consolidated Statement of Comprehensive Income .................................................... 13 (3) Condensed Consolidated Statement of Changes in Equity ............................................................ 14 (4) Condensed Consolidated Statement of Cash Flows ....................................................................... 16 (5) Notes to Consolidated Financial Statements .................................................................................. 18
(Note Related to Going Concern Assumption) .............................................................................. 18 (Segment Information) ................................................................................................................... 18

2
1. Qualitative Information about Consolidated Results for the First Three Months Daiichi Sankyo and its consolidated subsidiaries (“the Group”) have adopted IFRS starting in the fiscal year ended March 31, 2014.
(1) Information about Operating Results [Consolidated Financial Results]
(Millions of yen; all amounts have been rounded down to the nearest million yen.)
First three months of fiscal 2013
First three months of fiscal 2014 YoY change
Revenue 252,637 254,449 1,812 0.7%
Operating profit 15,180 29,430 14,249 93.9%
Profit before tax 17,514 27,925 10,411 59.4%
Profit attributable to owners of the Company 15,024 19,986
4,962 33.0%
<Revenue of global mainstay products> (Millions of yen; all amounts have been rounded down to the nearest million yen.)
Item name First three months of fiscal 2013
First three months of fiscal 2014 YoY change
Olmesartan Antihypertensive agent 73,126 75,772
2,645 3.6%
Prasugrel Antiplatelet agent 5,806 5,777
−28 −0.5%
<Research and development expenses> (Millions of yen; all amounts have been rounded down to the nearest million yen.)
First three months of fiscal 2013
First three months of fiscal 2014
Research and development expenses 48,112 43,179 Ratio of research and development expenses to revenue 19.0% 17.0%
<Yen exchange rates for major currencies (average rate during the period)> (Yen)
First three months of fiscal 2013
First three months of fiscal 2014
Yen/USD 98.76 102.16
Yen/EUR 128.96 140.06
Yen/INR 1.71 1.72

3
i. Revenue
Group revenue in the first three months of fiscal 2014 increased by ¥1.8 billion, or 0.7% year on year, to ¥254.4 billion.
In Japan, despite growth in mainstay products, there was a slight decline in revenue due to factors including the NHI price revisions and the consumption tax revision. However, revenue at the Group as a whole increased owing to sales growth and beneficial exchange rates in Europe and other regions.
ii. Operating Profit
Operating profit increased by ¥14.2 billion, or 93.9% year on year, to ¥29.4 billion.
This substantial operating profit increase reflected not only an increase in gross profit but also decreases in selling, general and administrative expenses and research and development expenses. In the first three months of the previous fiscal year, loss on business restructuring at Daiichi Sankyo Europe GmbH was recorded under selling, general and administrative expenses.
iii. Profit before Tax
Profit before tax increased by ¥10.4 billion, or 59.4% year on year, to ¥27.9 billion.
This increase was not as substantial as the operating profit increase owing to a decrease in financial income and an increase in financial expenses.
iv. Profit Attributable to Owners of the Company
Profit attributable to owners of the Company increased by ¥5.0 billion, or 33.0% year on year, to ¥20.0 billion.
This increase was not as substantial as profit before tax increase due to an increase in the amount of income taxes.
4
[Reports by Segment]
i. Daiichi Sankyo Group
The Daiichi Sankyo Group reported revenue of ¥213.4 billion, a year-on-year increase of ¥3.3 billion or 1.6%.
Operating profit increased by ¥17.5 billion, or 120.2% year on year, to ¥32.1 billion (prior to consolidated adjustments).
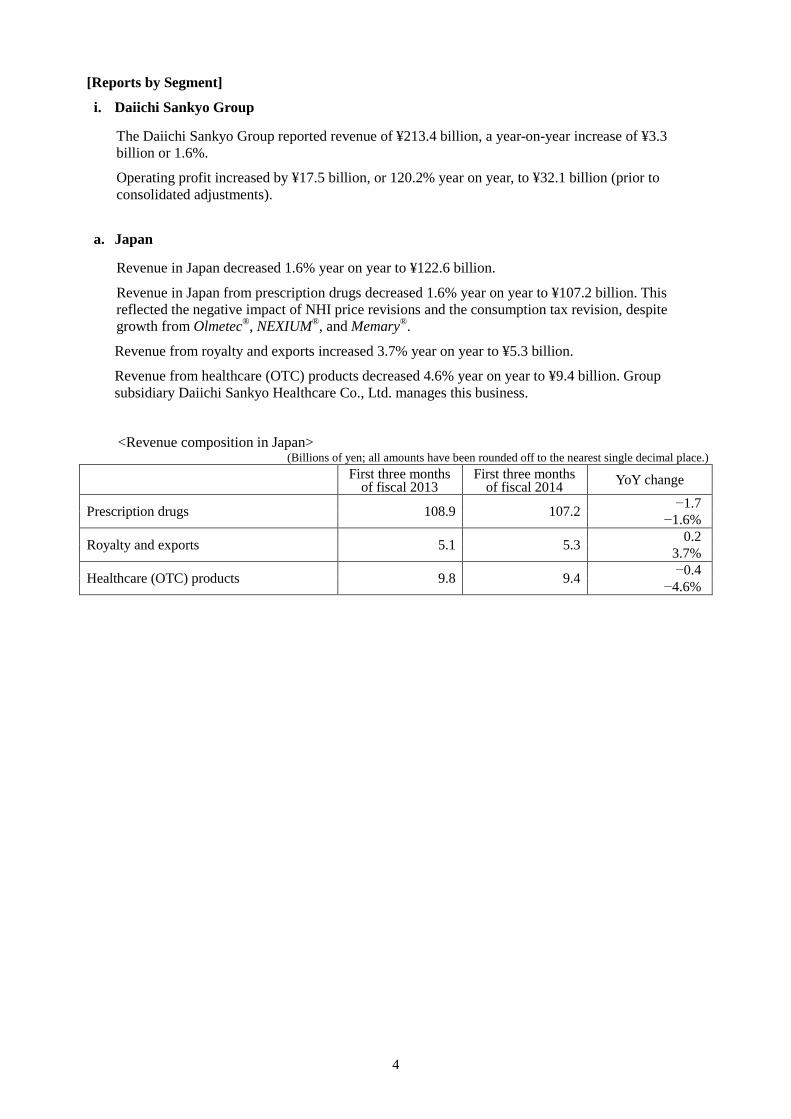
a. Japan
Revenue in Japan decreased 1.6% year on year to ¥122.6 billion.
Revenue in Japan from prescription drugs decreased 1.6% year on year to ¥107.2 billion. This reflected the negative impact of NHI price revisions and the consumption tax revision, despite growth from Olmetec®, NEXIUM®, and Memary®.
Revenue from royalty and exports increased 3.7% year on year to ¥5.3 billion.
Revenue from healthcare (OTC) products decreased 4.6% year on year to ¥9.4 billion. Group subsidiary Daiichi Sankyo Healthcare Co., Ltd. manages this business.
<Revenue composition in Japan> (Billions of yen; all amounts have been rounded off to the nearest single decimal place.)
First three months of fiscal 2013
First three months of fiscal 2014 YoY change
Prescription drugs 108.9 107.2 −1.7 −1.6%
Royalty and exports 5.1 5.3 0.2 3.7%
Healthcare (OTC) products 9.8 9.4 −0.4 −4.6%

5
<Revenue of Japan company mainstay pharmaceuticals> (Billions of yen; all amounts have been rounded off to the nearest single decimal place.)
Product name First three months of fiscal 2013
First three months of fiscal 2014 YoY change
Olmetec®
Antihypertensive agent 16.6 18.7 2.1
12.7% NEXIUM®
Ulcer treatment 10.9 15.3 4.3 39.4%
Loxonin®
Anti-inflammatory analgesic (of which Loxonin® Tape)
14.9 (9.0)
12.2 (7.5)
−2.7 −18.0%
Memary®
Alzheimer’s disease treatment 6.6 7.9 1.3 19.0%
Cravit®
Synthetic antibacterial agent 7.6 6.9 −0.8 −9.9%
Rezaltas® Antihypertensive agent 4.3 4.5 0.2
4.2% Artist® Treatment for hypertension, angina pectoris and chronic heart failure
5.4 4.8 −0.6 −11.7%
Mevalotin®
Antihyperlipidemic agent 5.2 4.2 −1.0 −19.9%
Omnipaque® Contrast medium 4.7 4.2 −0.5
−10.5% PRALIA® Treatment for osteoporosis 0.4 1.3 0.9
250.9% RANMARK® Treatment for bone complications 1.6 2.1
0.5 34.0%
b. North America
Revenue in North America decreased 1.6% year on year to ¥53.9 billion. Revenue in local currency terms fell 4.9% to approximately US$527 million. The slight decrease in overall business revenue in North America reflected decreased revenue from products such as Benicar®/Benicar HCT®, AZOR®, and Welchol® due to increased competition, despite positive contributions from Luitpold Pharmaceuticals’ Venofer® and a new product Injectafer®. <Revenue of Daiichi Sankyo, Inc. mainstay products>
(Millions of US$; all amounts have been rounded off to the nearest million US$.)
Product name First three months of fiscal 2013
First three months of fiscal 2014 YoY change
Benicar®/Benicar HCT®
Antihypertensive agent 241 185 −56
−23.3% AZOR®
Antihypertensive agent 47 40 −6
−13.6% TRIBENZOR® Antihypertensive agent 23 26
3 11.7%
Welchol®
Hypercholesterolemia treatment/ type 2 diabetes mellitus inhibitor
115 111 −5
−4.0%
Effient®
Antiplatelet agent (co-promotion revenue)
41 42 1
2.5%
6
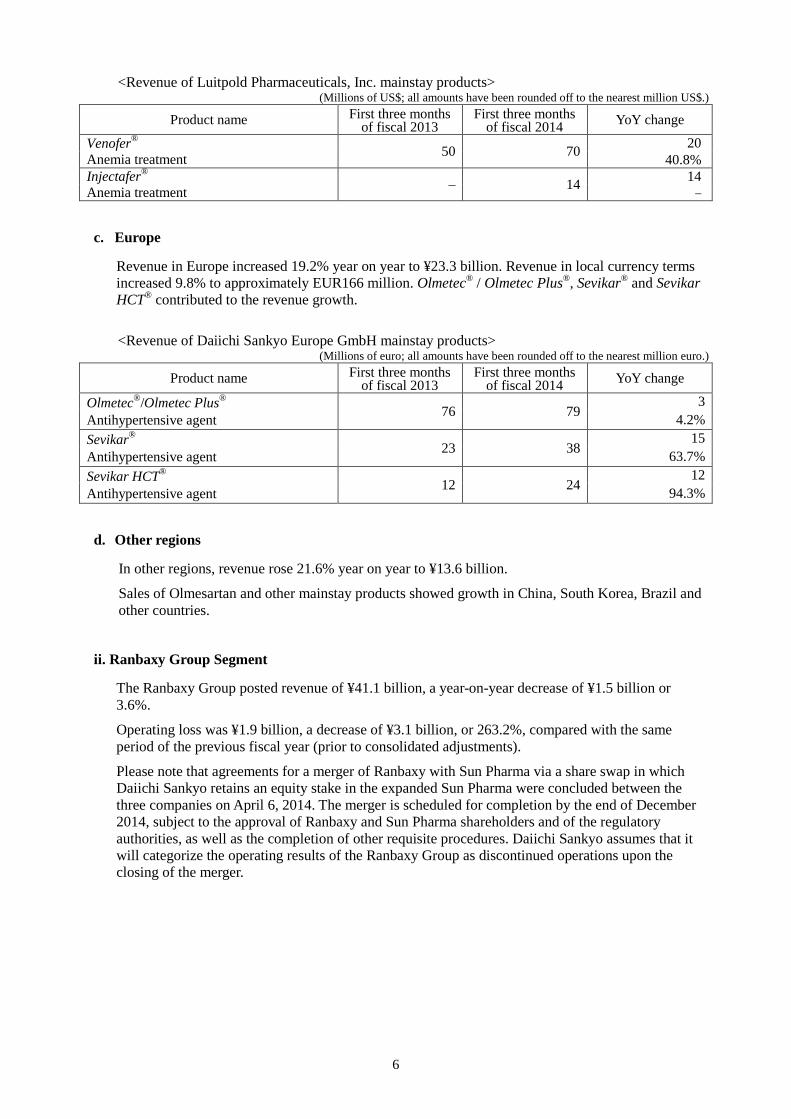
<Revenue of Luitpold Pharmaceuticals, Inc. mainstay products> (Millions of US$; all amounts have been rounded off to the nearest million US$.)
Product name First three months of fiscal 2013
First three months of fiscal 2014 YoY change
Venofer®
Anemia treatment 50 70 20 40.8%
Injectafer® Anemia treatment – 14 14
–
c. Europe
Revenue in Europe increased 19.2% year on year to ¥23.3 billion. Revenue in local currency terms increased 9.8% to approximately EUR166 million. Olmetec® / Olmetec Plus®, Sevikar® and Sevikar HCT® contributed to the revenue growth.
<Revenue of Daiichi Sankyo Europe GmbH mainstay products>
(Millions of euro; all amounts have been rounded off to the nearest million euro.)
Product name First three months of fiscal 2013
First three months of fiscal 2014 YoY change
Olmetec®/Olmetec Plus® Antihypertensive agent 76 79
3 4.2%
Sevikar® Antihypertensive agent 23 38
15 63.7%
Sevikar HCT® Antihypertensive agent 12 24
12 94.3%
d. Other regions
In other regions, revenue rose 21.6% year on year to ¥13.6 billion.
Sales of Olmesartan and other mainstay products showed growth in China, South Korea, Brazil and other countries.
ii. Ranbaxy Group Segment
The Ranbaxy Group posted revenue of ¥41.1 billion, a year-on-year decrease of ¥1.5 billion or 3.6%.
Operating loss was ¥1.9 billion, a decrease of ¥3.1 billion, or 263.2%, compared with the same period of the previous fiscal year (prior to consolidated adjustments).
Please note that agreements for a merger of Ranbaxy with Sun Pharma via a share swap in which Daiichi Sankyo retains an equity stake in the expanded Sun Pharma were concluded between the three companies on April 6, 2014. The merger is scheduled for completion by the end of December 2014, subject to the approval of Ranbaxy and Sun Pharma shareholders and of the regulatory authorities, as well as the completion of other requisite procedures. Daiichi Sankyo assumes that it will categorize the operating results of the Ranbaxy Group as discontinued operations upon the closing of the merger.
7
[R&D Activities]
Daiichi Sankyo’s R&D program aims to develop a competitive drug pipeline through accelerated and sustained generation of innovative medicines. The Group has designated the fields of cardiovascular-metabolic, oncology and frontier medicine as priority areas for drug development. Efforts continue to develop the R&D pipeline in these areas by creating drugs with the potential to become best-in-class or first-in-class therapies.
As part of ongoing efforts to cultivate an entrepreneurial biotech culture within the Group, Daiichi Sankyo is further utilizing the Group subsidiaries Asubio Pharma Co., Ltd., U3 Pharma GmbH, and Plexxikon Inc. Daiichi Sankyo also established Venture Science Laboratories (VSL) in April 2013 and is working to accelerate the efforts.
In addition, Daiichi Sankyo is continuing to develop R&D alliances with other companies and pursue an open innovation approach, while reinforcing R&D activities in preparation for full-scale entry into the biopharmaceutical sector.
i. Prasugrel
In May 2014, Daiichi Sankyo launched prasugrel (product name: Efient®) in Japan for the indication of ischemic heart disease in patients undergoing percutaneous coronary intervention (PCI). A Phase III clinical trial has been proceeding in Japan to evaluate the efficacy of prasugrel in patients with ischemic stroke.
ii. Edoxaban
The Group filed applications for approval for indications in Japan in December 2013 and in the United States and Europe in January 2014, for the treatment and inhibition of recurrence of venous thromboembolism (VTE) in patients who have had deep vein thrombosis (DVT) or pulmonary embolism (PE), and for the prevention of stroke and systemic embolism in non-valvular atrial fibrillation (AF).
As a result of deliberations over the sales and marketing strategy for edobaxan, the product will be sold through the Company’s own distribution channel in the United States, Japan and Europe. Outside those territories, the Company will select optimal partners for each country or region in light of considerations such as market conditions and the Company’s business capabilities in the relevant countries and regions.
iii. Denosumab
Denosumab is an antibody drug related to bone metabolism. The Company has obtained the rights to develop and market this product in Japan from Amgen Inc. of the US. In April 2012, the drug was launched under the brand name RANMARK® indicated for skeletal-related events in patents with multiple myeloma or bone metastases from solid tumors. In June 2013, it was also launched under the brand name PRALIA® as an agent for treatment for osteoporosis.
In May 2014, approval was obtained for revised application for approval for giant cell tumor of bone.
Denosumab is also currently undergoing global phase III clinical studies for postoperative adjuvant breast cancer therapy and phase III clinical studies in Japan for treatment of rheumatoid arthritis.
8
(2) Information about Financial Position Total equity as of June 30, 2014 equaled ¥1,001.6 billion (a decrease of ¥6.0 billion compared with the previous fiscal year-end), and total assets amounted to ¥1,756.8 billion (a decrease of ¥97.3 billion compared with the previous fiscal year-end). Ratio of equity attributable to owners of the Company to total assets was 55.5% at this date (compared with 52.9% at the previous fiscal year-end).
Total equity decreased due to a fall in exchange differences on translation of foreign operations despite the recording of profit for the period.
The decrease in total assets was larger than that for total equity, reflecting a decrease in bonds and borrowings.
(3) Information about Forecasts of Consolidated Financial Results and Other Forward-Looking Statements There are no changes from the forecasts of consolidated financial results for fiscal 2014 publicly announced on May 15, 2014.
It is assumed that the operating results of the Ranbaxy Group will be categorized as a discontinued operation upon the closing of the merger of Ranbaxy Laboratories Ltd. with Sun Pharmaceutical Industries Ltd. scheduled at the end of December 2014. Accordingly, forecasts for fiscal 2014 are provided for the Daiichi Sankyo Group, which comprises those parts of the Group’s operations that will continue after closing of the merger.
9
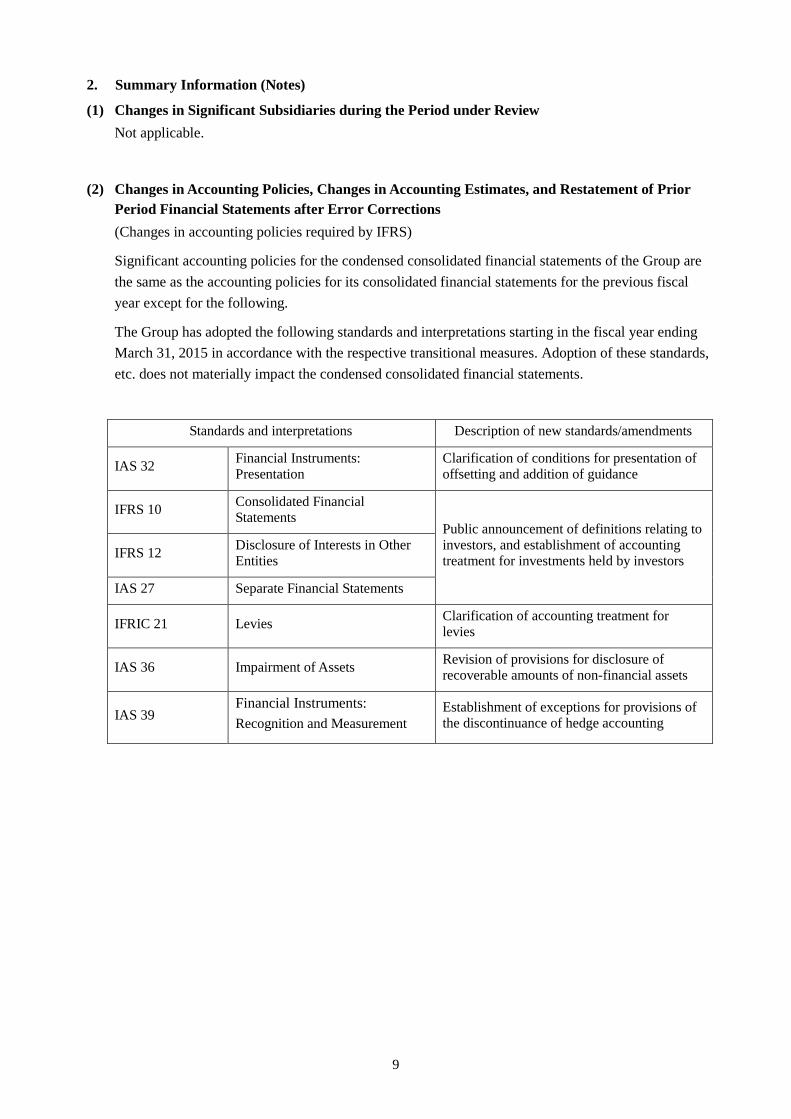
2. Summary Information (Notes)
(1) Changes in Significant Subsidiaries during the Period under Review Not applicable.
(2) Changes in Accounting Policies, Changes in Accounting Estimates, and Restatement of Prior Period Financial Statements after Error Corrections (Changes in accounting policies required by IFRS)
Significant accounting policies for the condensed consolidated financial statements of the Group are the same as the accounting policies for its consolidated financial statements for the previous fiscal year except for the following.
The Group has adopted the following standards and interpretations starting in the fiscal year ending March 31, 2015 in accordance with the respective transitional measures. Adoption of these standards, etc. does not materially impact the condensed consolidated financial statements.
Standards and interpretations Description of new standards/amendments
IAS 32 Financial Instruments: Presentation
Clarification of conditions for presentation of offsetting and addition of guidance
IFRS 10 Consolidated Financial Statements
Public announcement of definitions relating to investors, and establishment of accounting treatment for investments held by investors IFRS 12 Disclosure of Interests in Other
Entities
IAS 27 Separate Financial Statements
IFRIC 21 Levies Clarification of accounting treatment for levies
IAS 36 Impairment of Assets Revision of provisions for disclosure of recoverable amounts of non-financial assets
IAS 39 Financial Instruments: Recognition and Measurement
Establishment of exceptions for provisions of the discontinuance of hedge accounting

10
3. Condensed Consolidated Financial Statements
(1) Condensed Consolidated Statement of Financial Position (Millions of yen)
Fiscal 2013
(as of March 31, 2014) Fiscal 2014
(as of June 30, 2014)
ASSETS
Current assets
Cash and cash equivalents 183,070 165,683
Trade and other receivables 269,194 254,732
Other financial assets 324,160 256,039
Inventories 189,408 194,412
Other current assets 24,769 23,988
Total current assets 990,603 894,856
Non-current assets
Property, plant and equipment 316,304 312,318
Goodwill 85,518 84,980
Intangible assets 171,417 166,002 Investments accounted for using the equity method 2,624 2,768
Other financial assets 141,553 145,566
Deferred tax assets 122,550 125,510
Other non-current assets 23,464 24,774
Total non-current assets 863,433 861,920
Total assets 1,854,037 1,756,777

11
(Millions of yen)
Fiscal 2013
(as of March 31, 2014) Fiscal 2014
(as of June 30, 2014)
LIABILITIES AND EQUITY
Current liabilities
Trade and other payables 245,422 214,530
Bonds and borrowings 160,326 97,003
Other financial liabilities 15,115 13,823
Income taxes payable 5,636 8,401
Provisions 22,702 22,129
Other current liabilities 11,985 12,955
Total current liabilities 461,188 368,845
Non-current liabilities
Bonds and borrowings 263,289 261,712
Other financial liabilities 14,177 12,591
Post-employment benefit liabilities 8,947 8,808
Provisions 3,747 4,401
Deferred tax liabilities 39,838 42,695
Other non-current liabilities 55,320 56,148
Total non-current liabilities 385,321 386,359
Total liabilities 846,509 755,204
Equity
Equity attributable to owners of the Company
Share capital 50,000 50,000
Capital surplus 105,267 105,267
Treasury shares (14,408) (14,403)
Other components of equity 121,753 118,802
Retained earnings 717,320 716,096 Total equity attributable to owners of the Company 979,933 975,763
Non-controlling interests
Non-controlling interests 27,594 25,808
Total equity 1,007,527 1,001,572
Total liabilities and equity 1,854,037 1,756,777

12
(2) Condensed Consolidated Statement of Profit or Loss and Condensed Consolidated Statement of Comprehensive Income
Condensed Consolidated Statement of Profit or Loss
(Millions of yen)
First three months of fiscal 2013
(From April 1, 2013 to June 30, 2013)
First three months of fiscal 2014 (From April 1, 2014
to June 30, 2014)
Revenue 252,637 254,449
Cost of sales 87,601 85,881
Gross profit 165,035 168,568
Selling, general and administrative expenses 101,743 95,958
Research and development expenses 48,112 43,179
Operating profit 15,180 29,430
Financial income 6,983 5,389
Financial expenses 4,520 6,484 Share of loss of investments accounted for using the equity method
128 409
Profit before tax 17,514 27,925
Income taxes 2,120 9,379
Profit for the period 15,394 18,546
Profit attributable to:
Owners of the Company 15,024 19,986
Non-controlling interests 369 (1,440)
Profit for the period 15,394 18,546
Earnings per share
Basic earnings per share (Yen) 21.34 28.39
Diluted earnings per share (Yen) 21.31 28.34
13
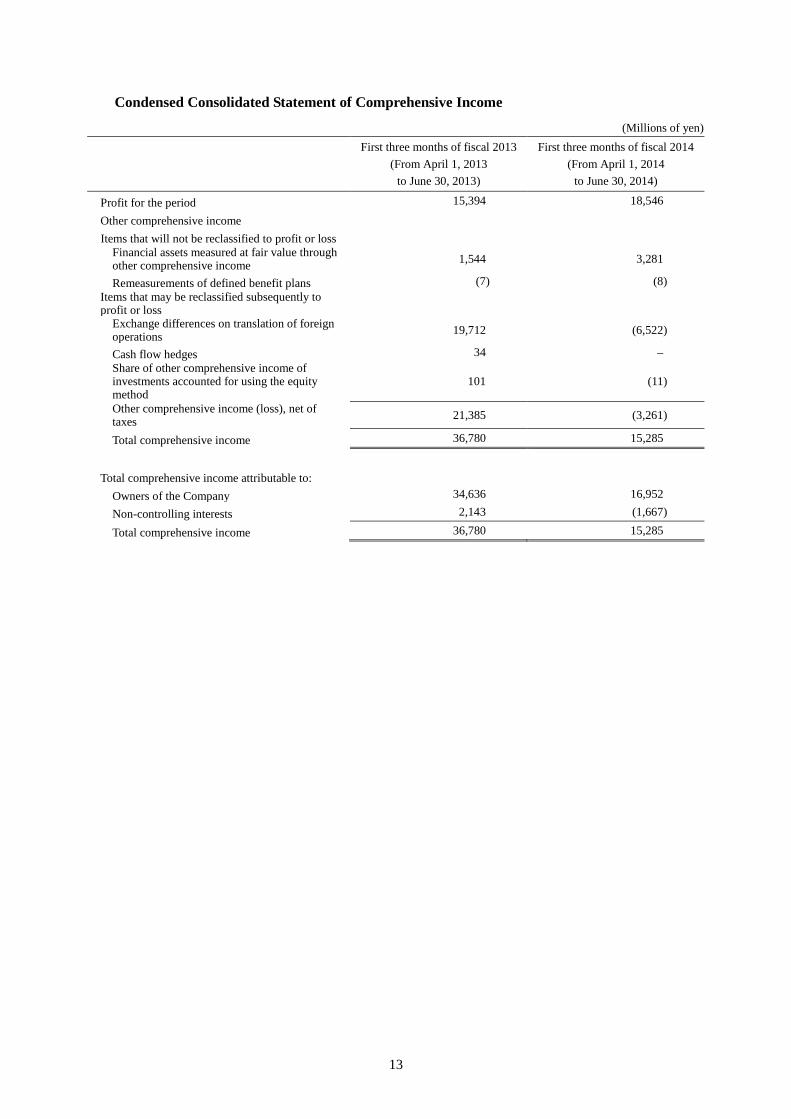
Condensed Consolidated Statement of Comprehensive Income
(Millions of yen)
First three months of fiscal 2013
(From April 1, 2013 to June 30, 2013)
First three months of fiscal 2014 (From April 1, 2014
to June 30, 2014)
Profit for the period 15,394 18,546
Other comprehensive income
Items that will not be reclassified to profit or loss Financial assets measured at fair value through other comprehensive income 1,544 3,281
Remeasurements of defined benefit plans (7) (8) Items that may be reclassified subsequently to profit or loss
Exchange differences on translation of foreign operations 19,712 (6,522)
Cash flow hedges 34 – Share of other comprehensive income of investments accounted for using the equity method
101 (11)
Other comprehensive income (loss), net of taxes 21,385 (3,261)
Total comprehensive income 36,780 15,285
Total comprehensive income attributable to:
Owners of the Company 34,636 16,952
Non-controlling interests 2,143 (1,667)
Total comprehensive income 36,780 15,285

14
(3) Condensed Consolidated Statement of Changes in Equity (Millions of yen)
Equity attributable to owners of the Company
Share capital Capital surplus Treasury shares
Other components of equity
Subscription rights to shares
Exchange differences on translation of foreign operations
Cash flow hedges
Financial assets measured at fair value through other comprehensive income
Balance as of April 1, 2013 50,000 105,194 (14,460) 1,504 40,545 959 42,057 Profit for the period - - - - - - - Other comprehensive income - - - - 18,050 22 1,546
Total comprehensive income - - - - 18,050 22 1,546
Acquisition of treasury shares - - (5) - - - - Disposal of treasury shares - - 0 - - - - Share-based payments - - - - - - - Dividends - - - - - - - Transfer from other components of equity to retained earnings
- - - - - - (50)
Other - - - - 0 (0) (0) Total transactions with the owners - - (5) - 0 (0) (50)
Balance as of June 30, 2013 50,000 105,194 (14,466) 1,504 58,596 981 43,553 Balance as of April 1, 2014 50,000 105,267 (14,408) 1,680 80,252 - 39,821
Profit for the period - - - - - - - Other comprehensive income - - - - (6,305) - 3,280
Total comprehensive income - - - - (6,305) - 3,280
Acquisition of treasury shares - - (4) - - - - Disposal of treasury shares - - 9 (4) - - - Share-based payments - - - - - - - Dividends - - - - - - - Transfer from other components of equity to retained earnings
- - - - - - 78
Other - - - - (0) - (0) Total transactions with the owners - - 4 (4) (0) - 78
Balance as of June 30, 2014 50,000 105,267 (14,403) 1,676 73,946 - 43,179

15
Equity attributable to owners of the Company Other components of equity
Retained earnings
Total equity attributable to owners of the Company
Non-controlling interests Total equity Remeasure-
ments of defined benefit plans
Total other components of equity
Balance as of April 1, 2013 - 85,067 680,844 906,645 31,835 938,480 Profit for the period - - 15,024 15,024 369 15,394 Other comprehensive income (7) 19,611 - 19,611 1,773 21,385
Total comprehensive income (7) 19,611 15,024 34,636 2,143 36,780
Acquisition of treasury shares - - - (5) - (5) Disposal of treasury shares - - (0) 0 - 0 Share-based payments - - - - 139 139 Dividends - - (21,118) (21,118) - (21,118) Transfer from other components of equity to retained earnings
7 (43) 43 - - -
Other - 0 - 0 276 277 Total transactions with the owners 7 (42) (21,075) (21,123) 416 (20,706)
Balance as of June 30, 2013 - 104,636 674,794 920,158 34,395 954,553 Balance as of April 1, 2014 - 121,753 717,320 979,933 27,594 1,007,527
Profit for the period - - 19,986 19,986 (1,440) 18,546 Other comprehensive income (8) (3,033) - (3,033) (227) (3,261)
Total comprehensive income (8) (3,033) 19,986 16,952 (1,667) 15,285
Acquisition of treasury shares - - - (4) - (4) Disposal of treasury shares - (4) (4) 0 - 0 Share-based payments - - - - 84 84 Dividends - - (21,118) (21,118) - (21,118) Transfer from other components of equity to retained earnings
8 86 (86) - - -
Other - (0) - (0) (202) (202) Total transactions with the owners 8 82 (21,210) (21,123) (118) (21,241)
Balance as of June 30, 2014 - 118,802 716,096 975,763 25,808 1,001,572

16
(4) Condensed Consolidated Statement of Cash Flows (Millions of yen)
First three months of fiscal 2013
(From April 1, 2013 to June 30, 2013)
First three months of fiscal 2014 (From April 1, 2014
to June 30, 2014)
Cash flows from operating activities
Profit before tax 17,514 27,925
Depreciation and amortization 12,250 12,581
Impairment loss 144 114
Financial income (6,983) (5,389)
Financial expenses 4,520 6,484 Share of (profit) loss of investments accounted for using the equity method
128 409
(Gain) loss on sale and disposal of fixed assets
(483) 125
(Increase) decrease in trade and other receivables
14,387 11,930
(Increase) decrease in inventories (3,728) (6,980) Increase (decrease) in trade and other payables
(3,808) (21,362)
Other, net 1,800 (1,221)
Subtotal 35,743 24,618
Interest and dividends received 2,714 1,577
Interest paid (1,250) (3,015)
Income taxes paid (22,445) (5,921)
Net cash flows from operating activities 14,761 17,258
Cash flows from investing activities
Purchase of time deposits (59,966) (13,486)
Proceeds from maturities in time deposits 49,599 20,041
Acquisition of securities (83,859) (75,997)
Proceeds from sale of securities 80,134 134,539 Acquisitions of property, plant and equipment
(9,065) (8,988)
Proceeds from sale of property, plant and equipment
138 25
Acquisition of intangible assets (2,208) (5,150)
Payments for loans receivable (376) (487)
Proceeds from collection of loans receivable
191 366
Other, net 453 (77)
Net cash flows from investing activities (24,958) 50,786

17
(Millions of yen)
First three months of fiscal 2013
(From April 1, 2013 to June 30, 2013)
First three months of fiscal 2014 (From April 1, 2014
to June 30, 2014)
Cash flows from financing activities Proceeds from bonds and borrowings 890 10,414 Repayments of bonds and borrowings (7,075) (72,737) Purchase of treasury shares (5) (4)
Proceeds from sale of treasury shares 0 0
Dividends paid (21,134) (21,130) Other, net (239) (355) Net cash flows from financing activities (27,564) (83,813)
Net increase (decrease) in cash and cash equivalents
(37,761) (15,768)
Cash and cash equivalents at the beginning of the period
191,145 183,070
Effect of exchange rate change on cash and cash equivalents
7,615 (1,618)
Cash and cash equivalents at the end of the period
160,999 165,683
18
(5) Notes to Consolidated Financial Statements
(Note Related to Going Concern Assumption)
Not applicable.
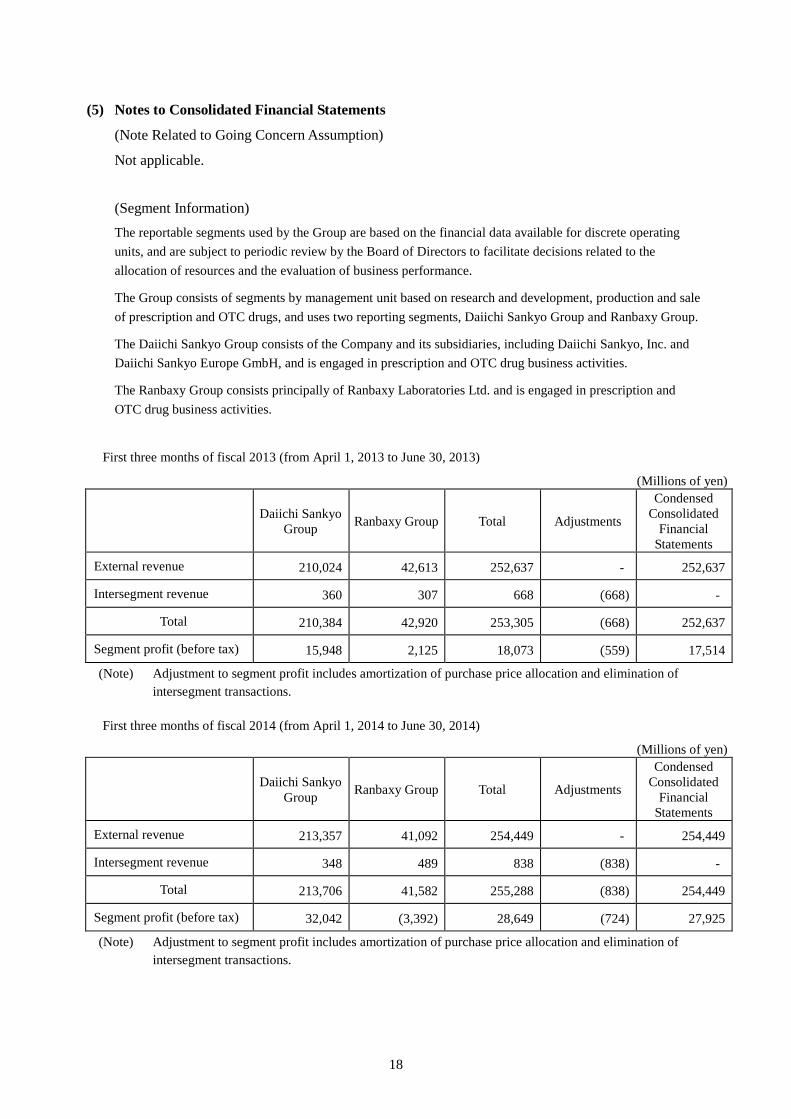
(Segment Information) The reportable segments used by the Group are based on the financial data available for discrete operating units, and are subject to periodic review by the Board of Directors to facilitate decisions related to the allocation of resources and the evaluation of business performance.
The Group consists of segments by management unit based on research and development, production and sale of prescription and OTC drugs, and uses two reporting segments, Daiichi Sankyo Group and Ranbaxy Group.
The Daiichi Sankyo Group consists of the Company and its subsidiaries, including Daiichi Sankyo, Inc. and Daiichi Sankyo Europe GmbH, and is engaged in prescription and OTC drug business activities.
The Ranbaxy Group consists principally of Ranbaxy Laboratories Ltd. and is engaged in prescription and OTC drug business activities.
First three months of fiscal 2013 (from April 1, 2013 to June 30, 2013)
(Millions of yen)
Daiichi Sankyo Group Ranbaxy Group Total Adjustments
Condensed Consolidated
Financial Statements
External revenue 210,024 42,613 252,637 - 252,637
Intersegment revenue 360 307 668 (668) -
Total 210,384 42,920 253,305 (668) 252,637
Segment profit (before tax) 15,948 2,125 18,073 (559) 17,514
(Note) Adjustment to segment profit includes amortization of purchase price allocation and elimination of intersegment transactions.
First three months of fiscal 2014 (from April 1, 2014 to June 30, 2014)
(Millions of yen)
Daiichi Sankyo Group Ranbaxy Group Total Adjustments
Condensed Consolidated
Financial Statements
External revenue 213,357 41,092 254,449 - 254,449
Intersegment revenue 348 489 838 (838) -
Total 213,706 41,582 255,288 (838) 254,449
Segment profit (before tax) 32,042 (3,392) 28,649 (724) 27,925
(Note) Adjustment to segment profit includes amortization of purchase price allocation and elimination of intersegment transactions.