consolidated financial highlights - epson · consolidated financial highlights ... parent company...
TRANSCRIPT

1
Oct 26, 2017
Consolidated Financial Highlights
Quarterly Condensed Consolidated Statement of Comprehensive Income
Millions of yen
Change
Thousands of U.S.
dollars
Six months ended
September 30, Six months ended
September 30,
2017 2016 2017
Revenue 487,569 527,327 8.2% 4,682,772
Business profit (Note) 25,729 28,142 9.4% 249,916
Profit from operating activities 27,773 23,689 (14.7%) 210,363
Profit before tax 27,073 23,011 (15.0%) 204,342
Profit for the period 18,605 15,157 (18.5%) 134,597
Profit for the period attributable to owners of
the parent company 18,445 14,987 (18.7%) 133,088
Total comprehensive income for the period (15,992) 27,264 - 242,109
Basic earnings per share (in ¥1, $1 unit) 52.09 42.55 0.38
Diluted earnings per share (in ¥1, $1 unit) 52.09 42.54 0.38
(Note) Business profit is calculated by subtracting Cost of sales and Selling, general and administrative
expenses from Revenue.
Quarterly Condensed Consolidated Statement of Financial Position
Millions of yen
Thousands of U.S.
dollars
March 31, 2017 September 30, 2017 September 30, 2017
Total assets 974,387 1,039,545 9,231,373 Total equity 494,722 511,330 4,540,715 Equity attributable to owners of the
parent company 492,196 508,676 4,517,147
Equity attributable to owners of the
parent company ratio (%) 50.5% 48.9% 48.9%
Quarterly Condensed Consolidated Statement of Cash Flows
Millions of yen
Change
Thousands of U.S.
dollars
Six months ended
September 30, Six months ended
September 30,
2017 2016 2017
Net cash provided by (used in) operating activities 33,207 26,664 (19.7%) 236,781
Net cash provided by (used in) investing activities (37,123) (41,731) - (370,579)
Net cash provided by (used in) financing activities (15,654) 22,861 - 203,010
Cash and cash equivalents at end of period 201,196 231,438 15.0% 2,055,217
3-5 Owa 3-chome Suwa, Nagano
392-8502, Japan
Tel: +81-266-52-3131
http://global.epson.com/
CONSOLIDATED RESULTS FOR
THE SECOND QUARTER ENDED SEPTEMBER 30, 2017 (IFRS basis)

2
Notes
I. Figures in “Change” column are comparisons with the same period of the previous year.
II. Equity attributable to owners of the parent company is equity excluding non-controlling interest in
subsidiaries.
III. U.S. dollar amounts are included solely for the convenience of readers. These translations should not be
construed as representations that the yen amounts actually represent, or have been or could be
converted into U.S. dollars at that or any other rate. The rate of ¥112.61 = U.S.$1 as of September 30,
2017 has been used for the purpose of presentation.

3
Operating Performance Highlights and Financial Condition
Fiscal 2017 First-Half (April 1 to September 30, 2017) Overview
The global economy basically continued to gradually head toward recovery in the first half of the year
under review. Regionally, the U.S. economy continued to steadily recover, fueled by an increase in
consumer spending and improvement in the employment situation. The Latin American and European
economies gradually recovered, and the Chinese economy showed signs of picking up. The Japanese
economy continued to register signs of a gradual economic recovery, as consumer spending remained stable
in response to a firm employment and income situation.
The situation in the main markets of the Epson Group ("Epson") was as follows.
Inkjet printer demand was firm in the Americas, but the consumer inkjet printer market in Japan continued
to shrink. Demand for high-capacity ink tank printers expanded steadily. Large-format inkjet printer
demand stayed firm. Serial-impact dot-matrix (SIDM) printer demand contracted in China after spiking last
year with the enactment of the “Business Tax to VAT reforms”. Demand also shrank in the Americas and
Europe.
Projector demand contracted after spiking last year ahead of major sporting events in Europe. Ongoing
slackness in the North American retail market contributed to the contraction.
Demand for smart phones, one of the main markets for Epson's electronic devices, was soft amid ongoing
channel inventory adjustments. Demand for watches slowly recovered in Japan. Demand for watch
movements was firm. Demand for industrial robots steadily expanded, particularly in China.
Against this backdrop, Epson formulated the Epson 25 Phase 1 Mid-Range Business Plan (FY2016-18), in
March 2016. The Phase 1 Plan delineates the first phase of work toward achieving the Epson 25 Corporate
Vision, which sets forth a goal of creating a new connected age of people, things and information with
efficient, compact and precision technologies. During the three years of the Phase 1 Plan Epson will sustain
the momentum it gained by strategically adopting new business models and developing new market
segments under the previous corporate vision. At the same time, it will move forward on product
development while aggressively investing as needed to provide a solid business foundation.
The average exchange rates of the yen against the U.S. dollar and of the yen against the euro in the first half
of the fiscal year were ¥111.04 and ¥126.24, respectively. This represents 5% depreciation in the value of
the yen against the dollar and 7% depreciation in the value of the yen against the euro, year on year.
The foregoing factors are reflected in our first half financial results. Revenue was ¥527.3 billion, up 8.2%
year on year. Business profit was ¥28.1 billion, up 9.4% year on year. Profit from operating activities was
¥23.6 billion, down 14.7% year on year. Profit before tax was ¥23.0 billion, down 15.0% year on year.
Profit for the period was ¥15.1 billion, down 18.5% year on year.

4
A breakdown of the financial results in each reporting segment is provided below.
Printing Solutions Segment
Printer business revenue increased.
Inkjet printer revenue continued to expand, as high-capacity ink tank printer unit shipments jumped in
emerging economies and as increased market recognition sparked unit shipment growth in developed
countries, as well. Foreign exchange effects also boosted inkjet revenue. Consumables revenue was flat
year on year.
Page printer sales decreased due to a slump in consumables sales in addition to a decline in unit shipments,
the result of Epson's focus on selling high added value models.
SIDM printer revenue declined compared to the same period last year, when there was special demand in
the Chinese tax collection system market.
Revenue in the professional printing business increased.
Total revenue from large-format inkjet printers increased because, in addition to sales growth in the existing
photo and graphics markets, we saw solid demand in the growing signage, textile, and label printer markets.
Foreign exchange effects also had a positive effect on revenue. Consumables revenue also increased owing
to an increase in unit shipments and to foreign exchange effects.
POS system product revenue increased along with an increase in unit shipments of low-end models to meet
firm demand in North America. Revenue also benefited from foreign exchange effects.
Although somewhat hurt by a decline in sales of page printers and SIDM printers, printing solutions
segment profit rose due to a combination of growth in sales of high-capacity ink tank inkjet printers and
large-format inkjet printers, and foreign exchange effects.
As a result of the foregoing factors, revenue in the printing solutions segment was ¥342.0 billion, up 7.4%
year on year. Segment profit was ¥35.9 billion, up 5.9% year on year.
Visual Communications Segment
Visual communications revenue increased.
Total 3LCD projector revenue increased chiefly because firm demand for Epson’s laser projectors in the
high-brightness segment caused an upsurge in unit shipments of high added value products. Foreign
exchange effects also positively affected revenue.
Segment profit in the visual communications segment increased due to unit shipment growth of high-
brightness projectors and foreign exchange effects.
As a result of the foregoing factors, revenue in the visual communications segment was ¥99.1 billion, up
13.1% year on year. Segment profit was ¥12.7 billion, up 77.5% year on year.
5
Wearable and Industrial Products Segment
Revenue in the wearable products business got a boost from currency effects but decreased due to a decline
in watch sales volume.
Revenue in the robotics solutions business increased. Revenue increased primarily due to industrial robot
unit shipment growth in China and because of a rise in IC handler revenue as a result of firm demand for
Chinese manufactured smart phones. Foreign exchange also positively affected total revenue.
Revenue in the microdevices business increased. Although positively affected by foreign exchange, crystal
device revenue decreased due to a decline in unit shipments to manufacturers of cell phones and other
personal electronics. Semiconductor revenue increased despite a decline in volume to a major automotive
account. The increase was due to currency effects and a rise in sales volume linked to growth in silicon
foundry demand.
Segment profit in the wearable products & industrial solutions segment increased despite lower sales in the
wearable products business. The increase was due to sales growth in the robotics solutions business and
foreign exchange effects.
As a result of the foregoing factors, revenue in the wearable products & industrial solutions operations
segment was ¥86.3 billion, up 6.5% year on year. Segment profit was ¥4.7 billion, up 20.1% year on year.
Other
Other revenue amounted to ¥0.4 billion, down 29.5% year on year. Segment loss was ¥0.2 billion,
compared to a segment loss of ¥0.2 billion in the same period last year.
Adjustments
Adjustments to the total profit of reporting segments amounted to negative ¥25.0 billion. (Adjustments in
the same period last year were negative ¥19.0 billion.) The main components of the adjustment were basic
technology research and development expenses that do not correspond to the reporting segments and
expenses associated with things such as new businesses and corporate functions.

6
Liquidity and Financial Position
Total assets at the end of the second quarter were ¥1,039.5 billion, an increase of ¥65.1 billion from the
previous fiscal year end. This increase was mainly due to a ¥25.4 billion increase in inventories, an ¥11.8
billion increase in property, plant and equipment and intangible assets, a ¥10.9 billion increase in trade and
other receivables, a ¥9.6 billion increase in cash and cash equivalents, and a ¥4.5 billion increase in
deferred tax assets.
Total liabilities were ¥528.2 billion, up ¥48.5 billion compared to the end of the last fiscal year. Although
net defined benefit liabilities decreased by ¥5.6 billion and other current liabilities decreased by ¥5.0 billion,
total liabilities increased primarily because of a ¥34.1 billion increase in bonds issued, borrowings and
lease liabilities under current liabilities and non-current liabilities, an ¥11.8 billion increase in trade and
other payables, a ¥7.8 billion increase in other non-current liabilities, and a ¥2.8 billion increase in
provisions for current liabilities.
The equity attributable to owners of the parent company totaled ¥508.6 billion, a ¥16.4 billion increase
compared to the previous fiscal year end. While we paid ¥10.5 billion in dividends, equity attributable to
owners of the parent company increased mainly because retained earnings increased due to the recording of
a ¥14.9 billion profit for the period and because of a ¥7.1 billion remeasurement of the defined benefit plan.
Qualitative Information Regarding the Consolidated Financial Outlook
The consolidated financial outlook for the full year has not changed since it was announced on July 27,
2017.
The figures in the outlook are based on assumed exchange rates of 108.00 yen to the U.S. dollar and 123.00
yen to the euro in the third and fourth quarters.
Consolidated Full-Year Financial Outlook
FY2016 Previous Outlook
(A)
Current Outlook
(B)
Change (B - A)
Revenue ¥1,024.8 billion ¥1,070.0 billion ¥1,070.0 billion -
Business profit ¥65.8 billion ¥79.0 billion ¥79.0 billion -
Profit from operating
activities
¥67.8 billion ¥76.0 billion ¥76.0 billion -
Profit before tax ¥67.4 billion ¥76.0 billion ¥76.0 billion -
Profit for the period ¥48.4 billion ¥58.0 billion ¥58.0 billion -
Profit for the year
attributable to owners
of the parent company
¥48.3 billion ¥58.0 billion ¥58.0 billion
-
Foreign exchange rates $1USD = ¥108.38 $1USD = ¥109.00 $1USD = ¥110.00
1 EUR = ¥118.79 1 EUR = ¥123.00 1 EUR = ¥125.00

7
Quarterly Condensed Consolidated Statement of Financial Position
Thousands of
U.S. dollars
NotesMarch 31,
2017
September 30,
2017
September 30,
2017
Assets
Current assets
Cash and cash equivalents 221,782 231,438 2,055,217
Trade and other receivables 155,704 166,656 1,479,939
Inventories 208,512 233,925 2,077,302
Income tax receivables 2,476 2,635 23,399
Other financial assets 10 754 490 4,351
Other current assets 13,176 15,490 137,583
Subtotal 602,406 650,636 5,777,791
Non-current assets held for sale 39 43 381
Total current assets 602,446 650,680 5,778,172
Non-current assets
Property, plant and equipment 275,195 287,058 2,549,134
Intangible assets 21,553 21,540 191,279
Investment property 1,288 1,281 11,375
Investments accounted for using the equity
method1,438 1,499 13,311
Net defined benefit assets 0 - -
Other financial assets 10 20,544 20,658 183,447
Other non-current assets 5,486 5,887 52,307
Deferred tax assets 46,433 50,939 452,348
Total non-current assets 371,940 388,865 3,453,201
Total assets 974,387 1,039,545 9,231,373
Millions of yen

8
Thousands of
U.S. dollars
NotesMarch 31,
2017
September 30,
2017
September 30,
2017
Liabilities and equity
Liabilities
Current liabilities
Trade and other payables 141,633 153,485 1,362,978
Income tax payables 7,263 8,073 71,689
Bonds issued, borrowings and lease liabilities 6,10 76,200 100,399 891,563
Other financial liabilities 10 1,318 3,639 32,315
Provisions 21,981 24,786 220,104
Other current liabilities 102,992 97,988 870,174
Total current liabilities 351,389 388,372 3,448,823
Non-current liabilities
Bonds issued, borrowings and lease liabilities 6,10 70,371 80,309 713,160
Other financial liabilities 10 1,586 1,680 14,918
Net defined benefit liabilities 45,281 39,632 351,940
Provisions 6,209 5,658 50,244
Other non-current liabilities 3,521 11,358 100,891
Deferred tax liabilities 1,304 1,203 10,682
Total non-current liabilities 128,275 139,842 1,241,835
Total liabilities 479,664 528,215 4,690,658
Equity
Share capital 53,204 53,204 472,462
Capital surplus 84,321 84,337 748,929
Treasury shares 7 (30,812) (30,802) (273,528)
Other components of equity 53,176 58,028 515,311
Retained earnings 332,306 343,908 3,053,973
Equity attributable to owners of the parent
company492,196 508,676 4,517,147
Non-controlling interests 2,526 2,654 23,568
Total equity 494,722 511,330 4,540,715
Total liabilities and equity 974,387 1,039,545 9,231,373
Millions of yen

9
Quarterly Condensed Consolidated Statement of Comprehensive Income
Six months ended September 30, 2016 and 2017:
Thousands of U.S.
dollars
Notes 2016 2017
Revenue 5 487,569 527,327 4,682,772
Cost of sales (319,752) (343,508) (3,050,422)
Gross profit 167,817 183,819 1,632,350
Selling, general and administrative expenses (142,088) (155,676) (1,382,434)
Other operating income 3,018 1,266 11,242
Other operating expense (974) (5,719) (50,795)
Profit from operating activities 27,773 23,689 210,363
Finance income 709 607 5,390
Finance costs (1,426) (1,312) (11,641)
Share of profit of investments accounted for using the
equity method17 26 230
Profit before tax 27,073 23,011 204,342
Income taxes (8,462) (7,853) (69,745)
Profit from continuing operations 18,611 15,157 134,597
Loss from discontinued operations (5) - -
Profit for the period 18,605 15,157 134,597
Profit for the period attributable to:
Owners of the parent company 18,445 14,987 133,088
Non-controlling interests 160 170 1,509
Profit for the period 18,605 15,157 134,597
Millions of yen
Six months ended
September 30,
Six months ended
September 30,
2017

10
Thousands of U.S.
dollars
Notes 2016 2017
Other comprehensive income
Items that will not be reclassified subsequently to profit
or loss, net of tax
Remeasurement of net defined benefit liabilities (assets) (5,655) 7,184 63,795
Net gain (loss) on revaluation of financial assets
measured at FVTOCI (Note)(84) 66 595
Subtotal (5,740) 7,251 64,390
Items that may be reclassified subsequently to profit
or loss, net of tax
Exchange differences on translation of foreign
operations(29,618) 5,907 52,464
Net changes in fair value of cash flow hedges 806 (1,065) (9,457)
Share of other comprehensive income of investments
accounted for using the equity method(45) 13 115
Subtotal (28,857) 4,855 43,122
Total other comprehensive income, net of tax (34,598) 12,106 107,512
Total comprehensive income for the period (15,992) 27,264 242,109
Total comprehensive income for the period
attributable to:
Owners of the parent company (15,800) 27,019 239,943
Non-controlling interests (192) 244 2,166
Total comprehensive income for the period (15,992) 27,264 242,109
(Note) FVTOCI: Fair Value Through Other Comprehensive Income
U.S. dollars
Notes 2016 2017
Earnings per share for the period:
Basic earnings per share for the period 9 52.09 42.55 0.38
Diluted earnings per share for the period 9 52.09 42.54 0.38
Earnings per share from continuing operations for the
period:
Basic earnings per share for the period 9 52.11 42.55 0.38
Diluted earnings per share for the period 9 52.11 42.54 0.38
Earnings per share from discontinued operations for the
period:
Basic loss per share for the period 9 (0.02) - -
Diluted loss per share for the period 9 (0.02) - -
Millions of yen
Six months ended
September 30,
Six months ended
September 30,
2017
Yen
Six months ended
September 30,
Six months ended
September 30,
2017
11
Quarterly Condensed Consolidated Statement of Comprehensive Income
Three months ended September 30, 2016 and 2017:
Thousands of U.S.
dollars
Notes 2016 2017
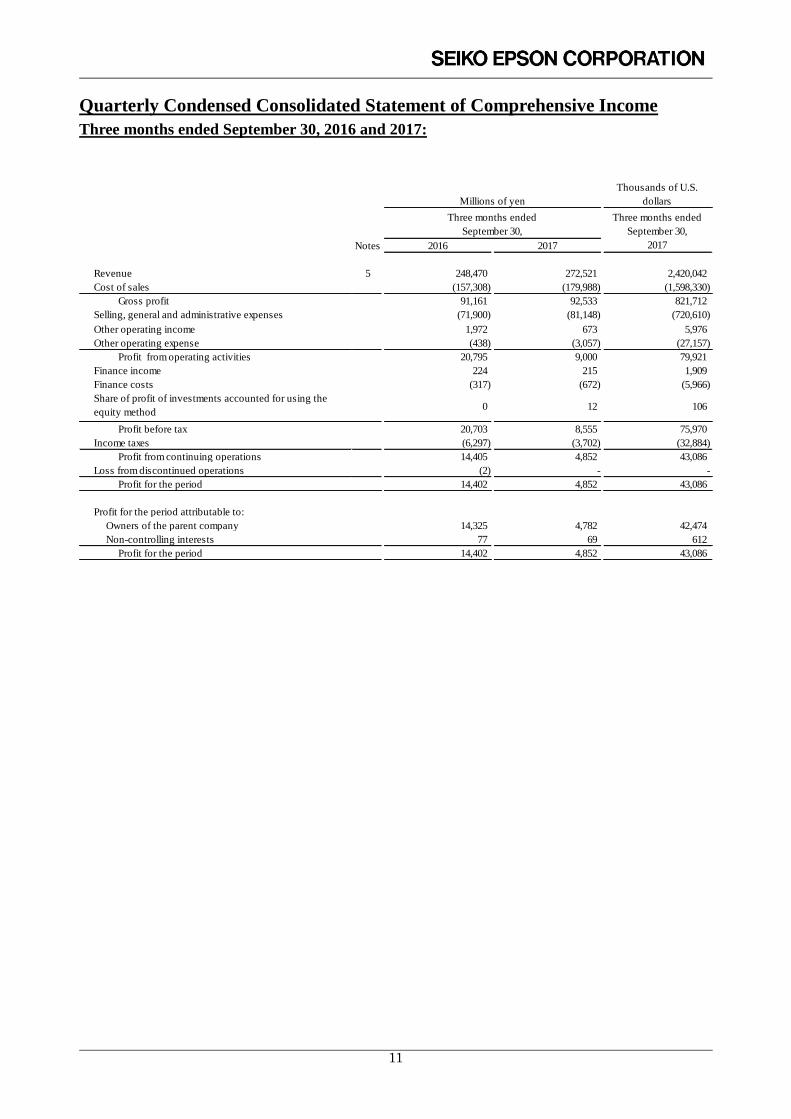
Revenue 5 248,470 272,521 2,420,042
Cost of sales (157,308) (179,988) (1,598,330)
Gross profit 91,161 92,533 821,712
Selling, general and administrative expenses (71,900) (81,148) (720,610)
Other operating income 1,972 673 5,976
Other operating expense (438) (3,057) (27,157)
Profit from operating activities 20,795 9,000 79,921
Finance income 224 215 1,909
Finance costs (317) (672) (5,966)
Share of profit of investments accounted for using the
equity method0 12 106
Profit before tax 20,703 8,555 75,970
Income taxes (6,297) (3,702) (32,884)
Profit from continuing operations 14,405 4,852 43,086
Loss from discontinued operations (2) - -
Profit for the period 14,402 4,852 43,086
Profit for the period attributable to:
Owners of the parent company 14,325 4,782 42,474
Non-controlling interests 77 69 612
Profit for the period 14,402 4,852 43,086
Millions of yen
Three months ended
September 30,
Three months ended
September 30,
2017

12
Thousands of U.S.
dollars
Notes 2016 2017
Other comprehensive income
Items that will not be reclassified subsequently to profit
or loss, net of tax
Remeasurement of net defined benefit liabilities (assets) (1,584) 3,935 34,943
Net gain (loss) on revaluation of financial assets
measured at FVTOCI (Note)569 (175) (1,563)
Subtotal (1,015) 3,759 33,380
Items that may be reclassified subsequently to profit
or loss, net of tax
Exchange differences on translation of foreign
operations(4,404) 3,364 29,901
Net changes in fair value of cash flow hedges (1,696) 809 7,184
Share of other comprehensive income of investments
accounted for using the equity method(4) 8 71
Subtotal (6,105) 4,182 37,156
Total other comprehensive income, net of tax (7,120) 7,942 70,536
Total comprehensive income for the period 7,282 12,795 113,622
Total comprehensive income for the period
attributable to:
Owners of the parent company 7,255 12,673 112,548
Non-controlling interests 27 121 1,074
Total comprehensive income for the period 7,282 12,795 113,622
(Note) FVTOCI: Fair Value Through Other Comprehensive Income
U.S. dollars
Notes 2016 2017
Earnings per share for the period:
Basic earnings per share for the period 9 40.66 13.58 0.12
Diluted earnings per share for the period 9 40.66 13.58 0.12
Earnings per share from continuing operations for the
period:
Basic earnings per share for the period 9 40.67 13.58 0.12
Diluted earnings per share for the period 9 40.67 13.58 0.12
Earnings per share from discontinued operations for the
period:
Basic loss per share for the period 9 (0.01) - -
Diluted loss per share for the period 9 (0.01) - -
Millions of yen
Three months ended
September 30,
Three months ended
September 30,
2017
Yen
Three months ended
September 30,
Three months ended
September 30,
2017

13
Quarterly Condensed Consolidated Statement of Changes in Equity
Six months ended September 30, 2016 and 2017:
Notes
Remeasurement of net
defined benefit
liabilities (assets)
Net gain (loss) on
revaluation of financial
assets measured at
FVTOCI (Note)
Exchange differences
on translation of
foreign operations
Net changes in fair
value of cash flow
hedges
Total other
components of equity
As of April 1, 2016 53,204 84,321 (20,471) - 4,533 53,616 (160) 57,989 292,775 467,818 2,858 470,676
Profit for the period - - - - - - - - 18,445 18,445 160 18,605
Other comprehensive income - - - (5,653) (82) (29,314) 806 (34,245) - (34,245) (352) (34,598)
Total comprehensive income for the period - - - (5,653) (82) (29,314) 806 (34,245) 18,445 (15,800) (192) (15,992)
Acquisition of treasury shares 7 - - (10,338) - - - - - - (10,338) - (10,338)
Dividends 8 - - - - - - - - (10,733) (10,733) (237) (10,970)
Share-based payment transactions - - - - - - - - - - - -
Transfer from other components of equity
to retained earnings - - - 5,653 (16) - - 5,637 (5,637) - - -
Total transactions with the owners - - (10,338) 5,653 (16) - - 5,637 (16,370) (21,071) (237) (21,309)
As of September 30, 2016 53,204 84,321 (30,810) - 4,433 24,301 645 29,381 294,850 430,946 2,428 433,374
(Note) FVTOCI: Fair Value Through Other Comprehensive Income
Millions of yen
Equity attributable to owners of the parent company
Non-controlling
interestsTotal equity
Share capital Capital surplus Treasury shares
Other components of equity
Retained
earnings
Total equity
attributable to owners
of the parent
company
14
Notes
Remeasurement of net
defined benefit
liabilities (assets)
Net gain (loss) on
revaluation of financial
assets measured at
FVTOCI (Note)
Exchange differences
on translation of
foreign operations
Net changes in fair
value of cash flow
hedges
Total other
components of equity
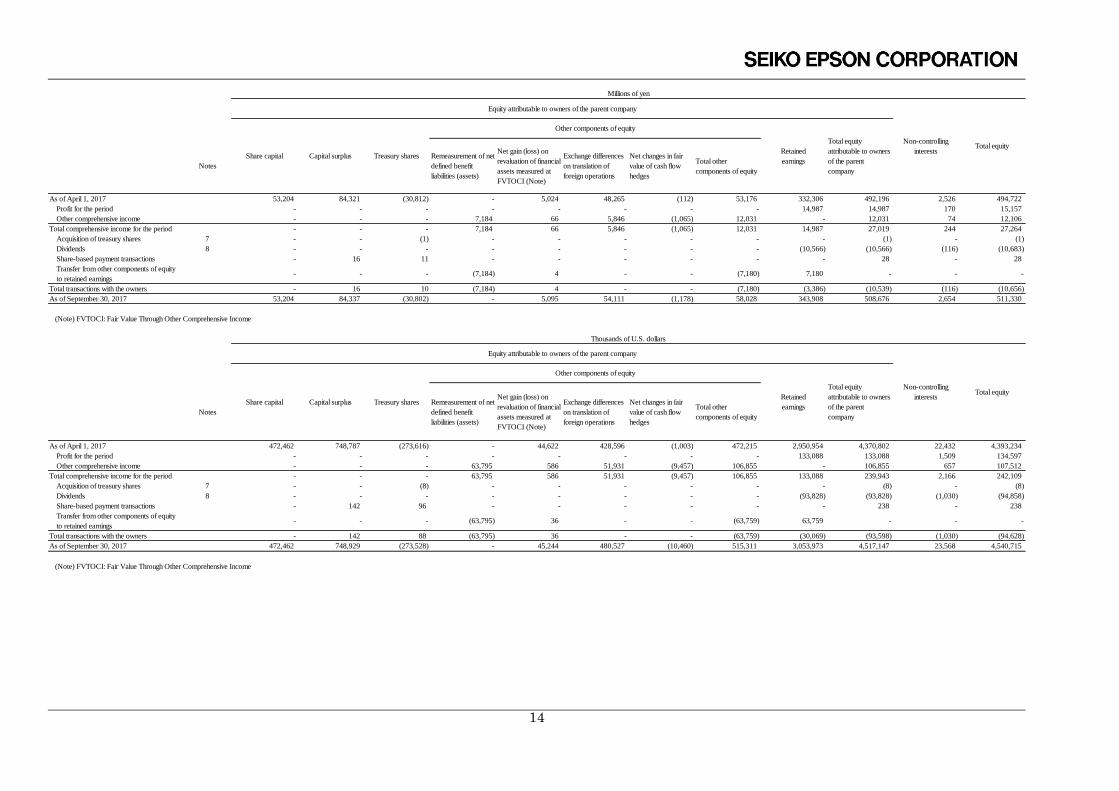
As of April 1, 2017 53,204 84,321 (30,812) - 5,024 48,265 (112) 53,176 332,306 492,196 2,526 494,722
Profit for the period - - - - - - - - 14,987 14,987 170 15,157
Other comprehensive income - - - 7,184 66 5,846 (1,065) 12,031 - 12,031 74 12,106
Total comprehensive income for the period - - - 7,184 66 5,846 (1,065) 12,031 14,987 27,019 244 27,264
Acquisition of treasury shares 7 - - (1) - - - - - - (1) - (1)
Dividends 8 - - - - - - - - (10,566) (10,566) (116) (10,683)
Share-based payment transactions - 16 11 - - - - - - 28 - 28
Transfer from other components of equity
to retained earnings - - - (7,184) 4 - - (7,180) 7,180 - - -
Total transactions with the owners - 16 10 (7,184) 4 - - (7,180) (3,386) (10,539) (116) (10,656)
As of September 30, 2017 53,204 84,337 (30,802) - 5,095 54,111 (1,178) 58,028 343,908 508,676 2,654 511,330
(Note) FVTOCI: Fair Value Through Other Comprehensive Income
Notes
Remeasurement of net
defined benefit
liabilities (assets)
Net gain (loss) on
revaluation of financial
assets measured at
FVTOCI (Note)
Exchange differences
on translation of
foreign operations
Net changes in fair
value of cash flow
hedges
Total other
components of equity
As of April 1, 2017 472,462 748,787 (273,616) - 44,622 428,596 (1,003) 472,215 2,950,954 4,370,802 22,432 4,393,234
Profit for the period - - - - - - - - 133,088 133,088 1,509 134,597
Other comprehensive income - - - 63,795 586 51,931 (9,457) 106,855 - 106,855 657 107,512
Total comprehensive income for the period - - - 63,795 586 51,931 (9,457) 106,855 133,088 239,943 2,166 242,109
Acquisition of treasury shares 7 - - (8) - - - - - - (8) - (8)
Dividends 8 - - - - - - - - (93,828) (93,828) (1,030) (94,858)
Share-based payment transactions - 142 96 - - - - - - 238 - 238
Transfer from other components of equity
to retained earnings - - - (63,795) 36 - - (63,759) 63,759 - - -
Total transactions with the owners - 142 88 (63,795) 36 - - (63,759) (30,069) (93,598) (1,030) (94,628)
As of September 30, 2017 472,462 748,929 (273,528) - 45,244 480,527 (10,460) 515,311 3,053,973 4,517,147 23,568 4,540,715
(Note) FVTOCI: Fair Value Through Other Comprehensive Income
Millions of yen
Equity attributable to owners of the parent company
Non-controlling
interestsTotal equity
Share capital Capital surplus Treasury shares
Other components of equity
Retained
earnings
Total equity
attributable to owners
of the parent
company
Thousands of U.S. dollars
Equity attributable to owners of the parent company
Non-controlling
interestsTotal equity
Share capital Capital surplus Treasury shares
Other components of equity
Retained
earnings
Total equity
attributable to owners
of the parent
company

15
Quarterly Condensed Consolidated Statement of Cash Flows
Six months ended September 30, 2016 and 2017:
Thousands of U.S. dollars
Six months ended
September 30,
Notes 2016 2017 2017
Cash flows from operating activities
Profit for the period 18,605 15,157 134,597
Depreciation and amortisation 21,091 24,367 216,383
Impairment loss and reversal of impairment loss 106 878 7,796
Finance (income) costs, net 717 704 6,251
Share of (profit) loss of investments accounted for using the equity
method(17) (26) (230)
Loss (gain) on sales and disposal of property, plant and equipment,
intangible assets and investment property, net118 386 3,427
Income taxes 8,462 7,853 69,745
Decrease (increase) in trade receivables (3,717) (8,623) (76,574)
Decrease (increase) in inventories (15,604) (19,646) (174,460)
Increase (decrease) in trade payables 17,662 17,021 151,149
Increase (decrease) in net defined benefit liabilities 848 917 8,143
Other, net (5,115) (490) (4,331)
Subtotal 43,157 38,501 341,896
Interest and dividend income received 745 629 5,585
Interest expenses paid (541) (448) (3,978)
Payments for loss on litigation - (564) (5,008)
Income taxes paid (10,154) (11,452) (101,714)
Net cash provided by (used in) operating activities 33,207 26,664 236,781
Cash flows from investing activities
Proceeds from sales of investment securities 46 - -
Purchase of property, plant and equipment (31,074) (38,432) (341,284)
Proceeds from sales of property, plant and equipment 597 305 2,708
Purchase of intangible assets (3,883) (2,443) (21,694)
Proceeds from sales of intangible assets 0 0 0
Proceeds from sales of investment property 13 9 79
Purchase of investments in subsidiaries (2,743) - -
Other, net (79) (1,171) (10,388)
Net cash provided by (used in) investing activities (37,123) (41,731) (370,579)
Cash flows from financing activities
Net increase (decrease) in current borrowings (14,057) 23,695 210,406
Proceeds from issuance of bonds issued 49,759 19,896 176,680
Redemption of bonds issued (30,000) (10,000) (88,802)
Payments of lease obligations (47) (46) (408)
Dividends paid 8 (10,733) (10,566) (93,828)
Dividends paid to non-controlling interests (236) (116) (1,030)
Purchase of treasury shares (10,338) (1) (8)
Net cash provided by (used in) financing activities (15,654) 22,861 203,010
Effect of exchange rate changes on cash and cash equivalents (9,731) 1,861 16,536
Net increase (decrease) in cash and cash equivalents (29,302) 9,655 85,748
Cash and cash equivalents at beginning of period 230,498 221,782 1,969,469
Cash and cash equivalents at end of period 201,196 231,438 2,055,217
Millions of yen
Six months ended
September 30,

16
Notes to Consolidated Financial Statements
1. Reporting Entity
Seiko Epson Corporation (the “Company”) is a stock corporation domiciled in Japan. The addresses of the
Company’s registered head office and principal business offices are available on the Company’s website
(http://global.epson.com/). The details of businesses and principal business activities of the Company and its
affiliates (“Epson”) are stated in “5. Segment Information”.
2. Basis of Preparation
Epson’s quarterly condensed consolidated financial statements have been prepared in accordance with IAS 34
“Interim Financial Reporting”, under the provision of Article 93 of Ordinance on Terminology, Forms and
Preparation Methods of Quarterly Consolidated Financial Statements, as the Company meets the criteria of a
“Specified Company applying Designated International Accounting Standards” defined under Article 1-2 of the
Ordinance.
Epson’s quarterly condensed consolidated financial statements do not contain all the information required in annual
consolidated financial statements, therefore they should be used in combination with the consolidated financial
statements for the fiscal year ended March 31, 2017.
3. Significant Accounting Policies The significant accounting policies adopted for Epson’s quarterly condensed consolidated financial statements are
the same as those for Epson’s consolidated financial statements for the fiscal year ended March 31, 2017.
Epson calculated income taxes for the six-month period ended September 30, 2017 based on an estimated average
annual effective income tax rate.
4. Significant Accounting Estimates and Judgments
The preparation of Epson’s quarterly condensed consolidated financial statements includes management estimates
and assumptions in order to measure income, expenses, assets and liabilities, and disclosed contingencies as of
September 30, 2017. These estimates and assumptions are based on the best judgment of management in light of
historical experience and various factors deemed to be reasonable as of September 30, 2017. Given their nature,
actual results may differ from the outcome of those estimates and assumptions.
The estimates and assumptions are continuously reviewed by management. The effects of a change in estimates and
assumptions are recognised in the period of the change and its subsequent periods. Estimates and assumptions
having a significant effects on the amounts recognised in Epson’s quarterly condensed consolidated financial
statements are consistent in principle with those for the fiscal year ended March 31, 2017.
17
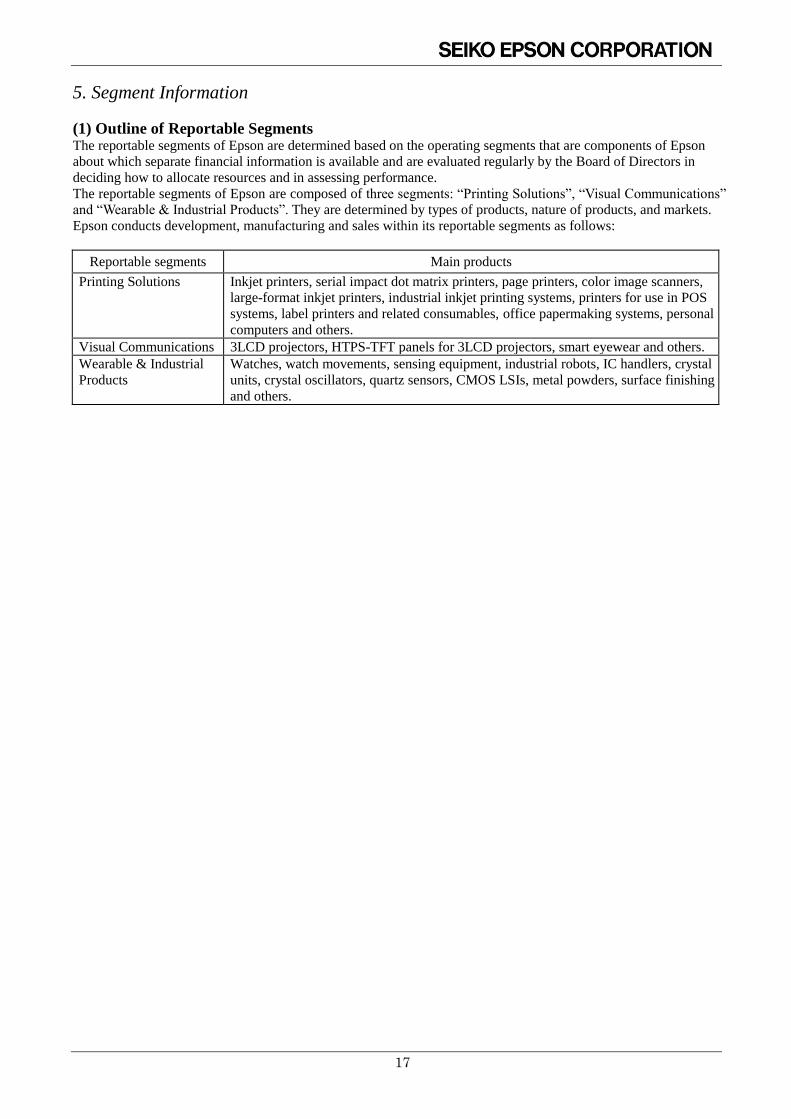
5. Segment Information
(1) Outline of Reportable Segments The reportable segments of Epson are determined based on the operating segments that are components of Epson
about which separate financial information is available and are evaluated regularly by the Board of Directors in
deciding how to allocate resources and in assessing performance.
The reportable segments of Epson are composed of three segments: “Printing Solutions”, “Visual Communications”
and “Wearable & Industrial Products”. They are determined by types of products, nature of products, and markets.
Epson conducts development, manufacturing and sales within its reportable segments as follows:
Reportable segments Main products
Printing Solutions Inkjet printers, serial impact dot matrix printers, page printers, color image scanners,
large-format inkjet printers, industrial inkjet printing systems, printers for use in POS
systems, label printers and related consumables, office papermaking systems, personal
computers and others.
Visual Communications 3LCD projectors, HTPS-TFT panels for 3LCD projectors, smart eyewear and others.
Wearable & Industrial
Products
Watches, watch movements, sensing equipment, industrial robots, IC handlers, crystal
units, crystal oscillators, quartz sensors, CMOS LSIs, metal powders, surface finishing
and others.

18
(2) Revenues and Performances for Reportable Segments Revenues and performances for reportable segments were as follows. Transactions between the segments were
mainly based on prevailing market prices.
FY2016: Six months ended September 30, 2016
Millions of yen
Reportable segments
Other (Note 2)
Adjustments (Note 3)
Consolidated
Printing
Solutions
Visual Communi-
cations
Wearable &
Industrial
Products Subtotal
Revenue
External revenue 318,507 87,692 77,235 483,435 314 3,820 487,569
Inter-segment revenue 123 12 3,777 3,912 341 (4,254) -
Total revenue 318,630 87,704 81,012 487,347 656 (434) 487,569
Segment profit (loss)
(Business profit)
(Note 1)
33,944 7,186 3,990 45,121 (294) (19,097) 25,729
Other operating income (expense)
2,043
Profit from operating activities 27,773
Finance income (costs), net (717)
Share of profit of investments accounted for using the equity method
17
Profit before tax 27,073
(Note 1) Segment profit (loss) (Business profit) is calculated by subtracting Cost of sales and Selling, general and
administrative expenses from Revenue.
(Note 2) “Other” consists of the intra-group services.
(Note 3) “Adjustments” to Segment profit (loss) (Business profit) of (¥19,097) million comprised “Eliminations” of
¥235 million and “Corporate expenses” of (¥19,332) million. “Corporate expenses” included expenses relating to
research and development for basic technology, new businesses and general corporate expenses which are not
attributed to reportable segments.

19
FY2017: Six months ended September 30, 2017
Millions of yen
Reportable segments
Other (Note 2)
Adjustments (Note 3)
Consolidated
Printing
Solutions
Visual Communi-
cations
Wearable &
Industrial
Products Subtotal
Revenue
External revenue 341,960 99,169 81,991 523,121 87 4,118 527,327
Inter-segment revenue 135 1 4,324 4,460 374 (4,835) -
Total revenue 342,095 99,170 86,316 527,582 462 (717) 527,327
Segment profit (loss)
(Business profit)
(Note 1)
35,947 12,754 4,791 53,493 (275) (25,075) 28,142
Other operating income (expense)
(4,453)
Profit from operating activities 23,689
Finance income (costs), net (704)
Share of profit of investments accounted for using the equity method
26
Profit before tax 23,011
(Note 1) Segment profit (loss) (Business profit) is calculated by subtracting Cost of sales and Selling, general and
administrative expenses from Revenue.
(Note 2) “Other” consists of the intra-group services.
(Note 3) “Adjustments” to Segment profit (loss) (Business profit) of (¥25,075) million comprised “Eliminations”
of ¥242 million and “Corporate expenses” of (¥25,317) million. “Corporate expenses” included expenses relating
to research and development for basic technology, new businesses and general corporate expenses which are not
attributed to reportable segments.

20
FY2017: Six months ended September 30, 2017
Thousands of U.S. dollars
Reportable segments
Other (Note 2)
Adjustments (Note 3)
Consolidated
Printing
Solutions
Visual Communi-
cations
Wearable &
Industrial
Products Subtotal
Revenue
External revenue 3,036,694 880,641 728,096 4,645,431 772 36,569 4,682,772
Inter-segment revenue 1,189 9 38,407 39,605 3,330 (42,935) -
Total revenue 3,037,883 880,650 766,503 4,685,036 4,102 (6,366) 4,682,772
Segment profit (loss)
(Business profit)
(Note 1)
319,225 113,258 42,545 475,028 (2,441) (222,671) 249,916
Other operating income (expense)
(39,553)
Profit from operating activities 210,363
Finance income (costs), net (6,251)
Share of profit of investments accounted for using the equity method
230
Profit before tax 204,342
(Note 1) Segment profit (loss) (Business profit) is calculated by subtracting Cost of sales and Selling, general and
administrative expenses from Revenue.
(Note 2) “Other” consists of the intra-group services.
(Note 3) “Adjustments” to Segment profit (loss) (Business profit) of ($222,671) thousand comprised “Eliminations”
of $2,149 thousand and “Corporate expenses” of ($224,820) thousand. “Corporate expenses” included expenses
relating to research and development for basic technology, new businesses and general corporate expenses which
are not attributed to reportable segments.

21
FY2016: Three months ended September 30, 2016
Millions of yen
Reportable segments
Other (Note 2)
Adjustments (Note 3)
Consolidated
Printing
Solutions
Visual Communi-
cations
Wearable &
Industrial
Products Subtotal
Revenue
External revenue 161,253 46,081 38,399 245,734 177 2,558 248,470
Inter-segment revenue 54 12 2,134 2,200 174 (2,374) -
Total revenue 161,307 46,093 40,534 247,935 351 183 248,470
Segment profit (loss)
(Business profit)
(Note 1)
21,081 5,023 2,340 28,445 (85) (9,098) 19,261
Other operating income (expense)
1,534
Profit from operating activities 20,795
Finance income (costs), net (93)
Share of profit of investments accounted for using the equity method
0
Profit before tax 20,703
(Note 1) Segment profit (loss) (Business profit) is calculated by subtracting Cost of sales and Selling, general and
administrative expenses from Revenue.
(Note 2) “Other” consists of the intra-group services.
(Note 3) “Adjustments” to Segment profit (loss) (Business profit) of (¥9,098) million comprised “Eliminations” of
¥120 million and “Corporate expenses” of (¥9,219) million. “Corporate expenses” included expenses relating to
research and development for basic technology, new businesses and general corporate expenses which are not
attributed to reportable segments.

22
FY2017: Three months ended September 30, 2017
Millions of yen
Reportable segments
Other (Note 2)
Adjustments (Note 3)
Consolidated
Printing
Solutions
Visual Communi-
cations
Wearable &
Industrial
Products Subtotal
Revenue
External revenue 176,038 52,812 41,076 269,928 44 2,549 272,521
Inter-segment revenue 66 0 2,215 2,283 177 (2,460) -
Total revenue 176,105 52,813 43,292 272,211 221 89 272,521
Segment profit (loss)
(Business profit)
(Note 1)
13,838 7,490 2,400 23,728 (105) (12,238) 11,384
Other operating income (expense)
(2,384)
Profit from operating activities 9,000
Finance income (costs), net (457)
Share of profit of investments accounted for using the equity method
12
Profit before tax 8,555
(Note 1) Segment profit (loss) (Business profit) is calculated by subtracting Cost of sales and Selling, general and
administrative expenses from Revenue.
(Note 2) “Other” consists of the intra-group services.
(Note 3) “Adjustments” to Segment profit (loss) (Business profit) of (¥12,238) million comprised “Eliminations”
of ¥121 million and “Corporate expenses” of (¥12,359) million. “Corporate expenses” included expenses relating
to research and development for basic technology, new businesses and general corporate expenses which are not
attributed to reportable segments.
23
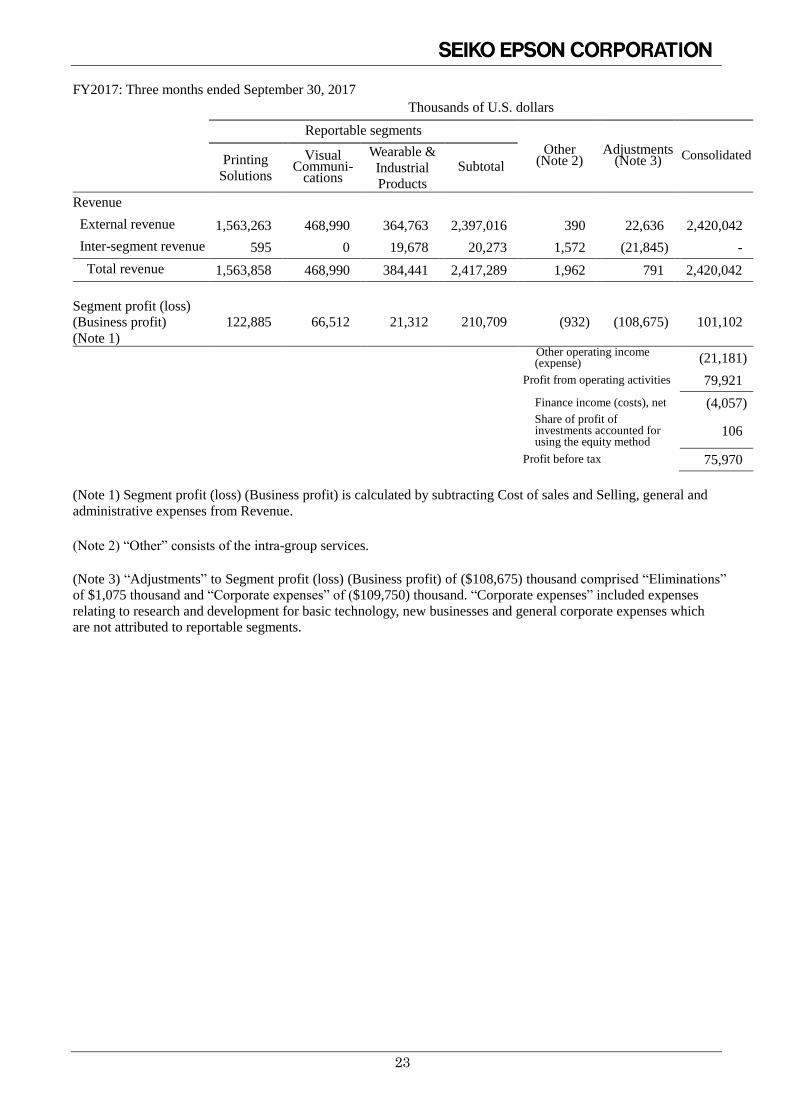
FY2017: Three months ended September 30, 2017
Thousands of U.S. dollars
Reportable segments
Other (Note 2)
Adjustments (Note 3)
Consolidated
Printing
Solutions
Visual Communi-
cations
Wearable &
Industrial
Products Subtotal
Revenue
External revenue 1,563,263 468,990 364,763 2,397,016 390 22,636 2,420,042
Inter-segment revenue 595 0 19,678 20,273 1,572 (21,845) -
Total revenue 1,563,858 468,990 384,441 2,417,289 1,962 791 2,420,042
Segment profit (loss)
(Business profit)
(Note 1)
122,885 66,512 21,312 210,709 (932) (108,675) 101,102
Other operating income (expense)
(21,181)
Profit from operating activities 79,921
Finance income (costs), net (4,057)
Share of profit of investments accounted for using the equity method
106
Profit before tax 75,970
(Note 1) Segment profit (loss) (Business profit) is calculated by subtracting Cost of sales and Selling, general and
administrative expenses from Revenue.
(Note 2) “Other” consists of the intra-group services.
(Note 3) “Adjustments” to Segment profit (loss) (Business profit) of ($108,675) thousand comprised “Eliminations”
of $1,075 thousand and “Corporate expenses” of ($109,750) thousand. “Corporate expenses” included expenses
relating to research and development for basic technology, new businesses and general corporate expenses which
are not attributed to reportable segments.

24
6. Bonds issued, Borrowings and Lease liabilities
The breakdown of “Bonds issued, borrowings and lease liabilities” was as follows:
(Note) Issuance of “Bonds issued”
The issued “Bonds issued” for the six months ended September 30, 2016 were as follows:
The issued “Bonds issued” for the six months ended September 30, 2017 were as follows:
Thousands of
U.S. dollars
March 31, 2017 September 30, 2017 September 30, 2017
Current borrowings 16,118 40,312 357,978
Current portion of non-current
borrowings50,000 50,000 444,010
Current portion of bonds issued
(Note)9,995 9,991 88,722
Non-current borrowings 499 499 4,431
Bonds issued (Note) 69,742 79,677 707,567
Lease liabilities 216 227 2,015
Total 146,572 180,708 1,604,723
Current liabilities 76,200 100,399 891,563
Non-current liabilities 70,371 80,309 713,160
Total 146,572 180,708 1,604,723
Millions of yen
FY2016: Six months ended September 30, 2016
% Millions of yen
Interest rateTotal amount of
issuance
The 13th Series unsecured straight bonds
(with inter-bond pari passu clause)September 21, 2016
The CompanyThe 14th Series unsecured straight bonds
(with inter-bond pari passu clause)September 21, 2016 0.27
0.34 September 18, 2026
Company Bonds name Issue date Maturity date
20,000
0.10 September 21, 2021 20,000The Company
The Company 10,000The 15th Series unsecured straight bonds
(with inter-bond pari passu clause)September 21, 2016
September 21, 2023
FY2017: Six months ended September 30, 2017
% Millions of yen
Thousands of
U.S. dollars
Interest rateTotal amount of
issuance
Total amount of
issuance
88,802September 6, 2027 10,000
88,802
Maturity date
The CompanyThe 16th Series unsecured straight bonds
(with inter-bond pari passu clause)September 6, 2017 0.26 September 6, 2024
Company Bonds name Issue date
The CompanyThe 17th Series unsecured straight bonds
(with inter-bond pari passu clause)September 6, 2017 0.36
10,000

25
(Note) Redemption of “Bonds issued”
The redeemed “Bonds issued” for the six months ended September 30, 2016 were as follows:
The redeemed “Bonds issued” for the six months ended September 30, 2017 were as follows:
Bonds issued, borrowings and lease liabilities are classified as financial liabilities measured at amortised cost.
There are no financial covenants on bonds issued and borrowings that have a significant impact on Epson's
financing activities.
7. Equity and Other Equity Items
In the six months ended September 30, 2016, the Company repurchased its own shares based on the resolution at
the meeting of its Board of Directors held on April 28, 2016.
Details of the repurchase
(1) Class of shares repurchased Ordinary shares
(2) Total number of shares repurchased 5,370,000 shares
(3) Total repurchase amount 9,987,101,600 yen
(4) Repurchase period May 2, 2016 - June 30, 2016 (on an agreement base)
(5) Repurchase method Through securities company using discretionary transactions method
FY2016: Six months ended September 30, 2016
% Millions of yen
Interest rateTotal amount of
issuance
The CompanyThe 10th Series unsecured straight bonds
(with inter-bond pari passu clause)September 11, 2013 0.33 September 9, 2016
The CompanyThe 7th Series unsecured straight bonds
(with inter-bond pari passu clause)June 14, 2011 0.72 June 14, 2016 20,000
10,000
Maturity dateBonds name Issue dateCompany
FY2017: Six months ended September 30, 2017
% Millions of yen
Thousands of
U.S. dollars
Interest rateTotal amount of
issuance
Total amount of
issuance
10,000 88,802
Company Bonds name Issue date Maturity date
The CompanyThe 9th Series unsecured straight bonds
(with inter-bond pari passu clause)September 12, 2012 0.67 September 12, 2017

26
8. Dividends
Dividends paid were as follows:
Dividends whose basis dates were during the six months ended September 30, 2016 and 2017, but whose effective
dates were subsequent to September 30, 2016 and 2017 were as follows:
FY2016: Six months ended September 30, 2016
Millions of yen Yen
Total dividendsDividends
per share
FY2017: Six months ended September 30, 2017
Millions of yen Yen
Total dividendsDividends
per share
FY2017: Six months ended September 30, 2017
Thousands of U.S.
dollars U.S. dollars
Total dividendsDividends
per share
30 March 31, 2016 June 29, 2016
(Resolution) Class of shares Basis date Effective date
Annual Shareholders Meeting
(June 28, 2016)Ordinary shares 10,733
(Resolution) Class of shares Basis date Effective date
Annual Shareholders Meeting
(June 28, 2017)Ordinary shares 10,572 30 March 31, 2017 June 29, 2017
(Resolution) Class of shares Basis date Effective date
March 31, 2017 June 29, 2017Annual Shareholders Meeting
(June 28, 2017)Ordinary shares 93,881 0.26
FY2016: Six months ended September 30, 2016
Millions of yen Yen
Total dividendsDividends
per share
FY2017: Six months ended September 30, 2017
Millions of yen Yen
Total dividendsDividends
per share
FY2017: Six months ended September 30, 2017
Thousands of U.S.
dollars U.S. dollars
Total dividendsDividends
per share
(Resolution) Class of shares Basis date Effective date
September 30,
2016
November 30,
2016
(Resolution) Class of shares Basis date Effective date
Board of Directors
(October 27, 2016)Ordinary shares 10,572 30
September 30,
2017
November 30,
2017
(Resolution) Class of shares Basis date Effective date
Board of Directors
(October 26, 2017)Ordinary shares 10,572 30
September 30,
2017
November 30,
2017
Board of Directors
(October 26, 2017)Ordinary shares 93,881 0.26

27
9. Earnings per Share
(1) Basis of calculating basic earnings per share
(A) Profit attributable to ordinary shareholders of the parent company
(B) Weighted-average number of ordinary shares outstanding during the period
Thousands of shares
Six months ended
September 30, 2016
Six months ended September 30, 2017
Weighted-average number of
ordinary shares 354,092 352,226
Thousands of shares
Three months ended September 30, 2016
Three months ended September 30, 2017
Weighted-average number of
ordinary shares 352,300 352,228
Millions of yen
Thousands of
U.S. dollars
Six months ended
September 30, Six months ended
September 30,
2016 2017 2017
Profit from continuing operations
attributable to owners of the parent
company
18,450 14,987 133,088
Loss from discontinued operations
attributable to owners of the parent
company
(5) - -
Profit used for calculation of basic
earnings per share 18,445 14,987 133,088
Millions of yen
Thousands of
U.S. dollars
Three months ended
September 30, Three months ended
September 30,
2016 2017 2017
Profit from continuing operations
attributable to owners of the parent
company
14,327 4,782 42,474
Loss from discontinued operations
attributable to owners of the parent
company
(2) - -
Profit used for calculation of basic
earnings per share 14,325 4,782 42,474

28
(2) Basis of calculating diluted earnings per share
(A) Profit attributable to ordinary shareholders of the parent company
Millions of yen
Thousands of
U.S. dollars
Six months ended
September 30, Six months ended
September 30,
2016 2017 2017
Profit from continuing operations
attributable to owners of the parent
company
18,450 14,987 133,088
Adjustments - - -
Profit from continuing operations
attributable to owners of the parent
company used for calculation of diluted
earnings per share
18,450 14,987 133,088
Loss from discontinued operations
attributable to owners of the parent
company
(5) - -
Adjustments - - -
Loss from discontinued operations
attributable to owners of the parent
company used for calculation of diluted
earnings per share
(5) - -
Profit attributable to owners of the parent
company 18,445 14,987 133,088
Adjustments - - -
Profit used for calculation of diluted
earnings per share 18,445 14,987 133,088

29
(B) Weighted-average number of ordinary shares outstanding during the period
Thousands of shares
Six months ended
September 30, 2016
Six months ended September 30, 2017
Weighted-average number of
ordinary shares 354,092 352,226
Effect of dilutive securities
BIP trust for eligible officers - 60
Diluted outstanding shares 354,092 352,286
Millions of yen
Thousands of
U.S. dollars
Three months ended
September 30, Three months ended
September 30,
2016 2017 2017
Profit from continuing operations
attributable to owners of the parent
company
14,327 4,782 42,474
Adjustments - - -
Profit from continuing operations
attributable to owners of the parent
company used for calculation of diluted
earnings per share
14,327 4,782 42,474
Loss from discontinued operations
attributable to owners of the parent
company
(2) - -
Adjustments - - -
Loss from discontinued operations
attributable to owners of the parent
company used for calculation of diluted
earnings per share
(2) - -
Profit attributable to owners of the parent
company 14,325 4,782 42,474
Adjustments - - -
Profit used for calculation of diluted
earnings per share 14,325 4,782 42,474

30
Thousands of shares
Three months ended September 30, 2016
Three months ended September 30, 2017
Weighted-average number of
ordinary shares 352,300 352,228
Effect of dilutive securities
BIP trust for eligible officers - 80
Diluted outstanding shares 352,300 352,308
(Note) In the calculation of basic earnings per share and diluted earnings per share, because the shares of the
Company held by BIP trust are accounted as treasury shares, the number of those shares are deducted from
weighted-average number of common shares outstanding during the period.
10. Fair Value of Financial Instruments
(1) Fair value measurement The fair values of financial assets and liabilities are determined as follows:
(Derivatives)
The fair values are calculated based on prices obtained from financial institutions.
(Equity securities and bonds receivable)
When market values for equity securities and bonds receivable are available, such values are used as the fair values.
The fair values of the equity securities and bonds receivable whose market values are unavailable are measured by
using the discounted cash flow method, price comparison method based on the prices of similar types of securities
and bonds and other valuation methods.
(Borrowings)
As current borrowings are settled on a short-term basis, the fair values approximate their carrying amounts. For
non-current borrowings with floating rates, it is assumed that the fair value is equal to the carrying amounts,
because the rates are affected in the short term by fluctuations in market interest rates, and because Epson’s credit
status has not greatly changed since they were implemented. The fair values of non-current borrowings with fixed
rates are calculated by the total sum of the principal and interest discounted by using the interest rates that would be
applied if similar new borrowings were conducted.
(Bonds issued)
The fair values are calculated based on prices obtained from financial institutions.
(Lease obligations)
The fair values are calculated based on the present value of the total amount discounted by the interest rate
corresponding to the period to maturity and the credit risk per each lease obligation classified per certain period.
(Other)
Other financial instruments are settled mainly on a short-term basis, and the fair values approximate the carrying
amounts.

31
(2) Fair value hierarchy The fair value hierarchy of financial instruments is categorised from Level 1 to Level 3 as follows:
Level 1: Fair value measured at quoted prices in active markets for identical assets or liabilities
Level 2: Fair value calculated using inputs other than quoted prices included within Level 1 that are observable,
either directly or indirectly
Level 3: Fair value calculated using valuation techniques including unobservable inputs for the assets and liabilities
Epson does not have any financial instruments for which there is significant measurement uncertainty and
subjectivity which needs to subdivide each level stated above for disclosure.
The transfers between levels in the fair value hierarchy are deemed to have occurred at the end of the reporting
period.
(A) Financial instruments measured at amortised cost
The carrying amounts and the fair value hierarchy of financial instruments measured at amortised cost were as
follows. The fair values of financial instruments that are not listed on the table below approximate the carrying
amounts.
(Note) Current portion is included.
There were no transfers of financial instruments between Level 1 and Level 2 of the fair value hierarchy during
each reporting period.
FY2016: As of March 31, 2017
Level 1 Level 2 Level 3 Total
Financial liabilities measured at
amortised cost
Borrowings (Note) 66,618 - 66,674 - 66,674
Bonds issued (Note) 79,738 - 79,838 - 79,838
Total 146,356 - 146,512 - 146,512
FY2017: As of September 30, 2017
Level 1 Level 2 Level 3 Total
Financial liabilities measured at
amortised cost
Borrowings (Note) 90,812 - 90,830 - 90,830
Bonds issued (Note) 89,668 - 89,769 - 89,769
Total 180,481 - 180,599 - 180,599
FY2017: As of September 30, 2017
Level 1 Level 2 Level 3 Total
Financial liabilities measured at
amortised cost
Borrowings (Note) 806,419 - 806,589 - 806,589
Bonds issued (Note) 796,289 - 797,167 - 797,167
Total 1,602,708 - 1,603,756 - 1,603,756
Carrying
amount
Thousands of U.S. dollars
Fair value
Carrying
amount
Fair value
Millions of yen
Millions of yen
Fair value Carrying
amount

32
(B) Financial instruments measured at fair value
The fair value hierarchy of financial instruments measured at fair value was as follows:
There were no transfers of financial instruments between Level 1 and Level 2 of the fair value hierarchy during
each reporting period.
FY2016: As of March 31, 2017
Level 1 Level 2 Level 3 Total
Financial assets measured at
fair value
Derivative financial assets - 449 - 449
Equity securities 13,310 - 2,498 15,809
Total 13,310 449 2,498 16,258
Financial liabilities measured at
fair value
Derivative financial liabilities - 1,112 - 1,112
Total - 1,112 - 1,112
FY2017: As of September 30, 2017
Level 1 Level 2 Level 3 Total
Financial assets measured at
fair value
Derivative financial assets - 151 - 151
Equity securities 13,101 - 2,726 15,828
Total 13,101 151 2,726 15,980
Financial liabilities measured at
fair value
Derivative financial liabilities - 3,626 - 3,626
Total - 3,626 - 3,626
FY2017: As of September 30, 2017
Level 1 Level 2 Level 3 Total
Financial assets measured at
fair value
Derivative financial assets - 1,340 - 1,340
Equity securities 116,339 - 24,207 140,546
Total 116,339 1,340 24,207 141,886
Financial liabilities measured at
fair value
Derivative financial liabilities - 32,199 - 32,199
Total - 32,199 - 32,199
Fair value
Millions of yen
Fair value
Millions of yen
Fair value
Thousands of U.S. dollars

33
The movement of financial instruments categorised within Level 3 of the fair value hierarchy was as follows:
11. Contingencies
Material litigation
In general, litigation has uncertainties and it is difficult to make reliable judgments for the possibility of an outflow
of resources embodying economic benefits and to estimate the financial effect.
Provisions are not recognised either if an outflow of resources embodying economic benefits is not probable or to
estimate the financial effect is not practicable. Epson was contending the following material actions.
(1) The liquid crystal display price-fixing cartel The Company is currently under investigation by a certain anti-monopoly-related authority, regarding allegations
of involvement in a liquid crystal display price-fixing cartel.
(2) The civil action on copyright fee of ink-jet printers In June 2010, Epson Europe B.V. (“EEB”), a consolidated subsidiary of the Company, brought a civil suit against
La SCRL Reprobel (“Reprobel”), a Belgium-based group that collects copyright royalties, seeking restitution for
copyright royalties for multifunction printers. After that, Reprobel also brought a civil suit against EEB. As a result,
these two lawsuits were adjoined. EEB’s claims were rejected at the first trial, but EEB, dissatisfied with the
decision, intends to appeal.
12. Subsequent Events
No material subsequent events were identified.
Millions of yen
Thousands of
U.S. dollars
Six months ended
September 30, Six months ended
September 30,
2016 2017 2017
Balance as of April 1 2,054 2,498 22,182
Gains and losses
Other comprehensive income 311 227 2,025
Other (51) - -
Balance as of September 30 2,314 2,726 24,207

Supplementary Information
Consolidated Second Quarter ended September 30, 2017
Cautionary Statement
This report includes forward-looking statements that are based on management’s view
from the information available at the time of the announcement. These statements are
subject to various risks and uncertainties. Actual results may be materially different
from those discussed in the forward-looking statements. The factors that may affect
Epson include, but are not limited to, general economic conditions, the ability of
Epson to continue to timely introduce new products and services in markets,
consumption trends, competition, technology trends, and exchange rate fluctuations.

1. Revenue by division
s-1
(Unit: billion yen)
Note: The intra-group services business was categorized within “Other”.
Increase
%
2016 2017 2018 %
318.6 342.0 7.4% 722.0 5.2%
Printers 222.0 238.8 7.5% 519.0 7.8%
Professional Printing 88.9 95.7 7.7% 186.0 (1.4%)
Other 8.3 8.2 (1.4%) 18.0 (2.4%)
Inter-segment revenue (0.7) (0.6) -% (1.0) -%
87.7 99.1 13.1% 191.0 6.3%
81.0 86.3 6.5% 163.0 2.8%
Wearable Products 27.9 26.6 (4.7%) 48.0 (5.5%)
Robotics Solutions 7.8 13.4 71.4% 22.0 30.0%
Microdevices,Other 48.2 49.5 2.7% 98.0 1.5%
Inter-segment revenue (3.0) (3.3) -% (5.0) -%
0.6 0.4 (29.5%) 1.0 (33.7%)
(0.4) (0.7) -% (7.0) -%
487.5 527.3 8.2% 1,070.0 4.4%
Corporate expenses & Eliminations
Consolidated revenue
Forecast for the year ended
March 31,
Increase
compared to
year ended
March 31,
2017
Printing Solutions
Wearable & Industrial Products
Other
Visual Communications
Six months ended
September 30,

2. Business segment information
s-2
Note: The intra-group services business was categorized within “Other”.
2016 2017 2018 %
Revenue:
External 318.5 341.9 7.4% 722.0 5.2%
Inter-segment 0.1 0.1 9.5% 0.0 -%
Total 318.6 342.0 7.4% 722.0 5.2%
Segment profit (loss) 33.9 35.9 5.9% 101.0 20.1%
Revenue:
External 87.6 99.1 13.1% 191.0 6.3%
Inter-segment 0.0 0.0 (91.9%) 0.0 -%
Total 87.7 99.1 13.1% 191.0 6.3%
Segment profit (loss) 7.1 12.7 77.5% 21.0 30.1%
Revenue:
External 77.2 81.9 6.2% 155.0 2.9%
Inter-segment 3.7 4.3 14.5% 8.0 1.6%
Total 81.0 86.3 6.5% 163.0 2.8%
Segment profit (loss) 3.9 4.7 20.1% 10.0 28.0%
Revenue:
External 0.3 0.0 (72.2%) 0.0 -%
Inter-segment 0.3 0.3 9.8% 1.0 38.6%
Total 0.6 0.4 (29.5%) 1.0 (33.7%)
Segment profit (loss) (0.2) (0.2) -% (1.0) -%
Revenue:
External 3.8 4.1 7.8% 2.0 (73.0%)
Inter-segment (4.2) (4.8) -% (9.0) -%
Total (0.4) (0.7) -% (7.0) -%
Segment profit (loss) (19.0) (25.0) -% (52.0) -%
Revenue 487.5 527.3 8.2% 1,070.0 4.4%
Business profit (loss) 25.7 28.1 9.4% 79.0 20.0%
Forecast for the year ended
March 31,
Increase
compared to
year ended
March 31,
2017
Visual Communications
Wearable & Industrial Products
Other
Corporate expenses & Eliminations
Consolidated
Printing Solutions
Six months ended
September 30, Increase
%
(Unit: billion yen)
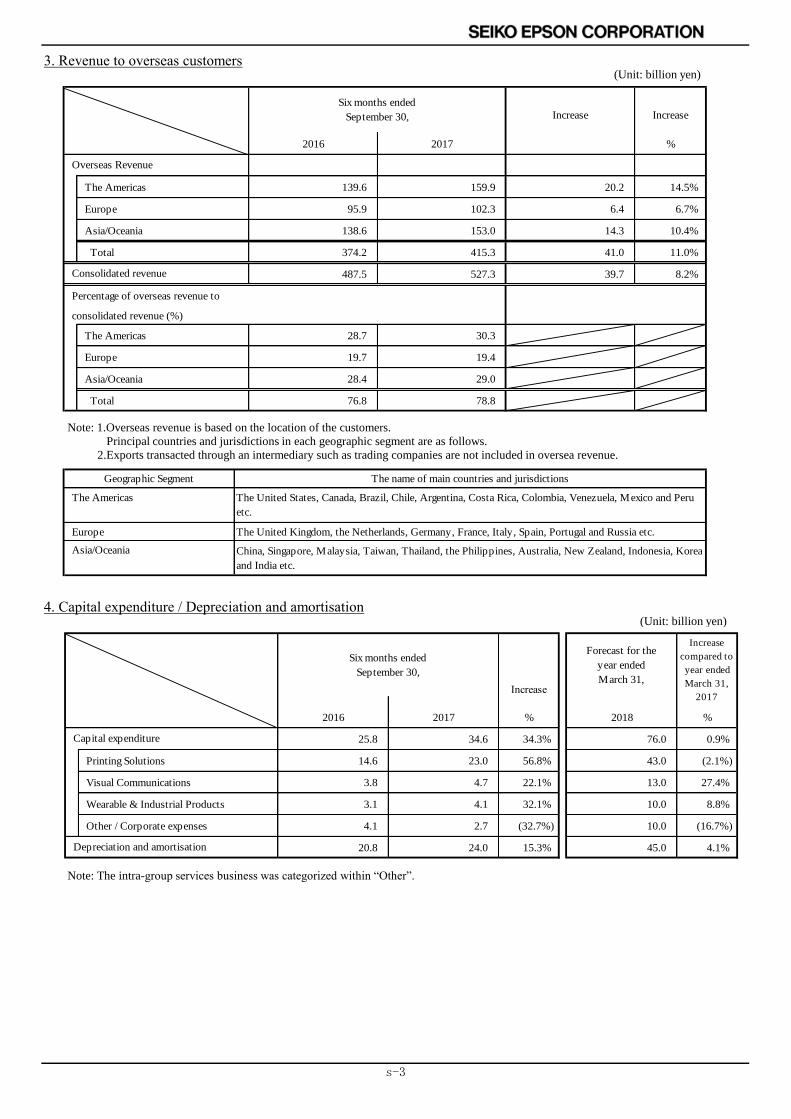
3. Revenue to overseas customers
4. Capital expenditure / Depreciation and amortisation
s-3
(Unit: billion yen)
(Unit: billion yen)
Note: The intra-group services business was categorized within “Other”.
Increase Increase
2016 2017 %
The Americas 139.6 159.9 20.2 14.5%
Europe 95.9 102.3 6.4 6.7%
Asia/Oceania 138.6 153.0 14.3 10.4%
Total 374.2 415.3 41.0 11.0%
487.5 527.3 39.7 8.2%
Percentage of overseas revenue to
consolidated revenue (%)
The Americas 28.7 30.3
Europe 19.7 19.4
Asia/Oceania 28.4 29.0
Total 76.8 78.8
The Americas
Europe The United Kingdom, the Netherlands, Germany, France, Italy, Spain, Portugal and Russia etc.
Asia/Oceania
The United States, Canada, Brazil, Chile, Argentina, Costa Rica, Colombia, Venezuela, Mexico and Peru
etc.
China, Singapore, Malaysia, Taiwan, Thailand, the Philippines, Australia, New Zealand, Indonesia, Korea
and India etc.
The name of main countries and jurisdictions
Six months ended
September 30,
Overseas Revenue
Consolidated revenue
Geographic Segment
Note: 1.Overseas revenue is based on the location of the customers.
Principal countries and jurisdictions in each geographic segment are as follows.
2.Exports transacted through an intermediary such as trading companies are not included in oversea revenue.
Increase
2016 2017 % 2018 %
25.8 34.6 34.3% 76.0 0.9%
Printing Solutions 14.6 23.0 56.8% 43.0 (2.1%)
Visual Communications 3.8 4.7 22.1% 13.0 27.4%
Wearable & Industrial Products 3.1 4.1 32.1% 10.0 8.8%
Other / Corporate expenses 4.1 2.7 (32.7%) 10.0 (16.7%)
20.8 24.0 15.3% 45.0 4.1% Depreciation and amortisation
Six months ended
September 30,
Forecast for the
year ended
March 31,
Increase
compared to
year ended
March 31,
2017
Capital expenditure

5. Research and development
6. Management indices
7. Foreign exchange fluctuation effect on revenue and business profit
s-4
(Unit: billion yen)
(Unit: %)
Note: 1.ROE=Profit for the period attributable to owners of the parent company / Beginning and ending balance average equity
attributable to owners of the parent company
2.ROA(Business profit)=Business profit / Beginning and ending balance average total assets
3.ROA(Profit from operating activities)=Profit from operating activities / Beginning and ending balance average total assets
4.ROS(Business profit)= Business profit / Revenue
5.ROS(Profit from operating activities)= Profit from operating activities / Revenue
Note: Foreign exchange effect = (Foreign currency revenue or business profit for the period) x (Average exchange rate for the period
– Average exchange rate for the same prior period)
(Unit: billion yen)
Increase
2016 2017 % 2018 %
26.2 24.4 (7.0%) 54.0 2.4%
5.4% 4.6% 5.0%
Six months ended
September 30,
Forecast for the
year ended
March 31,
Increase
compared to
year ended
March 31,
2017
Research and Development
R&D / revenue ratio
Increase
2016 2017 Point 2018 Point
4.1% 3.0% (1.1) 11.3% 1.2
2.8% 2.8% 0.0 7.9% 1.0
3.0% 2.4% (0.6) 7.6% 0.5
5.3% 5.3% 0.0 7.4% 1.0
5.7% 4.5% (1.2) 7.1% 0.5
Forecast for the
year ended
March 31,
Increase
compared to
year ended
March 31,
2017
ROE
ROA (Business profit)
ROA (Profit from operating activities)
ROS (Business profit)
ROS (Profit from operating activities)
Six months ended
September 30,
2016 2017
(65.7) 21.5
U.S. dollars (24.3) 8.7
Euro (10.8) 4.9
Other (30.5) 7.8
(15.5) 5.0
U.S. dollars 4.7 (2.4)
Euro (7.5) 3.0
Other (12.7) 4.3
Yen / U.S. dollars 105.29 111.04
Yen / Euro 118.15 126.24
Six months ended
September 30,
Foreign exchange effect on revenue
Foreign exchange effect on business profit
Exchange rate

8. Inventory
9. Employees
s-5
(Unit: billion yen)
Note: 1.Turnover by days = Interim (Ending) balance of inventory / Prior 6months (Prior 12 months) revenue per day
2.The intra-group services business was categorized within “Other”.
(Unit: person)
September 30, March 31, September 30, Increase compared to
2016 2017 2017 March 31, 2017
73,340 72,420 80,928 8,508
Domestic 19,221 19,175 19,616 441
Overseas 54,119 53,245 61,312 8,067
Number of employees at period end
September 30, March 31, September 30, Increase compared to
2016 2017 2017 March 31, 2017
196.6 208.5 233.9 25.4
Printing Solutions 111.2 114.4 132.2 17.8
Visual Communications 42.0 46.9 52.6 5.7
Wearable & Industrial Products 42.6 46.3 47.6 1.3
Other / Corporate expenses 0.7 0.7 1.3 0.5
(Unit: day)
74 74 81 7
Printing Solutions 64 61 71 10
Visual Communications 88 95 97 2
Wearable & Industrial Products 96 107 101 (6)
Other / Corporate expenses 30 31 60 29
Inventory
Turnover by days