consolidated annual accounts - european commission...
TRANSCRIPT
Financial year2014
of the European Union
annual accountsConsolidated

EN EN
EUROPEAN COMMISSION
Brussels, 23.7.2015
COM(2015) 377 final
COMMUNICATION FROM THE COMMISSION TO THE EUROPEAN
PARLIAMENT, THE COUNCIL AND THE COURT OF AUDITORS
CONSOLIDATED ANNUAL ACCOUNTS OF THE EUROPEAN UNION 2014

CONTENTS
FINANCIAL STATEMENT DISCUSSION AND ANALYSIS ............................................ 5 NOTE ACCOMPANYING THE CONSOLIDATED ACCOUNTS ...................................... 27 CONSOLIDATED FINANCIAL STATEMENTS AND EXPLANATORY NOTES ................... 29
BALANCE SHEET ................................................................................................ 32
STATEMENT OF FINANCIAL PERFORMANCE ............................................................ 33
CASHFLOW STATEMENT ...................................................................................... 34
STATEMENT OF CHANGES IN NET ASSETS ............................................................. 35
NOTES TO THE FINANCIAL STATEMENTS ............................................................... 37
AGGREGATED REPORTS ON THE IMPLEMENTATION OF THE BUDGET AND EXPLANATORY NOTES ................................................................................... 105

Annual accounts of the European Union 2014
4
Annual accounts of the European Union 2014
5
FINANCIAL STATEMENT DISCUSSION AND ANALYSIS

Annual accounts of the European Union 2014
6
Annual accounts of the European Union 2014
7
1. EU: Institutional governance and operations The European Union (EU) is an economic and political partnership of 28 European countries. It was established in 1993 by the Maastricht Treaty and succeeded the European Community, the European Coal and Steel Community (ECSC) and Euratom. The latest major amendment to the constitutional basis of the EU, the Treaty of Lisbon, entered into force on 1 December 2009.
The EU is based on the rule of law. This means that every action taken by the EU is founded on treaties that have been approved voluntarily and democratically by all EU Member States. It has a unique institutional set-up:
− European citizens elect directly the Members of the European Parliament (EP);
− The EU's broad priorities are set by the European Council, which brings together national and EU-level leaders;
− Governments defend their country's national interests in the Council of the European Union (the 'Council');
− The interests of the EU as a whole are promoted by the European Commission (the 'Commission'), whose President is elected by the EP and whose members are suggested for appointment by national governments by common accord with the President-elect and are subject, as a body, to a vote of consent by the EP.
The EU has its own legal order which is separate from international law and forms an integral part of the legal systems of the Member States. The legal order of the EU is based on its own sources of law. Given the varied nature of these sources, a hierarchy had to be established among them. Primary legislation is at the top of the hierarchy and is represented by the Treaties. This is followed by international agreements concluded by the EU, general legal principles and secondary legislation, which is based on the Treaties.
Sources and hierarchy of EU law:
• Treaty on European Union (TEU); Treaty on the Functioning of the European Union (TFEU); Charter of Fundamental Rights of the European Union; other Treaties and Protocols
• international agreements; • general principles of Union law; • secondary legislation.
The institutional governance of the EU consists of institutions, agencies and other EU bodies which are listed in note 10 of the notes to the financial statements. The main institutions in the sense of being responsible for drafting policies and taking decisions are the EP, the European Council, the Council and the Commission.
European Parliament
The EP is an important forum for political debate and decision-making at the EU level. The Members of the EP are directly elected by voters in all Member States to represent citizen's interests with regard to EU law-making and to make sure other EU institutions are working democratically.
Over the years and with subsequent changes in European treaties, the EP has acquired substantial legislative and budgetary powers that allow it to set, together with the representatives of the governments of the Member States in the Council, the direction in which the European project is heading. In doing so, the EP has sought to promote democracy and human rights – not only in Europe, but also throughout the world.
The EP is on an equal footing with the Council in the annual budgetary procedure. It is involved in the budgetary process from the preparation stage, notably in laying down the general guidelines and the type of spending, right up to the adoption. It establishes the budget with the Council and monitors its implementation. The EP gives a discharge on the implementation of the EU budget on a recommendation from the Council. Finally, the EP has to provide its consent to the Multi-annual Financial Framework (MFF) which ensures that EU expenditure develops in an orderly manner and within the limit of its own resources. The current President of the EP is Martin Schulz.
Annual accounts of the European Union 2014
8
The European Council and the Council of the European Union
The European Council, formed by the Heads of State or Government of the Member States together with its President and the President of the Commission, provides the necessary impetus for the development of the EU and defines the general political directions and priorities. The current President of the European Council is Donald Tusk.
Jointly with the EP, the Council adopts EU legislation through regulations and directives and also makes decisions and non-binding recommendations. The Council consists of a representative of each Member State, at ministerial level, authorised to commit the government of that Member State by casting its vote. With the exception of the Foreign Affairs configuration, the Council is chaired by the representative of the Member State that holds the Union’s presidency on the basis of equal rotation every six months. A committee consisting of the permanent representatives of the Governments of the Member States (Coreper) prepares the Council’s work.
In its areas of competence, the Council takes its decisions by a qualified majority, except where the Treaties provide otherwise (e.g. unanimity or simple majority). The Council is one of the two branches (the other being the EP) of the budgetary authority which adopts the EU’s budget. The Council also adopts the decisions, pursuant to a special legislative procedure and acting unanimously, laying down the provisions applying to the own resources system and the MFF. In the latter case, the EP must give its consent by a majority of its Members. The latest MFF (2014-2020) was adopted by the Council in November 2013.
European Commission
The Commission is the EU's executive body. It represents the interests of the EU as a whole (not the interests of individual countries).
The Commission's main roles are to:
− propose legislation which is then adopted by the co-legislators, the EP and the Council; − enforce European law (where necessary with the help of the Court of Justice of the EU); − set objectives and priorities for action, outlined yearly in the Commission Work Programme and
work towards delivering them; − manage and implement EU policies and the budget; − represent the Union outside Europe (negotiating trade agreements between the EU and other
countries, for example).
A new team of 28 Commissioners (one from each EU Member State) is appointed every five years. The candidate for President of the Commission is proposed to the EP by the European Council that decides by qualified majority and taking into account the elections to the EP. The Commission President is then elected by the EP by a majority of its component members (which corresponds to at least 376 out of 751 votes). Following this election, the President-elect selects the 27 other members of the Commission, on the basis of the suggestions made by Member States. The final list of Commissioners-designate has then to be agreed between the President-elect and the Council. The Commission as a whole needs the Parliament's consent. Prior to this, Commissioners-designate are assessed by the various EP committees. The current Commission's term of office runs until 31 October 2019. Its President is Jean-Claude Juncker.
The current Commission priorities are (1) Jobs, Growth and Investment, (2) Digital Single Market, (3) Energy Union and Climate, (4) Internal Market, (5) Economic and Monetary Union, (6) EU-US Free Trade, (7) Justice and Fundamental Rights, (8) Migration, (9) EU as a Global Actor, and (10) Democratic Change.
The staff of the Commission works in departments, known as Directorates-General (DGs) or services, each responsible for a particular policy area and headed by a Director-General. The DGs draft laws, but their proposals become official only once the College of Commissioners (28 Commissioners' meeting) adopts them. The DGs also manage funding initiatives at EU level, carry out public consultations and communication activities.
The Commission also administers a number of executive agencies, which help with the management of EU programmes.
Annual accounts of the European Union 2014
9
2. Initiatives and strategies of the Commission The new Commission that came into office in November 2014 has defined its work programme for 2015 and the new initiatives for the Commission until 2019. The work programme sets out the Commission's plans and identifies actions which will make a positive difference for jobs, growth and investment in 2015. This programme focuses on a limited set of concrete new initiatives such as:
A new boost for jobs, growth and investment
• EUR 315 billion investment offensive: The legislative follow-up to the Plan announced at the end of 2014, unlocking public and private investments in the real economy over the next three years;
• Promoting labour integration and employability; and
• Reviewing the Europe 2020 strategy.
Digital Single Market package:
• Creating the conditions for a vibrant digital economy and society by complementing the telecommunications regulatory environment;
• Modernising copyright rules;
• Simplifying rules for consumers making online and digital purchases;
• Enhancing cyber-security; and
• Mainstreaming digitalisation.
A resilient energy union with a forward looking climate change policy
• Creation of the European Energy Union: To ensure energy supply security, further integrate national energy markets, reduce European energy demand and decarbonise the energy mix; and
• Multilateral response to climate change.
A deeper and fairer internal market
• An internal market strategy;
• A labour mobility package;
• Capital markets union action plan;
• A framework for financial institution resolution; and
• An aviation package.
A trade and investment strategy to boost jobs and growth
An area of justice and fundamental rights
• EU accession to the European Convention on Human Rights; and
• European agenda on security.
A new policy on migration:
• Developing a new approach on legal migration to make the EU an attractive destination for talent and skills; and
Annual accounts of the European Union 2014
10
• Improving the management of migration into the EU through greater cooperation with third countries, solidarity among our Member States and fighting human trafficking.
A stronger global actor
• European Neighbourhood policy; and
• Post 2015 sustainable development goals.
A fair taxation environment
• An Action Plan on efforts to combat tax evasion and tax fraud, including measures at EU level in order to move to a system on the basis of which the country where profits are generated is also the country of taxation; including automatic exchange of information on tax rulings and stabilising corporate tax bases; and
• Compulsory exchange of information on tax rulings.
A Union of democratic change
• An EU agreement on better law making;
• A mandatory transparency register; and
• Review of the genetically modified organism decision making process.
Deeper Economic and Monetary Union: Continued efforts to promote economic stability and attract investors to Europe.
In preparing the work programme, the Commission examined around 450 proposals that were put forward to the EP and the Council, and is proposing to withdraw or amend 80 of them. Some are proposed for withdrawal because they do not match the new Commission's priorities. In many cases, the Commission remains strongly committed to the objectives sought – but proposals are of no use if they are simply sitting dormant on a negotiating table or if they will be so watered down in negotiations that they can no longer achieve their original purpose. When that is the case, the Commission will propose new, better ways of achieving these objectives.
3. EU Budget: From preparation to discharge
3.1. Budget and Funding
The MFF consists of headings with annual limits for commitment appropriations set for each. The sum of the ceilings of all headings gives the total ceiling of commitment appropriations. The EU Budget finances a wide range of policies and programmes throughout the EU. In accordance with the priorities set by the EP and the Council in the MFF, the Commission carries out specific programmes, activities and projects in the field. The direct link between the annual budget and the EU policies is ensured through activity-based budgeting (ABB). The activity-based budget nomenclature allows for clear identification of the policy areas of the EU and the total amount of resources allocated to each of these areas. The budget is prepared by the Commission and usually agreed in mid-December by the EP and the Council in accordance with the procedure of Art. 314 TFEU. According to the principle of budget equlibrium, the total revenue must equal total expenditure for a given financial year.
The EU has two main categories of funding: Own resources revenues and sundry revenues. Own resources revenues make up the vast majority of EU funding and accrue automatically to the EU to enable it to finance its budget without the need for a subsequent decision by national authorities. The overall amount of own resources needed to finance the budget is determined by total expenditure less sundry revenue. The total amount of own resources cannot exceed 1.23 % of the gross national income (GNI) of the EU. Own resources can be divided into traditional own resources (such as custom levies), the own resource based on value added tax (VAT) and the resource based on gross national income (GNI). Sundry revenues arising from the activities of the EU (e.g. competition fines) normally represent less than 10 % of total revenue.
Annual accounts of the European Union 2014
11
As a general principle the EU is not allowed to borrow money on capital markets or from financial institutions to finance its budget.
3.2. How the EU budget is managed and spent
Primary operational expenditure
The EU's operational expenditure covers the various headings of the MFF and takes different forms, depending on how the money is paid out and managed. From 2014 onwards, the Commission classifies its expenditure as follows:
Direct management: this is where the budget is implemented directly by the Commission services.
Indirect management: this refers to cases where the Commission confers tasks of implementation of the budget to bodies of EU law or national law, such as the EU agencies.
Shared management: under this method budget implementation tasks are delegated to Member States. About 80 % of the expenditure fall under this mode covering such areas as agricultural spending and structural actions.
The different financial actors within the Commission
The College of Commissioners assumes collective political responsibility but in practice does not exercise itself the budget implementation powers vested in it. It delegates these tasks each year to individual civil servants accountable to the College, subject to the Financial Regulation (FR) and the Staff Regulations (SR). The staff concerned – generally Directors-General and Heads of Service - are known as “Authorising Officers by delegation” or "AODs". They in turn may further delegate budget implementation tasks to “Authorising Officers by sub-delegation”.
The responsibility of the Authorising Officers covers the entire management process, from determining what needs to be done to achieve the policy objectives set by the institution to managing the activities launched from both an operational and budgetary standpoint. Each Authorising Officer is required to prepare an Annual Activity Report (AAR) on the activities under her/his responsibility where she/he reports on policy results and on the reasonable assurance she/he may have that the resources assigned to the activities described in her/his report have been used for their intended purpose and in accordance with the principles of sound financial management, and that the control procedures put in place give the necessary guarantees concerning the legality and regularity of the underlying transactions. On the basis of Art. 66 FR, the Commission transmits a summary report (synthesis report) on the individual AARs to the EP and the Council, by which the Commission takes overall political responsibility for the management of the EU budget in line with Art. 317 TFEU. This report and the AAR are available at: http://ec.europa.eu/atwork/planning-and-preparing/synthesis-report/index_en.htm.
The Accounting Officer executes payment and recovery orders drawn up by Authorising Officers and is responsible for managing the treasury, laying down accounting rules and methods, validating accounting systems, keeping the accounts and drawing up the institution's annual accounts. Furthermore, the Accounting Officer is required to sign the annual accounts declaring that they present fairly, in all material aspects, the financial position, the results of the operations and the cashflows.
Committing to spend the EU budget
Before a legal commitment (for example a contract or grant agreement) can be entered into with a third party, there must be a budget line authorising the activity in question in the annual budget. There must also be sufficient funds on the budget line to cover the expenditure. If these conditions are met, the funds required must be reserved in the budget by means of a budgetary commitment made in the accounting system and only then a legal commitment can be made. No money can be spent from the EU budget unless and until the Authorising Officer has adopted a budgetary commitment.
Once approved, the budgetary commitment is recorded in the budgetary accounting system and the appropriations are consumed accordingly. This, however, has no effect on the financial statements (or general ledger) since no expense has yet been incurred.

Annual accounts of the European Union 2014
12
Making a payment
The Commission is a participant in SWIFT (Society for Worldwide Interbank Financial Telecommunication) and makes more than 2 million payments a year. No payment can be made unless a budgetary commitment has already been approved by the Authorising Officer dealing with the operation in question.
Pre-financing is a payment intended to provide the beneficiary with a cash advance, i.e. a float. It may be split into a number of payments over a period defined in the particular legal commitment. If the beneficiary does not incur eligible expenditure he has the obligation to return the pre-financing advance to the EU. Thus pre-financing paid is not a definitive expense until the relevant conditions are met and so is recorded as an asset on the EU balance sheet when the initial payment is made.
Cost claims will be received by the relevant EU body so as to justify how the pre-financing amount was spent by the beneficiary in accordance with the legal commitment. The rhythm of receipt of these cost claims is variable depending on the type of action being funded and the conditions.
Eligibility criteria are defined in the basic act, in the calls for proposal, in other documents for grant beneficiaries and/or in the contractual clauses of the grant agreements or in the grant decision. After analysis, the eligible amounts are taken into expenses and the beneficiary is informed about any non-eligible amounts.
The FR and other applicable legislation, particularly concerning agriculture and cohesion policies, give the right to make checks on expenditure up to many years after it was incurred. Where errors, irregularities or fraud are detected, financial corrections or recoveries are applied (see note 6 of the notes to the financial statements).
3.3. Financial reporting and accountability
The consolidated annual accounts of the EU provide financial information on the activities of the institutions, agencies and other bodies of the EU from a budgetary and accrual accounting perspective. These accounts do not comprise the annual accounts of Member States.
The annual accounts of the EU consist of two separate but linked parts:
a) the financial statements; and
b) the reports on implementation of the budget, which provide a detailed record of budget implementation.
It is the responsibility of the Commission's Accounting Officer to prepare the EU's financial statements and ensure that they present fairly, in all material aspects, the financial position, the result of the operations and the cashflows of the EU.
In addition to the above annual accounts, ad-hoc reports on specific areas such as the report on budgetary and financial management, on financial instruments, on guarantees given and on financial corrections are also prepared.
Annual accounts of the European Union 2014
13
Reporting and Accountability in the Commission:
3.4. Audit and discharge
Audit
The EU’s annual accounts and resource management are audited by the European Court of Auditors (the Court), its external auditor, which as part of its activities draws up for the EP and the Council:
(1) an annual report on the activities financed from the general budget;
(2) an opinion, based on its audits and given in the annual report in the form of a statement of assurance, on (i) the reliability of the accounts and (ii) the legality and regularity of the underlying transactions involving both revenue collected from taxable persons and payments to final beneficiaries; and
(3) special reports giving the findings of audits covering specific areas.
Discharge
The final step of a budget lifecycle is the discharge of the budget for a given financial year. The EP is the discharge authority within the EU. This means that following the audit and finalisation of the annual accounts it falls to the Council to recommend and then to the EP to give a discharge to the Commission and other EU bodies for implementing the EU budget for a given financial year. This decision is based on an examination of the annual accounts, the Commission's synthesis report and annual evaluation report, the annual report, the audit opinion and special reports of the Court, and replies of the Commission to questions and further information requests.
Annual accounts of the European Union 2014
14
The discharge represents the political aspect of the external control of budget implementation and is the decision by which the EP, acting on a Council recommendation, "releases" the Commission (and other EU bodies) from its responsibility for management of a given budget by marking the end of that budget's existence. This discharge procedure may produce three outcomes: the granting, postponement or the refusal of the discharge. Integral to the annual budgetary discharge procedure in the EP are the hearings with Commissioners who are questioned by the Members of the EP's Budgetary Control Committee regarding the policy areas under their responsibility. The final discharge report including specific recommendations to the Commission for action is adopted in Plenary. The Council discharge recommendations are adopted by ECOFIN. Both, the EP's discharge report as well as the Council discharge recommendations are subject to an annual follow up report in which the Commission outlines the concrete actions it has taken to implement the recommendations made.
4. Consolidated financial statements of the EU: Financial situation 2014
4.1. General trends
Revenue
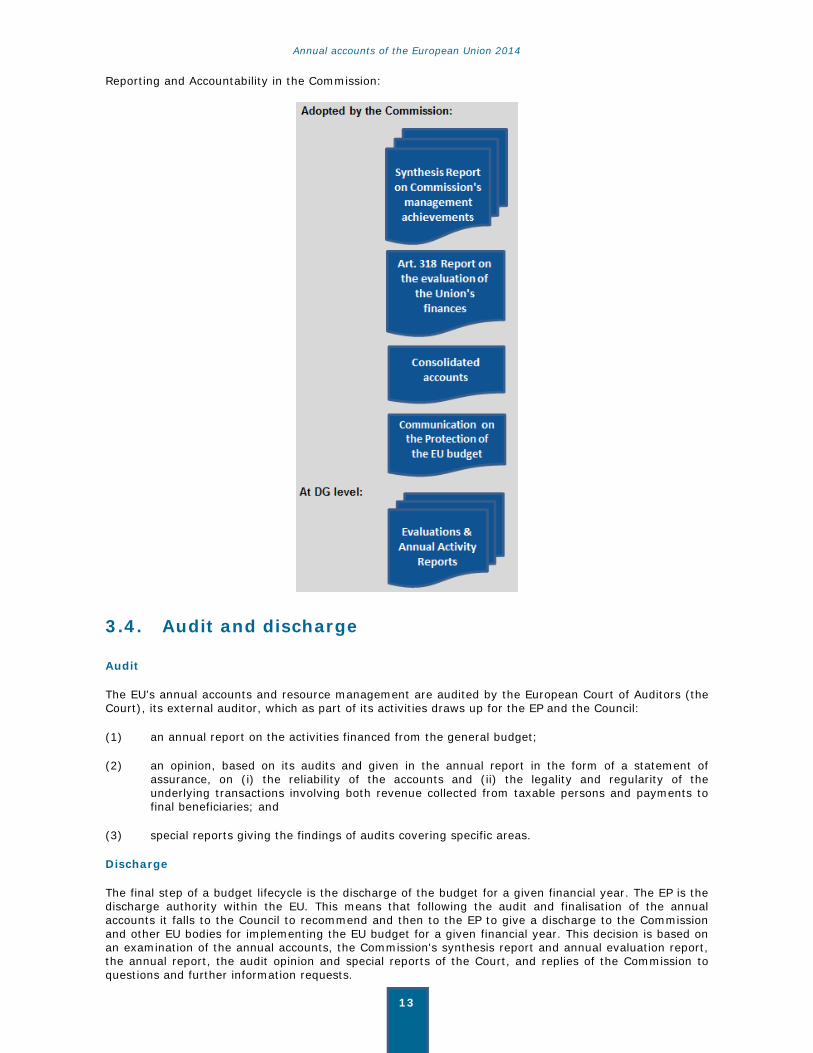
Five year trend of revenue in EUR millions:
In 2014, GNI resource revenue decreased while other own resource revenue remained at a similar level and recovery of expenses (financial corrections and recoveries – see note 3.5 of the notes to the financial statements) nearly doubled from EUR 1.8 billion to EUR 3.4 billion – this was due to the advanced stage of closure of the 2000-2006 cohesion programming period and the related withdrawals of non-eligible expenditure made, as well as significant corrections imposed by the Commission in agricultural policy.
Expenses
The main expense items are transfer payments in the context of the European Agricultural Guarantee Fund (EAGF), the European Agricultural Fund for Rural Development (EAFRD) and other rural development instruments, European Regional Development Fund (ERDF) and Cohesion Fund (CF) and the European Social Fund (ESF). In the financial year 2014 these made up almost 70 % of total expenses.
Expenses were generally at a similar level to last year. Decreases were, however, noted for ERDF/Cohesion, which was due to the fact that expenses recognised in 2014 relate only to programming
-
20 000
40 000
60 000
80 000
100 000
120 000
140 000
160 000
2010 2011 2012 2013 2014
Recovery of expenses
Fines
VAT
TOR
GNI resources
Annual accounts of the European Union 2014
15
period 2007-2013 whereas no expenses have been booked yet for the current period 2014-2020 due to the slow start up of programmes (implementation by Member States has only started in 2015).
The EU also recognises future payment obligations as expenses that are not yet shown in the cash-based budgetary accounts. The increased future payment obligations shown under payables for agriculture and rural development and future payment obligations for pension rights acquired by Commissioners, MEPs and staff generally lead to higher expenses and a negative economic result (these payments will be financed by future budgets and are not included yet in revenue).
Economic result
The economic result (deficit) of the period increased from EUR 4 365 million in 2013 to EUR 11 280 million in 2014. The main reason for this increase is the significant actuarial loss (net amount of EUR 9.2 billion) related to the pension and other employee benefits liability which occurred due to the decrease in interest rates. Such fluctuations must be expected due to the, internationally applied, accounting rules in place and the current economic environment. Should interest rates increase, a reverse impact would be expected.
Furthermore, as this is an actuarial estimate of the value of the total liability at one point in time, 31 December 2014, and is based on various assumptions valid at this time, this loss does not indicate actual charges to the EU budget, nor does it impact the amounts to be paid to pensioners from the EU budget in the immediate coming years. These payments are already estimated in the MFF 2014-2020 and will be implemented via the annual budgetary process.
Assets
The most significant items on the asset side of the balance sheet are financial assets (investments, loans, cash) and pre-financing amounts, which make up almost 85 % of the assets of the EU. The amount of loans remains stable at around EUR 60 billion (see note 4.3.2 below) whereas the amount of financial instruments financed from the EU budget increased by almost EUR 2 billion (see note 4.3.1 below). Included on the asset side under Property, Plant and Equipment are assets concerning the Copernicus programme (EUR 1.5 billion) and Galileo assets under construction (EUR 1.5 billion).
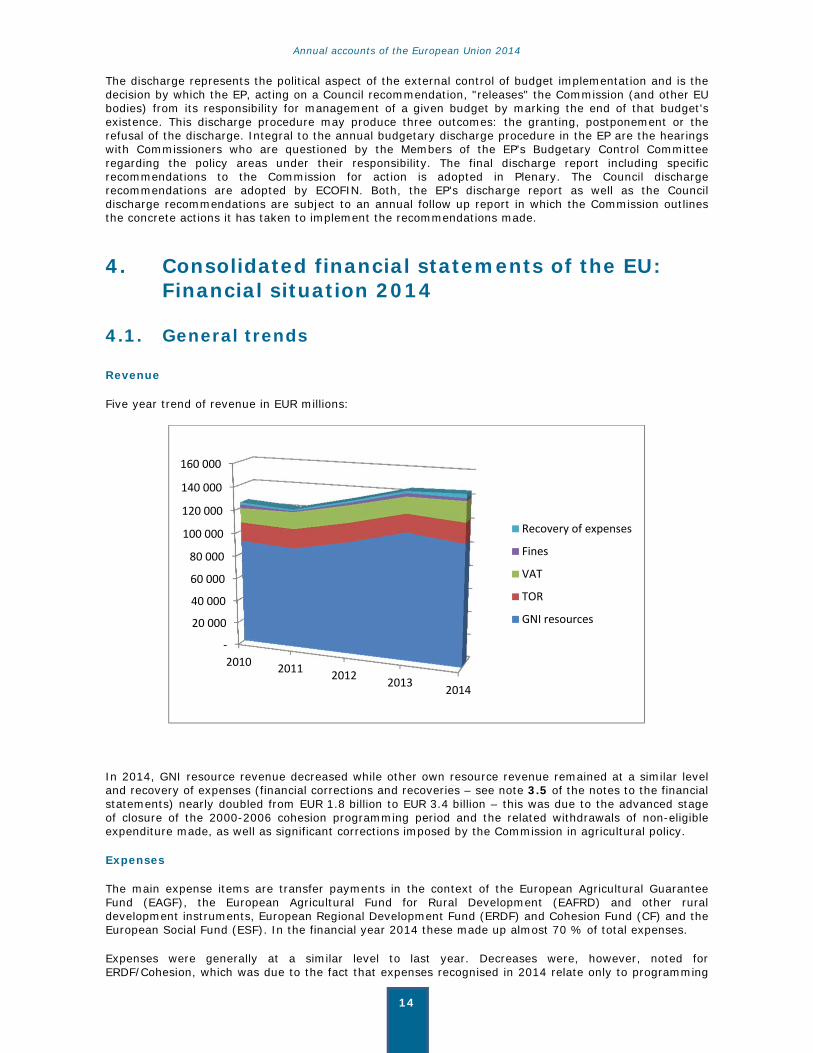
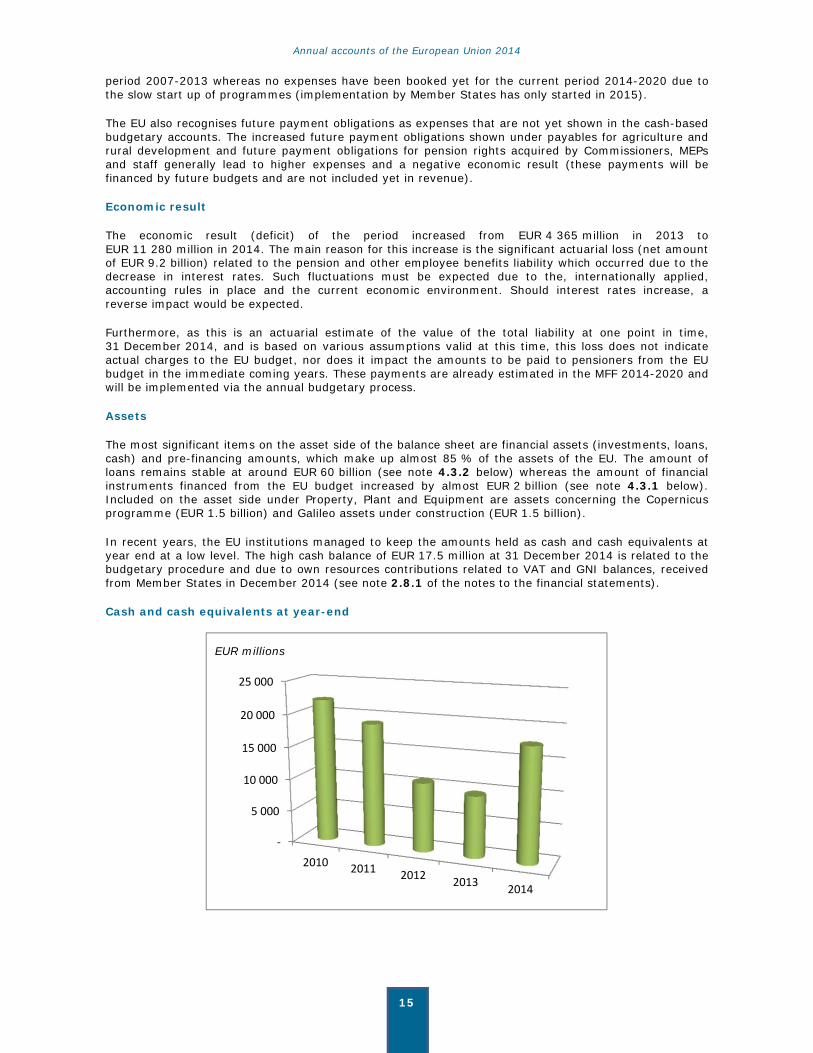
In recent years, the EU institutions managed to keep the amounts held as cash and cash equivalents at year end at a low level. The high cash balance of EUR 17.5 million at 31 December 2014 is related to the budgetary procedure and due to own resources contributions related to VAT and GNI balances, received from Member States in December 2014 (see note 2.8.1 of the notes to the financial statements).
Cash and cash equivalents at year-end
-
5 000
10 000
15 000
20 000
25 000
2010 2011 2012 2013 2014
EUR millions
Annual accounts of the European Union 2014
16
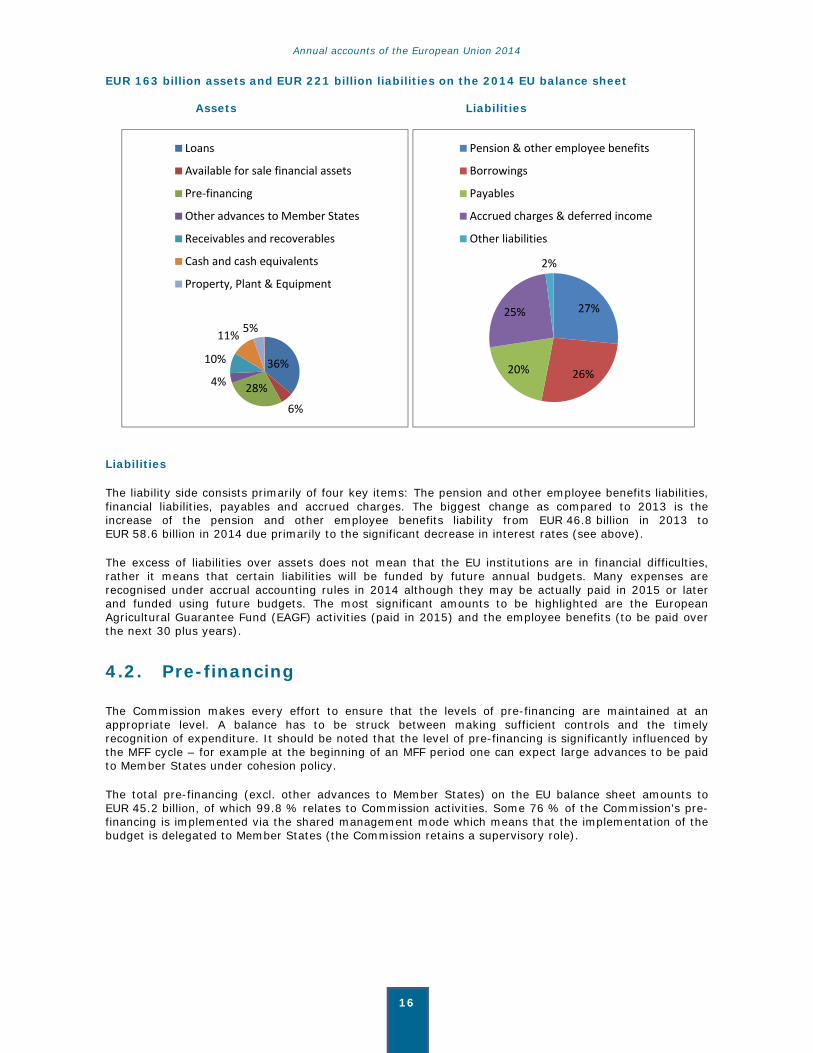
EUR 163 billion assets and EUR 221 billion liabilities on the 2014 EU balance sheet Assets Liabilities
Liabilities
The liability side consists primarily of four key items: The pension and other employee benefits liabilities, financial liabilities, payables and accrued charges. The biggest change as compared to 2013 is the increase of the pension and other employee benefits liability from EUR 46.8 billion in 2013 to EUR 58.6 billion in 2014 due primarily to the significant decrease in interest rates (see above).
The excess of liabilities over assets does not mean that the EU institutions are in financial difficulties, rather it means that certain liabilities will be funded by future annual budgets. Many expenses are recognised under accrual accounting rules in 2014 although they may be actually paid in 2015 or later and funded using future budgets. The most significant amounts to be highlighted are the European Agricultural Guarantee Fund (EAGF) activities (paid in 2015) and the employee benefits (to be paid over the next 30 plus years).
4.2. Pre-financing
The Commission makes every effort to ensure that the levels of pre-financing are maintained at an appropriate level. A balance has to be struck between making sufficient controls and the timely recognition of expenditure. It should be noted that the level of pre-financing is significantly influenced by the MFF cycle – for example at the beginning of an MFF period one can expect large advances to be paid to Member States under cohesion policy.
The total pre-financing (excl. other advances to Member States) on the EU balance sheet amounts to EUR 45.2 billion, of which 99.8 % relates to Commission activities. Some 76 % of the Commission's pre-financing is implemented via the shared management mode which means that the implementation of the budget is delegated to Member States (the Commission retains a supervisory role).
36%
6%
28%4%
10%
11% 5%
Loans
Available for sale financial assets
Pre-financing
Other advances to Member States
Receivables and recoverables
Cash and cash equivalents
Property, Plant & Equipment
27%
26%20%
25%
2%
Pension & other employee benefits
Borrowings
Payables
Accrued charges & deferred income
Other liabilities

Annual accounts of the European Union 2014
17
Commission pre-financing by management mode
The majority of expenditure under shared management mode covers agricultural spending and structural actions. The most significant pre-financing amounts relate to the European Regional Development Fund & Cohesion Fund (ERDF & CF), the European Agricultural Fund for Rural Development (EAFRD) and the European Social Fund (ESF).
Shared management spending by fund
Shared management
76%
Direct management
12%
Indirect management
12%
37%
11%12%
38%
2%
ERDF & CF ESF EAFRD EAGF Other

Annual accounts of the European Union 2014
18
4.3. Financial Instruments
4.3.1. Financial instruments financed by the EU budget under direct and indirect management
The importance and volume of financial instruments for budget implementation increases from year to year. The basic concept behind this approach, in contrast to the traditional method of budget implementation by giving grants and subsidies, is that for each euro spent from the budget via financial instruments, the final beneficiary receives more than EUR 1 as financial support due to the leverage effect. This intelligent use of the EU budget aims at maximising the impact of the funds available.
Available for sale financial assets of financial instruments financed by the EU budget
In general, there are three main types of financial instruments used:
• Equity instruments;
• Loan instruments; and
• Guarantee instruments.
Details of the major instruments are given below:
Guarantee Fund for external actions (EUR 1 996 million of assets)
The Guarantee Fund for external actions covers loans guaranteed by the EU as a result of a Council decision, in particular European Investment Bank (EIB) lending operations outside the EU and loans under macro-financial assistance (MFA) and Euratom loans outside the EU. It is a long-term instrument (non-current part: EUR 1 489 million) managed by the EIB and intended to cover any defaulting loans guaranteed by the EU. The Fund is endowed by payments from the general budget of the EU (so as to reach 9 % of the capital value of the operations), the proceeds from interest on investments made from the Fund's assets, and sums recovered from defaulting debtors for whom the Fund has had to activate its guarantee. Any yearly surplus arising shall be paid back as revenue for the EU budget.
The EU is required to include a guarantee reserve to cover loans to third countries. This reserve is intended to cover the requirements of the Guarantee Fund and, where necessary, activated guarantees exceeding the amount available in the Fund, so that these amounts may be charged to the budget. This reserve corresponds to the target amount of 9 % of the loans outstanding at year-end.
0500
10001500200025003000350040004500
2010 2011 2012 2013 2014
EUR millions
Annual accounts of the European Union 2014
19
Risk-Sharing Finance Facility (EUR 961 million of assets)
The Risk-Sharing Finance Facility (RSFF) is managed by the EIB and the Commission's investment portfolio is used to provision financial risk for loans and guarantees given by the EIB to eligible research projects. In total, a Commission budget of up to EUR 1 billion is foreseen for RSFF, of which up to EUR 800 million are from the “Cooperation” programme and up to EUR 200 million from the “Capacities” programme. The EIB has committed itself to provide the same amount. There will be no new budget contributions to RSFF under the 2014-2020 MFF. At 31 December 2014 the Commission had contributed, including also EFTA and third country contributions, EUR 856 million to the RSFF. In 2014, EUR 375 million of the EU contribution to the RSFF was transferred to its successor debt instrument under Horizon 2020. The amount disclosed as a contingent liability (note 5.2.1 of the notes to the financial statements) represents the estimated maximum loss at 31 December 2014 that the Commission would suffer in case of defaults on loans or guarantees given by the EIB within the framework of the RSFF. It should be noted that the Commission's overall risk is limited to the amount it contributes to the Facility.
Horizon 2020 (EUR 643 million of assets)
Horizon 2020 is a new equity instrument under the 2014-2020 MFF. Seen as a means to drive economic growth and create jobs, Horizon 2020 has the political backing of Europe’s leaders and the Members of the EP. They agreed that research is an investment in the future and so put it at the heart of the EU’s blueprint for smart, sustainable and inclusive growth and jobs. By coupling research and innovation, Horizon 2020 is helping to achieve this with its emphasis on excellent science, industrial leadership and tackling societal challenges. The goal is to ensure Europe produces world-class science, removes barriers to innovation and makes it easier for the public and private sectors to work together in delivering innovation. Horizon 2020 is managed by the EIF.
ETF start up (EUR 524 million of assets)
The European Technology start-up Facility (ETF) covers the Growth & Employment Programme, the Multi-annual Programme for Enterprise and Entrepreneurship (MAP) Programme and the Competitiveness and Innovation Framework Programme (CIP), under the trusteeship of the EIF, supporting the creation and financing of start-up SMEs by investing in suitable specialised venture capital funds.
Loan Guarantee instrument for TEN-T projects (EUR 235 million of assets)
The Loan Guarantee Instrument for TEN-T Projects (LGTT) issues guarantees so as to mitigate revenue risk in the early years of TEN-Transport projects. Specifically the guarantee would fully cover stand-by credit lines, which would only be drawn upon in cases where project cash flows are insufficient to service senior debt. The instrument is a joint financial product of the Commission and the EIB. The capital contribution to the LGTT instrument for the 2007-2013 financing period was initially set at EUR 1 billion, split evenly between the Commission and the EIB. The amending Regulation 670/2012 reallocated EUR 200 million to the Project Bond Initiative and another EUR 50 million to grant funding, so the total EU contribution still available to the instrument stands at EUR 250 million.
At 31 December 2014 the Commission had contributed EUR 212 million to the LGTT. The amount recognised as a contingent liability (note 5.2.1 of the notes to the financial statements), represents the estimated maximum loss at 31 December 2014 that the Commission would suffer in case of defaults on loans given by the EIB within the framework of the LGTT operations. It should be noted that the Commission's overall risk is limited to the amount it contributes to the Instrument.
Annual accounts of the European Union 2014
20
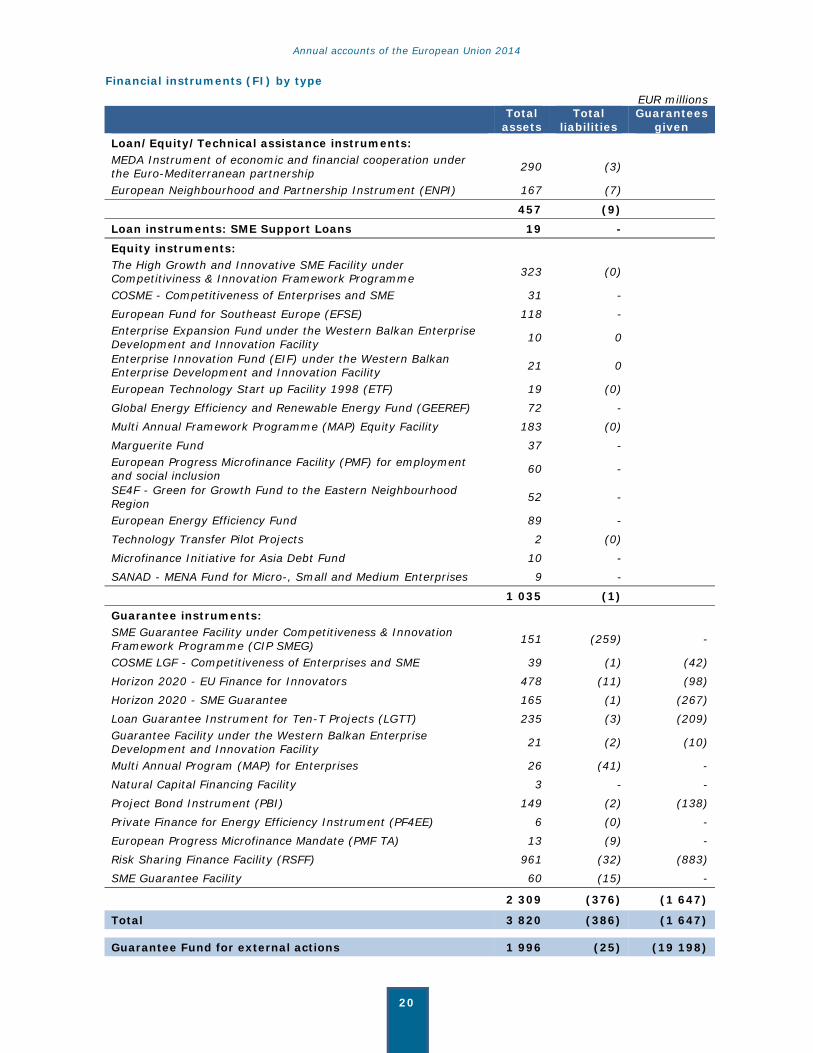
Financial instruments (FI) by type EUR millions
Total
assetsTotal
liabilities Guarantees
given Loan/Equity/Technical assistance instruments: MEDA Instrument of economic and financial cooperation under the Euro-Mediterranean partnership 290 (3)
European Neighbourhood and Partnership Instrument (ENPI) 167 (7)
457 (9) Loan instruments: SME Support Loans 19 -
Equity instruments: The High Growth and Innovative SME Facility under Competitiviness & Innovation Framework Programme 323 (0)
COSME - Competitiveness of Enterprises and SME 31 - European Fund for Southeast Europe (EFSE) 118 - Enterprise Expansion Fund under the Western Balkan Enterprise Development and Innovation Facility 10 0
Enterprise Innovation Fund (EIF) under the Western Balkan Enterprise Development and Innovation Facility 21 0
European Technology Start up Facility 1998 (ETF) 19 (0) Global Energy Efficiency and Renewable Energy Fund (GEEREF) 72 - Multi Annual Framework Programme (MAP) Equity Facility 183 (0) Marguerite Fund 37 - European Progress Microfinance Facility (PMF) for employment and social inclusion 60 -
SE4F - Green for Growth Fund to the Eastern Neighbourhood Region 52 -
European Energy Efficiency Fund 89 - Technology Transfer Pilot Projects 2 (0) Microfinance Initiative for Asia Debt Fund 10 - SANAD - MENA Fund for Micro-, Small and Medium Enterprises 9 -
1 035 (1)
Guarantee instruments: SME Guarantee Facility under Competitiveness & Innovation Framework Programme (CIP SMEG) 151 (259) -
COSME LGF - Competitiveness of Enterprises and SME 39 (1) (42)Horizon 2020 - EU Finance for Innovators 478 (11) (98)Horizon 2020 - SME Guarantee 165 (1) (267)Loan Guarantee Instrument for Ten-T Projects (LGTT) 235 (3) (209)Guarantee Facility under the Western Balkan Enterprise Development and Innovation Facility 21 (2) (10)
Multi Annual Program (MAP) for Enterprises 26 (41) -Natural Capital Financing Facility 3 - -Project Bond Instrument (PBI) 149 (2) (138)Private Finance for Energy Efficiency Instrument (PF4EE) 6 (0) -European Progress Microfinance Mandate (PMF TA) 13 (9) -Risk Sharing Finance Facility (RSFF) 961 (32) (883)SME Guarantee Facility 60 (15) -
2 309 (376) (1 647)
Total 3 820 (386) (1 647)
Guarantee Fund for external actions 1 996 (25) (19 198)

Annual accounts of the European Union 2014
21
4.3.2. Borrowing and lending activities managed by the Commission
The EU is empowered by the EU Treaty to adopt borrowing operations to mobilise the financial resources necessary to fulfill specific mandates. The Commission, acting on behalf of the EU, currently operates three main programmes, Macro-financial assistance (MFA), Balance of Payments (BOP) assistance and the European Financial Stabilisation Mechanism (EFSM), under which it may grant loans and fund these by issuing debt instruments in the capital markets or with financial institutions.
EU borrowing and lending activities are non-budget operations. The capital required to fund the EU lending operations under the above programmes is raised on the capital markets or with financial institutions. The EU is not permitted to borrow to finance its ordinary budgetary expenses or a budget deficit. The size of the borrowings varies from private placements for amounts of up to EUR 500 million to benchmark-size bond issues (at least EUR 1 billion). In general funds raised are on-lent back-to-back to the beneficiary country, i.e. with the same coupon, maturity and amount. Notwithstanding the back-to-back methodology, the debt service of the funding instruments is a legal obligation of the EU, which will ensure that all payments are made fully and in a timely manner. The Commission has put procedures in place so as to ensure the repayment of borrowings even in case of a loan default. For each country programme, the EP, the Council and the Commission decisions determine the overall granted amount, the (maximum) number of instalments to be disbursed, and the maximum (average) maturity of the loan package. Subsequently, the Commission and the beneficiary country agree loan/funding parameters, including instalments and the payment of tranches. In addition, except for the first one, all instalments of the loan depend on compliance with strict conditions, with agreed terms and conditions similar to International Monetray Fund (IMF) support, in the context of a joint EU/IMF financial assistance, which is another factor influencing the timing of funding. This implies that the timing and maturities of issuances are dependent on the related EU lending activity. Funding is exclusively denominated in euro and the maturity spectrum is 3 to 30 years.
Borrowings of the EU constitute direct and unconditional obligations of the EU and are guaranteed by the 28 Member States. Borrowings undertaken to fund loans to countries outside the EU are covered by the Guarantee Fund for external actions. Should a beneficiary Member State default, the debt service will be drawn from the available treasury balance of the Commission, if possible. If that would not be possible, the Commission would draw the necessary funds from the Member States. EU Member States are legally obliged, according to the EU own resources legislation (Article 12 of Council Regulation 1150/2000), to make available sufficient funds to meet the EU’s obligations. Thus investors are only exposed to the credit risk of the EU, not to that of the beneficiary of loans funded. “Back-to-back” lending ensures that the EU budget does not assume any interest rate or foreign exchange risk.
Balance of Payments
The BOP facility, a policy-based financial instrument, provides medium-term financial assistance to Member States of the EU. It enables the granting of loans to Member States which are experiencing, or are seriously threatened with, difficulties in their balance of payments or capital movements. Only Member States which have not adopted the Euro may benefit from this facility. BOP assistance to Latvia was granted before the introduction of the Euro on 1 January 2014. The maximum outstanding amount of
81%
15%
3% 1%
Borrowing & lending activities
European FinancialStabilisation Mechanism
Balance of PaymentsAssistance
Macro-FinancialAssistance
Euratom & European Coaland Steel Community
Annual accounts of the European Union 2014
22
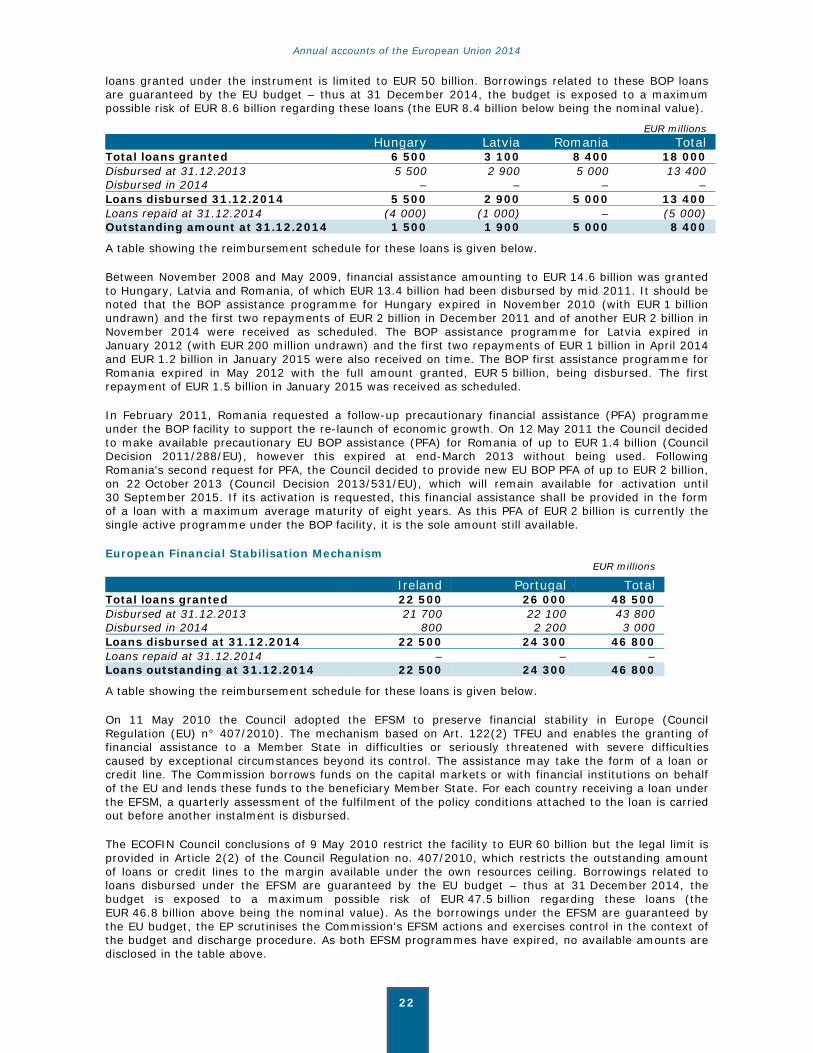
loans granted under the instrument is limited to EUR 50 billion. Borrowings related to these BOP loans are guaranteed by the EU budget – thus at 31 December 2014, the budget is exposed to a maximum possible risk of EUR 8.6 billion regarding these loans (the EUR 8.4 billion below being the nominal value).
EUR millions Hungary Latvia Romania TotalTotal loans granted 6 500 3 100 8 400 18 000 Disbursed at 31.12.2013 5 500 2 900 5 000 13 400 Disbursed in 2014 – – – – Loans disbursed 31.12.2014 5 500 2 900 5 000 13 400 Loans repaid at 31.12.2014 (4 000) (1 000) – (5 000) Outstanding amount at 31.12.2014 1 500 1 900 5 000 8 400
A table showing the reimbursement schedule for these loans is given below.
Between November 2008 and May 2009, financial assistance amounting to EUR 14.6 billion was granted to Hungary, Latvia and Romania, of which EUR 13.4 billion had been disbursed by mid 2011. It should be noted that the BOP assistance programme for Hungary expired in November 2010 (with EUR 1 billion undrawn) and the first two repayments of EUR 2 billion in December 2011 and of another EUR 2 billion in November 2014 were received as scheduled. The BOP assistance programme for Latvia expired in January 2012 (with EUR 200 million undrawn) and the first two repayments of EUR 1 billion in April 2014 and EUR 1.2 billion in January 2015 were also received on time. The BOP first assistance programme for Romania expired in May 2012 with the full amount granted, EUR 5 billion, being disbursed. The first repayment of EUR 1.5 billion in January 2015 was received as scheduled.
In February 2011, Romania requested a follow-up precautionary financial assistance (PFA) programme under the BOP facility to support the re-launch of economic growth. On 12 May 2011 the Council decided to make available precautionary EU BOP assistance (PFA) for Romania of up to EUR 1.4 billion (Council Decision 2011/288/EU), however this expired at end-March 2013 without being used. Following Romania's second request for PFA, the Council decided to provide new EU BOP PFA of up to EUR 2 billion, on 22 October 2013 (Council Decision 2013/531/EU), which will remain available for activation until 30 September 2015. If its activation is requested, this financial assistance shall be provided in the form of a loan with a maximum average maturity of eight years. As this PFA of EUR 2 billion is currently the single active programme under the BOP facility, it is the sole amount still available.
European Financial Stabilisation Mechanism EUR millions
Ireland Portugal TotalTotal loans granted 22 500 26 000 48 500 Disbursed at 31.12.2013 21 700 22 100 43 800 Disbursed in 2014 800 2 200 3 000 Loans disbursed at 31.12.2014 22 500 24 300 46 800 Loans repaid at 31.12.2014 – – – Loans outstanding at 31.12.2014 22 500 24 300 46 800
A table showing the reimbursement schedule for these loans is given below.
On 11 May 2010 the Council adopted the EFSM to preserve financial stability in Europe (Council Regulation (EU) n° 407/2010). The mechanism based on Art. 122(2) TFEU and enables the granting of financial assistance to a Member State in difficulties or seriously threatened with severe difficulties caused by exceptional circumstances beyond its control. The assistance may take the form of a loan or credit line. The Commission borrows funds on the capital markets or with financial institutions on behalf of the EU and lends these funds to the beneficiary Member State. For each country receiving a loan under the EFSM, a quarterly assessment of the fulfilment of the policy conditions attached to the loan is carried out before another instalment is disbursed.
The ECOFIN Council conclusions of 9 May 2010 restrict the facility to EUR 60 billion but the legal limit is provided in Article 2(2) of the Council Regulation no. 407/2010, which restricts the outstanding amount of loans or credit lines to the margin available under the own resources ceiling. Borrowings related to loans disbursed under the EFSM are guaranteed by the EU budget – thus at 31 December 2014, the budget is exposed to a maximum possible risk of EUR 47.5 billion regarding these loans (the EUR 46.8 billion above being the nominal value). As the borrowings under the EFSM are guaranteed by the EU budget, the EP scrutinises the Commission's EFSM actions and exercises control in the context of the budget and discharge procedure. As both EFSM programmes have expired, no available amounts are disclosed in the table above.
Annual accounts of the European Union 2014
23
The Council decided by Implementing Decision in December 2010 on a loan to Ireland of maximum EUR 22.5 billion, and in May 2011 on a loan to Portugal of maximum EUR 26 billion. The initial implementing decisions fixed interest with a margin to result in conditions similar to those of the IMF support. With the adoption of Council Implementing Decisions no. 682/2011 and 683/2011 of 11 October 2011, the Council suppressed the interest margin retroactively and extended the maximum average maturity from 7.5 years to 12.5 years and the maturity of individual tranches up to 30 years. With the adoption of Council Implementing Decisions no. 313/2013 and 323/2013 of 21 June 2013, the Council has further lengthened the maximum average maturity of the EFSM loans to Ireland and Portugal by 7 years to 19.5 years. The extension smoothes the debt redemption profile of both countries and lowers their refinancing needs in the post-programme period.
The last three instalments were disbursed in 2014: EUR 0.8 billion for Ireland and EUR 1.8 billion for Portugal in March 2014 and finally EUR 0.4 billion for Portugal in November 2014. EUR 1.7 billion of the financial assistance granted to Portugal has expired without being requested. There are currently no amounts available under EFSM.
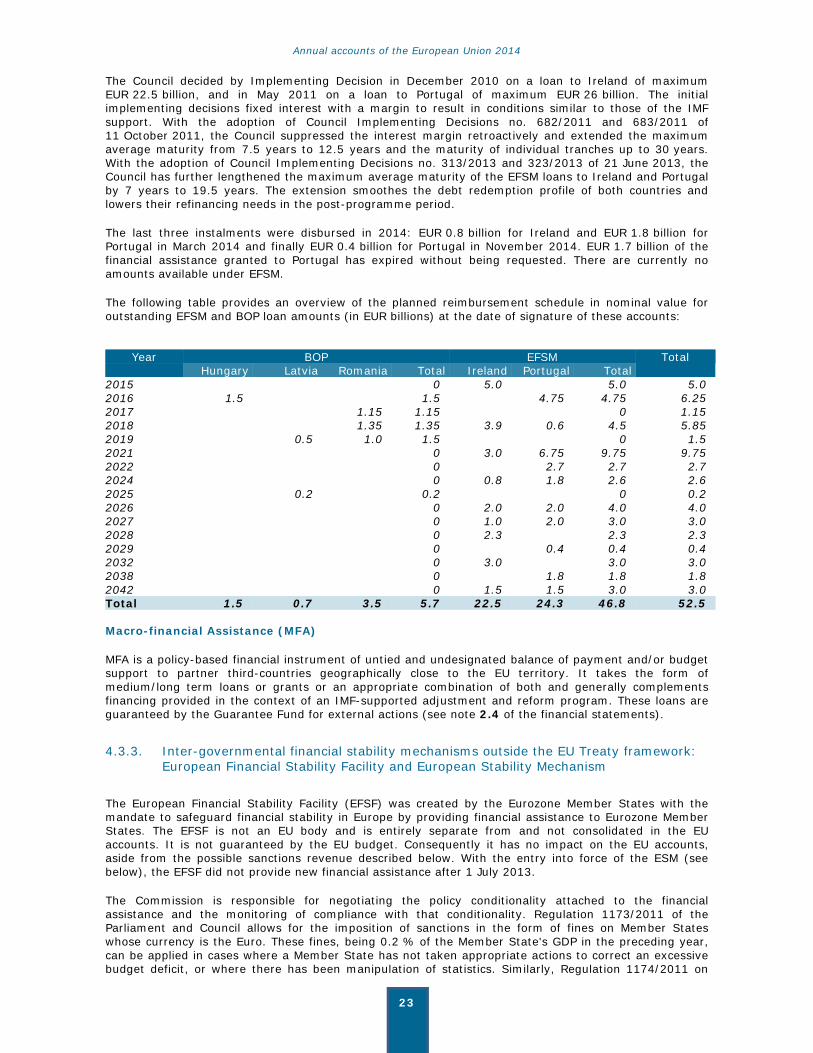
The following table provides an overview of the planned reimbursement schedule in nominal value for outstanding EFSM and BOP loan amounts (in EUR billions) at the date of signature of these accounts:
Year BOP EFSM Total
Hungary Latvia Romania Total Ireland Portugal Total 2015 0 5.0 5.0 5.0 2016 1.5 1.5 4.75 4.75 6.25 2017 1.15 1.15 0 1.15 2018 1.35 1.35 3.9 0.6 4.5 5.85 2019 0.5 1.0 1.5 0 1.5 2021 0 3.0 6.75 9.75 9.75 2022 0 2.7 2.7 2.7 2024 0 0.8 1.8 2.6 2.6 2025 0.2 0.2 0 0.2 2026 0 2.0 2.0 4.0 4.0 2027 0 1.0 2.0 3.0 3.0 2028 0 2.3 2.3 2.3 2029 0 0.4 0.4 0.4 2032 0 3.0 3.0 3.0 2038 0 1.8 1.8 1.8 2042 0 1.5 1.5 3.0 3.0 Total 1.5 0.7 3.5 5.7 22.5 24.3 46.8 52.5 Macro-financial Assistance (MFA)
MFA is a policy-based financial instrument of untied and undesignated balance of payment and/or budget support to partner third-countries geographically close to the EU territory. It takes the form of medium/long term loans or grants or an appropriate combination of both and generally complements financing provided in the context of an IMF-supported adjustment and reform program. These loans are guaranteed by the Guarantee Fund for external actions (see note 2.4 of the financial statements).
4.3.3. Inter-governmental financial stability mechanisms outside the EU Treaty framework: European Financial Stability Facility and European Stability Mechanism
The European Financial Stability Facility (EFSF) was created by the Eurozone Member States with the mandate to safeguard financial stability in Europe by providing financial assistance to Eurozone Member States. The EFSF is not an EU body and is entirely separate from and not consolidated in the EU accounts. It is not guaranteed by the EU budget. Consequently it has no impact on the EU accounts, aside from the possible sanctions revenue described below. With the entry into force of the ESM (see below), the EFSF did not provide new financial assistance after 1 July 2013.
The Commission is responsible for negotiating the policy conditionality attached to the financial assistance and the monitoring of compliance with that conditionality. Regulation 1173/2011 of the Parliament and Council allows for the imposition of sanctions in the form of fines on Member States whose currency is the Euro. These fines, being 0.2 % of the Member State's GDP in the preceding year, can be applied in cases where a Member State has not taken appropriate actions to correct an excessive budget deficit, or where there has been manipulation of statistics. Similarly, Regulation 1174/2011 on

Annual accounts of the European Union 2014
24
macroeconomic imbalances makes provision for an annual fine on a Eurozone Member State of 0.1 % of GDP in the cases where a Member State has not taken the requested corrective action or in case an insufficient corrective action plan has been submitted. Regulation 1177/2011 updated Regulation 1467/97 on speeding up and clarifying the implementation of the excessive deficit procedure. This updated Regulation also foresees the possibility of issuing fines to Eurozone Member States (equal to 0.2 % of GDP plus a variable component). Fines will transit through the EU Budget and then be transferred to the EFSF. This would mean that such amounts would appear as both a budget revenue and expense, thus having no impact on the overall budget result. Likewise they would have no impact on the economic result as presented in the EU financial statements.
The European Stability Mechanism ("ESM") is an intergovernmental organisation under public international law outside the EU Treaty framework. The ESM Treaty was signed by the then 17 Eurozone Member States and became operational in October 2012. The ESM has assumed the tasks fulfilled by the EFSM and the EFSF becoming the sole and permanent mechanism for responding to new requests for financial assistance to Eurozone Member States. Consequently, the EFSF and the EFSM no longer engage in new financing programmes or enter into new loan facility agreements. It must also be noted that the EU budget will not guarantee ESM borrowings. As this mechanism has its own legal personality and is funded directly by the Eurozone Member States, it is not an EU body and it has no impact on either the EU accounts or the EU budget, aside from the possible sanctions revenue described below.
Fines collected will pass through the EU budget and be transferred to the ESM once the EFSF is no longer operational. Furthermore, the Treaty on Stability, Coordination and Governance foresees penalty payments on any of the "Contracting Parties" where that Member State has not taken necessary measures to address a breach of deficit criterion. Penalties imposed (which cannot exceed 0.1 % of GDP) will be payable to the ESM if applied to Eurozone Member States (thus with no impact on the EU budget result, as with the EFSF above), or to the EU budget for non-Euro Member States. In the latter case, the sanction amount will be revenue for the EU budget and be reflected as such in its accounts.
5. Economic and financial context of EU budget implementation
Macro-economic environment
In the context of the sovereign debt crisis the economic growth in the EU Member States has slowed down from 2012 to 2013 and increased from 2013 to 2014. This general economic situation of Member States is reflected in the own resource revenue of the EU, which led to a slight increase of traditional own resources and VAT revenue. Since the GNI resource revenue is a residual component which is directly linked to the total level of payment appropriations adopted by the Budget Authority (and these appropriations have been reduced by Member States in the 2014-2020 MFF), the amount of GNI resource revenue decreased in 2014.
The reinforcement of the Stability and Growth Pact in the EU paves the way for sustainable public finances of the EU Member States concerned. The Fiscal pact aims at consolidating the public finances of the Member States and shall enable them to increase their GDP in the years to come.
The policy of the European Central Bank (ECB) of keeping interest rates at a low level supports the stabilisation of the Euro-area economy. The ECB contributes within its mandate to the increase of growth of the Euro area.

Annual accounts of the European Union 2014
25
Gross Domestic Product of EU 28 at market prices
GNI resource revenue
Unpaid payment claims
Due to the macro-economic environment in the EU, the pressure on the national budgets of Member States leads to pressure on the payment appropriations of the EU budget. This development has an immediate effect on the payment claims received from Member States and other benficiaries. The total of unpaid payment claims at year-end has increased from EUR 24.3 billion in 2013 to EUR 25.8 billion in 2014. Although there will always be outstanding claims due to amounts submitted close to the year-end, the main reason for the exceptional amounts noted in recent years is the shortage of payment appropriations.
Unpaid payment claims must be financed by future budgets. With this in mind, in May 2015 the EP, the Council and the Commission have agreed on a payment plan to bring the EU budget back on a sustainable track. For the EU it is crucial to consider the long-term needs budgetary payment appropriations since it is these which are decided on by the Budgetary Authority and without these, no payments can be made or cash transferred. Once agreed, appropriations are automatically transformed into available cash of the EU through the monthly own resource collection process.
Within the Commission, short-term cashflow forecasting is done weekly (sometimes daily) to ensure that the immediate payment obligations of the EU can be met, respecting the limits of the payment appropriations available in the budget. This short term forecast is the basis used to estimate the amount of own resources to be called monthly from Member States. On the first working day of each month Member States must credit to the Commission’s own resource accounts one-twelfth of the total amount of the VAT and GNI-based resource entered in the Union's budget. Depending on the Commission's cash
12 20012 40012 60012 80013 00013 20013 40013 60013 80014 00014 200
2010 2011 2012 2013 2014
EUR billions, current prices
0
20
40
60
80
100
120
2010 2011 2012 2013 2014
EUR billions

Annual accounts of the European Union 2014
26
position, Member States may be asked in the first quarter of the year to bring forward, by one or two months, the VAT and GNI based resources. Those advances have to be deducted from calls for funds in later months, depending on the forecasted cash needs.
For the medium and long-term, the Commission monitors in detail the payment requirements of the EU as part of its regular activities. For example, this is required for the preparation of Commission proposals on the MFF, as part of the annual budget preparation and when preparing amending budgets. In the negotiation phase of the MFF, the models used and the assumptions underlying are monitored regularly and updated when necessary. The results of the model simulation are channelled into the budgetary negotiations establishing the MFF payment ceiling.
Annual accounts of the European Union 2014
27
NOTE ACCOMPANYING THE CONSOLIDATED ACCOUNTS
The consolidated annual accounts of the European Union for the year 2014 have been prepared on the basis of the information presented by the institutions and bodies under Article 148(2) of the Financial Regulation applicable to the general budget of the European Union. I hereby declare that they were prepared in accordance with Title IX of this Financial Regulation and with the accounting principles, rules and methods set out in the notes to the financial statements.
I have obtained from the accounting officers of these institutions and bodies, who certified its reliability, all the information necessary for the production of the accounts that show the European Union's assets and liabilities and the budgetary implementation.
I hereby certify that based on this information, and on such checks as I deemed necessary to sign off the accounts of the European Commission, I have a reasonable assurance that the accounts present fairly, in all material aspects, the financial position, the results of the operations and the cashflows of the European Union.
[signed]
Manfred Kraff
Accounting Officer of the Commission
17 July 2015

Annual accounts of the European Union 2014
28
Annual accounts of the European Union 2014
29
EUROPEAN UNION FINANCIAL YEAR 2014
CONSOLIDATED FINANCIAL STATEMENTS AND EXPLANATORY NOTES
It should be noted that due to the rounding of figures into millions of euros, some financial data in the tables below may appear not to add-up.

Annual accounts of the European Union 2014
30
Annual accounts of the European Union 2014
31
CONTENTS
BALANCE SHEET ............................................................................................. 32 STATEMENT OF FINANCIAL PERFORMANCE ........................................................ 33 CASHFLOW STATEMENT .................................................................................. 34 STATEMENT OF CHANGES IN NET ASSETS ......................................................... 35 NOTES TO THE FINANCIAL STATEMENTS ........................................................... 37
1. SIGNIFICANT ACCOUNTING POLICIES ............................................................... 38
2. NOTES TO THE BALANCE SHEET ....................................................................... 50
3. NOTES TO THE STATEMENT OF FINANCIAL PERFORMANCE ................................... 69
4. NOTES TO THE CASHFLOW STATEMENT ............................................................. 79
5. CONTINGENT ASSETS & LIABILITIES AND OTHER SIGNIFICANT DISCLOSURES ...... 80
6. PROTECTION OF THE EU BUDGET ..................................................................... 83
7. FINANCIAL RISK MANAGEMENT ........................................................................ 89
8. RELATED PARTY DISCLOSURES ...................................................................... 100
9. EVENTS AFTER THE BALANCE SHEET DATE ...................................................... 102
10. SCOPE OF CONSOLIDATION ........................................................................... 103

Annual accounts of the European Union 2014
32
BALANCE SHEET EUR millions
Note 31.12.2014 31.12.2013NON-CURRENT ASSETS Intangible assets 2.1 282 237 Property, plant and equipment 2.2 7 937 6 104 Investments accounted for using the equity method 2.3 409 349 Financial assets 2.4 56 438 59 844 Pre-financing 2.5 18 358 38 072 Exchange receivables and non-exchange recoverables 2.6 1 198 498 84 623 105 104 CURRENT ASSETS Financial assets 2.4 11 811 5 571 Pre-financing 2.5 34 237 21 367 Exchange receivables and non-exchange recoverables 2.6 14 380 13 182 Inventories 2.7 128 128 Cash and cash equivalents 2.8 17 545 9 510 78 101 49 758 TOTAL ASSETS 162 724 154 862 NON-CURRENT LIABILITIES Pension and other employee benefits 2.9 (58 616) (46 818) Provisions 2.10 (1 537) (1 323) Financial liabilities 2.11 (51 851) (56 369) (112 005) (104 510) CURRENT LIABILITIES Provisions 2.10 (745) (545) Financial liabilities 2.11 (8 828) (3 163) Payables 2.12 (43 180) (36 213) Accrued charges and deferred income 2.13 (55 973) (56 282) (108 726) (96 204) TOTAL LIABILITIES (220 730) (200 714) NET ASSETS (58 006) (45 852) Reserves 2.14 4 435 4 073 Amounts to be called from Member States* 2.15 (62 441) (49 925) NET ASSETS (58 006) (45 852) * The European Parliament adopted a budget on 17 December 2014 which provides for the payment of the Union's short-term liabilities from own resources to be collected by, or called up from, the Member States in 2015. Additionally, under Article 83 of the Staff Regulations (Council Regulation 259/68 of 29 February 1968 as amended), the Member States shall jointly guarantee the liability for pensions.

Annual accounts of the European Union 2014
33
STATEMENT OF FINANCIAL PERFORMANCE
EUR millions
Note 2014 2013 (reclassified)*
REVENUE Revenue from non-exchange transactions GNI resources 3.1 104 688 110 194 Traditional own resources 3.2 17 137 15 467 VAT resources 3.3 17 462 14 019 Fines 3.4 2 297 2 757 Recovery of expenses 3.5 3 418 1 777 Other 3.6 5 623 4 045 Total 150 625 148 259 Revenue from exchange transactions Financial income 3.7 2 298 1 991 Other 3.8 1 066 1 443 Total 3 364 3 434
153 989 151 693 EXPENSES** Implemented by Member States 3.9
European Agricultural Guarantee Fund (44 465) (45 067) European Agricultural Fund for Rural Development andother rural development instruments
(14 046) (13 585)
European Regional Development Fund and Cohesion Fund
(43 345) (47 767)
European Social Fund (12 651) (12 126) Other (2 307) (1 525)
Implemented by the Commission and executive agencies 3.10 (15 311) (12 519) Implemented by other EU agencies and bodies 3.11 (1 025) (656) Implemented by third countries and international organisations
3.11 (2 770) (2 465)
Implemented by other entities 3.11 (1 799) (1 694) Staff and pension costs 3.12 (9 662) (9 058) Changes in employee benefits actuarial assumptions 3.13 (9 170) (2 033) Finance costs 3.14 (2 926) (2 383) Share of net deficit of joint ventures and associates 3.15 (640) (608) Other expenses 3.16 (5 152) (4 572) (165 269) (156 058) ECONOMIC RESULT OF THE YEAR (11 280) (4 365)
* Further information is given in note 3.18. ** Implemented by Member States: Shared management Implemented by the Commission and executive agencies: Direct Management Implemented by other EU agencies and bodies, third countries, international organisations and other entities: Indirect management.
Annual accounts of the European Union 2014
34
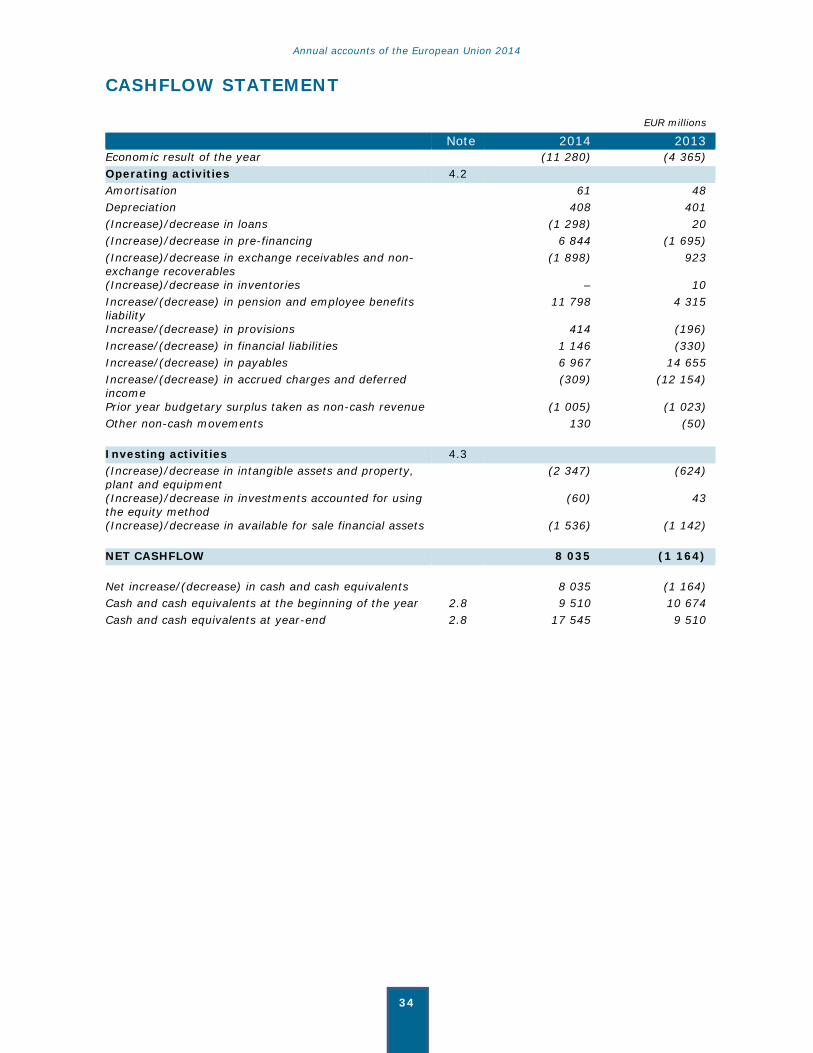
CASHFLOW STATEMENT EUR millions
Note 2014 2013Economic result of the year (11 280) (4 365) Operating activities 4.2 Amortisation 61 48 Depreciation 408 401 (Increase)/decrease in loans (1 298) 20 (Increase)/decrease in pre-financing 6 844 (1 695) (Increase)/decrease in exchange receivables and non-exchange recoverables
(1 898) 923
(Increase)/decrease in inventories – 10 Increase/(decrease) in pension and employee benefits liability
11 798 4 315
Increase/(decrease) in provisions 414 (196) Increase/(decrease) in financial liabilities 1 146 (330) Increase/(decrease) in payables 6 967 14 655 Increase/(decrease) in accrued charges and deferred income
(309) (12 154)
Prior year budgetary surplus taken as non-cash revenue (1 005) (1 023) Other non-cash movements 130 (50) Investing activities 4.3 (Increase)/decrease in intangible assets and property, plant and equipment
(2 347) (624)
(Increase)/decrease in investments accounted for using the equity method
(60) 43
(Increase)/decrease in available for sale financial assets (1 536) (1 142) NET CASHFLOW 8 035 (1 164) Net increase/(decrease) in cash and cash equivalents 8 035 (1 164) Cash and cash equivalents at the beginning of the year 2.8 9 510 10 674 Cash and cash equivalents at year-end 2.8 17 545 9 510
Annual accounts of the European Union 2014
35
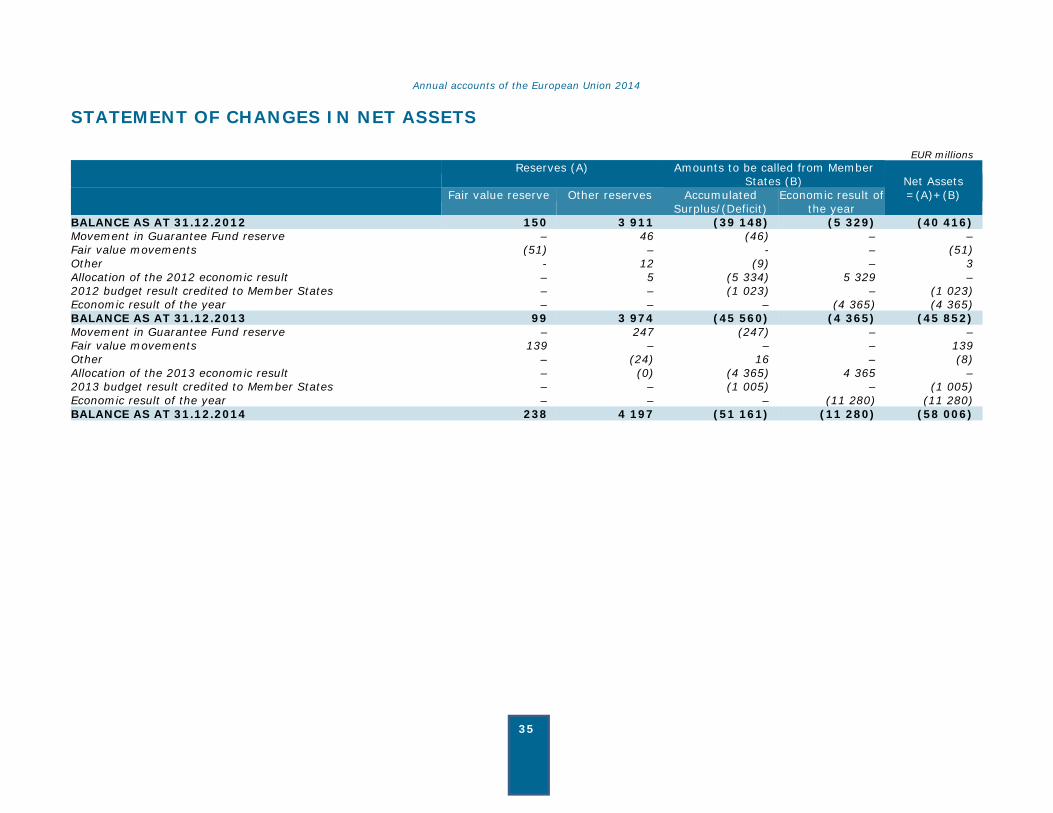
STATEMENT OF CHANGES IN NET ASSETS EUR millions
Reserves (A) Amounts to be called from Member States (B) Net Assets
=(A)+(B) Fair value reserve Other reserves Accumulated Surplus/(Deficit)
Economic result of the year
BALANCE AS AT 31.12.2012 150 3 911 (39 148) (5 329) (40 416) Movement in Guarantee Fund reserve – 46 (46) – – Fair value movements (51) – - – (51) Other - 12 (9) – 3 Allocation of the 2012 economic result – 5 (5 334) 5 329 – 2012 budget result credited to Member States – – (1 023) – (1 023) Economic result of the year – – – (4 365) (4 365) BALANCE AS AT 31.12.2013 99 3 974 (45 560) (4 365) (45 852) Movement in Guarantee Fund reserve – 247 (247) – – Fair value movements 139 – – – 139 Other – (24) 16 – (8) Allocation of the 2013 economic result – (0) (4 365) 4 365 – 2013 budget result credited to Member States – – (1 005) – (1 005) Economic result of the year – – – (11 280) (11 280) BALANCE AS AT 31.12.2014 238 4 197 (51 161) (11 280) (58 006)

Annual accounts of the European Union 2014
36
Annual accounts of the European Union 2014
37
NOTES TO THE FINANCIAL STATEMENTS

Annual accounts of the European Union 2014
38
1. SIGNIFICANT ACCOUNTING POLICIES
1.1. LEGAL BASIS AND ACCOUNTING RULES
The accounts of the EU are kept in accordance with Regulation (EU, Euratom) No 966/2012 of the European Parliament and of the Council of 25 October 2012 on the financial rules applicable to the general budget of the Union and repealing Council Regulation (EC, Euratom) No 1605/2002 (OJ L 298, 26.10.2012, p. 1) hereinafter referred to as the 'Financial Regulation' and Commission Delegated Regulation (EU) No 1268/2012 of 29 October 2012 (OJ L 362, 31.12.2012, p. 1) laying down detailed rules of application of this Financial Regulation.
In accordance with article 143 of the Financial Regulation, the EU prepares its financial statements on the basis of accrual-based accounting rules that are based on International Public Sector Accounting Standards (IPSAS). These accounting rules, adopted by the Accounting Officer of the Commission, have to be applied by all the institutions and EU bodies falling within the scope of consolidation in order to establish a uniform set of rules for accounting, valuation and presentation of the accounts with a view to harmonising the process for drawing up the financial statements and consolidation. The accounts are kept in Euro on the basis of the calendar year.
1.2. ACCOUNTING PRINCIPLES
The objective of the financial statements is to provide information about the financial position, performance and cashflows of an entity that is useful to a wide range of users. For the EU as a public sector entity, the objectives are more specifically to provide information useful for decision making, and to demonstrate the accountability of the entity for the resources entrusted to it. It is with these goals in mind that the present document has been drawn up.
The overall considerations (or accounting principles) to be followed when preparing the financial statements are laid down in EU accounting rule 2 and are the same as those described in IPSAS 1, that is: fair presentation, accrual basis, going concern, consistency of presentation, aggregation, offsetting and comparative information. The qualitative characteristics of financial reporting according to article 144 of the Financial Regulation are relevance, reliability, understandability and comparability.
Preparation of the financial statements in accordance with the above mentioned rules and principles requires management to make estimates that affect the reported amounts of certain items in the balance sheet and statement of financial performance, as well as the disclosures related to financial instruments and contingent assets and liabilities.
1.3. CONSOLIDATION
SCOPE OF CONSOLIDATION
The consolidated financial statements of the EU comprise all significant controlled entities (i.e. the EU institutions (including the Commission) and the EU agencies), associates and joint ventures, this being 52 controlled entities, 7 joint ventures and 1 associate. The complete list of consolidated entities can be found in note 10 of the EU accounts. In comparison with 2013, the scope of consolidation remains unchanged, noting that 1 associate has now been reclassified as a joint venture and following the amalgamation of 2 other associates the resulting entity has been classified as a joint venture.
CONTROLLED ENTITIES
The decision to include an entity in the scope of consolidation is based on the control concept. Controlled entities are all entities over which the EU has, directly or indirectly, the power to govern the financial and operating policies so as to be able to benefit from these entities' activities. This power must be presently exercisable. Controlled entities are fully consolidated. The consolidation begins at the first date on which control exists, and ends when such control no longer exists.
Annual accounts of the European Union 2014
39
The most common indicators of control within the EU are: creation of the entity through founding treaties or secondary legislation, financing of the entity from the general budget, the existence of voting rights in the governing bodies, audit by the Court and discharge by the European Parliament. It is clear that an individual assessment for each entity needs to be made in order to decide whether one or all of the criteria listed above are sufficient to trigger control.
Under this approach, the EU's institutions (except the European Central Bank - ECB) and agencies (excluding the agencies of the former 2nd pillar) are considered as under the exclusive control of the EU and are therefore included in the consolidation scope. Furthermore the European Coal and Steel Community (ECSC) in Liquidation is also considered as a controlled entity.
All material inter-company transactions and balances between EU controlled entities are eliminated, while unrealised gains and losses on such transactions are not material and so have not been eliminated.
JOINT VENTURES
A joint venture is a contractual arrangement whereby the EU and one or more parties (the "venturers") undertake an economic activity which is subject to joint control. Joint control is the contractually agreed sharing of control, directly or indirectly, over an activity embodying service potential. Participations in joint ventures are accounted for using the equity method (see 1.5.4 below).
ASSOCIATES
Associates are entities over which the EU has, directly or indirectly, significant influence but not control. It is presumed that significant influence exists if the EU holds directly or indirectly 20 % or more of the voting rights. Participations in associates are accounted for using the equity method (see 1.5.4 below).
NON-CONSOLIDATED ENTITIES THE FUNDS OF WHICH ARE MANAGED BY THE COMMISSION
The funds of the Sickness Insurance Scheme for staff of the EU, the European Development Fund and the Participants Guarantee Fund are managed by the Commission on their behalf, however since these entities are not controlled by the EU they are not consolidated in its financial statements.
1.4. BASIS OF PREPARATION
1.4.1. Currency and basis for conversion
Functional and reporting currency
The financial statements are presented in millions of euros, the euro being the EU's functional and reporting currency.
Transactions and balances
Foreign currency transactions are translated into euros using the exchange rates prevailing at the dates of the transactions. Foreign exchange gains and losses resulting from the settlement of foreign currency transactions and from the translation at year-end exchange rates of monetary assets and liabilities denominated in foreign currencies are recognised in the statement of financial performance.
Different conversion methods apply to property, plant and equipment and intangible assets, which retain their value in euros at the rate that applied at the date when they were purchased.
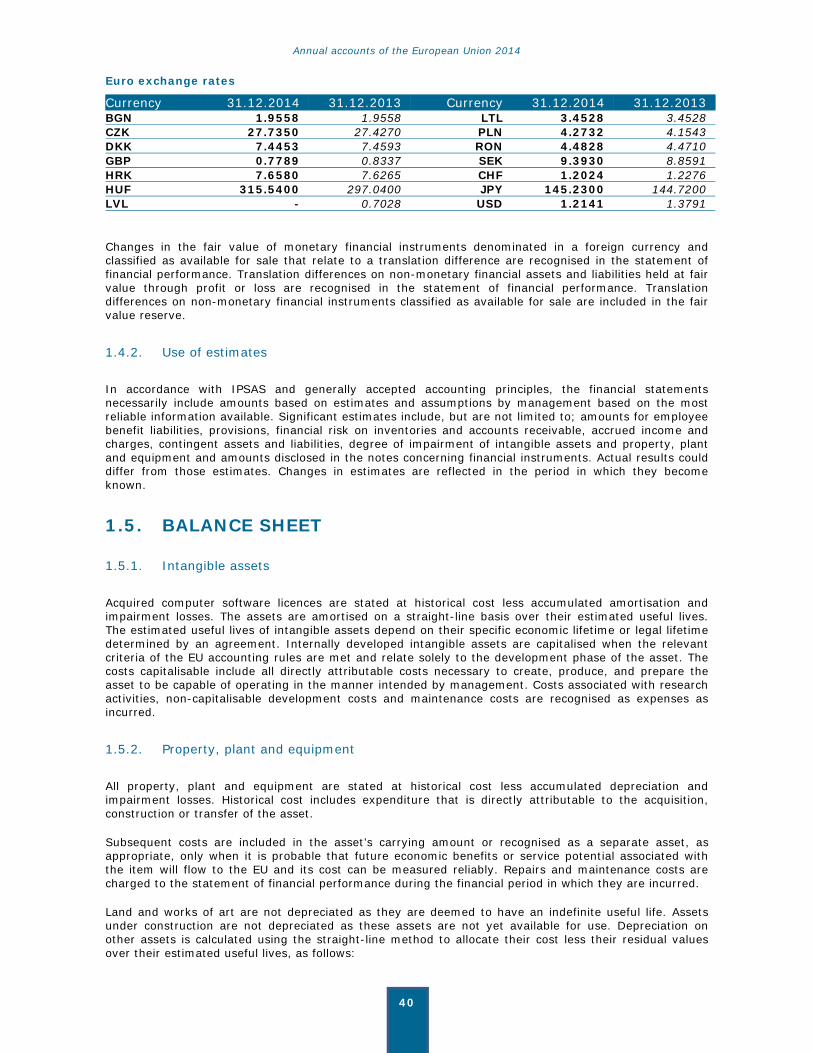
Year-end balances of monetary assets and liabilities denominated in foreign currencies are converted into euros on the basis of the exchange rates applying on 31 December:
Annual accounts of the European Union 2014
40
Euro exchange rates
Currency 31.12.2014 31.12.2013 Currency 31.12.2014 31.12.2013BGN 1.9558 1.9558 LTL 3.4528 3.4528 CZK 27.7350 27.4270 PLN 4.2732 4.1543 DKK 7.4453 7.4593 RON 4.4828 4.4710 GBP 0.7789 0.8337 SEK 9.3930 8.8591 HRK 7.6580 7.6265 CHF 1.2024 1.2276 HUF 315.5400 297.0400 JPY 145.2300 144.7200 LVL - 0.7028 USD 1.2141 1.3791
Changes in the fair value of monetary financial instruments denominated in a foreign currency and classified as available for sale that relate to a translation difference are recognised in the statement of financial performance. Translation differences on non-monetary financial assets and liabilities held at fair value through profit or loss are recognised in the statement of financial performance. Translation differences on non-monetary financial instruments classified as available for sale are included in the fair value reserve.
1.4.2. Use of estimates
In accordance with IPSAS and generally accepted accounting principles, the financial statements necessarily include amounts based on estimates and assumptions by management based on the most reliable information available. Significant estimates include, but are not limited to; amounts for employee benefit liabilities, provisions, financial risk on inventories and accounts receivable, accrued income and charges, contingent assets and liabilities, degree of impairment of intangible assets and property, plant and equipment and amounts disclosed in the notes concerning financial instruments. Actual results could differ from those estimates. Changes in estimates are reflected in the period in which they become known.
1.5. BALANCE SHEET
1.5.1. Intangible assets
Acquired computer software licences are stated at historical cost less accumulated amortisation and impairment losses. The assets are amortised on a straight-line basis over their estimated useful lives. The estimated useful lives of intangible assets depend on their specific economic lifetime or legal lifetime determined by an agreement. Internally developed intangible assets are capitalised when the relevant criteria of the EU accounting rules are met and relate solely to the development phase of the asset. The costs capitalisable include all directly attributable costs necessary to create, produce, and prepare the asset to be capable of operating in the manner intended by management. Costs associated with research activities, non-capitalisable development costs and maintenance costs are recognised as expenses as incurred.
1.5.2. Property, plant and equipment
All property, plant and equipment are stated at historical cost less accumulated depreciation and impairment losses. Historical cost includes expenditure that is directly attributable to the acquisition, construction or transfer of the asset.
Subsequent costs are included in the asset’s carrying amount or recognised as a separate asset, as appropriate, only when it is probable that future economic benefits or service potential associated with the item will flow to the EU and its cost can be measured reliably. Repairs and maintenance costs are charged to the statement of financial performance during the financial period in which they are incurred.
Land and works of art are not depreciated as they are deemed to have an indefinite useful life. Assets under construction are not depreciated as these assets are not yet available for use. Depreciation on other assets is calculated using the straight-line method to allocate their cost less their residual values over their estimated useful lives, as follows:

Annual accounts of the European Union 2014
41
Type of asset Straight line depreciation rateBuildings 4 % to 10 % Plant and equipment 10 % to 25 % Furniture and vehicles 10 % to 25 % Fixtures and fittings 10 % to 33 % Computer hardware 25 % to 33 % Other 10 % to 33 %
Gains or losses on disposals are determined by comparing proceeds less selling expenses with the carrying amount of the disposed asset and are included in the statement of financial performance.
Leases
Leases of tangible assets, where the EU has substantially all the risks and rewards of ownership, are classified as finance leases. Finance leases are capitalised at the inception of the lease at the lower of the fair value of the leased asset and the present value of the minimum lease payments. Each lease payment is allocated between the liability and finance charges so as to achieve a constant rate on the finance balance outstanding. The rental obligations, net of finance charges, are included in financial liabilities (non-current and current). The interest element of the finance cost is charged to the statement of financial performance over the lease period so as to produce a constant periodic interest rate on the remaining balance of the liability for each period. The assets held under finance leases are depreciated over the shorter of the assets' useful life and the lease term.
Leases where the lessor retains a significant portion of the risks and rewards inherent to ownership are classified as operating leases. Payments made under operating leases are charged to the statement of financial performance on a straight-line basis over the period of the lease.
1.5.3. Impairment of non-financial assets
Assets that have an indefinite useful life are not subject to amortisation/depreciation and are tested annually for impairment. Assets that are subject to amortisation/depreciation are reviewed for impairment whenever events or changes in circumstances indicate that the carrying amount may not be recoverable. An impairment loss is recognised for the amount by which the asset’s carrying amount exceeds its recoverable (service) amount. The recoverable (service) amount is the higher of an asset’s fair value less costs to sell and its value in use.
Intangible assets and property, plant and equipment residual values and useful lives are reviewed, and adjusted if appropriate, at least once per year. An asset’s carrying amount is written down immediately to its recoverable (service) amount if the asset’s carrying amount is greater than its estimated recoverable (service) amount. If the reasons for impairments recognised in previous years no longer apply, the impairment losses are reversed accordingly.
1.5.4. Investments accounted for using the equity method
Participations in associates and joint ventures
Participations in associates and joint ventures are accounted for using the equity method and are initially recognised at cost. The EU's interest in the results of its associates and joint ventures is recognised in the statement of financial performance, and its share in the movements in reserves is recognised in the reserves. The initial cost together with all movements (further contributions, share of economic results and reserve movements, impairments, and dividends) give the book value of the associate or joint venture in the financial statements at the balance sheet date. Distributions received from an associate or joint venture reduce the carrying amount of the asset.
If the EU's share of deficits of a joint venture equals or exceeds its interest in the joint venture, the EU discontinues recognising its share of further losses ("unrecognised losses"). The unrecognised share of losses is the result of a technical accounting exercise needed when using the equity method of accounting. These unrecognised losses do not represent losses for the EU and are due to the fact that the expense recognition normally takes place before the capital increase for the contribution in kind of the venturers other than the EU.
Annual accounts of the European Union 2014
42
Unrealised gains and losses on transactions between the EU and its associate or joint ventures are not material and have therefore not been eliminated. The accounting policies of associates or joint ventures may differ from those adopted by the EU for like transactions and events in similar circumstances.
If there are indications of impairment, a write-down to the lower recoverable amount is necessary. The recoverable amount is determined as described under 1.5.3. If the reason for impairment ceases to apply at a later date, the impairment loss is reversed to the carrying amount that would have been determined had no impairment loss been recognised.
In cases where the EU holds 20 % or more of an investment capital fund, it does not seek to exert significant influence. Such funds are therefore treated as financial instruments and categorised as available for sale financial assets.
1.5.5. Financial assets
Classification
The EU classifies their financial assets in the following categories: financial assets at fair value through profit or loss; loans and receivables; held-to-maturity investments; and available for sale financial assets. The classification of the financial instruments is determined at initial recognition and re-evaluated at each balance sheet date.
(i) Financial assets at fair value through profit or loss
A financial asset is classified in this category if acquired principally for the purpose of selling in the short term or if so designated by the EU. Derivatives are also categorised in this category. Assets in this category are classified as current assets if they are expected to be realised within 12 months of the balance sheet date. During this financial year, the EU did not hold any financial assets in this category.
(ii) Loans and receivables
Loans and receivables are non-derivative financial assets with fixed or determinable payments that are not quoted in an active market. They arise when the EU provides money, goods or services directly to a debtor with no intention of trading the receivable. They are included in non-current assets, except for maturities within 12 months of the balance sheet date even if the maturity date of the entire loan dates more than 12 months from the balance sheet date.
(iii) Held-to-maturity investments
Held-to-maturity investments are non-derivative financial assets with fixed or determinable payments and fixed maturities that the EU has the positive intention and ability to hold to maturity. During this financial year, the EU did not hold any investments in this category.
(iv) Available for sale financial assets
Available for sale financial assets are non-derivatives that are either designated in this category or not classified in any of the other categories. They are classified as either current or non-current assets, depending on the time period in which the EU expects to dispose of them which is usually the remaining maturity at the balance sheet date. Investments in unconsolidated entities and other equity investments (e.g. Risk Capital Operations) that are not accounted for using the equity method are also classified as available for sale financial assets.
Initial recognition and measurement
Purchases and sales of financial assets at fair value through profit or loss, held-to-maturity and available for sale are recognised on trade-date – the date on which the EU commits to purchase or sell the asset. Loans are recognised when cash is advanced to the borrowers. Financial instruments are initially recognised at fair value. For all financial assets not carried at fair value through profit or loss transactions costs are added to the fair value at initial recognition. Financial assets carried at fair value through profit or loss are initially recognised at fair value and transaction costs are expensed in the statement of financial performance.

Annual accounts of the European Union 2014
43
The fair value of a financial asset on initial recognition is normally the transaction price (i.e. the fair value of the consideration received). However, when a long-term loan that carries no interest or an interest below market conditions is granted, its fair value can be estimated as the present value of all future cash receipts discounted using the prevailing market rate of interest for a similar instrument with a similar credit rating.
Loans granted are measured at their nominal amount, which is considered to be the fair value of the loan. The reasoning for this is as follows:
- The “market environment” for EU lending is very specific and different from the capital market used to issue commercial or government bonds. As lenders in these markets have the opportunity to choose alternative investments, the opportunity possibility is factored into market prices. However, this opportunity for alternative investments does not exist for the EU which is not allowed to invest money on the capital markets; it only borrows funds for the purpose of lending at the same rate. This means that there is no alternative lending or investment option available to the EU for the sums borrowed. Thus, there is no opportunity cost and therefore no basis of comparison with market rates. In fact, the EU lending operation itself represents the market. Essentially, since the opportunity cost "option" is not applicable, the market price does not fairly reflect the substance of the EU lending transactions. Therefore, it is not appropriate to determine the fair value of EU lending with reference to commercial or government bonds.
- Furthermore as there is no active market or similar transactions to compare with, the interest rate to
be used by the EU for fair valuing its lending operations under the European Financial Stability Mechanism (EFSM), Balance of Payment (BOP) and other such loans, should be the interest rate charged.
- In addition, for these loans, there are compensating effects between loans and borrowings due to
their back-to-back character. Thus, the effective interest for the loan equals the effective interest rate for the related borrowings. The transaction costs incurred by the EU and then recharged to the beneficiary of the loan are directly recognised in the statement of financial performance.
Financial instruments are derecognised when the rights to receive cashflows from the investments have expired or have been transferred and the EU has transferred substantially all risks and rewards of ownership.
Subsequent measurement
(i) Financial assets at fair value through profit or loss are subsequently carried at fair value. Gains and losses arising from changes in the fair value of the ‘financial instruments at fair value through profit or loss’ category are included in the statement of financial performance in the period in which they arise.
(ii) Loans and receivables and held-to-maturity investments are carried at amortised cost using the effective interest method. In the case of loans granted on borrowed funds, the same effective interest rate is applied to both the loans and borrowings since these loans have the characteristics of 'back-to-back operations' and the differences between the loan and the borrowing conditions and amounts are not material. The transaction costs incurred by the EU and then recharged to the beneficiary of the loan are directly recognised in the statement of financial performance.
(iii) Held to maturity – the EU currently holds no held to maturity investments. (iv) Available for sale financial assets are subsequently carried at fair value. Gains and losses arising from
changes in the fair value of available for sale financial assets are recognised in the fair value reserve. When assets classified as available for sale financial assets are derecognised or impaired, the cumulative fair value adjustments previously recognised in the fair value reserve are recognised in the statement of financial performance. Interest on available for sale financial assets calculated using the effective interest method is recognised in the statement of financial performance. Dividends on available for sale equity instruments are recognised when the EU's right to receive payment is established.
The fair values of quoted investments in active markets are based on current bid prices. If the market for a financial asset is not active (and for unlisted securities), the EU establishes a fair value by using valuation techniques. These include the use of recent arm’s length transactions, reference to other instruments that are substantially the same, discounted cashflow analysis, option pricing models and other valuation techniques commonly used by market participants.
In cases where the fair value of investments in equity instruments that do not have a quoted market price in an active market cannot be reliably measured, these investments are valued at cost less impairment losses.
Annual accounts of the European Union 2014
44
Impairment of financial assets
The EU assesses at each balance sheet date whether there is objective evidence that a financial asset is impaired. A financial asset is impaired and impairment losses are incurred if, and only if, there is objective evidence of impairment as a result of one or more events that occurred after the initial recognition of the asset and that loss event (or events) has an impact on the estimated future cashflows of the financial asset that can be reliably estimated.
(a) Assets carried at amortised cost
If there is objective evidence that an impairment loss on loans and receivables or held-to-maturity investments carried at amortised cost has been incurred, the amount of the loss is measured as the difference between the asset’s carrying amount and the present value of estimated future cashflows (excluding future credit losses that have not been incurred) discounted at the financial asset’s original effective interest rate. The carrying amount of the asset is reduced and the amount of the loss is recognised in the statement of financial performance. If a loan or held-to-maturity investment has a variable interest rate, the discount rate for measuring any impairment loss is the current effective interest rate determined under the contract. The calculation of the present value of the estimated future cashflows of a collateralised financial asset reflects the cashflows that may result from foreclosure less costs for obtaining and selling the collateral, whether or not foreclosure is probable. If, in a subsequent period, the amount of the impairment loss decreases and the decrease can be related objectively to an event occurring after the impairment was recognised, the previously recognised impairment loss is reversed through the statement of financial performance.
(b) Assets carried at fair value
In the case of equity investments classified as available for sale financial assets, a significant or permanent (prolonged) decline in the fair value of the security below its cost is considered in determining whether the securities are impaired. If any such evidence exists for available for sale financial assets, the cumulative loss – measured as the difference between the acquisition cost and the current fair value, less any impairment loss on that financial asset previously recognised in the statement of financial performance – is removed from reserves and recognised in the statement of financial performance. Impairment losses recognised in the statement of financial performance on equity instruments are not reversed through the statement of financial performance. If, in a subsequent period, the fair value of a debt instrument classified as available for sale financial asset increases and the increase can be objectively related to an event occurring after the impairment loss was recognised, the impairment loss is reversed through the statement of financial performance.
Investments in venture capital funds
Investments in Venture Capital Funds are classified as available for sale financial assets and, accordingly, are carried at fair value with gains and losses arising from changes in the fair value (including translation differences) recognised in the fair value reserve. Since they do not have a quoted market price in an active market, investments in Venture Capital Funds are valued on a line-by-line basis at the lower of cost or attributable net asset value. Unrealised gains resulting from the fair value measurement are recognised through reserves and unrealised losses are assessed for impairment so as to determine whether they are recognised as impairment losses in the statement of financial performance or as changes in the fair value reserve.
1.5.6. Inventories
Inventories are stated at the lower of cost and net realisable value. Cost is determined using the first-in, first-out (FIFO) method. The cost of finished goods and work in progress comprises raw materials, direct labour, other directly attributable costs and related production overheads (based on normal operating capacity). Net realisable value is the estimated selling price in the ordinary course of business, less the costs of completion and selling expenses. When inventories are held for distribution at no charge or for a nominal charge, they are measured at the lower of cost and current replacement cost. Current replacement cost is the cost the EU would incur to acquire the asset on the reporting date.
Annual accounts of the European Union 2014
45
1.5.7. Pre-financing amounts
Pre-financing is a payment intended to provide the beneficiary with a cash advance, i.e. a float. It may be split into a number of payments over a period defined in the particular pre-financing agreement. The float or advance is repaid or used for the purpose for which it was provided during the period defined in the agreement. If the beneficiary does not incur eligible expenditure, he has the obligation to return the pre-financing advance to the EU. The amount of the pre-financing may be reduced (wholly or partially) by the acceptance of eligible costs (which are recognised as expenses) and amounts returned.
At year-end, outstanding pre-financing amounts are valued at the original amount(s) paid less: amounts returned, eligible amounts expensed, estimated eligible amounts not yet cleared at year-end, and value reductions.
Amounts defined in the Financial Regulation as "financial instruments under shared management" are from an accounting point of view classified as pre-financing amounts. These pre-financing amounts are valued at the original amounts paid to Member States less an estimation of amounts utilised.
Interest on pre-financing is recognised as it is earned in accordance with the provisions of the relevant agreement. An estimate of the accrued interest revenue, based on the most reliable information, is made at the year-end and included in the balance sheet.
1.5.8. Exchange receivables and non-exchange recoverables
As the EU accounting rules require a separate presentation of exchange and non-exchange transactions, for the purpose of drawing up the accounts, receivables are defined as stemming from exchange transactions and recoverables are defined as stemming from non-exchange transactions that do not arise out of a contract (sovereign recoverables).
Receivables from exchange transactions meet the definition of financial instruments and are thus classified as loans and receivables and measured accordingly (see 1.5.5 above). The financial instruments notes disclosures concerning receivables from exchange transactions include accrued income and deferred charges from exchange transactions as they are not material.
Recoverables from non-exchange transactions are carried at original amount (adjusted for interest and penalties) less write-down for impairment. A write-down for impairment of recoverables from non-exchange transactions is established when there is objective evidence that the EU will not be able to collect all amounts due according to the original terms of recoverables from non-exchange transactions. The amount of the write-down is the difference between the asset’s carrying amount and the recoverable amount. The amount of the write-down is recognised in the statement of financial performance. A general write-down, based on past experience, is also made for outstanding recovery orders not already subject to a specific write-down. See note 1.5.14 below concerning the treatment of accrued income at year-end. Amounts displayed and disclosed as recoverables from non-exchanges transactions are not financial instruments as they do not arise from a contract. However, in the notes to the financial statements recoverables from non-exchange transactions are disclosed together with receivables from exchange transactions where appropriate.
1.5.9. Cash and cash equivalents
Cash and cash equivalents are financial instruments and classified as available for sale financial assets. They include cash at hand, deposits held at call with banks and other short-term highly liquid investments with original maturities of three months or less.
1.5.10. Pension and other employee benefits
Pension obligations
The EU operates defined benefit pension plans. Whilst staff contribute from their salaries one third of the expected cost of these benefits, the liability is not funded. The liability recognised in the balance sheet in respect of defined benefit pension plans is the present value of the defined benefit obligation at the balance sheet date. The defined benefit obligation is calculated by actuaries using the projected unit

Annual accounts of the European Union 2014
46
credit method. The present value of the defined benefit obligation is determined by discounting the estimated future cash outflows using interest rates of government bonds that are denominated in the currency in which the benefits will be paid, and that have terms to maturity approximating to the terms of the related pension liability.
Actuarial gains and losses arising from experience adjustments and changes in actuarial assumptions are recognised immediately in the statement of financial performance. Past-service costs are recognised immediately in statement of financial performance, unless the changes to the pension plan are conditional on the employees remaining in service for a specified period of time (the vesting period). In this case, the past-service costs are amortised on a straight-line basis over the vesting period.
Post-employment sickness benefits
The EU provides health benefits to its employees through the reimbursement of medical expenses. A separate fund has been created for its day-to-day administration. Both current employees, pensioners, widowers and their beneficiaries benefit from the system. The benefits granted to the "inactives" (pensioners, orphans, etc.) are classified as "Post-Employment Employee Benefits". Given the nature of these benefits, an actuarial calculation is required. The liability in the balance sheet is determined on a similar basis as that for the pension obligations (see above).
1.5.11. Provisions
Provisions are recognised when the EU has a present legal or constructive obligation towards third parties as a result of past events, it is more likely than not that an outflow of resources will be required to settle the obligation, and the amount can be reliably estimated. Provisions are not recognised for future operating losses. The amount of the provision is the best estimate of the expenses expected to be required to settle the present obligation at the reporting date. Where the provision involves a large number of items, the obligation is estimated by weighting all possible outcomes by their associated probabilities (“expected value” method).
1.5.12. Financial liabilities
Financial liabilities are classified as financial liabilities at fair value through profit or loss or as financial liabilities carried at amortised cost. Borrowings are composed of borrowings from credit institutions and debts evidenced by certificates. They are recognised initially at fair value, being their issue proceeds (fair value of consideration received) net of transaction costs incurred, then subsequently carried at amortised cost using the effective interest method; any difference between proceeds, net of transaction costs, and the redemption value is recognised in the statement of financial performance over the period of the borrowings using the effective interest method.
Financial liabilities are classified as non-current liabilities, except for maturities less than 12 months after the balance sheet date. In the case of loans granted on borrowed funds, the effective interest method may not be applied to loans and borrowings, based on materiality considerations. The transaction costs incurred by the EU and then recharged to the beneficiary of the loan are directly recognised in the statement of financial performance.
Financial liabilities categorised at fair value through profit or loss include derivatives when their fair value is negative. They follow the same accounting treatment as financial assets at fair value through profit or loss, see note 1.5.5. During this financial year, the EU did not hold any financial liabilities in this category.
1.5.13. Payables
A significant amount of the payables of the EU are not related to exchange transactions such as the purchase of goods or services – instead they are unpaid cost claims from beneficiaries of grants or other EU funding (non-exchange transactions). They are recorded as payables for the requested amount when the cost claim is received. Upon verification and acceptance of the eligible costs, the payables are valued at the accepted and eligible amount.
Annual accounts of the European Union 2014
47
Payables arising from the purchase of goods and services are recognised at invoice reception for the original amount and corresponding expenses are entered in the accounts when the supplies or services are delivered and accepted by the EU.
1.5.14. Accrued and deferred income and charges
Transactions and events are recognised in the financial statements in the period to which they relate. At year-end, if an invoice is not yet issued but the service has been rendered, the supplies have been delivered by the EU or a contractual agreement exists (e.g. by reference to a treaty), an accrued income will be recognised in the financial statements. In addition, at year-end, if an invoice is issued but the services have not yet been rendered or the goods supplied have not yet been delivered, the revenue will be deferred and recognised in the subsequent accounting period.
Expenses are also accounted for in the period to which they relate. At the end of the accounting period, accrued expenses are recognised based on an estimated amount of the transfer obligation of the period. The calculation of accrued expenses is done in accordance with detailed operational and practical guidelines issued by the Commission which aim at ensuring that the financial statements provide a faithful representation of the economic and other phenomena they purport to represent.
1.6. STATEMENT OF FINANCIAL PERFORMANCE
1.6.1. Revenue
REVENUE FROM NON-EXCHANGE TRANSACTIONS
The vast majority of the EU's revenue relates to non-exchange transactions:
GNI based resources and VAT resources
Revenue is recognised for the period for which the Commission sends out a call for funds to the Member States claiming their contribution. They are measured at their “called amount”. As VAT and GNI resources are based on estimates of the data for the budgetary year concerned, they may be revised as changes occur until the final data are issued by the Member States. The effect of a change in estimate is included when determining the net surplus or deficit for the period in which the change occurred.
Traditional own resources
Recoverables from non-exchange transactions and related revenues are recognised when the relevant monthly "A" statements (including duties collected and amounts due that are guaranteed and not contested) are received from the Member States. At the reporting date, revenue collected by the Member States for the period but not yet paid to the Commission is estimated and recognised as accrued income. The quarterly "B" statements (including duties neither collected nor guaranteed, as well as guaranteed amounts that have been contested by the debtor) received from the Member States are recognised as revenue less the collection costs to which they are entitled. In addition, a value reduction is recognised for the amount of the estimated recovery gap.
Fines
Revenue from fines is recognised when the EU's decision imposing a fine has been taken and it is officially notified to the addressee. If there are doubts about the undertaking's solvency, a value reduction on the entitlement is recognised. After the decision to impose a fine, the debtors have two months from the date of notification:
- either to accept the decision, in which case they must pay the fine within the time limit laid down and the amount is definitively collected by the EU;
- or not to accept the decision, in which case they lodge an appeal under EU law.
However, even if appealed, the principal of the fine must be paid within the time limit of three months laid down as the appeal does not have suspensory effect (Article 278 of the EU Treaty) or, under certain
Annual accounts of the European Union 2014
48
circumstances and subject to the agreement of the Commission's Accounting Officer, it may present a bank guarantee for the amount instead.
If the undertaking appeals against the decision, and has already provisionally paid the fine, the amount is disclosed as a contingent liability. However, since an appeal against an EU decision by the addressee does not have suspensory effect, the cash received is used to clear the recoverable. If a guarantee is received instead of payment, the fine remains as a recoverable. If it appears probable that the General Court may not rule in favour of the EU, a provision is recognised to cover this risk. If a guarantee had been given instead, then the recoverable outstanding is written-down as required. The accumulated interest received by the Commission on the bank accounts where received payments are deposited is recognised as revenue, and any contingent liability is increased accordingly.
Since 2010, all provisionally cashed fines are managed by the Commission in a specifically created fund (BUFI) and invested in financial instruments categorised as available for sale financial assets.
REVENUE FROM EXCHANGE TRANSACTIONS
Revenue from the sale of goods and services is recognised when the significant risk and rewards of ownership of the goods are transferred to the purchaser. Revenue associated with a transaction involving the provision of services is recognised by reference to the stage of completion of the transaction at the reporting date.
Interest income and expense
Interest income and expense are recognised in the statement of financial performance using the effective interest method. This is a method of calculating the amortised cost of a financial asset or a financial liability and of allocating the interest income or interest expense over the relevant period. When calculating the effective interest rate, the EU estimates cashflows considering all contractual terms of the financial instrument (for example, prepayment options) but does not consider future credit losses. The calculation includes all fees and points paid or received between parties to the contract that are an integral part of the effective interest rate, transaction costs and all other premiums or discounts.
Once a financial asset or a group of similar financial assets has been written down as a result of an impairment loss, interest income is recognised using the rate of interest to discount the future cashflows for the purpose of measuring the impairment loss.
Dividend income
Dividend income is recognised when the right to receive payment is established.
1.6.2. Expenses
Expenses from non-exchange transactions account for the majority of the EU's expenses. They relate to transfers to beneficiaries and can be of three types: entitlements, transfers under agreement and discretionary grants, contributions and donations.
Transfers are recognised as expenses in the period during which the events giving rise to the transfer occurred, as long as the nature of the transfer is allowed by regulation (Financial Regulation, Staff Regulations, or other regulation) or an agreement has been signed authorising the transfer; any eligibility criteria have been met by the beneficiary; and a reasonable estimate of the amount can be made.
When a request for payment or cost claim is received and meets the recognition criteria, it is recognised as an expense for the eligible amount. At year-end, incurred eligible expenses due to the beneficiaries but not yet reported are estimated and recorded as accrued expenses.
Expenses from exchange transactions arising from the purchase of goods and services are recognised when the supplies are delivered and accepted by the EU. They are valued at original invoice cost.
Annual accounts of the European Union 2014
49
1.7. CONTINGENT ASSETS AND LIABILITIES
1.7.1. Contingent assets
A contingent asset is a possible asset that arises from past events and of which the existence will be confirmed only by the occurrence or non-occurrence of one or more uncertain future events not wholly within the control of the EU. A contingent asset is disclosed when an inflow of economic benefits or service potential is probable.
1.7.2. Contingent liabilities
A contingent liability is a possible obligation that arises from past events and of which the existence will be confirmed only by the occurrence or non-occurrence of one or more uncertain future events not wholly within the control of the EU; or a present obligation that arises from past events but is not recognised because: it is not probable that an outflow of resources embodying economic benefits or service potential will be required to settle the obligation or in the rare circumstances where the amount of the obligation cannot be measured with sufficient reliability.
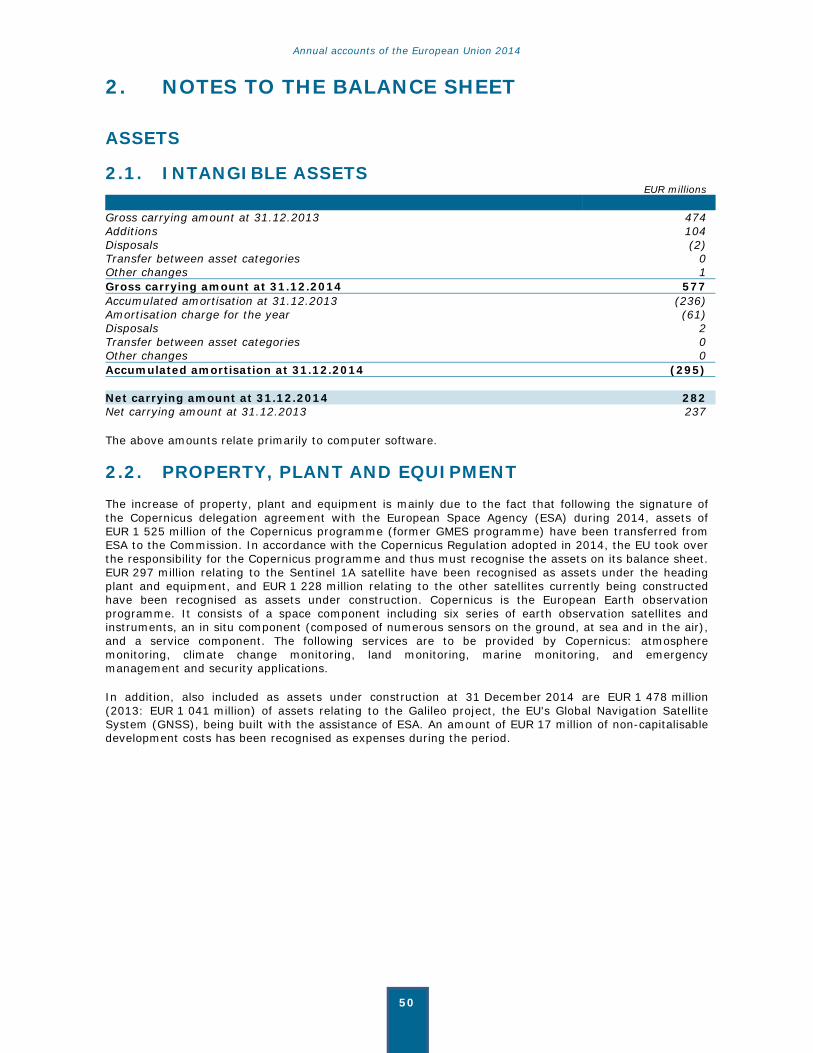
Annual accounts of the European Union 2014
50
2. NOTES TO THE BALANCE SHEET
ASSETS
2.1. INTANGIBLE ASSETS EUR millions Gross carrying amount at 31.12.2013 474 Additions 104 Disposals (2) Transfer between asset categories 0 Other changes 1 Gross carrying amount at 31.12.2014 577 Accumulated amortisation at 31.12.2013 (236) Amortisation charge for the year (61) Disposals 2 Transfer between asset categories 0 Other changes 0 Accumulated amortisation at 31.12.2014 (295) Net carrying amount at 31.12.2014 282 Net carrying amount at 31.12.2013 237
The above amounts relate primarily to computer software.
2.2. PROPERTY, PLANT AND EQUIPMENT The increase of property, plant and equipment is mainly due to the fact that following the signature of the Copernicus delegation agreement with the European Space Agency (ESA) during 2014, assets of EUR 1 525 million of the Copernicus programme (former GMES programme) have been transferred from ESA to the Commission. In accordance with the Copernicus Regulation adopted in 2014, the EU took over the responsibility for the Copernicus programme and thus must recognise the assets on its balance sheet. EUR 297 million relating to the Sentinel 1A satellite have been recognised as assets under the heading plant and equipment, and EUR 1 228 million relating to the other satellites currently being constructed have been recognised as assets under construction. Copernicus is the European Earth observation programme. It consists of a space component including six series of earth observation satellites and instruments, an in situ component (composed of numerous sensors on the ground, at sea and in the air), and a service component. The following services are to be provided by Copernicus: atmosphere monitoring, climate change monitoring, land monitoring, marine monitoring, and emergency management and security applications.
In addition, also included as assets under construction at 31 December 2014 are EUR 1 478 million (2013: EUR 1 041 million) of assets relating to the Galileo project, the EU's Global Navigation Satellite System (GNSS), being built with the assistance of ESA. An amount of EUR 17 million of non-capitalisable development costs has been recognised as expenses during the period.
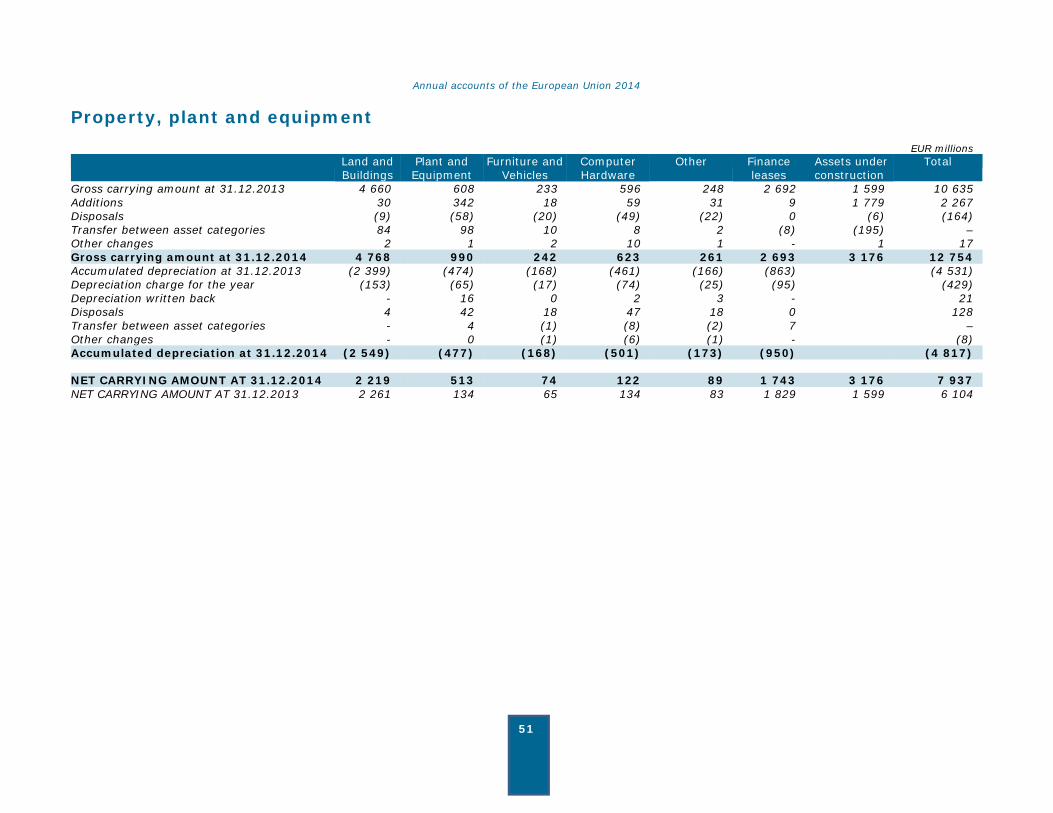
Annual accounts of the European Union 2014
51
Property, plant and equipment EUR millions Land and
BuildingsPlant and Equipment
Furniture and Vehicles
Computer Hardware
Other Finance leases
Assets under construction
Total
Gross carrying amount at 31.12.2013 4 660 608 233 596 248 2 692 1 599 10 635 Additions 30 342 18 59 31 9 1 779 2 267 Disposals (9) (58) (20) (49) (22) 0 (6) (164) Transfer between asset categories 84 98 10 8 2 (8) (195) – Other changes 2 1 2 10 1 - 1 17 Gross carrying amount at 31.12.2014 4 768 990 242 623 261 2 693 3 176 12 754 Accumulated depreciation at 31.12.2013 (2 399) (474) (168) (461) (166) (863) (4 531) Depreciation charge for the year (153) (65) (17) (74) (25) (95) (429) Depreciation written back - 16 0 2 3 - 21 Disposals 4 42 18 47 18 0 128 Transfer between asset categories - 4 (1) (8) (2) 7 – Other changes - 0 (1) (6) (1) - (8) Accumulated depreciation at 31.12.2014 (2 549) (477) (168) (501) (173) (950) (4 817) NET CARRYING AMOUNT AT 31.12.2014 2 219 513 74 122 89 1 743 3 176 7 937 NET CARRYING AMOUNT AT 31.12.2013 2 261 134 65 134 83 1 829 1 599 6 104
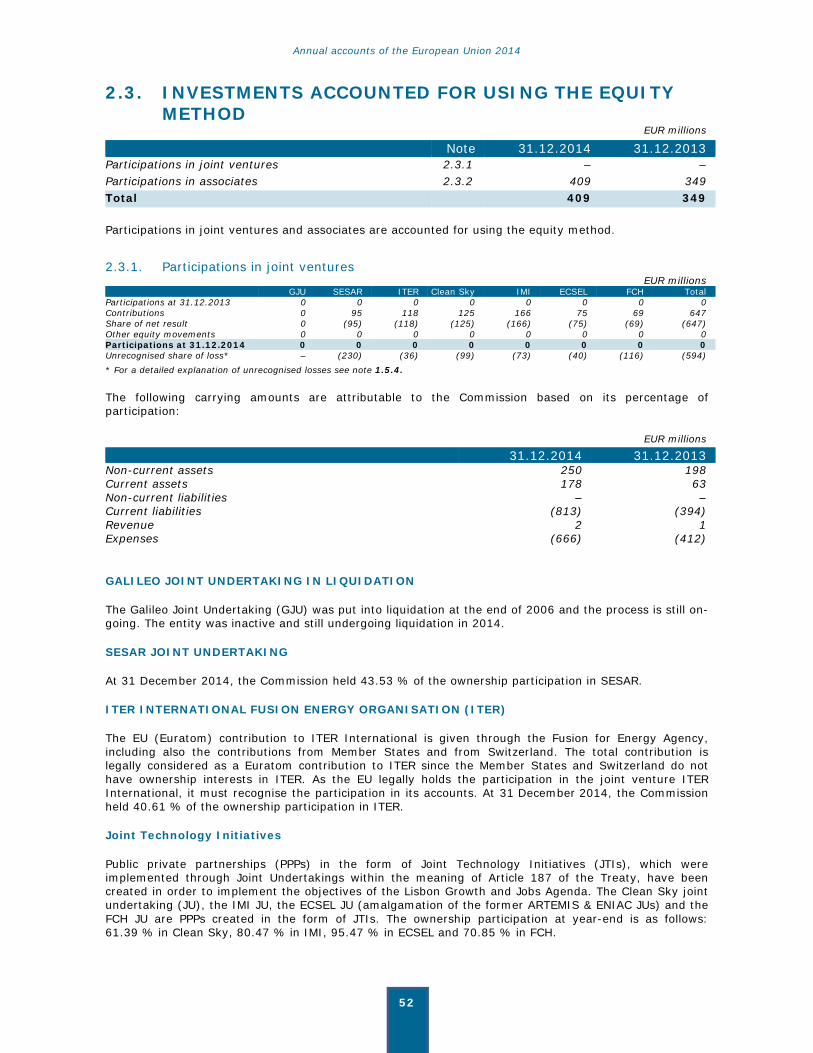
Annual accounts of the European Union 2014
52
2.3. INVESTMENTS ACCOUNTED FOR USING THE EQUITY METHOD
EUR millions
Note 31.12.2014 31.12.2013Participations in joint ventures 2.3.1 – – Participations in associates 2.3.2 409 349 Total 409 349
Participations in joint ventures and associates are accounted for using the equity method.
2.3.1. Participations in joint ventures EUR millions
GJU SESAR ITER Clean Sky IMI ECSEL FCH Total Participations at 31.12.2013 0 0 0 0 0 0 0 0 Contributions 0 95 118 125 166 75 69 647 Share of net result 0 (95) (118) (125) (166) (75) (69) (647) Other equity movements 0 0 0 0 0 0 0 0 Participations at 31.12.2014 0 0 0 0 0 0 0 0 Unrecognised share of loss* – (230) (36) (99) (73) (40) (116) (594) * For a detailed explanation of unrecognised losses see note 1.5.4.
The following carrying amounts are attributable to the Commission based on its percentage of participation:
EUR millions
31.12.2014 31.12.2013Non-current assets 250 198 Current assets 178 63 Non-current liabilities – – Current liabilities (813) (394) Revenue 2 1 Expenses (666) (412)
GALILEO JOINT UNDERTAKING IN LIQUIDATION
The Galileo Joint Undertaking (GJU) was put into liquidation at the end of 2006 and the process is still on-going. The entity was inactive and still undergoing liquidation in 2014.
SESAR JOINT UNDERTAKING
At 31 December 2014, the Commission held 43.53 % of the ownership participation in SESAR.
ITER INTERNATIONAL FUSION ENERGY ORGANISATION (ITER)
The EU (Euratom) contribution to ITER International is given through the Fusion for Energy Agency, including also the contributions from Member States and from Switzerland. The total contribution is legally considered as a Euratom contribution to ITER since the Member States and Switzerland do not have ownership interests in ITER. As the EU legally holds the participation in the joint venture ITER International, it must recognise the participation in its accounts. At 31 December 2014, the Commission held 40.61 % of the ownership participation in ITER.
Joint Technology Initiatives
Public private partnerships (PPPs) in the form of Joint Technology Initiatives (JTIs), which were implemented through Joint Undertakings within the meaning of Article 187 of the Treaty, have been created in order to implement the objectives of the Lisbon Growth and Jobs Agenda. The Clean Sky joint undertaking (JU), the IMI JU, the ECSEL JU (amalgamation of the former ARTEMIS & ENIAC JUs) and the FCH JU are PPPs created in the form of JTIs. The ownership participation at year-end is as follows: 61.39 % in Clean Sky, 80.47 % in IMI, 95.47 % in ECSEL and 70.85 % in FCH.

Annual accounts of the European Union 2014
53
2.3.2. Participations in associates
European Investment Fund
The participation of the Commission in the European Investment Fund (EIF) is treated as associate using the equity method of accounting. The EIF is the EU's financial institution specialising in providing risk capital and guarantees to SMEs. EUR millions EIFParticipation at 31.12.2013 349 Contributions 38 Share of net result 7 Other equity movements 15 Participation at 31.12.2014 409
The following carrying amounts are attributable to the Commission based on its percentage of participation:
EUR millions
31.12.2014 31.12.2013Assets 497 499 Liabilities (87) (240) Revenue 38 37 Surplus/(deficit) 21 (221)
The Commission has paid in 20 % of its participation, the balance being uncalled, corresponding to an amount of EUR 809 million.
EUR millions
Total EIF capital Commission subscription
Total share capital 4 161 1 011 Paid-in (832) (202) Uncalled 3 329 809
2.4. FINANCIAL ASSETS
EUR millions
Note 31.12.2014 31.12.2013Non-current financial assets Available for sale financial assets 2.4.1 6 550 5 497 Loans 2.4.2 49 888 54 347 Total 56 438 59 844 Current financial assets Available for sale financial assets 2.4.1 2 856 2 373 Loans 2.4.2 8 955 3 198 Total 11 811 5 571 Total 68 249 65 415
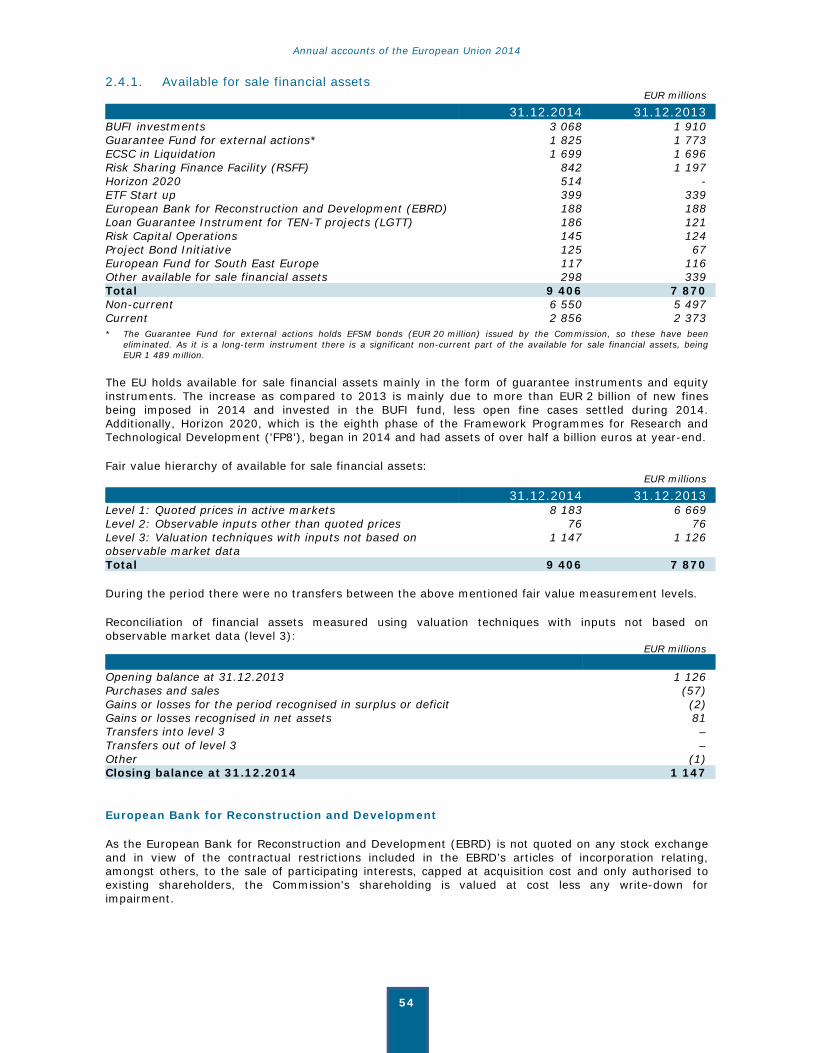
Annual accounts of the European Union 2014
54
2.4.1. Available for sale financial assets EUR millions
31.12.2014 31.12.2013BUFI investments 3 068 1 910 Guarantee Fund for external actions* 1 825 1 773 ECSC in Liquidation 1 699 1 696 Risk Sharing Finance Facility (RSFF) 842 1 197 Horizon 2020 514 - ETF Start up 399 339 European Bank for Reconstruction and Development (EBRD) 188 188 Loan Guarantee Instrument for TEN-T projects (LGTT) 186 121 Risk Capital Operations 145 124 Project Bond Initiative 125 67 European Fund for South East Europe 117 116 Other available for sale financial assets 298 339 Total 9 406 7 870 Non-current 6 550 5 497 Current 2 856 2 373 * The Guarantee Fund for external actions holds EFSM bonds (EUR 20 million) issued by the Commission, so these have been
eliminated. As it is a long-term instrument there is a significant non-current part of the available for sale financial assets, being EUR 1 489 million.
The EU holds available for sale financial assets mainly in the form of guarantee instruments and equity instruments. The increase as compared to 2013 is mainly due to more than EUR 2 billion of new fines being imposed in 2014 and invested in the BUFI fund, less open fine cases settled during 2014. Additionally, Horizon 2020, which is the eighth phase of the Framework Programmes for Research and Technological Development ('FP8'), began in 2014 and had assets of over half a billion euros at year-end.
Fair value hierarchy of available for sale financial assets: EUR millions
31.12.2014 31.12.2013Level 1: Quoted prices in active markets 8 183 6 669 Level 2: Observable inputs other than quoted prices 76 76 Level 3: Valuation techniques with inputs not based on observable market data
1 147 1 126
Total 9 406 7 870
During the period there were no transfers between the above mentioned fair value measurement levels.
Reconciliation of financial assets measured using valuation techniques with inputs not based on observable market data (level 3): EUR millions Opening balance at 31.12.2013 1 126 Purchases and sales (57) Gains or losses for the period recognised in surplus or deficit (2) Gains or losses recognised in net assets 81 Transfers into level 3 – Transfers out of level 3 – Other (1) Closing balance at 31.12.2014 1 147
European Bank for Reconstruction and Development
As the European Bank for Reconstruction and Development (EBRD) is not quoted on any stock exchange and in view of the contractual restrictions included in the EBRD’s articles of incorporation relating, amongst others, to the sale of participating interests, capped at acquisition cost and only authorised to existing shareholders, the Commission's shareholding is valued at cost less any write-down for impairment.
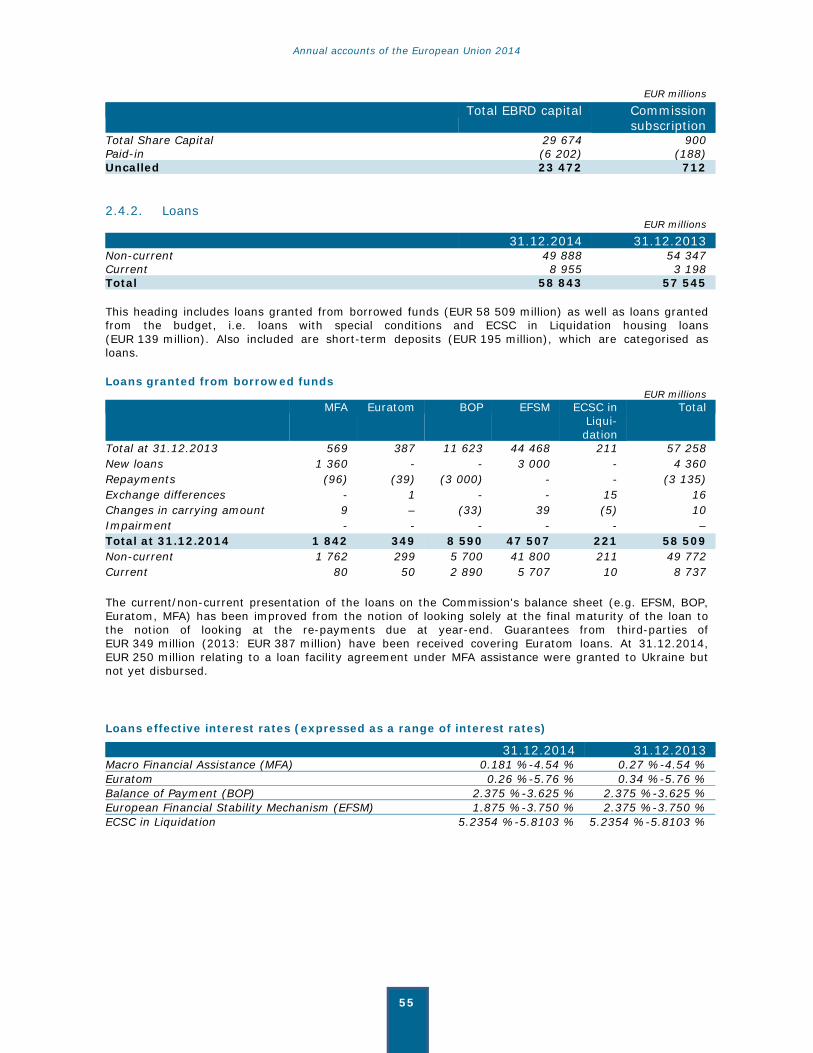
Annual accounts of the European Union 2014
55
EUR millions
Total EBRD capital Commissionsubscription
Total Share Capital 29 674 900 Paid-in (6 202) (188) Uncalled 23 472 712
2.4.2. Loans EUR millions
31.12.2014 31.12.2013Non-current 49 888 54 347 Current 8 955 3 198 Total 58 843 57 545
This heading includes loans granted from borrowed funds (EUR 58 509 million) as well as loans granted from the budget, i.e. loans with special conditions and ECSC in Liquidation housing loans (EUR 139 million). Also included are short-term deposits (EUR 195 million), which are categorised as loans.
Loans granted from borrowed funds EUR millions MFA Euratom BOP EFSM ECSC in
Liqui- dation
Total
Total at 31.12.2013 569 387 11 623 44 468 211 57 258 New loans 1 360 - - 3 000 - 4 360 Repayments (96) (39) (3 000) - - (3 135) Exchange differences - 1 - - 15 16 Changes in carrying amount 9 – (33) 39 (5) 10 Impairment - - - - - – Total at 31.12.2014 1 842 349 8 590 47 507 221 58 509 Non-current 1 762 299 5 700 41 800 211 49 772 Current 80 50 2 890 5 707 10 8 737
The current/non-current presentation of the loans on the Commission's balance sheet (e.g. EFSM, BOP, Euratom, MFA) has been improved from the notion of looking solely at the final maturity of the loan to the notion of looking at the re-payments due at year-end. Guarantees from third-parties of EUR 349 million (2013: EUR 387 million) have been received covering Euratom loans. At 31.12.2014, EUR 250 million relating to a loan facility agreement under MFA assistance were granted to Ukraine but not yet disbursed.
Loans effective interest rates (expressed as a range of interest rates)
31.12.2014 31.12.2013Macro Financial Assistance (MFA) 0.181 %-4.54 % 0.27 %-4.54 % Euratom 0.26 %-5.76 % 0.34 %-5.76 % Balance of Payment (BOP) 2.375 %-3.625 % 2.375 %-3.625 % European Financial Stability Mechanism (EFSM) 1.875 %-3.750 % 2.375 %-3.750 % ECSC in Liquidation 5.2354 %-5.8103 % 5.2354 %-5.8103 %
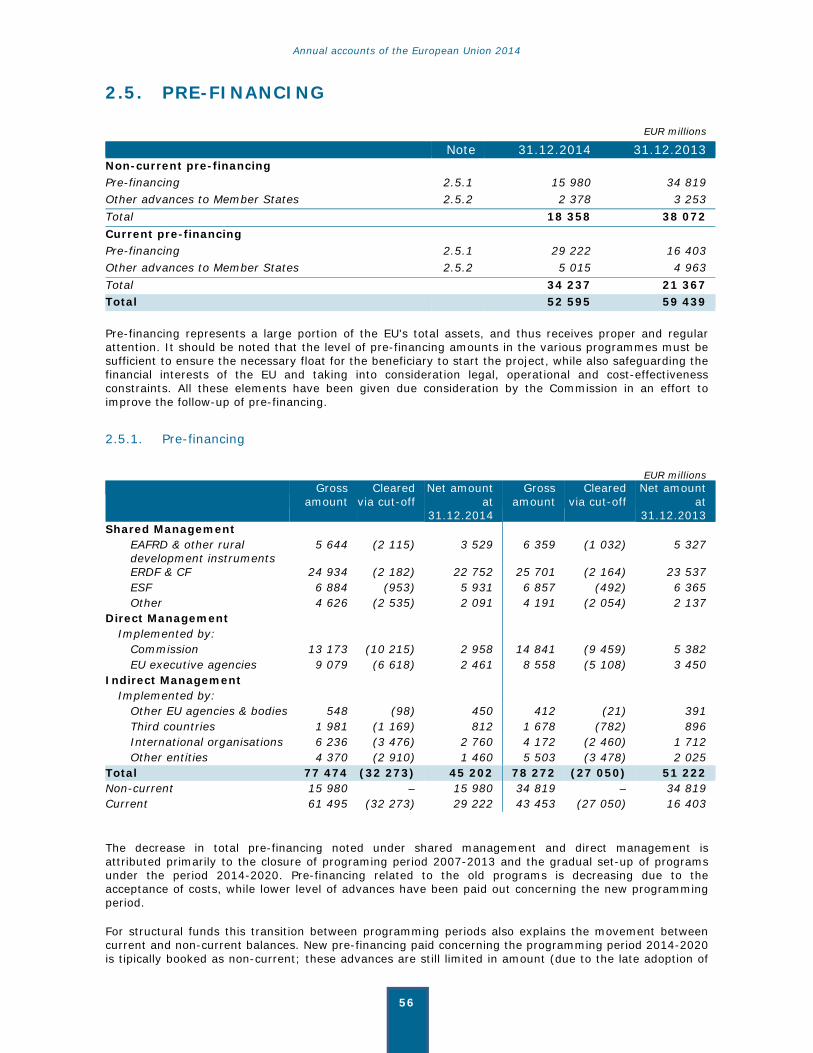
Annual accounts of the European Union 2014
56
2.5. PRE-FINANCING
EUR millions
Note 31.12.2014 31.12.2013Non-current pre-financing Pre-financing 2.5.1 15 980 34 819 Other advances to Member States 2.5.2 2 378 3 253 Total 18 358 38 072 Current pre-financing Pre-financing 2.5.1 29 222 16 403 Other advances to Member States 2.5.2 5 015 4 963 Total 34 237 21 367 Total 52 595 59 439
Pre-financing represents a large portion of the EU's total assets, and thus receives proper and regular attention. It should be noted that the level of pre-financing amounts in the various programmes must be sufficient to ensure the necessary float for the beneficiary to start the project, while also safeguarding the financial interests of the EU and taking into consideration legal, operational and cost-effectiveness constraints. All these elements have been given due consideration by the Commission in an effort to improve the follow-up of pre-financing.
2.5.1. Pre-financing
EUR millions Gross
amount Cleared
via cut-off Net amount
at 31.12.2014
Gross amount
Cleared via cut-off
Net amount at
31.12.2013 Shared Management
EAFRD & other rural development instruments
5 644 (2 115) 3 529 6 359 (1 032) 5 327
ERDF & CF 24 934 (2 182) 22 752 25 701 (2 164) 23 537 ESF 6 884 (953) 5 931 6 857 (492) 6 365 Other 4 626 (2 535) 2 091 4 191 (2 054) 2 137
Direct Management Implemented by:
Commission 13 173 (10 215) 2 958 14 841 (9 459) 5 382 EU executive agencies 9 079 (6 618) 2 461 8 558 (5 108) 3 450
Indirect Management Implemented by:
Other EU agencies & bodies 548 (98) 450 412 (21) 391 Third countries 1 981 (1 169) 812 1 678 (782) 896 International organisations 6 236 (3 476) 2 760 4 172 (2 460) 1 712 Other entities 4 370 (2 910) 1 460 5 503 (3 478) 2 025
Total 77 474 (32 273) 45 202 78 272 (27 050) 51 222 Non-current 15 980 – 15 980 34 819 – 34 819 Current 61 495 (32 273) 29 222 43 453 (27 050) 16 403
The decrease in total pre-financing noted under shared management and direct management is attributed primarily to the closure of programing period 2007-2013 and the gradual set-up of programs under the period 2014-2020. Pre-financing related to the old programs is decreasing due to the acceptance of costs, while lower level of advances have been paid out concerning the new programming period.
For structural funds this transition between programming periods also explains the movement between current and non-current balances. New pre-financing paid concerning the programming period 2014-2020 is tipically booked as non-current; these advances are still limited in amount (due to the late adoption of
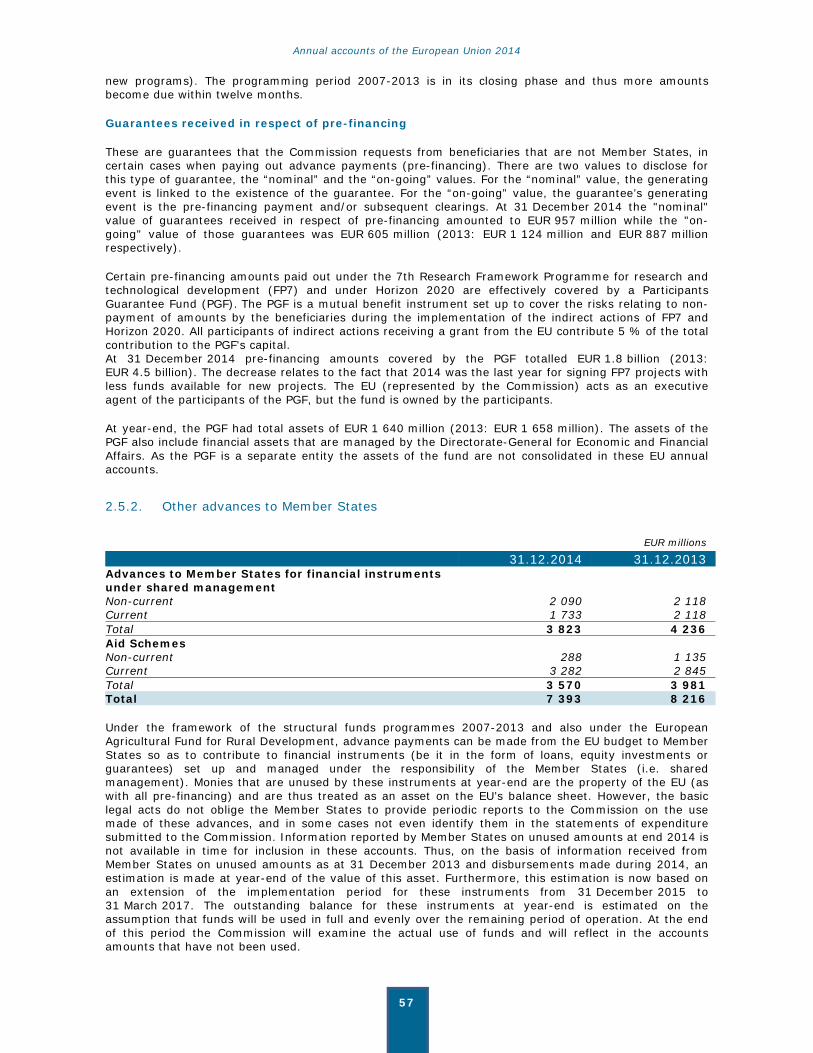
Annual accounts of the European Union 2014
57
new programs). The programming period 2007-2013 is in its closing phase and thus more amounts become due within twelve months.
Guarantees received in respect of pre-financing
These are guarantees that the Commission requests from beneficiaries that are not Member States, in certain cases when paying out advance payments (pre-financing). There are two values to disclose for this type of guarantee, the “nominal” and the “on-going” values. For the “nominal” value, the generating event is linked to the existence of the guarantee. For the “on-going” value, the guarantee’s generating event is the pre-financing payment and/or subsequent clearings. At 31 December 2014 the "nominal" value of guarantees received in respect of pre-financing amounted to EUR 957 million while the "on-going" value of those guarantees was EUR 605 million (2013: EUR 1 124 million and EUR 887 million respectively).
Certain pre-financing amounts paid out under the 7th Research Framework Programme for research and technological development (FP7) and under Horizon 2020 are effectively covered by a Participants Guarantee Fund (PGF). The PGF is a mutual benefit instrument set up to cover the risks relating to non-payment of amounts by the beneficiaries during the implementation of the indirect actions of FP7 and Horizon 2020. All participants of indirect actions receiving a grant from the EU contribute 5 % of the total contribution to the PGF's capital. At 31 December 2014 pre-financing amounts covered by the PGF totalled EUR 1.8 billion (2013: EUR 4.5 billion). The decrease relates to the fact that 2014 was the last year for signing FP7 projects with less funds available for new projects. The EU (represented by the Commission) acts as an executive agent of the participants of the PGF, but the fund is owned by the participants.
At year-end, the PGF had total assets of EUR 1 640 million (2013: EUR 1 658 million). The assets of the PGF also include financial assets that are managed by the Directorate-General for Economic and Financial Affairs. As the PGF is a separate entity the assets of the fund are not consolidated in these EU annual accounts.
2.5.2. Other advances to Member States
EUR millions
31.12.2014 31.12.2013 Advances to Member States for financial instruments under shared management
Non-current 2 090 2 118 Current 1 733 2 118 Total 3 823 4 236 Aid Schemes Non-current 288 1 135 Current 3 282 2 845 Total 3 570 3 981 Total 7 393 8 216
Under the framework of the structural funds programmes 2007-2013 and also under the European Agricultural Fund for Rural Development, advance payments can be made from the EU budget to Member States so as to contribute to financial instruments (be it in the form of loans, equity investments or guarantees) set up and managed under the responsibility of the Member States (i.e. shared management). Monies that are unused by these instruments at year-end are the property of the EU (as with all pre-financing) and are thus treated as an asset on the EU’s balance sheet. However, the basic legal acts do not oblige the Member States to provide periodic reports to the Commission on the use made of these advances, and in some cases not even identify them in the statements of expenditure submitted to the Commission. Information reported by Member States on unused amounts at end 2014 is not available in time for inclusion in these accounts. Thus, on the basis of information received from Member States on unused amounts as at 31 December 2013 and disbursements made during 2014, an estimation is made at year-end of the value of this asset. Furthermore, this estimation is now based on an extension of the implementation period for these instruments from 31 December 2015 to 31 March 2017. The outstanding balance for these instruments at year-end is estimated on the assumption that funds will be used in full and evenly over the remaining period of operation. At the end of this period the Commission will examine the actual use of funds and will reflect in the accounts amounts that have not been used.
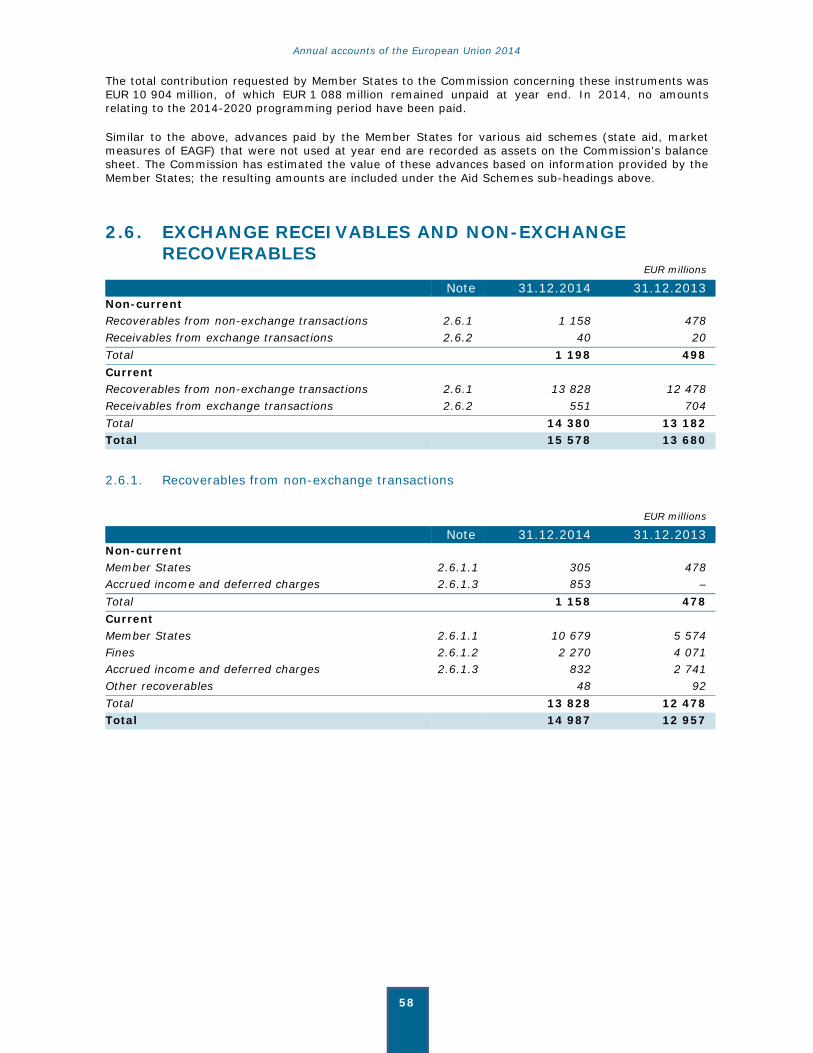
Annual accounts of the European Union 2014
58
The total contribution requested by Member States to the Commission concerning these instruments was EUR 10 904 million, of which EUR 1 088 million remained unpaid at year end. In 2014, no amounts relating to the 2014-2020 programming period have been paid.
Similar to the above, advances paid by the Member States for various aid schemes (state aid, market measures of EAGF) that were not used at year end are recorded as assets on the Commission's balance sheet. The Commission has estimated the value of these advances based on information provided by the Member States; the resulting amounts are included under the Aid Schemes sub-headings above.
2.6. EXCHANGE RECEIVABLES AND NON-EXCHANGE RECOVERABLES
EUR millions
Note 31.12.2014 31.12.2013Non-current Recoverables from non-exchange transactions 2.6.1 1 158 478 Receivables from exchange transactions 2.6.2 40 20 Total 1 198 498 Current Recoverables from non-exchange transactions 2.6.1 13 828 12 478 Receivables from exchange transactions 2.6.2 551 704 Total 14 380 13 182 Total 15 578 13 680
2.6.1. Recoverables from non-exchange transactions
EUR millions
Note 31.12.2014 31.12.2013Non-current Member States 2.6.1.1 305 478 Accrued income and deferred charges 2.6.1.3 853 – Total 1 158 478 Current Member States 2.6.1.1 10 679 5 574 Fines 2.6.1.2 2 270 4 071 Accrued income and deferred charges 2.6.1.3 832 2 741 Other recoverables 48 92 Total 13 828 12 478 Total 14 987 12 957
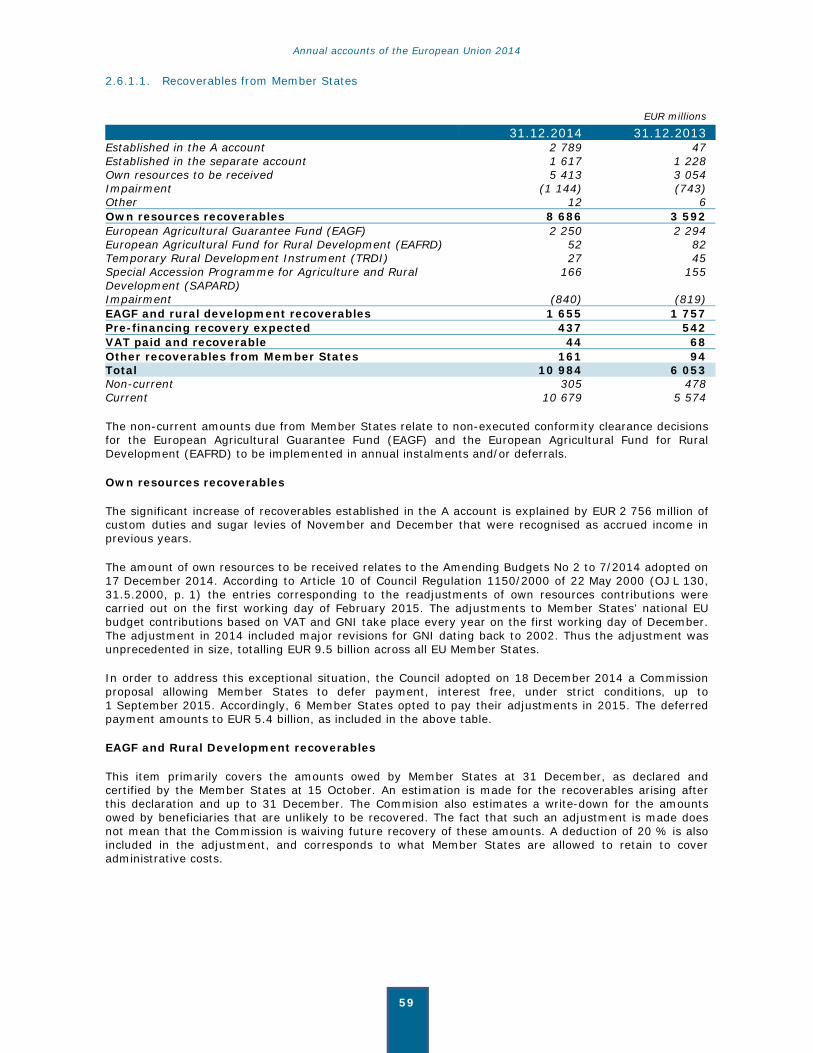
Annual accounts of the European Union 2014
59
2.6.1.1. Recoverables from Member States
EUR millions
31.12.2014 31.12.2013Established in the A account 2 789 47 Established in the separate account 1 617 1 228 Own resources to be received 5 413 3 054 Impairment (1 144) (743) Other 12 6 Own resources recoverables 8 686 3 592 European Agricultural Guarantee Fund (EAGF) 2 250 2 294 European Agricultural Fund for Rural Development (EAFRD) 52 82 Temporary Rural Development Instrument (TRDI) 27 45 Special Accession Programme for Agriculture and Rural Development (SAPARD)
166 155
Impairment (840) (819) EAGF and rural development recoverables 1 655 1 757 Pre-financing recovery expected 437 542 VAT paid and recoverable 44 68 Other recoverables from Member States 161 94 Total 10 984 6 053 Non-current 305 478 Current 10 679 5 574
The non-current amounts due from Member States relate to non-executed conformity clearance decisions for the European Agricultural Guarantee Fund (EAGF) and the European Agricultural Fund for Rural Development (EAFRD) to be implemented in annual instalments and/or deferrals.
Own resources recoverables
The significant increase of recoverables established in the A account is explained by EUR 2 756 million of custom duties and sugar levies of November and December that were recognised as accrued income in previous years.
The amount of own resources to be received relates to the Amending Budgets No 2 to 7/2014 adopted on 17 December 2014. According to Article 10 of Council Regulation 1150/2000 of 22 May 2000 (OJ L 130, 31.5.2000, p. 1) the entries corresponding to the readjustments of own resources contributions were carried out on the first working day of February 2015. The adjustments to Member States’ national EU budget contributions based on VAT and GNI take place every year on the first working day of December. The adjustment in 2014 included major revisions for GNI dating back to 2002. Thus the adjustment was unprecedented in size, totalling EUR 9.5 billion across all EU Member States.
In order to address this exceptional situation, the Council adopted on 18 December 2014 a Commission proposal allowing Member States to defer payment, interest free, under strict conditions, up to 1 September 2015. Accordingly, 6 Member States opted to pay their adjustments in 2015. The deferred payment amounts to EUR 5.4 billion, as included in the above table.
EAGF and Rural Development recoverables
This item primarily covers the amounts owed by Member States at 31 December, as declared and certified by the Member States at 15 October. An estimation is made for the recoverables arising after this declaration and up to 31 December. The Commision also estimates a write-down for the amounts owed by beneficiaries that are unlikely to be recovered. The fact that such an adjustment is made does not mean that the Commission is waiving future recovery of these amounts. A deduction of 20 % is also included in the adjustment, and corresponds to what Member States are allowed to retain to cover administrative costs.

Annual accounts of the European Union 2014
60
2.6.1.2. Fines
This concerns amounts to be recovered relating to fines issued by the Commission of EUR 2 424 million (2013: EUR 4 310 million) less a write-down of EUR 155 million (2013: EUR 239 million). Guarantees totalling EUR 1 916 million were received for the fines outstanding at year-end (2013: EUR 3 244 million). It should be noted that EUR 183 million of these receivables were due for payment after 31 December 2014.
The decrease in the balance of the open fines at year end is due to the fact that fines totalling EUR 4.1 billion became definitive and so were transferred to the budget during 2014.
2.6.1.3. Accrued income and deferred charges
EUR millions
31.12.2014 31.12.2013Own resources accrued income – 2 424 Cohesion, Agriculture & Rural Development Funds: financial corrections
1 502 31
Other accrued income 83 201 Impairment on accrued income – – Deferred charges relating to non-exchange transactions 101 85 Total 1 686 2 741 Non-current 853 – Current 832 2 741
It should be noted that the own resources accrued income, mainly custom duties of November and December, are now disclosed under current recoverables.
2.6.2. Receivables from exchange transactions
EUR millions
31.12.2014 31.12.2013Non-current Other receivables 40 20 Total 40 20 Current Customers 211 381 Impairment on receivables from customers (103) (100) Deferred charges relating to exchange transactions 219 352 Other 224 71 Total 551 704 Total 591 724
2.7. INVENTORIES EUR millions
31.12.2014 31.12.2013 Scientific materials 66 81 Other 62 47 Total 128 128
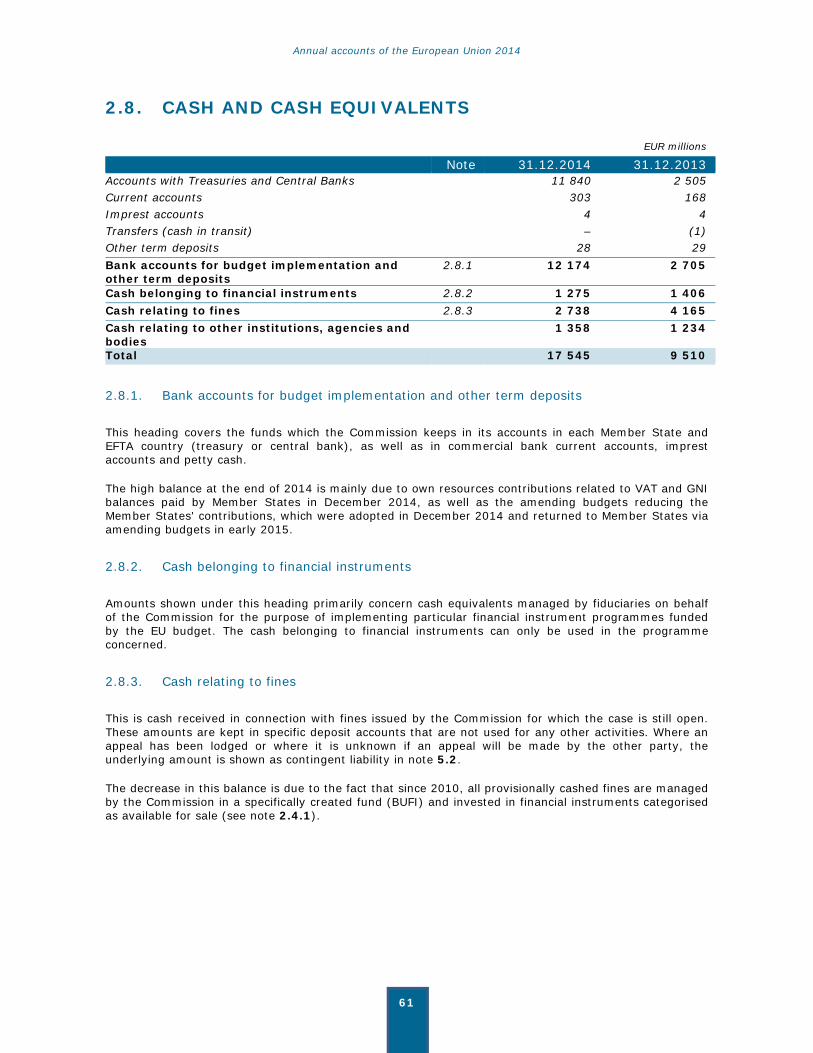
Annual accounts of the European Union 2014
61
2.8. CASH AND CASH EQUIVALENTS
EUR millions
Note 31.12.2014 31.12.2013Accounts with Treasuries and Central Banks 11 840 2 505 Current accounts 303 168 Imprest accounts 4 4 Transfers (cash in transit) – (1) Other term deposits 28 29 Bank accounts for budget implementation and other term deposits
2.8.1 12 174 2 705
Cash belonging to financial instruments 2.8.2 1 275 1 406 Cash relating to fines 2.8.3 2 738 4 165 Cash relating to other institutions, agencies and bodies
1 358 1 234
Total 17 545 9 510
2.8.1. Bank accounts for budget implementation and other term deposits
This heading covers the funds which the Commission keeps in its accounts in each Member State and EFTA country (treasury or central bank), as well as in commercial bank current accounts, imprest accounts and petty cash.
The high balance at the end of 2014 is mainly due to own resources contributions related to VAT and GNI balances paid by Member States in December 2014, as well as the amending budgets reducing the Member States' contributions, which were adopted in December 2014 and returned to Member States via amending budgets in early 2015.
2.8.2. Cash belonging to financial instruments
Amounts shown under this heading primarily concern cash equivalents managed by fiduciaries on behalf of the Commission for the purpose of implementing particular financial instrument programmes funded by the EU budget. The cash belonging to financial instruments can only be used in the programme concerned.
2.8.3. Cash relating to fines
This is cash received in connection with fines issued by the Commission for which the case is still open. These amounts are kept in specific deposit accounts that are not used for any other activities. Where an appeal has been lodged or where it is unknown if an appeal will be made by the other party, the underlying amount is shown as contingent liability in note 5.2.
The decrease in this balance is due to the fact that since 2010, all provisionally cashed fines are managed by the Commission in a specifically created fund (BUFI) and invested in financial instruments categorised as available for sale (see note 2.4.1).
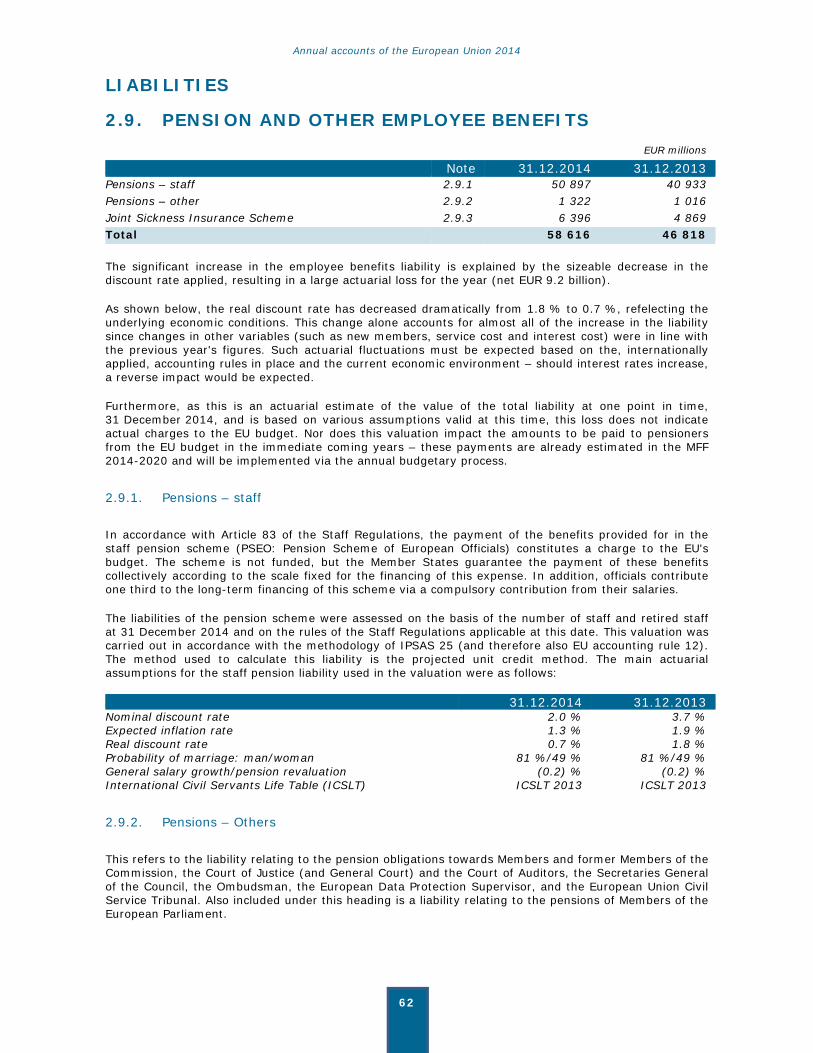
Annual accounts of the European Union 2014
62
LIABILITIES
2.9. PENSION AND OTHER EMPLOYEE BENEFITS EUR millions
Note 31.12.2014 31.12.2013Pensions – staff 2.9.1 50 897 40 933 Pensions – other 2.9.2 1 322 1 016 Joint Sickness Insurance Scheme 2.9.3 6 396 4 869 Total 58 616 46 818
The significant increase in the employee benefits liability is explained by the sizeable decrease in the discount rate applied, resulting in a large actuarial loss for the year (net EUR 9.2 billion).
As shown below, the real discount rate has decreased dramatically from 1.8 % to 0.7 %, refelecting the underlying economic conditions. This change alone accounts for almost all of the increase in the liability since changes in other variables (such as new members, service cost and interest cost) were in line with the previous year's figures. Such actuarial fluctuations must be expected based on the, internationally applied, accounting rules in place and the current economic environment – should interest rates increase, a reverse impact would be expected.
Furthermore, as this is an actuarial estimate of the value of the total liability at one point in time, 31 December 2014, and is based on various assumptions valid at this time, this loss does not indicate actual charges to the EU budget. Nor does this valuation impact the amounts to be paid to pensioners from the EU budget in the immediate coming years – these payments are already estimated in the MFF 2014-2020 and will be implemented via the annual budgetary process.
2.9.1. Pensions – staff
In accordance with Article 83 of the Staff Regulations, the payment of the benefits provided for in the staff pension scheme (PSEO: Pension Scheme of European Officials) constitutes a charge to the EU's budget. The scheme is not funded, but the Member States guarantee the payment of these benefits collectively according to the scale fixed for the financing of this expense. In addition, officials contribute one third to the long-term financing of this scheme via a compulsory contribution from their salaries.
The liabilities of the pension scheme were assessed on the basis of the number of staff and retired staff at 31 December 2014 and on the rules of the Staff Regulations applicable at this date. This valuation was carried out in accordance with the methodology of IPSAS 25 (and therefore also EU accounting rule 12). The method used to calculate this liability is the projected unit credit method. The main actuarial assumptions for the staff pension liability used in the valuation were as follows:
31.12.2014 31.12.2013Nominal discount rate 2.0 % 3.7 % Expected inflation rate 1.3 % 1.9 % Real discount rate 0.7 % 1.8 % Probability of marriage: man/woman 81 %/49 % 81 %/49 % General salary growth/pension revaluation (0.2) % (0.2) % International Civil Servants Life Table (ICSLT) ICSLT 2013 ICSLT 2013
2.9.2. Pensions – Others
This refers to the liability relating to the pension obligations towards Members and former Members of the Commission, the Court of Justice (and General Court) and the Court of Auditors, the Secretaries General of the Council, the Ombudsman, the European Data Protection Supervisor, and the European Union Civil Service Tribunal. Also included under this heading is a liability relating to the pensions of Members of the European Parliament.
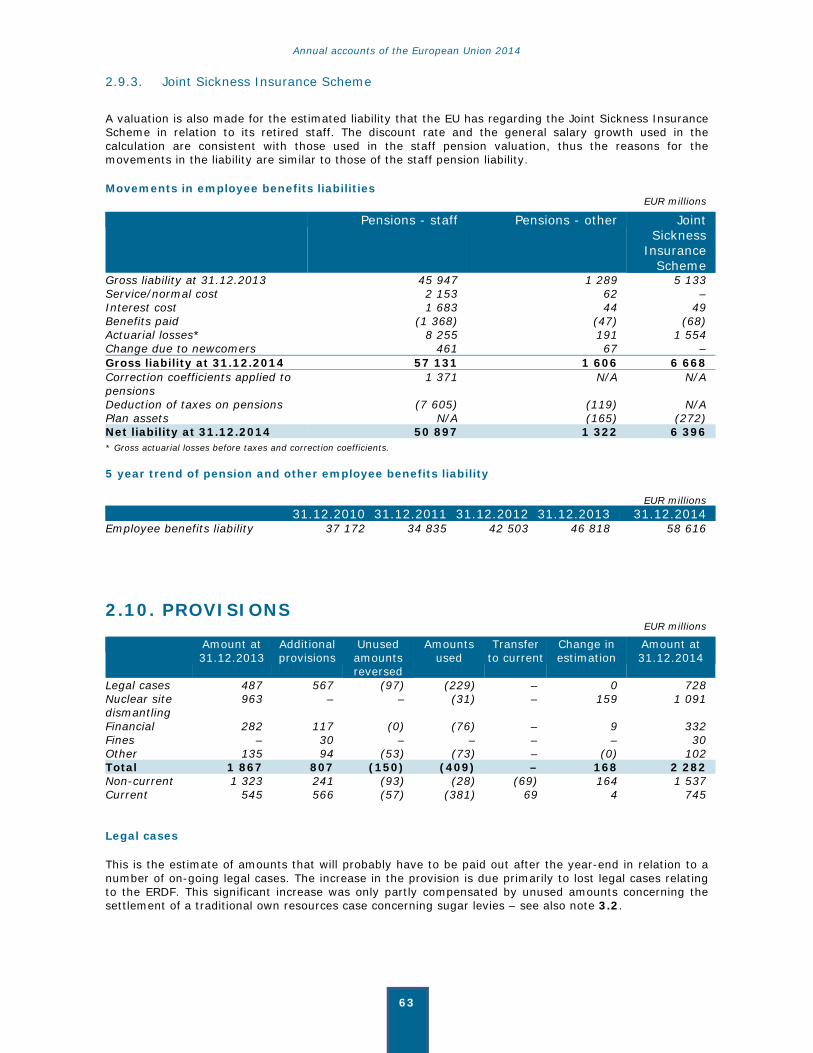
Annual accounts of the European Union 2014
63
2.9.3. Joint Sickness Insurance Scheme
A valuation is also made for the estimated liability that the EU has regarding the Joint Sickness Insurance Scheme in relation to its retired staff. The discount rate and the general salary growth used in the calculation are consistent with those used in the staff pension valuation, thus the reasons for the movements in the liability are similar to those of the staff pension liability.
Movements in employee benefits liabilities EUR millions
Pensions - staff Pensions - other JointSickness
Insurance Scheme
Gross liability at 31.12.2013 45 947 1 289 5 133 Service/normal cost 2 153 62 – Interest cost 1 683 44 49 Benefits paid (1 368) (47) (68) Actuarial losses* 8 255 191 1 554 Change due to newcomers 461 67 – Gross liability at 31.12.2014 57 131 1 606 6 668 Correction coefficients applied to pensions
1 371 N/A N/A
Deduction of taxes on pensions (7 605) (119) N/A Plan assets N/A (165) (272) Net liability at 31.12.2014 50 897 1 322 6 396 * Gross actuarial losses before taxes and correction coefficients. 5 year trend of pension and other employee benefits liability EUR millions 31.12.2010 31.12.2011 31.12.2012 31.12.2013 31.12.2014Employee benefits liability 37 172 34 835 42 503 46 818 58 616
2.10. PROVISIONS EUR millions
Amount at 31.12.2013
Additional provisions
Unused amounts reversed
Amounts used
Transfer to current
Change in estimation
Amount at 31.12.2014
Legal cases 487 567 (97) (229) – 0 728 Nuclear site dismantling
963 – – (31) – 159 1 091
Financial 282 117 (0) (76) – 9 332 Fines – 30 – – – – 30 Other 135 94 (53) (73) – (0) 102 Total 1 867 807 (150) (409) – 168 2 282 Non-current 1 323 241 (93) (28) (69) 164 1 537 Current 545 566 (57) (381) 69 4 745 Legal cases
This is the estimate of amounts that will probably have to be paid out after the year-end in relation to a number of on-going legal cases. The increase in the provision is due primarily to lost legal cases relating to the ERDF. This significant increase was only partly compensated by unused amounts concerning the settlement of a traditional own resources case concerning sugar levies – see also note 3.2.

Annual accounts of the European Union 2014
64
Nuclear site dismantlement
In 2012 a consortium of independent experts updated their 2008 study on the estimated costs of the decommissioning of the Joint Research Centre (JRC) nuclear facilities and waste management programme. Their estimate of EUR 989 million (previously EUR 1 222 million) was taken as the basis for this provision. In 2014 that basis for the provision was again updated as per the "2014 updated JRC Strategy on Decommissioning and Waste Management" (D&WM). It represents the follow up of the comments raised by the Review of the JRC D&WM programme made by external experts. In accordance with EU accounting rules, this provision is indexed for inflation and then discounted to its net present value (using the Euro zero-coupon swap curve). At 31 December 2014, this results in a provision of EUR 1 091 million, split between amounts expected to be used in 2015 (EUR 27 million) and afterwards (EUR 1 064 million).
In view of the estimated duration of this programme (around 20 years), it should be pointed out that there is some uncertainty about this estimate, and the final cost could be different from the amounts currently recorded.
Financial provisions
These concern mainly provisions which represent the estimated losses that will be incurred in relation to the guarantees given by the different financial instruments, where the European Investment Fund (EIF) and the European Investment Bank (EIB) are empowered to issue guarantees in their own name but on behalf of and at the risk of the Commission. The financial risk linked to the drawn and undrawn guarantees is, however, capped. Non-current financial provisions are discounted to their net present value (using the Euro Swap annual rate).
2.11. FINANCIAL LIABILITIES
EUR millions
Note 31.12.2014 31.12.2013Non-current financial liabilities Borrowings 2.11.1 49 743 54 153 Other financial liabilities 2.11.2 2 108 2 216 Total 51 851 56 369 Current financial liabilities Borrowings 2.11.1 8 727 3 065 Other financial liabilities 2.11.2 101 99 Total 8 828 3 163 Total 60 680 59 533
2.11.1. Borrowings
EUR millions
31.12.2014 31.12.2013Borrowings 58 491 57 237 Elimination: Guarantee Fund for external actions* (20) (20) Total 58 470 57 218 * The Guarantee Fund for external actions holds EFSM bonds issued by the Commission, so these need to be eliminated.
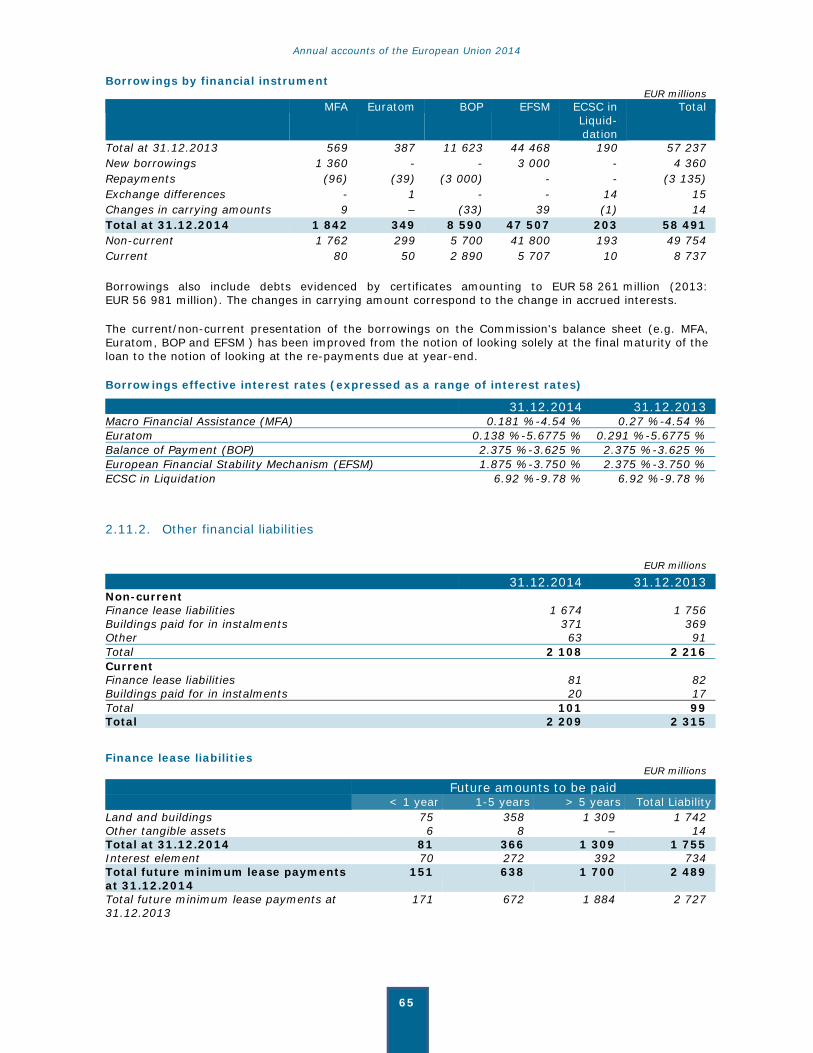
Annual accounts of the European Union 2014
65
Borrowings by financial instrument EUR millions MFA Euratom BOP EFSM ECSC in
Liquid- dation
Total
Total at 31.12.2013 569 387 11 623 44 468 190 57 237 New borrowings 1 360 - - 3 000 - 4 360 Repayments (96) (39) (3 000) - - (3 135) Exchange differences - 1 - - 14 15 Changes in carrying amounts 9 – (33) 39 (1) 14 Total at 31.12.2014 1 842 349 8 590 47 507 203 58 491 Non-current 1 762 299 5 700 41 800 193 49 754 Current 80 50 2 890 5 707 10 8 737
Borrowings also include debts evidenced by certificates amounting to EUR 58 261 million (2013: EUR 56 981 million). The changes in carrying amount correspond to the change in accrued interests.
The current/non-current presentation of the borrowings on the Commission's balance sheet (e.g. MFA, Euratom, BOP and EFSM ) has been improved from the notion of looking solely at the final maturity of the loan to the notion of looking at the re-payments due at year-end.
Borrowings effective interest rates (expressed as a range of interest rates)
31.12.2014 31.12.2013Macro Financial Assistance (MFA) 0.181 %-4.54 % 0.27 %-4.54 % Euratom 0.138 %-5.6775 % 0.291 %-5.6775 % Balance of Payment (BOP) 2.375 %-3.625 % 2.375 %-3.625 % European Financial Stability Mechanism (EFSM) 1.875 %-3.750 % 2.375 %-3.750 % ECSC in Liquidation 6.92 %-9.78 % 6.92 %-9.78 %
2.11.2. Other financial liabilities
EUR millions
31.12.2014 31.12.2013 Non-current Finance lease liabilities 1 674 1 756 Buildings paid for in instalments 371 369 Other 63 91 Total 2 108 2 216 Current Finance lease liabilities 81 82 Buildings paid for in instalments 20 17 Total 101 99 Total 2 209 2 315
Finance lease liabilities EUR millions
Future amounts to be paid < 1 year 1-5 years > 5 years Total Liability
Land and buildings 75 358 1 309 1 742 Other tangible assets 6 8 – 14 Total at 31.12.2014 81 366 1 309 1 755 Interest element 70 272 392 734 Total future minimum lease payments at 31.12.2014
151 638 1 700 2 489
Total future minimum lease payments at 31.12.2013
171 672 1 884 2 727

Annual accounts of the European Union 2014
66
2.12. PAYABLES EUR millions
Gross Amount Adjustments* Net Amount2014 Cost claims & invoices received from: Member States:
European Agricultural Fund for Rural Development & other rural development instruments
318 (23) 295
European Regional Development Fund & Cohesion Fund
19 928 (2 306) 17 622
European Social Fund 5 893 (272) 5 621 Other 751 (93) 658
Private and public entities 1 718 (106) 1 612 Total costs claims & invoices received
28 608 (2 800) 25 808
European Agricultural Guarantee Fund 11 066 N/A 11 066 Sundry payables 156 N/A 156 Own resources payables 5 945 N/A 5 945 Other 204 N/A 204 Total at 31.12.2014 45 980 (2 800) 43 180 2013 Total costs claims & invoices received
27 257 (2 918) 24 339
European Agricultural Guarantee Fund 11 252 N/A 11 252 Sundry payables 147 N/A 147 Own resources payables 244 N/A 244 Other 231 N/A 231 Total at 31.12.2013 39 131 (2 918) 36 213 * Estimated non-eligible amounts and pending prepayments.
Payables include cost statements received by the Commission under the framework of grant activities. They are credited for the amount being claimed from the moment the demand is received. If the counterpart is a Member State, they are classified as such. It is the same procedure for invoices and credit notes received under procurement activities. The cost claims concerned have been taken into account through the year-end cut off procedures. Following these cut-off entries, estimated eligible amounts have therefore been recorded in the accounts as expenses, while the remaining part is disclosed as “Estimated non-eligible amounts and pending prepayments” (see below).
Own resources payables refer to the contribution of Member States to the EU budget to be reimbursed at year-end following the last amending budget of 2014 (EUR 5.9 billion). The significant increase compared to last year is due to the GNI revisions made at year-end (see also note 2.6.1.1).
Estimated non-eligible amounts and pending prepayments
Payables are reduced by that part of the requests for reimbursement received, but not yet checked, that was estimated to be non-eligible. The largest amounts concern the Structural Actions DGs. Payables are also reduced by the part of requests for reimbursement received concerning other advances to Member States (see note 2.5.2) still to pay at year end (EUR 2.0 billion).
Requests for pre-financing
In addition to the above amounts, EUR 1.3 billion of requests for pre-financing have been received and were not yet paid at year-end. According to the EU accounting rules, these amounts are not booked as payables.
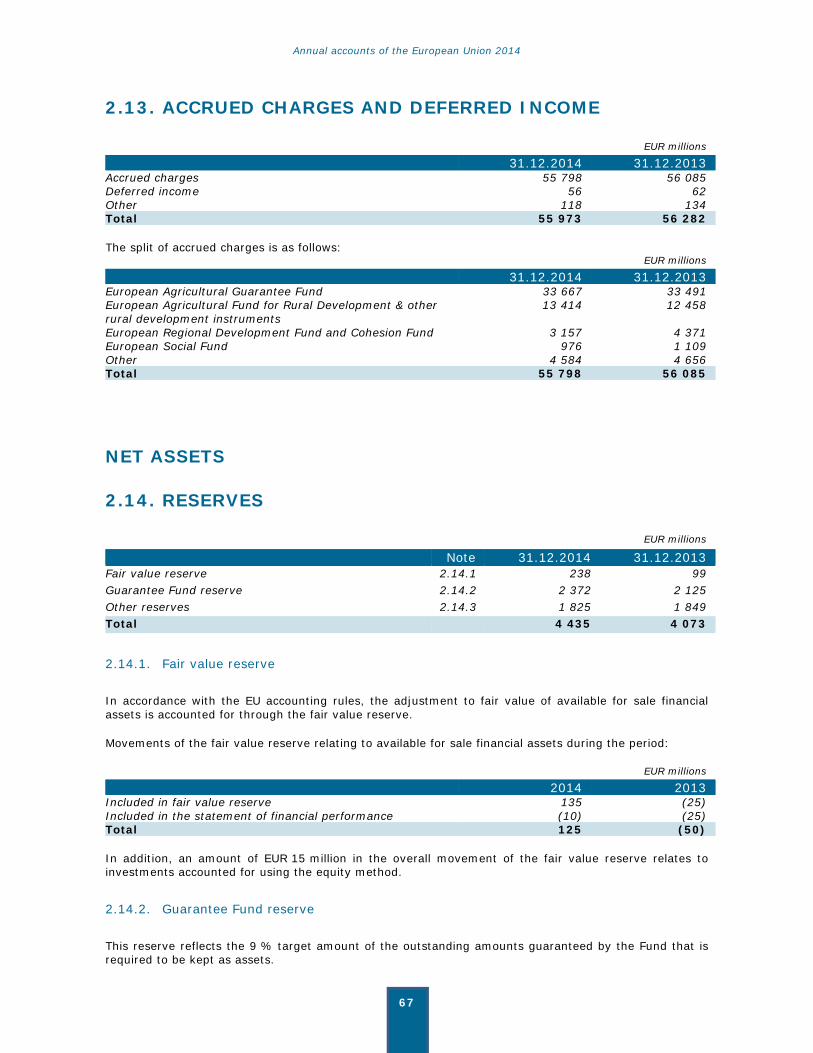
Annual accounts of the European Union 2014
67
2.13. ACCRUED CHARGES AND DEFERRED INCOME
EUR millions
31.12.2014 31.12.2013Accrued charges 55 798 56 085 Deferred income 56 62 Other 118 134 Total 55 973 56 282
The split of accrued charges is as follows: EUR millions
31.12.2014 31.12.2013European Agricultural Guarantee Fund 33 667 33 491 European Agricultural Fund for Rural Development & other rural development instruments
13 414 12 458
European Regional Development Fund and Cohesion Fund 3 157 4 371 European Social Fund 976 1 109 Other 4 584 4 656 Total 55 798 56 085
NET ASSETS
2.14. RESERVES
EUR millions
Note 31.12.2014 31.12.2013Fair value reserve 2.14.1 238 99 Guarantee Fund reserve 2.14.2 2 372 2 125 Other reserves 2.14.3 1 825 1 849 Total 4 435 4 073
2.14.1. Fair value reserve
In accordance with the EU accounting rules, the adjustment to fair value of available for sale financial assets is accounted for through the fair value reserve.
Movements of the fair value reserve relating to available for sale financial assets during the period:
EUR millions
2014 2013Included in fair value reserve 135 (25) Included in the statement of financial performance (10) (25) Total 125 (50)
In addition, an amount of EUR 15 million in the overall movement of the fair value reserve relates to investments accounted for using the equity method.
2.14.2. Guarantee Fund reserve
This reserve reflects the 9 % target amount of the outstanding amounts guaranteed by the Fund that is required to be kept as assets.
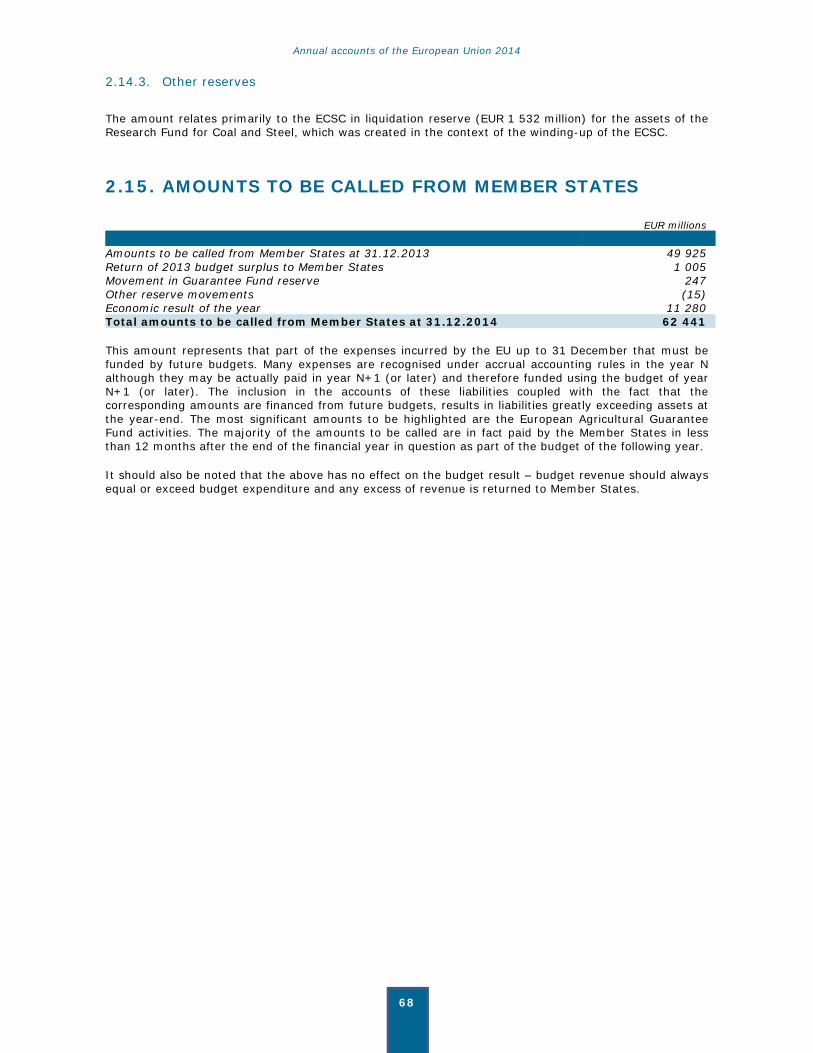
Annual accounts of the European Union 2014
68
2.14.3. Other reserves
The amount relates primarily to the ECSC in liquidation reserve (EUR 1 532 million) for the assets of the Research Fund for Coal and Steel, which was created in the context of the winding-up of the ECSC.
2.15. AMOUNTS TO BE CALLED FROM MEMBER STATES
EUR millions Amounts to be called from Member States at 31.12.2013 49 925 Return of 2013 budget surplus to Member States 1 005 Movement in Guarantee Fund reserve 247 Other reserve movements (15) Economic result of the year 11 280 Total amounts to be called from Member States at 31.12.2014 62 441
This amount represents that part of the expenses incurred by the EU up to 31 December that must be funded by future budgets. Many expenses are recognised under accrual accounting rules in the year N although they may be actually paid in year N+1 (or later) and therefore funded using the budget of year N+1 (or later). The inclusion in the accounts of these liabilities coupled with the fact that the corresponding amounts are financed from future budgets, results in liabilities greatly exceeding assets at the year-end. The most significant amounts to be highlighted are the European Agricultural Guarantee Fund activities. The majority of the amounts to be called are in fact paid by the Member States in less than 12 months after the end of the financial year in question as part of the budget of the following year.
It should also be noted that the above has no effect on the budget result – budget revenue should always equal or exceed budget expenditure and any excess of revenue is returned to Member States.
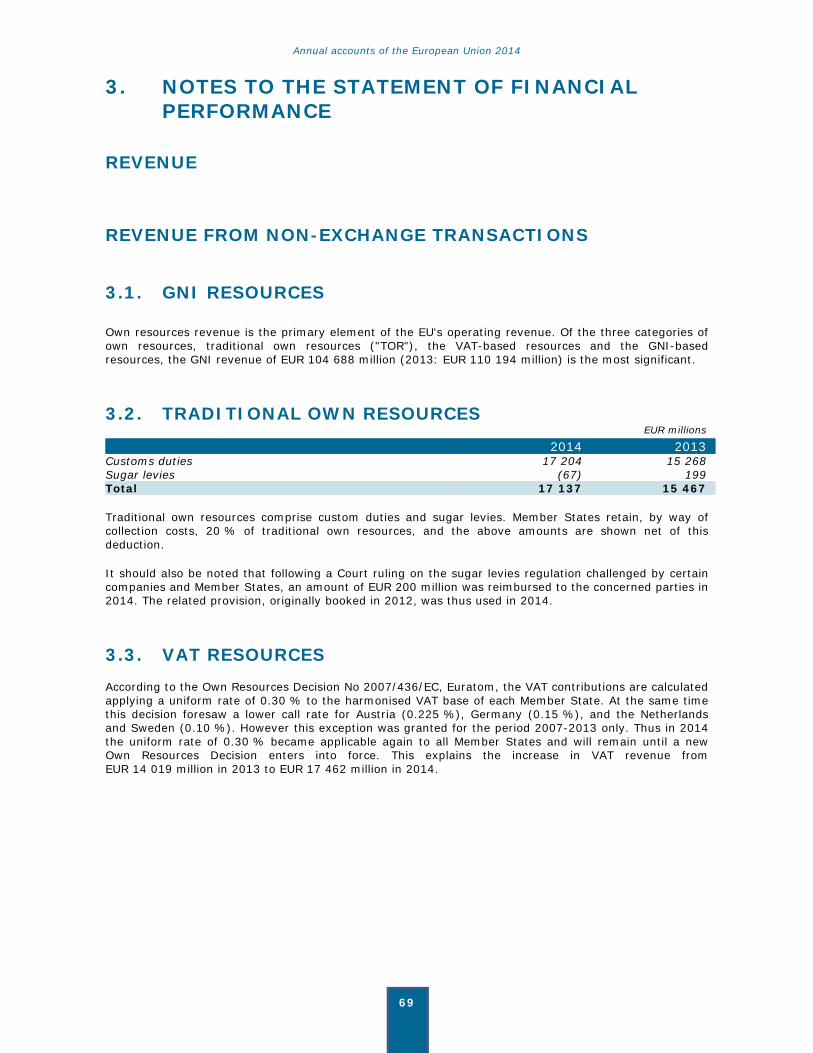
Annual accounts of the European Union 2014
69
3. NOTES TO THE STATEMENT OF FINANCIAL PERFORMANCE
REVENUE
REVENUE FROM NON-EXCHANGE TRANSACTIONS
3.1. GNI RESOURCES
Own resources revenue is the primary element of the EU's operating revenue. Of the three categories of own resources, traditional own resources ("TOR"), the VAT-based resources and the GNI-based resources, the GNI revenue of EUR 104 688 million (2013: EUR 110 194 million) is the most significant.
3.2. TRADITIONAL OWN RESOURCES EUR millions
2014 2013Customs duties 17 204 15 268 Sugar levies (67) 199 Total 17 137 15 467
Traditional own resources comprise custom duties and sugar levies. Member States retain, by way of collection costs, 20 % of traditional own resources, and the above amounts are shown net of this deduction.
It should also be noted that following a Court ruling on the sugar levies regulation challenged by certain companies and Member States, an amount of EUR 200 million was reimbursed to the concerned parties in 2014. The related provision, originally booked in 2012, was thus used in 2014.
3.3. VAT RESOURCES According to the Own Resources Decision No 2007/436/EC, Euratom, the VAT contributions are calculated applying a uniform rate of 0.30 % to the harmonised VAT base of each Member State. At the same time this decision foresaw a lower call rate for Austria (0.225 %), Germany (0.15 %), and the Netherlands and Sweden (0.10 %). However this exception was granted for the period 2007-2013 only. Thus in 2014 the uniform rate of 0.30 % became applicable again to all Member States and will remain until a new Own Resources Decision enters into force. This explains the increase in VAT revenue from EUR 14 019 million in 2013 to EUR 17 462 million in 2014.

Annual accounts of the European Union 2014
70
REVENUE FROM NON-EXCHANGE TRANSACTIONS: TRANSFERS 3.4. FINES These revenues (EUR 2 297 million) relate to fines imposed by the Commission for breach of infringement rules, mainly related to competition cases. Receivables and related revenues are recognised when the Commission decision imposing a fine has been taken and it is officially notified to the addressee.
The main amount in 2014 concerns the market for automotive bearings. The Commission imposed fines for a total amount of EUR 953 million on producers of car and truck bearings for operating a cartel.
3.5. RECOVERY OF EXPENSES EUR millions
2014 2013Shared management 3 328 1 628 Direct management 45 69 Indirect management 45 6 Decentralised management – 41 Joint management – 33 Total 3 418 1 777
This heading represents mainly the recovery orders issued by the Commission that are cashed or offset against (i.e. deducted from) subsequent payments recorded in the Commission's accounting system, made so as to recover expenditure previously paid out from the general budget. These operations are based on controls, audits or eligibility analysis. Recovery orders issued by Member States to beneficiaries of EAGF expenditure, as well as the variation of accrued income estimations from the previous year-end to the current, are also included.
It should be noted that these figures represent the accounting impact of EU corrective activities only, based on the EU accounting rules in force. For this reason, these figures cannot and do not show the full extent of the measures taken to protect the EU budget, particularly for Cohesion policy where specific mechanisms are in place to ensure the correction of ineligible expenditure, most of which do not involve the issuance of a recovery order. Moreover, recoveries of pre-financing amounts are also not included as revenue, in accordance with the EU accounting rules. More details on financial corrections and the recovery of expenses are given in Note 6.
Shared management makes up the bulk of the total:
Agriculture: EAGF and rural development
In the framework of the EAGF and the EAFRD, amounts accounted for as revenue of the year under this heading are financial corrections of the year and reimbursements declared by Member States and recovered during the year, as well as the net increase in the outstanding amounts declared by Member States to be recovered at year-end concerning fraud and irregularities.
Cohesion policy
The main amounts related to Cohesion policy include recovery orders issued by the Commission to recover undue expenditure made in previous years, amounts related to financial corrections implemented by withdrawals during the year, as well as deductions from expenditure less the decrease in accrued income at year-end.

Annual accounts of the European Union 2014
71
Other recovery orders issued in Cohesion policy concern the recovery of pre-financing – see note 6.4. These amounts are not shown as revenue, but credited to the pre-financing heading on the balance sheet.
Total recovery of expenses almost doubled compared to last year due to the advanced closure of the 2000-2006 Cohesion programming period and the related withdrawals made, as well as significant corrections imposed by the Directorate-General for Agriculture and Rural Development in 2014.
3.6. OTHER REVENUE FROM NON-EXCHANGE TRANSACTIONS
EUR millions
2014 2013Transfer of assets 1 448 – Budgetary adjustments 794 1 187 Staff taxes and contributions 1 276 1 137 Contributions from third countries 336 373 Agricultural levies 409 48 Adjustment of provisions 369 208 Other 990 1 091 Total 5 623 4 045
Transfer of assets revenue relates to the transfer of satellites under the Copernicus programme (former GMES programme) from the European Space Agency (ESA) to the Commission (see note 2.2). This transfer is a non-exchange transaction according to the EU accounting rules and will occur in future periods for the remaining Copernicus satellites currently under construction.
The budgetary adjustments include the budget surplus from 2013 (EUR 1 005 million) which is indirectly refunded to Member States by deduction of the amounts of own resources they have to transfer to the EU in the following year – thus it is a revenue for 2014.
Staff taxes and contributions revenue arises primarily from deductions from staff salaries and is made up of two significant amounts – staff pension contributions and taxes on income.
Contributions from third countries are contributions from EFTA countries and accession countries.
Agricultural levies concern milk levies which are a market management tool aimed at penalising milk producers who exceed their reference quantities. As it is not linked to prior payments by the Commission, it is in practice considered as revenue for a specific purpose. The increase in milk levies this year is due to eight Member States exceeding their milk quotas for deliveries in 2013/2014, meaning that they must therefore pay penalties (known as a "superlevy"). The dairy quota regime was abolished on 1 April 2015.

Annual accounts of the European Union 2014
72
REVENUE FROM EXCHANGE TRANSACTIONS
3.7. FINANCIAL INCOME EUR millions
2014 2013Interest income on: Pre-financing 16 29 Late payments 387 88 Available for sale financial assets 65 71 Loans 1 722 1 712 Cash and cash equivalents 10 21 Impaired financial assets 0 - Other 1 1 Interest income 2 202 1 922 Dividend income 6 6 Realised gains on sale of financial assets 30 24 Other financial income 61 40 Total 2 298 1 991
Interest income on loans relates mainly to loans granted from borrowed funds (see note 2.4.2).
Net gains or losses on financial assets EUR millions
2014 2013 Net gains/(losses) on available for sale financial assets 13 24
3.8. OTHER REVENUE FROM EXCHANGE TRANSACTIONS EUR millions
2014 2013Property, plant and equipment related revenue 16 38 Foreign exchange gains 478 336 Other 571 1 070 Total 1 066 1 443
Other revenue from exchange transactions are primarily management fee revenue and revenue relating to receivables previously impaired.
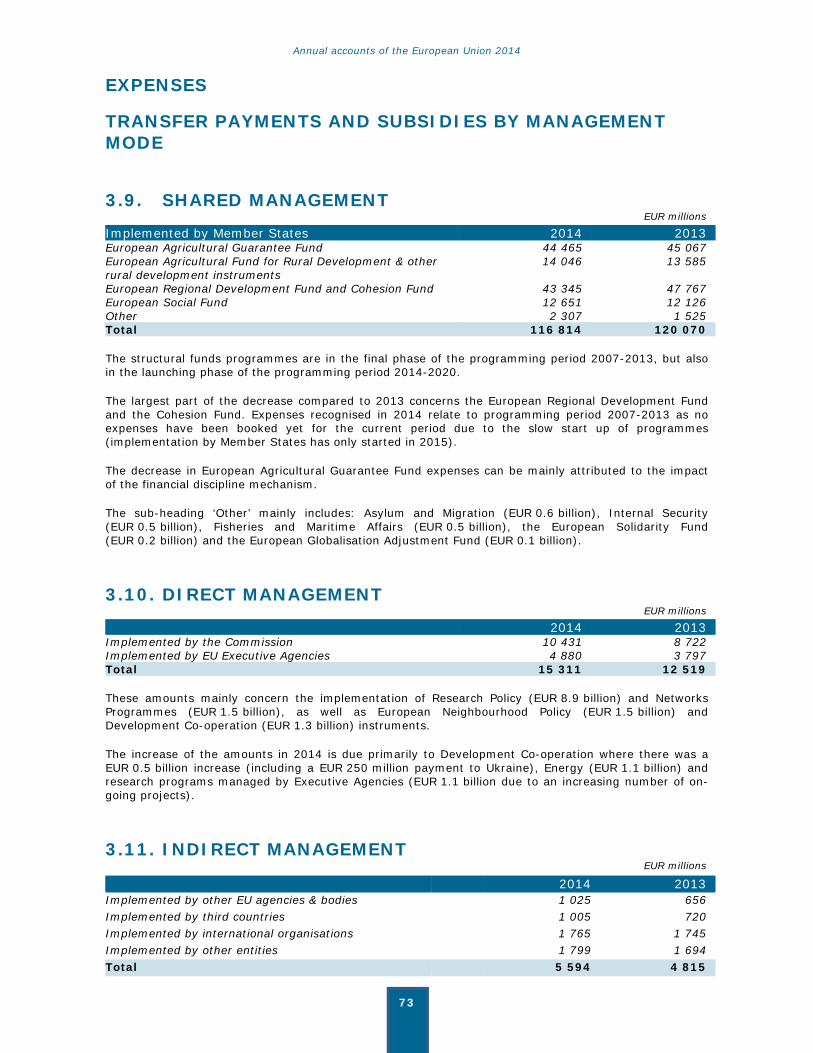
Annual accounts of the European Union 2014
73
EXPENSES
TRANSFER PAYMENTS AND SUBSIDIES BY MANAGEMENT MODE
3.9. SHARED MANAGEMENT EUR millions
Implemented by Member States 2014 2013 European Agricultural Guarantee Fund 44 465 45 067 European Agricultural Fund for Rural Development & other rural development instruments
14 046 13 585
European Regional Development Fund and Cohesion Fund 43 345 47 767 European Social Fund 12 651 12 126 Other 2 307 1 525 Total 116 814 120 070
The structural funds programmes are in the final phase of the programming period 2007-2013, but also in the launching phase of the programming period 2014-2020.
The largest part of the decrease compared to 2013 concerns the European Regional Development Fund and the Cohesion Fund. Expenses recognised in 2014 relate to programming period 2007-2013 as no expenses have been booked yet for the current period due to the slow start up of programmes (implementation by Member States has only started in 2015).
The decrease in European Agricultural Guarantee Fund expenses can be mainly attributed to the impact of the financial discipline mechanism.
The sub-heading ‘Other’ mainly includes: Asylum and Migration (EUR 0.6 billion), Internal Security (EUR 0.5 billion), Fisheries and Maritime Affairs (EUR 0.5 billion), the European Solidarity Fund (EUR 0.2 billion) and the European Globalisation Adjustment Fund (EUR 0.1 billion).
3.10. DIRECT MANAGEMENT EUR millions
2014 2013Implemented by the Commission 10 431 8 722 Implemented by EU Executive Agencies 4 880 3 797 Total 15 311 12 519
These amounts mainly concern the implementation of Research Policy (EUR 8.9 billion) and Networks Programmes (EUR 1.5 billion), as well as European Neighbourhood Policy (EUR 1.5 billion) and Development Co-operation (EUR 1.3 billion) instruments.
The increase of the amounts in 2014 is due primarily to Development Co-operation where there was a EUR 0.5 billion increase (including a EUR 250 million payment to Ukraine), Energy (EUR 1.1 billion) and research programs managed by Executive Agencies (EUR 1.1 billion due to an increasing number of on-going projects).
3.11. INDIRECT MANAGEMENT EUR millions
2014 2013Implemented by other EU agencies & bodies 1 025 656 Implemented by third countries 1 005 720 Implemented by international organisations 1 765 1 745 Implemented by other entities 1 799 1 694 Total 5 594 4 815
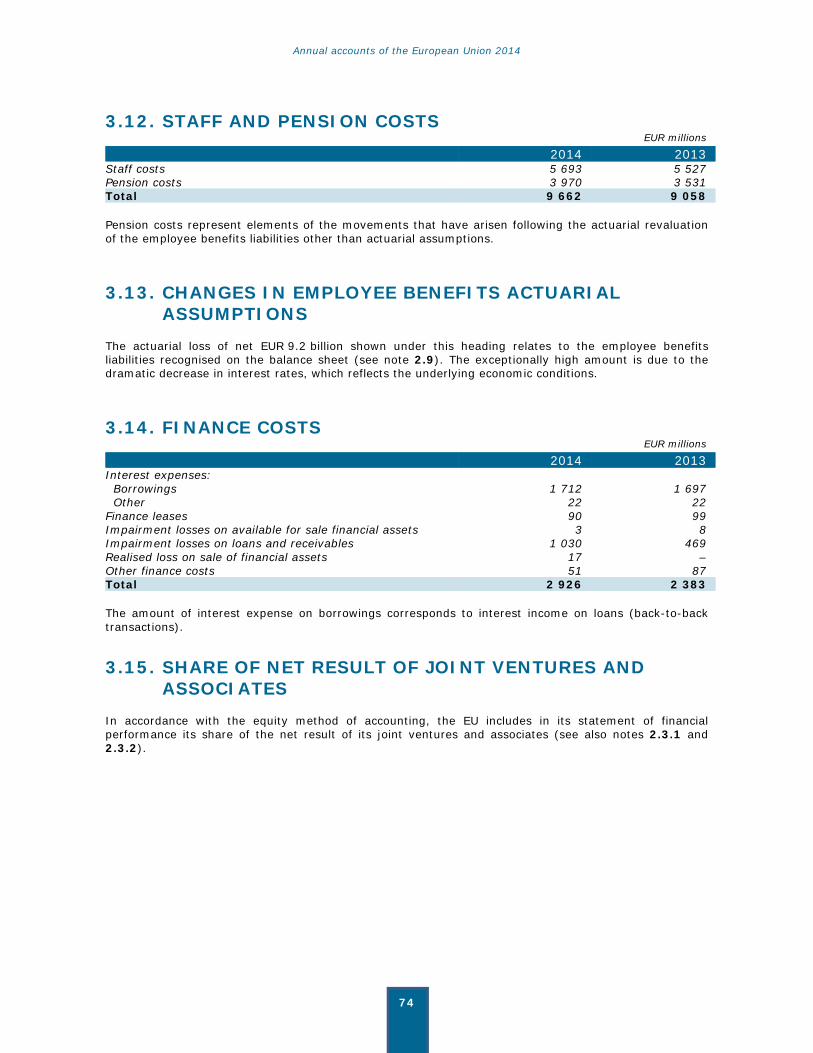
Annual accounts of the European Union 2014
74
3.12. STAFF AND PENSION COSTS EUR millions
2014 2013Staff costs 5 693 5 527 Pension costs 3 970 3 531 Total 9 662 9 058
Pension costs represent elements of the movements that have arisen following the actuarial revaluation of the employee benefits liabilities other than actuarial assumptions.
3.13. CHANGES IN EMPLOYEE BENEFITS ACTUARIAL ASSUMPTIONS
The actuarial loss of net EUR 9.2 billion shown under this heading relates to the employee benefits liabilities recognised on the balance sheet (see note 2.9). The exceptionally high amount is due to the dramatic decrease in interest rates, which reflects the underlying economic conditions.
3.14. FINANCE COSTS EUR millions
2014 2013Interest expenses: Borrowings 1 712 1 697 Other 22 22 Finance leases 90 99 Impairment losses on available for sale financial assets 3 8 Impairment losses on loans and receivables 1 030 469 Realised loss on sale of financial assets 17 – Other finance costs 51 87 Total 2 926 2 383
The amount of interest expense on borrowings corresponds to interest income on loans (back-to-back transactions).
3.15. SHARE OF NET RESULT OF JOINT VENTURES AND ASSOCIATES
In accordance with the equity method of accounting, the EU includes in its statement of financial performance its share of the net result of its joint ventures and associates (see also notes 2.3.1 and 2.3.2).
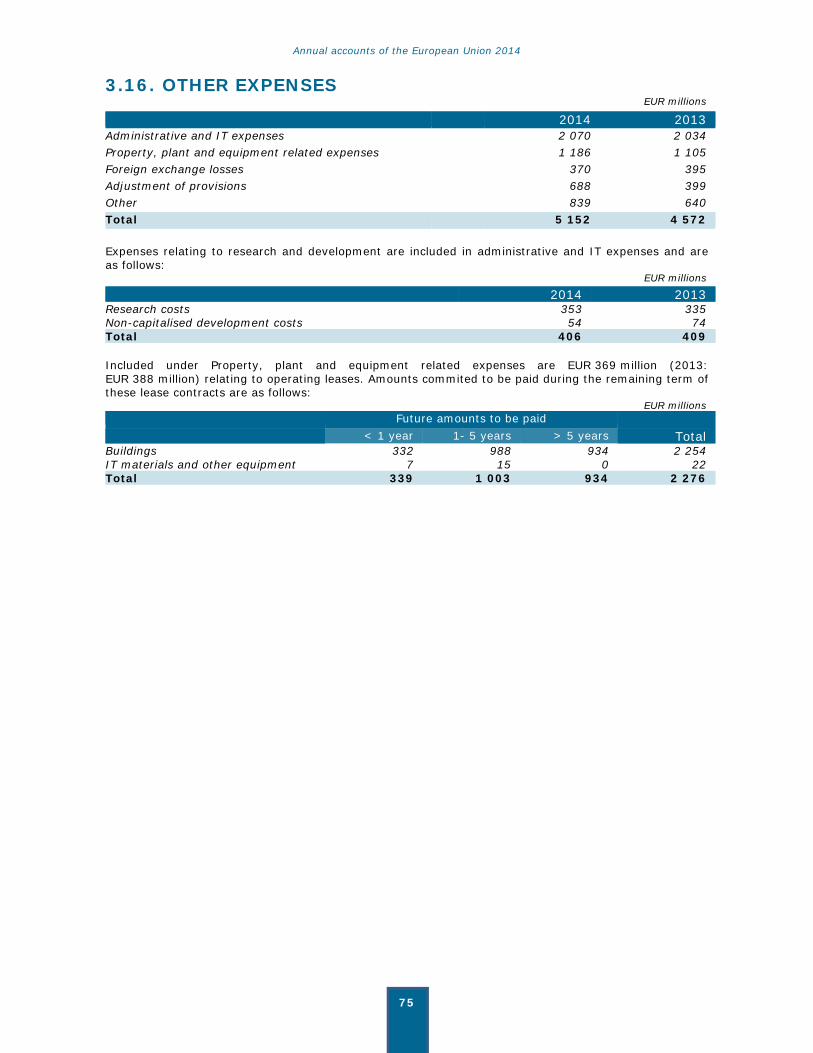
Annual accounts of the European Union 2014
75
3.16. OTHER EXPENSES EUR millions
2014 2013Administrative and IT expenses 2 070 2 034 Property, plant and equipment related expenses 1 186 1 105 Foreign exchange losses 370 395 Adjustment of provisions 688 399 Other 839 640 Total 5 152 4 572
Expenses relating to research and development are included in administrative and IT expenses and are as follows: EUR millions
2014 2013Research costs 353 335 Non-capitalised development costs 54 74 Total 406 409
Included under Property, plant and equipment related expenses are EUR 369 million (2013: EUR 388 million) relating to operating leases. Amounts commited to be paid during the remaining term of these lease contracts are as follows: EUR millions
Future amounts to be paid < 1 year 1- 5 years > 5 years TotalBuildings 332 988 934 2 254 IT materials and other equipment 7 15 0 22 Total 339 1 003 934 2 276
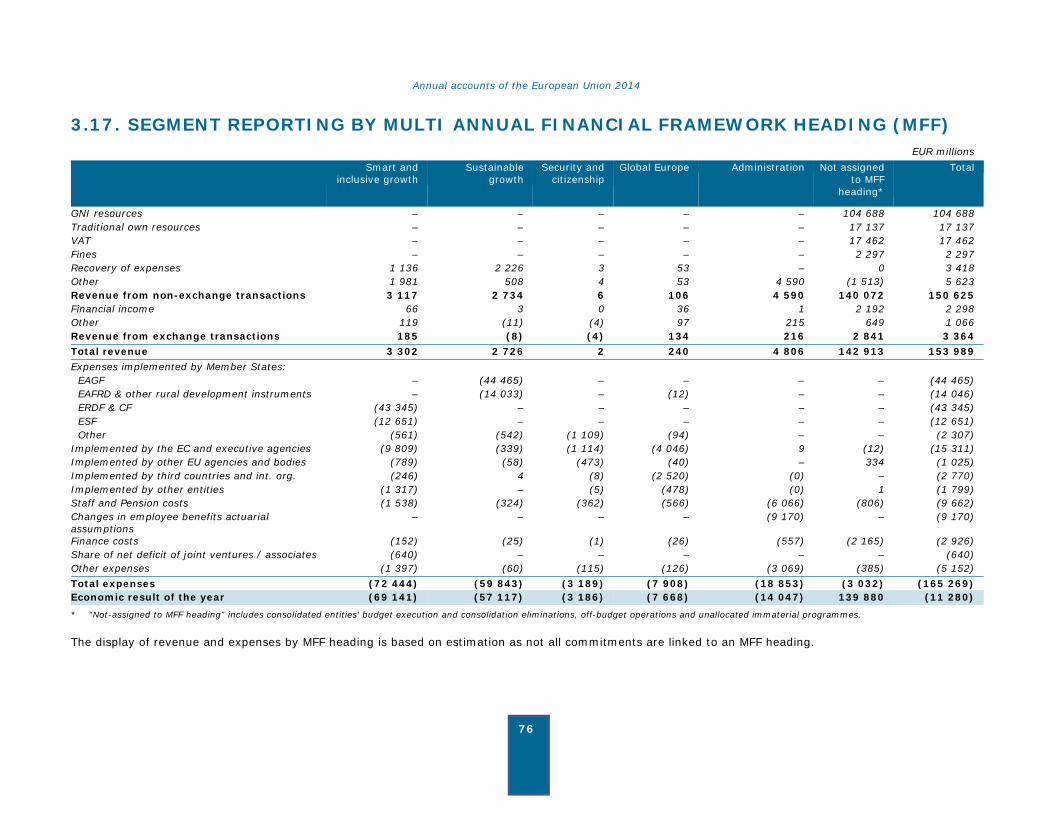
Annual accounts of the European Union 2014
76
3.17. SEGMENT REPORTING BY MULTI ANNUAL FINANCIAL FRAMEWORK HEADING (MFF) EUR millions
Smart and inclusive growth
Sustainable growth
Security and citizenship
Global Europe Administration Not assigned to MFF
heading*
Total
GNI resources – – – – – 104 688 104 688 Traditional own resources – – – – – 17 137 17 137 VAT – – – – – 17 462 17 462 Fines – – – – – 2 297 2 297 Recovery of expenses 1 136 2 226 3 53 – 0 3 418 Other 1 981 508 4 53 4 590 (1 513) 5 623 Revenue from non-exchange transactions 3 117 2 734 6 106 4 590 140 072 150 625 Financial income 66 3 0 36 1 2 192 2 298 Other 119 (11) (4) 97 215 649 1 066 Revenue from exchange transactions 185 (8) (4) 134 216 2 841 3 364 Total revenue 3 302 2 726 2 240 4 806 142 913 153 989 Expenses implemented by Member States: EAGF – (44 465) – – – – (44 465) EAFRD & other rural development instruments – (14 033) – (12) – – (14 046) ERDF & CF (43 345) – – – – – (43 345) ESF (12 651) – – – – – (12 651) Other (561) (542) (1 109) (94) – – (2 307) Implemented by the EC and executive agencies (9 809) (339) (1 114) (4 046) 9 (12) (15 311) Implemented by other EU agencies and bodies (789) (58) (473) (40) – 334 (1 025) Implemented by third countries and int. org. (246) 4 (8) (2 520) (0) – (2 770) Implemented by other entities (1 317) – (5) (478) (0) 1 (1 799) Staff and Pension costs (1 538) (324) (362) (566) (6 066) (806) (9 662) Changes in employee benefits actuarial assumptions
– – – – (9 170) – (9 170)
Finance costs (152) (25) (1) (26) (557) (2 165) (2 926) Share of net deficit of joint ventures / associates (640) – – – – – (640) Other expenses (1 397) (60) (115) (126) (3 069) (385) (5 152) Total expenses (72 444) (59 843) (3 189) (7 908) (18 853) (3 032) (165 269) Economic result of the year (69 141) (57 117) (3 186) (7 668) (14 047) 139 880 (11 280) * "Not-assigned to MFF heading" includes consolidated entities' budget execution and consolidation eliminations, off-budget operations and unallocated immaterial programmes.
The display of revenue and expenses by MFF heading is based on estimation as not all commitments are linked to an MFF heading.
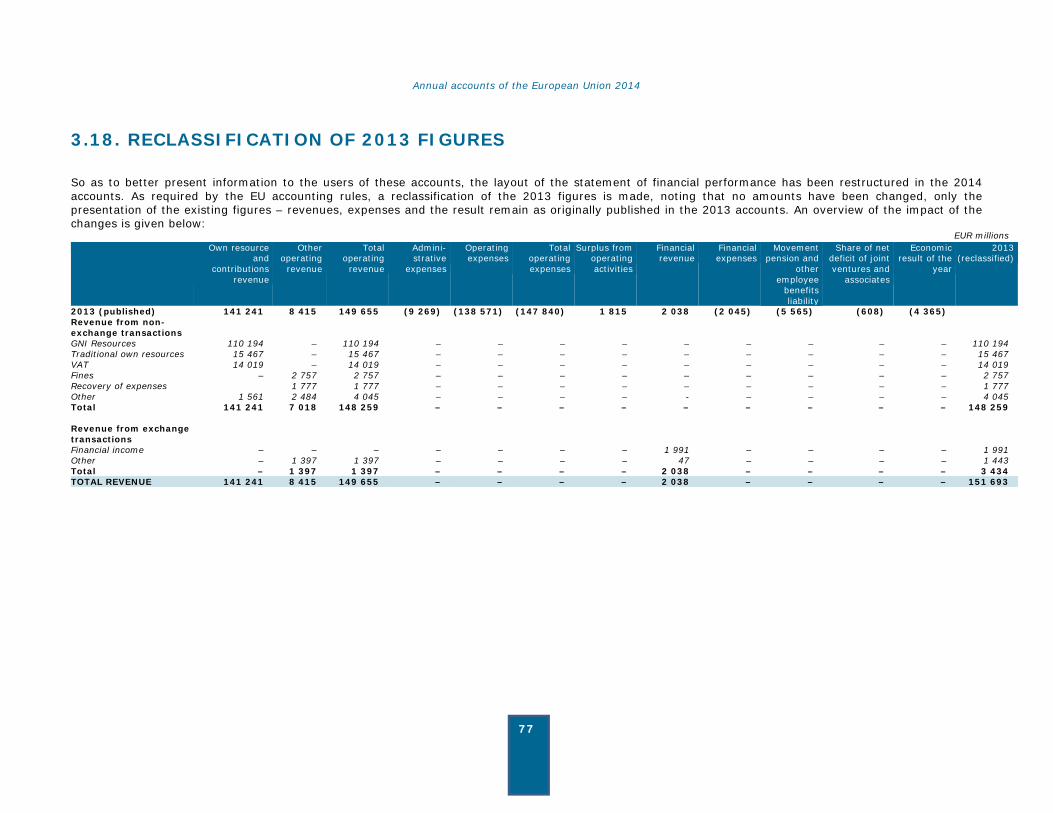
Annual accounts of the European Union 2014
77
3.18. RECLASSIFICATION OF 2013 FIGURES
So as to better present information to the users of these accounts, the layout of the statement of financial performance has been restructured in the 2014 accounts. As required by the EU accounting rules, a reclassification of the 2013 figures is made, noting that no amounts have been changed, only the presentation of the existing figures – revenues, expenses and the result remain as originally published in the 2013 accounts. An overview of the impact of the changes is given below: EUR millions
Own resource and
contributions revenue
Other operating
revenue
Total operating
revenue
Admini-strative
expenses
Operating expenses
Total operating expenses
Surplus from operating activities
Financial revenue
Financial expenses
Movement pension and
other employee
benefits liability
Share of net deficit of joint ventures and
associates
Economic result of the
year
2013 (reclassified)
2013 (published) 141 241 8 415 149 655 (9 269) (138 571) (147 840) 1 815 2 038 (2 045) (5 565) (608) (4 365) Revenue from non-exchange transactions
GNI Resources 110 194 – 110 194 – – – – – – – – – 110 194 Traditional own resources 15 467 – 15 467 – – – – – – – – – 15 467 VAT 14 019 – 14 019 – – – – – – – – – 14 019 Fines – 2 757 2 757 – – – – – – – – – 2 757 Recovery of expenses 1 777 1 777 – – – – – – – – – 1 777 Other 1 561 2 484 4 045 – – – – - – – – – 4 045 Total 141 241 7 018 148 259 – – – – – – – – – 148 259 Revenue from exchange transactions
Financial income – – – – – – – 1 991 – – – – 1 991 Other – 1 397 1 397 – – – – 47 – – – – 1 443 Total – 1 397 1 397 – – – – 2 038 – – – – 3 434 TOTAL REVENUE 141 241 8 415 149 655 – – – – 2 038 – – – – 151 693
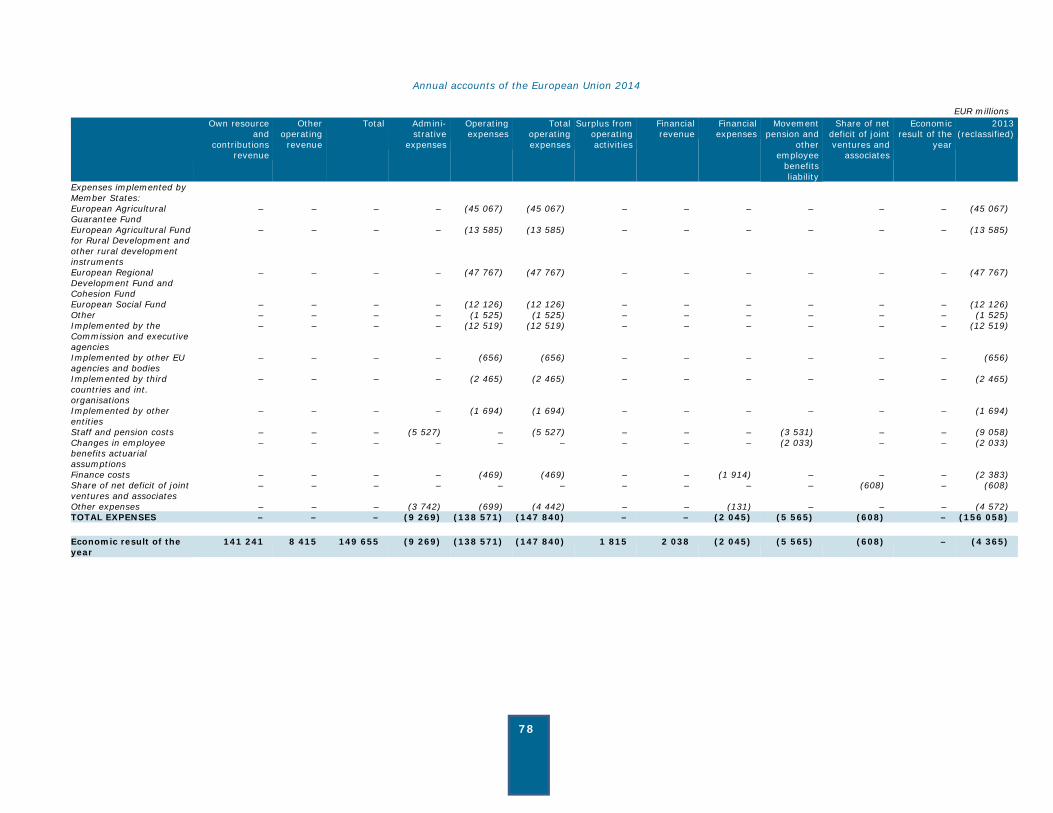
Annual accounts of the European Union 2014
78
EUR millions Own resource
and contributions
revenue
Other operating
revenue
Total Admini-strative
expenses
Operating expenses
Total operating expenses
Surplus from operating activities
Financial revenue
Financial expenses
Movement pension and
other employee
benefits liability
Share of net deficit of joint ventures and
associates
Economic result of the
year
2013 (reclassified)
Expenses implemented by Member States:
European Agricultural Guarantee Fund
– – – – (45 067) (45 067) – – – – – – (45 067)
European Agricultural Fund for Rural Development and other rural development instruments
– – – – (13 585) (13 585) – – – – – – (13 585)
European Regional Development Fund and Cohesion Fund
– – – – (47 767) (47 767) – – – – – – (47 767)
European Social Fund – – – – (12 126) (12 126) – – – – – – (12 126) Other – – – – (1 525) (1 525) – – – – – – (1 525) Implemented by the Commission and executive agencies
– – – – (12 519) (12 519) – – – – – – (12 519)
Implemented by other EU agencies and bodies
– – – – (656) (656) – – – – – – (656)
Implemented by third countries and int. organisations
– – – – (2 465) (2 465) – – – – – – (2 465)
Implemented by other entities
– – – – (1 694) (1 694) – – – – – – (1 694)
Staff and pension costs – – – (5 527) – (5 527) – – – (3 531) – – (9 058) Changes in employee benefits actuarial assumptions
– – – – – – – – – (2 033) – – (2 033)
Finance costs – – – – (469) (469) – – (1 914) – – – (2 383) Share of net deficit of joint ventures and associates
– – – – – – – – – – (608) – (608)
Other expenses – – – (3 742) (699) (4 442) – – (131) – – – (4 572) TOTAL EXPENSES – – – (9 269) (138 571) (147 840) – – (2 045) (5 565) (608) – (156 058) Economic result of the year
141 241 8 415 149 655 (9 269) (138 571) (147 840) 1 815 2 038 (2 045) (5 565) (608) – (4 365)

Annual accounts of the European Union 2014
79
4. NOTES TO THE CASHFLOW STATEMENT
4.1. PURPOSE AND PREPARATION OF THE CASHFLOW STATEMENT
Cashflow information is used to provide a basis for assessing the ability of the EU to generate cash and cash equivalents, and its needs to utilise those cashflows.
The cashflow statement is prepared using the indirect method. This means that the economic result for the financial year is adjusted for the effects of transactions of a non-cash nature, any deferrals or accruals of past or future operating cash receipts or payments, and items of revenue or expense associated with investing cashflows.
Cashflows arising from transactions in a foreign currency are recorded in the EU’s reporting currency (Euro), by applying to the foreign currency amount the exchange rate between the euro and the foreign currency at the date of the cashflow.
The cashflow statement reports cashflows during the period classified by operating and investing activities (the EU does not have financing activities).
4.2. OPERATING ACTIVITIES Operating activities are the activities of the EU that are not investing activities. These are the majority of the activities performed. Loans granted to beneficiaries (and the related borrowings, when applicable) are not considered as investing (or financing) activities as they are part of the general objectives and thus daily operations of the EU. Operating activities also include investments such as EIF, EBRD and venture capital funds. Indeed, the objective of these activities is to contribute to the achievement of policy targeted outcomes.
4.3. INVESTING ACTIVITIES Investing activities are the acquisition and disposal of intangible assets and property, plant and equipment and of other investments which are not included in cash equivalents. Investing activities do not include loans granted to beneficiaries. The objective is to show the real investments made by the EU.
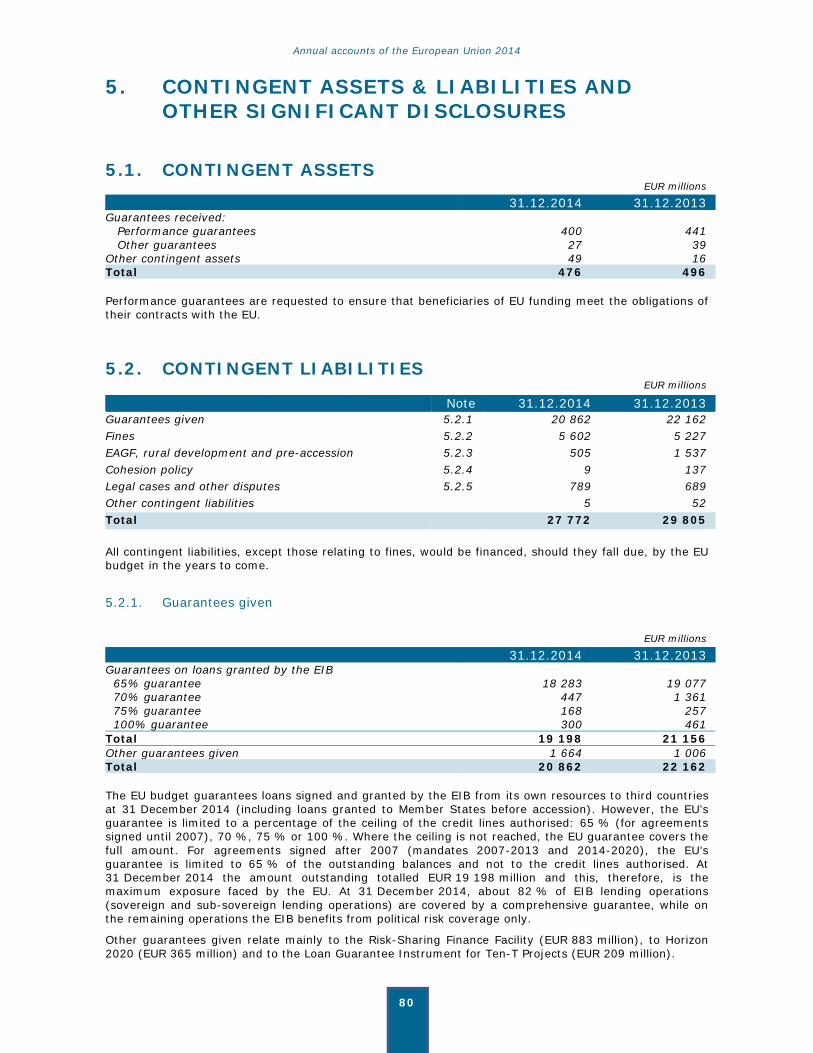
Annual accounts of the European Union 2014
80
5. CONTINGENT ASSETS & LIABILITIES AND OTHER SIGNIFICANT DISCLOSURES
5.1. CONTINGENT ASSETS EUR millions
31.12.2014 31.12.2013Guarantees received: Performance guarantees 400 441 Other guarantees 27 39 Other contingent assets 49 16 Total 476 496
Performance guarantees are requested to ensure that beneficiaries of EU funding meet the obligations of their contracts with the EU.
5.2. CONTINGENT LIABILITIES EUR millions
Note 31.12.2014 31.12.2013 Guarantees given 5.2.1 20 862 22 162 Fines 5.2.2 5 602 5 227 EAGF, rural development and pre-accession 5.2.3 505 1 537 Cohesion policy 5.2.4 9 137 Legal cases and other disputes 5.2.5 789 689 Other contingent liabilities 5 52 Total 27 772 29 805
All contingent liabilities, except those relating to fines, would be financed, should they fall due, by the EU budget in the years to come.
5.2.1. Guarantees given
EUR millions
31.12.2014 31.12.2013Guarantees on loans granted by the EIB 65% guarantee 18 283 19 077 70% guarantee 447 1 361 75% guarantee 168 257 100% guarantee 300 461 Total 19 198 21 156 Other guarantees given 1 664 1 006 Total 20 862 22 162
The EU budget guarantees loans signed and granted by the EIB from its own resources to third countries at 31 December 2014 (including loans granted to Member States before accession). However, the EU’s guarantee is limited to a percentage of the ceiling of the credit lines authorised: 65 % (for agreements signed until 2007), 70 %, 75 % or 100 %. Where the ceiling is not reached, the EU guarantee covers the full amount. For agreements signed after 2007 (mandates 2007-2013 and 2014-2020), the EU’s guarantee is limited to 65 % of the outstanding balances and not to the credit lines authorised. At 31 December 2014 the amount outstanding totalled EUR 19 198 million and this, therefore, is the maximum exposure faced by the EU. At 31 December 2014, about 82 % of EIB lending operations (sovereign and sub-sovereign lending operations) are covered by a comprehensive guarantee, while on the remaining operations the EIB benefits from political risk coverage only.
Other guarantees given relate mainly to the Risk-Sharing Finance Facility (EUR 883 million), to Horizon 2020 (EUR 365 million) and to the Loan Guarantee Instrument for Ten-T Projects (EUR 209 million).
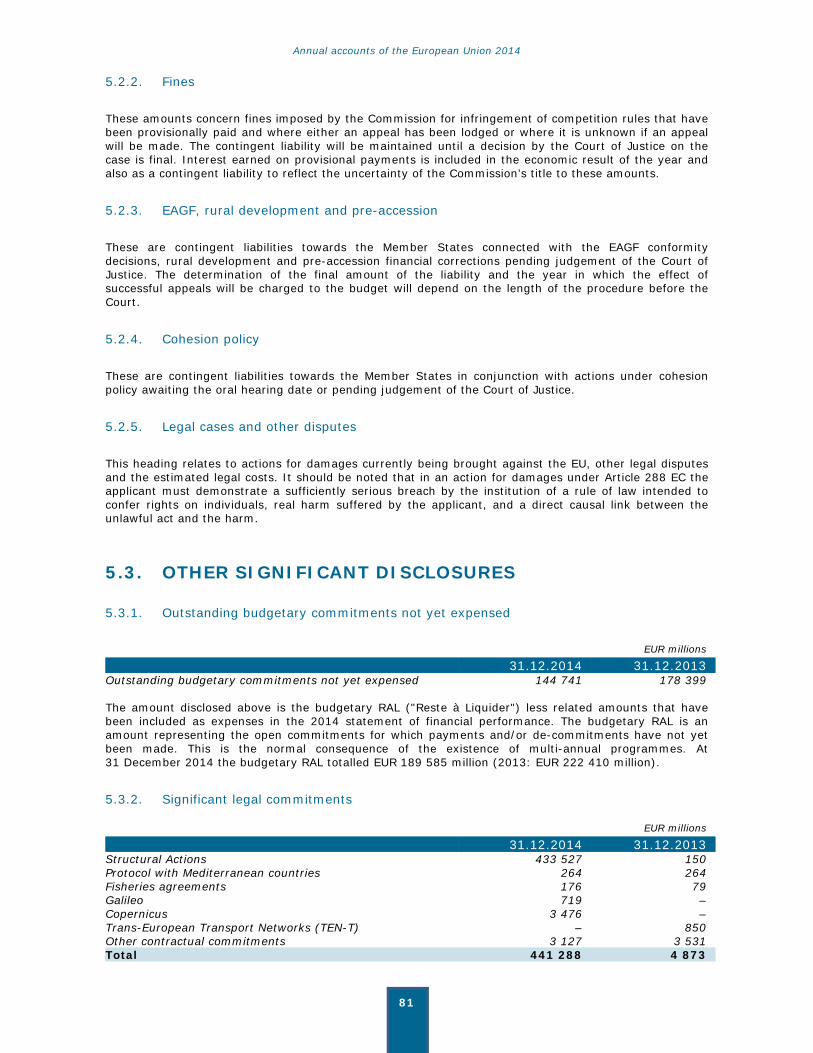
Annual accounts of the European Union 2014
81
5.2.2. Fines
These amounts concern fines imposed by the Commission for infringement of competition rules that have been provisionally paid and where either an appeal has been lodged or where it is unknown if an appeal will be made. The contingent liability will be maintained until a decision by the Court of Justice on the case is final. Interest earned on provisional payments is included in the economic result of the year and also as a contingent liability to reflect the uncertainty of the Commission’s title to these amounts.
5.2.3. EAGF, rural development and pre-accession
These are contingent liabilities towards the Member States connected with the EAGF conformity decisions, rural development and pre-accession financial corrections pending judgement of the Court of Justice. The determination of the final amount of the liability and the year in which the effect of successful appeals will be charged to the budget will depend on the length of the procedure before the Court.
5.2.4. Cohesion policy
These are contingent liabilities towards the Member States in conjunction with actions under cohesion policy awaiting the oral hearing date or pending judgement of the Court of Justice.
5.2.5. Legal cases and other disputes
This heading relates to actions for damages currently being brought against the EU, other legal disputes and the estimated legal costs. It should be noted that in an action for damages under Article 288 EC the applicant must demonstrate a sufficiently serious breach by the institution of a rule of law intended to confer rights on individuals, real harm suffered by the applicant, and a direct causal link between the unlawful act and the harm.
5.3. OTHER SIGNIFICANT DISCLOSURES
5.3.1. Outstanding budgetary commitments not yet expensed
EUR millions
31.12.2014 31.12.2013Outstanding budgetary commitments not yet expensed 144 741 178 399 The amount disclosed above is the budgetary RAL ("Reste à Liquider") less related amounts that have been included as expenses in the 2014 statement of financial performance. The budgetary RAL is an amount representing the open commitments for which payments and/or de-commitments have not yet been made. This is the normal consequence of the existence of multi-annual programmes. At 31 December 2014 the budgetary RAL totalled EUR 189 585 million (2013: EUR 222 410 million).
5.3.2. Significant legal commitments
EUR millions
31.12.2014 31.12.2013Structural Actions 433 527 150 Protocol with Mediterranean countries 264 264 Fisheries agreements 176 79 Galileo 719 – Copernicus 3 476 – Trans-European Transport Networks (TEN-T) – 850 Other contractual commitments 3 127 3 531 Total 441 288 4 873

Annual accounts of the European Union 2014
82
These commitments originated because the Commission entered into long-term legal commitments in respect of amounts that were not yet covered by commitment appropriations in the budget. This can relate to multi-annual programmes such as Structural Actions or amounts that the Commission is committed to pay in the future under administrative contracts existing at the balance sheet date (e.g. relating to the provision of services such as security, cleaning, etc, but also contractual commitments concerning specific projects such as building works). The significant increase of legal commitments relating to Structural Actions is due to the start of the 2014-2020 MFF during the reporting period.
Structural Actions The table below shows a comparison between the legal commitments for which budget commitments have not yet been made and the maximum commitments in relation to the amounts foreseen in the MFF 2014-2020. The future obligations represent the outstanding amounts for which the Commission is still committed to make payments after 31 December 2014. EUR millions
Funds Financial
framework 2014-2020 (A)
Legal commitments concluded (B)
Budget commitments
(C )
Decommit- ments (D)
Legal commitments less budget
commitments (=B-C+D)
Future obligations (=A-C-D)
European Regional Development Fund and Cohesion Fund 259 799 133 163 16 837 – 116 325 242 962
European Social Fund 89 624 57 828 9 273 – 48 555 80 350 Fund for European Aid to the most Deprived 3 814 3 723 501 – 3 222 3 313
HEADING 1B: COHESION POLICY FUNDS 353 236 194 714 26 611 – 168 102 326 625
European Agricultural Fund for Rural Development 99 348 20 707 3 295 – 17 413 96 053
European Maritime and Fisheries Fund 5 749 140 19 – 121 5 730
HEADING 2: NATURAL RESOURCES 105 097 20 847 3 314 – 17 533 101 783
Asylum and Migration Fund 2 752 – – – – 2 752
Internal Security Fund 2 367 – – – – 2 367 HEADING 3: SECURITY & CITIZENSHIP 5 119 – – – – 5 119
Total 463 452 215 561 29 925 – 185 636 433 527
Protocols with Mediterranean countries These commitments relate to financial protocols with Mediterranean non-member countries. The amount included here is the difference between the total amount of the protocols signed and the amount of the budget commitments entered in the accounts. These protocols are international treaties that cannot be wound up without the agreement of both parties, although the winding-up process is on-going.
Fisheries agreements These are commitments entered into with third countries for operations under international fisheries agreements.
Galileo These are amounts committed to the Galileo programme developing a European Global Navigation Satellite System – see also note 2.2.
Copernicus
Copernicus is the European Earth observation programme – see also note 2.2.
TEN-T The 2013 amount related to grants in the field of the Trans-European Transport Networks (TEN-T) for the period 2007-2013. Since the programme is finished there are no new legal commitments without budgetary commitments in 2014.
Other contractual commitments The amounts included under this disclosure correspond to amounts committed to be paid during the term of the contracts. The largest amounts included here relate to EUR 1 933 million for the Fusion for Energy Agency in the context of the ITER project and EUR 547 million for mainly building contracts of the European Parliament.
Annual accounts of the European Union 2014
83
6. PROTECTION OF THE EU BUDGET
6.1. PROTECTION OF THE EU BUDGET - SUMMARY
An important consideration in implementing the EU budget is the need to ensure the proper prevention or detection and subsequent correction of errors, irregularities and fraud. The the Court provides in its annual report a statement of assurance on the legality and regularity of transactions underlying the accounts, as well as observations and statistics on the material level of error in the payments underlying the accounts. The statement of assurance accompanies these accounts in its publication in the Official Journal.
The Commission protects the EU budget, i.e. EU spending, from undue or irregular expenditure via two main methods:
(1) preventive mechanisms; and
(2) corrective mechanisms (primarily financial corrections imposed on or agreed with Member States and, to a lesser extent, recoveries from recipients of EU payments).
The corrective mechanisms are based on a wide range of measures, which apply both before and after the Commission makes (or reimburses) expenditure.
The objective of this note is to present an overview and best estimates of how the EU budget is protected from expenditure in breach of law. This note represents a voluntary disclosure of information that is not required by the accounting standards and includes data which is not drawn directly from the accounting system (see below).
More details on these figures and on the preventive and corrective mechanisms laid down in the applicable legislation can be found in the Communication on the protection of the EU budget prepared by the Commission and sent to the Discharge Authority and the Court every September – this is available on the Europa website of the Directorate-General for Budget. This Communication not only provides more details on the figures in this note (in particular break-downs of financial corrections per Member State), it also includes additional information (such as data on net financial corrections which lead to assigned revenue for the EU budget, and the results of the corrective work done by Member States). Further information on the corrective capacity is also available in the Communication: Synthesis of the Commission's management achievements in 2014 (the "Synthesis Report" issued in June 2015) – this is also available on the Europa website.
6.1.1. Financial corrections
Under shared management, Member States are primarily responsible for preventing or detecting and addressing serious deficiencies in the management and control systems, while the Commission ensures an overall supervisory role. Where serious failings in the management and control systems of Member States have led or could lead to individual or systemic errors, irregularities or fraud, the Commission can apply financial corrections. The term "financial correction" covers a wide range of actions, resulting from the Commission's (and other EU bodies') supervisory and audit role, including cases where the Commission bases the corrective actions on work done by national authorities. Where amounts unduly spent cannot be identified precisely, the Commission may apply extrapolated or flat-rate corrections in accordance with the sector-specific rules.
Financial corrections are presented under two main categories in this note:
(1) Financial corrections confirmed/decided (table 6.2.1): These amounts have been either confirmed (i.e. agreed) by the Member State concerned or adopted by a Commission decision. Corrections by Commission decision are recorded as revenue or negative expenses in the accounting system (see notes 3.5 and 3.9).
(2) Financial corrections implemented (table 6.2.2): These amounts represent the final step of the process whereby the observed situation of undue expenditure is definitively corrected. Several implementation mechanisms are foreseen in the sector-based regulatory frameworks.
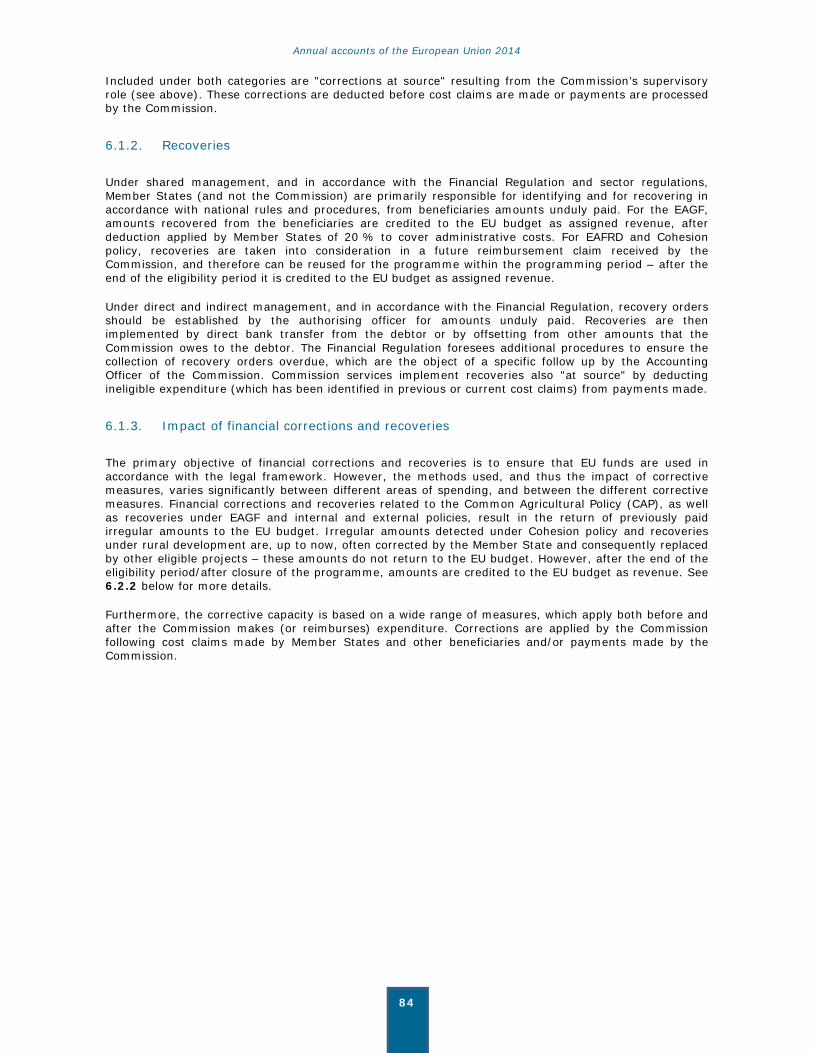
Annual accounts of the European Union 2014
84
Included under both categories are "corrections at source" resulting from the Commission’s supervisory role (see above). These corrections are deducted before cost claims are made or payments are processed by the Commission.
6.1.2. Recoveries
Under shared management, and in accordance with the Financial Regulation and sector regulations, Member States (and not the Commission) are primarily responsible for identifying and for recovering in accordance with national rules and procedures, from beneficiaries amounts unduly paid. For the EAGF, amounts recovered from the beneficiaries are credited to the EU budget as assigned revenue, after deduction applied by Member States of 20 % to cover administrative costs. For EAFRD and Cohesion policy, recoveries are taken into consideration in a future reimbursement claim received by the Commission, and therefore can be reused for the programme within the programming period – after the end of the eligibility period it is credited to the EU budget as assigned revenue.
Under direct and indirect management, and in accordance with the Financial Regulation, recovery orders should be established by the authorising officer for amounts unduly paid. Recoveries are then implemented by direct bank transfer from the debtor or by offsetting from other amounts that the Commission owes to the debtor. The Financial Regulation foresees additional procedures to ensure the collection of recovery orders overdue, which are the object of a specific follow up by the Accounting Officer of the Commission. Commission services implement recoveries also "at source" by deducting ineligible expenditure (which has been identified in previous or current cost claims) from payments made.
6.1.3. Impact of financial corrections and recoveries
The primary objective of financial corrections and recoveries is to ensure that EU funds are used in accordance with the legal framework. However, the methods used, and thus the impact of corrective measures, varies significantly between different areas of spending, and between the different corrective measures. Financial corrections and recoveries related to the Common Agricultural Policy (CAP), as well as recoveries under EAGF and internal and external policies, result in the return of previously paid irregular amounts to the EU budget. Irregular amounts detected under Cohesion policy and recoveries under rural development are, up to now, often corrected by the Member State and consequently replaced by other eligible projects – these amounts do not return to the EU budget. However, after the end of the eligibility period/after closure of the programme, amounts are credited to the EU budget as revenue. See 6.2.2 below for more details.
Furthermore, the corrective capacity is based on a wide range of measures, which apply both before and after the Commission makes (or reimburses) expenditure. Corrections are applied by the Commission following cost claims made by Member States and other beneficiaries and/or payments made by the Commission.
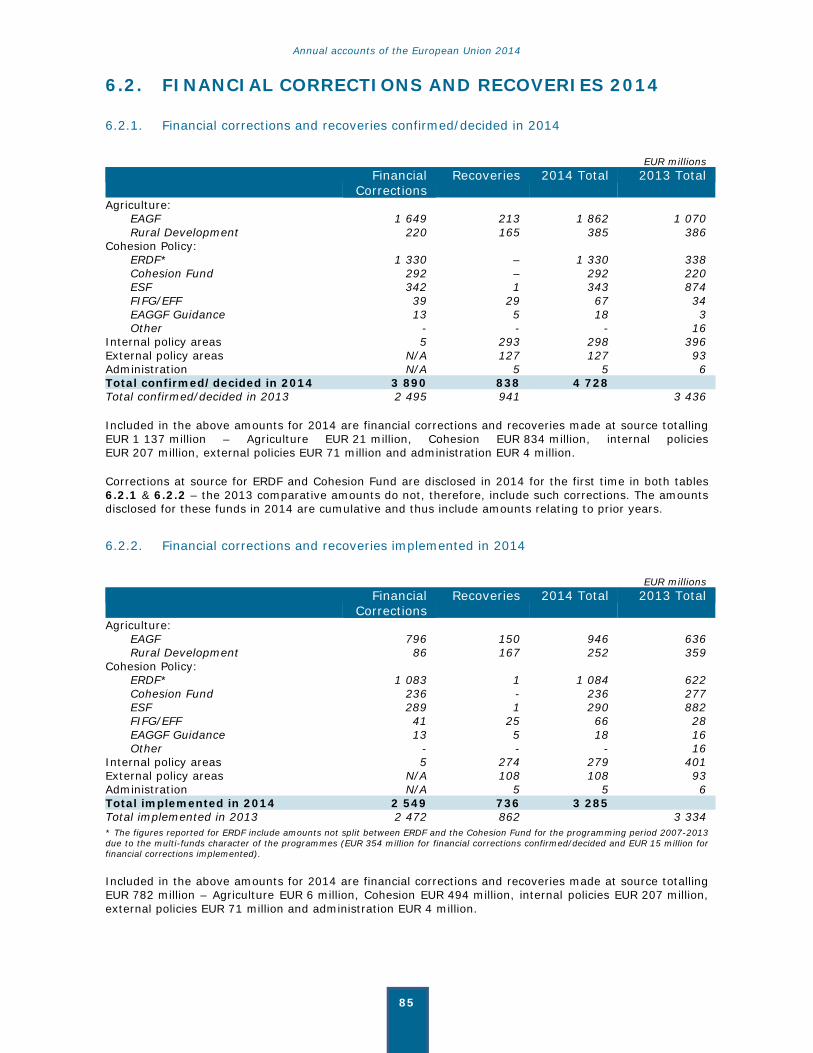
Annual accounts of the European Union 2014
85
6.2. FINANCIAL CORRECTIONS AND RECOVERIES 2014
6.2.1. Financial corrections and recoveries confirmed/decided in 2014
EUR millions Financial
Corrections Recoveries 2014 Total 2013 Total
Agriculture: EAGF 1 649 213 1 862 1 070 Rural Development 220 165 385 386
Cohesion Policy: ERDF* 1 330 – 1 330 338 Cohesion Fund 292 – 292 220 ESF 342 1 343 874 FIFG/EFF 39 29 67 34 EAGGF Guidance 13 5 18 3 Other - - - 16
Internal policy areas 5 293 298 396 External policy areas N/A 127 127 93 Administration N/A 5 5 6 Total confirmed/decided in 2014 3 890 838 4 728 Total confirmed/decided in 2013 2 495 941 3 436
Included in the above amounts for 2014 are financial corrections and recoveries made at source totalling EUR 1 137 million – Agriculture EUR 21 million, Cohesion EUR 834 million, internal policies EUR 207 million, external policies EUR 71 million and administration EUR 4 million.
Corrections at source for ERDF and Cohesion Fund are disclosed in 2014 for the first time in both tables 6.2.1 & 6.2.2 – the 2013 comparative amounts do not, therefore, include such corrections. The amounts disclosed for these funds in 2014 are cumulative and thus include amounts relating to prior years.
6.2.2. Financial corrections and recoveries implemented in 2014
EUR millions Financial
Corrections Recoveries 2014 Total 2013 Total
Agriculture: EAGF 796 150 946 636 Rural Development 86 167 252 359
Cohesion Policy: ERDF* 1 083 1 1 084 622 Cohesion Fund 236 - 236 277 ESF 289 1 290 882 FIFG/EFF 41 25 66 28 EAGGF Guidance 13 5 18 16 Other - - - 16
Internal policy areas 5 274 279 401 External policy areas N/A 108 108 93 Administration N/A 5 5 6 Total implemented in 2014 2 549 736 3 285 Total implemented in 2013 2 472 862 3 334 * The figures reported for ERDF include amounts not split between ERDF and the Cohesion Fund for the programming period 2007-2013 due to the multi-funds character of the programmes (EUR 354 million for financial corrections confirmed/decided and EUR 15 million for financial corrections implemented).
Included in the above amounts for 2014 are financial corrections and recoveries made at source totalling EUR 782 million – Agriculture EUR 6 million, Cohesion EUR 494 million, internal policies EUR 207 million, external policies EUR 71 million and administration EUR 4 million.
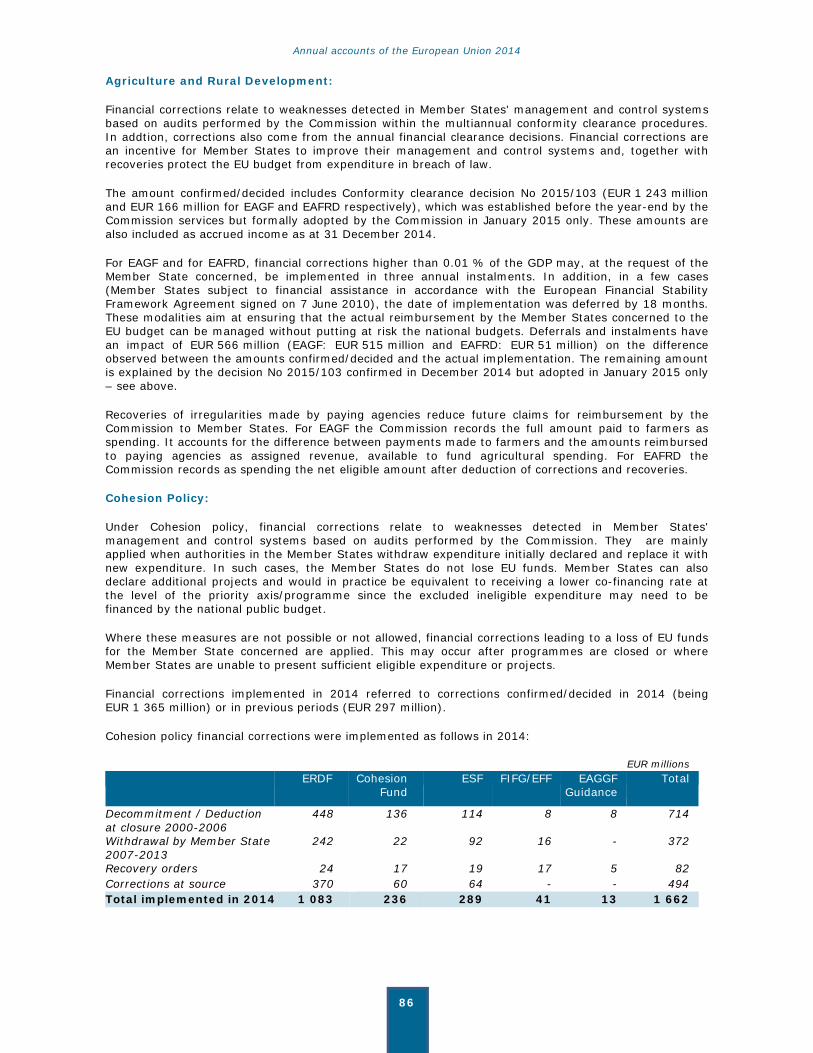
Annual accounts of the European Union 2014
86
Agriculture and Rural Development:
Financial corrections relate to weaknesses detected in Member States' management and control systems based on audits performed by the Commission within the multiannual conformity clearance procedures. In addtion, corrections also come from the annual financial clearance decisions. Financial corrections are an incentive for Member States to improve their management and control systems and, together with recoveries protect the EU budget from expenditure in breach of law.
The amount confirmed/decided includes Conformity clearance decision No 2015/103 (EUR 1 243 million and EUR 166 million for EAGF and EAFRD respectively), which was established before the year-end by the Commission services but formally adopted by the Commission in January 2015 only. These amounts are also included as accrued income as at 31 December 2014.
For EAGF and for EAFRD, financial corrections higher than 0.01 % of the GDP may, at the request of the Member State concerned, be implemented in three annual instalments. In addition, in a few cases (Member States subject to financial assistance in accordance with the European Financial Stability Framework Agreement signed on 7 June 2010), the date of implementation was deferred by 18 months. These modalities aim at ensuring that the actual reimbursement by the Member States concerned to the EU budget can be managed without putting at risk the national budgets. Deferrals and instalments have an impact of EUR 566 million (EAGF: EUR 515 million and EAFRD: EUR 51 million) on the difference observed between the amounts confirmed/decided and the actual implementation. The remaining amount is explained by the decision No 2015/103 confirmed in December 2014 but adopted in January 2015 only – see above.
Recoveries of irregularities made by paying agencies reduce future claims for reimbursement by the Commission to Member States. For EAGF the Commission records the full amount paid to farmers as spending. It accounts for the difference between payments made to farmers and the amounts reimbursed to paying agencies as assigned revenue, available to fund agricultural spending. For EAFRD the Commission records as spending the net eligible amount after deduction of corrections and recoveries.
Cohesion Policy:
Under Cohesion policy, financial corrections relate to weaknesses detected in Member States' management and control systems based on audits performed by the Commission. They are mainly applied when authorities in the Member States withdraw expenditure initially declared and replace it with new expenditure. In such cases, the Member States do not lose EU funds. Member States can also declare additional projects and would in practice be equivalent to receiving a lower co-financing rate at the level of the priority axis/programme since the excluded ineligible expenditure may need to be financed by the national public budget.
Where these measures are not possible or not allowed, financial corrections leading to a loss of EU funds for the Member State concerned are applied. This may occur after programmes are closed or where Member States are unable to present sufficient eligible expenditure or projects.
Financial corrections implemented in 2014 referred to corrections confirmed/decided in 2014 (being EUR 1 365 million) or in previous periods (EUR 297 million).
Cohesion policy financial corrections were implemented as follows in 2014:
EUR millions ERDF Cohesion
Fund ESF FIFG/EFF EAGGF
Guidance Total
Decommitment / Deduction at closure 2000-2006
448 136 114 8 8 714
Withdrawal by Member State 2007-2013
242 22 92 16 - 372
Recovery orders 24 17 19 17 5 82 Corrections at source 370 60 64 - - 494 Total implemented in 2014 1 083 236 289 41 13 1 662
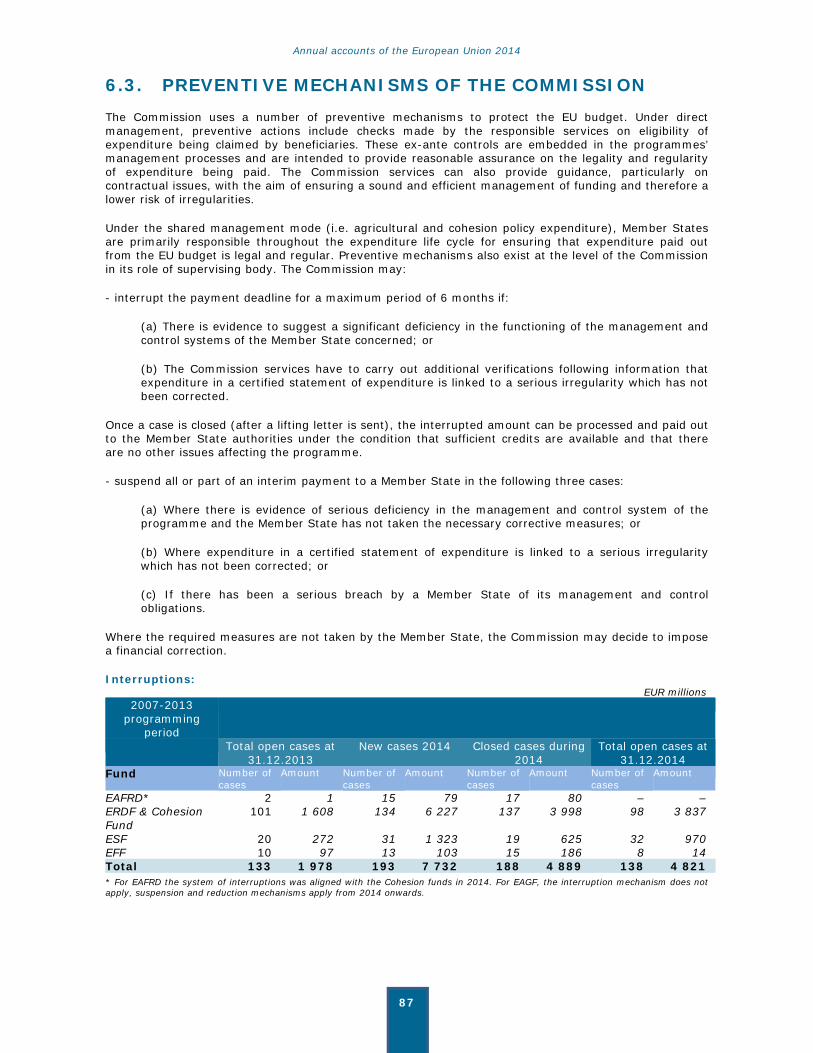
Annual accounts of the European Union 2014
87
6.3. PREVENTIVE MECHANISMS OF THE COMMISSION The Commission uses a number of preventive mechanisms to protect the EU budget. Under direct management, preventive actions include checks made by the responsible services on eligibility of expenditure being claimed by beneficiaries. These ex-ante controls are embedded in the programmes’ management processes and are intended to provide reasonable assurance on the legality and regularity of expenditure being paid. The Commission services can also provide guidance, particularly on contractual issues, with the aim of ensuring a sound and efficient management of funding and therefore a lower risk of irregularities.
Under the shared management mode (i.e. agricultural and cohesion policy expenditure), Member States are primarily responsible throughout the expenditure life cycle for ensuring that expenditure paid out from the EU budget is legal and regular. Preventive mechanisms also exist at the level of the Commission in its role of supervising body. The Commission may:
- interrupt the payment deadline for a maximum period of 6 months if:
(a) There is evidence to suggest a significant deficiency in the functioning of the management and control systems of the Member State concerned; or
(b) The Commission services have to carry out additional verifications following information that expenditure in a certified statement of expenditure is linked to a serious irregularity which has not been corrected.
Once a case is closed (after a lifting letter is sent), the interrupted amount can be processed and paid out to the Member State authorities under the condition that sufficient credits are available and that there are no other issues affecting the programme.
- suspend all or part of an interim payment to a Member State in the following three cases:
(a) Where there is evidence of serious deficiency in the management and control system of the programme and the Member State has not taken the necessary corrective measures; or
(b) Where expenditure in a certified statement of expenditure is linked to a serious irregularity which has not been corrected; or
(c) If there has been a serious breach by a Member State of its management and control obligations.
Where the required measures are not taken by the Member State, the Commission may decide to impose a financial correction.
Interruptions: EUR millions
2007-2013 programming
period
Total open cases at 31.12.2013
New cases 2014 Closed cases during 2014
Total open cases at 31.12.2014
Fund Number of cases
Amount Number of cases
Amount Number of cases
Amount Number of cases
Amount
EAFRD* 2 1 15 79 17 80 – – ERDF & Cohesion Fund
101 1 608 134 6 227 137 3 998 98 3 837
ESF 20 272 31 1 323 19 625 32 970 EFF 10 97 13 103 15 186 8 14 Total 133 1 978 193 7 732 188 4 889 138 4 821 * For EAFRD the system of interruptions was aligned with the Cohesion funds in 2014. For EAGF, the interruption mechanism does not apply, suspension and reduction mechanisms apply from 2014 onwards.

Annual accounts of the European Union 2014
88
Suspensions and reductions:
Concerning ERDF and the Cohesion Fund, five suspension decisions were still in force at the end of 2013 (the decision for lifting one was taken in 2013 but officially notified in 2014). Decisions to lift the suspensions for two programmes were taken during 2014. The other three suspension decisions remained in force at the end of 2014. Four new suspension decisions were adopted in 2014. Two were still in force at year-end.
Concerning ESF, one suspension decision adopted in 2011 was still in force at end of 2014. Out of the eleven suspension decisions adopted in 2013, seven remained in force at the end of 2014. During 2014, eleven new suspension decisions were adopted and were still effective at end 2014.
One suspension decision was taken in 2014 for EFF following a deficiency identified in the management and control system of a Member State related to the EU measure to reduce fishing overcapacity.
There were no suspension decisions taken in 2014 for EAFRD. For EAGF, there was one reduction made in 2014 while there were 3 reduction decisions adopted for EAFRD. At year-end there were 5 EAFRD reduction cases ongoing.
6.4. RECOVERY OF UNUSED PRE-FINANCING AMOUNTS
EUR millions
2014 2013Agriculture:
EAGF – – Rural Development – –
Cohesion Policy: ERDF – 68 Cohesion Fund – 4 ESF 9 53 FIFG/EFF 10 7 EAGGF Guidance 6 3
Internal policy areas 278 208 External policy areas 95 91 Administration 2 1 Total recovered 400 435
Recoveries of unused pre-financing amounts should not be confused with irregular expenditure recovered. Where the Commission services identify and recover such expenditure in relation to pre-financing amounts paid out, these are included in the normal financial correction or recovery processes described above. For more details on prefinancing, see also note 2.5.

Annual accounts of the European Union 2014
89
7. FINANCIAL RISK MANAGEMENT The following disclosures with regard to the financial risk management of the EU relate to:
- Lending and borrowing activities carried out by the Commission through: EFSM, BOP, MFA, and Euratom actions and the ECSC in Liquidation;
- The treasury operations carried out by the Commission in order to implement the EU budget, including the receipt of fines;
- The Guarantee Fund for external actions; and
- Financial instruments financed by the budget.
7.1. TYPES OF RISK
Market risk is the risk that the fair value or future cashflows of a financial instrument will fluctuate, because of variations in market prices. Market risk embodies not only the potential for loss, but also the potential for gain. It comprises currency risk, interest rate risk and other price risk (the EU has no significant other price risk).
(1) Currency risk is the risk that the EU's operations or its investments' value will be affected by changes in exchange rates. This risk arises from the change in price of one currency against another.
(2) Interest rate risk is the possibility of a reduction in the value of a security, especially a bond, resulting from an increase in interest rates. In general, higher interest rates will lead to lower prices of fixed rate bonds, and vice versa.
Credit risk is the risk of loss due to a debtor's/borrower's non-payment of a loan or other line of credit (either the principal or interest or both) or other failure to meet a contractual obligation. The default events include a delay in repayments, restructuring of borrower repayments and bankruptcy.
Liquidity risk is the risk that arises from the difficulty of selling an asset; for example, the risk that a given security or asset cannot be traded quickly enough in the market to prevent a loss or meet an obligation.
7.2. RISK MANAGEMENT POLICIES
The implementation of the EU budget relies increasingly on the use of of financial instruments. The basic concept behind this new approach, in contrast to the traditional method of budget implementation by giving grants and subsidies, is that for each euro spent from the budget via financial instruments, the final beneficiary receives more than EUR 1 as financial support due to the leverage effect. This intelligent use of the EU budget maximises the impact of the funds available. For more information on the amounts concerned, see note 2.4.
Common to most financial instruments is the fact that the implementation is delegated to either the EIB group (including EIF) based on an agreement between the EC and the EIB or to other financial intermediaries. Agreements signed with these intermediaries include strict conditions and obligations on the intermediaries so as ensure that EU monies are properly managed and properly reported on. Once a financial contribution to one of the instruments has been committed, the funds are transferred to a specifically created bank account of the financial intermediary (i.e. a fiduciary account). The financial intermediary may, depending on the instrument in question, use the funds on this fiduciary account to provide loans, issue debt instruments, etc. Proceeds from financial instruments have to, as a general rule, be reimbursed to the EU budget.
The risk as regards these financial instruments is usually limited to a ceiling as indicated in the underlying agreements which is the budgeted amount foreseen for the instrument. As the Commission often bears the "first loss piece" and since instruments are intended to finance riskier beneficiaries (who have difficulties in obtaining funding from commercial lenders), it is therefore likely that at least some losses to the EU budget will occur.

Annual accounts of the European Union 2014
90
Borrowing & Lending activities
The lending and borrowing transactions, as well as related treasury management, are carried out by the EU according to the respective Council Decisions, if applicable, and internal guidelines. Written procedure manuals covering specific areas such as borrowings, loans and treasury management have been developed and are used by the relevant operating units. As a general rule, there are no activities to compensate interest rate variations or foreign currency variations ("hedging" activities) carried-out as lending operations are generally financed by "back-to-back" borrowings, which thus do not generate open interest rate or currency positions. The application of the "back-to-back" character is checked regularly.
Treasury
The rules and principles for the management of the Commission's treasury operations are laid down in the Council Regulation 1150/2000 (amended by Council Regulations 2028/2004 and 105/2009) and in the Financial Regulation and its rules of application.
As a result of the above regulations, the following main principles apply:
- Own resources are paid by the Member States into accounts opened for this purpose in the name of the Commission with the Treasury or the body appointed by each Member State. The Commission may draw on the above accounts solely to cover its cash requirements.
- Own Resources are paid by Member States in their own national currencies, while the Commission's payments are mostly denominated in EUR.
- Bank accounts opened in the name of the Commission may not be overdrawn. This restriction does not apply to the Commission's own resource accounts in case of a default on loans contracted or guaranteed pursuant to EU Council regulations and decision and under certain conditions in case the cash resource requirements are in excess of the assets of the accounts.
- Funds held in bank accounts denominated in currencies other than EUR are either used for payments in the same currencies or periodically converted in EUR.
In addition to the own resources accounts, other bank accounts are opened by the Commission, with central banks and commercial banks, for the purpose of executing payments and receiving receipts other than the Member State contributions to the budget.
Treasury and payment operations are highly automated and rely on modern information systems. Specific procedures are applied to guarantee system security and to ensure segregation of duties in line with the Financial Regulation, the Commission’s internal control standards, and audit principles.
A written set of guidelines and procedures regulates the management of the Commission's treasury and payment operations with the objective of limiting operational and financial risk and ensuring an adequate level of control. They cover the different areas of operation (for example: payment execution and cash management, cashflow forecasting, business continuity, etc.), and compliance with the guidelines and procedures is checked regularly. Additionally, information is exchanged between Directorate General for the Budget and Directorate-General for Economic and Financial Affairs on risk management and best exposures.
Fines
Provisionally cashed fines: deposits
Amounts received before 2010 remain in bank accounts with banks specifically selected for the deposit of provisionally cashed fines. The selection of banks is conducted in compliance with tender procedures defined by the Financial Regulation. Placement of funds with specific banks is determined by the internal risk management policy defining the credit rating requirements and the amount of funds which could be placed in proportion to the counterparty equity. Financial and operational risks are identified and evaluated and compliance with internal policies and procedures is checked regularly.
Provisionally cashed fines: BUFI portfolio
Fines imposed and provisionally cashed from 2010 onwards are invested in a specifically created fund, BUFI. The main objectives of the Fund are the reduction of risks associated with financial markets and the equal treatment of all fined entities by offering a guaranteed return calculated on the same basis. The
Annual accounts of the European Union 2014
91
asset management for provisionally cashed fines is carried out by the Commission in accordance with internal asset management guidelines. Procedural manuals covering specific areas such as treasury management have been developed and are used by the relevant operating units. Financial and operational risks are identified and evaluated and compliance with internal guidelines and procedures is checked regularly.
The objectives of the asset management activities are to invest the fines provisionally paid to the Commission in such a way as to:
a) ensure that the funds are easily available when needed, while
b) aiming at delivering, under normal circumstances, a return which on average is at least equal to the return of the BUFI Benchmark minus costs incurred.
Investments are restricted essentially to the following categories: term deposits with Euro-area Central Banks, Euro-area sovereign debt agencies, fully state-owned or state-guaranteed banks or supranational institutions, and bonds, bills and Certificates of Deposit issued by either sovereign or supranational institutions.
Bank guarantees
Significant amounts of guarantees issued by financial institutions are held by the Commission in relation to the fines it imposes on companies breaching EU competition rules (see note 2.6.1.2). These guarantees are provided by fined companies as an alternative to making provisional payments. The guarantees are managed in compliance with the internal risk management policy. Financial and operational risks are identified and evaluated and compliance with internal policies and procedures is checked regularly.
Guarantee Fund
The rules and principles for the asset management of the Guarantee Fund are laid out in the Convention between the Commission and the EIB dated 25 November 1994 and the subsequent amendments dated 17/23 September 1996, 8 May 2002, 25 February 2008 and 9 November 2010. The Guarantee Fund operates only in euros. It exclusively invests in this currency in order to avoid any foreign currency risk. Management of the assets is based upon the traditional rules of prudence adhered to for financial activities. It is required to pay particular attention to reducing the risks and to ensuring that the managed assets can be sold or transferred without significant delay, taking into account the commitments covered.
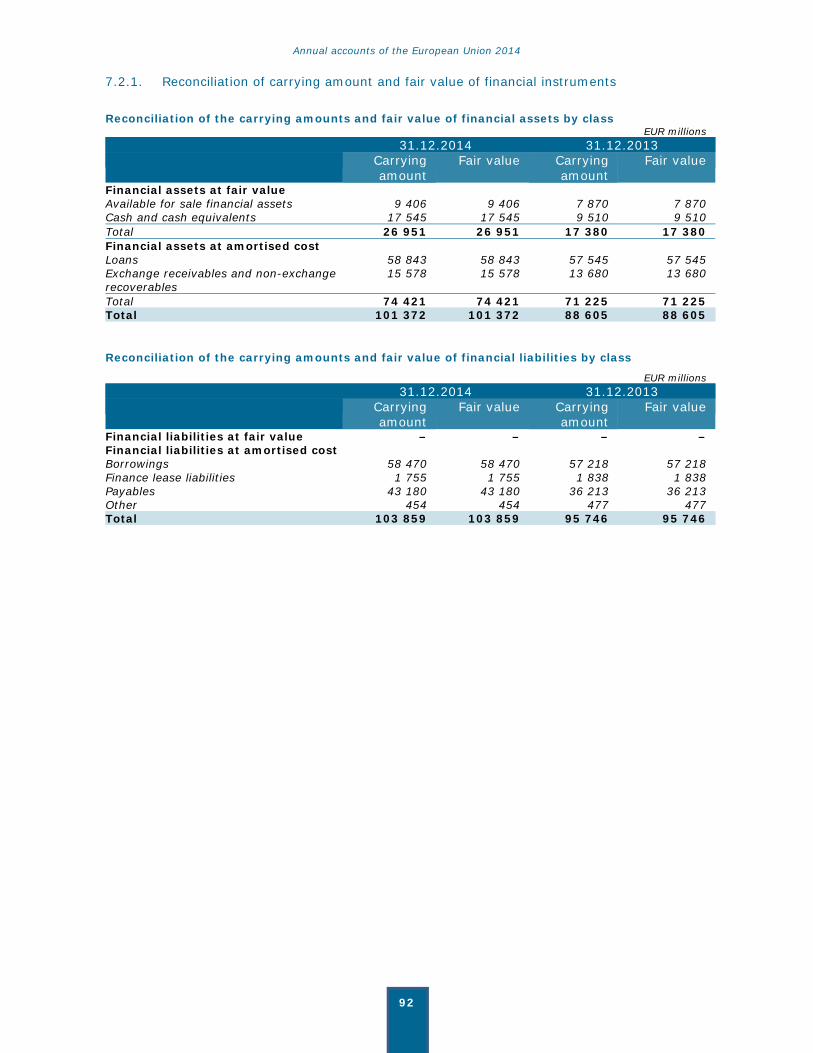
Annual accounts of the European Union 2014
92
7.2.1. Reconciliation of carrying amount and fair value of financial instruments
Reconciliation of the carrying amounts and fair value of financial assets by class EUR millions 31.12.2014 31.12.2013 Carrying
amount Fair value Carrying
amount Fair value
Financial assets at fair value Available for sale financial assets 9 406 9 406 7 870 7 870 Cash and cash equivalents 17 545 17 545 9 510 9 510 Total 26 951 26 951 17 380 17 380 Financial assets at amortised cost Loans 58 843 58 843 57 545 57 545 Exchange receivables and non-exchange recoverables
15 578 15 578 13 680 13 680
Total 74 421 74 421 71 225 71 225 Total 101 372 101 372 88 605 88 605
Reconciliation of the carrying amounts and fair value of financial liabilities by class
EUR millions 31.12.2014 31.12.2013 Carrying
amount Fair value Carrying
amount Fair value
Financial liabilities at fair value – – – – Financial liabilities at amortised cost Borrowings 58 470 58 470 57 218 57 218 Finance lease liabilities 1 755 1 755 1 838 1 838 Payables 43 180 43 180 36 213 36 213 Other 454 454 477 477 Total 103 859 103 859 95 746 95 746
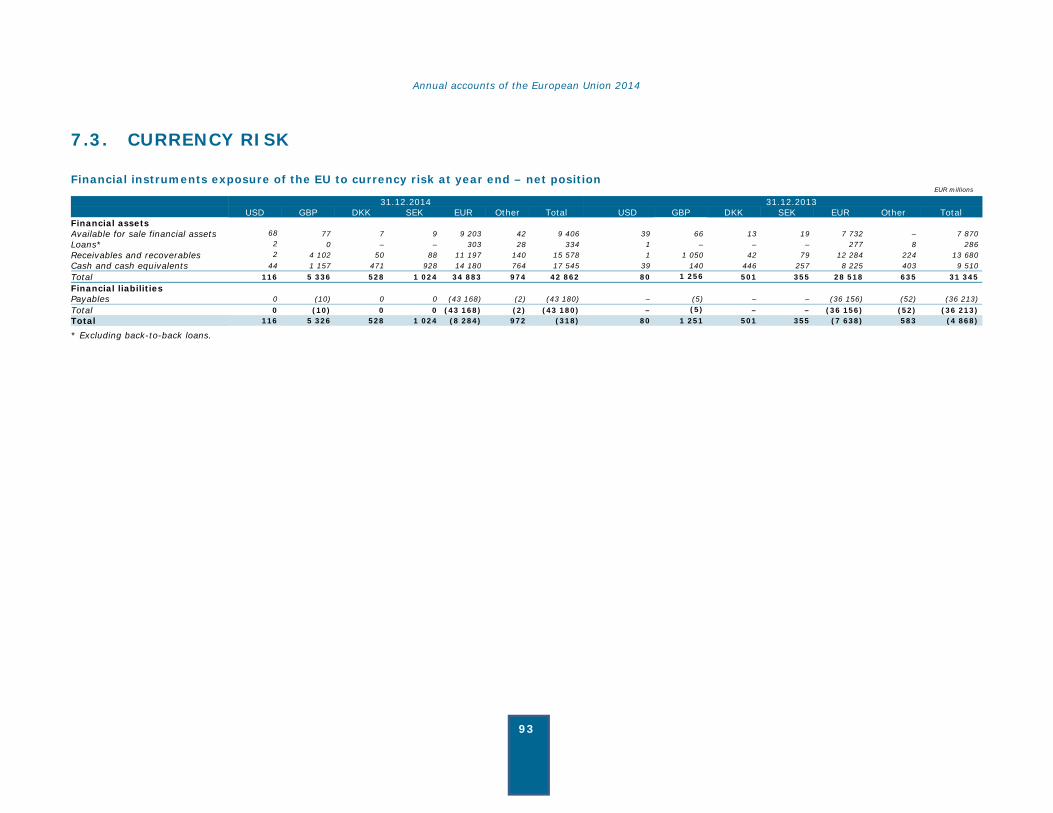
Annual accounts of the European Union 2014
93
7.3. CURRENCY RISK
Financial instruments exposure of the EU to currency risk at year end – net position EUR millions
31.12.2014 31.12.2013 USD GBP DKK SEK EUR Other Total USD GBP DKK SEK EUR Other Total
Financial assets Available for sale financial assets 68 77 7 9 9 203 42 9 406 39 66 13 19 7 732 – 7 870Loans* 2 0 – – 303 28 334 1 – – – 277 8 286Receivables and recoverables 2 4 102 50 88 11 197 140 15 578 1 1 050 42 79 12 284 224 13 680Cash and cash equivalents 44 1 157 471 928 14 180 764 17 545 39 140 446 257 8 225 403 9 510Total 116 5 336 528 1 024 34 883 974 42 862 80 1 256 501 355 28 518 635 31 345Financial liabilities Payables 0 (10) 0 0 (43 168) (2) (43 180) – (5) – – (36 156) (52) (36 213)Total 0 (10) 0 0 (43 168) (2) (43 180) – (5) – – (36 156) (52) (36 213)Total 116 5 326 528 1 024 (8 284) 972 (318) 80 1 251 501 355 (7 638) 583 (4 868)
* Excluding back-to-back loans.
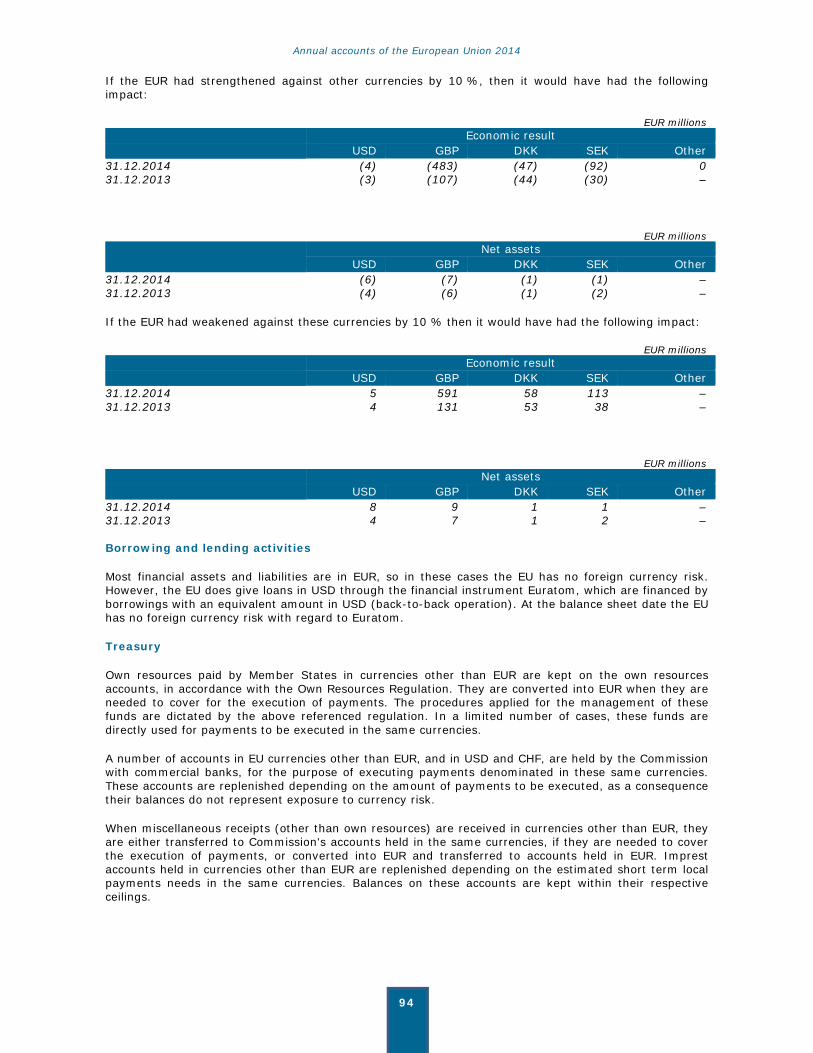
Annual accounts of the European Union 2014
94
If the EUR had strengthened against other currencies by 10 %, then it would have had the following impact:
EUR millions Economic result USD GBP DKK SEK Other 31.12.2014 (4) (483) (47) (92) 0 31.12.2013 (3) (107) (44) (30) –
EUR millions Net assets USD GBP DKK SEK Other 31.12.2014 (6) (7) (1) (1) – 31.12.2013 (4) (6) (1) (2) –
If the EUR had weakened against these currencies by 10 % then it would have had the following impact:
EUR millions Economic result USD GBP DKK SEK Other 31.12.2014 5 591 58 113 – 31.12.2013 4 131 53 38 –
EUR millions Net assets USD GBP DKK SEK Other 31.12.2014 8 9 1 1 – 31.12.2013 4 7 1 2 – Borrowing and lending activities
Most financial assets and liabilities are in EUR, so in these cases the EU has no foreign currency risk. However, the EU does give loans in USD through the financial instrument Euratom, which are financed by borrowings with an equivalent amount in USD (back-to-back operation). At the balance sheet date the EU has no foreign currency risk with regard to Euratom.
Treasury
Own resources paid by Member States in currencies other than EUR are kept on the own resources accounts, in accordance with the Own Resources Regulation. They are converted into EUR when they are needed to cover for the execution of payments. The procedures applied for the management of these funds are dictated by the above referenced regulation. In a limited number of cases, these funds are directly used for payments to be executed in the same currencies.
A number of accounts in EU currencies other than EUR, and in USD and CHF, are held by the Commission with commercial banks, for the purpose of executing payments denominated in these same currencies. These accounts are replenished depending on the amount of payments to be executed, as a consequence their balances do not represent exposure to currency risk.
When miscellaneous receipts (other than own resources) are received in currencies other than EUR, they are either transferred to Commission's accounts held in the same currencies, if they are needed to cover the execution of payments, or converted into EUR and transferred to accounts held in EUR. Imprest accounts held in currencies other than EUR are replenished depending on the estimated short term local payments needs in the same currencies. Balances on these accounts are kept within their respective ceilings.
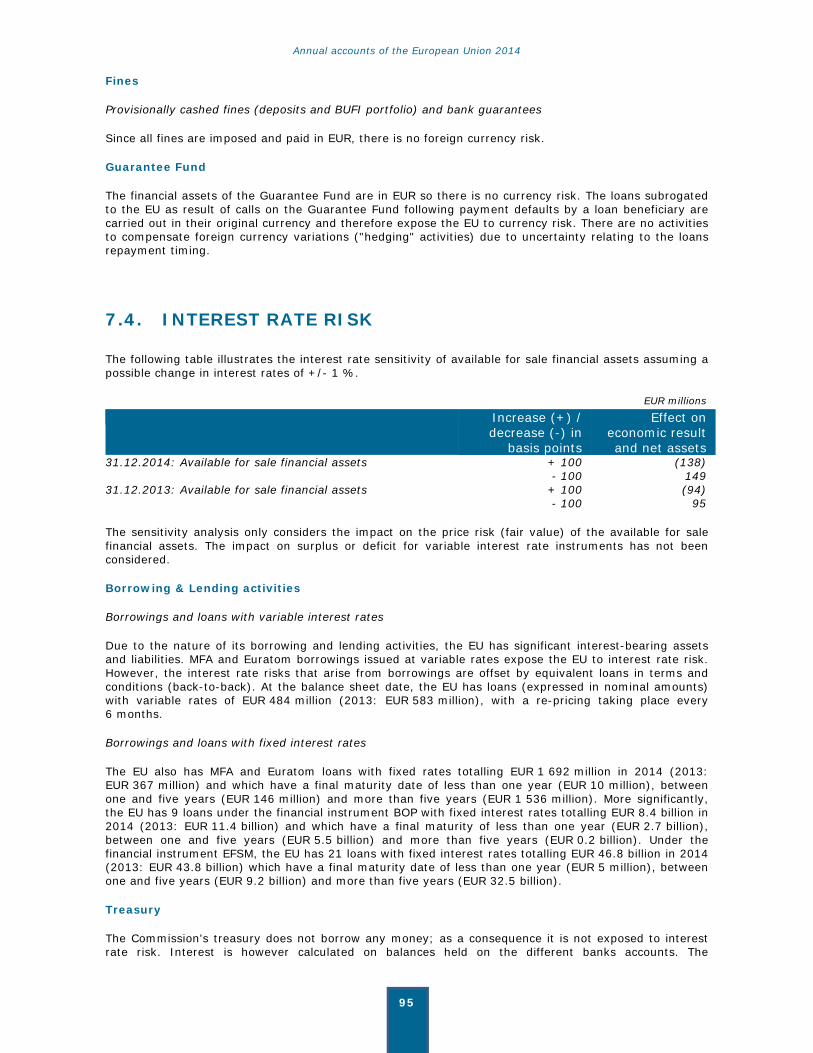
Annual accounts of the European Union 2014
95
Fines
Provisionally cashed fines (deposits and BUFI portfolio) and bank guarantees
Since all fines are imposed and paid in EUR, there is no foreign currency risk.
Guarantee Fund
The financial assets of the Guarantee Fund are in EUR so there is no currency risk. The loans subrogated to the EU as result of calls on the Guarantee Fund following payment defaults by a loan beneficiary are carried out in their original currency and therefore expose the EU to currency risk. There are no activities to compensate foreign currency variations ("hedging" activities) due to uncertainty relating to the loans repayment timing.
7.4. INTEREST RATE RISK
The following table illustrates the interest rate sensitivity of available for sale financial assets assuming a possible change in interest rates of +/- 1 %.
EUR millions
Increase (+) / decrease (-) in
basis points
Effect oneconomic result and net assets
31.12.2014: Available for sale financial assets + 100 (138) - 100 149 31.12.2013: Available for sale financial assets + 100 (94) - 100 95
The sensitivity analysis only considers the impact on the price risk (fair value) of the available for sale financial assets. The impact on surplus or deficit for variable interest rate instruments has not been considered.
Borrowing & Lending activities
Borrowings and loans with variable interest rates
Due to the nature of its borrowing and lending activities, the EU has significant interest-bearing assets and liabilities. MFA and Euratom borrowings issued at variable rates expose the EU to interest rate risk. However, the interest rate risks that arise from borrowings are offset by equivalent loans in terms and conditions (back-to-back). At the balance sheet date, the EU has loans (expressed in nominal amounts) with variable rates of EUR 484 million (2013: EUR 583 million), with a re-pricing taking place every 6 months.
Borrowings and loans with fixed interest rates
The EU also has MFA and Euratom loans with fixed rates totalling EUR 1 692 million in 2014 (2013: EUR 367 million) and which have a final maturity date of less than one year (EUR 10 million), between one and five years (EUR 146 million) and more than five years (EUR 1 536 million). More significantly, the EU has 9 loans under the financial instrument BOP with fixed interest rates totalling EUR 8.4 billion in 2014 (2013: EUR 11.4 billion) and which have a final maturity of less than one year (EUR 2.7 billion), between one and five years (EUR 5.5 billion) and more than five years (EUR 0.2 billion). Under the financial instrument EFSM, the EU has 21 loans with fixed interest rates totalling EUR 46.8 billion in 2014 (2013: EUR 43.8 billion) which have a final maturity date of less than one year (EUR 5 million), between one and five years (EUR 9.2 billion) and more than five years (EUR 32.5 billion).
Treasury
The Commission's treasury does not borrow any money; as a consequence it is not exposed to interest rate risk. Interest is however calculated on balances held on the different banks accounts. The
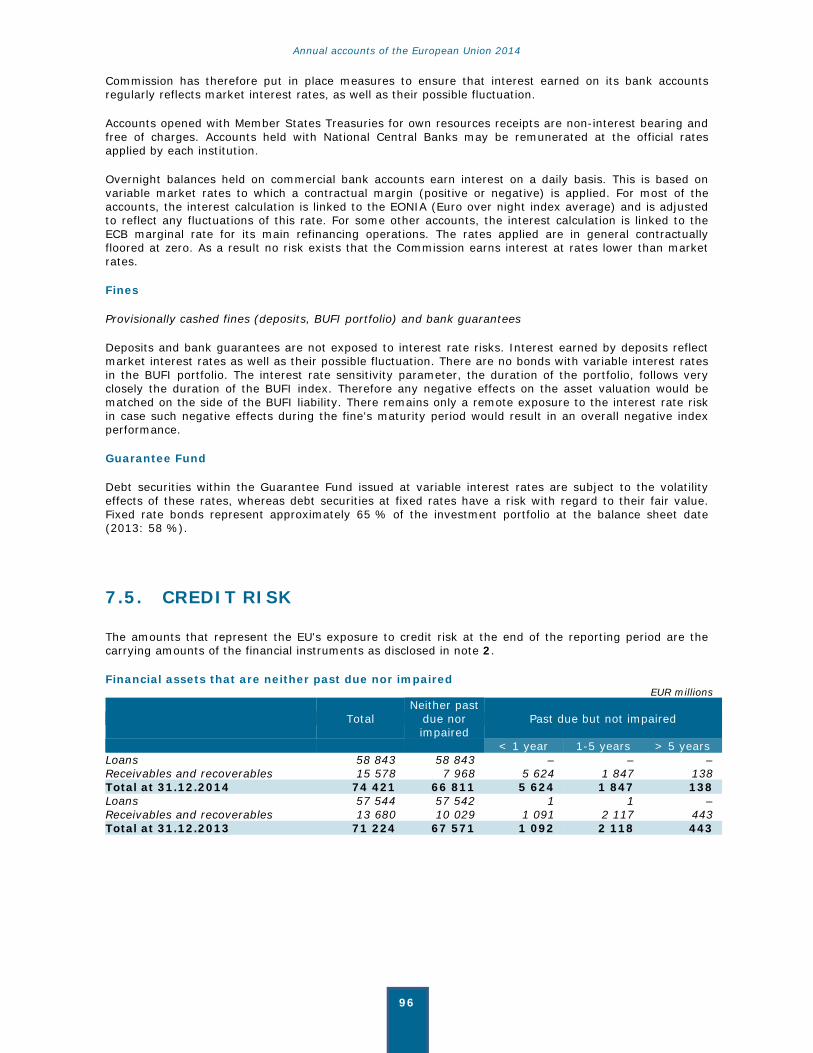
Annual accounts of the European Union 2014
96
Commission has therefore put in place measures to ensure that interest earned on its bank accounts regularly reflects market interest rates, as well as their possible fluctuation.
Accounts opened with Member States Treasuries for own resources receipts are non-interest bearing and free of charges. Accounts held with National Central Banks may be remunerated at the official rates applied by each institution.
Overnight balances held on commercial bank accounts earn interest on a daily basis. This is based on variable market rates to which a contractual margin (positive or negative) is applied. For most of the accounts, the interest calculation is linked to the EONIA (Euro over night index average) and is adjusted to reflect any fluctuations of this rate. For some other accounts, the interest calculation is linked to the ECB marginal rate for its main refinancing operations. The rates applied are in general contractually floored at zero. As a result no risk exists that the Commission earns interest at rates lower than market rates.
Fines
Provisionally cashed fines (deposits, BUFI portfolio) and bank guarantees
Deposits and bank guarantees are not exposed to interest rate risks. Interest earned by deposits reflect market interest rates as well as their possible fluctuation. There are no bonds with variable interest rates in the BUFI portfolio. The interest rate sensitivity parameter, the duration of the portfolio, follows very closely the duration of the BUFI index. Therefore any negative effects on the asset valuation would be matched on the side of the BUFI liability. There remains only a remote exposure to the interest rate risk in case such negative effects during the fine's maturity period would result in an overall negative index performance.
Guarantee Fund
Debt securities within the Guarantee Fund issued at variable interest rates are subject to the volatility effects of these rates, whereas debt securities at fixed rates have a risk with regard to their fair value. Fixed rate bonds represent approximately 65 % of the investment portfolio at the balance sheet date (2013: 58 %).
7.5. CREDIT RISK
The amounts that represent the EU's exposure to credit risk at the end of the reporting period are the carrying amounts of the financial instruments as disclosed in note 2.
Financial assets that are neither past due nor impaired EUR millions
Total Neither past
due nor impaired
Past due but not impaired
< 1 year 1-5 years > 5 years Loans 58 843 58 843 – – – Receivables and recoverables 15 578 7 968 5 624 1 847 138 Total at 31.12.2014 74 421 66 811 5 624 1 847 138 Loans 57 544 57 542 1 1 – Receivables and recoverables 13 680 10 029 1 091 2 117 443 Total at 31.12.2013 71 224 67 571 1 092 2 118 443
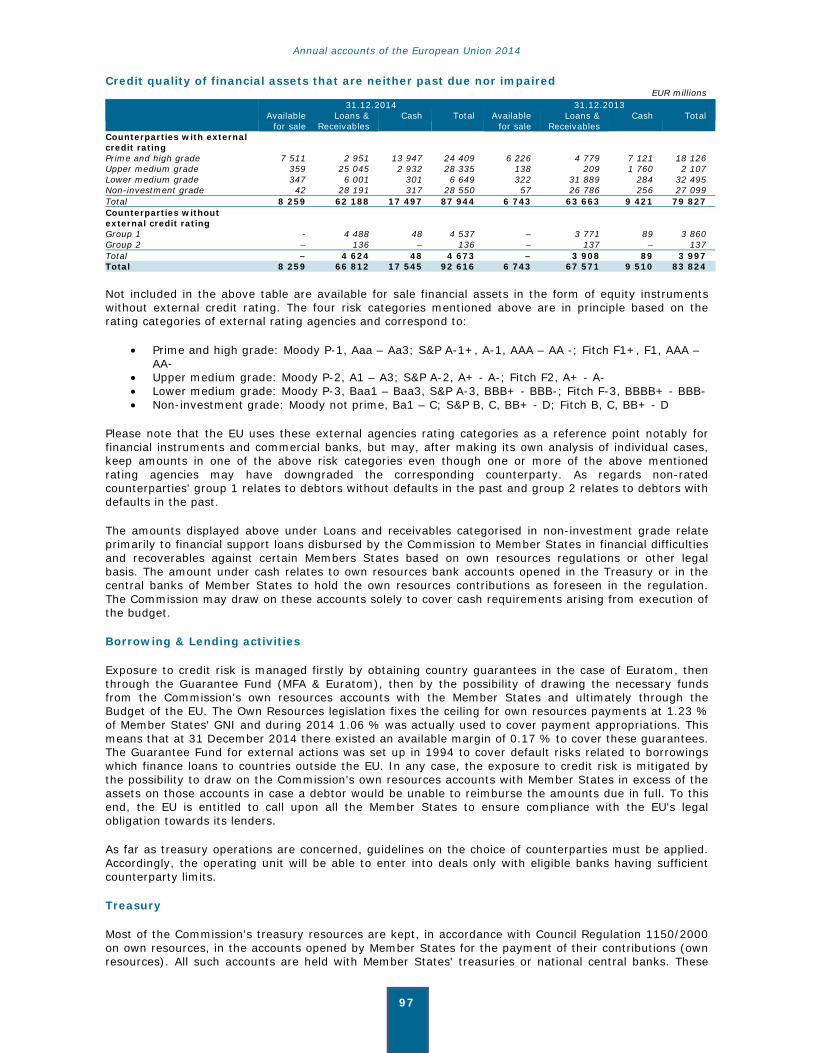
Annual accounts of the European Union 2014
97
Credit quality of financial assets that are neither past due nor impaired EUR millions
31.12.2014 31.12.2013 Available
for sale Loans &
Receivables Cash Total Available
for sale Loans &
Receivables Cash Total
Counterparties with external credit rating
Prime and high grade 7 511 2 951 13 947 24 409 6 226 4 779 7 121 18 126 Upper medium grade 359 25 045 2 932 28 335 138 209 1 760 2 107 Lower medium grade 347 6 001 301 6 649 322 31 889 284 32 495 Non-investment grade 42 28 191 317 28 550 57 26 786 256 27 099 Total 8 259 62 188 17 497 87 944 6 743 63 663 9 421 79 827Counterparties without external credit rating
Group 1 - 4 488 48 4 537 – 3 771 89 3 860 Group 2 – 136 – 136 – 137 – 137 Total – 4 624 48 4 673 – 3 908 89 3 997 Total 8 259 66 812 17 545 92 616 6 743 67 571 9 510 83 824
Not included in the above table are available for sale financial assets in the form of equity instruments without external credit rating. The four risk categories mentioned above are in principle based on the rating categories of external rating agencies and correspond to:
• Prime and high grade: Moody P-1, Aaa – Aa3; S&P A-1+, A-1, AAA – AA -; Fitch F1+, F1, AAA – AA-
• Upper medium grade: Moody P-2, A1 – A3; S&P A-2, A+ - A-; Fitch F2, A+ - A- • Lower medium grade: Moody P-3, Baa1 – Baa3, S&P A-3, BBB+ - BBB-; Fitch F-3, BBBB+ - BBB- • Non-investment grade: Moody not prime, Ba1 – C; S&P B, C, BB+ - D; Fitch B, C, BB+ - D
Please note that the EU uses these external agencies rating categories as a reference point notably for financial instruments and commercial banks, but may, after making its own analysis of individual cases, keep amounts in one of the above risk categories even though one or more of the above mentioned rating agencies may have downgraded the corresponding counterparty. As regards non-rated counterparties' group 1 relates to debtors without defaults in the past and group 2 relates to debtors with defaults in the past.
The amounts displayed above under Loans and receivables categorised in non-investment grade relate primarily to financial support loans disbursed by the Commission to Member States in financial difficulties and recoverables against certain Members States based on own resources regulations or other legal basis. The amount under cash relates to own resources bank accounts opened in the Treasury or in the central banks of Member States to hold the own resources contributions as foreseen in the regulation. The Commission may draw on these accounts solely to cover cash requirements arising from execution of the budget.
Borrowing & Lending activities
Exposure to credit risk is managed firstly by obtaining country guarantees in the case of Euratom, then through the Guarantee Fund (MFA & Euratom), then by the possibility of drawing the necessary funds from the Commission's own resources accounts with the Member States and ultimately through the Budget of the EU. The Own Resources legislation fixes the ceiling for own resources payments at 1.23 % of Member States' GNI and during 2014 1.06 % was actually used to cover payment appropriations. This means that at 31 December 2014 there existed an available margin of 0.17 % to cover these guarantees. The Guarantee Fund for external actions was set up in 1994 to cover default risks related to borrowings which finance loans to countries outside the EU. In any case, the exposure to credit risk is mitigated by the possibility to draw on the Commission's own resources accounts with Member States in excess of the assets on those accounts in case a debtor would be unable to reimburse the amounts due in full. To this end, the EU is entitled to call upon all the Member States to ensure compliance with the EU's legal obligation towards its lenders.
As far as treasury operations are concerned, guidelines on the choice of counterparties must be applied. Accordingly, the operating unit will be able to enter into deals only with eligible banks having sufficient counterparty limits.
Treasury
Most of the Commission's treasury resources are kept, in accordance with Council Regulation 1150/2000 on own resources, in the accounts opened by Member States for the payment of their contributions (own resources). All such accounts are held with Member States' treasuries or national central banks. These
Annual accounts of the European Union 2014
98
institutions carry the lowest credit (or counterparty) risk for the Commission as the exposure is with its Member States. For the part of the Commission's treasury resources kept with commercial banks, in order to cover the execution of payments, replenishment of these accounts is made on a just-in-time basis and is automatically managed by the treasury cash management system. Minimum cash levels, proportional to the average amount of daily payments executed from it, are kept on each account. As a consequence the amounts kept overnight on these accounts remain constantly at low levels (overall between EUR 1 million and EUR 20 million on average, spread over more than 20 accounts) and so ensure the Commission's risk exposure is limited. These amounts should be viewed with regard to the daily overall treasury balances which fluctuated in 2014 between EUR 100 million and EUR 34 billion, and with an overall amount of payments executed in 2014 that equals EUR 142 billion.
In addition, specific guidelines are applied for the selection of commercial banks in order to further minimise counterparty risk to which the Commission is exposed:
- All commercial banks are selected by call for tenders. The minimum short term credit rating required for admission to the tendering procedures is Moody's P-1 or equivalent. A lower level may be accepted in specific and duly justified circumstances.
- The credit ratings of the commercial banks where the Commission has accounts are reviewed on a daily basis. Intensified monitoring measures and daily reviews of commercial banks' ratings were adopted in the context of the financial crisis, and kept in place during 2014.
- In delegations outside the EU, imprest accounts are held with local banks selected by a simplified tendering procedure. Rating requirements depend on the local situation and may significantly differ from one country to another. In order to limit risk exposure, balances on these accounts are kept at the lowest possible levels (taking into account operational needs), they are regularly replenished, and the applied ceilings are reviewed on a yearly basis.
Fines
Provisionally cashed fines: deposits
Banks holding deposits for the fines provisionally cashed before 2010 are selected by tender procedure in compliance with the risk management policy which defines the credit rating requirements and the amount of funds which could be placed in proportion to the counterparty equity.
For commercial banks that have been specifically selected for the deposit of provisionally cashed fines, a minimum long-term rating A (S&P or equivalent) and a minimum short term rating A-1 (S&P or equivalent) is required as a general rule. Specific measures are applied in case banks in this group are subject to downgrade. In addition, the amount deposited with each bank is limited to a certain percentage of its own funds, which varies depending on the rating level of each institution. The calculation of such limits also takes into account the amount of outstanding guarantees issued to the Commission by the same institution. The compliance of outstanding deposits with the applicable policy requirements is reviewed regularly.
Provisionally cashed fines: BUFI portfolio
For investments from provisionally cashed fines, the Commission takes on exposure to credit risk which is the risk that a counterparty will be unable to pay amounts in full when due. The highest concentration of exposure is towards France and Germany as these countries represents 43 % and 27 % respectively of the total nominal volume of the portfolio.
Bank guarantees
Significant amounts of guarantees issued by financial institutions are also held by the Commission in relation to the fines it imposes on companies breaching EU competition rules (see note 2.6.1.2). These guarantees are provided by fined companies as an alternative to making provisional payments. The risk management policy applied for the acceptance of such guarantees has been reviewed in 2012 and a new combination of credit rating requirements and limited percentages per counterpart (proportional to each counterpart's own funds) has been defined in the light of the current financial environment in the EU. It continues to ensure a high credit quality for the Commission. The compliance of the outstanding guarantees with the applicable policy requirements is reviewed regularly.
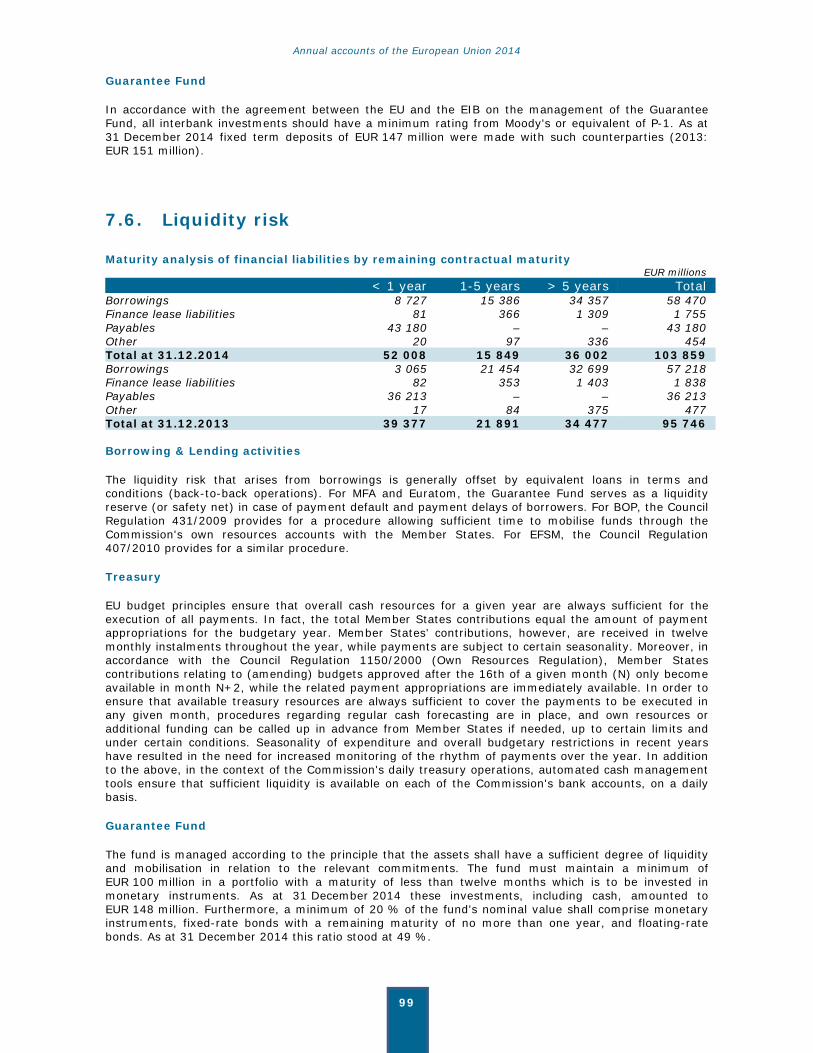
Annual accounts of the European Union 2014
99
Guarantee Fund
In accordance with the agreement between the EU and the EIB on the management of the Guarantee Fund, all interbank investments should have a minimum rating from Moody's or equivalent of P-1. As at 31 December 2014 fixed term deposits of EUR 147 million were made with such counterparties (2013: EUR 151 million).
7.6. Liquidity risk
Maturity analysis of financial liabilities by remaining contractual maturity EUR millions < 1 year 1-5 years > 5 years TotalBorrowings 8 727 15 386 34 357 58 470 Finance lease liabilities 81 366 1 309 1 755 Payables 43 180 – – 43 180 Other 20 97 336 454 Total at 31.12.2014 52 008 15 849 36 002 103 859 Borrowings 3 065 21 454 32 699 57 218 Finance lease liabilities 82 353 1 403 1 838 Payables 36 213 – – 36 213 Other 17 84 375 477 Total at 31.12.2013 39 377 21 891 34 477 95 746 Borrowing & Lending activities
The liquidity risk that arises from borrowings is generally offset by equivalent loans in terms and conditions (back-to-back operations). For MFA and Euratom, the Guarantee Fund serves as a liquidity reserve (or safety net) in case of payment default and payment delays of borrowers. For BOP, the Council Regulation 431/2009 provides for a procedure allowing sufficient time to mobilise funds through the Commission's own resources accounts with the Member States. For EFSM, the Council Regulation 407/2010 provides for a similar procedure.
Treasury
EU budget principles ensure that overall cash resources for a given year are always sufficient for the execution of all payments. In fact, the total Member States contributions equal the amount of payment appropriations for the budgetary year. Member States’ contributions, however, are received in twelve monthly instalments throughout the year, while payments are subject to certain seasonality. Moreover, in accordance with the Council Regulation 1150/2000 (Own Resources Regulation), Member States contributions relating to (amending) budgets approved after the 16th of a given month (N) only become available in month N+2, while the related payment appropriations are immediately available. In order to ensure that available treasury resources are always sufficient to cover the payments to be executed in any given month, procedures regarding regular cash forecasting are in place, and own resources or additional funding can be called up in advance from Member States if needed, up to certain limits and under certain conditions. Seasonality of expenditure and overall budgetary restrictions in recent years have resulted in the need for increased monitoring of the rhythm of payments over the year. In addition to the above, in the context of the Commission's daily treasury operations, automated cash management tools ensure that sufficient liquidity is available on each of the Commission's bank accounts, on a daily basis.
Guarantee Fund
The fund is managed according to the principle that the assets shall have a sufficient degree of liquidity and mobilisation in relation to the relevant commitments. The fund must maintain a minimum of EUR 100 million in a portfolio with a maturity of less than twelve months which is to be invested in monetary instruments. As at 31 December 2014 these investments, including cash, amounted to EUR 148 million. Furthermore, a minimum of 20 % of the fund's nominal value shall comprise monetary instruments, fixed-rate bonds with a remaining maturity of no more than one year, and floating-rate bonds. As at 31 December 2014 this ratio stood at 49 %.
Annual accounts of the European Union 2014
100
8. RELATED PARTY DISCLOSURES
8.1. RELATED PARTIES
The related parties of the EU are the EU consolidated entities and the key management personnel of these entities. Transactions between these entities take place as part of the normal operations of the EU and as this is the case, no specific disclosure requirements are necessary for these transactions in accordance with the EU accounting rules.
8.2. KEY MANAGEMENT ENTITLEMENTS
For the purposes of presenting information on related party transactions concerning the key management of the EU, such persons are shown here under five categories:
Category 1: the Presidents of the European Council, the Commission and the Court of Justice of the European Union
Category 2: the Vice-president of the Commission and High Representative of the EU for Foreign Affairs and Security Policy and the other Vice-presidents of the Commission
Category 3: the Secretary-General of the Council, the Members of the Commission, the Judges and Advocates General of the Court of Justice of the European Union, the President and Members of the General Court, the President and Members of the European Civil Service Tribunal, the Ombudsman and the European Data Protection Supervisor
Category 4: the President and Members of the European Court of Auditors
Category 5: the highest ranking civil servants of the Institutions and Agencies
A summary of their entitlements is given below – further information can be found in the Staff Regulations published on the Europa website which is the official document describing the rights and obligations of all officials of the EU. Key management personnel have not received any preferential loans from the EU.
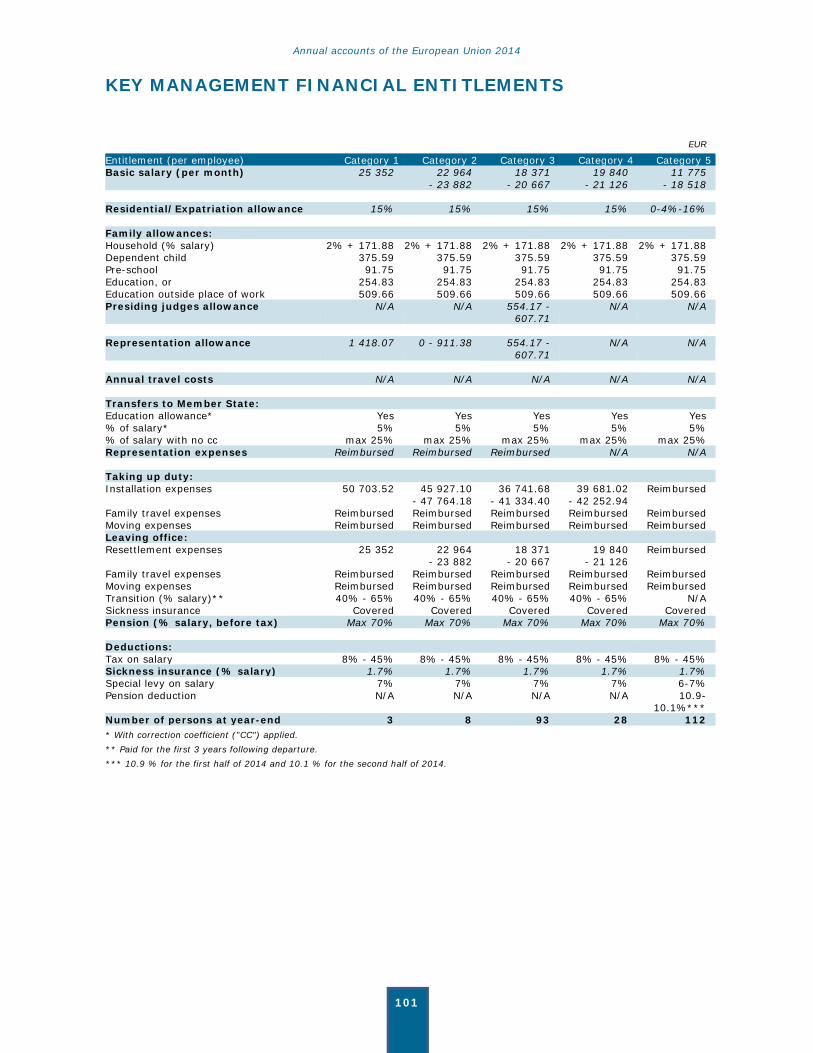
Annual accounts of the European Union 2014
101
KEY MANAGEMENT FINANCIAL ENTITLEMENTS
EUR
Entitlement (per employee) Category 1 Category 2 Category 3 Category 4 Category 5Basic salary (per month) 25 352 22 964 18 371 19 840 11 775 - 23 882 - 20 667 - 21 126 - 18 518 Residential/Expatriation allowance 15% 15% 15% 15% 0-4%-16% Family allowances: Household (% salary) 2% + 171.88 2% + 171.88 2% + 171.88 2% + 171.88 2% + 171.88Dependent child 375.59 375.59 375.59 375.59 375.59Pre-school 91.75 91.75 91.75 91.75 91.75 Education, or 254.83 254.83 254.83 254.83 254.83Education outside place of work 509.66 509.66 509.66 509.66 509.66 Presiding judges allowance N/A N/A 554.17 -
607.71N/A N/A
Representation allowance 1 418.07 0 - 911.38 554.17 -
607.71 N/A N/A
Annual travel costs N/A N/A N/A N/A N/A Transfers to Member State: Education allowance* Yes Yes Yes Yes Yes % of salary* 5% 5% 5% 5% 5%% of salary with no cc max 25% max 25% max 25% max 25% max 25% Representation expenses Reimbursed Reimbursed Reimbursed N/A N/A Taking up duty: Installation expenses 50 703.52 45 927.10 36 741.68 39 681.02 Reimbursed - 47 764.18 - 41 334.40 - 42 252.94 Family travel expenses Reimbursed Reimbursed Reimbursed Reimbursed ReimbursedMoving expenses Reimbursed Reimbursed Reimbursed Reimbursed ReimbursedLeaving office: Resettlement expenses 25 352 22 964 18 371 19 840 Reimbursed - 23 882 - 20 667 - 21 126 Family travel expenses Reimbursed Reimbursed Reimbursed Reimbursed ReimbursedMoving expenses Reimbursed Reimbursed Reimbursed Reimbursed Reimbursed Transition (% salary)** 40% - 65% 40% - 65% 40% - 65% 40% - 65% N/ASickness insurance Covered Covered Covered Covered CoveredPension (% salary, before tax) Max 70% Max 70% Max 70% Max 70% Max 70% Deductions: Tax on salary 8% - 45% 8% - 45% 8% - 45% 8% - 45% 8% - 45%Sickness insurance (% salary) 1.7% 1.7% 1.7% 1.7% 1.7%Special levy on salary 7% 7% 7% 7% 6-7% Pension deduction N/A N/A N/A N/A 10.9-
10.1%*** Number of persons at year-end 3 8 93 28 112* With correction coefficient ("CC") applied. ** Paid for the first 3 years following departure. *** 10.9 % for the first half of 2014 and 10.1 % for the second half of 2014.

Annual accounts of the European Union 2014
102
9. EVENTS AFTER THE BALANCE SHEET DATE At the date of signing of these accounts, no material issues had come to the attention of the Accounting Officer of the Commission or were reported to him that would require separate disclosure under this section. The accounts and related notes were prepared using the most recently available information and this is reflected in the information presented.
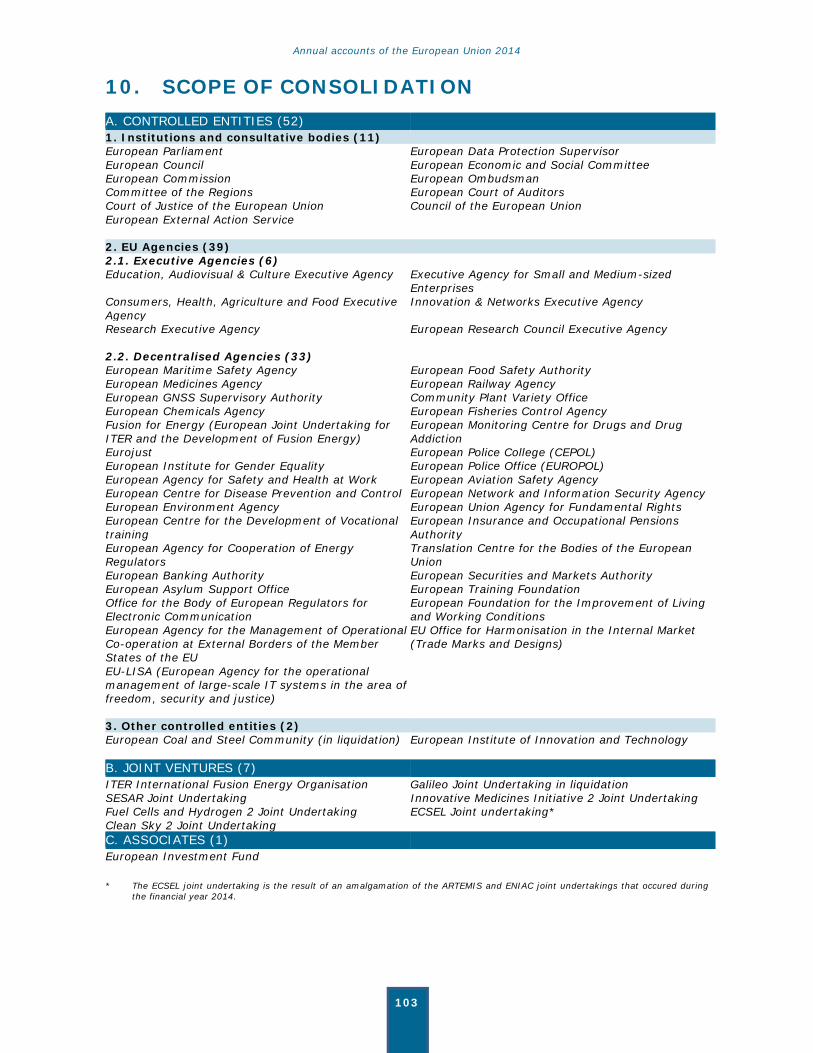
Annual accounts of the European Union 2014
103
10. SCOPE OF CONSOLIDATION A. CONTROLLED ENTITIES (52) 1. Institutions and consultative bodies (11) European Parliament European Data Protection Supervisor European Council European Economic and Social Committee European Commission European Ombudsman Committee of the Regions European Court of Auditors Court of Justice of the European Union Council of the European Union European External Action Service 2. EU Agencies (39) 2.1. Executive Agencies (6) Education, Audiovisual & Culture Executive Agency Executive Agency for Small and Medium-sized
Enterprises Consumers, Health, Agriculture and Food Executive Agency
Innovation & Networks Executive Agency
Research Executive Agency European Research Council Executive Agency 2.2. Decentralised Agencies (33) European Maritime Safety Agency European Food Safety Authority European Medicines Agency European Railway Agency European GNSS Supervisory Authority Community Plant Variety Office European Chemicals Agency European Fisheries Control Agency Fusion for Energy (European Joint Undertaking for ITER and the Development of Fusion Energy)
European Monitoring Centre for Drugs and Drug Addiction
Eurojust European Police College (CEPOL) European Institute for Gender Equality European Police Office (EUROPOL) European Agency for Safety and Health at Work European Aviation Safety Agency European Centre for Disease Prevention and Control European Network and Information Security Agency European Environment Agency European Union Agency for Fundamental Rights European Centre for the Development of Vocational training
European Insurance and Occupational Pensions Authority
European Agency for Cooperation of Energy Regulators
Translation Centre for the Bodies of the European Union
European Banking Authority European Securities and Markets Authority European Asylum Support Office European Training Foundation Office for the Body of European Regulators for Electronic Communication
European Foundation for the Improvement of Living and Working Conditions
European Agency for the Management of OperationalCo-operation at External Borders of the Member States of the EU
EU Office for Harmonisation in the Internal Market (Trade Marks and Designs)
EU-LISA (European Agency for the operational management of large-scale IT systems in the area offreedom, security and justice)
3. Other controlled entities (2) European Coal and Steel Community (in liquidation) European Institute of Innovation and Technology B. JOINT VENTURES (7) ITER International Fusion Energy Organisation Galileo Joint Undertaking in liquidation SESAR Joint Undertaking Innovative Medicines Initiative 2 Joint Undertaking Fuel Cells and Hydrogen 2 Joint Undertaking ECSEL Joint undertaking* Clean Sky 2 Joint Undertaking C. ASSOCIATES (1) European Investment Fund * The ECSEL joint undertaking is the result of an amalgamation of the ARTEMIS and ENIAC joint undertakings that occured during
the financial year 2014.

Annual accounts of the European Union 2014
104
Annual accounts of the European Union 2014
105
EUROPEAN UNION FINANCIAL YEAR 2014
AGGREGATED REPORTS ON THE IMPLEMENTATION OF THE BUDGET AND EXPLANATORY NOTES
It should be noted that due to the rounding of figures into millions of euros, some financial data in the tables below may appear not to add-up.

Annual accounts of the European Union 2014
106
Annual accounts of the European Union 2014
107
CONTENTS
EU BUDGET RESULT...................................................................................... 108 RECONCILIATION OF ECONOMIC RESULT WITH BUDGET RESULT ........................ 109 STATEMENT OF COMPARISON OF BUDGET AND ACTUAL AMOUNTS ..................... 110 NOTES TO THE AGGREGATED REPORTS ON THE IMPLEMENTATION OF THE BUDGET ........................................................................................... 113 1. THE EU BUDGET CYCLE ............................................................................. 113
1.1. MULTIANNUAL FINANCIAL FRAMEWORK 2014-2020 .......................................... 113
1.2. POLICY AREAS ............................................................................................. 114
1.3. ANNUAL BUDGET .......................................................................................... 114
2. NOTES TO THE EU BUDGET RESULT ............................................................ 116 2.1. CALCULATION OF THE BUDGET RESULT ........................................................... 116
2.2. IMPLEMENTATION OF THE 2014 EU BUDGET .................................................... 117
3. NOTES TO THE RECONCILIATION OF ECONOMIC RESULT WITH BUDGET RESULT ...................................................................................... 118 4. IMPLEMENTATION OF EU BUDGET REVENUE ................................................. 119
4.1. SUMMARY OF THE IMPLEMENTATION OF BUDGET REVENUE ............................... 119
4.2. REVENUE IMPLEMENTATION .......................................................................... 121
5. IMPLEMENTATION OF EU BUDGET EXPENDITURE .......................................... 124 5.1. MFF: BREAKDOWN & CHANGES IN COMMITMENT & PAYMENT APPROPRIATIONS ... 124
5.2. MFF: IMPLEMENTATION OF COMMITMENT APPROPRIATIONS .............................. 125
5.3. MFF: IMPLEMENTATION OF PAYMENT APPROPRIATIONS..................................... 126
5.4. MFF: MOVEMENTS IN COMMITMENTS OUTSTANDING (RAL) ............................... 127
5.5. MFF: BREAKDOWN OF COMMITMENTS OUTSTANDING BY YEAR OF ORIGIN .......... 128
5.6. POLICY AREA: BREAKDOWN AND CHANGES IN COMMITMENT AND PAYMENT APPROPRIATIONS ........................................................................... 129
5.7. POLICY AREA: IMPLEMENTATION OF COMMITMENT APPROPRIATIONS ................. 131
5.8. POLICY AREA: IMPLEMENTATION OF PAYMENT APPROPRIATIONS ........................ 133
5.9. POLICY AREA: MOVEMENTS IN COMMITMENTS OUTSTANDING ........................... 134
5.10. POLICY AREA: BREAKDOWN OF COMMITMENTS OUTSTANDING BY YEAR OF ORIGIN .......................................................................................... 135
5.11. IMPLEMENTATION OF 2014 EXPENDITURE ....................................................... 136
6. IMPLEMENTATION OF THE INSTITUTIONS AND AGENCIES BUDGET ................. 137 6.1. INSTITUTIONS: SUMMARY OF THE IMPLEMENTATION OF BUDGET REVENUE ......... 137
6.2. INSTITUTIONS: IMPLEMENTATION OF COMMITMENT AND PAYMENT APPROPRIATIONS ........................................................................... 138
6.3. AGENCIES INCOME: BUDGET FORECASTS, ENTITLEMENTS AND AMOUNTS RECEIVED .................................................................................... 140
6.4. COMMITMENT & PAYMENT APPROPRIATIONS BY AGENCY ................................... 142
6.5. BUDGET RESULT INCLUDING AGENCIES .......................................................... 143
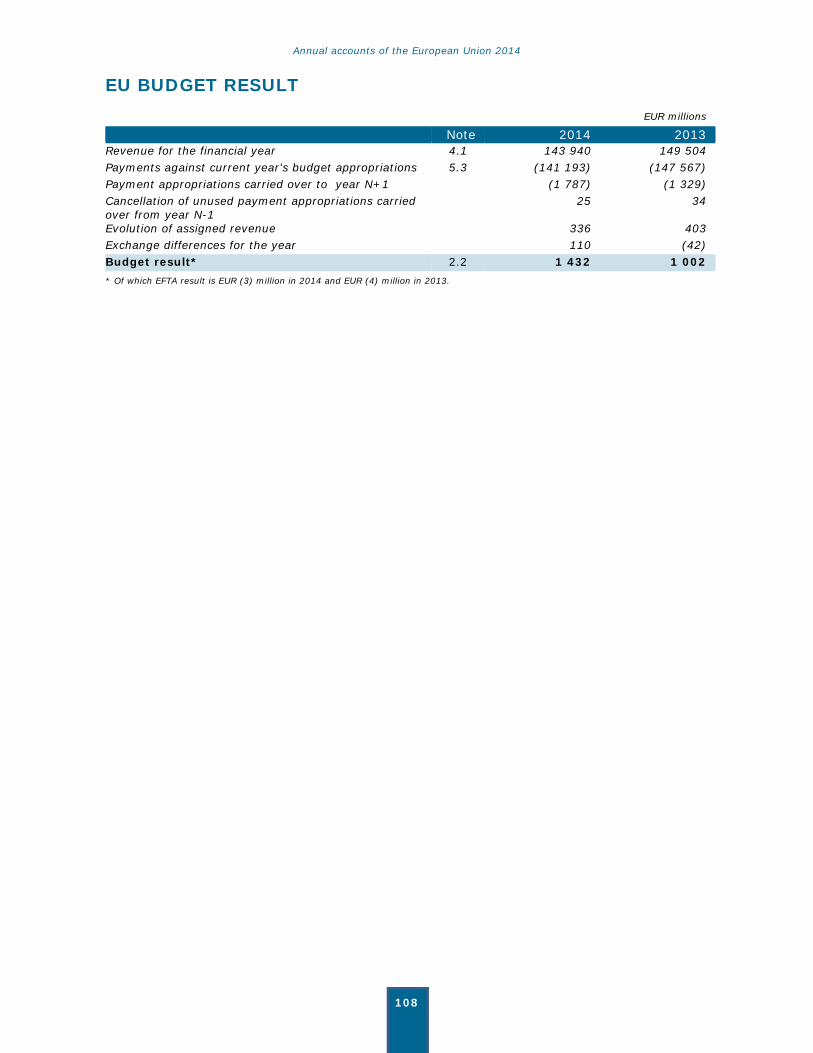
Annual accounts of the European Union 2014
108
EU BUDGET RESULT EUR millions
Note 2014 2013Revenue for the financial year 4.1 143 940 149 504 Payments against current year's budget appropriations 5.3 (141 193) (147 567) Payment appropriations carried over to year N+1 (1 787) (1 329) Cancellation of unused payment appropriations carried over from year N-1
25 34
Evolution of assigned revenue 336 403 Exchange differences for the year 110 (42) Budget result* 2.2 1 432 1 002 * Of which EFTA result is EUR (3) million in 2014 and EUR (4) million in 2013.
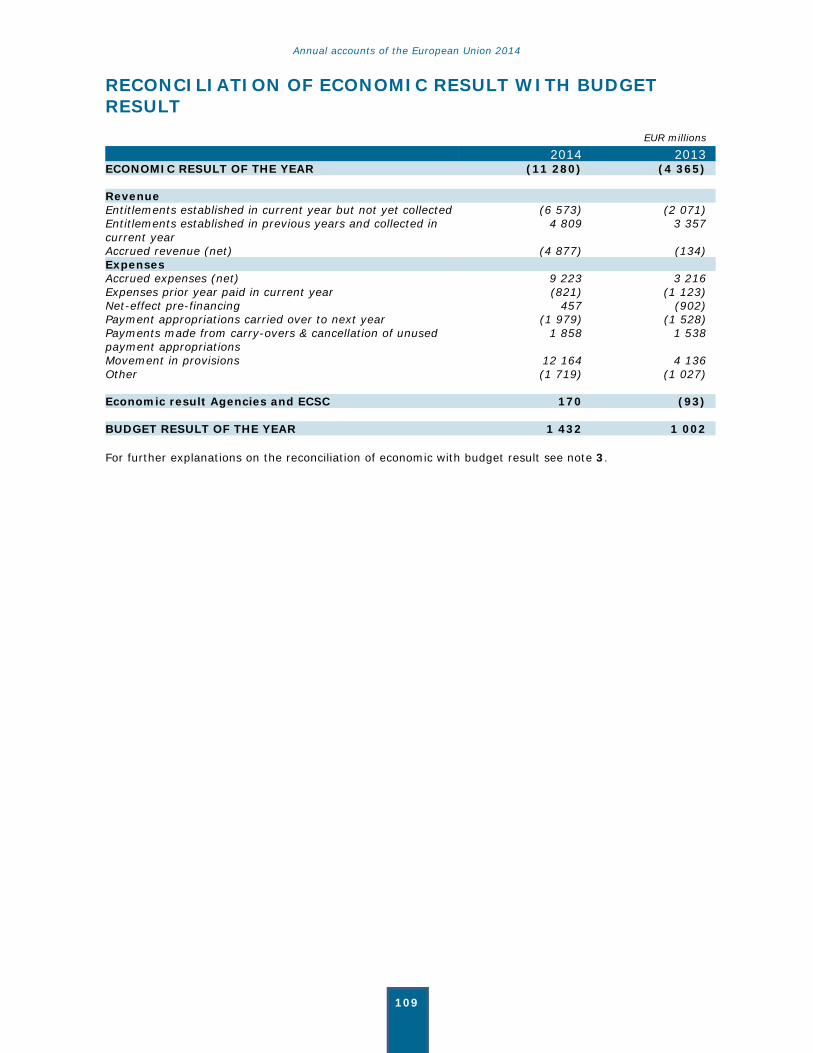
Annual accounts of the European Union 2014
109
RECONCILIATION OF ECONOMIC RESULT WITH BUDGET RESULT EUR millions
2014 2013 ECONOMIC RESULT OF THE YEAR (11 280) (4 365) Revenue Entitlements established in current year but not yet collected (6 573) (2 071) Entitlements established in previous years and collected in current year
4 809 3 357
Accrued revenue (net) (4 877) (134) Expenses Accrued expenses (net) 9 223 3 216 Expenses prior year paid in current year (821) (1 123) Net-effect pre-financing 457 (902) Payment appropriations carried over to next year (1 979) (1 528) Payments made from carry-overs & cancellation of unused payment appropriations
1 858 1 538
Movement in provisions 12 164 4 136 Other (1 719) (1 027) Economic result Agencies and ECSC 170 (93) BUDGET RESULT OF THE YEAR 1 432 1 002
For further explanations on the reconciliation of economic with budget result see note 3.
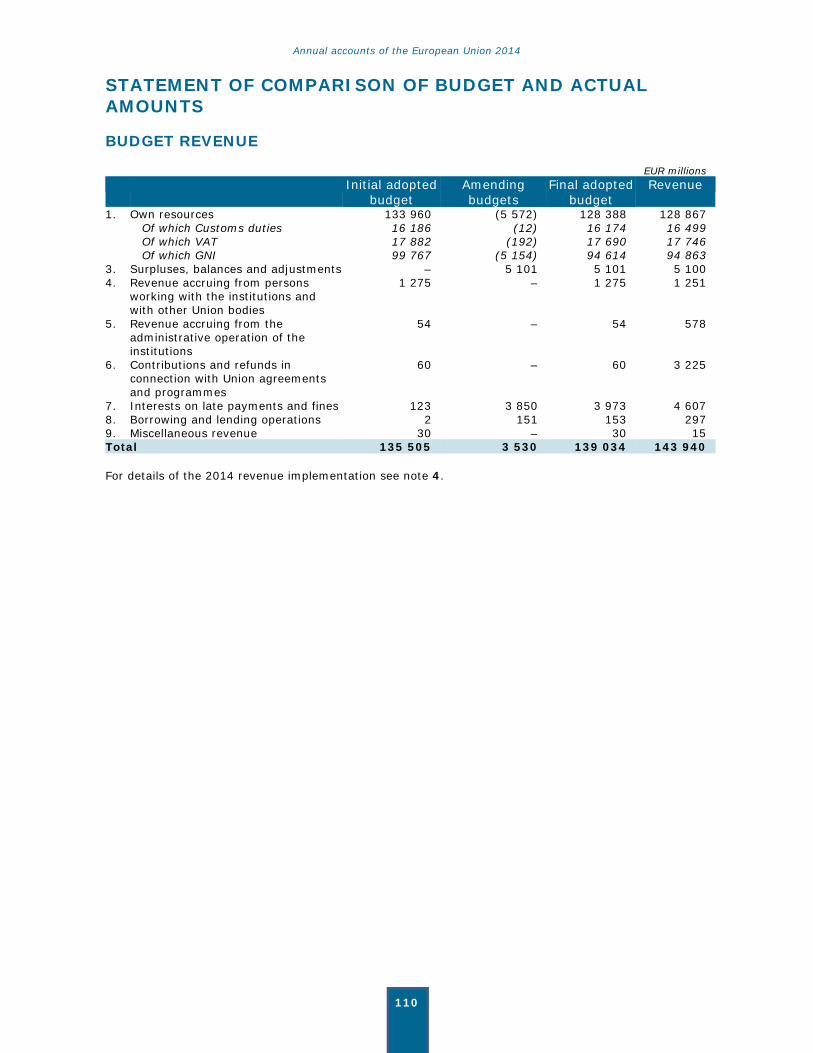
Annual accounts of the European Union 2014
110
STATEMENT OF COMPARISON OF BUDGET AND ACTUAL AMOUNTS
BUDGET REVENUE
EUR millions Initial adopted
budget Amendingbudgets
Final adopted budget
Revenue
1. Own resources 133 960 (5 572) 128 388 128 867 Of which Customs duties 16 186 (12) 16 174 16 499 Of which VAT 17 882 (192) 17 690 17 746 Of which GNI 99 767 (5 154) 94 614 94 863 3. Surpluses, balances and adjustments – 5 101 5 101 5 100 4. Revenue accruing from persons
working with the institutions and with other Union bodies
1 275 – 1 275 1 251
5. Revenue accruing from the administrative operation of the institutions
54 – 54 578
6. Contributions and refunds in connection with Union agreements and programmes
60 – 60 3 225
7. Interests on late payments and fines 123 3 850 3 973 4 607 8. Borrowing and lending operations 2 151 153 297 9. Miscellaneous revenue 30 – 30 15 Total 135 505 3 530 139 034 143 940
For details of the 2014 revenue implementation see note 4.
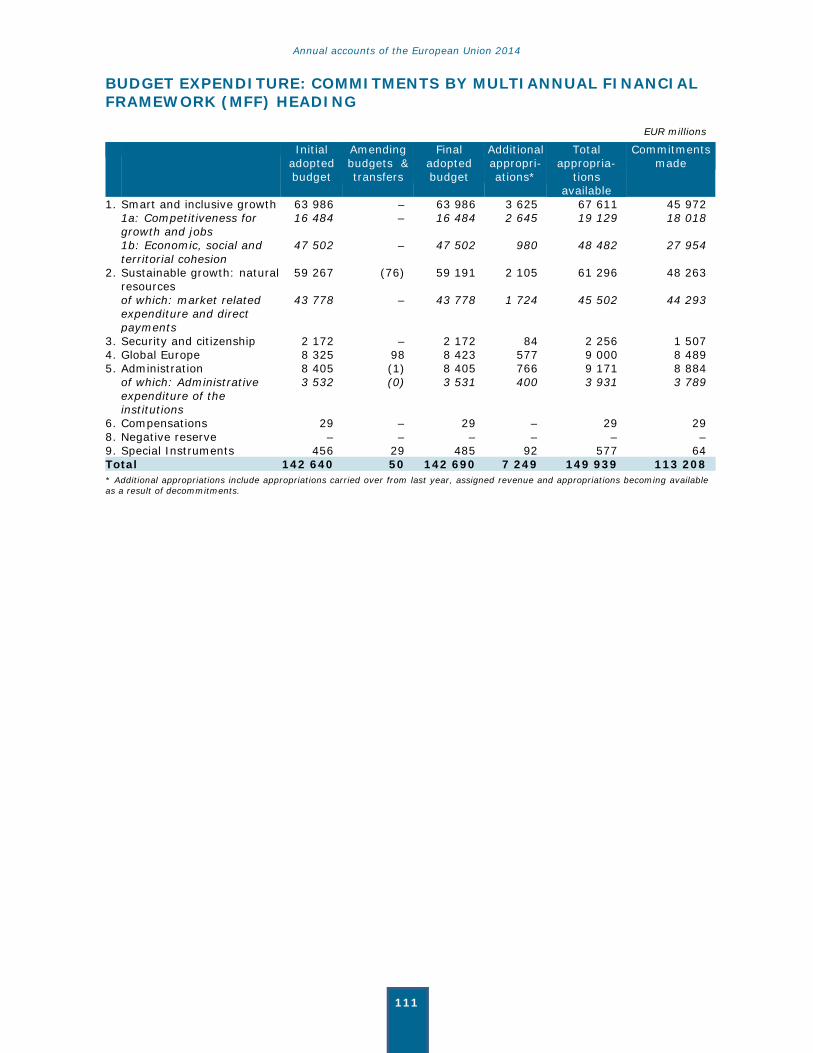
Annual accounts of the European Union 2014
111
BUDGET EXPENDITURE: COMMITMENTS BY MULTIANNUAL FINANCIAL FRAMEWORK (MFF) HEADING
EUR millions
Initial adopted budget
Amending budgets & transfers
Final adopted budget
Additional appropri-ations*
Total appropria-
tions available
Commitments made
1. Smart and inclusive growth 63 986 – 63 986 3 625 67 611 45 972 1a: Competitiveness for
growth and jobs 16 484 – 16 484 2 645 19 129 18 018
1b: Economic, social and territorial cohesion
47 502 – 47 502 980 48 482 27 954
2. Sustainable growth: natural resources
59 267 (76) 59 191 2 105 61 296 48 263
of which: market related expenditure and direct payments
43 778 – 43 778 1 724 45 502 44 293
3. Security and citizenship 2 172 – 2 172 84 2 256 1 507 4. Global Europe 8 325 98 8 423 577 9 000 8 489 5. Administration 8 405 (1) 8 405 766 9 171 8 884 of which: Administrative
expenditure of the institutions
3 532 (0) 3 531 400 3 931 3 789
6. Compensations 29 – 29 – 29 29 8. Negative reserve – – – – – – 9. Special Instruments 456 29 485 92 577 64 Total 142 640 50 142 690 7 249 149 939 113 208 * Additional appropriations include appropriations carried over from last year, assigned revenue and appropriations becoming available as a result of decommitments.
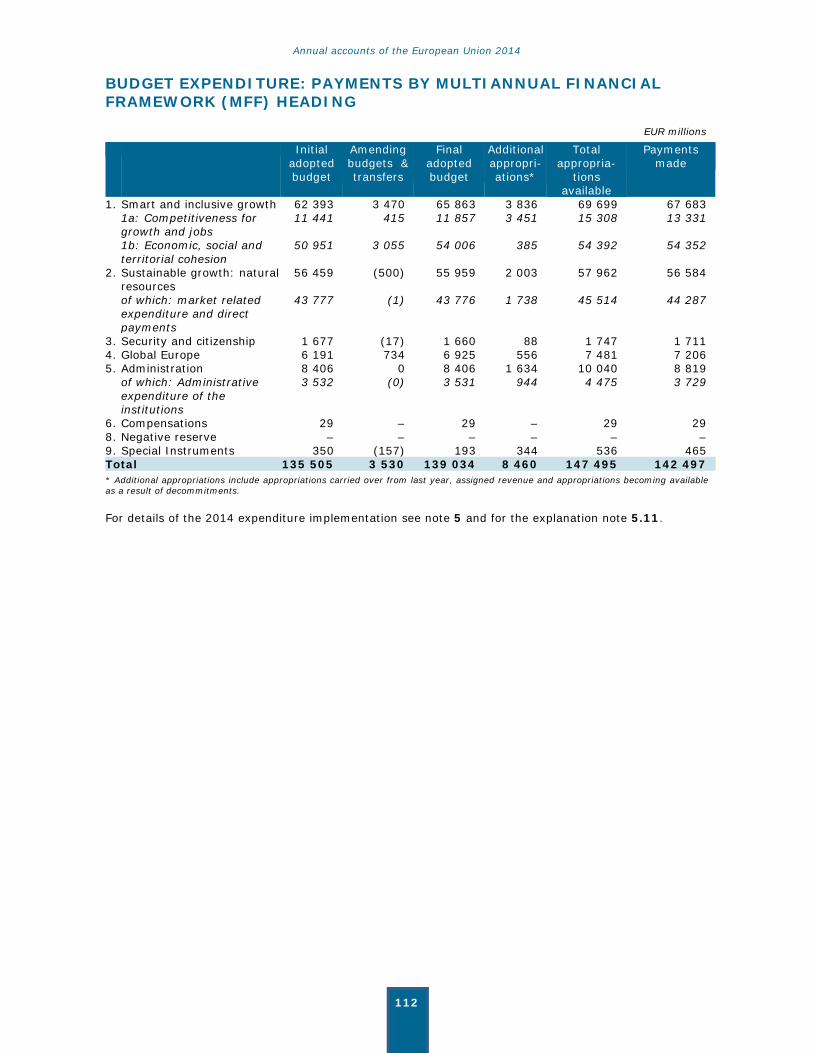
Annual accounts of the European Union 2014
112
BUDGET EXPENDITURE: PAYMENTS BY MULTIANNUAL FINANCIAL FRAMEWORK (MFF) HEADING
EUR millions
Initial adopted budget
Amending budgets & transfers
Final adopted budget
Additional appropri-ations*
Total appropria-
tions available
Payments made
1. Smart and inclusive growth 62 393 3 470 65 863 3 836 69 699 67 683 1a: Competitiveness for
growth and jobs 11 441 415 11 857 3 451 15 308 13 331
1b: Economic, social and territorial cohesion
50 951 3 055 54 006 385 54 392 54 352
2. Sustainable growth: natural resources
56 459 (500) 55 959 2 003 57 962 56 584
of which: market related expenditure and direct payments
43 777 (1) 43 776 1 738 45 514 44 287
3. Security and citizenship 1 677 (17) 1 660 88 1 747 1 711 4. Global Europe 6 191 734 6 925 556 7 481 7 206 5. Administration 8 406 0 8 406 1 634 10 040 8 819 of which: Administrative
expenditure of the institutions
3 532 (0) 3 531 944 4 475 3 729
6. Compensations 29 – 29 – 29 29 8. Negative reserve – – – – – – 9. Special Instruments 350 (157) 193 344 536 465 Total 135 505 3 530 139 034 8 460 147 495 142 497 * Additional appropriations include appropriations carried over from last year, assigned revenue and appropriations becoming available as a result of decommitments.
For details of the 2014 expenditure implementation see note 5 and for the explanation note 5.11.
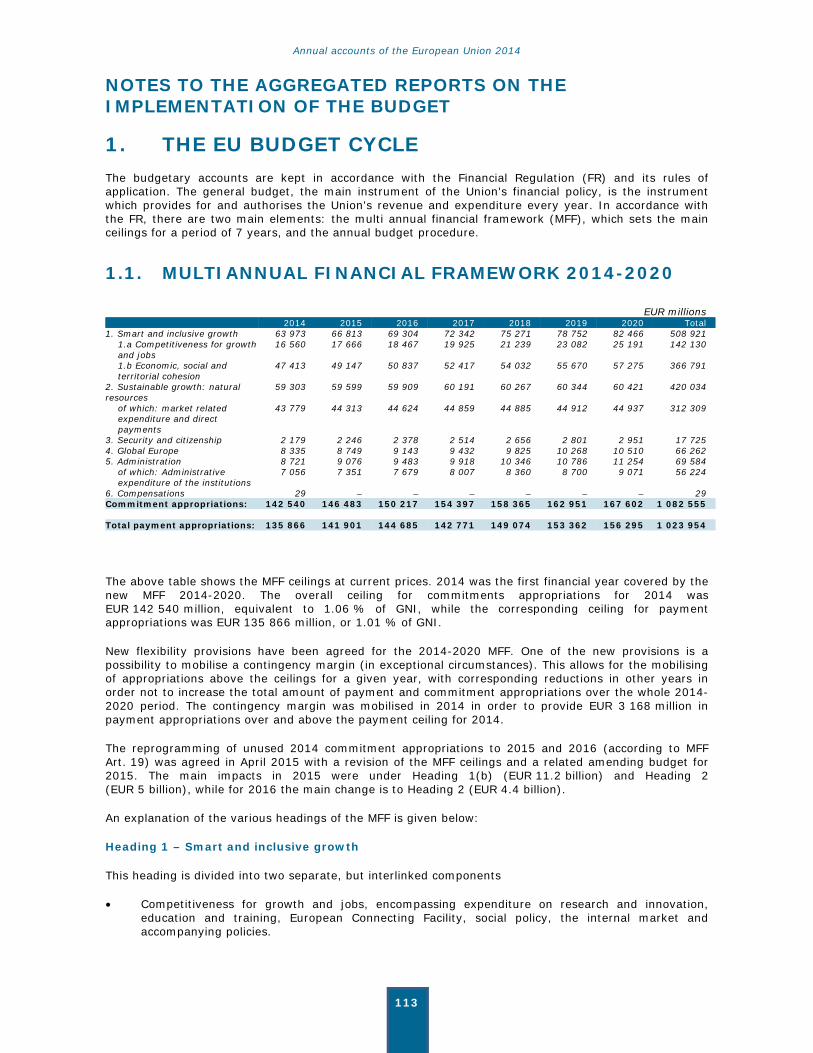
Annual accounts of the European Union 2014
113
NOTES TO THE AGGREGATED REPORTS ON THE IMPLEMENTATION OF THE BUDGET
1. THE EU BUDGET CYCLE The budgetary accounts are kept in accordance with the Financial Regulation (FR) and its rules of application. The general budget, the main instrument of the Union's financial policy, is the instrument which provides for and authorises the Union's revenue and expenditure every year. In accordance with the FR, there are two main elements: the multi annual financial framework (MFF), which sets the main ceilings for a period of 7 years, and the annual budget procedure.
1.1. MULTIANNUAL FINANCIAL FRAMEWORK 2014-2020
EUR millions 2014 2015 2016 2017 2018 2019 2020 Total
1. Smart and inclusive growth 63 973 66 813 69 304 72 342 75 271 78 752 82 466 508 921 1.a Competitiveness for growth and jobs
16 560 17 666 18 467 19 925 21 239 23 082 25 191 142 130
1.b Economic, social and territorial cohesion
47 413 49 147 50 837 52 417 54 032 55 670 57 275 366 791
2. Sustainable growth: natural resources
59 303 59 599 59 909 60 191 60 267 60 344 60 421 420 034
of which: market related expenditure and direct payments
43 779 44 313 44 624 44 859 44 885 44 912 44 937 312 309
3. Security and citizenship 2 179 2 246 2 378 2 514 2 656 2 801 2 951 17 725 4. Global Europe 8 335 8 749 9 143 9 432 9 825 10 268 10 510 66 262 5. Administration 8 721 9 076 9 483 9 918 10 346 10 786 11 254 69 584
of which: Administrative expenditure of the institutions
7 056 7 351 7 679 8 007 8 360 8 700 9 071 56 224
6. Compensations 29 – – – – – – 29 Commitment appropriations: 142 540 146 483 150 217 154 397 158 365 162 951 167 602 1 082 555 Total payment appropriations: 135 866 141 901 144 685 142 771 149 074 153 362 156 295 1 023 954
The above table shows the MFF ceilings at current prices. 2014 was the first financial year covered by the new MFF 2014-2020. The overall ceiling for commitments appropriations for 2014 was EUR 142 540 million, equivalent to 1.06 % of GNI, while the corresponding ceiling for payment appropriations was EUR 135 866 million, or 1.01 % of GNI.
New flexibility provisions have been agreed for the 2014-2020 MFF. One of the new provisions is a possibility to mobilise a contingency margin (in exceptional circumstances). This allows for the mobilising of appropriations above the ceilings for a given year, with corresponding reductions in other years in order not to increase the total amount of payment and commitment appropriations over the whole 2014-2020 period. The contingency margin was mobilised in 2014 in order to provide EUR 3 168 million in payment appropriations over and above the payment ceiling for 2014.
The reprogramming of unused 2014 commitment appropriations to 2015 and 2016 (according to MFF Art. 19) was agreed in April 2015 with a revision of the MFF ceilings and a related amending budget for 2015. The main impacts in 2015 were under Heading 1(b) (EUR 11.2 billion) and Heading 2 (EUR 5 billion), while for 2016 the main change is to Heading 2 (EUR 4.4 billion).
An explanation of the various headings of the MFF is given below:
Heading 1 – Smart and inclusive growth
This heading is divided into two separate, but interlinked components
• Competitiveness for growth and jobs, encompassing expenditure on research and innovation, education and training, European Connecting Facility, social policy, the internal market and accompanying policies.
Annual accounts of the European Union 2014
114
• Economic, social and territorial cohesion, designed to enhance convergence of the least developed Member States and regions, to complement the EU strategy for sustainable development outside the less prosperous regions and to support inter regional cooperation.
Heading 2 – Sustainable growth: natural resources
Heading 2 includes the common agricultural and fisheries policies, rural development and environmental measures, in particular Natura 2000.
Heading 3 – Security and citizenship
Heading 3 (Security and citizenship) reflects the growing importance attached to certain fields where the EU has been assigned particular tasks – justice and home affairs, border protection, immigration and asylum policy, public health and consumer protection, culture, youth, information and dialogue with citizens.
Heading 4 – Global Europe
Heading 4 covers all external action, including development cooperation, humanitarian aid, pre-accession and neigbourhood instruments. The EDF remains outside of the EU budget and is not part of the MFF.
Heading 5 - Administration
This heading covers administrative expenditure for all institutions, pensions and the European Schools. For the Institutions other than the Commission, these costs make up the total of their expenditure.
Heading 6 - Compensations
In accordance with the political agreement that new Member States should not become net-contributors to the budget at the very beginning of their membership, compensation was foreseen under this heading. This amount was available as transfers to them to balance their budgetary receipts and contributions.
1.2. POLICY AREAS
As part of its use of Activity Based Management (ABM) the Commission implements Activity Based Budgeting (ABB) in its planning and management processes. ABB involves a budget structure where budget titles correspond to policy areas and budget chapters to activities. ABB aims to provide a clear framework for translating the Commission's policy objectives into action, either through legislative, financial or any other public policy means. By structuring the Commission's work in terms of activities, a clear picture is obtained of the Commission's undertakings and simultaneously a common framework is established for priority setting. Resources are allocated to priorities during the budget procedure, using the activities as the building blocks for budgeting purposes. By establishing such a link between activities and the resources allocated to them, ABB aims to increase efficiency and effectiveness in the use of resources in the Commission.
A policy area may be defined as a homogeneous grouping of activities constituting parts of the Commission's work, which are relevant for the decision-making process. Each policy area corresponds, in general, to a Directorate General, and encompassing an average of about 6 or 7 individual activities. Policy areas are mainly operational, since their core activities aim at benefiting a third-party beneficiary within their respective domains of activity. The operational budget is completed with the necessary administrative expenditure for each policy area.
1.3. ANNUAL BUDGET
Every year, the Commission estimates all the Institutions' revenue and expenditure for the year and draws up a draft budget which it sends to the budgetary authority. On the basis of this draft budget, the Council sets out its position, which is then the subject of negotiations between the two arms of the budgetary authority. The President of Parliament declares that the joint draft has been finally adopted, thus making the budget enforceable. During the year in question, amending budgets are adopted. The task of executing the budget is mainly the responsibility of the Commission.
Annual accounts of the European Union 2014
115
The budget structure for the Commission consists of administrative and operational appropriations. The other Institutions have only administrative appropriations. Furthermore, the budget distinguishes between two types of appropriations: non-differentiated and differentiated. Non-differentiated appropriations are used to finance operations of an annual nature (which comply with the principle of annuality). Differentiated appropriations are used in order to reconcile the principle of annuality with the need to manage multi-annual operations. Differentiated appropriations are split into commitment and payment appropriations:
• commitment appropriations: cover the total cost of the legal obligations entered into for the current financial year for operations extending over a number of years. However, budgetary commitments for actions extending over more than one financial year may be broken down over several years into annual instalments where the basic act so provides.
• payment appropriations: cover expenditure arising from commitments entered into in the current
financial year and/or earlier financial years.
Origin of Appropriations
The main source of appropriations is the Union's adopted budget for the current year. However, there are other types of appropriations resulting from the provisions of the Financial Regulation. They come from previous financial years or outside sources:
– Budget appropriations from initial adopted budget and amending budgets – Appropriations carried over from previous year – Assigned revenue which is made up of refunds, EFTA appropriations, revenue from third
parties/other countries, work for third parties and appropriations made available again as a result of repayment of payments on account.
Composition of Total Available Budget
– Initial adopted budget = appropriations voted in year N-1; – Amending budgets adopted; – Additional appropriations = assigned revenue + appropriations carried over from the previous
financial year or made available again following decommitments.

Annual accounts of the European Union 2014
116
2. NOTES TO THE EU BUDGET RESULT
2.1. CALCULATION OF THE BUDGET RESULT
The budget result of the EU is returned to the Member States during the following year through deduction of their amounts due for that year.
The amounts of own resources entered in the accounts are those credited during the course of the year to the accounts opened in the Commission's name by the governments of the Member States. Revenue comprises also, in the case of a surplus, of the budget result for the previous financial year. The other revenue entered in the accounts is the amount actually received during the course of the year.
For the purposes of calculating the budget result for the year, expenditure comprises payments made against the year's appropriations plus any of the appropriations for that year that are carried over to the following year. Payments made against the year's appropriations means payments that are made by the accounting officer by 31 December of the financial year. For the EAGF, payments are those effected by the Member States between 16 October N-1 and 15 October N, provided that the accounting officer was notified of the commitment and authorisation by 31 January N+1. EAGF expenditure may be subject to a conformity decision following controls in the Member States.
The budget result comprises two elements: the result of the EU and the result of the participation of the EFTA countries belonging to the EEA. In accordance with Article 15 of Regulation No 1150/2000 on own resources, this result represents the difference between:
• total revenue received for the financial year; and
• total payments made against current year's appropriations plus the total amount of that year's appropriations carried over to the following year.
The following are added to or deducted from the resulting figure:
• the net balance of cancellations of payment appropriations carried over from previous years and any payments which, because of fluctuations in the euro rate, exceed non-differentiated appropriations carried over from the previous year;
• the evolution of assigned revenue; and
• the net exchange-rate gains or losses recorded during the year.
Appropriations carried over from the previous financial year in respect of contributions by and work for third parties, which by definition never lapse, are included as additional appropriations for the financial year. This explains the difference between carryovers from the previous year in the 2014 budget implementation statements and those carried over to the following year in the 2013 budget implementation statements. Appropriations made available again following the repayment of payments on account are disregarded when calculating the budget result.
Payment appropriations carried over include: automatic carryovers and carryovers by decision. The cancellation of unused payment appropriations carried over from the previous year shows the cancellations of appropriations carried over automatically and by decision.
Annual accounts of the European Union 2014
117
2.2. IMPLEMENTATION OF THE 2014 EU BUDGET
Budget surplus of EUR 1.4 billion:
– The surplus comes primarily from the revenue side (EUR 1.2 billion), from over-execution of custom duties (EUR 0.5 billion) and additional, non-budgeted, fines (EUR 0.6 billion);
– The minor surplus on the expenditure side (EUR 142 million) comes mainly from the other institutions as the Commission implementation rate is practically 100 %;
– The remaining EUR 110 million of surplus comes from exchange rate gains.
Revenue:
– Revenue, totalling EUR 143.9 billion, was EUR 4.9 billion higher than the final adopted budget due primarily to assigned revenue under headings 5 and 6 – see table 4.1 below;
– Fines revenue of EUR 4.2 billion was used to finance the increased need for payment appropriations;
– There was an exceptionally high revision of GNI own resources made in 2014 (EUR 9.5 billion) covering the period back to 2002. This, however, had a negligible impact on the budget revenue for 2014 since amounts were effectively adjusted between Member States (some are to receive refunds, others have to pay) and, moreover, most amounts have been deferred until 2015.
Expenditure:
– Initial payment appropriations (EUR 135.5 billion) were exceptionally low – 6 % lower than the final adopted budget for 2013. Amending budgets eventually increased the final adopted appropriations to EUR 139 million – see table 5.1;
– Total payments amounted to EUR 142.5 billion, (2013: EUR 148.5 billion) – see table 5.3.;
– Under-implementation of payments (after carry-overs) of EUR 32 million is one of the lowest recorded, confirming the tight constraints imposed on payment appropriations.
Commitments & RAL:
– Available commitment appropriations of EUR 149.9 billion were only implemented at an overall level of 76 % and a large amount of appropriations were carried over or reprogrammed to 2015 – see table 5.2;
– Outstanding commitments ("RAL") decreased significantly from EUR 222.4 bilion at end 2013 to EUR 189.6 billion at end 2014 – see table 5.9. This reflects the low implementation of commitments at the start of new programming period – had all appropriations for the new programmes been committed in 2014, the RAL would have remained at a similar level as 2013.
A more detailed analysis of budgetary adjustments, their relevant context, their justification and their impact is presented in Commission's Report on Budgetary and Financial Management 2014, Part A "Overview at budget level" and Part B dealing with each heading of the multi-annual financial framework.

Annual accounts of the European Union 2014
118
3. NOTES TO THE RECONCILIATION OF ECONOMIC RESULT WITH BUDGET RESULT
In accordance with the Financial Regulation, the economic result of the year is calculated on the basis of accrual accounting principles, while the budget result is based on modified cash accounting rules. As the economic result and the budget result both cover the same underlying transactions, it is a useful control to ensure that they are reconcilable.
Reconciling items - Revenue
The actual budgetary revenue for a financial year corresponds to the revenue collected from entitlements established in the course of the year and amounts collected from entitlements established in previous years. Therefore the entitlements established in the current year but not yet collected are to be deducted from the economic result for reconciliation purposes as they do not form part of budgetary revenue. On the contrary the entitlements established in previous years and collected in current year must be added to the economic result for reconciliation purposes.
The net accrued revenue mainly consists of accrued revenue for agriculture, own resources and interests and dividends. Only the net-effect, i.e. accrued revenue for current year minus reversal accrued revenue from previous year, is taken into consideration.
Reconciling items - Expenditure
Net accrued expenses mainly consists of accruals made for year-end cut-off purposes, i.e. eligible expenses incurred by beneficiaries of EU funds but not yet reported to the Commission. While accrued expenses are not considered as budgetary expenditure, payments made in the current year relating to invoices registered in prior years are part of current year's budgetary expenditure.
The net effect of pre-financing is the combination of (1) the new pre-financing amounts paid in the current year and recognised as budgetary expenditure of the year and (2) the clearing of the pre-financing paid in current year or previous years through the acceptance of eligible costs. The latter represent an expense in accrual terms but not in the budgetary accounts since the payment of the initial pre-financing had already been considered as a budgetary expenditure at the time of its payment.
Besides the payments made against the year's appropriations, the appropriations for that year that are carried forward to the next year also need to be taken into account in calculating the budget result for the year (in accordance with Article 15 of Regulation No 1150/2000). The same applies for the budgetary payments made in the current year from carry-overs from previous years, and the cancellation of unused payment appropriations.
The movement in provisions relates to year-end estimates made in the financial statements (employee benefits mainly) that do not impact the budgetary accounts. Other reconciling amounts comprise different elements such as asset depreciation, asset acquisitions, capital lease payments and financial participations for which the budgetary and accrual accounting treatments differ.

Annual accounts of the European Union 2014
119
4. IMPLEMENTATION OF EU BUDGET REVENUE
4.1. SUMMARY OF THE IMPLEMENTATION OF BUDGET REVENUE
EUR millions Title Income appropriations Entitlements established Revenue Receipts as Outstanding
Initial
adopted budget
Final adopted budget Current yearCarried over Total
On entitlements current year
On entitlements carried over
Total % of budget
1. Own resources 133 960 128 388 128 853 46 128 899 128 841 25 128 867 100.37% 32 3. Surpluses, balances and
adjustments – 5 101 10 507 – 10 507 5 100 – 5 100 99.98% 5 407
4. Revenue accruing from persons working with the institutions and other Union bodies
1 275 1 275 1 248 12 1 260 1 240 11 1 251 98.14% 8
5. Revenue accruing from the administrative operation of the institutions
54 54 578 21 599 563 15 578 1075.46% 21
6. Contributions and refunds in connection with Union agreements and programmes
60 60 3 267 228 3 496 3 120 105 3 225 5374.97% 271
7. Interests on late payments and fines
123 3 973 2 206 10 416 12 622 1 131 3 475 4 607 115.95% 8 016
8. Borrowing and lending operations
2 153 46 255 301 43 254 297 193.72% 3
9. Miscellaneous revenue 30 30 15 10 25 13 2 15 50.01% 10 Total 135 505 139 034 146 721 10 988 157 709 140 052 3 888 143 940 103.53% 13 769
EUR millions Detail Title 1: Own resources
Chapter Income appropriations Entitlements established Revenue Receipts as Outstanding
Initial budget voted
Final adopted budget Current yearCarried over Total
On entitlements current year
On entitlements carried over
Total % of budget
11. Sugar levies 125 (90) (69) – (69) (69) – (69) 77.12% – 12. Customs duties 16 186 16 174 16 485 46 16 531 16 473 25 16 499 102.01% 32 13. VAT 17 882 17 690 17 746 – 17 746 17 746 – 17 746 100.32% – 14. GNI 99 767 94 614 94 863 – 94 863 94 863 – 94 863 100.26% – 15. Correction of budgetary
imbalances – – (172) – (172) (172) – (172) 0.00% –
Total 133 960 128 388 128 853 46 128 899 128 841 25 128 867 100.37% 32
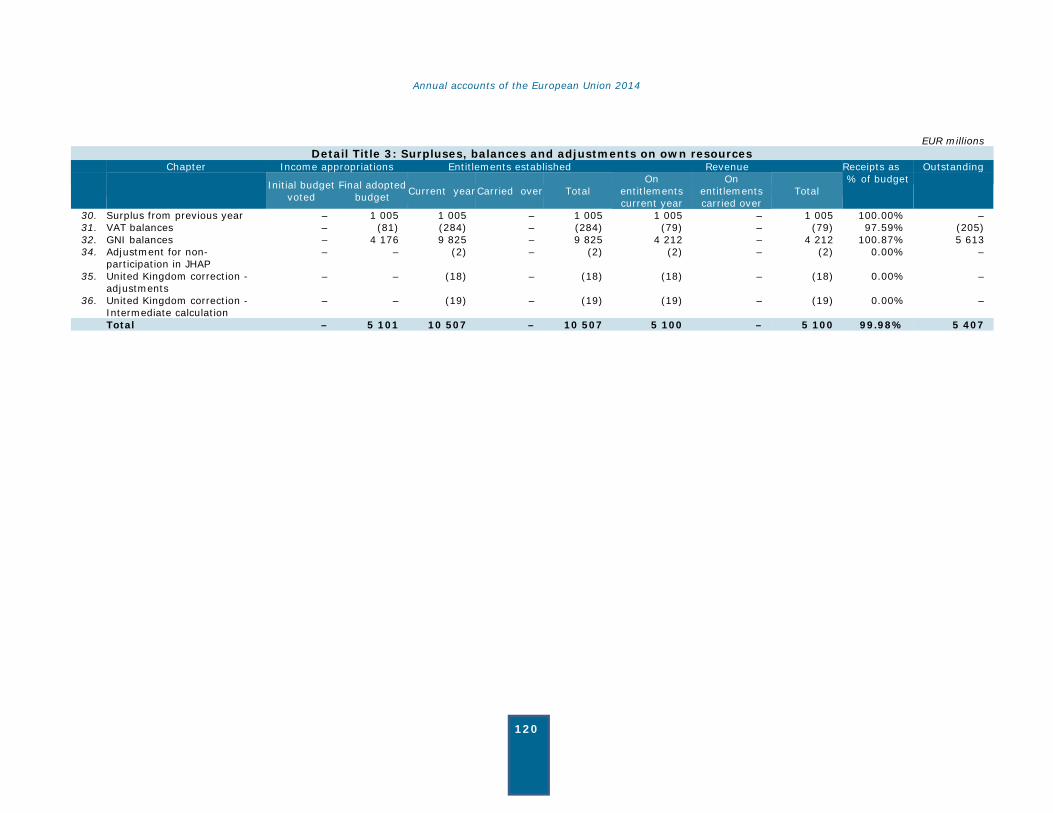
Annual accounts of the European Union 2014
120
EUR millions Detail Title 3: Surpluses, balances and adjustments on own resources
Chapter Income appropriations Entitlements established Revenue Receipts as Outstanding
Initial budget voted
Final adopted budget Current yearCarried over Total
On entitlements current year
On entitlements carried over
Total % of budget
30. Surplus from previous year – 1 005 1 005 – 1 005 1 005 – 1 005 100.00% – 31. VAT balances – (81) (284) – (284) (79) – (79) 97.59% (205) 32. GNI balances – 4 176 9 825 – 9 825 4 212 – 4 212 100.87% 5 613 34. Adjustment for non-
participation in JHAP – – (2) – (2) (2) – (2) 0.00% –
35. United Kingdom correction - adjustments
– – (18) – (18) (18) – (18) 0.00% –
36. United Kingdom correction - Intermediate calculation
– – (19) – (19) (19) – (19) 0.00% –
Total – 5 101 10 507 – 10 507 5 100 – 5 100 99.98% 5 407
Annual accounts of the European Union 2014
121
4.2. REVENUE IMPLEMENTATION
4.2.1. Overview of 2014 revenue
In the initial adopted EU budget, signed by the President of the European Parliament on 20 November 2013, the amount of payment appropriations was EUR 135 505 million and the amount to be financed by own resources totalled EUR 133 960 million. The revenue and expenditure estimates in the initial budget are typically adjusted during the budgetary year, such modifications being presented in Amending Budgets. Adjustments in the GNI-based own resources ensure that budgeted revenue matches exactly budgeted expenditure. In accordance with the principle of equilibrium, budget revenue and expenditure (payment appropriations) must be in balance.
During 2014, seven amending budgets were adopted. Taking them into account, the total final adopted revenue for 2014 amounted to EUR 139 034 million. This was financed by own resources totalling EUR 128 388 million (thus EUR 5 572 million less than initially forecasted) and the remainder by other revenue. The increased need for financing payment appropriations was covered mainly by income coming from fines. Moreover, the surplus from the previous financial year and extraordinary income coming from the VAT and GNI adjustments of previous years reduced substantially Member States' GNI balancing contribution.
The Amending Budgets No. 2 and No. 3/2014 included fines and related interest on undertakings totalling EUR 3 850 million that were known at the time when the corresponding Draft Amending Budgets were established. By 31 December 2014, other fines became definitive, either after a definitive judgement or because companies did not appeal new fine decisions.
Revenue, contributions and refunds in connection with EU agreements and programmes total an amount of EUR 3 225 million. The principal amounts concern the EAGF and EAFRD (and in particular the clearance of accounts and irregularities), the participation of third countries in research programs and other contributions and refunds to EU programs/activities. A substantial part of this total is made up of earmarked revenue, which typically gives rise to the entering of additional appropriations on the expenditure side.
As far as the own resources result is concerned, the collection of traditional own resources was close to the forecasted amounts. This is primarily because the budget estimates that were modified at the time the Draft Amending Budget No. 4/2014 was established (they were decreased by EUR 646 million according to the new forecasts of spring 2014), were once again amended in the Draft Amending Budget No. 6/2014 to take into account the actual rhythm of collection. Thus they were increased by EUR 420 million.
The final Member States' VAT and GNI payments also correspond closely to the final budgetary estimate. The differences between the forecasted amounts and the amounts actually paid are due to the differences between the euro rates used for budgetary purposes and the rates in force at the time when the Member States outside the EMU actually made their payments.
The adjustment in 2014 included major revisions for the GNI dating back to 2002. Thus the adjustment was unprecedented in size totalling EUR 9.5 billion across all EU Member States. In order to address the exceptional situation, the Council adopted on 18 December a Commission proposal (Council Regulation (EU, Euratom) No 1377/2014 of 18 December 2014) allowing Member States to defer payment, interest free, under strict conditions, up to 1 September 2015. Accordingly 6 Member States opted to pay their adjustments in 2015. The deferred payment amounts to EUR 5.4 billion.
The amount of own resources to be received relates to the Amending Budgets Numbers 2 to 7/2014 adopted on 17 December 2014. According to Article 10 of Council Regulation 1150/2000 of 22 May 2000 (OJ L 130, 31.5.2000, p. 1) the entries corresponding to the readjustments of own resources contributions were carried out on the first working day of February 2015. The adjustments to Member States’ national EU budget contributions based on VAT and GNI takes place every year on the first working day of December.

Annual accounts of the European Union 2014
122
4.2.2. Own resources revenue
The vast majority of revenue comes from own resources. This is laid down in Article 311 of the Treaty on the Functioning of the EU, which states that: "Without prejudice to other revenue, the budget shall be financed wholly from own resources." The bulk of budgetary expenditure is financed by own resources.
Own resources can be divided into the following categories:
(1) Traditional own resources (TOR) consist of customs duties and sugar levies. These own resources are levied on economic operators and collected by Member States on behalf of the EU. However, Member States keep 25 % as a compensation for their collection costs (20 % as of 2014). Customs duties are levied on imports of products coming from third countries, at rates based on the Common Customs Tariff. Sugar levies are paid by sugar producers to finance the export refunds for sugar. TOR usually account for +/- 13 % of own resource revenue.
(2) The own resource based on value added tax (VAT) is levied on Member States' VAT bases, which are harmonised for this purpose in accordance with EU rules. The same percentage is levied on the harmonised base of each Member State. However, the VAT base to take into account is capped at 50 % of each Member State’s GNI. The VAT-based resource usually accounts for around 12 % of own resource revenue.
(3) The resource based on gross national income (GNI) is used to balance budget revenue and expenditure, i.e. to finance the part of the budget not covered by any other sources of revenue. The same percentage rate is levied on each Member States' GNI, which is established in accordance with EU rules. The GNI-based resource usually accounts for +/- 75 % of own resource revenue.
The allocation of own resources is made in accordance with the rules laid down in the Council Decision No. 2007/436/EC, Euratom of 7 June 2007 on the system of the EU's own resources (ORD 2007). A new decision establishing the system of the EU’s own resources has been adopted for the 2014-2020 period (ORD 2014: Council Decision No. 2014/335/EU, Euratom of 26 May 2014). The 2014 ORD will enter into force after it has been ratified by all Member States according to their constitutional rules (expected for beginning of 2016). Until then, the 2007 ORD remains valid. The retroactive effects (the ORD 2014 will apply from 1 January 2014) will be taken into account in the budgetary year when the decision will enter into force.
4.2.3. Traditional own resources
Traditional own resources: All established traditional own resource amounts must be entered in one or other of the accounts kept by the competent authorities.
• In the ordinary account provided for in Article 6(3)(a) of Regulation No 1150/2000: all amounts recovered or guaranteed.
• In the separate account provided for in Article 6(3)(b) of Regulation No 1150/2000: all amounts not yet recovered and/or not guaranteed; amounts guaranteed but challenged may also be entered in this account.
For the separate account, the Member States quarterly statement to the Commission includes:
• the balance to be recovered during the previous quarter, • the established entitlements during the quarter in question, • rectifications of the base (corrections/cancellations) during the quarter in question, • amounts written off (which cannot be made available according to Article 17(2) of Regulation
1150/2000), • the amounts recovered during the quarter in question, • the balance to be recovered at the end of the quarter in question.
Traditional own resources must be entered in the Commission's account with the Treasury or the body appointed by the Member State at the latest on the first working day following the 19th day of the second month following the month during which the entitlement was established (or recovered in the case of the separate account). Member States retain, by way of collection costs, 25 % of traditional own resources (20 % according to the 2014 ORD). The contingent own resources entitlements are adjusted on the basis of the likelihood of their recovery.
Annual accounts of the European Union 2014
123
4.2.4. VAT-based resources and GNI-based resources
VAT-based own resources derive from the application of a uniform rate, for all Member States, to the harmonised VAT base determined in accordance with the rules of Article 2(1)(b) of the ORD 2007. The uniform rate is fixed at 0.30 % except for the period 2007-2013 in which the rate of call for Austria was fixed at 0.225 %, for Germany at 0.15 % and for Netherlands and Sweden at 0.10 %. The VAT base is capped at 50 % of GNI for all Member States. According to the 2014 ORD, the rate of call will remain at 0.3 %, except for the period 2014-20 the rate of call for Germany, the Netherlands and Sweden will be fixed at 0.15 %.
The GNI-based resource is a variable resource intended to supply the revenue required, in any given year, to cover expenditure exceeding the amount collected from traditional own resources, VAT resources and miscellaneous revenue. The revenue derives from the application of a uniform rate to the aggregate GNI of all the Member States. VAT and GNI-based resources are determined on the basis of forecasts of VAT and GNI bases made when the draft budget is being prepared. These forecasts are subsequently revised; the figures are updated during the budget year in question by means of an amending budget. The actual figures for the VAT and GNI bases are available in the course of the year following the budget year in question. The Commission calculates the differences between the amounts due by the Member States by reference to the actual bases and the sums actually paid on the basis of the (revised) forecasts. These VAT and GNI balances, either positive or negative, are called in by the Commission from the Member States for the first working day of December of the year following the budget year in question. The Council adopted on 18 December 2014 Regulation (EU, Euratom) No 1377/2014 which allows Member States, under certain conditions, to defer making available the amounts of VAT and GNI balances until the first working day of September of the following year. Corrections may still be made to the actual VAT and GNI bases during the subsequent four years, unless a reservation is issued. The balances calculated earlier are adjusted and the difference is called in at the same time as the VAT and GNI balances for the previous budget year.
When conducting controls of VAT statements and GNI data, the Commission may notify reservations to the Member States regarding certain points which may have consequences to their own resources contributions. These points, for example, may result from an absence of acceptable data, or a need to develop a suitable methodology. These reservations have to be seen as potential claims on the Member States for uncertain amounts as their financial impact cannot be estimated with accuracy. When the exact amount can be determined, the corresponding VAT and GNI-based resources are called either in connection with VAT and GNI balances or by individual calls for funds.
4.2.5. UK correction
This mechanism reduces the own resources payments of the UK in proportion to what is known as its "budgetary imbalance" and increases the own resources payments of the other Member States correspondingly. The budgetary imbalance correction mechanism in favour of the United Kingdom was instituted by the European Council in Fontainebleau (June 1984) and the resulting Own Resources Decision of 7 May 1985. The purpose of the mechanism was to reduce the budgetary imbalance of the UK through a reduction in its payments to the EU. Germany, Austria, Sweden and Netherlands benefit from a reduced financing of the correction (restricted to one fourth of their normal share).
4.2.6. Gross reduction
The European Council of 15 and 16 December 2005 concluded that the Netherlands and Sweden shall benefit from gross reductions in their annual GNI-based contributions during the period 2007-2013. Reflecting these conclusions, the 2007 ORD provides that the Netherlands shall benefit from a gross reduction in its annual GNI contribution of EUR 605 million and Sweden from a gross reduction in its annual GNI contribution of EUR 150 million, measured at 2004 prices. The European Council of 7-8 February 2013 concluded that Denmark, the Netherlands and Sweden are to benefit from gross reductions in their annual contributions based on gross national income (GNI) for the period 2014-2020 only and that Austria is to benefit from gross reductions in its annual GNI-based contributions for the period 2014-2016 only. Denmark, the Netherlands and Sweden shall benefit from gross reductions in their annual GNI-based contribution of EUR 130 million, EUR 695 million and EUR 185 million respectively. Austria shall benefit from a gross reduction in its annual GNI-based contribution of EUR 30 million in 2014, EUR 20 million in 2015 and EUR 10 million in 2016 (all amounts in 2011 prices). These provisions were taken up in the 2014 ORD and will be applied (retroactively) after its entry into force.
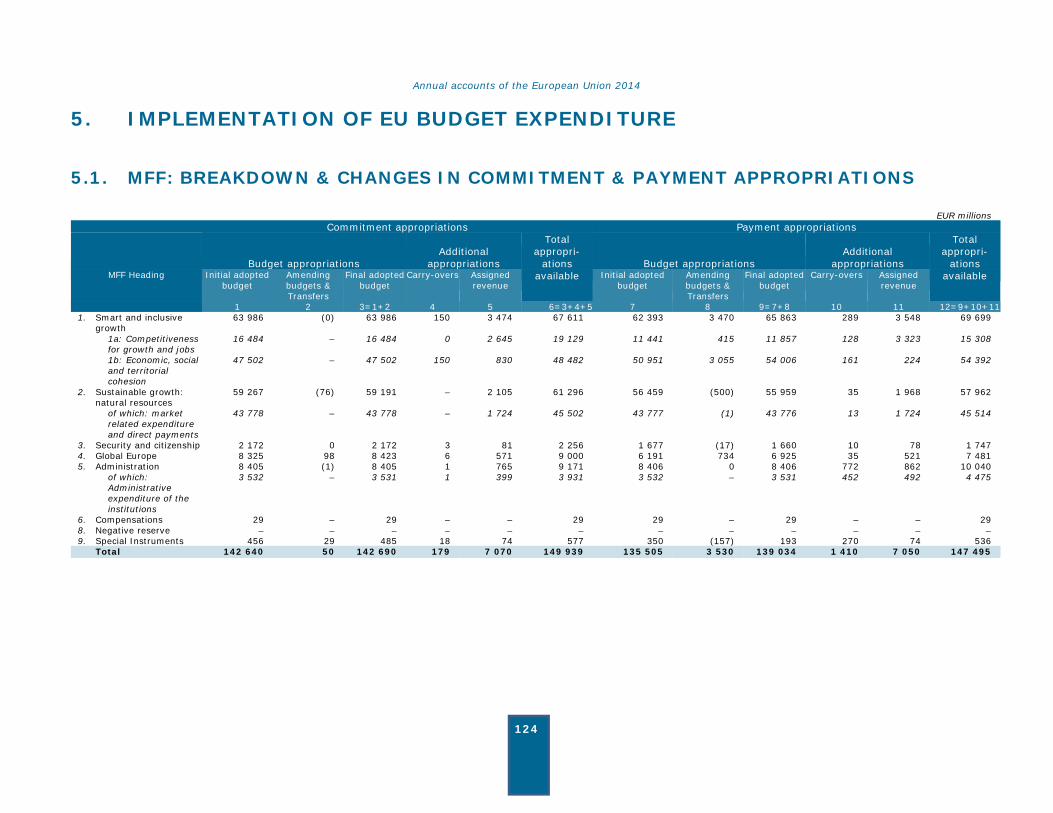
Annual accounts of the European Union 2014
124
5. IMPLEMENTATION OF EU BUDGET EXPENDITURE
5.1. MFF: BREAKDOWN & CHANGES IN COMMITMENT & PAYMENT APPROPRIATIONS
EUR millions Commitment appropriations Payment appropriations
Budget appropriationsAdditional
appropriations
Total appropri-
ations Budget appropriationsAdditional
appropriations
Total appropri-
ationsMFF Heading Initial adopted
budget Amending budgets & Transfers
Final adopted budget
Carry-overs Assigned revenue
available Initial adopted budget
Amending budgets & Transfers
Final adopted budget
Carry-overs Assigned revenue
available
1 2 3=1+2 4 5 6=3+4+5 7 8 9=7+8 10 11 12=9+10+11 1. Smart and inclusive
growth 63 986 (0) 63 986 150 3 474 67 611 62 393 3 470 65 863 289 3 548 69 699
1a: Competitiveness for growth and jobs
16 484 – 16 484 0 2 645 19 129 11 441 415 11 857 128 3 323 15 308
1b: Economic, social and territorial cohesion
47 502 – 47 502 150 830 48 482 50 951 3 055 54 006 161 224 54 392
2. Sustainable growth: natural resources
59 267 (76) 59 191 – 2 105 61 296 56 459 (500) 55 959 35 1 968 57 962
of which: market related expenditure and direct payments
43 778 – 43 778 – 1 724 45 502 43 777 (1) 43 776 13 1 724 45 514
3. Security and citizenship 2 172 0 2 172 3 81 2 256 1 677 (17) 1 660 10 78 1 747 4. Global Europe 8 325 98 8 423 6 571 9 000 6 191 734 6 925 35 521 7 481 5. Administration 8 405 (1) 8 405 1 765 9 171 8 406 0 8 406 772 862 10 040
of which: Administrative expenditure of the institutions
3 532 – 3 531 1 399 3 931 3 532 – 3 531 452 492 4 475
6. Compensations 29 – 29 – – 29 29 – 29 – – 29 8. Negative reserve – – – – – – – – – – – – 9. Special Instruments 456 29 485 18 74 577 350 (157) 193 270 74 536
Total 142 640 50 142 690 179 7 070 149 939 135 505 3 530 139 034 1 410 7 050 147 495
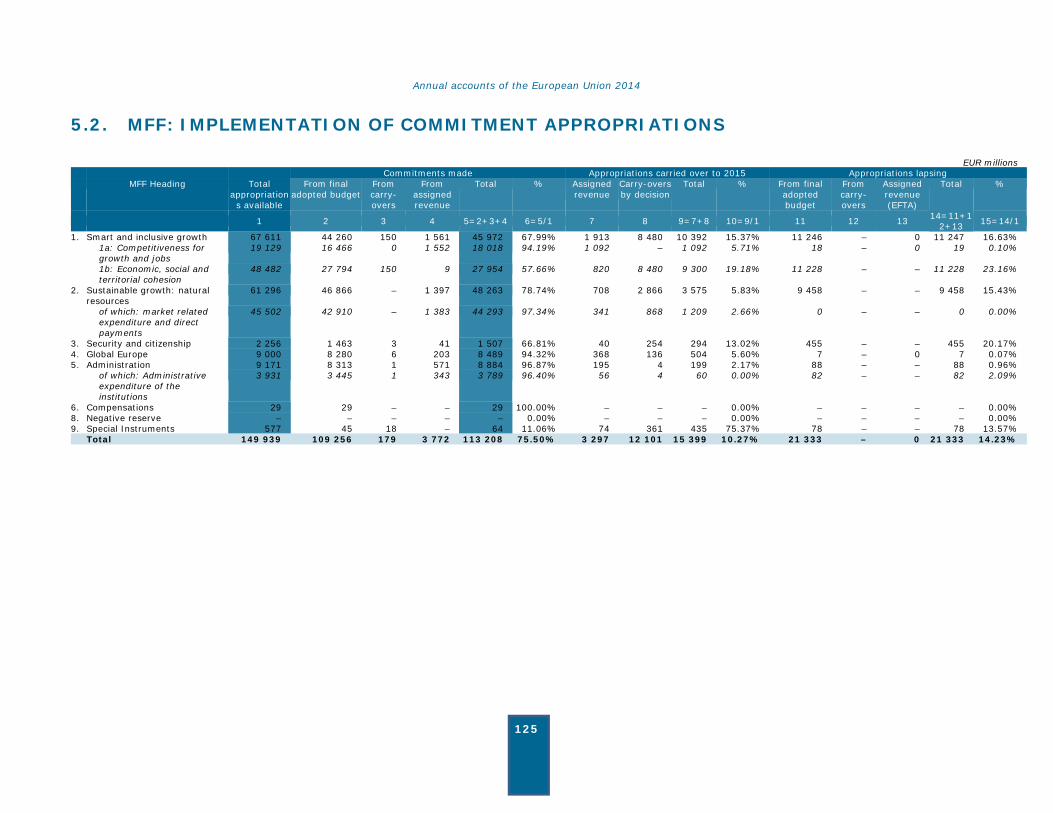
Annual accounts of the European Union 2014
125
5.2. MFF: IMPLEMENTATION OF COMMITMENT APPROPRIATIONS
EUR millions Commitments made Appropriations carried over to 2015 Appropriations lapsing MFF Heading Total
appropriations available
From final adopted budget
From carry-overs
From assigned revenue
Total % Assigned revenue
Carry-overs by decision
Total % From final adopted budget
From carry-overs
Assigned revenue (EFTA)
Total %
1 2 3 4 5=2+3+4 6=5/1 7 8 9=7+8 10=9/1 11 12 13 14=11+12+13 15=14/1
1. Smart and inclusive growth 67 611 44 260 150 1 561 45 972 67.99% 1 913 8 480 10 392 15.37% 11 246 – 0 11 247 16.63% 1a: Competitiveness for
growth and jobs 19 129 16 466 0 1 552 18 018 94.19% 1 092 – 1 092 5.71% 18 – 0 19 0.10%
1b: Economic, social and territorial cohesion
48 482 27 794 150 9 27 954 57.66% 820 8 480 9 300 19.18% 11 228 – – 11 228 23.16%
2. Sustainable growth: natural resources
61 296 46 866 – 1 397 48 263 78.74% 708 2 866 3 575 5.83% 9 458 – – 9 458 15.43%
of which: market related expenditure and direct payments
45 502 42 910 – 1 383 44 293 97.34% 341 868 1 209 2.66% 0 – – 0 0.00%
3. Security and citizenship 2 256 1 463 3 41 1 507 66.81% 40 254 294 13.02% 455 – – 455 20.17% 4. Global Europe 9 000 8 280 6 203 8 489 94.32% 368 136 504 5.60% 7 – 0 7 0.07% 5. Administration 9 171 8 313 1 571 8 884 96.87% 195 4 199 2.17% 88 – – 88 0.96% of which: Administrative
expenditure of the institutions
3 931 3 445 1 343 3 789 96.40% 56 4 60 0.00% 82 – – 82 2.09%
6. Compensations 29 29 – – 29 100.00% – – – 0.00% – – – – 0.00% 8. Negative reserve – – – – – 0.00% – – – 0.00% – – – – 0.00% 9. Special Instruments 577 45 18 – 64 11.06% 74 361 435 75.37% 78 – – 78 13.57%
Total 149 939 109 256 179 3 772 113 208 75.50% 3 297 12 101 15 399 10.27% 21 333 – 0 21 333 14.23%
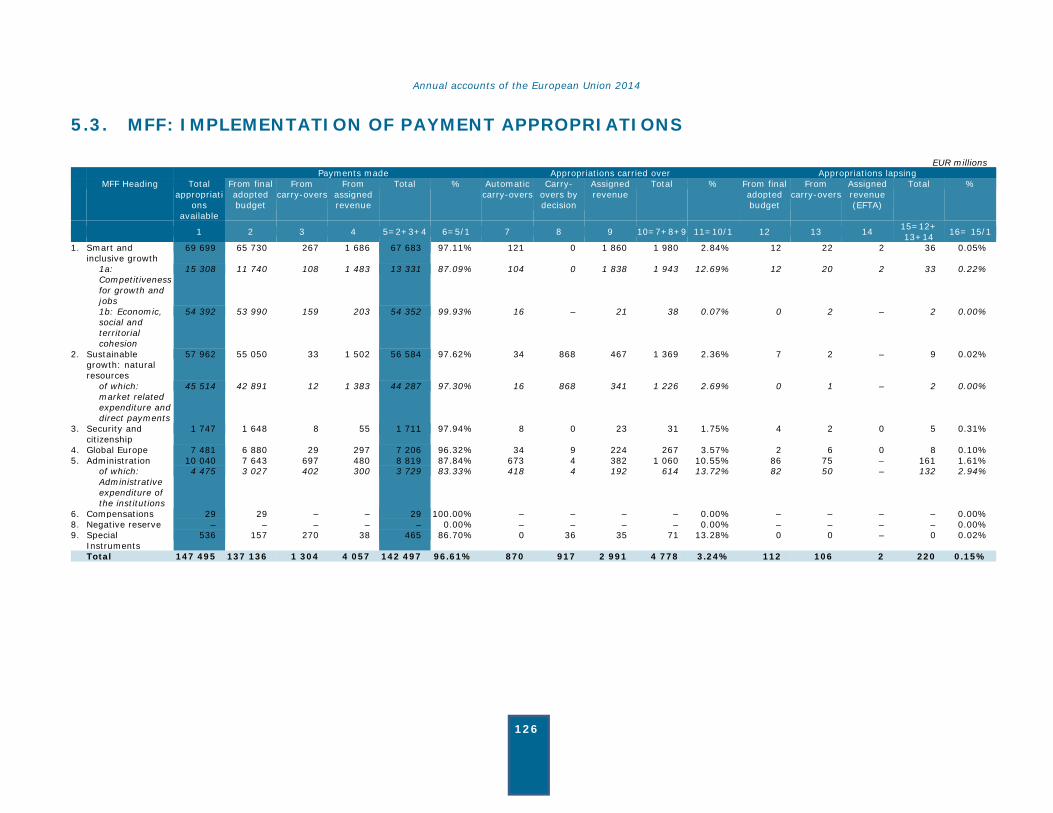
Annual accounts of the European Union 2014
126
5.3. MFF: IMPLEMENTATION OF PAYMENT APPROPRIATIONS
EUR millions Payments made Appropriations carried over Appropriations lapsing MFF Heading Total
appropriations
available
From final adopted budget
From carry-overs
From assigned revenue
Total % Automatic carry-overs
Carry-overs by decision
Assigned revenue
Total % From final adopted budget
From carry-overs
Assigned revenue (EFTA)
Total %
1 2 3 4 5=2+3+4 6=5/1 7 8 9 10=7+8+9 11=10/1 12 13 14 15=12+ 13+14 16= 15/1
1. Smart and inclusive growth
69 699 65 730 267 1 686 67 683 97.11% 121 0 1 860 1 980 2.84% 12 22 2 36 0.05%
1a: Competitiveness for growth and jobs
15 308 11 740 108 1 483 13 331 87.09% 104 0 1 838 1 943 12.69% 12 20 2 33 0.22%
1b: Economic, social and territorial cohesion
54 392 53 990 159 203 54 352 99.93% 16 – 21 38 0.07% 0 2 – 2 0.00%
2. Sustainable growth: natural resources
57 962 55 050 33 1 502 56 584 97.62% 34 868 467 1 369 2.36% 7 2 – 9 0.02%
of which: market related expenditure and direct payments
45 514 42 891 12 1 383 44 287 97.30% 16 868 341 1 226 2.69% 0 1 – 2 0.00%
3. Security and citizenship
1 747 1 648 8 55 1 711 97.94% 8 0 23 31 1.75% 4 2 0 5 0.31%
4. Global Europe 7 481 6 880 29 297 7 206 96.32% 34 9 224 267 3.57% 2 6 0 8 0.10% 5. Administration 10 040 7 643 697 480 8 819 87.84% 673 4 382 1 060 10.55% 86 75 – 161 1.61% of which:
Administrative expenditure of the institutions
4 475 3 027 402 300 3 729 83.33% 418 4 192 614 13.72% 82 50 – 132 2.94%
6. Compensations 29 29 – – 29 100.00% – – – – 0.00% – – – – 0.00% 8. Negative reserve – – – – – 0.00% – – – – 0.00% – – – – 0.00% 9. Special
Instruments 536 157 270 38 465 86.70% 0 36 35 71 13.28% 0 0 – 0 0.02%
Total 147 495 137 136 1 304 4 057 142 497 96.61% 870 917 2 991 4 778 3.24% 112 106 2 220 0.15%
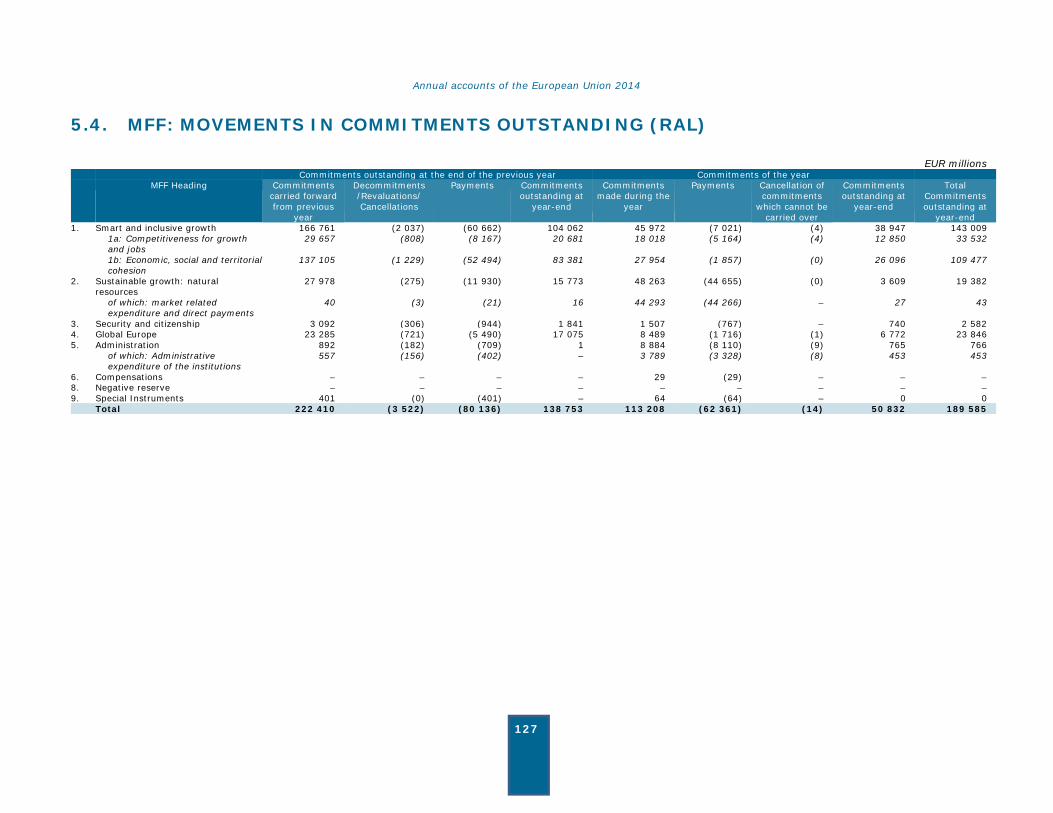
Annual accounts of the European Union 2014
127
5.4. MFF: MOVEMENTS IN COMMITMENTS OUTSTANDING (RAL)
EUR millions Commitments outstanding at the end of the previous year Commitments of the year MFF Heading Commitments
carried forward from previous
year
Decommitments /Revaluations/ Cancellations
Payments Commitments outstanding at
year-end
Commitments made during the
year
Payments Cancellation of commitments
which cannot be carried over
Commitments outstanding at
year-end
Total Commitments outstanding at
year-end 1. Smart and inclusive growth 166 761 (2 037) (60 662) 104 062 45 972 (7 021) (4) 38 947 143 009 1a: Competitiveness for growth
and jobs 29 657 (808) (8 167) 20 681 18 018 (5 164) (4) 12 850 33 532
1b: Economic, social and territorial cohesion
137 105 (1 229) (52 494) 83 381 27 954 (1 857) (0) 26 096 109 477
2. Sustainable growth: natural resources
27 978 (275) (11 930) 15 773 48 263 (44 655) (0) 3 609 19 382
of which: market related expenditure and direct payments
40 (3) (21) 16 44 293 (44 266) – 27 43
3. Security and citizenship 3 092 (306) (944) 1 841 1 507 (767) – 740 2 582 4. Global Europe 23 285 (721) (5 490) 17 075 8 489 (1 716) (1) 6 772 23 846 5. Administration 892 (182) (709) 1 8 884 (8 110) (9) 765 766 of which: Administrative
expenditure of the institutions 557 (156) (402) – 3 789 (3 328) (8) 453 453
6. Compensations – – – – 29 (29) – – – 8. Negative reserve – – – – – – – – – 9. Special Instruments 401 (0) (401) – 64 (64) – 0 0 Total 222 410 (3 522) (80 136) 138 753 113 208 (62 361) (14) 50 832 189 585

Annual accounts of the European Union 2014
128
5.5. MFF: BREAKDOWN OF COMMITMENTS OUTSTANDING BY YEAR OF ORIGIN
EUR millions MFF Heading <2008 2008 2009 2010 2011 2012 2013 2014 Total
1. Smart and inclusive growth 2 915 414 1 578 4 327 11 007 27 951 55 870 38 947 143 009 1a: Competitiveness for growth
and jobs 255 211 1 260 2 274 3 001 5 451 8 230 12 850 33 532
1b: Economic, social and territorial cohesion
2 660 203 318 2 053 8 007 22 500 47 640 26 096 109 477
2. Sustainable growth: natural resources
338 50 93 116 193 3 524 11 459 3 609 19 382
of which: market related expenditure and direct payments
0 – – 0 0 9 7 27 43
3. Security and citizenship 14 31 73 158 261 497 807 740 2 582 4. Global Europe 944 539 842 1 336 2 800 4 686 5 928 6 772 23 846 5. Administration – – – – – 0 1 765 766 of which: Administrative
expenditure of the institutions – – – – – – – 453 453
6. Compensations – – – – – – – – – 8. Negative reserve – – – – – – – – – 9. Special Instruments – – – – – – 0 0 0 Total 4 211 1 034 2 586 5 937 14 261 36 658 74 066 50 832 189 585
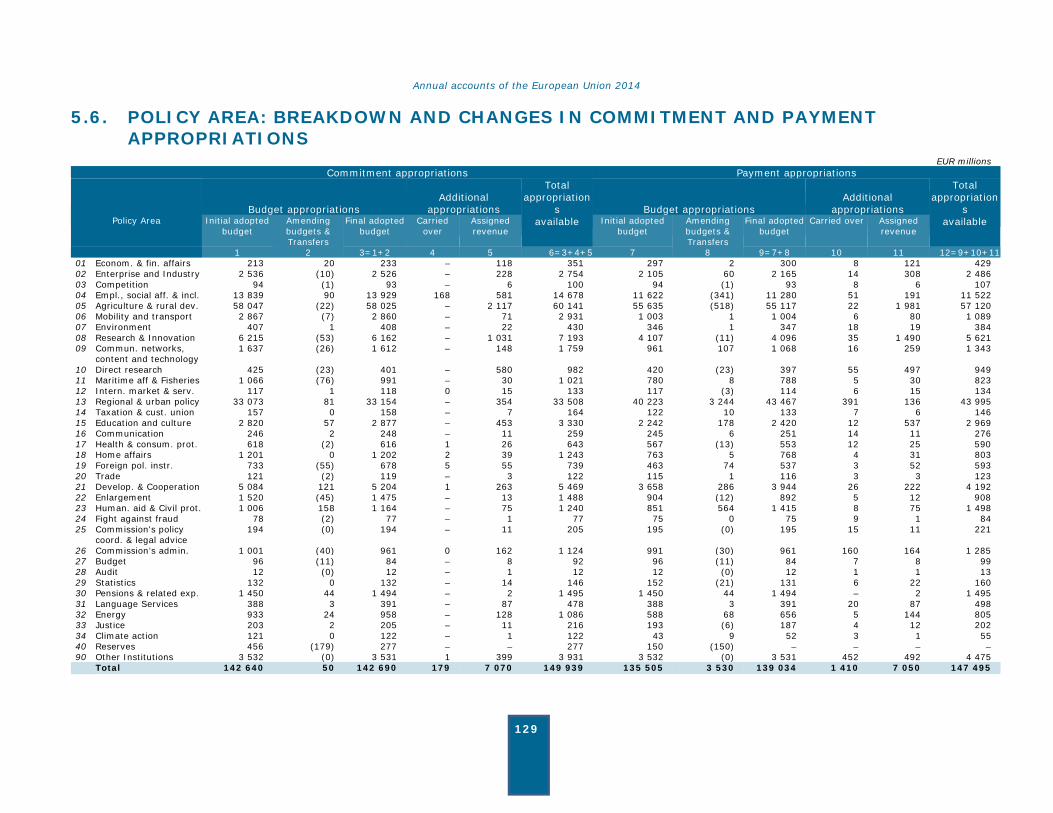
Annual accounts of the European Union 2014
129
5.6. POLICY AREA: BREAKDOWN AND CHANGES IN COMMITMENT AND PAYMENT APPROPRIATIONS
EUR millions Commitment appropriations Payment appropriations
Budget appropriationsAdditional
appropriations
Total appropriation
s Budget appropriationsAdditional
appropriations
Total appropriation
sPolicy Area Initial adopted
budget Amending budgets & Transfers
Final adopted budget
Carried over
Assigned revenue
available Initial adopted budget
Amending budgets & Transfers
Final adopted budget
Carried over Assigned revenue
available
1 2 3=1+2 4 5 6=3+4+5 7 8 9=7+8 10 11 12=9+10+11 01 Econom. & fin. affairs 213 20 233 – 118 351 297 2 300 8 121 429 02 Enterprise and Industry 2 536 (10) 2 526 – 228 2 754 2 105 60 2 165 14 308 2 486 03 Competition 94 (1) 93 – 6 100 94 (1) 93 8 6 107 04 Empl., social aff. & incl. 13 839 90 13 929 168 581 14 678 11 622 (341) 11 280 51 191 11 522 05 Agriculture & rural dev. 58 047 (22) 58 025 – 2 117 60 141 55 635 (518) 55 117 22 1 981 57 120 06 Mobility and transport 2 867 (7) 2 860 – 71 2 931 1 003 1 1 004 6 80 1 089 07 Environment 407 1 408 – 22 430 346 1 347 18 19 384 08 Research & Innovation 6 215 (53) 6 162 – 1 031 7 193 4 107 (11) 4 096 35 1 490 5 621 09 Commun. networks,
content and technology 1 637 (26) 1 612 – 148 1 759 961 107 1 068 16 259 1 343
10 Direct research 425 (23) 401 – 580 982 420 (23) 397 55 497 949 11 Maritime aff & Fisheries 1 066 (76) 991 – 30 1 021 780 8 788 5 30 823 12 Intern. market & serv. 117 1 118 0 15 133 117 (3) 114 6 15 134 13 Regional & urban policy 33 073 81 33 154 – 354 33 508 40 223 3 244 43 467 391 136 43 995 14 Taxation & cust. union 157 0 158 – 7 164 122 10 133 7 6 146 15 Education and culture 2 820 57 2 877 – 453 3 330 2 242 178 2 420 12 537 2 969 16 Communication 246 2 248 – 11 259 245 6 251 14 11 276 17 Health & consum. prot. 618 (2) 616 1 26 643 567 (13) 553 12 25 590 18 Home affairs 1 201 0 1 202 2 39 1 243 763 5 768 4 31 803 19 Foreign pol. instr. 733 (55) 678 5 55 739 463 74 537 3 52 593 20 Trade 121 (2) 119 – 3 122 115 1 116 3 3 123 21 Develop. & Cooperation 5 084 121 5 204 1 263 5 469 3 658 286 3 944 26 222 4 192 22 Enlargement 1 520 (45) 1 475 – 13 1 488 904 (12) 892 5 12 908 23 Human. aid & Civil prot. 1 006 158 1 164 – 75 1 240 851 564 1 415 8 75 1 498 24 Fight against fraud 78 (2) 77 – 1 77 75 0 75 9 1 84 25 Commission's policy
coord. & legal advice 194 (0) 194 – 11 205 195 (0) 195 15 11 221
26 Commission’s admin. 1 001 (40) 961 0 162 1 124 991 (30) 961 160 164 1 285 27 Budget 96 (11) 84 – 8 92 96 (11) 84 7 8 99 28 Audit 12 (0) 12 – 1 12 12 (0) 12 1 1 13 29 Statistics 132 0 132 – 14 146 152 (21) 131 6 22 160 30 Pensions & related exp. 1 450 44 1 494 – 2 1 495 1 450 44 1 494 – 2 1 495 31 Language Services 388 3 391 – 87 478 388 3 391 20 87 498 32 Energy 933 24 958 – 128 1 086 588 68 656 5 144 805 33 Justice 203 2 205 – 11 216 193 (6) 187 4 12 202 34 Climate action 121 0 122 – 1 122 43 9 52 3 1 55 40 Reserves 456 (179) 277 – – 277 150 (150) – – – – 90 Other Institutions 3 532 (0) 3 531 1 399 3 931 3 532 (0) 3 531 452 492 4 475
Total 142 640 50 142 690 179 7 070 149 939 135 505 3 530 139 034 1 410 7 050 147 495

Annual accounts of the European Union 2014
130
5.6.1. POLICY AREA: COMPARISON OF BUDGET AND ACTUAL COMMITMENTS
EUR millions
Policy Area Initial adopted budget
Amending budgets & transfers
Final adopted budget
Additional appropri-ations*
Total appropria-
tions available
Commitments made
01 Economic and financial affairs
213 20 233 118 351 236
02 Enterprise and Industry 2 536 (10) 2 526 228 2 754 2 608 03 Competition 94 (1) 93 6 100 97 04 Employment, social affairs
and inclusion 13 839 90 13 929 750 14 678 10 312
05 Agriculture and rural development
58 047 (22) 58 025 2 117 60 141 47 789
06 Mobility and transport 2 867 (7) 2 860 71 2 931 2 879 07 Environment 407 1 408 22 430 423 08 Research and Innovation 6 215 (53) 6 162 1 031 7 193 7 002 09 Communications networks,
content and technology 1 637 (26) 1 612 148 1 759 1 708
10 Direct research 425 (23) 401 580 982 535 11 Maritime affairs and
Fisheries 1 066 (76) 991 30 1 021 218
12 Internal market and services
117 1 118 16 133 123
13 Regional and urban policy 33 073 81 33 154 354 33 508 17 078 14 Taxation and customs union 157 – 158 7 164 160 15 Education and culture 2 820 57 2 877 453 3 330 3 223 16 Communication 246 2 248 11 259 252 17 Health and consumer
protection 618 (2) 616 27 643 624
18 Home affairs 1 201 – 1 202 41 1 243 523 19 Foreign policy instruments 733 (55) 678 61 739 687 20 Trade 121 (2) 119 3 122 120 21 Development and
Cooperation 5 084 121 5 204 264 5 469 5 353
22 Enlargement 1 520 (45) 1 475 13 1 488 1 440 23 Humanitarian aid and Civil
protection 1 006 158 1 164 75 1 240 1 187
24 Fight against fraud 78 (2) 77 1 77 77 25 Commission's policy
coordination & legal advice 194 – 194 11 205 198
26 Commission’s administration
1 001 (40) 961 162 1 124 1 070
27 Budget 96 (11) 84 8 92 89 28 Audit 12 – 12 1 12 12 29 Statistics 132 – 132 14 146 140 30 Pensions and related
expenditure 1 450 44 1 494 2 1 495 1 493
31 Language Services 388 3 391 87 478 444 32 Energy 933 24 958 128 1 086 990 33 Justice 203 2 205 11 216 209 34 Climate action 121 – 122 1 122 122 40 Reserves 456 (179) 277 – 277 – 90 Other Institutions 3 532 – 3 531 400 3 931 3 789 Total 142 640 50 142 690 7 249 149 939 113 208 * Additonal appropriations include appropriations carried over from previous year, assigned revenue and appropriations made available again following decommitments.
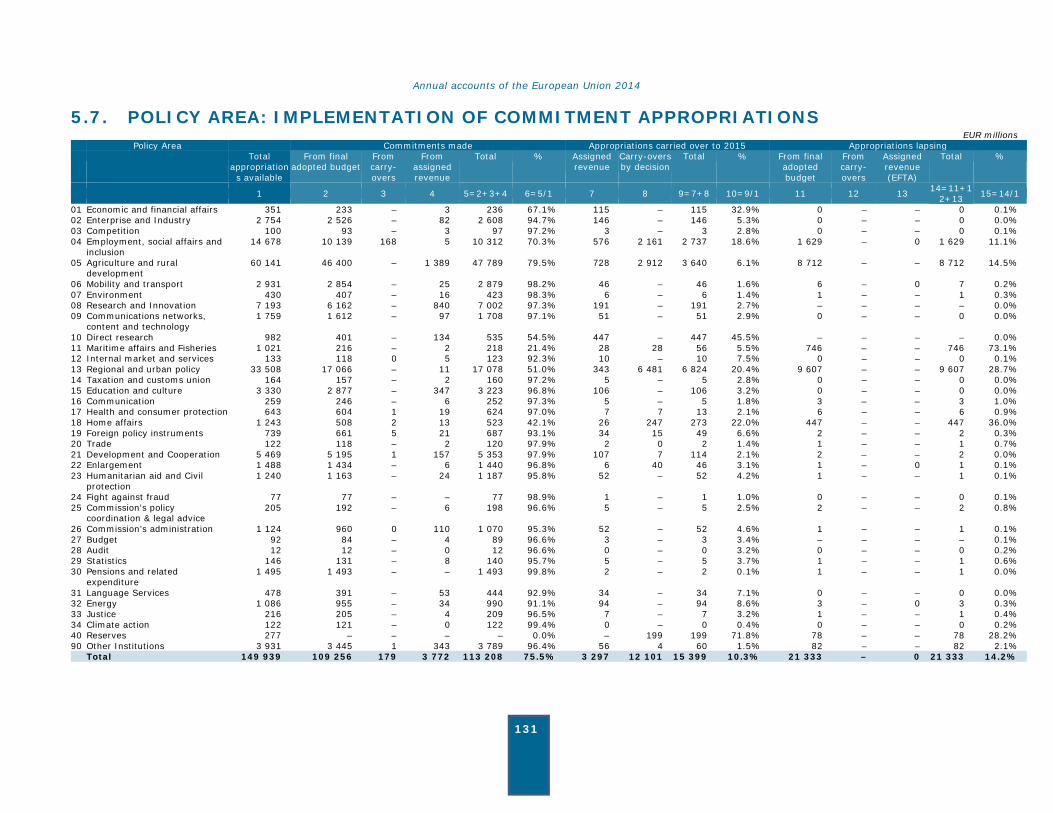
Annual accounts of the European Union 2014
131
5.7. POLICY AREA: IMPLEMENTATION OF COMMITMENT APPROPRIATIONS EUR millions
Policy Area Commitments made Appropriations carried over to 2015 Appropriations lapsing Total
appropriations available
From final adopted budget
From carry-overs
From assigned revenue
Total % Assigned revenue
Carry-overs by decision
Total % From final adopted budget
From carry-overs
Assigned revenue (EFTA)
Total %
1 2 3 4 5=2+3+4 6=5/1 7 8 9=7+8 10=9/1 11 12 13 14=11+12+13 15=14/1
01 Economic and financial affairs 351 233 – 3 236 67.1% 115 – 115 32.9% 0 – – 0 0.1% 02 Enterprise and Industry 2 754 2 526 – 82 2 608 94.7% 146 – 146 5.3% 0 – – 0 0.0% 03 Competition 100 93 – 3 97 97.2% 3 – 3 2.8% 0 – – 0 0.1% 04 Employment, social affairs and
inclusion 14 678 10 139 168 5 10 312 70.3% 576 2 161 2 737 18.6% 1 629 – 0 1 629 11.1%
05 Agriculture and rural development
60 141 46 400 – 1 389 47 789 79.5% 728 2 912 3 640 6.1% 8 712 – – 8 712 14.5%
06 Mobility and transport 2 931 2 854 – 25 2 879 98.2% 46 – 46 1.6% 6 – 0 7 0.2% 07 Environment 430 407 – 16 423 98.3% 6 – 6 1.4% 1 – – 1 0.3% 08 Research and Innovation 7 193 6 162 – 840 7 002 97.3% 191 – 191 2.7% – – – – 0.0% 09 Communications networks,
content and technology 1 759 1 612 – 97 1 708 97.1% 51 – 51 2.9% 0 – – 0 0.0%
10 Direct research 982 401 – 134 535 54.5% 447 – 447 45.5% – – – – 0.0% 11 Maritime affairs and Fisheries 1 021 216 – 2 218 21.4% 28 28 56 5.5% 746 – – 746 73.1% 12 Internal market and services 133 118 0 5 123 92.3% 10 – 10 7.5% 0 – – 0 0.1% 13 Regional and urban policy 33 508 17 066 – 11 17 078 51.0% 343 6 481 6 824 20.4% 9 607 – – 9 607 28.7% 14 Taxation and customs union 164 157 – 2 160 97.2% 5 – 5 2.8% 0 – – 0 0.0% 15 Education and culture 3 330 2 877 – 347 3 223 96.8% 106 – 106 3.2% 0 – – 0 0.0% 16 Communication 259 246 – 6 252 97.3% 5 – 5 1.8% 3 – – 3 1.0% 17 Health and consumer protection 643 604 1 19 624 97.0% 7 7 13 2.1% 6 – – 6 0.9% 18 Home affairs 1 243 508 2 13 523 42.1% 26 247 273 22.0% 447 – – 447 36.0% 19 Foreign policy instruments 739 661 5 21 687 93.1% 34 15 49 6.6% 2 – – 2 0.3% 20 Trade 122 118 – 2 120 97.9% 2 0 2 1.4% 1 – – 1 0.7% 21 Development and Cooperation 5 469 5 195 1 157 5 353 97.9% 107 7 114 2.1% 2 – – 2 0.0% 22 Enlargement 1 488 1 434 – 6 1 440 96.8% 6 40 46 3.1% 1 – 0 1 0.1% 23 Humanitarian aid and Civil
protection 1 240 1 163 – 24 1 187 95.8% 52 – 52 4.2% 1 – – 1 0.1%
24 Fight against fraud 77 77 – – 77 98.9% 1 – 1 1.0% 0 – – 0 0.1% 25 Commission's policy
coordination & legal advice 205 192 – 6 198 96.6% 5 – 5 2.5% 2 – – 2 0.8%
26 Commission’s administration 1 124 960 0 110 1 070 95.3% 52 – 52 4.6% 1 – – 1 0.1% 27 Budget 92 84 – 4 89 96.6% 3 – 3 3.4% – – – – 0.1% 28 Audit 12 12 – 0 12 96.6% 0 – 0 3.2% 0 – – 0 0.2% 29 Statistics 146 131 – 8 140 95.7% 5 – 5 3.7% 1 – – 1 0.6% 30 Pensions and related
expenditure 1 495 1 493 – – 1 493 99.8% 2 – 2 0.1% 1 – – 1 0.0%
31 Language Services 478 391 – 53 444 92.9% 34 – 34 7.1% 0 – – 0 0.0% 32 Energy 1 086 955 – 34 990 91.1% 94 – 94 8.6% 3 – 0 3 0.3% 33 Justice 216 205 – 4 209 96.5% 7 – 7 3.2% 1 – – 1 0.4% 34 Climate action 122 121 – 0 122 99.4% 0 – 0 0.4% 0 – – 0 0.2% 40 Reserves 277 – – – – 0.0% – 199 199 71.8% 78 – – 78 28.2% 90 Other Institutions 3 931 3 445 1 343 3 789 96.4% 56 4 60 1.5% 82 – – 82 2.1%
Total 149 939 109 256 179 3 772 113 208 75.5% 3 297 12 101 15 399 10.3% 21 333 – 0 21 333 14.2%
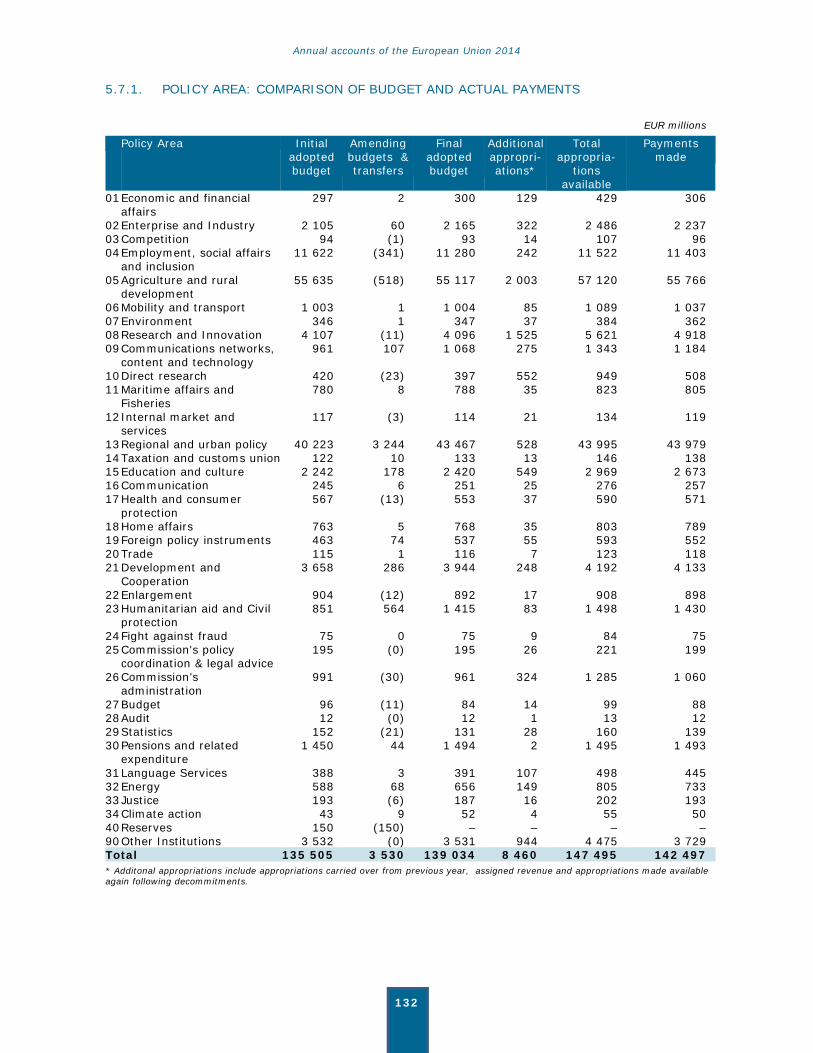
Annual accounts of the European Union 2014
132
5.7.1. POLICY AREA: COMPARISON OF BUDGET AND ACTUAL PAYMENTS
EUR millions
Policy Area Initial adopted budget
Amending budgets & transfers
Final adopted budget
Additional appropri-ations*
Total appropria-
tions available
Payments made
01 Economic and financial affairs
297 2 300 129 429 306
02 Enterprise and Industry 2 105 60 2 165 322 2 486 2 237 03 Competition 94 (1) 93 14 107 96 04 Employment, social affairs
and inclusion 11 622 (341) 11 280 242 11 522 11 403
05 Agriculture and rural development
55 635 (518) 55 117 2 003 57 120 55 766
06 Mobility and transport 1 003 1 1 004 85 1 089 1 037 07 Environment 346 1 347 37 384 362 08 Research and Innovation 4 107 (11) 4 096 1 525 5 621 4 918 09 Communications networks,
content and technology 961 107 1 068 275 1 343 1 184
10 Direct research 420 (23) 397 552 949 508 11 Maritime affairs and
Fisheries 780 8 788 35 823 805
12 Internal market and services
117 (3) 114 21 134 119
13 Regional and urban policy 40 223 3 244 43 467 528 43 995 43 979 14 Taxation and customs union 122 10 133 13 146 138 15 Education and culture 2 242 178 2 420 549 2 969 2 673 16 Communication 245 6 251 25 276 257 17 Health and consumer
protection 567 (13) 553 37 590 571
18 Home affairs 763 5 768 35 803 789 19 Foreign policy instruments 463 74 537 55 593 552 20 Trade 115 1 116 7 123 118 21 Development and
Cooperation 3 658 286 3 944 248 4 192 4 133
22 Enlargement 904 (12) 892 17 908 898 23 Humanitarian aid and Civil
protection 851 564 1 415 83 1 498 1 430
24 Fight against fraud 75 0 75 9 84 75 25 Commission's policy
coordination & legal advice 195 (0) 195 26 221 199
26 Commission’s administration
991 (30) 961 324 1 285 1 060
27 Budget 96 (11) 84 14 99 88 28 Audit 12 (0) 12 1 13 12 29 Statistics 152 (21) 131 28 160 139 30 Pensions and related
expenditure 1 450 44 1 494 2 1 495 1 493
31 Language Services 388 3 391 107 498 445 32 Energy 588 68 656 149 805 733 33 Justice 193 (6) 187 16 202 193 34 Climate action 43 9 52 4 55 50 40 Reserves 150 (150) – – – – 90 Other Institutions 3 532 (0) 3 531 944 4 475 3 729 Total 135 505 3 530 139 034 8 460 147 495 142 497 * Additonal appropriations include appropriations carried over from previous year, assigned revenue and appropriations made available again following decommitments.

Annual accounts of the European Union 2014
133
5.8. POLICY AREA: IMPLEMENTATION OF PAYMENT APPROPRIATIONS EUR millions
Policy Area Payments made Appropriations carried over Appropriations lapsing Total
appropriations
available
From final adopted budget
From carry-overs
From assigned revenue
Total % Automatic carry-overs
Carry-overs by decision
Assigned revenue
Total % From final adopted budget
From carry-overs
Assigned revenue (EFTA)
Total %
1 2 3 4 5=2+3+4 6=5/1 7 8 9 10=7+8+9
11=10/1 12 13 14 15= 12+13 +14
16=15/1
01 Economic and financial affairs 429 293 7 5 306 71.2% 7 – 116 122 28.5% 0 1 – 1 0.3% 02 Enterprise and Industry 2 486 2 144 12 81 2 237 90.0% 18 – 227 245 9.9% 3 2 – 4 0.2% 03 Competition 107 87 7 3 96 90.0% 7 – 3 10 9.5% 0 0 – 1 0.5% 04 Employment, social affairs and
inclusion 11 522 11 226 48 129 11 403 99.0% 15 36 62 112 1.0% 4 2 – 6 0.1%
05 Agriculture and rural development
57 120 54 224 20 1 522 55 766 97.6% 23 868 459 1 350 2.4% 2 2 – 4 0.0%
06 Mobility and transport 1 089 997 5 35 1 037 95.2% 5 – 44 49 4.5% 2 1 0 2 0.2% 07 Environment 384 330 18 15 362 94.5% 16 – 4 20 5.2% 1 0 – 1 0.3% 08 Research and Innovation 5 621 4 080 28 810 4 918 87.5% 16 – 680 696 12.4% – 8 – 8 0.1% 09 Communications networks,
content and technology 1 343 1 052 15 117 1 184 88.2% 16 – 142 158 11.7% 0 1 0 1 0.1%
10 Direct research 949 353 47 108 508 53.6% 43 – 389 433 45.6% – 8 – 8 0.8% 11 Maritime affairs and Fisheries 823 782 4 19 805 97.8% 3 – 11 14 1.7% 3 1 – 4 0.5% 12 Internal market and services 134 109 5 5 119 88.6% 4 – 10 14 10.1% 1 0 – 2 1.3% 13 Regional and urban policy 43 995 43 456 390 133 43 979 100.0% 11 – 3 14 0.0% 0 1 – 2 0.0% 14 Taxation and customs union 146 128 6 3 138 94.7% 4 – 3 7 5.1% 0 – – 0 0.2% 15 Education and culture 2 969 2 405 11 257 2 673 90.1% 13 – 280 293 9.9% 1 1 – 2 0.1% 16 Communication 276 241 13 4 257 93.3% 10 0 7 17 6.2% 0 1 – 1 0.5% 17 Health and consumer protection 590 543 11 17 571 96.7% 10 – 8 18 3.0% 0 2 0 2 0.3% 18 Home affairs 803 762 4 22 789 98.2% 3 – 8 12 1.5% 2 0 – 3 0.4% 19 Foreign policy instruments 593 527 2 24 552 93.2% 4 6 29 39 6.6% 0 1 – 1 0.2% 20 Trade 123 113 3 2 118 95.9% 3 – 2 5 3.9% 0 – – 0 0.3% 21 Development and Cooperation 4 192 3 917 23 193 4 133 98.6% 25 – 29 54 1.3% 1 3 – 5 0.1% 22 Enlargement 908 885 4 9 898 98.8% 6 – 3 9 1.0% 1 1 0 2 0.2% 23 Humanitarian aid and Civil
protection 1 498 1 405 8 17 1 430 95.4% 7 3 58 68 4.5% 1 0 0 1 0.1%
24 Fight against fraud 84 68 6 0 75 88.6% 7 0 1 7 8.8% 0 2 – 2 2.7% 25 Commission's policy coordination
& legal advice 221 180 13 5 199 90.1% 13 – 6 19 8.5% 2 1 – 3 1.4%
26 Commission’s administration 1 285 833 150 77 1 060 82.5% 128 – 87 215 16.7% 1 10 – 11 0.8% 27 Budget 99 79 6 3 88 89.2% 6 – 4 10 10.3% 0 0 – 1 0.5% 28 Audit 13 11 0 0 12 92.6% 0 – 0 1 6.7% 0 0 – 0 0.8% 29 Statistics 160 126 5 8 139 86.9% 5 – 15 20 12.2% – 1 – 1 0.8% 30 Pensions and related expenditure 1 495 1 493 – – 1 493 99.8% 0 – 2 2 0.1% 1 – – 1 0.0% 31 Language Services 498 377 19 49 445 89.5% 14 – 38 52 10.4% 0 1 – 1 0.2% 32 Energy 805 650 4 79 733 91.0% 5 – 63 69 8.5% 1 1 2 4 0.4% 33 Justice 202 183 3 7 193 95.1% 3 – 5 8 4.1% 1 1 – 2 0.8% 34 Climate action 55 48 2 0 50 91.1% 3 – 1 4 6.4% 1 1 – 1 2.4% 40 Reserves – – – – – 0.0% – – – – 0.0% – – – – 0.0% 90 Other Institutions 4 475 3 027 402 300 3 729 83.3% 418 4 192 614 13.7% 82 50 – 132 2.9%
Total 147 495 137 136 1 304 4 057 142 497 96.6% 870 917 2 991 4 778 3.2% 112 106 2 220 0.1%
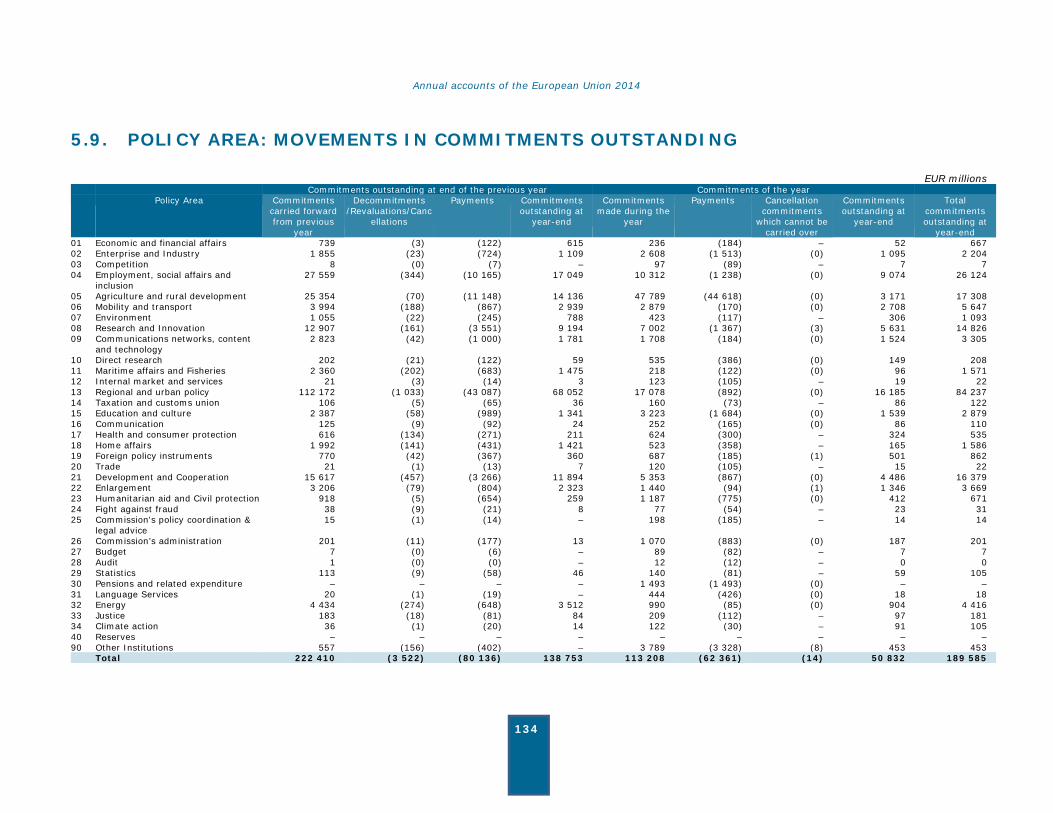
Annual accounts of the European Union 2014
134
5.9. POLICY AREA: MOVEMENTS IN COMMITMENTS OUTSTANDING
EUR millions Commitments outstanding at end of the previous year Commitments of the year Policy Area Commitments
carried forward from previous
year
Decommitments /Revaluations/Canc
ellations
Payments Commitments outstanding at
year-end
Commitments made during the
year
Payments Cancellation commitments
which cannot be carried over
Commitments outstanding at
year-end
Total commitments outstanding at
year-end 01 Economic and financial affairs 739 (3) (122) 615 236 (184) – 52 667 02 Enterprise and Industry 1 855 (23) (724) 1 109 2 608 (1 513) (0) 1 095 2 204 03 Competition 8 (0) (7) – 97 (89) – 7 7 04 Employment, social affairs and
inclusion 27 559 (344) (10 165) 17 049 10 312 (1 238) (0) 9 074 26 124
05 Agriculture and rural development 25 354 (70) (11 148) 14 136 47 789 (44 618) (0) 3 171 17 308 06 Mobility and transport 3 994 (188) (867) 2 939 2 879 (170) (0) 2 708 5 647 07 Environment 1 055 (22) (245) 788 423 (117) – 306 1 093 08 Research and Innovation 12 907 (161) (3 551) 9 194 7 002 (1 367) (3) 5 631 14 826 09 Communications networks, content
and technology 2 823 (42) (1 000) 1 781 1 708 (184) (0) 1 524 3 305
10 Direct research 202 (21) (122) 59 535 (386) (0) 149 208 11 Maritime affairs and Fisheries 2 360 (202) (683) 1 475 218 (122) (0) 96 1 571 12 Internal market and services 21 (3) (14) 3 123 (105) – 19 22 13 Regional and urban policy 112 172 (1 033) (43 087) 68 052 17 078 (892) (0) 16 185 84 237 14 Taxation and customs union 106 (5) (65) 36 160 (73) – 86 122 15 Education and culture 2 387 (58) (989) 1 341 3 223 (1 684) (0) 1 539 2 879 16 Communication 125 (9) (92) 24 252 (165) (0) 86 110 17 Health and consumer protection 616 (134) (271) 211 624 (300) – 324 535 18 Home affairs 1 992 (141) (431) 1 421 523 (358) – 165 1 586 19 Foreign policy instruments 770 (42) (367) 360 687 (185) (1) 501 862 20 Trade 21 (1) (13) 7 120 (105) – 15 22 21 Development and Cooperation 15 617 (457) (3 266) 11 894 5 353 (867) (0) 4 486 16 379 22 Enlargement 3 206 (79) (804) 2 323 1 440 (94) (1) 1 346 3 669 23 Humanitarian aid and Civil protection 918 (5) (654) 259 1 187 (775) (0) 412 671 24 Fight against fraud 38 (9) (21) 8 77 (54) – 23 31 25 Commission's policy coordination &
legal advice 15 (1) (14) – 198 (185) – 14 14
26 Commission’s administration 201 (11) (177) 13 1 070 (883) (0) 187 201 27 Budget 7 (0) (6) – 89 (82) – 7 7 28 Audit 1 (0) (0) – 12 (12) – 0 0 29 Statistics 113 (9) (58) 46 140 (81) – 59 105 30 Pensions and related expenditure – – – – 1 493 (1 493) (0) – – 31 Language Services 20 (1) (19) – 444 (426) (0) 18 18 32 Energy 4 434 (274) (648) 3 512 990 (85) (0) 904 4 416 33 Justice 183 (18) (81) 84 209 (112) – 97 181 34 Climate action 36 (1) (20) 14 122 (30) – 91 105 40 Reserves – – – – – – – – – 90 Other Institutions 557 (156) (402) – 3 789 (3 328) (8) 453 453 Total 222 410 (3 522) (80 136) 138 753 113 208 (62 361) (14) 50 832 189 585
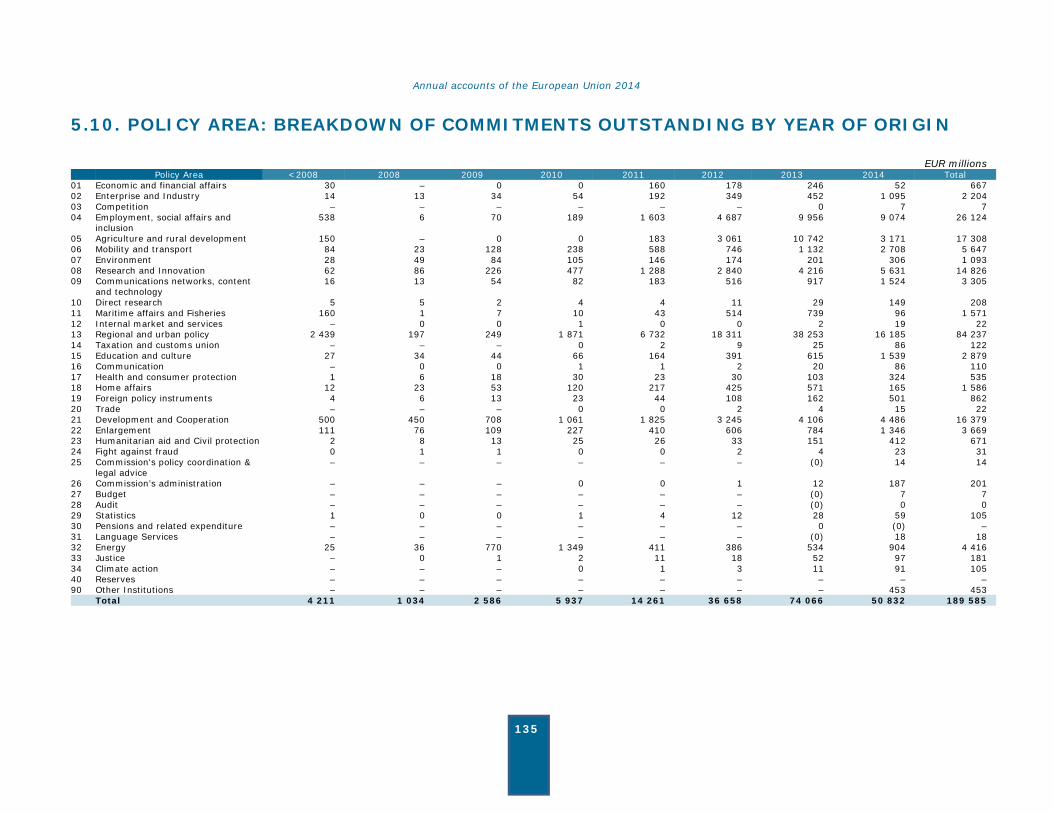
Annual accounts of the European Union 2014
135
5.10. POLICY AREA: BREAKDOWN OF COMMITMENTS OUTSTANDING BY YEAR OF ORIGIN
EUR millions Policy Area <2008 2008 2009 2010 2011 2012 2013 2014 Total
01 Economic and financial affairs 30 – 0 0 160 178 246 52 667 02 Enterprise and Industry 14 13 34 54 192 349 452 1 095 2 204 03 Competition – – – – – – 0 7 7 04 Employment, social affairs and
inclusion 538 6 70 189 1 603 4 687 9 956 9 074 26 124
05 Agriculture and rural development 150 – 0 0 183 3 061 10 742 3 171 17 308 06 Mobility and transport 84 23 128 238 588 746 1 132 2 708 5 647 07 Environment 28 49 84 105 146 174 201 306 1 093 08 Research and Innovation 62 86 226 477 1 288 2 840 4 216 5 631 14 826 09 Communications networks, content
and technology 16 13 54 82 183 516 917 1 524 3 305
10 Direct research 5 5 2 4 4 11 29 149 208 11 Maritime affairs and Fisheries 160 1 7 10 43 514 739 96 1 571 12 Internal market and services – 0 0 1 0 0 2 19 22 13 Regional and urban policy 2 439 197 249 1 871 6 732 18 311 38 253 16 185 84 237 14 Taxation and customs union – – – 0 2 9 25 86 122 15 Education and culture 27 34 44 66 164 391 615 1 539 2 879 16 Communication – 0 0 1 1 2 20 86 110 17 Health and consumer protection 1 6 18 30 23 30 103 324 535 18 Home affairs 12 23 53 120 217 425 571 165 1 586 19 Foreign policy instruments 4 6 13 23 44 108 162 501 862 20 Trade – – – 0 0 2 4 15 22 21 Development and Cooperation 500 450 708 1 061 1 825 3 245 4 106 4 486 16 379 22 Enlargement 111 76 109 227 410 606 784 1 346 3 669 23 Humanitarian aid and Civil protection 2 8 13 25 26 33 151 412 671 24 Fight against fraud 0 1 1 0 0 2 4 23 31 25 Commission's policy coordination &
legal advice – – – – – – (0) 14 14
26 Commission’s administration – – – 0 0 1 12 187 201 27 Budget – – – – – – (0) 7 7 28 Audit – – – – – – (0) 0 0 29 Statistics 1 0 0 1 4 12 28 59 105 30 Pensions and related expenditure – – – – – – 0 (0) – 31 Language Services – – – – – – (0) 18 18 32 Energy 25 36 770 1 349 411 386 534 904 4 416 33 Justice – 0 1 2 11 18 52 97 181 34 Climate action – – – 0 1 3 11 91 105 40 Reserves – – – – – – – – – 90 Other Institutions – – – – – – – 453 453 Total 4 211 1 034 2 586 5 937 14 261 36 658 74 066 50 832 189 585
Annual accounts of the European Union 2014
136
5.11. IMPLEMENTATION OF 2014 EXPENDITURE
The year 2014 was the first year of the new programming period 2014-2020.
Commitments:
The initial adopted budget for all institutions, excluding Special Instruments, set commitment appropriations at EUR 142 184 million. This represented a decrease of 6 % compared to the final 2013 budget and left a margin of EUR 445 million below the ceiling of the MFF.
The final adopted budget for commitments was implemented at a 76 % level in the first year of the new programming period mostly because of the delay in the adoption of the operational programmes for the funds under shared management. Modifications via amending budgets were negligible apart from the mobilisation of the European Union Solidarity Fund for EUR 127 million. The total implementation of EUR 109 256 million left EUR 33 434 million unused. This will be fully compensated by the reprogramming of commitments in various Funds under shared management and by the carry over to 2015.
The reprogramming of unused 2014 commitment appropriations to 2015 and 2016 (according to MFF Art. 19) was agreed in April 2015 with a revision of the MFF ceilings and a related amending budget for 2015. The main impacts in 2015 were under Heading 1(b) (EUR 11.2 billion) and Heading 2 (EUR 5 billion), while for 2016 the main change is to Heading 2 (EUR 4.4 billion).
In 2014, the low implementation of commitments at the start of new programmes led to a decrease of RAL of EUR 32.8 billion or 15 %, which is only temporary due to the magnitude of amounts re-programmed or carried forward.
Payments:
Payment appropriations were, after a cut of EUR 556 million to the Draft Budget 2014 (including Amending Letters 1 and 2), initially set at EUR 135 505 million (including Special Instruments), corresponding to 1 % of the EU's GNI. This meant a decrease of 6 % (EUR 9 billion) compared to the final adopted budget for 2013. This initial level of appropriations left a margin of only EUR 711 million below the MFF ceiling. The ceiling of payments for this first year of the new programming period was set exceptionally low, i.e. more than EUR 8 billion below 2013 and EUR 6 billion below 2015 level. It was clear from the outset that in view of the amount of outstanding commitments, the heavy pressure on payments would continue throughout 2014 with a need to revise the amount of appropriations required and very active management of the budget.
The net reinforcement of payment appropriations of operational budget lines via amending budgets amounted to EUR 3 599 million. This brought at year-end the level of payment appropriations above the ceiling of the MFF through recourse to the Contingency Margin, and the new and last-resort Special Instrument to react to unforeseen circumstances. The Council and the Parliament rejected Commission’s Global transfer proposal and used the proposed reinforcements for redeployments in the amending budgets.
The total implementation of payment appropriations was EUR 137 136 million (EUR 142 883 million in 2013) with a rate of 99 %. Once account is taken of the carryover of payment appropriations to 2015, a total of EUR 112 million lapses. From payment appropriations carried forward from 2013 an amount of EUR 106 million was cancelled.
A more detailed analysis of budgetary adjustments, their relevant context, their justification and their impact is presented in Commission's Report on Budgetary and Financial Management 2014, Part A "Overview at budget level" and Part B dealing with each heading of the multi-annual financial framework.

Annual accounts of the European Union 2014
137
6. IMPLEMENTATION OF THE INSTITUTIONS AND AGENCIES BUDGET
6.1. INSTITUTIONS: SUMMARY OF THE IMPLEMENTATION OF BUDGET REVENUE
EUR millions Institution Income appropriations Entitlements established Revenue Receipts as Outstanding
Initial adopted budget
Final adopted budget
Current year
Carried over Total On entitlements of current year
On entitlements Carried over
Total % of budget
European Parliament 156 156 173 24 197 170 4 174 111.97% 22 European Council and Council 56 56 74 7 80 70 6 76 136.61% 4 Commission 135 167 138 697 146 066 10 957 157 023 139 403 3 878 143 280 103.30% 13 743 Court of Justice 47 47 50 – 50 50 – 50 105.10% 0 Court of Auditors 20 20 20 – 20 19 – 19 98.42% – Economic and Social Committee 11 11 15 – 15 15 – 15 137.08% – Committee of the Regions 8 8 10 – 10 10 – 10 121.66% – Ombudsman 1 1 1 – 1 1 – 1 104.28% – European Data Protection Supervisor
1 1 1 – 1 1 – 1 78.02% –
European External Action Service 37 37 313 – 313 313 – 313 835.12% – 135 505 139 034 146 721 10 988 157 709 140 052 3 888 143 940 103.53% 13 769
The consolidated reports on the implementation of the general budget of the EU include, as in previous years, the budget implementation of all Institutions since within the EU budget a separate budget for each Institution is established. Agencies do not have a separate budget inside the EU budget and they are partially financed by a Commission budget subsidy.
Concerning the EEAS, it should be noted that, in addition to its own budget, it also receives contributions from the Commission of EUR 208 million (2013: EUR 210 million) and the EDF of EUR 56 million (2013: EUR 59 million). These budget credits are put at the disposal of the EEAS (as assigned revenue) so as to cover primarily the costs of Commission staff working in the EU delegations, these delegations being administratively managed by the EEAS.
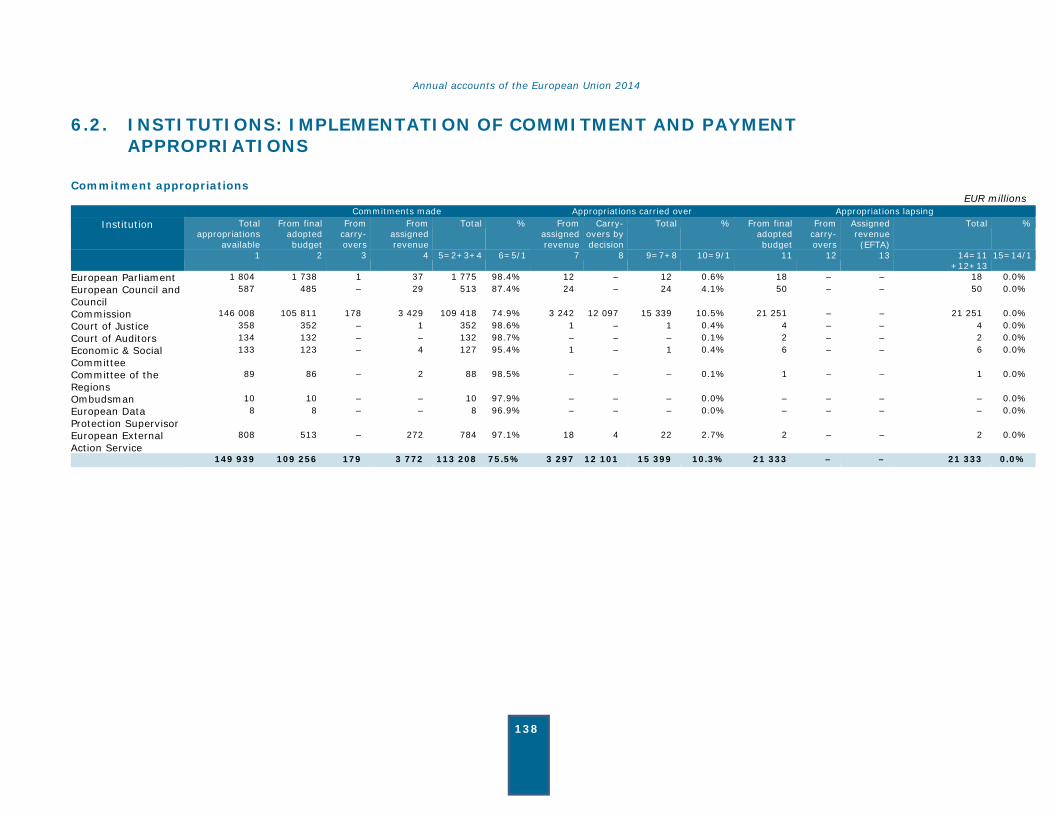
Annual accounts of the European Union 2014
138
6.2. INSTITUTIONS: IMPLEMENTATION OF COMMITMENT AND PAYMENT APPROPRIATIONS
Commitment appropriations EUR millions
Commitments made Appropriations carried over Appropriations lapsing Institution Total
appropriations available
From final adopted budget
From carry-overs
From assigned revenue
Total % From assigned revenue
Carry-overs by decision
Total % From final adopted budget
From carry-overs
Assigned revenue (EFTA)
Total %
1 2 3 4 5=2+3+4 6=5/1 7 8 9=7+8 10=9/1 11 12 13 14=11 +12+13
15=14/1
European Parliament 1 804 1 738 1 37 1 775 98.4% 12 – 12 0.6% 18 – – 18 0.0% European Council and Council
587 485 – 29 513 87.4% 24 – 24 4.1% 50 – – 50 0.0%
Commission 146 008 105 811 178 3 429 109 418 74.9% 3 242 12 097 15 339 10.5% 21 251 – – 21 251 0.0% Court of Justice 358 352 – 1 352 98.6% 1 – 1 0.4% 4 – – 4 0.0% Court of Auditors 134 132 – – 132 98.7% – – – 0.1% 2 – – 2 0.0% Economic & Social Committee
133 123 – 4 127 95.4% 1 – 1 0.4% 6 – – 6 0.0%
Committee of the Regions
89 86 – 2 88 98.5% – – – 0.1% 1 – – 1 0.0%
Ombudsman 10 10 – – 10 97.9% – – – 0.0% – – – – 0.0% European Data Protection Supervisor
8 8 – – 8 96.9% – – – 0.0% – – – – 0.0%
European External Action Service
808 513 – 272 784 97.1% 18 4 22 2.7% 2 – – 2 0.0%
149 939 109 256 179 3 772 113 208 75.5% 3 297 12 101 15 399 10.3% 21 333 – – 21 333 0.0%
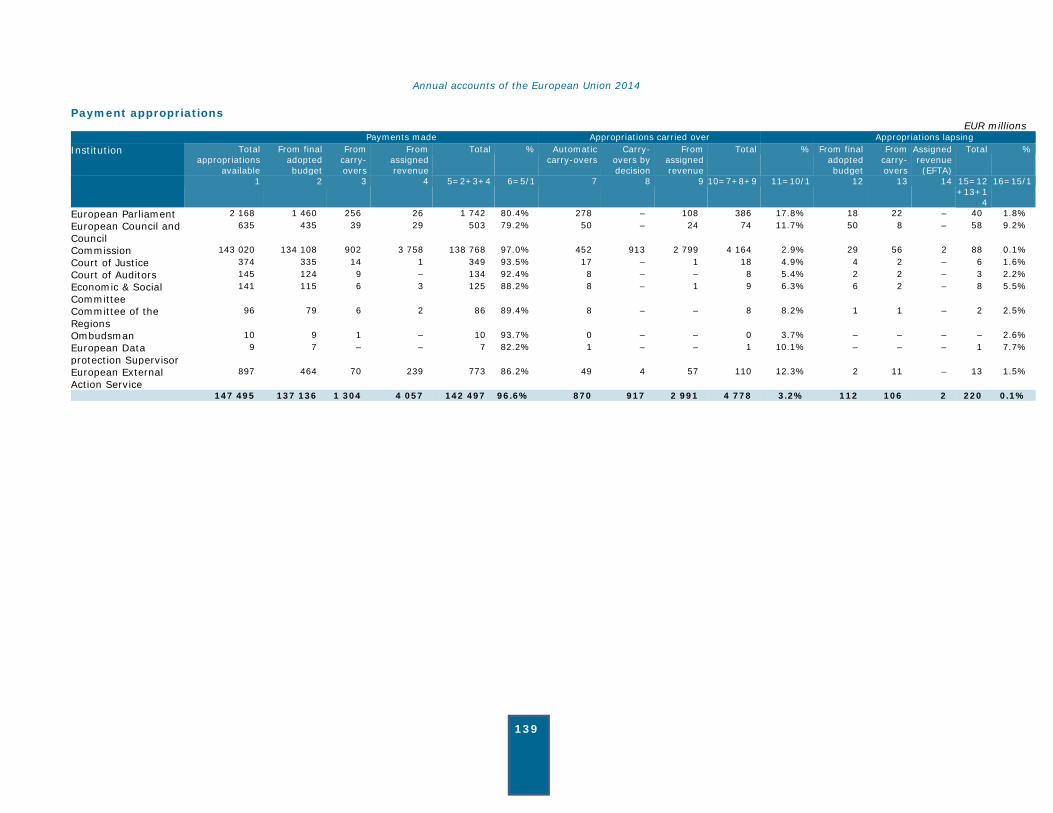
Annual accounts of the European Union 2014
139
Payment appropriations EUR millions Payments made Appropriations carried over Appropriations lapsing Institution Total
appropriations available
From final adopted budget
From carry-overs
From assigned revenue
Total % Automatic carry-overs
Carry-overs by decision
From assigned revenue
Total % From final adopted budget
From carry-overs
Assigned revenue (EFTA)
Total %
1 2 3 4 5=2+3+4 6=5/1 7 8 9 10=7+8+9 11=10/1 12 13 14 15=12 +13+1
4
16=15/1
European Parliament 2 168 1 460 256 26 1 742 80.4% 278 – 108 386 17.8% 18 22 – 40 1.8% European Council and Council
635 435 39 29 503 79.2% 50 – 24 74 11.7% 50 8 – 58 9.2%
Commission 143 020 134 108 902 3 758 138 768 97.0% 452 913 2 799 4 164 2.9% 29 56 2 88 0.1% Court of Justice 374 335 14 1 349 93.5% 17 – 1 18 4.9% 4 2 – 6 1.6% Court of Auditors 145 124 9 – 134 92.4% 8 – – 8 5.4% 2 2 – 3 2.2% Economic & Social Committee
141 115 6 3 125 88.2% 8 – 1 9 6.3% 6 2 – 8 5.5%
Committee of the Regions
96 79 6 2 86 89.4% 8 – – 8 8.2% 1 1 – 2 2.5%
Ombudsman 10 9 1 – 10 93.7% 0 – – 0 3.7% – – – – 2.6% European Data protection Supervisor
9 7 – – 7 82.2% 1 – – 1 10.1% – – – 1 7.7%
European External Action Service
897 464 70 239 773 86.2% 49 4 57 110 12.3% 2 11 – 13 1.5%
147 495 137 136 1 304 4 057 142 497 96.6% 870 917 2 991 4 778 3.2% 112 106 2 220 0.1%

Annual accounts of the European Union 2014
140
6.3. AGENCIES INCOME: BUDGET FORECASTS, ENTITLEMENTS AND AMOUNTS RECEIVED
EUR millions
Agency Final adoptedbudget
Entitlementsestablished
Amounts received
Outstanding Funding Commission Policy Area
European Agency for the Cooperation of Energy Regulators
11 11 11 – 06
European Asylum Support Office 16 13 13 0 18European Aviation Safety Agency 162 145 137 8 06 Frontex 98 87 87 (0) 18European Centre for the Development of Vocational Training
18 17 17 0 15
European Police College 9 9 9 0 18European Chemicals Agency 33 37 37 0 02 European Centre for Disease Prevention and Control
60 59 59 0 17
European Monitoring Centre for Drugs and Drug Addiction
15 16 16 – 18
European Banking Authority 34 34 34 0 12 European Insurance and Occupational Pensions Authority
22 22 22 0 12
European Environment Agency 43 53 52 1 07European Police office 84 85 85 0 18European Securities and Markets Authority 33 32 32 – 12 Community Fisheries Control Agency 9 9 9 – 11European Food Safety Authority 80 80 80 0 17 European Institute for gender equality 7 7 7 – 04Galileo Supervisory Authority 25 358 358 – 06Fusion for energy ITER 551 551 551 0 08 The European Union's Judicial Cooperation Unit (Eurojust)
34 34 34 0 33
eu.LISA 65 57 57 – 18European Maritime Safety Agency 58 58 58 0 06Office for Harmonisation in the Internal Market
194 196 196 0 12
European Medicines Agency 282 311 272 39 02 European Network and Information Security Agency
10 10 10 – 09
Office for the body of European Regulators for Electronic Communications BEREC
4 4 4 – 09
European Union Agency for Fundamental Rights
21 21 21 – 18
European Railway Safety Agency 26 26 26 0 06 European Agency for Safety and Health at Work
15 15 15 – 04
European Institute of Innovation and Technology
175 167 167 – 15
Translations Centre for the bodies of the EU
56 48 47 1 15
European Training Foundation 20 21 21 0 15Community Plant Variety Office 15 13 13 – 17 European foundation for improvement of living & working conditions
21 21 21 0 04
Education, Audiovisual and Culture Executive Agency
47 47 47 – 15
Executive Agency for Competitiveness and Innovation
24 25 25 – 06
European Research Council Executive Agency
36 36 36 0 08
Research Executive Agency 52 52 52 0 08 Executive Agency for Health and Consumers
7 7 7 – 17
European Transport Network Executive Agency
13 14 14 0 06
2 486 2 809 2 759 50
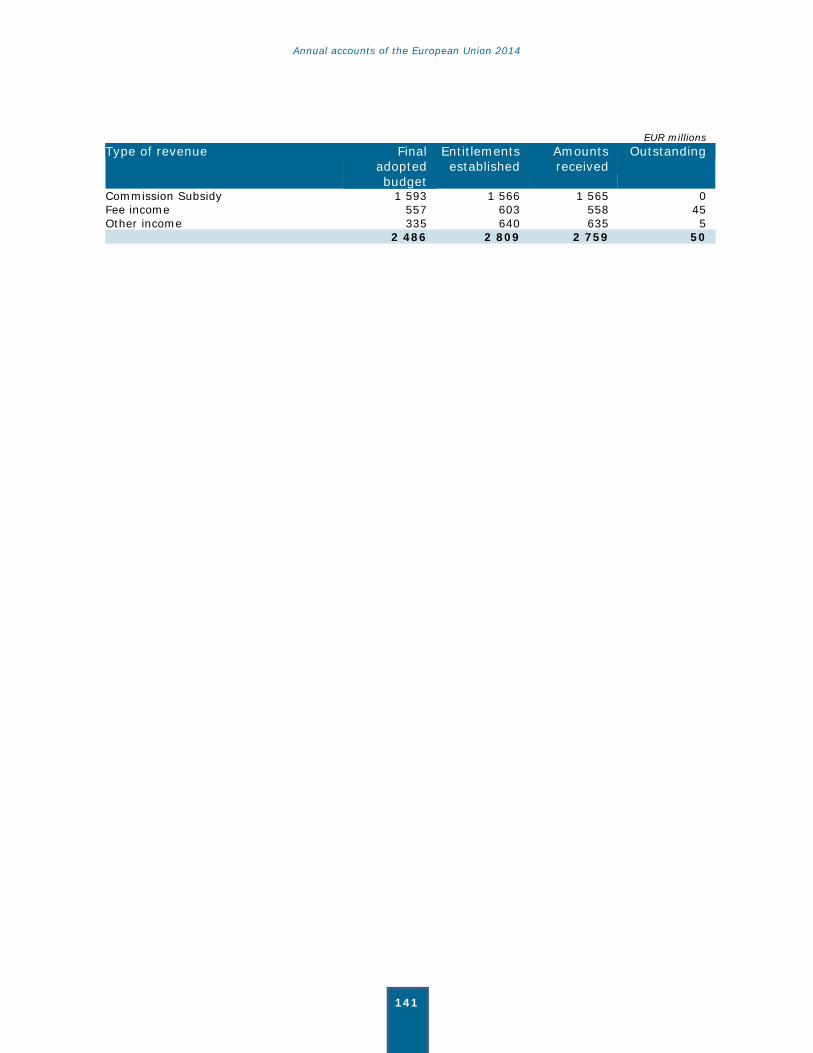
Annual accounts of the European Union 2014
141
EUR millions Type of revenue Final
adopted budget
Entitlementsestablished
Amounts received
Outstanding
Commission Subsidy 1 593 1 566 1 565 0 Fee income 557 603 558 45 Other income 335 640 635 5 2 486 2 809 2 759 50
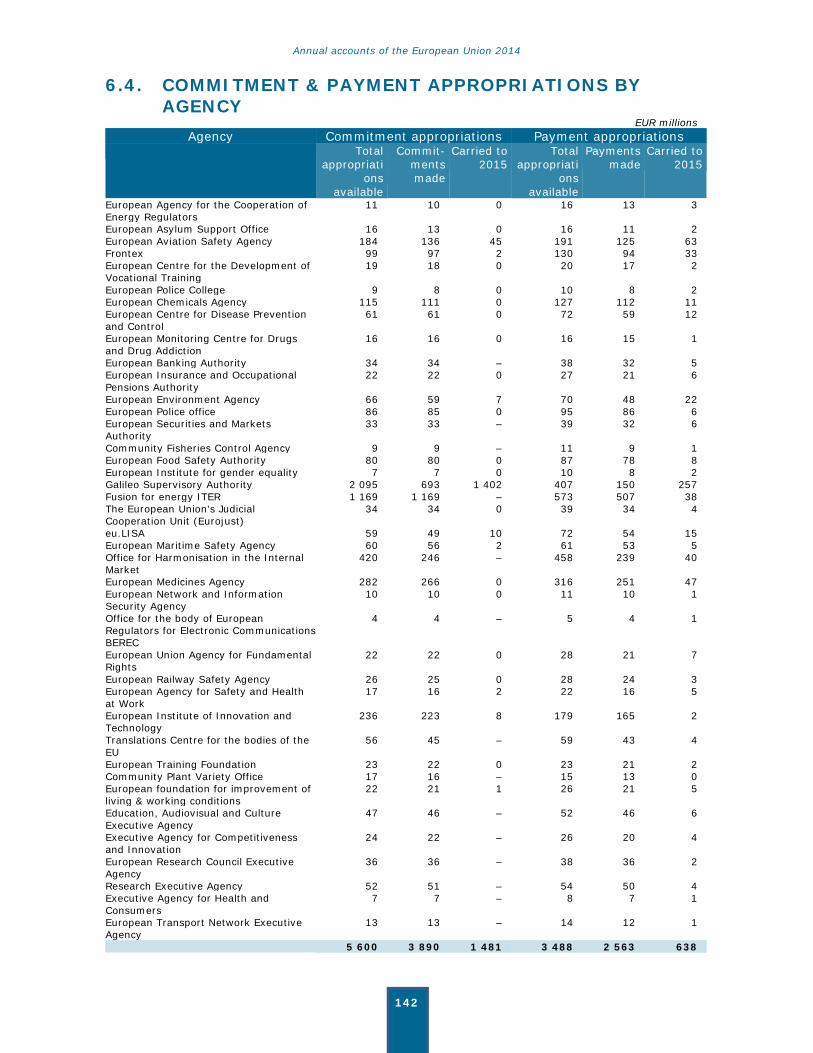
Annual accounts of the European Union 2014
142
6.4. COMMITMENT & PAYMENT APPROPRIATIONS BY AGENCY
EUR millions Agency Commitment appropriations Payment appropriations
Totalappropriati
onsavailable
Commit-mentsmade
Carried to2015
Total appropriati
ons available
Payments made
Carried to2015
European Agency for the Cooperation of Energy Regulators
11 10 0 16 13 3
European Asylum Support Office 16 13 0 16 11 2 European Aviation Safety Agency 184 136 45 191 125 63Frontex 99 97 2 130 94 33 European Centre for the Development of Vocational Training
19 18 0 20 17 2
European Police College 9 8 0 10 8 2European Chemicals Agency 115 111 0 127 112 11European Centre for Disease Prevention and Control
61 61 0 72 59 12
European Monitoring Centre for Drugs and Drug Addiction
16 16 0 16 15 1
European Banking Authority 34 34 – 38 32 5European Insurance and Occupational Pensions Authority
22 22 0 27 21 6
European Environment Agency 66 59 7 70 48 22 European Police office 86 85 0 95 86 6European Securities and Markets Authority
33 33 – 39 32 6
Community Fisheries Control Agency 9 9 – 11 9 1European Food Safety Authority 80 80 0 87 78 8 European Institute for gender equality 7 7 0 10 8 2Galileo Supervisory Authority 2 095 693 1 402 407 150 257Fusion for energy ITER 1 169 1 169 – 573 507 38The European Union's Judicial Cooperation Unit (Eurojust)
34 34 0 39 34 4
eu.LISA 59 49 10 72 54 15European Maritime Safety Agency 60 56 2 61 53 5 Office for Harmonisation in the Internal Market
420 246 – 458 239 40
European Medicines Agency 282 266 0 316 251 47 European Network and Information Security Agency
10 10 0 11 10 1
Office for the body of European Regulators for Electronic Communications BEREC
4 4 – 5 4 1
European Union Agency for Fundamental Rights
22 22 0 28 21 7
European Railway Safety Agency 26 25 0 28 24 3European Agency for Safety and Health at Work
17 16 2 22 16 5
European Institute of Innovation and Technology
236 223 8 179 165 2
Translations Centre for the bodies of the EU
56 45 – 59 43 4
European Training Foundation 23 22 0 23 21 2Community Plant Variety Office 17 16 – 15 13 0European foundation for improvement of living & working conditions
22 21 1 26 21 5
Education, Audiovisual and Culture Executive Agency
47 46 – 52 46 6
Executive Agency for Competitiveness and Innovation
24 22 – 26 20 4
European Research Council Executive Agency
36 36 – 38 36 2
Research Executive Agency 52 51 – 54 50 4Executive Agency for Health and Consumers
7 7 – 8 7 1
European Transport Network Executive Agency
13 13 – 14 12 1
5 600 3 890 1 481 3 488 2 563 638
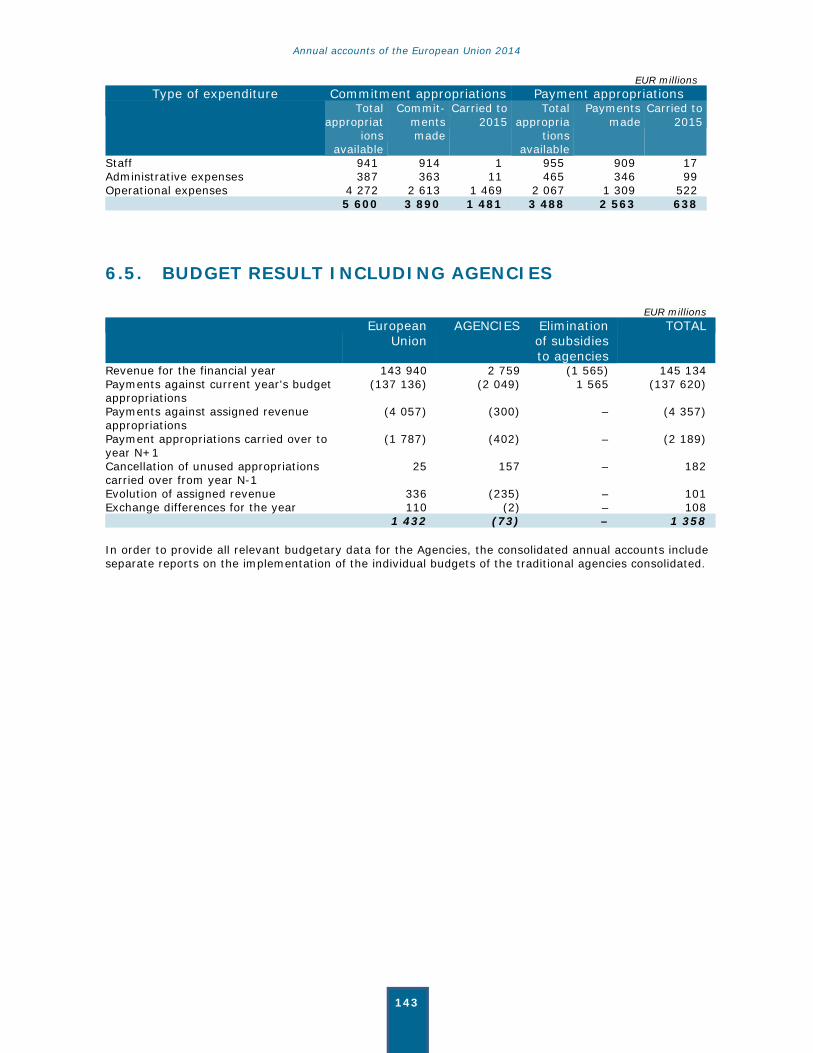
Annual accounts of the European Union 2014
143
EUR millionsType of expenditure Commitment appropriations Payment appropriations
Totalappropriat
ionsavailable
Commit-mentsmade
Carried to2015
Totalappropria
tionsavailable
Payments made
Carried to2015
Staff 941 914 1 955 909 17 Administrative expenses 387 363 11 465 346 99 Operational expenses 4 272 2 613 1 469 2 067 1 309 522 5 600 3 890 1 481 3 488 2 563 638
6.5. BUDGET RESULT INCLUDING AGENCIES
EUR millions European
Union AGENCIES Elimination
of subsidies to agencies
TOTAL
Revenue for the financial year 143 940 2 759 (1 565) 145 134 Payments against current year's budget appropriations
(137 136) (2 049) 1 565 (137 620)
Payments against assigned revenue appropriations
(4 057) (300) – (4 357)
Payment appropriations carried over to year N+1
(1 787) (402) – (2 189)
Cancellation of unused appropriations carried over from year N-1
25 157 – 182
Evolution of assigned revenue 336 (235) – 101 Exchange differences for the year 110 (2) – 108 1 432 (73) – 1 358
In order to provide all relevant budgetary data for the Agencies, the consolidated annual accounts include separate reports on the implementation of the individual budgets of the traditional agencies consolidated.