considerations for accelerometer selection when … sensors accel presentation 0116.pdf ·...
TRANSCRIPT

Considerations For
Accelerometer Selection
When Monitoring
Complex Machinery Vibration
Jeff Rybak
PCB/IMI Sensors

What Is An Accelerometer?
A sensor that measures
acceleration
Periodic Acceleration
• Varies over the duration of the
event
• Repetitive.
• Vibration of rotating
machinery such as
motors and bearings
• Periodic acceleration is the
result of continuous motion.
constant rotational speed
discontinuous motion

Types of Accelerometers
– MEMS (Variable Capacitive and Piezo-resistive)
– Piezoelectric (Voltage Mode and Charge Mode)

PCB
MEMS - What is it?
• Micro Electro Mechanical Systems
− Made of components between 1 and 100
micrometers in size
− Overall MEMS devices are 20 micrometers to 1
mm in size
• MEMS are very small mechanical devices
• Made from silicon wafers

PCB
MEMS - What’s it used for?
• Accelerometers– Air Bag Sensors
• Pressure Sensors
• Gyroscopes
• Display devices - using hundreds of thousands of mirrors on a chip
• Biomedical devices
• Consumer electronics devices (cell phones…)

MEMS Sensing TechnologyThere are two primary sensing techniques employed in MEMS
accelerometers: piezo-resistive and variable capacitive.
Piezo-resistive devices exhibit a change in resistance
with respect to applied acceleration.
These units tend to be more rugged and are used for
applications requiring higher amplitudes and higher
frequency response.
On the other hand, variable capacitive units offer higher sensitivities and are
utilized for low amplitude, low frequency applications.

2010
MEMS Sensing Technology
• MEMS DC Response
Accelerometers with a
variable capacitive
MEMS chip as the
sensing element

MEMS Sensing Technology
• MEMS DC Response
Accelerometers with a Piezo-
resistive MEMS chip as the
sensing element.

PCB
Typical Accelerometer Ranges
Piezoelectric, Piezo-resistive and Variable Capacitance
* MEMS Accelerometers Measure <1kHz

Complex Machinery Vibration
Frequencies of Interest
Measure Typical Frequency Span Typical Frequency Span
Displacement <1200 CPM <20 Hz
Displacement
Non-contact with fluid
film bearings
Velocity 600 to 60,000 CPM 10 Hz to 1000 Hz
Acceleration >60,000 CPM >1000 Hz
From Basic Machinery Vibrations by Ronald L. Eshleman
Table 1

Required Accelerometer Bandwidth
• Dependent upon speed of machine and defects we wish to capture
• Obvious Fault Frequencies are typically between 1.5Hz to 1kHz
• First few multiples of running speed
• Balance, misalignment, looseness, etc.
• First few multiples of bearing fault frequencies
• For rolling element bearings
• First few multiples of blade pass frequencies
• For pumps
• First few multiples of gear mesh frequencies
• For gearing systems
• Faults that initiate stress waves like fatigue cracks, impacting, improper
gear meshing, cavitation, etc. can excite frequencies exceeding 7kHz.
• For this reason, a typical industrial piezoelectric accelerometer will
have a frequency bandwidth of 0.5Hz to 10kHz (30 to 600,000cpm).

Piezoelectric Accelerometers
• Most commonly used sensor for monitoring machinery
vibration.

Sir Isaac Newton
(1642 - 1727)
Newton’s Three Laws of Motion
I. Every object in a state of uniform motion
tends to remain in that state of motion
unless an external force is applied to it.
II. The relationship between an object's
mass m, its acceleration a, and the
applied force F is F = ma.
III. For every action there is an equal and
opposite reaction.

• An accelerometer structure can be characterized as a single degree of freedom system that is governed by Newton’s 2nd Law of Motion, F=ma.
Seismic Mass
Sensing element, (spring) experiences
Force, F
Acceleration, a
Base of Accelerometer
Mass, m
Piezoelectric Accelerometers

Piezoelectric Effect
• Sensing element is constructed with
natural Quartz or man-made
Ceramic crystals that are coupled to
a seismic mass.
• When accelerated, the mass
causes stress on the crystal, which
results in a charge accumulating on
opposing surfaces and a
proportional electrical output signal.

The Piezoelectric Effect
• The charge then can be converted internally (Voltage
Mode) or externally (Charge Mode) to a low impedance
voltage signal and utilized by appropriate readout and
data acquisition equipment.

Three Properties of A Piezoelectric
Crystal
• It’s a Capacitor
• It’s Piezoelectric –
develops a charge
(q) relative to force
(F) applied
• It has a modulus of
elasticity (spring
constant or
stiffness)
F
F
+
-Piezoelectric
Material
V=q/C k

• High stiffness -- imparts high frequency response and long life
• High output -- clean signal, good resolution
• Stability -- negligible aging effect
• Wide temperature range
• Temperature insensitivity (Negligible pyro-electric output)
• Economical
Qualities of Crystals that
are Important for Sensors

Materials
• Two main types of piezoelectric
materials are used today:
– Quartz Crystals
– Polycrystalline Ceramic Crystals

Quartz Crystals
• Single Crystal made of SiO2 molecules
• Found naturally in the Earth
– Evolves over millions of years
– Most is of poor quality useful as
jewelry only
• Sensor Quartz is Artificially grown under
high pressure and temperature in large
autoclaves
– Very high quality
– Takes approximately 1 month
Si
O O-
-+

Quartz Crystals
• Advantages
– Naturally Piezoelectric
• Excellent long term repeatability
– Non-pyroelectric
• Works well in thermally active
environments
– Low Capacitance
• High Voltage Sensitivity (V=Q/C)
– Low Temperature Coefficient
• Little deviation over wide temperature
range
– High Stiffness
• Extremely linear

Quartz Crystals
• Disadvantages
– Limited Temperature Range
• Non-piezoelectric above 650 F (343 C)
– Low Charge Output (2.2pC/N)
• Not effective in low-noise, charge-amplified
systems
– Limited Geometry
• Can only cut crystal in certain number of
ways and still remain piezoelectric

Quartz Accelerometers- Advantages
• Longer term stability - No change in senstivity over
time
• Lower thermal transient senstivity - Better for
thermally active Environments
• Lower temperature coefficient - Less change in
sensitivity over temperature
• Uses voltage Amplifier- Better for Extreme IEPE
temperatures -320 ºF to 325 ºF (-196 ºC to 163 ºC)

Ceramic Crystals
• Man-made material
• Lead-Zirconate Titanate, Barium Titanate, Lead
Metaniobate
• Polycrystalline structure
– Naturally isotropic (physical and electrical
properties the same in all directions)
– Naturally non-piezoelectric
– Becomes piezoelectric through high voltage
process known as“Poling”

Ceramic Crystals Polarization Process (Poling)
An extremely high voltage placed on the polycrystalline ceramic causes the dipoles to align themselves.
BEFOREPOLING
AFTERPOLING
+
-
+
-

• Advantages
– High Charge Output (350pC/N)
• Excellent for use with tests requiring high
sensitivity and/or low-noise, charge-amplified
systems
– Unlimited Geometry
• “Poling” occurs after shaping
• Versatility for different sensor designs: plates,
annular tubes, cones, etc...
– High Temperature Range
• Operating temperatures: >1000 F (>540 C)
Ceramic Crystals

Piezo-Ceramic Accelerometers
• Advantages
– Better resolution and frequency response
than comparable size quartz accelerometers
– Easier to make smaller higher resolution
accelerometers
– Can use different crystal geometries for
different shear designs
– Higher charge output for use in Charge Mode
Systems

• Disadvantages
– Pyroelectric
• Unwanted output generated by a thermal input
– Only an issue below 0.5Hz
– Shear design eliminates this problem
– High temperature coefficient
• Change in sensitivity over temperature
– Correction charts provided
– Artificially Polarized
• Exhibit temporary/permanent changes under large
mechanical, thermal or electrical shock
• Electrical characteristics change over time
– Crystal Pre-Aging eliminates this problem
Piezo-Ceramic Accelerometers

Add a Mass to Make an
Accelerometer
• Newton’s 2nd Law, F = ma
– When the mass is accelerated, it
produces a force on the crystal
– A larger mass = more force,
higher output (higher sensitivity),
and a lower natural frequency
(lower frequency range)
– A smaller mass = less force,
less output (lower sensitivity),
and a higher natural frequency
(higher frequency range)
PC crystal (k)
mass
Accelerometer

• These piezoelectric crystals can be
cut and stressed in different ways:
– Shear
– Flexural
– Compression
Crystal Structures

Accelerometer Designs
Flexural beam design
Compression design
Tri-shear design

Compression Mode

Flexural Mode

Accelerometer, Shear Mode

How the Vibration is Sensed• Piezoelectric Accelerometer
– Simple single degree-of-freedom device which
converts the acceleration aspect of motion into
a proportional electrical signal
• Linear Acceleration
Amplitude
Signal Output
is: mV per g
(mV per m/s2)

Accelerometer
Base
Piezoelectric
Element
Seismic
Mass
Preload
Ring (SMAR)
Accelerometer ConstructionPCB’s “Tri-Shear” Design

Voltage Mode vs Charge Mode
• Piezoelectric accelerometers: Two Types
• In each type the high impedance charge signal is
converted to a low impedance time varying voltage
signal
• Type 1 -Accelerometers with built in electronics or IEPE
(Internal Electronic Piezoelectric) generic or ICP® (PCB
Trademark) - Impedance conversion is done internally in
the accelerometer (Voltage Mode).
• Type 2 - Charge output - Impedance conversion is done
externally to accelerometer (Charge Mode).

CHARGE MODE SYSTEM• System Schematic
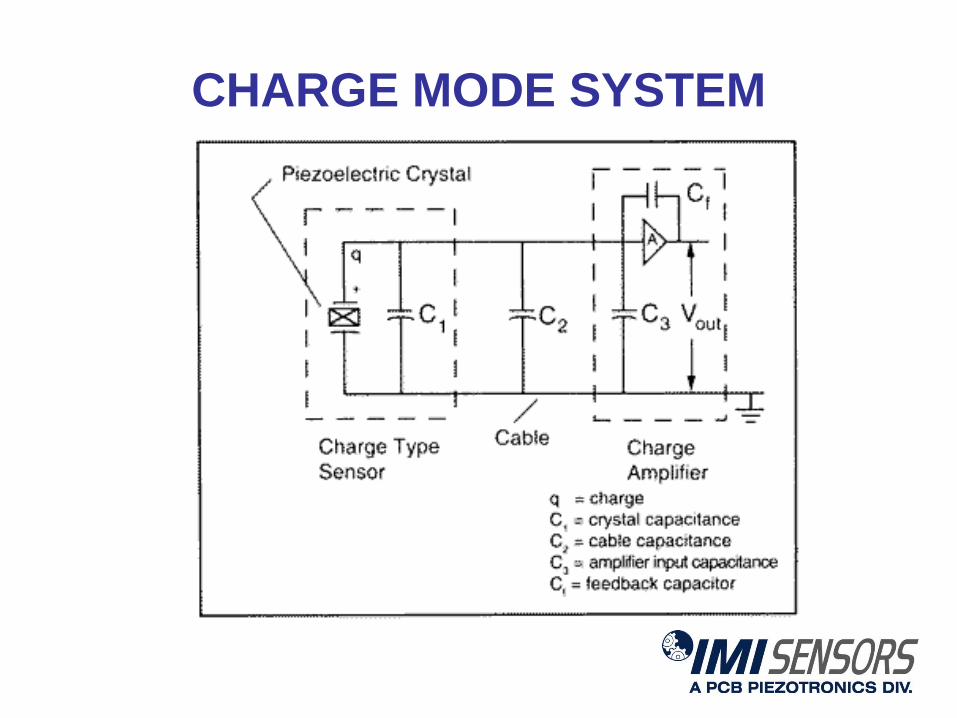
CHARGE MODE SYSTEM
CHARGE MODE SYSTEM
Advantages
High temperature range (1000 F / 540 C)
Amplitude range, low frequency limit, and signal normalization can be adjusted at the charge amplifier- Very flexible
Disadvantages
High output impedance signal
Requires low noise cable easily corrupted by EMI and RFI
Often requires expensive charge amplifiers and low-noise cables
All high impedance components must be kept dry and clean
Signal/noise limited by cable length
Difficult to use in contaminated environments
Higher per Channel Cost than IEPE Type Systems.

Charge Mode Accelerometers
• Removing the charge amplifier from the
high temperature environment and utilizing
hard-line cable allows the accelerometer
to withstand as much as 1300°F.

IEPE (ICP®)
VOLTAGE MODE SYSTEM

IEPE (ICP®)
VOLTAGE MODE SYSTEM

APPLICATIONS OF CHARGE and VOLTAGE MODE SYSTEMS
• Charge Mode
• High Temperature Testing
• Engine Studies, Steam Pipe Vibration, Gas Turbine Monitoring
• Voltage Mode (IEPE)
• Almost Everything Else
• Modal Analysis, Cryogenic, Shock, Machinery Monitoring, Seismic, High Frequency, Structural Testing, Flight Testing, Underwater, Human Vibration, Package Testing

IEPE Temperature Limitations
• Typical IEPE industrial accelerometers are
limited to 250°F (temperature limit of
silicon).
• Higher temperature electronics now allow
us to withstand up to 325°F.

Piezoelectric (Dynamic)
Accelerometers
• Operates using the piezoelectric effect
• Use natural quartz crystals or artificially polarized polycrystalline ceramics (PZT)
• Crystals produce an electrical charge that is proportional to the force applied
• Generally used with a built in amplifier IEPE(ICP®) for low impedance voltage output
• Most commonly used sensor for monitoring machinery vibration.
• ICP® is a registered trademark of PCB Group, Inc.

Why Measure Vibration
• It’s the best overall indicator of machine
health
• Works on the widest range of machines &
faults

Maintenance Strategies
• Breakdown (Run To Failure)
• Preventive (Time Based)
• Predictive (Condition Based)
• Proactive (Correction & Root Cause)

Predictive (Condition-Based)
Maintenance
• Vibration Analysis
• Infrared Thermography
• Ultrasonic Analysis
• Oil particle Analysis
• Motor Current Analysis
Why Do It?
• Reduce unscheduled downtime
• Improve uptime
• Reduce catastrophic failures
• Improve production scheduling reliability
• Reduce maintenance costs
• Reduce spare parts inventory
• Reduce insurance costs (in some cases)

Common Faults Found with
Vibration Analysis
• Unbalance
• Misalignment
• Looseness
• Bearing faults
• Gear faults
• Oil whirl
• Oil whip
• Aerodynamic
• Resonance
• Loose Footing
• Critical speed
• Cavitation
• Recirculation
• Rubs
• Broken rotor bars
• Eccentric rotor
• Stator faults
• Shaft bow

The PdM Process
• Identify machines and points to be monitored (develop a route or continuously monitor)
• Determine the measurements to be made
• Setup alarm levels for the points
• Measure vibration at a periodic interval
• Trend the data
• Analyze the points that exceed the alarms to determine the fault using:– Time waveform analysis
– FFT (spectrum) analysis
– HFE analysis (Spike Energy®, PeakVue®, demodulation, etc)
– Severity charts and specifications

Data Collection Systems
• Walk Around
– Uses a portable data collector
• With magnetically mounted sensor or
• With permanently mounted sensors and a
junction box
• On-line (continuous) monitoring
– Surveillance
– Protection (with fast shut down capability)
– Plant systems
• PLC, DCS, SCADA, PI with 4-20 mA
output sensors and vibration transmitters

Accelerometer Selection

What do you want to measure?
• Acceleration, velocity, or displacement measurements
– An accelerometer provides a signal proportional to acceleration
– If velocity or displacement measurement is desired, there are sensors available
with additional circuitry that integrates the acceleration signal into velocity or
displacement.
• Single axis, bi-axial, or tri-axial measurements
– Some applications, such as vertical pumps, are ideally monitored in more than
one axis of vibration. Does your application require uni-axial, bi-axial or tri-axial
measurement?
• ICP® raw vibration or 4-20 mA transmitter measurements
– Vibration can be monitored with accelerometers that provide raw vibration data
or transmitters which provide the calculated overall RMS vibration.
• Vibration Analysis or Control System Interface?
• Temperature measurements– Both ICP® (IEPE) accelerometers and 4-20 mA transmitters are available with the
temperature output option.

Accelerometer Selection
• What is the amplitude of vibration?
• What is the frequency of vibration?
• What is the temperature of the environment?
• Will it be submersed in liquid?
• Will it be exposed to any potentially harmful chemicals or
debris?
• Do you prefer a top exit, side exit, or a low profile Swiveler®
• Should you use a precision or low cost sensor?
• Do you need any special approvals?

What is the amplitude of vibration?
• The maximum amplitude of the vibration being measured
will determine the range of the sensor that can be used.
• Typical sensitivities for ICP® accelerometers are 100
mV/g for a standard application (50 g range) and 500
mV/g for a low frequency or low amplitude application
(10 g range).
• General industrial applications with 4-20 mA transmitters
commonly use a range of 0-1 in/s or 0-2 in/s.

What is the frequency of vibration?
• Piezoelectric materials, by nature, act as high pass filters and as a
result, even the best piezoelectric sensor will have a low frequency
limit near 0.2 Hz.
• Sensors have natural frequencies where the signal is greatly
amplified and possible saturation can occur.
• To combat saturation caused by exciting sensor resonance, most
industrial accelerometers have single or double pole RC filters.
• It is critical to select a sensor with a usable frequency range that
includes all frequencies of vibration you are interested in measuring.
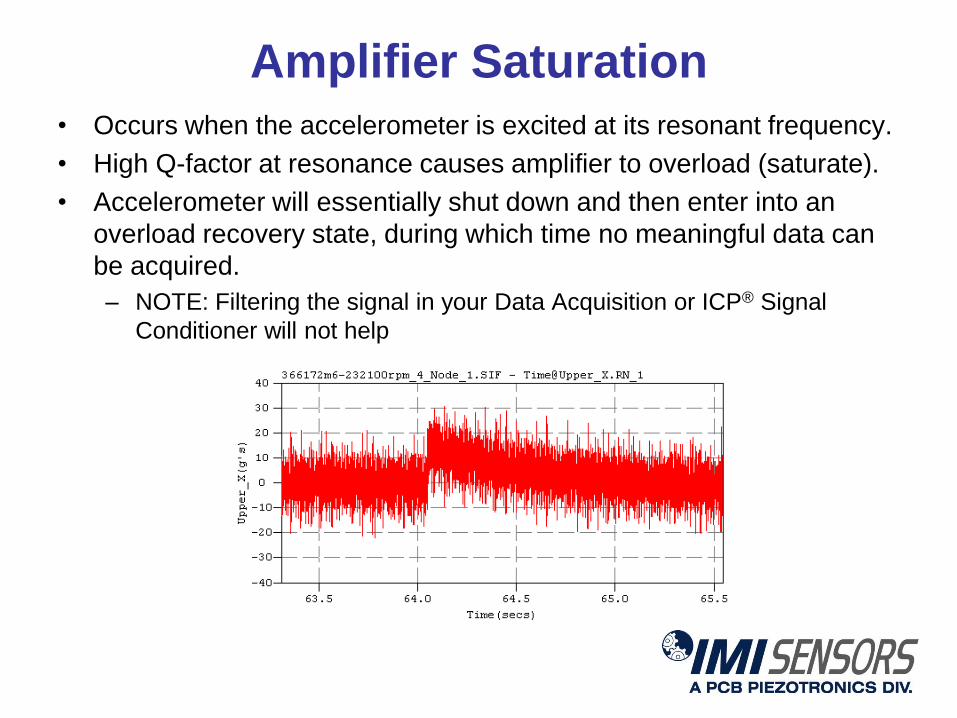
Amplifier Saturation
• Occurs when the accelerometer is excited at its resonant frequency.
• High Q-factor at resonance causes amplifier to overload (saturate).
• Accelerometer will essentially shut down and then enter into an
overload recovery state, during which time no meaningful data can
be acquired.
– NOTE: Filtering the signal in your Data Acquisition or ICP® Signal
Conditioner will not help
Filtered ICP® Accelerometers
1. Extend the usable high frequency range.
2. Minimize the possibility of amplifier
saturation.
There are two reasons to use filtered accelerometers:

What does the filter do?
• The filter is typically a “low-pass” type, which attenuates (suppresses) signal generation near the resonant frequency of the sensor.
• This counter-acts the gain, or Q-factor, that is caused by the accelerometer’s mechanical resonance.
• PCB uses either a single pole, or two-pole filter.

Which filter style should be used?
• A single-pole (-6dB/octave), low-pass filter is used primarily for
extending the usable frequency range, or when the size of the
sensor prevents a two-pole from being used.
• A two-pole (-12dB/octave), low-pass filter is better for preventing
amplifier saturation.
• PCB uses two styles of electronic amplifiers in its ICP®
accelerometers:
– Charge amplifiers (used more with ceramic crystal
accelerometers)
– Voltage amplifiers (used exclusively with quartz crystal
accelerometers)
• Filters can be added to both types of amplifiers and the results are
the same.

Single Pole Filter Effect
• Blue line shows behavior
without filter.
• Red line shows behavior
with filter.
• Purple line shows filter
only behavior.
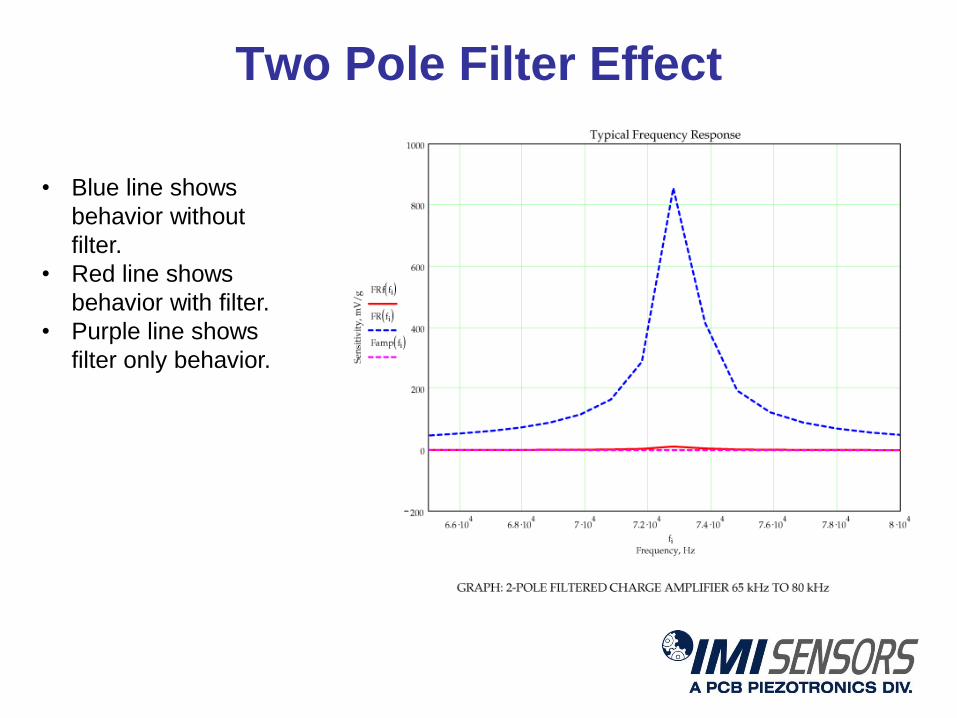
Two Pole Filter Effect
• Blue line shows
behavior without
filter.
• Red line shows
behavior with filter.
• Purple line shows
filter only behavior.

Two Pole Filter Effect
Calibration Certificate for
model 352B30, which
includes a two pole
electrical filter

What is the temperature of the
environment?
• Extremely high temperature applications can pose a threat to the electronics
built into ICP® accelerometers and 4-20 mA transmitters.
• IMI Sensors offers “HT” or high temperature versions of both ICP® and 4-20
mA sensors. – For very high temperature applications such as steam pipe monitoring, charge mode
accelerometers are available.
• Charge mode accelerometers do not have built in electronics like ICP®
sensors, but instead have remotely located charge amplifiers.
• For ultra-high temperature applications above 500 F, such as gas turbine
vibration monitoring, charge mode accelerometers with integral hard-line
cable are available.

Will it be submersed in liquid?
• IMI’s industrial accelerometers with integral polyurethane
cable are completely submersible in liquid for permanent
installation to depths corresponding up to 1,000 PSI.
• If the application is not completely submersed but
sprayed, such as cutting fluid on machine tools, integral
cable is normally recommended as well.

Will it be exposed to any potentially
harmful chemicals or debris?
• IMI’s industrial accelerometers are constructed with stainless steel
bodies to be corrosion and chemical resistant.
• If your application is located in an environment with harmful
chemicals, consider using PTFE cable with corrosion resistant boot
connectors.
• For cables that may come into contact with debris such as cutting
chips or workers’ tools, integral armor jacketed cables offer excellent
protection.

Do you prefer a top exit, side exit, or
a low profile Swiveler®
• Ultimately, the sensor you select will need to be installed on your
equipment in the space available.
• Sensors are available with top and side exit connectors or integral
cables.
• IMI’s patented Swiveler® design is one of the lowest profile
industrial accelerometers available; the locknut design allows the
sensor to be oriented in any direction prior to installation which is
especially favorable when working with integral cable.

Should you use a precision or low
cost sensor?
• Precision accelerometers typically receive a full calibration sweep.
• Low cost accelerometers receive a single point calibration.
• Precision accelerometers have tighter tolerances on some
specifications such as sensitivity and frequency ranges.
– A precision accelerometer may have a nominal sensitivity of 100
mV/g ± 5% (95-105mV/g), while a low cost accelerometer may
have a sensitivity of 100 mV/g ± 10% (90-110 mV/g).

Do you need any special approvals?
• Both ICP® accelerometers and 4-20 mA transmitters are
available with CSA and ATEX approvals for use in
hazardous areas.
• Many applications in the Energy market require various
levels of hazardous area approval.

Performance Specifications

Sensitivity• By design, piezoelectric accelerometers are intended to generate an
electrical signal when they are subjected to acceleration. This response is termed the sensitivity and is primarily expressed in the following units:
– mV/g
– mV/(m/s2)
– pC/g
– pC/(m/s2)

Sensitivity
– Typically 10, 100, 500 mV/g• Tolerance ±5, ± 10, or ± 15%
– 100 mV/g is the most typical sensitivity for industrial monitoring
– Maximum output is 5 v so the range for a 100 mV/g sensor is 50 g
– Calibration shows actual measured sensitivity• Low cost - single point calibration @ 100 Hz
• Precision - have full calibration

Measurement Range
• How much output may be obtained during a reading.
Positive Swing:
Supply Voltage – 1 Volt (for cc Diode) – Non-Linear Region - Sensor Bias Voltage
Bias Voltage is the baseline --------------------------------------
Negative Swing:
Bias Voltage – 2 Volts (readings below 2 volts may be poor)

VB = Sensor Bias Voltage = 10 VDC
VS1 = Supply Voltage 1 = 24 VDC
VE1 = Excitation Voltage 1 = VS1 -1 = 23 VDC
• - non-linear portion
• Output Signal (+10V / -8V)
VS2 = Supply Voltage 2 = 18 VDC
VE2 = Excitation Voltage 2 = VS2 -1 = 17 VDC
• Output Signal (+7V / -8V)
Bias Voltage Varies from 8VDC to 14VDC
(Voltage swing can be compromised)
Specified amplifier range = +/- 5 Volts
Actual max. amp. range = +/- 10 Volts
Measurement Range

Frequency Range
• Sensors respond to all frequencies
– High frequency response– Mechanical structure of sensor
– Mounting plays a significant role
– Cable driving may also affect signal
– Low frequency response– Sensor Discharge Time Constant
– System Coupling Time Constant

Frequency Range
• Ideal accelerometer treats frequencies of interest
the same.
Mounted Resonant Frequency (fr )
Rel
ativ
e A
mp
litu
de
5% limit 0.2 fr
3 dB limit 0.5 fr
f/fm
Sensitivity Deviationvs.
Frequency
Usable Freq. Range
10% limit 0.3 fr

High Frequency Response
• The upper frequency range of an accelerometer is dependent upon its overall mass, the stiffness of the sensing element, and the amount of damping, if any. The structure will resonate, or ring, at its natural frequency.
Seismic Mass
Frequency
AmplItude
oNatural Frequency
Damping Effect

Mounted Resonant Frequency
• The mounted resonant frequency for an
accelerometer takes into account the
additional mass and stiffness associated
with the mounting technique used to
connect it to the structure under test.

• Stud mount (w/ Silicone grease)
• Stud mount (w/o Silicone grease)
• Magnet mount (w/ Silicone grease)
• Magnet mount (w/o Silicone grease)
• Hand Probe
Mounting Frequency Response
Amplit udeDeviat ion
Tit le: Summary Magnet mount (w/ silicone grease)
Magnet mount (w/o silicone grease)
Hand Probe
10 100 1000Freq. Hz 10000
0
-3 dB
+3 dB
St ud mount (w/ silicone grease)
St ud mount (w/o silicone grease)
Note: Numbers are for reference only. Actual FR of
similar mounts can vary widely.

Mounting Frequency Response
• The following plots show the frequency
and phase response of various mounts as
measured with a lab calibration system
– Stud mounted
– 0.75”, 15# pull flat magnet
– 0.75”, 15# pull 2-rail (curved surface) magnet
– 4” Stainless steel probe (stinger)
• Photo of probe

603C01 – 1” Mounting Pad – Stud Mounted
Phase Response
-180 °
-130 °
-80 °
-30 °
20 °
70 °
120 °
170 °
1.0 Hz 10.0 Hz 100.0 Hz 1000.0 Hz 10000.0 Hz 100000.0 Hz
Frequency Response
REF1
-20.0 dB
-15.0 dB
-10.0 dB
-5.0 dB
0.0 dB
5.0 dB
10.0 dB
15.0 dB
20.0 dB
1.0Hz 10.0Hz 100.0Hz 1000.0Hz 10000.0Hz 100000.0Hz
Frequency Response (5%) = 3772 Hz
Frequency Response (3 dB) = >15 kHz
90° Phase Shift = 7983 Hz

603C01 – 1” Mounting Pad – 0.75” Flat Magnet
Phase Response
-180 °
-130 °
-80 °
-30 °
20 °
70 °
120 °
170 °
1.0 Hz 10.0 Hz 100.0 Hz 1000.0 Hz 10000.0 Hz 100000.0 Hz
Frequency Response
REF
1
-20.0 dB
-15.0 dB
-10.0 dB
-5.0 dB
0.0 dB
5.0 dB
10.0 dB
15.0 dB
20.0 dB
1.0Hz 10.0Hz 100.0Hz 1000.0Hz 10000.0Hz 100000.0Hz
Frequency Response (5%) = 1918 Hz
Frequency Response (3 dB) = 3949 Hz
90° Phase Shift = 5692 Hz

603C01 – 1” Mounting Pad – 0.75” Curved Surface Magnet
Phase Response
-180 °
-130 °
-80 °
-30 °
20 °
70 °
120 °
170 °
1.0 Hz 10.0 Hz 100.0 Hz 1000.0 Hz 10000.0 Hz 100000.0 Hz
Frequency Response
REF
1
-20.0 dB
-15.0 dB
-10.0 dB
-5.0 dB
0.0 dB
5.0 dB
10.0 dB
15.0 dB
20.0 dB
1.0Hz 10.0Hz 100.0Hz 1000.0Hz 10000.0Hz 100000.0Hz
Frequency Response (5%) = 1554 Hz
Frequency Response (3 dB) = 3350 Hz
90° Phase Shift = 12380 Hz

603A01 with 4” Steel Probe
Phase Response
-180 °
-130 °
-80 °
-30 °
20 °
70 °
120 °
170 °
100.0 Hz 1000.0 Hz 10000.0 Hz 100000.0 Hz
Frequency Response
REF
1
-20.0 dB
-15.0 dB
-10.0 dB
-5.0 dB
0.0 dB
5.0 dB
10.0 dB
15.0 dB
20.0 dB
100.0Hz 1000.0Hz 10000.0Hz 100000.0Hz
Frequency Response = 715 Hz
Low Frequency Response
• Low frequency response of an accelerometer is determined by the electrical characteristics of the measurement system.
• Piezoelectric accelerometers are inherently AC coupled and will not respond to DC. (MEMS accelerometers can)
• The following terms are inherent to piezoelectric (PE) accelerometers:
– AC Coupling
– Discharge Time Constant
– High Pass Filter
– Low Frequency Roll-off

Low Frequency Response
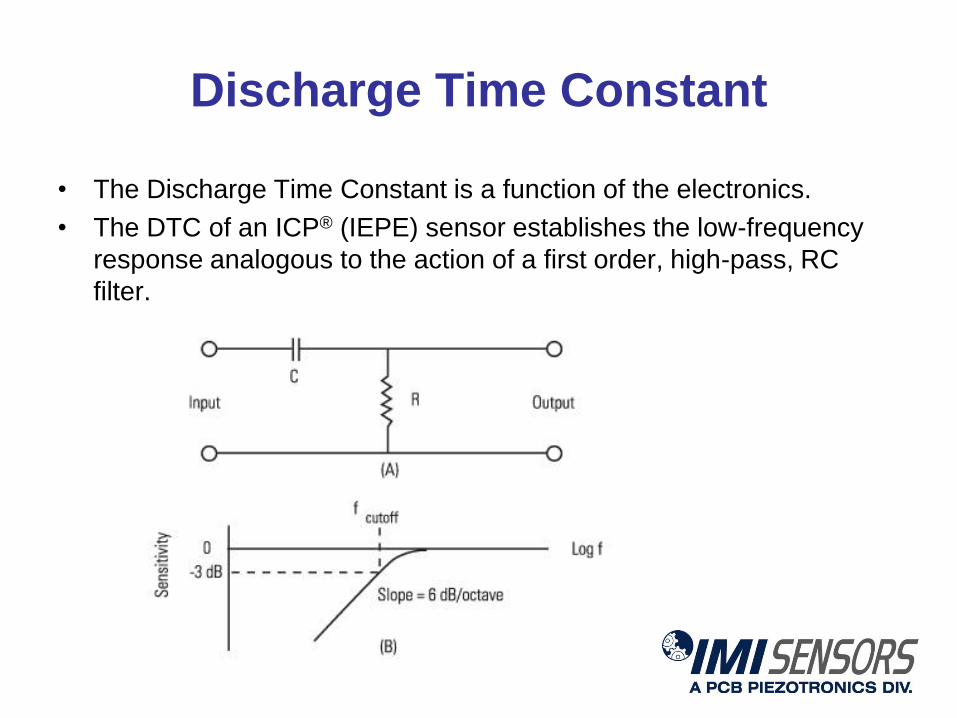
• Since the DTC is essentially a first-order high pass filter, the frequency response
profile of the filter will look something like this:
0-3 dB
Slope = -6 dB/octave
G
a
I
n
Frequency
• The relationship between DTC and the attenuation at various frequencies can be represented by the following:
f-5% = 0.5/DTC
f-10% = 0.34/DTC
f-3dB = 0.16/DTC

Sensor Low Frequency Response
DTC
(sec)
Frequency (Hz)
-5% -10% -3dB
.1 5 3.4 1.6
.5 1 .68 .32
1 .5 .34 .16
5 .1 .07 .03
10 .05 .03 .016

Resonant Frequency of
Accelerometer
Sensitivity
Frequency
0.004 pC/ms -2
3.16 pC/ms -2
31.6 pC/ms-2
13 kHz
28 kHz 180 kHz
54 kHz
8.4 kHz
3.9 kHz
Decreasing seismic mass
• Determined by mass and rigidity of design

• How low can we measure?
• Electrical characteristic
– ICP® - Noise floor of internal electronics
– Charge – Noise of the external charge amplifier
• For Accelerometers
– Broadband – the average lowest level over a frequency range.
– Spectral – The resolution at a specified frequency.
• Generally, measure x10 above resolution to stay out of electrical noise.
Resolution (Noise Floor)
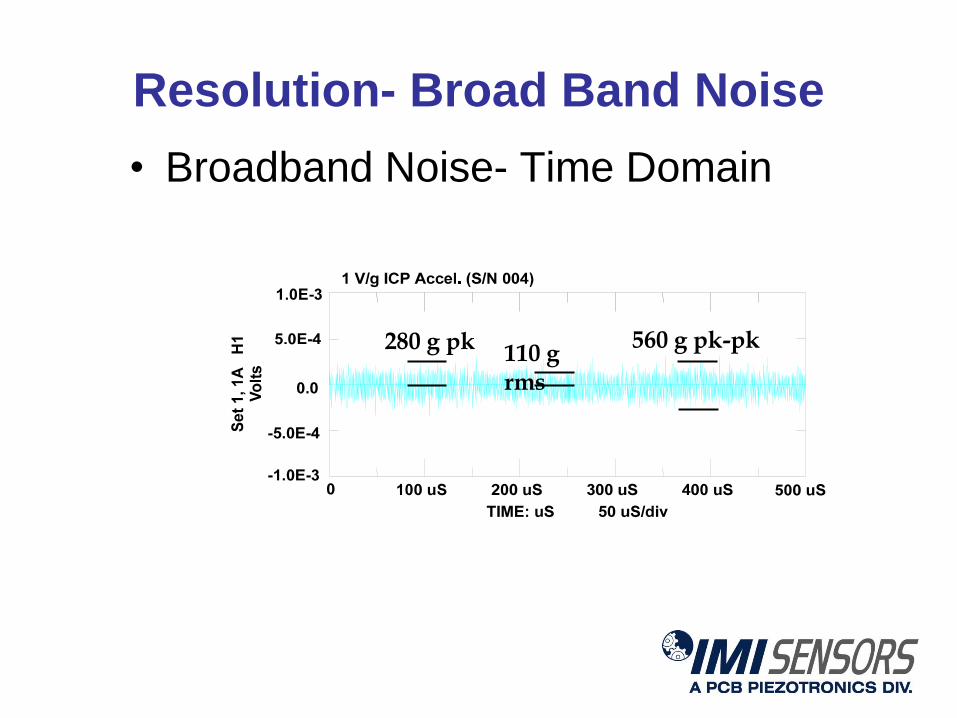
Resolution- Broad Band Noise
• Broadband Noise- Time Domain
280 g pk110 g rms
560 g pk-pk

Resolution- Broad Band Noise
• Rotating Machinery
– Vibration Alert Levels and Running Speed?
– 600RPM to 10,000RPM
• 0.1 ips-peak
– 100RPM
• 0.02 ips-peak (380µg rms)
• S/N Ratio of 5 (minimum)
• 80µg resolution (broadband)
Model: 625B02
Low Frequency Industrial
ICP® Accelerometer

Resolution- Broadband Noise
• PCB measures broadband noise between
1 Hz and 10 kHz.
– More noise is present in lower frequencies.
• Some competitors will start their
measurements at 5 Hz or 10 Hz.
– By starting the measurement at a higher
frequency the sensor could appear to have a
“better” noise floor.

Non-linearity
• Defined as % of F.S.O and determined as the best fit
straight line through the zero:

Transverse Sensitivity
• Represents the output of the accelerometer if an
acceleration is applied at 90 degrees of the most sensitive
axis.

• At PCB, all accelerometers are tested for
transverse sensitivity.
• Transverse sensitivity is caused by:
– Misalignment of parts
– Improper mounting of the sensor
(flatness, perpendicularity)
Transverse Sensitivity

Environmental Specifications

• Sensors can also go into an “over-load” condition
without damage
– However, it may take sensor anywhere from
10 microseconds to 24 hours for the sensor to
re-stabilize.
– This depends on:
• Type of overload
– Electronic or Mechanical overload
– Ceramic destabilization - “jitter” or
“noise”
• Amount of overload
Overload Limit (Shock)

• Caused by:
– Magnetic mounting
– Dropping the sensor
– Impacting nearby
– Careless installation or removal
• Factors involved:
– Pulse duration (Frequency content)
• Metal to Metal vs. Softer material
– ‘g’ level
Overload Limit (Shock)

• Test Set-up
MAGNETIC MOUNTING
“SNAP” METHOD “ROCKING” METHOD
Shock Protection

Temperature Range
- the ideal working range of the sensor.
• Most ICP® sensors are: - 73 to 135°C (-100 to + 275°F)
• Most charge sensors are:- 240 to +204°C (-400 to +400°F)
• High Temperature Ranges Available- 357C9X…ie 357C90… 650°C (1,200 °F)

Temperature Response
(Coefficient)
– the % change in sensitivity per degree change in
temperature
• Usually 0.054%/°C (0.03%/°F)
• For every 100°C temperature change, sensitivity
will change 5.4%

Temperature Precautions
• Thermal Transients can cause signal drift
– Expansion of the parts surrounding the
sensing element cause changes in preload
– Changes in Preload result in change in
sensitivity, thus possible drift.
• Sensors with longer DTC are susceptible
to Signal drift.
• Shear design eliminates thermal transient
response.

Enclosure RatingIP Ratings (Ingress Protection)
A two-digit number established by the International Electro Technical Commission representing different forms of environmental influence:• The first digit represents protection against ingress of solid objects.• The second digit represents protection against ingress of liquids.• The larger the value of each digit, the greater the protection.
IP..First digit: Second digit:
Ingress of solid objects Ingress of liquids
0 No protection No protection
1Protected against solid objects over 50mm e.g. hands, large tools.
Protected against vertically falling drops of water or condensation.
2Protected against solid objects over 12.5mm e.g. hands, large tools.
Protected against falling drops of water, if the case is disposed up to 15 from vertical.
3Protected against solid objects over 2.5mm e.g. wire, small tools.
Protected against sprays of water from any direction, even if the case is disposed up to 60from vertical.
4Protected against solid objects over 1.0mm e.g. wires.
Protected against splash water from any direction.
5Limited protection against dust ingress.
Protected against low pressure water jets from any direction. Limited ingress permitted.
(no harmful deposit)
6 Totally protected against dust ingress.Protected against high pressure water jets from any direction. Limited ingress permitted.
7 N/AProtected against short periods of immersion in water.
8 N/AProtected against long, durable periods of immersion in water.
9k N/AProtected against close-range high pressure, high temperature spray downs.

Electrical Specifications

Settling Time
– The amount of time that a sensor must be
powered before a measurement can be made
– The higher the DTC, the longer the settling
time.
• A conservative rule of thumb to follow is that a
settling time of 10 times the discharge time
constant will allow the signal to decay to within 1%
of the output bias.
– Typically 2 to 10 seconds
– This is of concern when running routes with
permanently mounted sensors

Discharge Time Constant
After a step change in measurand, the DTC is the time required for a sensor or measurement system to discharge its signal to 37% of the original step input value.
There is a direct relationship between DTC and low frequency response.
-The longer the DTC, the lower the frequency of measure
Discharge Time Constant
• The Discharge Time Constant is a function of the electronics.
• The DTC of an ICP® (IEPE) sensor establishes the low-frequency
response analogous to the action of a first order, high-pass, RC
filter.

Excitation Voltage

Constant Current Excitation
• The electronics within ICP accelerometers require excitation power from a
constant-current regulated, DC voltage source. – This power source is sometimes built into vibration meters, FFT analyzers, and vibration data
collectors. A separate signal conditioner is required when none is built into the readout.
• The constant current may vary between 2 and 20 mA.– A constant current value of 4 mA is typical for most devices.
– Higher adjustments can be made to drive longer cable runs.

Output Impedance
• ICP® (IEPE) accelerometers have
very low output impedance (<150Ω)
– This improves S/N and ability to
drive signal over hundreds of
feet of cable through harsh
environments.
• The maximum frequency that can be
transmitted over a given cable length
can be calculated or obtained from
this nomograph.
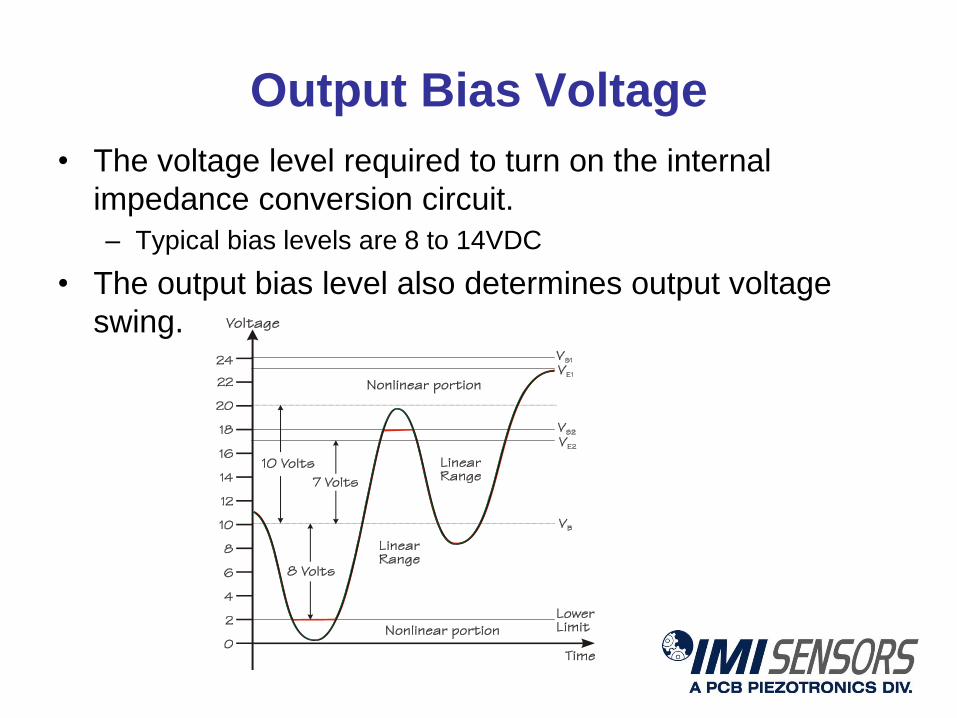
Output Bias Voltage
• The voltage level required to turn on the internal
impedance conversion circuit.
– Typical bias levels are 8 to 14VDC
• The output bias level also determines output voltage
swing.

Spectral Noise
• How low can one measure?
• Electrical characteristic
– ICP® - Noise floor of internal electronics
– Charge – Noise of the external charge amplifier
• For Accelerometers
– Broadband – the average lowest level over a frequency range.
– Spectral – The resolution at a specified frequency.
• Generally, measure x10 above resolution to stay out of electrical noise.

Spectral Noise
Log Hz1 10k
-
100
rms
-
180
Hz
dB
V
-128 dB/Hz
-143 dB/Hz
-151 dB/Hz
-107 dB/Hz = 5 ug for a typical 1 V/g sensor

Electrical Isolation
• Ground isolated accelerometers have the
electrical components isolated from the
case and are much less susceptible to
ground induced noise.
• A typical electrical isolation value is
>100MOhms

• Base Isolation
– Isolates ground from test object
• Engine monitoring, testing electric motors
• Reduces potential for ground loops
• Reduces electrical interference generated by
“noisy” test objects
Electrical Base Isolation

• Case Isolation
– Fully isolates and surrounds element
• Predictive maintenance, seismic studies,
generators
• Reduces potential for ground loops
• Reduces electrical interference generated by
“noisy” test objects
• Provides filtering of environmental noise (RFI)
Electrical Case Isolation
Physical Specifications

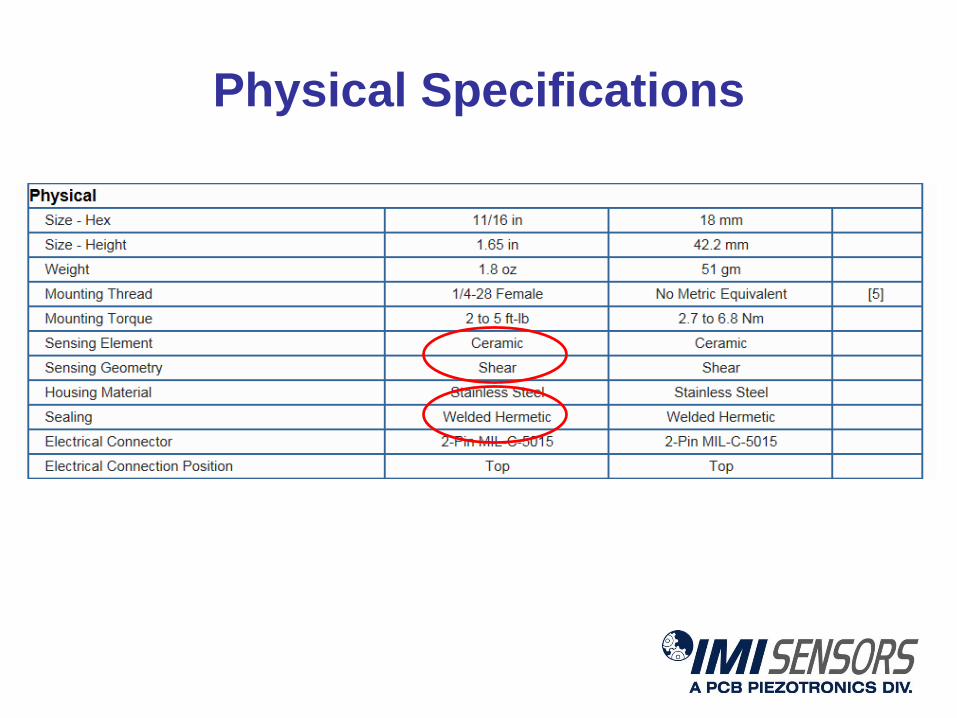
Physical Specifications
• Ceramic Sensing Element
– Higher charge per unit force than quartz
• More sensitivity and better resolution
• Shear Sensing Geometry
– Lower base strain sensitivity
– Lower transverse sensitivity
– Lower thermal transient response
• Welded Hermetic Sealing
– Preserves insulation resistance and sensitivity tolerance

Who is IMI Sensors?
• IMI stands for Industrial Monitoring Instrumentation
– Established in 1990 to focus on durable sensors for
machinery monitoring applications
• Global leader in design and manufacture of low cost industrial
accelerometers, vibration and pressure sensors, switches and
instrumentation
• Service the predictive maintenance (PdM), process
monitoring/protection, and power generation/energy markets
• Division of PCB Piezotronics, Inc.

For over 45 years PCB® has been dedicated to the
development of sensor technology and serving the needs
of test and measurement professionals worldwide.
Who is PCB Piezotronics?

Who is PCB Piezotronics?
• Pioneer of ICP® Technology
• Established IEPE technology (integrated electronics) as the
measurement standard
• Specialize in development and manufacture of sensors designed to
measure vibration, shock, force, pressure, torque, strain, acoustics,
load and blast.
• Total Customer Satisfaction is at the core of our company culture
• In-house staff of experienced Application Engineers and courteous
Customer Service Representatives who provide 24/7 technical
support to customers
• Largest Piezoelectric sensor manufacturer in the World

PCB Group Structure
PCB Group is an independent,
privately-owned company that acts
as the management vehicle for its
subsidiaries in an effort to insure
their combined success.
Subsidiaries directly interact with
one another on a regular basis.
Operating Subsidiaries & Divisions:

• Founded in 1967 by Bob and Jim Lally
• Developed and Patented ICP® (Integrated-Circuit-
Piezoelectric)
• Headquartered on a 6-acre, 150,000 sq ft campus in
Depew, NY
• Additional manufacturing footprint in 5 states across the
U.S.
• Over $180 million in annual sales (all Group companies)
• Global distribution network in over 50 countries
• Approximately 1,100 employees worldwide
• Customer base of over 10,000
• 1,500 catalog models
PCB Overview

Where It All Began

Our Vision
Continuously improve and deliver
Total Customer Satisfaction
to consistently provide reasonably
priced, quality products on time
to the schedules of our
customers

• We live, work, and play by our brand promise of Total
Customer Satisfaction (TCS)
• We recognize that we exist because of the customer and
not the other way around
• We have a 24/7 Sensor Hotline staffed by experienced
Application Engineers who pay personal attention to
satisfying customer needs
• Platinum products – immediate shipment + lifetime
warranty
• All of our products are backed by our unwavering
satisfaction guarantee
– If our customers are not satisfied, we will repair,
replace, exchange or refund their money
The Culture

Manufacturing CapabilitiesPCB continually invests in people, advanced manufacturing
capabilities, and state of the art facilities.
Other Capabilities
Include:
Laser welding and
etching
Silicon wafer
fabrication
Ceramics fabrication
Hydrogen furnace
glass-to-metal
hermetic sealing
Spectral density and
vibration testing and
analysis

Global Network

Industrial Applications
• Market Groups
– Predictive Maintenance (PdM)
– Process Monitoring and Protection
– Energy (Power Generation / Oil & Gas)
• Typical Industries Served
– Pulp and Paper
– Oil and Gas
– Petrochemical & Chemical Plants
– Steel and Metals
– Mining
– Pharmaceutical
– Water and Wastewater Treatment
– Machine Tools
– Food Processing

Machinery Monitored
• Motors
• Machine Tools (Spindles)
• Pumps
• Compressors
• Fans
• Cooling Towers
• Gear Boxes
• Gas Turbine
• Wind Turbines
• Gas Pipelines
• Natural Gas Wells
• Mining Equipment
• Paper Machines
• Rolling Mills

Industrial Product Range

Typical Sensor Options
• 2-pin MIL
• Integral polyurethane cable
• Integral Teflon® cable
• Integral armor jacketed cable
• 10, 100, 500 mV/g sensitivities
• Hazardous area approvals
• Velocity, temperature, and/or raw voltage
output options
• Most products are CE marked

Low Cost ICP® Accelerometers
• Hermetically Sealed
• Top or side exit
• Patented Swiveler®
mounting technique
• Single frequency
calibration
• Intrinsically safe models

Precision ICP® Accelerometers
• Single axis, Biaxial, &Triaxial versions
• Ideal for FFT analysis
• Velocity output versions available
• Low bias voltage versions available
• Intrinsically safe & Mine safety certified versions available

4-20 mA output sensors
• 640 Series of vibration transmitters
– Continuous Protection of Overall Vibration
– Predictive maintenance groups and
some OEM business
– Typically connected to
existing PLC or DCS

DIN Rail ICP® to 4-20 mA
Transmitter
• Series 682AX3 Din Rail Transmitters
– Compatible with ICP® Accelerometers
– Typically used for out of balance &
misalignment detection
– Programmable integration
– Pluggable filters
– BNC for raw vibration


Why Go Wireless?Earlier Warning, Frees up Personnel
Reduces downtime and lost productivity
Increases sample rate on machinery and identifies
problems sooner than route-based monitoring
Frees up technical experts for fault analysis
Simplifies installation & reduces monitoring costs
Eliminates the need for running expensive cable
Monitors more assets with less human resources
Allows for safe data collection in dangerous areas

• Sensor transmits
directly to receiver
• No mesh networks,
gateways, or repeaters
are required
• Provides periodic data to
determine machine’s health
• Allows for Overall Trending
•Supplements or replaces
route based monitoring
• Focuses resources on
machines that need attention,
not healthy machines.
• “Extended Range
Radio Frequency”
• Extreme Low RF
Noise
•Transmissions over
1000s of ft
• Extremely low
power (.75 mW)
Point to Point ERRF Alarm Based Monitoring

Paper MillEven with antenna inside a building, points were picked up in other buildings
& outside.
20+ Points Successfully Tested: Over 1200 Foot Range

Chemical PlantGood in-plant test results even with a bad receiver location
30+ Points Successfully Tested: Over 1200 Foot Range

Power Generating StationGood test results even inside a small metal building inside another
20+ Points Successfully Tested: Over 1/3 Mile Range

Suburban EnvironmentExtremely far transmission distance in open environments
2 Points Successfully Tested: Nearly 1.5 Mile Range

System Components

Low noise 916 MHz
frequency band
Up to 1.5 mile radius range
Secure encrypted data
400 Sensors per ReceiverAt default transmission interval of 8 hours
Connects via Ethernet to
Network or Local Computer
Variable Gain Antenna Options

Eliminates expensive
cable runs.
Can measure enclosed points
where cables may not be an option.
Ideal for machinery with external
moving components.
Battery life greater than 5 years
Raw Vibration output version also
available.

Converts existing standard
wired ICP® sensors to
wireless operation
Allows for wireless operation of
high temperature, submerged,
and other specialized
piezoelectric sensors.
Extremely cost effective
Also functions as a switchbox
with handheld data collectors

Visual Alarms
Email Alert
Notifications when
Alarms are tripped
Access to
Historical Data
Creation of Trend Plots
Signal Strength and
Battery Status Display
Easily Programs
Sensors and Alarms

Echo® Wireless Customers

Success at Plastics Manufacturer
• A large domestic polymer plant has been effectively running the
Echo® Wireless System for over 3 years.
• System consists of:
10 EchoPlus® Wireless
Junction Boxes
&
10 Echo® Wireless
Sensors
90 Points Monitored

Our wireless vibration monitoring system caught 6
bearing faults in their motors and pumps within the first
year of operation.

Proactive replacement of these bearings has already saved them
tens of thousands of dollars.

Bearing Fault Detector
• Series 682A05 Bearing Fault Detector
– Two 4-20 mA output signals
– Similar output to a peak-vue overall

The Bearing Fault Detector
Sinusoidal Problem Detection
Unbalance, Misalignment, etc
Filter
RMS/DC
Conversion
4-20 mAmp
Conversion
Accelerometer Real Time Buffered Vibration

Universal Transmitter
• Series 682A06 Universal Transmitter
– Ideal for customers that do not have access to
a PLC or DCS System
– Provides set point relays based
on 4-20 mA inputs
– Removable face plate for
programming multiple channels
– Provides loop power

Programmable Panel Meter
• Series 683A Vibration Indicators (panel
meters)
– Can be used with ICP or 4-20 mA inputs
– Provide up to 4 set point relays
– Adjustable time delay
– Integration to velocity or
displacement (ICP version)
– Retransmit option

Vibration Switches
• Electronic Vibration Switches
Series 686A: Two-Wire Electronic
Switch
Series 685B: Electronic Dual Switch

686A Series Two-wire Electronic
Smart Vibration Switch

Features
• Microprocessor controlled with no moving parts or mechanical adjustments
• Base models have fixed velocity set point threshold ranging from 0.25-6.0 ips peak (for installations where the vibration limit is known)
• Fully USB programmable
• Solid state relay for reliable operation
• Monitors vibration velocity for consistent results
• 2-wire operation uses existing switch wires
• Remote Reset AnywhereTM for safety and convenience
• Exclusive MAVTTM sets alarm threshold automatically
• Eliminates false trips with programmable delays
• Hazardous area approvals
• Hermetically sealed design- NO LEAKS!!

Magnetically Adjustable
Vibration Threshold (MAVT™).
• Field setup of threshold value
using a magnetically actuated
sensor within the housing of
the vibration switch.
• The sensor is activated by
touching the housing of the
switch, at the proper location,
with a strong, permanent
magnet.
• This contact initiates a course
of action within the
microprocessor to change the
vibration threshold value.

MAVT™ Functionality
• When installed on operating machinery, the magnetic actuation begins a 30 second period where the vibration experienced is averaged over that span
• The average vibration is then doubled and the result becomes set as the new threshold value
• This value can also be more precisely achieved using a controlled vibration shaker (699A02 or 699A06).
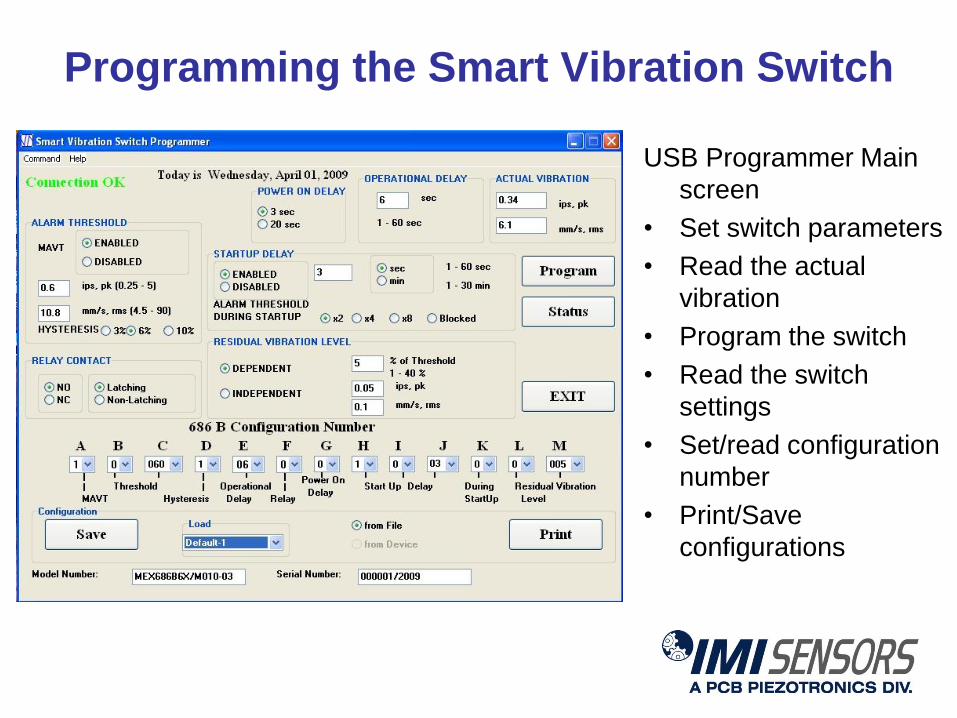
Programming the Smart Vibration Switch
USB Programmer Main
screen
• Set switch parameters
• Read the actual
vibration
• Program the switch
• Read the switch
settings
• Set/read configuration
number
• Print/Save
configurations

685B Series Electronic
Vibration Switch

Features• Integrated 100mV/g Accelerometer (external ICP® sensor
optional)
• Universal 85-245Vac, 50/60 Hz Power Supply (24 Vdc also available)
• Dual 5 Amp Triac Outputs or Form C Relay Outputs
• Triac NO/NC; Field Selectable
• 4-20mA Output Standard (unlike many competitive models)
• Local and Remote Reset
• Unique 4-20mA Calibration for High Precision
• Two connection Interfaces (unlike most competitive models)
• Dual Cord Grip Interface Standard (1/2” NPT optional)
• 2Hz to 1kHz Frequency Response
• Raw Vibration Output via BNC connection (optional)
• Standard Ranges: 5g, 1.5ips, 15mils
• Intrinsically Safe Versions Available

RMP – Reciprocating Machinery
Protector
• Model 649A01 – Reciprocating Machinery
Protector
– Detects impact severity
– Provides early detection based
on overall vibration level
– Counts the number of impacts
that exceed specified threshold
– USB Programmable, Loop powered

RMP – Reciprocating Machinery
Protector
• Early warning of faults such as:
– Loose rod nuts
– Loose bolts
– Worn pins
– Rubbing
– Liquid in the process
• Optional third pin for raw vibration output

Shock Measurement for
Reciprocating Compressors
IL
4 mA
IOUT
Time
PLC
Shutdown
Alarm
20 mA

RMP User Interface

Questions & Answers