conservation enhancements for a living...
TRANSCRIPT
Conservation Enhancements for a Living
Landscape
Kristi L. Sullivan and Stephen J. Morreale
Cornell University
2012 Conservation Activities E.L. Rose Conservancy
2
2012 Overview
In 2012, cooperative conservation and monitoring efforts involving the Cornell
Conservation Education and Research Program and the E.L. Rose Conservancy focused on five
overarching issues including: 1) continued expansion of biological monitoring and inventory
efforts, 2) research on the effects of natural gas pipeline development on forest amphibians, 3)
hemlock woolly adelgid monitoring, education, and research, 4) Geographic Information
Systems (GIS) modeling of potential watershed impacts and high priority water quality
monitoring sites, and 5) education and outreach. Through biological inventories, we continue to
elevate the knowledge of biological communities on the Conservancy’s fee-owned properties
and surrounding areas. Four Cornell undergraduate students were formally incorporated into
inventory activities through summer undergraduate internships funded by Cornell’s Arnot Forest
Internship Program and other sources of grant funding. In addition to biological inventories,
interns also assisted with a water quality monitoring workshop for the public. In addition,
students from a Cornell Applied Conservation Ecology class used Geographic Information
Systems (GIS) to conduct a group project in the spring, looking at gas well locations in relation
to topography and streams to predict ideal water monitoring locations.
Biological Inventories
Biological inventories are important for establishing baseline information, and for
detecting environmental change over time. Both the location and the ecological characteristics of
the Conservancy’s three fee-owned properties make them ideal sites for biological monitoring.
These sites can serve as indicators of overall landscape-level forest health in the area.
Odonate Inventory at Greenwood and Silver Lake
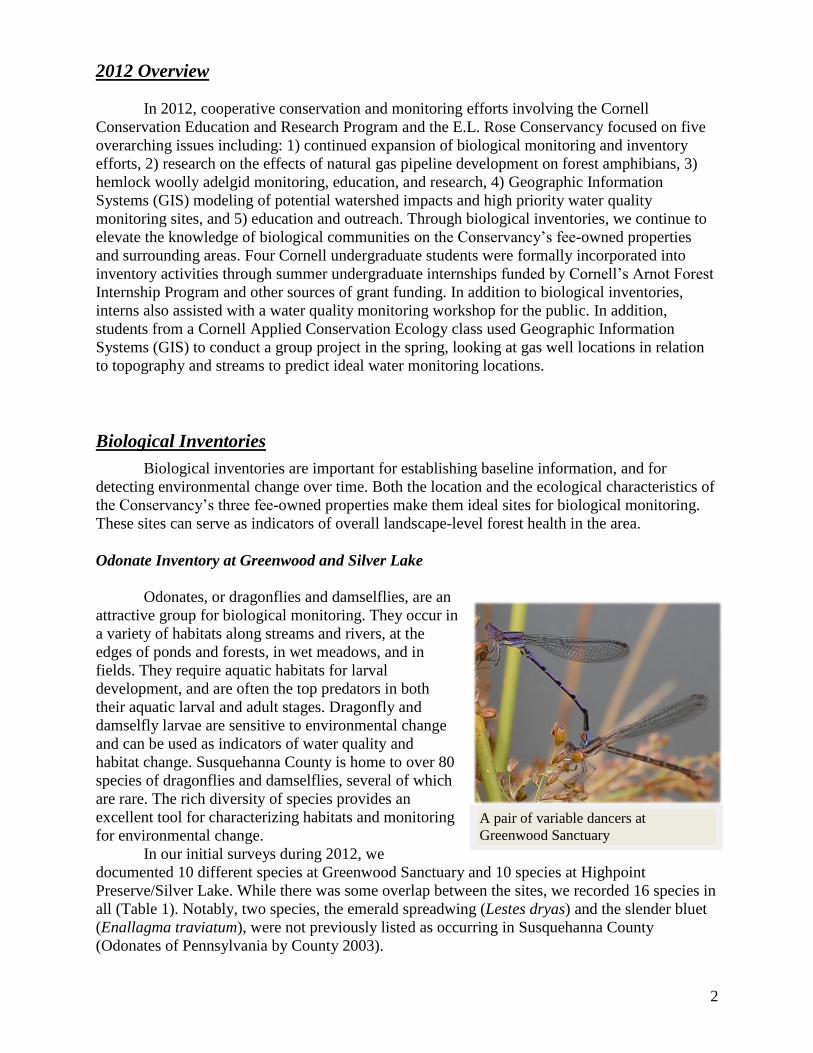
Odonates, or dragonflies and damselflies, are an
attractive group for biological monitoring. They occur in
a variety of habitats along streams and rivers, at the
edges of ponds and forests, in wet meadows, and in
fields. They require aquatic habitats for larval
development, and are often the top predators in both
their aquatic larval and adult stages. Dragonfly and
damselfly larvae are sensitive to environmental change
and can be used as indicators of water quality and
habitat change. Susquehanna County is home to over 80
species of dragonflies and damselflies, several of which
are rare. The rich diversity of species provides an
excellent tool for characterizing habitats and monitoring
for environmental change.
In our initial surveys during 2012, we
documented 10 different species at Greenwood Sanctuary and 10 species at Highpoint
Preserve/Silver Lake. While there was some overlap between the sites, we recorded 16 species in
all (Table 1). Notably, two species, the emerald spreadwing (Lestes dryas) and the slender bluet
(Enallagma traviatum), were not previously listed as occurring in Susquehanna County
(Odonates of Pennsylvania by County 2003).
A pair of variable dancers at
Greenwood Sanctuary

3
Permanent Forest Inventory Plots at Greenwood Sanctuary and
Highpoint Preserve
Our natural environment is facing many different
pressures today, including climate change, invasive plants and
insects, emerging diseases, and forest fragmentation. By
establishing Permanent Forest Inventory (PFI) plots, valuable
information can be gathered on species composition, species
distribution, presence of invasive pests, and other forest health
indicators, for both current analyses and future comparisons.
Methodology
To enhance the level and quality of information about
plant species composition and habitat condition at Greenwood
Sanctuary, two additional PFI plots were established and sampled
in 2012, bringing the total number of plots to 12 at that site
(Figure 1). At Highpoint Preserve, three new plots were sampled
bringing the total number of plots to 15, and three previously
established plots were re-sampled (Figure 1). This year, we
intentionally selected plots containing eastern hemlock. While
conducting other research this summer, hemlock woolly
adelgid (Adelges tsugae) was found at Greenwood. As such,
the emphasis of our forest inventory this summer shifted
slightly, and focused on documenting the current condition
of hemlock trees, so that we can monitor their long-term
health and survival. The PFI plot methodology (Appendix A)
Scientific Name Common Name Greenwood Silver Lake
Argia fumipennis violacea Variable dancer x x
Argia moesta Powdered dancer x
Calopteryx maculata Ebony jewelwing x
Celithemis elisa Calico pennant x
Enallagma geminatum Skimming bluet x
Enallagma signatum Orange bluet x
Enallagma traviatum Slender bluet x
Epitheca cynosura Common baskettail x
Erythemis simplicicollis Eastern pondhawk x x
Ischnura verticalis Eastern forktail x
Lestes dryas Emerald spreadwing x
Libellula incesta Slaty skimmer x
Libellula luctuosa Widow skimmer x
Libellula pulchella Twelve-spotted skimmer x x
Perithemis tenera Eastern amberwing x x
Plathemis lydia Common whitetail x
Figure 1. Three additional PFI plots were
established at Greenwood Preserve in 2012
(top, red). At Highpoint Preserve, three new
plots were sampled (bottom, red), and three
plots were sampled for a second time
(bottom, blue). Additional plots designated
for future sampling appear in yellow.
Table 1. Dragonfly and damselfly species detected at Highpoint Preserve/Silver Lake and
Greenwood Sanctuary in 2012.

4
is based on protocols we developed and implemented at Cornell University’s Arnot Teaching
and Research Forest. In addition to providing information on the current conditions, PFI plots
will be used to monitor short- and long-term changes in forest health and composition.
Each quarter-acre PFI plot consists of a circular central plot (58.9’ radius) and two
subplots (11.8’). The center of the plot is marked with white pvc pipe for visibility to act as a
long-term marker. The pipe has a numbered tag attached at the top, and the plot number is also
written on the pipe in permanent marker for easy identification. Within the central plot, all the
living trees with a diameter at breast height (dbh) of at least 4” are marked one foot off the
ground with small, round aluminum tags. The tags provide a permanent reference for future tree
measurements. For each tagged tree, the species, dbh, presence/absence of cavities, and crown
class are recorded. At the north and south ends of each plot, subplots are marked at the center
with short wooden stakes. The subplots are used to sample the number of seedlings and saplings
present, as well as other key understory characteristics. Additional information recorded for the
PFI plots included: geography (elevation, aspect, etc.); measures of coarse woody debris;
presence/absence of water, rocks and tree cavities; number of dead standing trees (snags);
species and number of salamanders found; and signs of other wildlife (Appendix A).
Greenwood Sanctuary Overstory and Understory Characteristics
In 2012, 146 overstory trees were recorded, measured, classified and tagged in two plots
at Greenwood. Eleven tree species were present within the new plots, bringing the total recorded
number of species to 20. Species present include American basswood (Tilia americana),
American beech (Fagus grandifolia), eastern hemlock (Tsuga canadensis), red maple (Acer
rubrum), sugar maple (Acer saccharum), black birch (Betula lenta), gray birch (Betula
populifolia), yellow birch (Betula alleghaniensis), white birch (Betula papyrifera), black cherry
(Prunus serotina), white ash (Fraxinus americana), northern red oak (Quercus rubra), northern
white oak (Quercus alba), eastern hophornbeam (Ostraya virginiana), American hornbeam
(Carpinus caroliniana), big tooth aspen (Populus grandidentata), quaking aspen (Populus
tremuloides), white pine ( Pinus strobus), bitternut hickory (Carya cordiformis), and shagbark
hickory (Carya ovata). Dominant species comprising 30% or more of the trees in one or more
plots include eastern hemlock (5 plots), black birch (3 plots), quaking aspen (1 plot), red maple
(1 plot), and sugar maple (1 plot) (Table 2). The number of trees per ¼-acre plot ranged from 30
to 86.
At Greenwood, 16 different tree and shrub species have been recorded in the understory
(Table 3). Thirteen of the 16 species growing in the understory were also observed growing in
the overstory. American beech (11 of 12 plots) and white ash (9 of 12 plots) were most prevalent
in the understory. Bitternut hickory, hop hornbeam, red maple, and sugar maple were also
common and were documented in at least 40% of the plots. The number of seedlings present in
the plots varied and, although quite a few seedlings were present in some of the plots, very few
(58 total) have grown to sapling size in the plots sampled. With relatively little sunlight reaching
the forest floor due to a closed forest canopy, it is not surprising that the understory is not well-
developed. Several herbaceous species of note were found in the understory plots including
maidenhair fern, Christmas fern, trillium, blue cohosh, and jack-in-the-pulpit.

5
PFI Plot Number
Overstory trees 1 2 8 9 10 16 17 26 28 42 44 46
American basswood 0.00 1.61 0.00 0.00 0.00 0.00 0.00 0.00 0.00 0.00 0.00 0.00
American beech 6.67 4.84 3.33 5.08 5.56 7.94 1.16 0.00 20.00 0.00 0.00 0.00
American hornbeam 0.00 0.00 0.00 0.00 0.00 0.00 2.33 0.00 0.00 10.81 0.00 0.00
Big tooth aspen 0.00 0.00 0.00 0.00 0.00 0.00 2.33 0.00 0.00 0.00 0.00 0.00
Bitternut hickory 0.00 0.00 0.00 0.00 0.00 0.00 0.00 25.71 6.67 0.00 3.51 0.00
Black birch 35.00 11.29 3.33 6.78 0.00 23.81 67.44 0.00 3.33 8.11 73.68 0.00
Black cherry 0.00 0.00 0.00 1.69 0.00 0.00 1.16 5.71 0.00 2.70 0.00 0.00
Eastern hemlock 45.00 69.35 88.33 55.93 0.00 28.57 4.65 0.00 43.33 2.70 1.75 0.00
Gray birch 0.00 0 0.00 0 0.00 0 0.00 0.00 0.00 0.00 0.00 7.89
Hop hornbeam 1.67 0.00 0.00 0.00 25.00 0.00 1.16 14.29 0.00 0.00 0.00 0.00
North. red oak 1.67 0.00 0.00 6.78 2.78 3.17 1.16 11.43 0.00 10.81 0.00 0.00
North. white oak 0.00 0.00 0.00 0.00 0.00 0.00 0.00 2.86 0.00 0.00 0.00 0.00
Quaking aspen 1.67 0.00 0.00 0.00 0.00 3.17 0.00 0.00 0.00 2.70 1.75 92.11
Red maple 5.00 6.45 1.67 13.56 19.44 12.70 7.95 0.00 0.00 32.43 3.51 0.00
Shagbark hickory 0.00 0.00 0.00 0.00 0.00 3.17 9.3 17.14 0.00 0.00 0.00 0.00
Sugar maple 0.00 3.23 0.00 0.00 30.56 0.00 0.00 5.71 16.67 8.11 5.26 0.00
White ash 1.67 0.00 0.00 10.17 16.67 15.87 1.16 17.14 10.00 18.92 7.02 0.00
White birch 0.00 0.00 0.00 0.00 0.00 0.00 0.00 0.00 0.00 0.00 3.51 0.00
White pine 0.00 0.00 0.00 0.00 0.00 0.00 0.00 0.00 0.00 2.70 0.00 0.00
Yellow birch 1.67 3.23 3.33 0.00 0.00 1.59 0.00 0.00 0.00 0.00 0.00 0.00
Table 2. Overstory tree composition of PFI plots at Greenwood Sanctuary; species comprising 30 percent
or more of overstory trees in the plot are highlighted.
Plot
Am
eric
an b
assw
ood
Am
eric
an b
eech
Am
eric
an h
orn
bea
m
Bit
tern
ut
hic
kory
Bla
ck b
irch
Bla
ck c
her
ry
Do
gw
ood s
p.
Eas
tern
hem
lock
Ho
p h
orn
bea
m
Iro
nw
ood
Map
le-l
eaved
vib
urn
um
No
rth
ern r
ed o
ak
Red
map
le
Su
gar
map
le
Sh
agbar
k h
ickory
Wh
ite
ash
1 0 6 0 0 0 0 0 1 0 0 0 1 0 0 0 2
2 0 30 0 0 0 0 0 1 0 0 0 0 0 0 0 0
8 0 6 0 0 27 0 0 0 0 0 0 1 32 0 0 15
9 0 24 0 0 0 0 0 0 0 0 0 0 61 0 0 0
10 2 3 0 1 0 3 0 0 22 0 0 0 5 8 0 3
16 0 3 0 0 5 0 0 0 4 0 20 0 0 0 0 21
17 0 6 2 0 11 0 0 0 0 0 0 0 3 0 8 0
26 4 4 0 20 0 0 0 0 74 0 0 16 4 36 5 4
28 0 4 0 16 0 0 0 0 20 0 0 4 0 80 0 24
42 0 6 0 21 0 0 4 0 46 0 0 0 13 0 15 8
44 0 9 0 28 0 0 8 0 0 8 0 0 0 24 0 15
46 0 0 0 0 0 0 0 0 0 18 0 0 0 8 4 38
Table 3. Number of seedlings and saplings by species in each plot at Greenwood Sanctuary.

6
Highpoint Preserve Overstory and Understory Characteristics
At Highpoint Preserve in 2012, 198 new overstory trees were recorded, measured,
classified and tagged in three plots, and 163 trees in three previously established plots were re-
measured. Nine tree species were present within the new plots, bringing the total recorded
number of species to 14. Species include American basswood (Tilia americana), American
beech (Fagus grandifolia), eastern hemlock (Tsuga canadensis), red maple (Acer rubrum), sugar
maple (Acer saccharum), striped maple (Acer pennsylvanica), black birch (Betula lenta), yellow
birch (Betula alleghaniensis), black cherry (Prunus serotina), white ash (Fraxinus americana),
eastern hophornbeam (Ostraya virginiana), American hornbeam (Carpinus caroliniana), white
pine (Pinus strobus), and hickory (Carya sp.). Dominant species comprising 30% or more of the
trees in one or more plots included eastern hemlock (8 plots), American beech (1 plot), red maple
(2 plot), and sugar maple (6 plots), and white pine (1 plot) (Table 4).
At Highpoint Preserve, 8 tree species have been recorded in the understory (Table 5).
Seven of the 8 species growing in the understory were also observed growing in the overstory.
American beech (3 of 14 plots) and white ash (9 of 14 plots) were most prevalent in the
understory. The number of seedlings present in the plots varied, and very few have grown to
sapling size in the plots sampled. Although quite a few seedlings were present in some of the
plots, only 77 saplings were documented in the plots sampled, and a majority of saplings were of
only two species, beech and sweet birch. With relatively little sunlight reaching the forest floor
due to a closed forest canopy, it is not surprising that the understory is not well-developed.
Several herbaceous species of note were found in the understory plots including maidenhair fern,
Christmas fern, trillium, sensitive fern, blue cohosh, and jack-in-the-pulpit.
PFI Plot Number
Overstory Trees 1 3 5 6 10 15 20 25 30 35 40 42 45 50 55
Am. beech 13.11 3.77 3.15 15.38 0.00 9.52 5.56 21.95 9.72 3.33 27.78 5.71 32.65 11.00 2.27
Am. basswood 0.00 0.00 0.00 0.00 0.00 3.17 0.00 0.00 6.94 0.00 0.00 0.00 0.00 0.00 2.27
Am. hornbeam 0.00 0.00 0.00 0.00 0.00 0.00 0.00 0.00 0.00 0.00 0.00 2.86 0.00 0.00 0.00
Black birch 11.48 1.89 14.96 12.50 0.00 0.00 13.33 0.00 4.17 3.33 18.52 8.57 4.08 0.00 0.00
Black cherry 13.11 0.00 0.00 0.00 1.96 4.76 0.00 2.44 1.39 0.00 1.85 0.00 0.00 0.00 6.82
E. hemlock 47.54 24.53 43.31 44.23 39.22 20.63 53.33 41.46 33.33 1.67 1.85 11.43 42.86 0.00 2.27
Hickory sp. 0.00 0.00 0.00 0.00 0.00 0.00 0.00 0.00 0.00 0.00 0.00 0.00 0.00 7.41 4.55
Hop hornbeam 0.00 0.00 0.00 0.00 0.00 0.00 0.00 0.00 0.00 1.67 0.00 0.00 0.00 0.00 0.00
Red maple 6.58 24.53 33.86 20.19 33.33 3.17 5.56 7.32 8.33 10 5.56 0.00 10.2 14.81 2.27
Striped maple 0.00 1.89 0.00 0.00 0.00 0.00 0.00 0.00 0.00 0.00 0.00 0.00 0.00 3.70 0.00
Sugar maple 0.00 0.00 0.00 0.00 0.00 39.68 0.00 24.39 23.61 73.33 37.04 62.86 4.08 62.96 65.91
White ash 0.00 0.00 0.00 0.00 0.00 4.76 0.00 2.44 12.5 6.67 7.41 0.00 2.04 0.00 13.6
White pine 0.00 43.40 2.36 5.77 1.96 0.00 0.00 0.00 0.00 0.00 0.00 0.00 4.08 0.00 0.00
Yellow birch 8.20 0.00 2.36 1.92 23.53 14.29 22.22 0.00 0.00 0.00 0.00 8.57 0.00 0.00 0.00
Table 4. Overstory tree composition of PFI plots at Highpoint Preserve; species comprising 30 percent or
more of overstory trees in the plot are highlighted.

7
New and Ongoing Research
Longford Lake Deer Exclosure
The white-tailed deer is both a charismatic and influential member of our biological
community. Through extensive browsing, deer can affect the kinds and numbers of plants
present in an area, impair the ability to grow new trees, and shape the overall structure of the
forest, both present and future. The changes brought about by deer can affect the quality of the
forest, and reduce available food and habitat for other wildlife species.
As selective browsers, deer prefer certain plant
species over other less desirable species. Many of the tree
species deer prefer are valued for timber or as wildlife
food trees (e.g., oak, maple). Deer also eat many
wildflower and understory plants like trillium and lady
slipper, but tend to avoid ferns and some other plants. By
feeding on certain species and leaving others behind, deer
can actually change the plant species and community
composition in a forest.
In addition to changing the types of plants, deer
can also cause changes in the vertical structure of the
Table 5. Number of seedlings and saplings by species in each plot at Highpoint Preserve.
Plot
Am
eric
an b
eech
Bla
ck c
her
ry
Red
map
le
Sh
agb
ark
hic
kory
Su
gar
map
le
Str
iped
map
le
Sw
eet
bir
ch
Wh
ite
pin
e
1 10 51 16 0 0 0 0 2
3 11 1 0 0 0 0 0 0
5 6 10 0 0 0 0 0 0
6 1 1 0 0 0 0 0 0
10 5 0 0 0 0 0 0 0
15 0 0 0 0 0 0 0 0
20 2 0 0 0 19 0 0 0
25 10 0 5 0 10 1 0 0
30 1 0 0 0 4 4 0 0
35 2 0 0 0 80 0 0 0
40 5 0 0 0 13 302 0 0
42 5 0 0 1 9 2 0 0
45 42 1 10 0 8 39 46 0
50 25 0 20 0 75 6 0 0
55 0 0 100 0 100 0 0 0
Deer can reduce the abundance of
wildflowers such as trillium.

8
forest. For example, over-browsing of tree seedlings and shrubs creates open, park-like stands
with few preferred food species near the ground and little or no forest understory. Loss of forest
understory affects other wildlife too, particularly those songbirds that rely on the forest
understory for nesting and feeding. In fact, some animal species may become less abundant in
heavily browsed areas, while others may disappear completely where deer have done there
damage.
To determine and demonstrate the severity of impacts deer are having on vegetation and
potential forest regrowth in Susquehanna County, Conservancy members and volunteers from
Rockwell Collins constructed a deer exclosure at Longford Lake in 2006. Following an
experimental design created by the Cornell Conservation Education and Research team, black
cherry and red oak seedlings were planted both inside and outside of the exclosure, situated in an
open area near a woodland edge.
After six years, the results
have been striking. Based on data
collected this year, 98% of the black
cherry seedlings planted inside the
exclosure have survived, while only
72% have survived outside the
exclosure. In contrast, the black
cherry seedlings outside of the
exclosure have only grown to an
average of 11 inches tall, while those
within the exclosure have grown to an
average of 5 ½ feet tall.
Browsing effects on the
northern red oak seedlings was even
more pronounced. Eighty percent of
the red oak seedlings within the
exclosure have survived, while only
30% have survived outside of the
exclosure. The seedlings inside the exclosure
average about 4 feet in height, compared to
survivors on the outside which average only 9
inches. So, overall, most black cherry seedlings
were able to withstand multiple years of deer
browsing, but their height was stunted greatly and
their chances of ever growing beyond the reach
of deer are probably minimal. Red oak seedlings
were much more sensitive to browsing early on
and suffered a higher rate of mortality in the first
six years, and even slower growth when browsed
repeatedly.
From this straightforward experiment, it is
clear that deer are having a substantial effect on
the vegetation in the area, and likely are delaying,
or even preventing, natural forest regeneration.
After six growing seasons, the planted seedlings
within the exclosure have reached a height
sufficient enough to guarantee their escape from
the pressures of deer browsing (5-6 feet).
Inside the fence, the planted seedlings are thriving and many are over
5 or 6 feet tall.
After six years, the few red oak seedlings that
survived outside of the fence have been browsed
multiple times and are still very small.

9
Additionally, many trees including red maple, black birch, aspen and apple have seeded into the
exclosure on their own and have grown to heights of five feet or more. In the absence of reduced
deer populations, landowners in the region hoping to reforest an open area, or grow young trees
(regenerate) within existing forest, will need to provide protection around seedlings for them to
survive and grow.
Effect of Gas Pipeline Development on Amphibians
In 2012, we initiated a research project to study to the effects of Marcellus Shale gas
exploration and development on forest amphibians in northern Pennsylvania, using Greenwood
Sanctuary as one of our study sites. Amphibians reach their highest diversity within eastern
forests and are highly sensitive to changes in forest cover and increased road densities making
understanding effects of Marcellus activity on this group extremely critical. Direct loss of forest
habitat, as well as changes in remaining forest due to forest fragmentation, may have a
substantial effect on forest salamander populations. When sizable openings in the forest tree
canopy are created, forest floor temperatures may rise, and soil moisture maydecrease
considerably. Salamanders are sensitive to heat, and prone to desiccation when soil moisture is
low.
To measure the effects of gas pipeline openings on adjacent populations of forest
salamanders, we established both natural cover and artificial cover transects along which to
measure the relative abundance of salamanders from pipeline openings into the adjacent forest.
We established five natural cover transects and four artificial cover transects at Greenwood
Sanctuary. These transects are located a minimum of 30 m apart. Each natural cover transect
begins at the forest edge (0 m) and extends perpendicularly into the forest for a distance of 100 m
(Figure 2). Artificial cover transects are 50 m in length. We placed a pair of coverboards,
constructed from rough-cut lumber, at 10-m intervals (from 0 to 50 m into the forest) along each
Inside the deer exclosure (pictured right) the tree seedlings have thrived. Outside the deer exclosure (pictured
left within red circle) seedling mortality has been high and few seedlings have grown taller than 11 inches high.

10
transect. At each 10-m interval one board was placed 0.5 m to the left of the transect, and another
was placed 0.5 m to the right of the transect (Figure 2).
Natural cover surveys were conducted by walking slowly along each transect, recording
all amphibians found on the surface or under cover objects. All amphibians seen on the surface
or under cover (rocks, logs) within a 3-m wide strip centered on each transect were recorded.
Artificial cover surveys were conducted by turning over all cover boards along each transect, and
recording the number and species of salamanders found under each board. Natural cover
searches were conducted three times from July to September 2012, and artificial cover searches
were conducted five times from June to October. Results from each of the methods show a
general increase in the number of redbacked salamanders from the edge of the pipeline into the
interior of the forest (Figure 3). Very few red-backed salamanders were present within the first
15 m from the edge.
To determine the effects of pipeline creation on temperature and light from the edge of
the opening into the forest, Hobo temperature and light data loggers were installed along one of
the artificial cover transects at the Susquehanna County site. Each data logger measured and
archived temperature and light readings every two hours, from the end of July through the
beginning of October. Temperature was higher nearer the pipeline edge, and cooler deeper into
Figure 3. The number of redbacked salamanders increased with distance from edge. Few salamanders
were found within the first 10 m from the pipeline opening.
Figure 2. Natural cover transects (yellow)
begin at the pipeline edge and extend 100 m
into the forest. Artificial cover transects
(orange) begin at the edge and extend 50 m
into the forest.

11
the forest. Data collection will continue at this and other sites throughout the state in the
upcoming year.
Hemlock Woolly Adelgid Monitoring, Research and Control
This summer, we discovered an infestation of hemlock woolly adelgid (HWA) at
Greenwood Sanctuary, and subsequently conducted a property-wide survey for HWA at both
Greenwood Sanctuary and Highpoint Preserve. The adelgid is a destructive, non-native insect
pest which presents a serious danger to eastern hemlock trees. Once infested, untreated hemlock
trees often die within 4-10 years. The level of infestation is moderate and widespread at
Greenwood Sanctuary. At Highpoint Preserve, there is some evidence of HWA, but it appears to
be a new, localized infestation.
Hemlock trees help maintain cool water temperatures for fish and other aquatic
organisms and provide important and unique habitat and food resources for wildlife. Therefore,
the loss of hemlocks could have far-reaching effects beyond just the trees. Sudden and
widespread death of hemlock trees at Silver Lake and Greenwood could further lead to soil
erosion on steep slopes. The cooling shade which hemlock trees now provide along the water’s
edge would be lost, and could contribute to warmer water temperatures in Silver Lake.
A long-term plan is needed to address the potential impacts of HWA and determine
appropriate treatment options. Researchers have been investigating the use of natural adelgid
predators (beetles) as biological controls to manage HWA at the landscape scale. These beetles
have been released in a number of locations in Pennsylvania and show some promise. However,
it may be years before populations of these beetles reach the levels needed to provide widespread
protection. Therefore, for the time being, chemical insecticides are the only effective option for
controlling this pest. We conducted extensive research on current HWA treatment options, which
included interviews with leading experts from Cornell University and the National Park
Service. We attended a Stewardship Committee meeting at the Nature Conservancy’s
Woodbourne Preserve to explore future, long-term collaborative treatment options with the
Nature Conservancy. In the short term, in an effort to safeguard some individual hemlock trees at
Greenwood Sanctuary, we selected, measured and marked 23 hemlock trees for basal bark
treatment with Dinotefuran, and coordinated treatment with a local applicator. Dinotefuran
provides immediate protection to the treated trees – protection that lasts for up to 2 years.
Water Quality Monitoring
In support of Conservancy efforts to engage citizens in water quality monitoring,
undergraduate students from Cornell’s Applied Conservation Ecology class undertook a group
project focused on industrial gas development and water quality in Susquehanna County. They
looked at gas well locations in relation to topography and streams to develop a predictive risk
assessment model to target water quality monitoring locations with the greatest likelihood of
detecting impacts resulting from natural gas drilling activities. Using GIS, students assembled a
number of different spatial data layers. The layers included streams, watersheds, a digital
elevation model, roads and bridges, and active and permitted gas wells. They modeled the flow
of water over the landscape relative to gas well locations to pinpoint downstream locations most
likely to receive water flow from areas with gas wells (Figure 4). Bridge locations closest to
those downstream locations were then designated as potential water sampling sites, and labeled
according to the number of gas wells within the watershed draining to that location (Figure 5).
Bridges with the highest numbers are the sites at which water quality impacts are most likely to
be captured.

12
Figure 4. Watersheds shown in red and orange had the greatest number of permitted gas wells as
of June 2012, and therefore the greatest risk for water quality impacts.
Figure 5. Sample of GIS map showing bridge locations that could be used as water
monitoring sites, and labeled according to the number of gas wells within the watershed
draining to that location.

13
Education and Outreach
This year we, along with several undergraduate students, were involved in several
educational outreach efforts. We delivered a presentation at the water quality monitoring
workshop in June, and provided one-on-one consultation with workshop participants using the
GIS maps developed with students as a focus of discussion. Other outreach efforts included
writing an article about the Longford Lake deer exclosure research results for inclusion in the
summer newsletter, a letter to Silver Lake residents regarding monitoring and treatment of
hemlock woolly adelgid, and two fact sheets and checklists of dragonflies and damselflies of
Silver Lake and Greenwood Preserve (Appendix B).
Summary
Through our collaborative efforts in 2012, we continued to expand and enhance our
collective knowledge about the ecology of the Conservancy’s fee-owned properties, as well as
their respective roles within the overall landscape. We expanded biological survey, inventory,
research and monitoring efforts, and addressed critical issues of water quality and the spread of
invasive species. We incorporated Cornell undergraduate students into all aspects of our work
with the Conservancy, in an effort both to provide them with hands-on experience and to bring
their skills and knowledge to bear on Conservancy-related issues.

14
Appendix A. Permanent Forest Inventory Plot Methodology

15
Permanent Forest Inventory Plot Methodology
(Adapted in 2008 from methodology developed for Cornell’s Arnot Forest)
Objective: Establish permanent plot samples throughout the forest to measure the
change in various forest characteristics through time. Be able to describe changes in
forest species composition, structure, health and habitat availability that result from
natural forest dynamics and management practices.
Assumptions/Constraints: Plots will be established annually. Each point will be re-
sampled every 5 to 8 years and allow an analysis of change through time. Some plots
may be sampled more frequently to assess short-term forest dynamics.
Methods: Establish 10-15 plots per year, distributed among properties owned or
managed by the E.L. Rose Conservancy in Susquehanna County, Pennsylvania. Plots
will be numbered sequentially. Plot center is marked with a white 2.5” PVC pipe 5’
long. A GPS unit will be used to record UTM coordinates. A “Permanent Plot Location
Sheet” will be completed for each plot. This sheet will include written directions/map to
the plot, a general description, and information about deer impact. Each plot will
include:
A fixed radius overstory plot (0.25 acres, 58.9 ft. radius) where all live trees > 4”
dbh will be tagged with aluminum numbered tags and aluminum nails at 12”
above ground, and tallied by species, dbh, presence of cavities > 1” diameter,
and crown class. DBH will be measured to the nearest 0.1 inch using a diameter
tape located at the top of a 3.5’ stick placed on the nail. Nails should face plot
center. All dead trees will be tallied and diameter will be recorded.
Within each overstory plot record elevation, aspect, % slope, slope shape,
percent fern cover, and presence or absence of grass, seeps or wet areas, trails or
roads, logs in water, perches, soft or hard mast species, rock piles, rock crevices,
caves, and cavities in living or dead trees. Also make note of the presence or
absence of accumulate litter on the forest floor, and note the presence or absence
of forest pests including beech blight, hemlock woolly adelgid, and emerald ash
borer.
Within each plot, N/S and E/W lines transecting the diameter of the plot will be
established to record the percent cover of coarse woody debris > 3” diameter at
the point of their intersection with the transect. Record diameter at the
intersection, condition, and whether bark is present.
At the north and south cardinal directions on the edge of the overstory plot,
establish sapling/ground layer plots having an 11.8’ radius to equal 0.01 acres
each. Subplot centers should be marked with a 30” wooden stake and flagged.
Record the number of woody stems by species in the ground layer (height of 4”
– 54”) and sapling/shrub layer (height > 54” up to 3.99” dbh) using decadal
increments (1-10 by one; 11 to 100 by tens; 101+ by hundreds).
Within each sapling subplot (11.8’ radius), record presence or absence of the
following herbs: sensitive fern, maiden-hair fern, Christmas fern, true ginseng,

16
dwarf ginseng, blue cohosh, jack-in-the-pulpit, or trillium. Also record presence
or absence of invasive species including garlic mustard, barberry, multi-flora
rose, honeysuckle, or autumn olive, and the percent of inhibiting fern cover,
percent of other fern cover, and percent grass and sedge cover.
List of Equipment Needed
1. PVC Pipe: preferably white 2.5” PVC pipe 5’ long
2. Short wooden stakes
3. Blue spray paint (for the top of the PVC)
4. Tags for the pipe (the soft etch-able aluminum one work)
5. Round aluminum tree tags from Forestry Suppliers Co.
6. Multiple tape measures
7. Data sheets, pencils, and permanent marker
8. DBH tape
9. Hammer
10. Aluminum nails (aluminum makes it safe for loggers)
11. Small sledge hammer (to pound in stakes)
12. Flagging
13. Field guides if necessary
Definitions of Variables Recorded at Permanent Forest Inventory (PFI) Plots at
Greenwood
Deer Impact: An estimate of the browsing pressure that deer are having on tree
seedlings in the area of the sample plot. Code is as follows:
1= low pressure; 2= low/medium; 3= medium; 4=medium/high; 5= high
Travel Description: A narrative description of travel from the nearest permanent
location or landmark.
Map: A hand sketch of the travel description.
Overstory Plot Size: The length of the plot’s radius in feet. Typically 58.9’ unless
otherwise noted.
Sapling Plot Size: The length of the subplot’s radius in feet. Typically 11.8’ unless
otherwise noted.
Seedling Plot Size: The length of the subplot’s radius in feet. Typically 11.8’ unless
otherwise noted.
Aspect: The direction of the downward slope coded as: North, Northeast, East,
Southeast, South, Southwest, West, or Northwest.
Slope: The calculated percent slope. Can be calculated in the field or from a topographic
map.
Slope Shape: An visual estimation coded as: 1=convex; 2=linear; 3=concave
17
Topographic Position: Coded as: 1=Upland Plateau; 2=Upland Bottom; 3=Ridge Top;
4=Upper Slope or Shoulder; 5=Mid-slope; 6=Bench; 7=Lower Slope;
8=Bottomland/Flatland.
Riparian %: The percentage of the plot that characterized by stream channels, wetlands,
floodplains, and immediately adjacent terrestrial ecosystems.
Seep: Enter either “present” or “absent” as to the presence of seeps or springs within or
adjacent to the plot. A seep is a source of surface ground water without a well-defined
point of origin. A spring has a well-defined point of origin. Seeps and springs may or
may not have vegetation around them.
Streams: Enter “present” if perennial streams are within the stand or immediately
adjacent to the stand.
Temporary Ponds: Enter “present” if any temporary or vernal pools are within or
adjacent to the plot. Temporary ponds must be greater than 6 inches deep and greater
than 1 square yard; water must be present for at least two months during the growing
season. The exact month differs for each species that uses temporary ponds. Areas
covered by a fine layer of silt and depressions filled with blackened leaves me serve as
dry season indicators of temporary ponds.
Permanent Ponds: Enter “present” if any permanent ponds of lakes are within or
adjacent to the plot. Permanent ponds are any size of depth, but larger is generally
better; water must be present year-round, although the top layer can freeze.
Logs in water: Enter “present” if any downed logs are partially or wholly in a
permanent water source.
High Perch: Enter “present” if any high exposed perches occur in the plot. A high perch
is any live or dead tree that clearly towers above the canopy such as a supracanopy
white pine, or a single tree or group of trees standing above ground vegetation such as
a lone elm in a pasture or a snag in a clearcut.
Hard mast: Enter “present” if there are any plant species in or near the plot that provide
hard mast such as acorns or hickory.
Loose soils: Enter “present” if there is soil that can be easily burrowed into.
Rock Piles: Enter “present” if there are any natural or man-made piles (rock walls), as
long as they provide hiding places for small mammals, amphibians, or reptiles.
Rock crevices: Enter “present” if there are openings in the rocks that lead below the
frost line.
Caves: Enter “present” if there are any caves or larger rock openings that lead below the
frost line.
Live cavities: Enter “present” if there are any live trees in or near the plot with cavities
at least 1” in diameter. This is collected in the overstory plot and may be determined
from field data.
Dead cavities: Enter “present” if there are any dead trees in or near the plot with
cavities at least 1” in diameter. This is collected in the overstory plot and may be
determined from field data.

18
Coarse Woody Debris: Any fallen logs or trees that are longer than three feet and
greater than three inches in diameter.
Condition: Coded as: 1=solid/good; 2=rotten/ poor
Species: For every tallied tree, enter the tree species using either the 3-digit forest
survey code or the mnemonic abbreviation.
DBH: The diameter at breast height (typically four feet above the ground).
Crown Class: Determine the position of the
tree crown using the following codes:
1= open grown- a tree that is free of
competition and receives light on top and all
sides of the crown as a result of a very heavy
thinning or being in an isolated, open-grown
position.
2= dominant- a tree with the crown
extending above the general level of the main
crown canopy and receiving full light from
above and partly from the sides.
3=codominant-a tree with a crown
forming the general level of the main canopy,
receiving full light from above but little from
the sides.
4=intermediate- a tree with a crown
extending into the lower portions of the main
crown canopy, but shorter than the
codominants and receiving little direct light
from above and none from the sides.
5=suppressed- a tree whose crown is
entirely below the general level of the canopy
and receives no direct light from either above or the sides.

19
Data Sheets for Permanent Forest Inventory (PFI) Plots
-PFI Plot Features
Tally date _____/ _____/ ______ Page _______ of ______________
PFI Plot Number ______________ Tallied by______________________________________
Comments: _____________________________________
_____________________________________
___________________________________________________________
___________________________________________________________
___________________________________________________________
Sapling/Seedling Plot Features
Indicator Species North South
Ginseng (p/a)
Dwarf ginseng (p/a)
Sensitive fern (p/a)
Maiden-hair fern (p/a)
Christmas fern (p/a)
Trillium (p/a)
Blue cohosh (p/a)
Jack-n-the-pulpit (p/a)
Invasive Exotics
Garlic mustard (p/a)
Barberry (p/a)
Multi-flora rose (p/a)
Honeysuckle (p/a)
Autumn Olive (p/a)
Inhibiting Fern Cover (%)
Other Fern Cover (%)
Grass and Sedge Cover (%)
Soggy Ground (%)
Surface Stone > 50% (y/n)
Overstory
Plot Size
(radius,
ft)
58.9
Sapling/
Seedling
Plot Size
(radius,
ft)
11.8
Logs in water
(p/a)
High Perch (p/a)
Low Perch (p/a)
Soft Mast (p/a)
Hard Mast (p/a)
Rock Pile (p/a)
Rock Crevice
(p/a)
Cave (p/a)
Live Cavity
(p/a)
Dead Cavity
(p/a)
# of Snags
Accumulate
litter (p/a)
Elevation
Aspect
Slope
Slope Shape
Topo
Position
UTM Coordinates:
Trail on Road
(y/n)
Riparian %
Wetland %
Adjacent
water(y/n)
Seep (p/a)
Stream (p/a)
Temp. Pond
(p/a)
Perm. Pond
(p/a)
Forest Health
Beech blight (p/a)
Hemlock woolly adelgid
(p/a)
Emerald ash borer (p/a)
Other:
N-S Transect
(117.8ft)
E-W Transect
(117.8ft)
Diam.
(ft.)
Cond.
(1/2)
Bark
(y/n)
Diam.
(ft.)
Cond.
(1/2)
Bark
(y/n)
Coarse Woody Material

20
-PFI Herp Search Data and Wildlife Sign
PFI Plot Number ________________________ Tally Date _____/ _____/ _________
Tallied By ________________________________________ Page ________ of ________
Time of day
Days since significant
rain
Litter moisture rating
Dry Moist Wet
Number of turn-overs
(minimum 10)
Species Name Number Found
1. ____________________________________________ _______________
2. ____________________________________________ _______________
3. ____________________________________________ _______________
4. ____________________________________________ _______________
5. ____________________________________________ _______________
Wildlife Sign / Special Features
_____________________________________________________________________
_____________________________________________________________________
_____________________________________________________________________
_____________________________________________________________________
_____________________________________________________________________
_____________________________________________________________________
_____________________________________________________________________
_____________________________________________________________________

21
-Greenwood Preserve Permanent Plot Location Sheet
PFI Plot Number ________________________ Tally date: ____/ ____/ ________
Tallied by ____________________________________________ Page ________ of
_________
Pictures __________ -___________
Plot Habitat
Description
Deer Impact
Comments/ Travel Description:
______________________________________________________________________________
______________________________________________________________________________
______________________________________________________________________________
_____________________
Map / Directions

22
-PFI Seedling-Sapling Sample Data Sheet
PFI Plot Number __________________________ Tally Date _____/ _____/ ________
Tallied by _______________________________________ Page _______ of _________
Subplot : 11.8’ radius
Seedlings: 4”-- 54” tall
Saplings: 54.1” tall -- 3.99” dbh
North (cont.)
SPP #SDL #SPL
North Subplot
SPP #SDL #SPL
South Subplot
SPP #SDL #SPL
South (cont.)
SPP #SDL #SPL

23
-PFI Overstory Tree Sample Data Sheet
PFI Plot Number _______________________ Tally Date _____/ _____/ ________
Tallied By ______________________
Tree
#
Specie
s
dbh Cavit
y
(y/n)
Crown
class
Tree
#
Specie
s
dbh Cavit
y
(y/n)
Crown
class

24
Appendix B. Educational and Outreach Materials
Checklists of Odonates of Greenwood Sanctuary and Odonates
of Silver Lake
Odonates of Greenwood Sanctuary and Odonates of Silver
Lake handouts
Deer exclosure article for newsletter
Letter to Silver Lake residents regarding hemlock woolly
adelgid

25
Checklist of Odonates at Greenwood Sanctuary
Check Here if Observed Scientific Name Common Name Argia fumipennis violacea Variable Dancer
Calopteryx maculata Ebony Jewelwing
Celithemis elisa Calico Pennant
Enallagma signatum Orange Bluet
Epitheca cynosura Common Baskettail
Erythemis simplicicollis Eastern Pondhawk
Ischnura verticalis Eastern Forktail
Lestes dryas Emerald Spreadwing
Libellula pulchella Twelve-spotted Skimmer
Perithemis tenera Eastern Amberwing

26
Checklist of Odonates at Silver Lake and Highpoint Preserve
Check Here if Observed Scientific Name Common Name
Argia fumipennis violacea Variable Dancer
Argia moesta Powdered Dancer
Enallagma geminatum Skimming Bluet
Enallagma traviatum Slender Bluet
Erythemis simplicicollis Eastern Pondhawk
Libellula incesta Slaty Skimmer
Libellula luctuosa Widow Skimmer
Libellula pulchella Twelve-spotted Skimmer
Perithemis tenera Eastern Amberwing
Plathemis lydia Common Whitetail

27
Eastern Pondhawk
Eastern Amberwing
Common Baskettail Twelve-Spotted Skimmer Variable Dancer
Calico Pennant Eastern Forktail Ebony Jewelwing
Emerald Spreadwing
Orange Bluet
Odonates
Of
Greenwood
Preserve

28
Eastern Pondhawk Common Whitetail Eastern Amberwing
Widow Skimmer Slaty Skimmer Skimming Bluet
Variable Dancer Powdered Dancer
Slender Bluet
Odonates of Silver Lake and
Highpoint Preserve

29
Oh Deer! The Longford Lake Deer Exclosure Experiment
The white-tailed deer is both a charismatic and influential member of our biological
community. Although graceful and stately, deer can greatly impact their own habitat, the
resources of other species, and the forest ecosystem overall. Through extensive browsing, deer
can affect the kinds and numbers of plants present in an area, impair the ability to grow new
trees, and shape the overall structure of the forest, both present and future. The changes brought
about by deer can affect the quality of the forest, and reduce available food and habitat for other
wildlife species.
As selective browsers, deer prefer certain plant species over other less desirable species.
Many of the tree species deer prefer are valued for timber or as wildlife food trees (e.g., oak,
maple). Deer also eat many wildflower and understory plants like trillium and lady slipper, but
tend to avoid ferns and some other plants. By feeding on certain species and leaving others
behind, deer can actually change the plant species and community composition in a forest.
In addition to changing the types of plants, deer can also cause changes in the vertical
structure of the forest. For example, over-browsing of tree seedlings and shrubs creates open,
park-like stands with few preferred food species near the ground and little or no forest
understory. Loss of forest understory affects other wildlife too, particularly those songbirds that
rely on the forest understory for nesting and feeding. In fact, some animal species may become
less abundant in heavily browsed areas, while others may disappear completely where deer have
done there damage.
To determine and demonstrate the severity of impacts deer are having on vegetation and
potential forest regrowth in Susquehanna County, Conservancy members and volunteers from
Rockwell Collins constructed a deer exclosure at Longford Lake. Following an experimental
design created by the Cornell Conservation Education and Research team, black cherry and red
oak seedlings were planted both inside and outside of the exclosure, situated in an open area near
a woodland edge.
After six years, the results have been striking. Ninety-eight percent of the black cherry
seedlings planted inside the exclosure have survived, while only 72% have survived outside the
exclosure. But that is not the whole story. The black cherry seedlings outside of the exclosure
have only grown to an average of 11 inches tall, while those within the exclosure have grown to
an average of 5 ½ feet tall! And browsing effects on the northern red oak seedlings was even
more pronounced. Eighty percent of the red oak seedlings within the exclosure have survived,
while only 30 percent have survived outside of the exclosure. The seedlings inside the exclosure
average about 4 feet in height, compared to survivors on the outside which average only 9
inches. So, overall, most black cherry seedlings were able to withstand multiple years of deer
browsing, but their height was stunted greatly and their chances of ever growing beyond the
reach of deer are probably minimal. Red oak seedlings were much more sensitive to browsing
early on and suffered a higher rate of mortality in the 1st six years, and even slower growth when
browsed repeatedly.

30
From this straightforward experiment, it is clear that deer are having a substantial effect
on the vegetation in the area, and likely are delaying, or even preventing, natural forest
regeneration. After six growing seasons, the planted seedlings within the exclosure have reached
a height sufficient enough to guarantee their escape from the pressures of deer browsing (5-6
feet). Additionally, many trees including red maple, black birch, aspen and apple have seeded
into the exclosure on their own and have grown to heights of five feet or more. This is good
news. Landowners in the region hoping to reforest an open area, or grow young trees
(regenerate) within existing forest, can have similar success by protecting young seedlings from
browsing and watching them thrive.
Inside the deer exclosure (pictured right) the tree seedlings have thrived. Outside the deer exclosure
(pictured left within red circle) seedling mortality has been high and few seedlings have grown taller
than 11 inches high.

31
Dear (Conservancy member, Lake Association member, neighbor at Silver Lake, etc.),
This summer, our Cornell University partners discovered hemlock woolly adelgid on
several hemlock trees in Highpoint Preserve. In addition, two neighboring property owners at
either end of the lake reported finding infested trees on their land. The adelgid is a destructive,
non-native insect pest which presents a serious danger to the hemlock trees along the lake and in
the Preserve, and could pose a threat to the beautiful view enjoyed by all. Quick and decisive
action is very important to slowing the spread of this damaging insect. Once infested, untreated
hemlock trees often die within 4-10 years. In light of this new and serious problem, we are
contacting you and all our neighbors to increase awareness about this pest, and offer assistance.
Hemlock trees help maintain cool water temperatures for fish and other aquatic
organisms and provide important and unique habitat and food resources for wildlife. Therefore,
the loss of our hemlocks could have far-reaching effects beyond just these trees. Sudden and
widespread death of hemlock trees at Silver Lake could further lead to soil erosion on steep
slopes. The cooling shade which hemlock trees now provide along the waters’ edge would be
lost, and could contribute to warmer water temperatures in Silver Lake.
Researchers have been investigating the use of natural adelgid predators (beetles) as
biological controls to manage hemlock woolly adelgid at the landscape scale. These beetles have
been released in a number of locations in both Pennsylvania and New York and show some
promise. However, it may be years before populations of these beetles reach the levels needed to
provide widespread protection. Therefore, for the time being, chemical insecticides are the only
effective option for controlling this pest.
Some of the chemical products used are providing up to 4 years of protection with a
single application. However, application of these products may require professional certification,
and some are restricted from use near water. Because of the complexities involved the Edward L.
Rose Conservancy, in conjunction with our Cornell partners, is offering to coordinate an adelgid
education and control program for property owners in the area.
If you are concerned about the well-being of hemlock trees on your property, and would
like to help slow the spread in and around Highpoint Preserve, we recommend the following:
1) Search each of your hemlock trees for hemlock woolly adelgid – a brochure with
pictures of the adelgid is attached to this email to help you identify the white woolly
masses attached to the underside of twigs near the base of the needles.
2) If you suspect you have hemlock woolly adelgid on any of your trees, please report it by
October 15th
by emailing or calling Kristi Sullivan ([email protected], 607-255-5508).
Kristi is also available to visit your property to confirm that adelgid is present, answer
questions about treatment options, and coordinate treatment for anyone interested.
If we catch this problem early and work together, we may have a chance at beating this
destructive pest.