conrad industries, inc. - otc markets
TRANSCRIPT

Section I
Conrad Industries, Inc. 2016 ANNUAL REPORT

2
TABLE OF CONTENTS REPORT TO OUR FELLOW SHAREHOLDERS .................................................................................................................. 3 An Important Note About This Report ..................................................................................................................................... 4 Business Overview .................................................................................................................................................................... 5
General ................................................................................................................................................................................. 5 Operations ............................................................................................................................................................................. 7 Customers ............................................................................................................................................................................. 9 Contract Procedure, Structure and Pricing............................................................................................................................ 9 Bonding and Guarantee Requirements ............................................................................................................................... 10 Engineering ......................................................................................................................................................................... 10 Materials and Supplies ........................................................................................................................................................ 10 Vessel Construction Process ............................................................................................................................................... 11 Competition ........................................................................................................................................................................ 11 Employees .......................................................................................................................................................................... 11 Insurance ............................................................................................................................................................................. 11 Regulation ........................................................................................................................................................................... 12 Risk Factors ........................................................................................................................................................................ 12
Properties ............................................................................................................................................................................... 18 Morgan City Shipyard ........................................................................................................................................................ 18 Amelia Shipyards ............................................................................................................................................................... 18 Conrad Orange Shipyard .................................................................................................................................................... 19
Legal Proceedings .................................................................................................................................................................. 19 Market for the Company’s Common Equity, Related Stockholder Matters and Issuer Purchases of Equity Securities ......... 19 Selected Financial Data ......................................................................................................................................................... 21 Management’s Discussion and Analysis of Financial Condition and Results of Operations ................................................. 23
Overview ............................................................................................................................................................................ 23 Results of Operations .......................................................................................................................................................... 26 Liquidity and Capital Resources ......................................................................................................................................... 28
Directors and Executive Officers ............................................................................................................................................ 30 Executive Compensation ......................................................................................................................................................... 32 Directors’ Compensation ....................................................................................................................................................... 33 Security Ownership of Certain Beneficial Owners and Management and Related Stockholder Matters ............................... 34 Certain Relationships and Related Transactions ................................................................................................................... 35 Financial Statements and Quarterly Financial Data ............................................................................................................. 36
FORWARD-LOOKING-STATEMENTS In this Annual Report and in the normal course of business, we, in an effort to help keep our stockholders and the public informed about our operations, may from time to time issue or make certain statements, either in writing or orally, that are or contain forward looking statements. All statements contained herein, other than statements of historical fact, are forward looking statements. When used in this Annual Report, the words “anticipate,” “believe,” “estimate” and “expect” and similar expressions are intended to identify forward looking statements. Such statements reflect our current views with respect to future events and are subject to certain risks, uncertainties and assumptions, including our reliance on cyclical industries, our reliance on principal customers and government contracts, the outcome of the claims process for economic damages under the Deepwater Horizon Court-Supervised Settlement Program, our ability to perform contracts at costs consistent with estimated costs utilized in bidding for the projects covered by such contracts, variations in quarterly revenues and earnings resulting from the percentage of completion accounting method, the possible termination of contracts included in our backlog at the option of customers, operating risks, competition for marine vessel contracts, our ability to retain and implement effective succession plans for key management personnel and to continue to attract and retain skilled workers, state and federal regulations, the availability and cost of capital, and general industry and economic conditions. These and other risks and assumptions are discussed in more detail in our Annual Report. Should one or more of these risks or uncertainties materialize, or should underlying assumptions prove incorrect, actual results may vary materially from those anticipated, believed, estimated or expected. We do not intend to update these forward looking statements. Although we believe that the expectations reflected in such forward looking statements are reasonable, no assurance can be given that such expectations will prove correct.

3
REPORT TO OUR FELLOW SHAREHOLDERS The year 2016 was another challenging one for our Company, and while our financial results were not as strong as in recent years, we continued to invest in our Company to increase our capabilities and competitiveness. For 2016, we recognized total revenues of $164.4 million, a net loss of $1.7 million, loss per diluted share of -$0.33, and EBITDA (earnings before interest, taxes, depreciation and amortization) of $4.7 million, compared to 2015, when we recognized total revenues of $263.8 million, net income of $10.6 million (including $5.9 million in research and development tax credits), earnings per diluted share of $1.86, and EBITDA of $12.7 million. During 2016 our new construction segment was adversely affected by a soft market for energy transportation, increased pricing pressure, and customer delays on large project orders, while our repair and conversion segment continues to be impacted by low crude oil prices. These factors also had a negative impact on our operating results in 2015, and they may continue to impact our operations during 2017. In addition, our 2016 and 2015 operating results were affected by a $13.2 million loss and a $4.0 million loss, respectively, on the LNG Barge. The losses on the LNG barge primarily relate to vessel changes required by regulatory authorities, which increased costs and caused delays, and higher than expected equipment costs, resulting from the vessel being the first of its kind produced in North America. While most of the regulatory review process has been completed, we continue to have regulatory and execution risk associated with completing the vessel. We have adjusted our anticipated delivery date to the latter part of 2017. Despite the losses we have incurred on the construction of the LNG Barge, the first vessel of its kind ever constructed in North America, we believe that we have developed the resources to establish ourselves as a leader in LNG marine-related construction in North America. To remain competitive, we must be able to respond to customer demands for new types of vessels. For example, in recent years, we have constructed barges larger than those we constructed historically, including 55,000 and 80,000 barrel tank barges, and articulated tug barges (ATBs) consisting of a large tank barge and a related tug that is positioned in a notch in the stern of the barge, enhancing the maneuverability of the barge. While these projects can entail additional risk, they can also provide us access to new customers and markets and provide more consistent backlog for a longer period of time than smaller projects. Pursuant to our capital improvement program, we have invested an aggregate of $61.9 million in our facilities over the last five years. We believe these improvements have increased our operational capacity, operating efficiency and competitiveness. During 2016, our capital improvement investments focused on the continued development of our Deepwater South facility. Of the aggregate $6.9 million invested in capital improvements during the year, $5.3 million was dedicated to the Deepwater South location. Among these improvements is a panel line building equipped with an automated welding system. Construction of the building began during 2015 and was completed during the third quarter of 2016. Other capital investments made during 2016 allowed us to replace leased equipment with Company owned equipment and make additional improvements to our other facilities. Our Board of Directors has approved $3.8 million for the continuation of our capital investment program during 2017, which includes $1.5 million specifically designated for further enhancements to our Deepwater South facility.
During 2016 we continued our quarterly dividend program, paying a total of $2.1 million in dividends as part of our ongoing efforts to return value to our stockholders. From and including our first special dividend in December 2012, we have paid a total of $37.4 million in dividends to our stockholders. Dividends are paid at the discretion of our Board and depend on the Company’s financial performance, cash requirements, outlook, and any other factors that the Board deems relevant. After the consideration of these factors, our Board elected not to declare a dividend during the first quarter of 2017. Our stock repurchase program also continued during 2016. Over the course of the fiscal year, we repurchased 245,633 shares of our common stock for an aggregate purchase price of $4.8 million. Since the program’s inception in 2010, we have repurchased a total of 1,352,771 shares of our common stock for a purchase price in excess of $27.4 million. As of December 31, 2016, $2.8 million remained available for future repurchases of common stock under our stock repurchase program. During 2016, we worked with 124 different customers engaged in a wide range of business activities including the towing, transportation, dredging, construction, and bunkering industries, and the oil and gas industry in the Gulf of Mexico (the “energy sector”). We also worked with federal, state, and local government agencies, including the US

4
Army Corps of Engineers and the US Coast Guard. We delivered 31 vessel construction projects, which consisted of 9 aggregate barges, 7 tank barges, an LPG barge, a tug, a crane barge, 3 deck barges, 2 anchor barges, 2 dry bulk barges, a ferry and 4 spud barges. By segment, 82.5% of our total 2016 revenue was generated by our new construction, and 17.5% was generated by repair and conversion compared to 89.1% and 10.9% for 2015, respectively. The majority of this revenue, 87.6%, was derived from commercial customers operating outside of the energy sector, 3.2% was related to the energy sector contracts, and 9.2% was government related, compared to 71.1%, 15.6% and 13.3%, respectively, during 2015. We also added $131.4 million of backlog to our new construction segment, resulting in a total backlog of $216.5 million at December 31, 2016, compared to $211.8 million at the close of 2015. At December 31, 2016, 86.3% of our vessel construction backlog was from contracts with commercial customers not operating in the energy sector and 13.7% was from government contracts. Our management is focused on effectively executing our backlog. To enhance our financial flexibility, on November 21, 2016, we entered into a new loan agreement, which provides for a $15 million term loan and $10 million revolving credit facility and supersedes all of our prior loan agreements. The revolving credit facility matures on April 30, 2019 and the interest rate is the prime rate, or one-month LIBOR plus 1.5%, at our option. As of December 31, 2016, no amounts were drawn down on the revolving credit facility. The term loan has a 120-month amortization, a 3.5% fixed interest rate, and can be prepaid without penalty at any time. The loans are secured by accounts receivable, deposit accounts and chattel paper, and by two dry-docks. While the new loan agreement restricts mergers and liens on the collateral and the capital stock of our subsidiaries, it does not restrict our ability to pay dividends or repurchase shares of common stock, subject to our compliance with financial covenants. Throughout our 69 year history, we have used our cash and debt to make investments in our business, continue to diversify our product mix, take advantage of business opportunities and improve efficiency. We believe this has allowed us to remain competitive, meet evolving customer needs and effectively navigate a cyclical business. Our primary goal has always been, and remains, the enhancement of shareholder value. In pursuit of this objective, we have returned cash to our shareholders through our stock repurchase program and the payment of dividends. Although we expect 2017 to be another challenging year, we are optimistic about the long-term prospects of our business. We have met these types of challenges in the past, and we remain confident that with our talented and dedicated employees, strong balance sheet and diversified customer base we can effectively respond to changing market conditions. Yours truly, /s/ John P. Conrad, Jr.
John P. Conrad, Jr. President, Chief Executive Officer and Chairman of the Board
An Important Note About This Report
Effective March 31, 2005, Conrad Industries, Inc. is no longer subject to the reporting requirements of Section 13(a) or 15(d) of the Securities Exchange Act of 1934(the “Act”). Accordingly, this Annual Report is not filed with the Securities and Exchange Commission, is not available on the SEC’s EDGAR system, and does not purport to meet the requirements for companies that are subject to the Act’s reporting requirements. The Company does intend in this Annual Report and other reports to provide accurate financial and other information of interest to investors. Information in this Annual Report has not been reviewed or audited by our independent certified public accountants, except for the audited financial statements included in Section III. This Annual Report and other periodic reports to shareholders are available on the Company’s website,www.ConradIndustries.com , and at www.otcmarkets.com. Interested persons may also request copies directly from the Company; please direct requests and inquiries to Chief Financial Officer, Conrad Industries Inc., P. O. Box 790, Morgan City, LA, 70381, telephone (985) 702-0195.

5
Business Overview General We specialize in the construction, repair and conversion of a wide variety of steel and aluminum marine vessels for commercial and governmental customers. Through our subsidiaries, we operate five shipyards: one in Morgan City, Louisiana, three in Amelia, Louisiana and one in Orange, Texas. Our Company was founded in 1948 and commenced operations at our shipyard in Morgan City. From 1996 through 2003, we acquired and expanded our Conrad Amelia yard, our Conrad Orange yard and our second yard in Amelia, Conrad Deepwater. In 2012 we purchased 50 acres of property adjacent to our Conrad Deepwater yard and built our Conrad Deepwater South yard, which delivered its first vessel in the first quarter of 2014. We have continued to construct significant improvements at our Conrad Deepwater South yard, including a panel line building with an automated welding system completed during the third quarter of 2016. During the past five years, we have made an aggregate of approximately $61.9 million of capital expenditures to add capacity and improve the efficiency of our shipyards. Our business has two segments: new construction, and repair and conversion. Our new construction segment accounted for 82.5%, 89.1%, and 78.2% of our total revenue for 2016, 2015 and 2014, respectively. Vessels we construct include barges, tug boats, tow boats, ferries, lift boats and aluminum crew/supply vessels. Much of our new construction is performed indoors, which we consider to be a significant strategic advantage. Our repair and conversion segment accounted for 17.5%, 10.9%, and 21.8% of our total revenue for 2016, 2015 and 2014, respectively. We repair a wide variety of marine vessels. Our conversion projects are included in our repair segment and primarily consist of lengthening the midbodies of vessels, modifying vessels to permit their use for a different type of activity and other modifications to increase the capacity or functionality of a vessel. We serve a variety of customers and markets, including the Gulf of Mexico oil and gas industry (“energy”), other commercial markets, various local and state governments and the U.S. government. In 2016, 3.2% of total revenue related to the Gulf of Mexico oil and gas industry, 87.6% was other commercial and 9.2% was government related. We believe that our ability to provide products and services to a variety of customers and to respond to demand for new types of vessels is a competitive strength. The demand for our products and services is dependent upon a number of factors, including the economic condition of our customers and markets, the age and state of repair of the vessels operated by our customers and the relative cost to construct a new vessel as compared with repairing an older vessel. To remain competitive, we must also be able to respond to changing customer demands for new types of vessels. For example, in recent years, we have constructed barges larger than those we constructed historically, including 55,000 and 80,000 barrel tank barges, and articulated tug barges (ATBs) consisting of a large tank barge and a related tug that is positioned in a notch in the stern of the barge, enhancing the maneuverability of the barge. In April 2010, the Deepwater Horizon rig, which was engaged in deepwater drilling operations in the Gulf of Mexico, sank after an explosion and fire, resulting in the discharge of substantial amounts of oil. On May 28, 2010, the Department of Interior imposed a moratorium on offshore deepwater drilling operations, which was lifted on October 12, 2010. However, due to the incident and new regulatory and permitting issues, deepwater and shallow water drilling was slowed, which adversely affected our business. In December 2012 and February 2013, the Company submitted claims to the BP Settlement Fund in accordance with the Deepwater Horizon Court-Supervised Settlement Program, totaling $22.6 million. Certain of our businesses are located within the economic zones included in the class settlement and we believe that the damage calculations have been made in accordance with the guidelines established for the BP Settlement Fund; however, the amounts awarded to us may be less than the amounts we submitted and some or all of our claims may be rejected. Since June 2013, our claims have been in “moratoria review,” which is a review to determine whether losses are related to the BP oil spill and not the federal government’s moratorium on offshore drilling that followed the spill, as moratoria losses are not recoverable under the settlement program. We cannot predict the timing of the resolution of this matter or whether we will ultimately receive any award, although the continuing resistance of BP to a reasonable resolution or settlement of the claims in moratoria review leads to significant uncertainty regarding whether we will recover any material amount from the settlement program. No amounts related to the claims have been recorded in our financial statements at December 31, 2015 and 2016. For additional information, see Note 12 to our financial statements included with this report.

6
A significant portion of our historical revenues was derived from customers in the Gulf of Mexico oil and gas industry. When there has been a decline in new construction opportunities in the Gulf of Mexico oil and gas industry, we have been successful in securing work from government sources and other commercial customers. We saw in 2009, 2010 and 2011 a major increase in projects for other commercial customers as well as government projects. In 2012 and 2013, we saw increases in the commercial market and some increases in the energy market; however there was a decrease in the government market. The increase in commercial customer demand was driven largely by customers acquiring inland tank barges to transport petroleum products resulting from the use of horizontal drilling in conjunction with hydraulic fracturing, which has expanded the ability of producers to recover natural gas and oil from low-permeability geologic plays, particularly shale plays. During 2014, 2015 and 2016, we experienced a decline in demand for these types of inland tank barges, and a softer repair market, due to declining oil prices. Other commercial contracts accounted for approximately 86.3%, 93.4%, and 65.7% of our backlog at December 31, 2016, 2015 and 2014, respectively. Government contracts accounted for approximately 13.7%, 5.2%, and 20.8% of our backlog at December 31, 2016, 2015 and 2014, respectively. Energy contracts accounted for approximately 0%, 1.4%, and 13.5% of our backlog at December 31, 2016, 2015 and 2014, respectively. Other commercial markets includes barges and motorized vessels used in a variety of commercial markets that are not related to the offshore oil and gas industry, including the marine construction industry, the petrochemical industry, the commodity grain industry and the ocean shipping industry. Many of these industries utilize barges and motorized vessels to transport products through inland waterways as well as offshore coastal waters and ocean waters. During 2016, we added $131.4 million of backlog, which are related to commercial and government contracts. Our backlog was $216.5 million at December 31, 2016 as compared to $211.8 million at December 31, 2015. During 2015, we added $269.1 million to our new construction segment, which was related to commercial, government and energy contracts. For 2016, 2015 and 2014, we received approximately 3.2%, 15.6%, and 35.3%, respectively, of our total revenues from customers in the Gulf of Mexico oil and gas industry, 9.2%, 13.3%, and 2.7% from government customers and 87.6%, 71.1%, and 62.0% from other commercial customers. Because a large percentage of our repair work is derived from the Gulf of Mexico oil and gas industry, conditions in that industry affect our repair segment. There was an increase in revenue and gross profit in the repair and conversion segment starting in the fourth quarter of 2005 and continuing for 2006, 2007 and 2008 related to increased oil and gas activities in the Gulf of Mexico and the impacts of Hurricanes Katrina, Rita, Gustav and Ike. Although we had strong activity in our repair segment during the first quarter of 2009, we experienced lower repair gross profits in 2009, 2010 and 2011 as a result of a significant decrease in demand and profitability primarily due to decreased customer activity in the Gulf of Mexico, which we believe resulted from the Deepwater Horizon incident and economic uncertainties. In 2012 we experienced a slightly higher gross profit in the repair segment resulting from an increase in production hours and a few more profitable jobs as compared to 2011, when we incurred losses on a few jobs. In 2013, we experienced our highest revenue in our repair segment in the history of the Company, and it exceeded our previous highest repair segment revenue in 2008 by $7.4 million. We experienced lower repair gross profits in 2014 due to a significant loss on a large conversion job, and a decrease in demand and customer activity, which we believe was due to the decline in crude oil prices. In 2015, we had the lowest repair revenue and repair production hours since 2005 due to a significant decrease in demand and customer activity, due to the decline in crude oil prices and Gulf of Mexico activity. In 2016, our repair revenue and repair production hours were slightly higher than prior year. Internal Expansion During 2016, we continued to do capital improvements, purchase equipment and develop our Deepwater South location in the amount of $5.3. These improvements included a panel line building equipped with automated welding systems that was completed in 2016. At our Orange location, we purchased equipment to build the LNG vessel. In total $6.9 million was spent on capital expenditures for the year ended December 31, 2016. During 2015, we continued to do capital improvements, purchase equipment and develop our Deepwater South location in the amount of $14.9 million. These improvements include a panel line building equipped with automated welding systems that was completed during the third quarter of 2016. At our Orange location, we purchased

7
equipment and improved our infrastructure to build the LNG vessel. In total $17.5 million was spent on capital expenditures for the year ended December 31, 2015. During 2014, we purchased real estate for $1.3 million at our Morgan City location, as well as replaced equipment. We made plant improvements and purchased machinery and equipment for our new facility, Deepwater South in the amount of $3.4 million. At our Deepwater location, we completed bulkheads and utility services in the amount of $1.4 million. At our Orange location, we completed plant improvements in the amount of $2.0 million. At our Conrad Aluminum facility, we purchased machinery and equipment. In total $9.9 million was spent on capital expenditures for the year ended December 31, 2014. During 2013, we purchased real estate at our Morgan City location, as well as replaced equipment. We made plant improvements and purchased machinery and equipment for our new facility, Deepwater South in the amount of $1.9 million. At our Deepwater location we refurbished one of our drydocks in the amount of $1.5 million. At our Orange location, we were in the process of doing plant improvements. At our Conrad Aluminum facility, we extended the bulkheads and completed property improvements in the amount of $1.8 million. In total $12.4 million was spent on capital expenditures for the year ended December 31, 2013. During 2012, we purchased 50 acres of land adjoining our Deepwater facility for $5.6 million. We made repairs and upgrades to our railway launching system for $3.7 million at our Orange facility. We did property improvements at our various locations in the amount of $1.1 million. We replaced rental equipment with Company owned equipment and upgraded equipment to provide improved functionality and efficiency. In total $15.3 million was spent on capital expenditures for the year ended December 31, 2012. History Our company was founded in 1948 by J. Parker Conrad, Chairman Emeritus of our Board of Directors, and began operations at our shipyard in Morgan City, Louisiana. In December 1997, we paid approximately $22.8 million in cash (net of cash acquired) to purchase all of the stock of Orange Shipbuilding Company, Inc., which owns our shipyard in Orange, Texas. The acquisition expanded our new construction capacity and expanded our product capabilities into additional types of marine vessels, including vessels for the U.S. government and modular components for offshore drilling rigs and floating, production, storage and offloading vessels. Orange Shipbuilding has been engaged in shipbuilding since 1974, and on June 29, 2012 Orange Shipbuilding Company, Inc.’s name was changed to Conrad Orange Shipyard, Inc. Our parent company Conrad Industries, Inc. was incorporated in March 1998 to serve as the holding company for our wholly-owned subsidiaries, currently Conrad Shipyard, L.L.C., Conrad Orange Shipyard, Inc. and Conrad Aluminum, L.L.C. We completed our initial public offering in June 1998 by issuing 2.1 million shares of common stock. On March 30, 2005 we voluntarily delisted our common stock from Nasdaq and, simultaneously with delisting, filed a Form 15 with the Securities and Exchange Commission (the "SEC") to voluntarily deregister our common stock under the Securities Exchange Act of 1934, as amended (the "Exchange Act") and to suspend our obligation to file reports under Section 15(d) of the Exchange Act. We were eligible to deregister by filing a Form 15 because we had fewer than 300 holders of record of common stock. At the time of filing, our obligation to file certain reports with the SEC, including Forms 10-K, 10-Q, and 8-K, immediately ceased. Operations Our principal operations consist of the construction, repair and conversion of a wide variety of steel and aluminum marine vessels for commercial and governmental customers. Backlog Our backlog as of December 31, 2016 consisted of 23 vessels: 1 - 30,000 BBL offshore tank barge, 1 - 55,000 BBL tank barge, 3 - 80,000 BBL tank barges, 1 deck barge, 2 stop log barges, 1 spud barge, 2 crane barges, 7 ATB tugs, a LNG barge and 4 Damen Stan Tugs. Our backlog (including remaining contract revenue for projects currently in progress) as of December 31, 2016 was approximately $216.5 million compared to $211.8 million as of December 31, 2015. We anticipate that all of the aggregate remaining revenue from firm contracts as of December 31, 2016

8
will be realized during fiscal 2017, 2018, and 2019. As of December 31, 2016, approximately 75.8% of our backlog related to contracts for two commercial customers. Construction of Vessels We construct a variety of small, medium, and large sized vessels for commercial and governmental customers. This activity accounted for 82.5%, 89.1% and 78.2% of our total revenue for 2016, 2015 and 2014, respectively. Much of our new vessel construction is done indoors in well-lighted space specifically designed to accommodate construction of marine vessels up to 350 feet in length. As a result, marine vessel construction is not hampered by weather conditions, and we are able to more effectively utilize our workforce and equipment. We continue development of the Conrad Deepwater South yard which will enhance our ability to build larger vessels up to 600 feet in length. The following is a description of the main types of vessels we manufacture: Offshore and Inland Barges. We build a variety of offshore barges, including container barges, double-skinned tank barges, pressurized tank barges, liquefied petroleum gas barges, and deck barges for commercial customers. Additionally, we have built YCs (yard carrier barges) and YONs (yard oiler Navy barges) for the U.S. Navy. We also build a variety of inland barges, including deck, crane, hopper, liquefied petroleum gas, and double skinned tank barges up to 83,000 BBL capacity. We have constructed a variety of barges used in the offshore oil and gas industry, including shale barges, pipe laying barges, oil and gas drilling barges, and oil and gas production barges. Our barges are also used in marine construction and are used by operators to carry liquid cargoes such as petroleum and drilling fluids, dry bulk cargoes such as aggregate, coal and wood products, deck cargoes such as machinery and equipment, and other large item cargoes such as containers and rail cars. Other barges function as cement offloaders and split-hull dump scows. We have built barges ranging from 50 feet to 400 feet in length, with as many cargo tanks, decks and support systems as necessary for the intended functions of the barges. During March 2015 we entered into a contract to construct the first LNG bunker barge to be built for the marine market in North America. Lift Boats. Lift boats are used primarily to furnish a stable work platform for drilling rigs, to house personnel, equipment and supplies for such operations and to support construction and ongoing operation of offshore oil and gas production platforms. Lift boats are self-propelled, self-elevating and self-contained vessels that can efficiently assist offshore platform construction and well servicing tasks that traditionally have required the use of larger, more expensive mobile offshore drilling units or derrick barges. Lift boats have different water depth capacities and have legs, ranging from 65 to 250 feet, which are used to elevate the deck of the boat in order to perform required procedures on a platform at different heights above the water. Tug Boats/Push Boats/Tow Boats. We build boats for towing and pushing, anchor handling, mooring and positioning, dredging assistance, tanker escort, port management, shipping, piloting, firefighting and salvage. Other Offshore Support Vessels. In addition to lift boats and tug boats, we build other types of offshore support vessels that serve exploration and production facilities and support offshore construction and maintenance activities. These offshore support vessels include supply vessels, utility vessels and anchor handling vessels. Ferries. We build aluminum and steel ferries for State agencies and Puerto Rico that transport passengers and vehicles. Drydocks. Drydocks are used to lift marine vessels from the water in order to facilitate the inspection and/or repair of the vessels’ underwater areas. A drydock is composed of a floodable pontoon with wing walls and its designated capacity identifies the number of tons it is capable of safely lifting from the water. The drydock is submerged by opening valves to flood compartments; the vessel is then placed over the submerged deck of the drydock; and the vessel is lifted from the water by closing the valves and pumping the water out of the flooded compartments. Repair and Conversion Services Repair and conversion services accounted for 17.5%, 10.9%, and 21.8% of our total revenue for 2016, 2015 and 2014, respectively. We have six drydocks, a 300 ton travel lift and dockside space capable of accommodating vessels and barges up to 500 feet long. Our marine repair activities include shot blasting, painting, electrical system

9
and piping repairs, propeller and shaft reconditioning and American Bureau of Shipping certified welding. Our conversion projects primarily consist of lengthening the midbodies of vessels, modifying vessels to permit their use for a different type of activity and other modifications to increase the capacity or functionality of a vessel. All U.S. Coast Guard inspected vessels and ABS classed vessels are required to undergo periodic inspections and surveys which require regular drydock examination. Non-U.S. flag vessels are subject to similar regulations. The inspection of vessels generally results in repair work being required in order to pass inspection. In addition, vessel owners often elect to make other repairs or modifications to vessels while in drydock undergoing required repairs. While we are not aware of any proposals to reduce the frequency or scope of such inspections, any such reduction could adversely affect our results of operations. Our repair and conversion business tends to be seasonal, with increases in the colder months in the Gulf of Mexico during the latter part of our fourth quarter and beginning of our first quarter. During this time, vessel owners and operators tend to repair or modify their vessels as a result of or in anticipation of work during the warmer months in the Gulf of Mexico. Customers We service a wide variety of customers. Customers include marine service companies, offshore support companies, rig fabricators, offshore and inland barge and support vessel operators, offshore construction and drilling contractors, diving companies, energy companies, the U.S. Army, U.S. Army Corps of Engineers, U.S. Navy, U.S. Coast Guard and various state and local governmental agencies, many of whom have been our customers on a recurring and long-term basis. We have also provided and continue to provide repair and conversion services to many of the major offshore support vessel companies and barge operators. Our principal customers may differ substantially on a year-to-year basis due to the size and limited number of new construction projects performed each year. All of our customers for the last three years have been domiciled in the United States and Puerto Rico, but we are currently pursuing projects with foreign businesses. During 2016, we derived 28% of our revenue from one customer for which we constructed or have under construction 2 - 35,000 BBL tank barges, 3 - 80,000 BBL tank barges, 3 - 55,000 BBL tank barges and 3 ATB tugs, and 25% from another customer for which we constructed or have under construction, a barge, and 4 ATB tugs. The remaining 47% of the revenue was attributable to 122 other customers. During 2015, we derived 20% of our revenue from one customer for which we constructed or have under construction 5 - 35,000 BBL tank barges, 4 - 80,000 BBL tank barges, 3 - 55,000 BBL tank barges and 3 ATB tugs, and 11% from another customer for which we have under construction a ferry and 10% from another customer for which we constructed or have under construction 4 - 30,000 BBL tank barges, a 80,000 BBL tank barge, and an ATB tug. The remaining 59% of the revenue was attributable to 137 other customers. During 2014, we derived 12% of our revenue from one customer for which we constructed 8 - 35,000 BBL tank barges and 11% from another customer for which we constructed 4 - 30,000 BBL tank barges, 2 tow boats and 3 ATB tugs. The remaining 77% of the revenue was attributable to 140 other customers. Contract Procedure, Structure and Pricing Our contracts for new commercial construction projects generally are obtained through a competitive bidding process. In addition, contracts for the construction and conversion of vessels for the U.S. government are generally subject to competitive bidding. We submit a large number of bids to commercial customers. However, because the bidding process for U.S. government contracts is significantly more detailed and costly, we tend to be more selective regarding the government projects on which we bid. Most of the construction contracts we enter into, whether commercial or government, are fixed-price contracts under which we retain all cost savings on completed contracts but are liable for all cost overruns. Contracts with the U.S. government and some commercial customers are subject to termination by the customer either for their convenience or upon our default. If the termination is for the customer’s convenience, the contracts provide for payment upon termination for items delivered to and accepted by the customer, payment of our costs

10
incurred through the termination date, and the costs of settling and paying claims by terminated subcontractors, other settlement expenses and a reasonable profit. Although varying contract terms may be negotiated on a case-by-case basis, our commercial and government contracts ordinarily provide for a down payment, progress payments at specified stages of construction and a final payment upon delivery. Final payment under certain contracts may be subject to deductions if the vessel fails to meet certain performance specifications based on tests we conduct prior to delivery, although it has been very rare. Under commercial contracts, we generally provide a six-month to twelve-month warranty with respect to workmanship and materials we furnish. In the majority of commercial contracts, we pass through the respective suppliers’ warranties to the customer and do not warrant materials acquired from our suppliers. Our government contracts typically contain warranties up to two years covering both materials and workmanship. Historically, our expenses to fulfill such warranty obligations have not been material in the aggregate. The work performed on vessels is subject to acceptance by the U.S. Coast Guard and, in some cases, by the American Bureau of Shipping or other classification societies. In addition, the work and the finished vessel are subject to acceptance by the customer based on the contract plans and specifications. If we fail to meet the regulatory or customer requirements additional work could be required which could increase the cost of the job. Although there are instances where some rework is required, typically, these situations have had only a minor impact on the progress of the job and the amount of revenue and profit recognized. We monitor our progress on our contracts, including whether we are meeting the regulatory and customer requirements, and take that into account when calculating our estimates at completion. Bonding and Guarantee Requirements Although we generally meet financial criteria that exempt us from bonding and guarantee requirements for most contracts, certain contracts with federal, state or local governments and commercial customers may require contract bid and performance bonds if requested by the customer. As of December 31, 2016, outstanding bonds and letters of credit amounted to $63.5 million. Although we believe that in the future we will be able to obtain bonds, letters of credit, and similar obligations on terms we regard as acceptable, there can be no assurance we will be successful in doing so. Engineering We generally build vessels based on our customers’ design, drawings and specifications. We also develop in-house custom designs for customers’ special requirements using our computer-aided design (CAD) capabilities and outside engineering services. We have designed and built numerous barges, tow boats, tug boats and other vessels. This library of projects allows us to respond quickly to customers’ needs. The process of computer drafting, preparation of construction drawings and development of cut tapes for numerically controlled plasma cutting of steel with the latest 3-D software programs allows us to minimize engineering mistakes and costly rework. Materials and Supplies The principal materials we use are standard steel shapes, steel plate and paint. Other materials used in large quantities include aluminum, steel pipe, electrical cable and fittings. We also purchase component parts such as propulsion systems, hydraulic systems, generators, auxiliary machinery and electronic equipment. Additionally, we purchase the tanks used in our LPG barges from third parties. All these materials and parts are currently available in adequate supply from domestic and foreign sources. However, in late 2003, the price of steel and steel delivery times began to increase substantially and we were experiencing challenges in finding certain steel sizes. Steel prices increased significantly during most of 2008 before declining in the latter part of 2008 and the first quarter of 2009. Prices did not fluctuate significantly in 2009. We experienced significant increases in the price of steel during 2010. Steel prices increased during 2011 approximately 10 percent. We experienced a slight decrease in steel prices in the beginning of 2012 due to a decrease in global demand for steel. From 2012 to 2014 steel prices remained relatively flat, and we experienced a slight decrease in 2015 and most of 2016. In the later part of 2016 we started experiencing a slow increase in steel prices. All of our shipyards obtain materials and supplies by truck or rail.

11
Vessel Construction Process Once a contract has been awarded to us, a project manager is assigned to supervise all aspects of the project, from the date the contract is signed through delivery of the vessel. The project manager oversees the engineering liaison’s completion of the vessel’s drawings and supervises the planning of the vessel’s construction. The project manager also oversees the purchasing of all supplies and equipment needed to construct the vessel, as well as the actual construction of the vessel. We construct each vessel from raw materials, which are fabricated by shipyard workers into the necessary shapes to construct the hull and vessel superstructure. We purchase component parts, such as propulsion systems, hydraulic systems and generators, auxiliary machinery and electronic equipment, separately and install them or have them installed in the vessel. Additionally, we purchase the tanks used in our LPG barges separately from third parties. We use job scheduling and costing systems to track progress of the construction of the vessel, allowing ourselves and the customer to remain apprised of the status of the vessel’s construction. With the assistance of computers, construction drawings and bills of materials are prepared for each module to be fabricated. Modules are built separately, and penetrations for piping, electrical and ventilation systems for each module are positioned and cut during the plasma cutting operation. Piping, raceways and ducting are also installed prior to the final assembly of modules. After the modules are assembled to form the vessel, piping, electrical, ventilation and other systems, as well as machinery, are installed prior to launching, testing and final outfitting and delivery of the vessel. Competition U.S. shipbuilders are generally classified into two categories: (1) the two largest shipbuilders, which are capable of building large scale vessels such as aircraft carriers and battleships for the U.S. Navy and oceangoing cargo vessels for commercial customers; and (2) other shipbuilders that build small to medium-sized vessels for government and commercial markets. We compete in the second of these categories. We compete for U.S. government contracts to build small to medium-sized vessels principally with four to six U.S. shipbuilders, which may include one or more of the two largest shipbuilders. We compete for domestic commercial shipbuilding contracts principally with approximately ten to fifteen U.S. shipyards. The number and identity of competitors on particular projects vary greatly depending on the type of vessel and size of the project, but we generally compete with only three or four companies with respect to a particular project. We compete with approximately ten shipyards in our repair and conversion business. Competition is based primarily on price, available capacity, service, quality, and geographic proximity. Employees At December 31, 2016 we had 468 employees of which 113 were salaried and 353 were hourly. At December 31, 2015 we had 517 employees of which 112 were salaried and 405 were hourly. At December 31, 2014, we had 593 employees of which 102 were salaried and 491 were hourly. In addition, we use subcontract employees to fill openings that are short-term in nature or when we cannot find people to hire. These totaled 425, 478, and 624 at December 31, 2016, 2015, and 2014, respectively. We are not a party to any collective bargaining agreements. Insurance We maintain insurance against property damage caused by fire, flood, explosion and similar catastrophic events that may result in physical damage or destruction to our facilities and equipment. The insurance currently excludes acts of terrorism as we have determined that this coverage is not available at a reasonable cost. We generally do not have business interruption insurance. We also maintain commercial general liability insurance, including builders’ risk coverage, employment practices, professional (design), and directors and officer’s liability. We currently maintain excess and umbrella policies. Other coverages currently in place include workers compensation, water pollution, automobile, and hull/property and indemnity. All policies are subject to deductibles and other coverage limitations. Due to the impact of Hurricanes Katrina and Rita in the Gulf Coast region our property insurance costs and deductibles increased significantly during 2007 and 2008. Rates have stabilized since 2009.

12
Regulation Environmental Regulation We are subject to extensive and changing federal, state and local laws (including common law) and regulations designed to protect the environment, including laws and regulations that relate to air and water quality, impose limitations on the discharge of pollutants into the environment and establish standards for the treatment, storage and disposal of toxic and hazardous wastes (‘‘Environmental Laws’’). Because industrial operations have been conducted at some of our properties by previous owners and operators and by us for many years, various materials from these operations might have been disposed of at such properties. This could result in obligations under Environmental Laws, such as requirements to remediate environmental impacts.
Although no assurances can be given, we believe that our operations are in compliance in all material respects with all Environmental Laws. However, stricter interpretations and enforcement of Environmental Laws and compliance with potentially more stringent future Environmental Laws could materially and adversely affect our operations.
Health and Safety Matters Our facilities and operations are governed by laws and regulations, including the federal Occupational Safety and Health Act, relating to worker health and workplace safety. We believe that appropriate precautions are taken to protect employees and others from workplace injuries and harmful exposure to materials handled and managed at our facilities. While we do not anticipate that we will be required in the near future to expend material additional amounts by reason of such health and safety laws and regulations, we are unable to predict the ultimate cost of compliance with these changing regulations. Jones Act Section 27 of the Merchant Marine Act of 1920 (the “Jones Act”) requires that all vessels transporting products between U.S. ports must be constructed in U.S. shipyards, owned and crewed by U.S. citizens and registered under U.S. law, thereby eliminating competition from foreign shipbuilders with respect to vessels to be constructed for the U.S. coastwise trade. Many customers elect to have vessels constructed at U.S. shipyards, even if such vessels are intended for international use, in order to maintain flexibility to use such vessels in the U.S. coastwise trade in the future. Risk Factors Our business is subject to significant risks. The following section discusses material risks that may impact our business and identifies important factors that could cause our actual results to differ materially from those in or anticipated by our forward-looking statements. Risks Related to our Business
We could incur losses under our fixed-price contracts as a result of cost overruns or delays in delivery, particularly on types of vessels we have not constructed in the past. Most of our contracts for marine vessel construction, including government contracts, are fixed-price contracts. Under fixed-price contracts, we retain all cost savings on completed contracts but are liable for the full amount of all cost overruns. We attempt to anticipate increases in costs of labor and materials in our bids on fixed-price contracts. However, the costs and gross profits realized on a fixed-price contract may vary from our estimates due to factors such as:
• unanticipated variations in labor and equipment productivity over the term of a contract; • unanticipated increases in costs of materials, labor and indirect expenses; and • errors in estimates and bidding.

13
Depending on the size of the project, variations from estimated contract performance could significantly reduce our earnings, and could result in losses, during any fiscal quarter or year. In addition, some of our fixed-price contracts provide for incentive payments for early delivery and liquidated damages for late delivery. If we miss a specified delivery deadline under one of those contracts, we may be subject to liquidated damages. From time to time, we bid on fixed-price contracts to construct vessels that we have not constructed in the past, such as the LNG bunker barge for which we were awarded a contract in March 2015. The risks of cost overruns or delays in delivery on those contracts are greater than for contracts for vessels that we have built in the past, and we have incurred substantial losses on the LNG barge. When we enter into contracts for vessels we have not constructed in the past, we generally believe we have sufficient related experience to perform profitably; however we are willing to risk losses in order to gain experience and entry into markets for new products. Estimates we may make in applying percentage-of-completion accounting could result in a reduction of previously reported profits and have a significant impact on quarter-to-quarter operating results. We use the percentage-of-completion method to account for our construction contracts in process. Under this method, revenue and expenses are based on the percentage of labor hours incurred as compared to estimated total labor hours for each contract. As a result, the timing of recognition of revenue and expenses we report may differ materially from the timing of actual contract payments received and expenses paid. We make provisions for estimated losses on uncompleted contracts in the period in which the losses are determined. To the extent that those provisions result in a reduction of previously reported profits on a project, we must recognize a charge against current earnings. These charges may significantly reduce our earnings, depending on the size of the contract and the adjustment. In addition, because many of these contracts are completed over a period of several months, the timing of the recognition of related revenue and expense could have a significant impact on quarter-to-quarter operating results. A decline in general economic conditions or deterioration in the financial condition of a particular customer or that customer’s industry can increase our customer credit risk, which may adversely affect our profits. Although varying contract terms may be negotiated on a case-by-case basis, our commercial and government construction contracts ordinarily provide for a down payment, with progress payments at specified stages of construction and a final payment upon delivery. Conversely, repair and conversion customers are typically billed upon completion of the work performed. A decline in the economy can adversely affect some of our customers’ ability to pay. For example, during 2009, we experienced an increase in bad debt write-offs, and also experienced an increase in our allowance of doubtful accounts primarily due to the bankruptcy of two customers. If we are unable to collect any account receivable in the amount we have estimated to be collectible, we must recognize a charge to earnings that is in effect a reversal of previously recorded profits. We raised our bad debt allowance in 2014, 2015 and 2016 as a result of declining market conditions due to the decrease in crude oil prices [and related concerns with specific customers.] As of December 31, 2016, approximately 75.8% of our backlog related to contracts for two commercial customers. Accordingly, any events adversely impacting those customers’ ability to pay could have a material adverse effect on our financial condition, results of operations and cash flow. The loss of a significant customer could result in a substantial loss of revenue. A relatively small number of customers have historically generated a large portion of our revenue, although not necessarily the same customers from year to year. For the years ended December 31, 2016, 2015 and 2014, our ten largest customers collectively accounted for 84.4%, 72.0% and 70.9% of our revenues, respectively. The loss of a significant customer could result in a substantial loss of revenue and significantly reducing our earnings. See “Business – Customers.” We have in the past performed a significant amount of our work under U.S. and other government contracts. Reductions in government spending on the types of products and services we offer or our inability to secure new government contracts could have a substantial negative impact on our revenues and profits. We have built vessels for the U.S. Army, U.S. Navy, U.S. Coast Guard and U.S. Army Corp of Engineers. We have also built vessels and performed conversion or repair services for local and state governments, either directly or as a

14
subcontractor. Revenue derived from all government customers accounted for approximately 9.2%, 13.3%, and 2.7% of our total revenue in 2016, 2015 and 2014, respectively. Revenue derived from U.S. government customers accounted for approximately .1%, .7%, and 2.7% of our total revenue in 2016, 2015 and 2014, respectively. Government contracts accounted for approximately 13.8%, 5.2%, and 20.8% of our backlog at December 31, 2016, 2015 and 2014, respectively. Government contracts are generally subject to strict competitive bidding requirements. In addition, the number of vessels that are purchased by governments varies with their budgets and the appropriation of government funds. We cannot predict whether we will be able to secure new government contracts. Because a significant portion of our revenues has historically come from customers in the Gulf of Mexico oil and gas industry, particularly in our repair segment, decreases in offshore oil and gas activities tend to reduce demand for our products and services and negatively impact our revenues and profits. The level of offshore oil and gas activities can be affected by prevailing oil and gas prices, which historically have fluctuated significantly. The Gulf of Mexico oil and gas industry can be affected by prevailing oil and gas prices, which historically have fluctuated significantly. Low oil or gas prices or a decline in demand for oil or gas can depress offshore exploration, development and production activity and result in decreased spending by our Gulf of Mexico oil and gas industry customers. This can result in a decline in the demand for our products and services and can have a substantial negative effect on our revenues and profits. Declines in offshore oil and gas exploration, development and production activity in the Gulf of Mexico can also result in excess capacity at other shipyard companies, which can lead to increased competition and pricing pressure. Measures we may take to respond to a slowdown in new construction or repair projects due to a deterioration in general economic conditions or in our customers’ industries may not be sufficient to prevent a decline in earnings. Reductions in activities in our business may cause us to reevaluate our operations. We may respond to these conditions by reducing our prices and anticipated profit margins in order to attempt to maintain activity levels in our yards and thereby maintain our workforce. Price and profit margin reductions may lead to decreased profitability, particularly over the short term. In addition, we may respond by beginning construction of historically marketable vessels before obtaining a customer contract in order to preserve our workforce. We may also respond by cutting costs, including through employee attrition or layoffs. Decreases in costs may not be adequate to offset losses in revenues, particularly over the short term. We may also seek new customers or different types of projects, which may increase our marketing and other costs. These measures, among others we may take, may not be sufficient to prevent a decline in our earnings. Weak or uncertain global or domestic economic conditions can have an adverse impact on our business. Adverse global and domestic economic conditions may contribute to a reduction in demand for our products and services. Market uncertainties may cause customers to delay signing new construction contracts and reduce their use of repair services. We construct stock vessels from time to time to fill gaps in our construction schedules or for strategic business and marketing reasons. Inability to sell stock vessels at prices above our cost could have a material adverse impact on our profitability. From time to time we have experienced gaps in our construction schedules and have begun construction on projects that were not under contract and that we believed we could convert to contracts in a relatively short period of time within starting construction or within completion of the project. The primary goal of this strategy is to maintain operational efficiencies and revenue volume between contracted projects. We have also constructed stock vessels for strategic business and marketing reasons. At December 31, 2014, we had ten stock vessels under construction with approximately $11.8 million of total costs. At December 31, 2015, we had one stock vessel under construction and one completed stock barge with approximately $1.7 million of total costs. At December 31, 2016, we had one stock vessel under construction with approximately $3.6 million of total costs. Our board has approved up to $20 million in inventory costs in stock barges and vessels. If we are not able to sell the stock vessels for at least cost, we would have a loss on the project. Additionally, this strategy results in a reduction in working capital available for other purposes until the stock vessels are sold.

15
Our repair business has high fixed costs, which can adversely affect our margins and profits. Our repair business has high fixed costs primarily associated with the depreciation of facilities, floating drydocks and the marine travel lift. As a result, our margins and profits are adversely affected when the volume of our work declines. If our customers terminate projects, our reported backlog could decrease, which could substantially reduce our revenues and earnings. Our backlog is based on unearned revenue attributable to projects for which a customer has authorized us to begin work or purchase materials. Our contracts with commercial customers generally do not permit the customer to terminate the contract but our government contracts are often subject to termination by the customer. In the case of a termination, the government is generally required to pay us for work performed and materials purchased through the date of termination and, in some cases, pay us termination fees. Either the change or terminations of government contracts could substantially change the amount of backlog currently reported and could substantially decrease our revenue and earnings. Our backlog of $216.5 million at December 31, 2016, was attributable to 23 projects, of which 13.8% was attributable to four government projects. We are subject to the possibility of significant physical damage and business interruption caused by hurricanes or flooding. Due to the proximity of our shipyards to the Gulf of Mexico and locations along rivers in flood plains, our work in progress and facilities are subject to the possibility of significant physical damage and business interruption caused by hurricanes or flooding. Although we maintain insurance protection as we consider economically prudent, there can be no assurance that such insurance will be sufficient in coverage or effective under all circumstances or against all hazards to which we may be subject. If we sustain major damage that is not covered by insurance it could have a material adverse effect on the Company. During the second quarter of 2011, we were affected by rising water levels along the Mississippi and Atchafalaya Rivers. The primary adverse impact was the temporary suspension of operations at our Morgan City shipyard which is located on the Atchafalaya River outside the protection of the levee system. In order to minimize the impact of the imminent flooding and decrease the amount of down time, we constructed our own levee system to protect our Morgan City shipyard. This resulted in no property and equipment damage and also allowed us to return to full operation with minimal clean-up, months sooner than otherwise. We relocated all of our production and support personnel and many of our projects to our other shipyards and continued operations at a minimally reduced level. All of our other yards remained fully operational. Due to the efforts of our people to plan for protection and move projects to other facilities, there was only a minimal impact on our profitability and no material adverse effect on our Company. Additionally, we were able to keep our people working and we were able to meet the delivery deadlines committed to customers. We also have experienced disruptions in our operations at our Morgan City yard and our Orange yard in the first quarter of 2016 due to rising water levels and heavy rainfall, which did not produce any material adverse effect. Hazardous water conditions or insufficient water depths on waterways needed to access our shipyards may have a material adverse impact on our business. If hazardous water conditions develop, for example due to heavy rainfall or flooding, or water depths become low, for example due to low rainfall or insufficient dredging by government entities responsible for maintenance of ports and waterways, on waterways needed to access our shipyards, we could lose projects and customers and incur expenses or losses on existing projects, which may have a material adverse impact on our business. We have experienced lost projects and incurred expenses due to insufficient dredging in the Atchafalaya River. From time to time, we may not be able to hire sufficient numbers of trained shipyard workers. Any labor shortage may increase our cost of labor, limit our production capacity and materially decrease our earnings. Shipyards along the Gulf Coast have experienced shortages of skilled labor from time to time as a result of low unemployment in the economy in general and/or increased demand for skilled labor in the offshore oil and gas and

16
related industries in particular. We, along with other shipyards along the Gulf Coast experienced labor shortages from 2005 through much of 2008 due to the high demand in our industry for new construction and repair and conversion services. Currently we are not experiencing trouble finding skilled labor; however if market conditions improve it could lead to shortages of skilled labor. These labor shortages increase our cost of labor, could limit our production capacity, and materially decrease our earnings. We rely on key personnel. We are dependent on the continuing efforts of our executive officers and key operating personnel. The loss of the services of any of these persons could result in inefficiencies in our operations, lost business opportunities and the loss of one or more customers. We generally do not have employment agreements with our employees other than our executive officers and we do not carry key person life insurance. Our Chief Executive Officer is 74, and we have been engaged in a succession planning process. Our principal stockholders may control the outcome of stockholder voting. Our executive officers and directors as a group, which John P. Conrad, Jr. and Daniel T. Conrad, beneficially own approximately 2,198,588 shares or 43.1% of our common stock. John P. Conrad, Jr. and Katherine C. Court, the sister of John P. Conrad, Jr., are sole managers of the John Parker Conrad Family, L.L.C. which holds 1,043,267 shares of our common stock (which shares are included in the 2,198,588 shares beneficially owned by our directors and executive officers as a group). If they act in concert, these holders could be able to exercise effective control over our affairs, elect our entire board of directors, and control substantially all matters submitted to a vote of our stockholders. The interests of these holders may differ from the interests of our minority stockholders, and they may vote their shares in a manner adverse to our minority stockholders. Sales or the availability for sale, of substantial amounts of our common stock in the over-the-counter market could adversely affect the market price of our common stock. Of the 5,102,578 shares of our common stock outstanding as of March 10, 2017, approximately 3.0 million shares are freely tradable. The remaining outstanding shares may be resold publicly only following their registration under the Securities Act of 1933, as amended, or under an available exemption. In addition, the average daily trading volume in our common stock for 2016 was 3,903 shares. The availability of a large block of stock for sale in relation to our normal trading volume can result in a decline in the market price of our common stock. We are not a public company. On March 30, 2005 we voluntarily delisted our common stock from Nasdaq and filed a Form 15 with the Securities and Exchange Commission (the "SEC") to voluntarily deregister our common stock under the Securities Exchange Act of 1934, as amended (the "Exchange Act") and to suspend our obligation to file reports under Section 15(d) of the Exchange Act. We were eligible to deregister by filing a Form 15 because we had fewer than 300 holders of record of common stock. At the time of filing, our obligation to file certain reports with the SEC, including Forms 10-K, 10-Q, and 8-K, immediately ceased. On March 31, 2005 our common stock began trading in the over-the-counter market through the OTC Markets Electronic Quotation Service. Quotes are available over the internet at www.otcmarkets.com as well as through other services. We cannot control whether trading in the stock will continue on the “OTC Markets” or elsewhere.

17
Some provisions of our corporate documents and Delaware law may discourage a takeover. Our Amended and Restated Certificate of Incorporation (the “Charter”) and Delaware law could make it more difficult for a third party to acquire us, even if a change in control would be beneficial to our stockholders. Specifically, our Charter:
• authorizes the issuance of “blank check” preferred stock; • divides our board into three classes, the members of which serve three-year terms; • provides that directors may only be removed for cause and then only by the vote of the holders of
a majority of our outstanding capital stock; • establishes advance notice requirements for director nominations and stockholder proposals to be
considered at annual meetings; • prohibits stockholder action by written consent; and • prohibits stockholders from calling special meetings of stockholders.
In addition, Delaware law restricts specified mergers and other business combinations between us and any holder of 15% or more of our common stock. Delaware law also permits the adoption of a shareholder rights plan without stockholder approval, and we have adopted a rights plan. The rights plan is intended to protect stockholder interests in the event we become the subject of a takeover initiative that our board of directors believes could deny our stockholders the full value of their investment. The adoption of the rights plan was intended as a means to guard against abusive takeover tactics and was not in response to any particular proposal. The plan does not prohibit the board from considering any offer that it considers advantageous to stockholders. We also have employment agreements with our executive officers that provide for benefits in specified circumstances if there is a change of control of our company. These provisions might hinder, delay or prevent a change of control of our company. These provisions could also limit the price that investors might be willing to pay in the future for shares of our common stock. We may not pay dividends in the future. We paid special dividends on our common stock of $1.00 per share on January 5, 2015, and of $2.00 per share on December 17, 2013 and December 31, 2012. Additionally, we paid quarterly dividends of $0.25 per share during each of the four quarters of 2015. We paid quarterly dividends of $0.10 per share during each of the four quarters of 2016. Our board did not declare a dividend in the first quarter of 2017. Declaration of future dividends is at the discretion of the Board each quarter, and will depend upon the Company’s financial performance, cash requirements, outlook and other factors deemed relevant by the Board. Risks Related to our Industry
• Our business is highly competitive. As a result, we may lose business and employees to our competitors or may
experience lower profit margins than we would in the absence of competition. • The price of steel may increase substantially, which can adversely affect our profits and cause potential
customers to delay new construction projects. For additional information, see “Business Overview – Materials and Supplies.”
• Excess capacity in our industry from time to time can place downward pressure on pricing and profit margins. • Our customers may require us to post bid bonds and performance bonds, which may be difficult to obtain for
reasons primarily related to industry conditions or our financial condition. • Federal law favoring U.S. shipyards over foreign shipyards may be modified or rescinded, resulting in greater
competition from foreign shipyards that operate with lower costs.

18
• New regulations or modifications to existing regulations affecting our significant customers could decrease demand for our products and services and result in significantly lower revenues and earnings.
• Compliance with environmental laws and other government regulations may increase our cost of doing
business. • Our business involves operating hazards and risks of liability and lawsuits, and our insurance coverage may be
insufficient to cover all losses that we experience. Properties We conduct our operations at five shipyards, one in Morgan City, Louisiana, three in Amelia, Louisiana, and one in Orange, Texas. Much of our new vessel construction is done indoors in well-lighted space specifically designed to accommodate construction of marine vessels up to 350 feet in length. During the past five years, we have made, in the aggregate, approximately $61.9 million of capital expenditures to add capacity and improve the efficiency of our shipyards. For additional information, see “General – Internal Expansion.” Our principal executive offices occupy approximately 10,533 square feet of leased office space in Morgan City, Louisiana. The current lease term extends through June 2020. Morgan City Shipyard We have owned and operated our Morgan City, Louisiana shipyard since 1948. The yard is located on the Atchafalaya River approximately 30 miles from the Gulf of Mexico on approximately 12 acres. The shipyard has 14 buildings containing approximately 125,000 square feet of enclosed building area and ten overhead cranes. In addition, the shipyard has one submersible launch barge, 1,700 linear feet of steel bulkhead, five rolling cranes and a slip. During 2012, we completed filling our second slip to increase our land area for material lay down and fabrication. The buildings at the Morgan City shipyard include offices for management and support personnel as well as three large fabrication warehouses specifically designed to accommodate marine vessel construction. In 2014 and 2016 we purchased land and buildings to increase parking, fabrication and office space. Amelia Shipyards We have three facilities in Amelia, Louisiana, which is approximately five miles from Morgan City, Louisiana: Conrad Aluminum, Conrad Deepwater and Conrad Deepwater South. Conrad Aluminum is located on the Bayou Boeuf/Intracoastal Waterway approximately 30 miles from the Gulf of Mexico on approximately 16 acres. We purchased the yard for approximately $1.0 million in 1996 and commenced marine steel repair and conversion operations there during February 1998. In 2003, we obtained approximately $5.5 million in financing to convert the yard into an aluminum marine fabrication and repair facility capable of serving both commercial and government customers, and commenced our aluminum operations at the facility in the fourth quarter of 2003. The funding was primarily used to construct a 37,500 square foot two-bay building, to purchase a 300 ton travel lift, six overhead cranes and other tools and equipment, and to make improvements to the docks. The facility has a total of seven buildings containing approximately 67,500 square feet of enclosed building area. The site has 2,100 linear feet of bulkhead and two slips. During 2007 and 2009 we further developed our repair and new construction areas at Conrad Aluminum to give us additional capacity and improved production efficiencies. On March 13, 2017 Conrad Aluminum L.L.C.‘s name was changed to Conrad Shipyard Amelia, L.L.C. Conrad Deepwater is located on the Bayou Boeuf/Intracoastal Waterway approximately 30 miles from the Gulf of Mexico and is within one mile of Conrad Aluminum. The facility is located on a 52-acre previously undeveloped site that we purchased in 2000 for $1.3 million. During 2002 and 2003, we invested approximately $7.0 million developing approximately 14 acres of the site into the new facility. We commenced steel repair and conversion operations at the facility in February 2003. This facility has one building containing approximately 5,400 square feet comprising a stock room and maintenance shop. The site also has 1,700 linear feet of bulkhead and one slip. The facility allows us to handle vessels with deeper drafts than we have historically been able to service at our other facilities. We expanded our new construction capabilities at Conrad Deepwater during the first quarter of 2005. During 2007, we purchased a heavy lift crane and installed a crane foundation at our Deepwater facility to enable us

19
to remove and replace lift boat legs that needed repair. This heavy lift crane has also been used by our new construction operations to install legs on liftboats. In the past we had to bring the liftboats, at an additional cost, to a third party facility to accomplish this task. During 2008, we completed development of a slip at the facility and added infrastructure to increase our capabilities for topside work. We currently have six drydocks at Conrad Deepwater. The drydocks consist of two 120-foot by 52-foot drydock with lifting capacity of 900 tons, two 200-feet by 70-foot drydocks with lifting capacities of 2,400 tons, one 200-foot by 95-foot drydock with a lifting capacity of 4,000 tons and one 280-foot by 160-foot drydock with a lifting capacity of 10,000 tons. We constructed the largest drydock ourselves in 2000 and 2001 for approximately $5.7 million. This allowed us to (1) increase our repair and conversion capacity; (2) compete by lifting larger repair vessels such as derrick and pipe laying barges and the large offshore service vessels built for the deep water drilling activities in the Gulf of Mexico; and (3) launch larger new vessel construction projects more competitively. During 2010, we put into service an extension to our second largest drydock that increased the lifting capacity to 4,000 tons from 3,000 tons. During the first quarter of 2012, we received a grant from The U.S. Maritime Administration to construct a new section to extend our largest drydock to a length of approximately 350 feet, with a lifting capacity of 12,500 tons. The total cost of the project was $2.6 million. In 2013, we spent $1.0 million in machinery and equipment to improve our operational efficiency. In 2014, we completed 550 feet of additional bulkhead at a cost of $1.4 million. In 2012, we purchased 50 acres of property adjoining our Conrad Deepwater facility for $5.6 million, which we now operate as our Conrad Deepwater South shipyard. During the fourth quarter of 2012, we renovated the existing office building at the new location and relocated our engineering department. We added one new construction site and upgraded the existing building for manufacturing. We started operations at this site in June 2013. In 2013 we purchased machinery and equipment and did improvements to the facility in the amount of $1.9 million. We delivered our first vessel constructed at the yard in the first quarter of 2014. In 2014, we spent $3.4 million to renovate a building for fabrication, land improvements, and additional equipment. In 2015, we made land improvements, purchased equipment and bulkhead in the amount of $14.9 million. In 2016, we continued to make land improvements and purchase machinery for added efficiency. These improvements for 2015 and 2016 include a panel line building equipped with automated welding systems that was completed in the third quarter of 2016. Conrad Orange Shipyard Our Orange, Texas shipyard is located on the Sabine River approximately 37 miles from the Gulf of Mexico on approximately 18 acres. The shipyard has six construction bays under approximately 110,000 square feet of enclosed building area with 14 overhead cranes. The site also has 150 feet of steel bulkhead and one slip. Our Orange shipyard equipment includes a Wheelabrator, a “gantry” type NC (“Numerical Control”) plasma burner with a 21-foot by 90-foot table, over 60 automatic and semi-automatic welding machines, two rolling cranes, 600, 800 and 1,600-ton transfer/load-out systems and a marine railway with side transfer system. We acquired our Orange shipyard in 1997. During 2007 we added a second repair dolly to allow us to repair a greater number of vessels and we improved our railway system. During 2012 we made improvements and renovations to our railway launch system in the amount of $3.7 million. On June 29, 2012, Orange Shipbuilding Company, Inc.’s name was changed to Conrad Orange Shipyard, Inc. In 2014, we spent $2.5 million in property improvements, land and machinery. In 2015, we continued to make property improvements and purchase equipment in the amount of $1.5 million. In 2016, we purchased land adjacent to our facility, additional machinery and did plant improvements totaling $900,000. Legal Proceedings For a discussion of legal proceedings, see Note 12 to our financial statements included with this report. Market for the Company’s Common Equity, Related Stockholder Matters and Issuer Purchases of Equity Securities On March 30, 2005 we voluntarily delisted our common stock from Nasdaq and, simultaneously with delisting, filed a Form 15 with the Securities and Exchange Commission (the "SEC") to voluntarily deregister our common stock

20
under the Securities Exchange Act of 1934, as amended (the "Exchange Act") and to suspend our obligation to file reports under Section 15(d) of the Exchange Act. On March 31, 2005 our common stock began trading in the over-the-counter market through the OTC Markets Electronic Quotation Service. Quotes are available over the internet at www.otcmarkets.com as well as through other services. Prior to this time our stock was traded on the NASDAQ National Market System under the symbol “CNRD.” As of January 11, 2017, there were 122 record holders of our common stock. The following table sets forth the high and low bid prices per share of the Common Stock, as reported by the OTC Markets for each fiscal quarter during the last two fiscal years. Fiscal Year 2016 High Low
First Quarter………………………………………………………. $22.90 $18.03 Second Quarter …………………………………………………… 22.00 18.95 Third Quarter……………………………………………………… 24.70 20.61 Fourth Quarter…………………………………………………….. 25.05 21.11
Fiscal Year 2015 High Low
First Quarter………………………………………………………. $35.00 $29.90 Second Quarter …………………………………………………… 32.04 29.71 Third Quarter……………………………………………………… 31.30 21.35 Fourth Quarter…………………………………………………….. 22.40 21.35
We paid special dividends on our common stock of $1.00 per share on January 5, 2015, and of $2.00 per share on December 17, 2013 and December 31, 2012. Additionally, we paid quarterly dividends of $0.25 per share during each of the four quarters of 2015. We paid quarterly dividend of $0.10 per share during each of the four quarters of 2016. The Board did not declare a dividend in the first quarter of 2017. Declaration of future dividends is at the discretion of the Board each quarter, and will depend upon the Company’s financial performance, cash requirements, outlook and other factors deemed relevant by the Board. In November 2016, the Company entered into a new loan agreement, which does not restrict the payment of dividends or repurchase of shares, subject to compliance with the financial covenants in the agreement. During August 2010, our board authorized the Company to repurchase up to $5 million of common stock using our cash on hand or generated from operations, in the open market or privately negotiated transactions. We purchased 38,075 shares during the third quarter of 2010 at an average price of $7 per share. During March 2011, our board authorized a 10b5-1 stock purchase plan, in an attempt to increase the amount of stock we repurchase pursuant to the share repurchase program. In 2011, we purchased 255,039 shares at an average price of $14 per share. On January 17, 2012 our Board authorized an additional $5 million to purchase shares of our common stock under the program. In 2012, we purchased 209,881 shares at an average price of $15 per share. During February 2013, the board approved an increase in the stock repurchase program of $10 million. No shares were purchased under the program in 2013. In November 2014, we purchased 100,000 shares at an average price of $32 per share. On December 11, 2014, the board approved an increase in the stock repurchase program of $20 million. During the second quarter of 2015, we purchased 121,155 shares at an average price of $31 per share. During the third quarter of 2015, we purchased 126,526 shares at an average price of $24 per share. During the fourth quarter of 2015, we purchased 256,462 shares at an average price of $22 per share. During the first quarter of 2016, we purchased 181,075 shares at an average price of $19 per share. During the second quarter of 2016, we purchased 12,955 shares at an average price of $21 per share. During the third quarter of 2016, we purchased 33,948 shares at an average price of $22 per share. During the fourth quarter of 2016, we purchased 17,655 shares at an average price of $22 per share. During 2010 through 2016, we have repurchased an aggregate of 1,352,771 shares pursuant to our stock repurchase program. As of December 31, 2016, $2.8 million remained available for future repurchases under our stock repurchase program.

21
Selected Financial Data The following table sets forth our selected historical consolidated financial data as of the dates and for the periods indicated. The historical financial data for each year in the five-year period ended December 31, 2016 are derived from our historical audited financial statements. The following information should be read in conjunction with “Management’s Discussion and Analysis of Financial Condition and Results of Operations” included elsewhere in this report and our consolidated financial statements and notes thereto included as an attachment to this report.
2016 2015 2014 2013 2012
Statement of Operations DataRevenues 164,416$ 263,809$ 309,009$ 303,331$ 233,630$ Cost of revenue 160,893 248,895 269,197 253,765 196,497 Gross profit 3,523 14,914 39,812 49,566 37,133 Selling, general and administrative expenses 6,483 7,153 8,558 7,102 6,408 Income/(loss) from operations (2,960) 7,761 31,254 42,464 30,725 Interest and other income (expense), net 511 (1,446) 224 1,580 793 Income/(loss) before income taxes (2,449) 6,315 31,478 44,044 31,518 Provision/(benefit) for income taxes (755) (4,303) 8,657 15,418 10,676 Net income/(loss) (1,694)$ 10,618$ 22,821$ 28,626$ 20,842$
Net Income/(Loss) Per Common Share (1)Basic (0.33)$ 1.86$ 3.84$ 4.82$ 3.47$ Diluted (0.33)$ 1.86$ 3.84$ 4.80$ 3.46$
Weighted Average Common Shares Oustanding
Basic 5,174 5,700 5,950 5,940 6,000 Diluted 5,174 5,700 5,950 5,961 6,023
Dividends Paid Per Share of Common Stock (1) 0.40$ 2.00$ -$ 2.00$ 2.00$ Statement of Cash Flows Data
Cash provided by/(used in ) operating activities (36,219)$ 13,873$ 33,868$ 23,800$ 42,546$
Cash used in investing activities (6,854)$ (17,480)$ (9,866)$ (12,432)$ (15,293)$ Cash provided by/(used in) financing activities 8,025$ (18,083)$ (10,281)$ (12,086)$ (15,294)$
Other Financial DataDepreciation & amortization 7,074$ 6,261$ 5,676$ 4,807$ 4,067$ Capital expenditures 6,854$ 17,480$ 9,871$ 12,432$ 15,293$ EBITDA (2) 4,669$ 12,658$ 37,165$ 48,881$ 35,622$ EBITDA margin (3) 2.8% 4.8% 12.0% 16.1% 15.2%Operating profit/(loss) margin (4) (1.8)% 2.9% 10.1% 14.0% 13.2%
Year Ended December 31,
(In thousands, except per share data)

22
2016 2015 2014 2013 2012
Balance Sheet Data Working capital (1) 66,066$ 61,276$ 79,554$ 70,804$ 61,316$ Property, plant & equipment, net 72,462$ 72,705$ 61,489$ 57,279$ 49,650$ Total assets 164,533$ 166,954$ 190,887$ 177,106$ 143,950$ Long term debt, including current portion 14,875$ -$ -$ 1,221$ 1,487$ Shareholders' equity (1) 115,839$ 124,383$ 131,848$ 118,087$ 101,281$
As of December 31,
(In thousands)
(1) We paid quarterly dividends in 2016 totaling $2.1 million. We paid quarterly dividends in 2015 totaling
$5.7 million. We declared in December 2014 and paid in January 2015 a special cash dividend of $1.00 per share totaling $5.9 million. We paid dividends of $2.00 per share in December 2013 and 2012, totaling $11.9 million per year. In addition, for 2012-2016, stock repurchases totaled $3.1 million, $0, $3.2 million, $12.4 million and $4.8 million, respectively.
(2) Represents earnings before deduction of interest, taxes, depreciation and amortization. EBITDA is not a measure of cash flow, operating results or liquidity as determined by generally accepted accounting principles. We have included information concerning EBITDA as supplemental disclosure because management believes that EBITDA provides meaningful information regarding a company's historical ability to incur and service debt. EBITDA as defined and measured by us may not be comparable to similarly titled measures reported by other companies. EBITDA should not be considered in isolation or as an alternative to, or more meaningful than, net income or cash flow provided by operations as determined in accordance with generally accepted accounting principles as an indicator of our profitability or liquidity.
(3) Represents EBITDA as a percentage of revenues. (4) Represents income from operations as a percentage of revenues.
The following table sets forth a reconciliation of net cash provided by operating activities to EBITDA for the periods presented (in thousands):
2016 2015 2014 2013 2012
Net cash provided by/(used in) operating activities (36,219)$ 13,873$ 33,868$ 23,800$ 42,546$ Interest expense 44 82 11 30 37 Provision/(benefit) for income taxes (755) (4,303) 8,657 15,418 10,676 Deferred income tax provision (benefit) 2,675 813 (490) (1,341) 539 Other (25) (3) (1) (1) (19) Changes in operating assets and liabilities 38,949 2,196 (4,880) 10,975 (18,157) EBITDA 4,669$ 12,658$ 37,165$ 48,881$ 35,622$
23
Management’s Discussion and Analysis of Financial Condition and Results of Operations The following discussion and analysis should be read in conjunction with our consolidated financial statements and the notes to consolidated financial statements included as an attachment to this report. Overview We specialize in the construction, conversion and repair of a wide variety of steel and aluminum marine vessels for commercial and government customers. These vessels include tugboats, ferries, liftboats, barges, aluminum crew/supply vessels and other offshore support vessels. We operate five shipyards: one in Morgan City, Louisiana, three in Amelia, Louisiana and one in Orange, Texas. For the year ended December 31, 2016 our new construction segment accounted for 82.5% of our total revenue and our repair and conversion segment accounted for 17.5% of our total revenue. For the year ended December 31, 2015 our new construction segment accounted for 89.1% of our total revenue and our repair and conversion segment accounted for 10.9% of our total revenue. In 2016, we recognized revenues of $164.4 million, net loss of $1.7 million, diluted loss per share of -$0.33 and operating cash used of -$36.2 million, compared to 2015 revenues of $263.8 million, net income of $10.6 million, diluted earnings per share of $1.86 and operating cash flow of $13.9 million. Our 2015 net income included research and development tax credits of $5.9 million. Vessel construction gross profit for 2016 and 2015 reflects $13.2 million and $4.0 million, respectively, in losses on the LNG barge. The losses on the LNG barge primarily relate to vessel changes required by regulatory authorities, which increased costs and caused delays, and higher than expected equipment costs, resulting from the vessel being the first of its kind produced in North America. We have adjusted our anticipated delivery date to the latter part of 2017. While most of the regulatory review process has been completed, we continue to have regulatory and execution risk associated with completing the vessel. While we have incurred losses on the LNG barge, we believe we have developed resources to establish our Company as a leader in LNG marine-related construction in North America. In our repair segment, gross profit improved from a gross loss of $350,000 in 2015 to gross profit of $3.0 million in 2016, reflecting solid performance in a very competitive environment. As of December 31, 2016, we had cash and cash equivalents of $11.9 million. As part of our detailed business planning process to identify optimal uses for our cash, in 2014 our Board of Directors declared a special dividend of $1.00 per share that was paid in January 2015, totaling $5.9 million. During 2015, the Company paid quarterly dividends of $0.25 per share. During 2016, the Company paid quarterly dividends of $0.10 per share. The Board did not declare a dividend during the first quarter of 2017. During 2016, we had $6.9 million in capital expenditures, and our Board has approved a $3.8 million capital expenditure program for 2017, which includes $1.5 million for the continued development of the Conrad Deepwater South yard. The additional improvements made at Deepwater South will continue to enhance our ability to build larger vessels, and we believe these investments in our business will improve our efficiencies and competitiveness. In 2016, we purchased $4.8 million of stock under our stock buyback program. As of December 31, 2016, $2.8 million remained available under the program. Our results for 2016 reflect a continued challenging operating environment. In new construction, we continue to experience a soft market for energy transportation projects and projects related to the offshore oil and gas industry, and customers continue to delay orders for larger projects. The repair market continues to be soft, which continues to be impacted by low crude oil prices. We have experienced pricing pressure in both segments. Many new construction customers are continuing to request favorable contract terms with smaller up-front and progress payments during construction. These factors negatively impacted our results for 2015 and 2016, and may negatively impact our financial performance through 2017. We have been actively pursuing and have been successful in obtaining opportunities to produce different types of vessels for new markets. Some of these vessels are larger, take longer to start production and take longer to complete than the types of vessels we have constructed more often in the past. For example, in recent years, we have constructed barges larger than those we constructed historically, including 55,000 and 80,000 barrel tank barges, and articulated tug barges (ATBs) consisting of a large tank barge and a related tug that is positioned in a

24
notch in the stern of the barge, enhancing the maneuverability of the barge. During March 2015, we entered into a contract to construct the first LNG bunker barge to be built for the marine market in North America. The barge is scheduled for delivery during the latter part of 2017. We believe our capital improvement program at our Deepwater South yard has strengthened our ability to compete for these types of projects. While these types of larger projects can entail additional risk, they can also supply us with a more consistent backlog for a longer period of time. In December 2012 and February 2013, the Company submitted claims totaling $22.6 million to the BP Settlement Fund in accordance with the Deepwater Horizon Court-Supervised Settlement Program. For additional information, see Note 12 in our consolidated financial statements in this report. The demand for our products and services is dependent upon a number of factors, including the economic condition of our customers and markets, the age and state of repair of the vessels operated by our customers and the relative cost to construct a new vessel as compared with repairing an older vessel. Because some of our repair work is derived from the Gulf of Mexico oil and gas industry, conditions in that industry affect our repair segment. For 2016, 2015 and 2014, we received approximately 3.2%, 15.6%, and 35.3%, respectively, of our total revenues from customers in the Gulf of Mexico oil and gas industry (“energy”), 9.2%, 13.3%, and 2.7% from government customers and 87.6%, 71.1%, and 62.0% from other commercial customers. During 2016, we added $131.4 million of backlog. Our backlog was $216.5 million at December 31, 2016, compared to $211.8 million at December 31, 2015. Other commercial contracts accounted for approximately 86.3%, 93.4%, and 65.7% of our backlog at December 31, 2016, 2015 and 2014, respectively. Government contracts accounted for approximately 13.7%, 5.2%, and 20.8% of our backlog at December 31, 2016, 2015 and 2014, respectively. Energy contracts accounted for approximately 0%, 1.4%, and 13.5% of our backlog at December 31, 2016, 2015 and 2014, respectively. As of December 31, 2016, approximately 75.8% of our backlog related to contracts for two commercial customers. Unlike most prior years when we expected to complete most of our backlog within 12 months, we expect to complete approximately three-fourths of our December 31, 2016 backlog during 2017 and most of the remainder in 2018. Our management team is committed to effectively executing our backlog. We can experience significant changes in the price of steel due to global demand. For additional information about steel prices, see Business -- Overview -- Material and Supplies. Our construction and fabrication projects in progress as of December 31, 2016 consisted of 23 vessels: 7 ATB tugs, 1 - 30,000 BBL tank barges, 1 barge, 1 - 55,000 BBL tank barges, 3 - 80,000 BBL tank barges, 1 spud barge, 2 crane barges, 2 stop log barges, 4 damen stan tugs and a LNG barge. Our customers comprise a very diverse group that crosses a wide range of businesses including the energy sector, dredging, construction, towing, and bunkering markets. From time to time we have experienced gaps in our construction schedules and began construction on projects that were not under contract and that we believed we could convert to contracts in a relatively short period of time within starting construction or within completion of the project. The primary goal of this strategy is to maintain operational efficiencies and revenue volume between contracted projects. We have also constructed stock vessels for strategic business and marketing reasons. At December 31, 2016, we had one stock vessel under construction with approximately $3.6 million of total costs. At December 31, 2015, we had one stock vessel under construction and one completed stock barge with approximately $1.7 million of costs included in inventory. Our board has approved construction of up to $20 million in stock barges and vessels. The stock vessel program adversely impacted our results for 2015 and 2016, and the ultimate selling price and timing of the sales of the stock vessels could have an impact on our revenue, profitability, and working capital in the future. We delisted our common stock on March 30, 2005 and filed a Form 15 to deregister our common stock under Section 12 of the Securities Exchange Act of 1934 and ceased filing reports pursuant to Section 15(d) of that Act primarily to reduce expenses.

25
Our new construction projects generally range from one month to twenty-four months in duration. We use the percentage-of-completion method of accounting and therefore take into account the estimated costs, estimated earnings and revenue to date on fixed-price contracts not yet completed. The amount of revenue recognized is based on the portion of the total contract price that the labor hours incurred to date bears to the estimated total labor hours, based on current estimates to complete the project. This method is used because management considers expended labor hours to be the best available measure of progress on these contracts. Revenues from cost-plus-fee contracts are recognized on the basis of cost incurred during the period plus the fee earned. Most of the contracts we enter into for new vessel construction, and some of our contracts for conversion and repair, whether commercial or governmental, are fixed-price contracts under which we retain all cost savings on completed contracts but are liable for all cost overruns. We develop our bids for a fixed price project by estimating the amount of labor hours and the cost of materials necessary to complete the project and then bid the projects in order to achieve a sufficient profit margin to justify the allocation of our resources to such project. Our revenues therefore may fluctuate from period to period based on, among other things, the aggregate amount of materials used in projects during a period and whether the customer provides materials and equipment. We perform many of our conversion and repair services on a time and materials basis pursuant to which the customer pays a negotiated labor rate for labor hours spent on the project as well as the cost of materials plus a margin on materials purchased. Repair projects may take a few days to a few weeks, although some extend for a longer period. On March 13, 2017 Conrad Aluminum L.L.C.’s name was changed to Conrad Shipyard Amelia, L.L.C.

26
Results of Operations
Financial Data:Revenue
Vessel construction 135,721$ 82.5% 235,118$ 89.1% 241,717$ 78.2%Repair and conversions 28,695 17.5% 28,691 10.9% 67,292 21.8%
Total revenue 164,416 100.0% 263,809 100.0% 309,009 100.0%Cost of revenue
Vessel construction 135,205 99.6% 219,854 93.5% 207,315 85.8%Repair and conversions 25,688 89.5% 29,041 101.2% 61,882 92.0%
Total cost of revenue 160,893 97.9% 248,895 94.3% 269,197 87.1%Gross profit
Vessel construction 516 0.4% 15,264 6.5% 34,402 14.2%Repair and conversions 3,007 10.5% (350) -1.2% 5,410 8.0%
Total gross profit 3,523 2.1% 14,914 5.7% 39,812 12.9%S G & A expenses 6,483 3.9% 7,153 2.7% 8,558 2.8%Income/(loss) from operations (2,960) -1.8% 7,761 2.9% 31,254 10.1%Interest expense (44) 0.0% (82) 0.0% (11) 0.0%Other income/(expense), net 555 0.3% (1,364) -0.5% 235 0.1%Income/(loss) before income taxes (2,449) -1.5% 6,315 2.4% 31,478 10.2%Income tax provision/(benefit) (755) -0.5% (4,303) -1.6% 8,657 2.8%Net income/loss (1,694)$ -1.0% 10,618$ 4.0% 22,821$ 7.4%
EBITDA (1) 4,669$ 2.8% 12,658$ 4.8% 37,165$ 12.0%
Net cash provided by/(used in) operating activities (36,219)$ 13,873$ 33,868$ Net cash used in investing activities (6,854)$ (17,480)$ (9,866)$ Net cash providedby/(used in) financing activities 8,025$ (18,083)$ (10,281)$
Years Ended December 31,2016 2015 2014
(1) Represents earnings before deduction of interest, taxes, depreciation and amortization. EBITDA is not a measure of cash flow, operating results or liquidity as determined by generally accepted accounting principles. We have included information concerning EBITDA as supplemental disclosure because management believes that EBITDA provides meaningful information regarding a company's historical ability to incur and service debt. EBITDA as defined and measured by us may not be comparable to similarly titled measures reported by other companies. EBITDA should not be considered in isolation or as an alternative to, or more meaningful than, net income or cash flow provided by operations as determined in accordance with generally accepted accounting principles as an indicator of our profitability or liquidity.

27
The following table sets forth a reconciliation of net cash provided by operating activities to EBITDA for the periods presented (in thousands):
2016 2015 2014
Net cash provided by/(used in) operating activities (36,219)$ 13,873$ 33,868$ Interest expense 44 82 11 Provision/(benefit) for income taxes (755) (4,303) 8,657 Deferred income tax provision (benefit) 2,675 813 (490) Other (25) (3) (1) Changes in operating assets and liabilities 38,949 2,196 (4,880) EBITDA 4,669$ 12,658$ 37,165$
Year Ended December 31, 2016 Compared to Year Ended December 31, 2015 During the year ended December 31, 2016, we generated revenue of $164.4 million, a decrease of approximately $99.4 million or -37.7%, compared to $263.8 million generated for 2015. The decrease was due to a $99.4 million or -42.3% decrease in vessel construction revenue compared to $235.1 million for 2015. The decrease in revenue for the current year is primarily a result of the overall decrease in production hours associated with fewer new construction contracts. Vessel construction hours decreased 24.0% compared to 2015 while repair and conversion hours increased by 1.9% compared to 2015. The decrease is driven by unfavorable market conditions throughout most of 2016, which we believe is due primarily to the decline in crude oil prices. Vessel construction revenue was 82.5% of total revenue compared to 89.1% for 2015 and repair and conversion revenue was 17.5% of total revenue compared to 10.9% in 2015. For 2016, 9.2% of revenue was government related, 3.2% was energy and 87.6% was other commercial. This compares to 14.1% government, 11.7% energy and 74.3% other commercial in 2015. Gross profit was $3.5 million (2.1% of revenue) for 2016 as compared to gross profit of $14.9 million (5.7% of revenue) for 2015. Vessel construction gross profit decreased $14.7 million for 2016 to a gross profit of $516,000 compared to gross profit of $15.3 million for 2015. Repair and conversion gross profit increased $3.4 million for 2016 to $3.0 million compared to $-.4 million for 2015. Vessel construction gross profit margins decreased to .4% for 2016, compared to gross profit margins of 6.5% for 2015, due to a significant loss on the LNG barge. Vessel construction gross profit for 2016 and 2015 reflects $13.2 million and $4.0 million, respectively, in losses on the LNG barge. The losses on the LNG barge primarily relate to vessel changes required by regulatory authorities, which increased costs and caused delays, and higher than expected equipment costs, resulting from the vessel being the first of its kind produced in North America. We have adjusted our anticipated delivery date to the latter part of 2017. While most of the regulatory review process has been completed, we continue to have regulatory and execution risk associated with completing the vessel. Repair and conversion gross profit margins were 10.5% for 2016, compared to gross profit margins of -1.2% for 2015. Repair and conversion gross profit increased primarily from production efficiencies and cost controls, as production hours were flat. Selling, general and administrative expenses (“SG&A”) decreased $670,000, or -9.4%, to $6.5 million (3.9% of revenue) for 2016, as compared to $7.2 million (2.7% of revenue) for 2015. This decrease in SG&A expenses was due to decreases in employee related expenses due to lower bonus accruals and employee benefits, professional fees, and contract services. Interest expense decreased $38,000 to $44,000 for 2016 as compared to interest expense of $82,000 for 2015. 2015 interest was due to the payment of interest on amended tax returns. The 2016 interest is due to the term loan that we

28
entered into in the fourth quarter of 2016. We paid in full the remaining balance of our Industrial Revenue Bonds in June 2014; we had no long-term debt as of December 31, 2015. We had an income tax benefit of $800,000 for 2016, compared to income tax benefit of $4.3 million for 2015, as a result of lower income from operations in 2016 and research and development tax credits of $5.9 million in 2015. The total 2015 research and development tax credit is comprised of an estimate for 2015 of approximately $3.5 million and a credit for 2012 and 2013 for approximately $2.4 million. We do not expect to record any additional research and development tax credits for periods prior to 2015, or any for 2016. Liquidity and Capital Resources Net cash used in operations was $36.2 million for 2016, compared to net cash provided by operations of $13.9 million and $33.9 million for 2015 and 2014, respectively. The decrease in 2016 is due to the net loss, a decrease in accrued expenses, decrease in billings in excess of costs and estimated earnings and an increase in cost and estimated earnings, partially offset by decreases in accounts receivable. Our working capital position was $66.1 million and $61.3 million at December 31, 2016 and 2015, respectively. Cash and cash equivalents at December 31, 2016 and 2015 were $11.9 million and $46.9 million, respectively. Management continues to engage in a detailed business planning process that includes an assessment of the Company’s cash position and potential resources in light of the challenging operating environment, new types of projects being pursued, and the Company’s capital expenditure program. In response to market conditions, we have been providing more favorable payment terms to certain new construction customers, which decreases our cash balances and increases our costs and estimated earnings in excess of billings on uncompleted contracts, and we expect this trend to continue in 2017. Our net cash used in investing activities of $6.9 million in 2016 consisted of capital expenditures, which included the machinery, building and property improvements at our Conrad Deepwater South shipyard. Our net cash used in investing activities of $17.5 million in 2015 consisted of capital expenditures, which included machinery and property improvements at the Deepwater South facility in the amount of $14.9 million. These improvements include a panel line building equipped with automated welding systems that went on line in the third quarter of 2016. We also spent $900,000 at our Conrad Orange facility in 2016 on plant improvements, machinery and land. For additional information on our internal expansion activities, see Business -- Overview -- Internal Expansion. Our Board of Directors has approved a $3.8 million capital expenditure program for 2017, which includes $1.5 million for the continued development of the Deepwater South yard. In April 2016, the Company received a grant from the U. S. Maritime Administration to purchase equipment for our Conrad Orange Shipyard. This grant is a portion of a $5 million appropriation by Congress for capital improvements and for maritime training programs at small shipyards. The grant funds must be spent in 2 years or less, and the Company must adhere to various recordkeeping and filing requirements. The Company must maintain title to the purchased equipment for a minimum of 2 years, and “Buy American” as much as practical. The total cost of the project is $1.2 million of which the Federal share for reimbursement is $605,000 and the “required portion” by the Company is $605,000. The Company must expend the required portion before any portion of the Federal share is distributed. At December 31, 2016 we have expended $718,000. The Company has elected to receive reimbursement at the completion of the project; therefore $113,000 is included in “Other Receivables” at December 31, 2016.
To fill in gaps in our construction schedules, we construct stock vessels from time to time. We have also constructed stock vessels for strategic business and marketing reasons. At December 31, 2015, we had one stock vessel under construction and one completed stock barge which were included in our inventory at a cost of $1.7 million. At December 31, 2016, we had one stock vessel under construction which is included in our inventory at a cost of $3.6 million. Our board has approved construction of up to $20 million in stock vessels to the extent management deems appropriate. Net cash provided by financing activities was $8.0 million for 2016 which includes $15 million drawn on the term loan offset by $2.1 million for payment of quarterly dividends, $4.8 million for the purchase of stock under the stock buyback program and $125,000 for payments on the term loan. Net cash used by financing activities was $18.1

29
million for 2015 which includes $5.7 million for payment of quarterly dividends and $12.4 million for the purchase of stock under the stock buyback program. We paid a special dividend on January 5, 2015 of $1.00 per share to shareholders of record on December 23, 2014, totaling $5.9 million. The Company initiated a quarterly dividend of $0.25 per share during the first quarter of 2015. During 2015, quarterly dividends of $0.25 per share were paid on April 14, 2015, June 16, 2015, September 17, 2015 and December 15, 2015 for a total of $5.7 million. During 2016, quarterly dividends of $0.10 per share were paid on April 12, 2016, June 14, 2016, September 15, 2016 and December 13, 2016 for a total of $2.1 million. Our board did not declare a dividend during the first quarter of 2017. Declaration of the dividends is at the discretion of the Board each quarter, and will depend upon the Company’s financial performance, cash requirements, outlook and other factors deemed relevant by the Board. During December 2014, our Board approved an increase in our stock repurchase program to $20 million. The program permits purchase of common stock in the open market or privately negotiated transactions, does not obligate us to acquire any particular amount of stock, does not have an expiration date and can be amended or terminated at any time without prior notice. During the first quarter of 2016, we purchased 181,075 shares at an average price of $19 per share. During the second quarter of 2016, we purchased 12,955 shares at an average price of $21 per share. During the third quarter of 2016, we purchased 33,948 shares at an average price of $22 per share. During the fourth quarter of 2016, we purchased 17,655 shares at an average price of $22 per share. As of December 31, 2016, $2.8 million remained available under the program.
Our long term-debt is described in Note 5 to our financial statements included as an attachment to this report. In the fourth quarter of 2016, we entered into a $15.0 million term loan. We also have a $10.0 million revolving credit facility and no amounts were drawn on the facility as of December 31, 2016 or December 31, 2015. We have no outstanding letters of credit as of December 31, 2016. In the normal course of our business, we may be required to provide letters of credit to secure the payment of workers' compensation obligations. Additionally, under certain contracts we may be required to provide letters of credit and bonds to secure our performance and payment obligations. At December 31, 2016, bonds and letters of credit amounted to $63.5 million compared to $52.1 million at December 31, 2015. We believe that general industry conditions have led customers to require performance bonds more often than in the past. Although we believe that in the future we will be able to obtain bonds, letters of credit, and similar obligations on terms we regard as acceptable, there can be no assurance we will be successful in doing so. In addition, the cost of obtaining such bonds, letters of credit and similar obligations has increased and may continue to increase. Our backlog was $216.5 million at December 31, 2016 as compared to $211.8 million at December 31, 2015 and $180.2 million at December 31, 2014. We believe that our existing working capital, cash flow from operations and bank commitments will be adequate to meet our working capital needs for operations and capital expenditures through 2017. We further believe that, barring unforeseen circumstances, we should have sufficient resources to meet our cash needs through 2018.

30
Directors and Executive Officers Chairman Emeritus J. Parker Conrad founded our Company and served as Chairman of the Board from its inception in 1948 and as President from 1948 until 1994. From March 1998, Mr. Conrad served as Executive Co-Chairman of the Board of Conrad Industries, Inc., our holding company formed at that time in connection with our initial public offering, until his retirement from our Board in January 2014. Upon his retirement from our Board, he was granted the honorary position of Chairman Emeritus and is invited to attend all board meetings, although he is not entitled to vote. He remains an employee of our Company and serves as Advisor to the Chief Executive Officer. Mr. Conrad is the father of John P. Conrad, Jr. and grandfather of Daniel T. Conrad. Current Directors
Name Age Position
John P. Conrad, Jr. 74 Chairman of the Board of Directors, 1998 President and Chief Executive Officer (Class III)
Cecil A. Hernandez 60 Director (Class I) 1998
Michael J. Harris 67 Director (Class II) 1998
Ogden U. Thomas, Jr. 71 Director (Class II) 2004 Daniel T. Conrad
53 Director (Class III)
2014
John P. Conrad, Jr. has been with our company since 1962, serving as Vice President since 1982, and as Co-Chairman of the Board of Conrad Industries, Inc. from March 1998 to January 2014, when he became Chairman of the Board. Mr. Conrad has served as President and Chief Executive Officer since April 2004. Mr. Conrad founded Johnny’s Propeller Shop, Inc., a marine-related service company, in 1963 and is Chairman of the Board and Chief Executive Officer of this company. In 2000, Mr. Conrad and members of his immediate family founded Summit Management Group, L.L.C., which currently owns, among other investments, all of the outstanding ownership interests in Johnny’s Propeller Shop. Mr. Conrad is currently the Operating Manager of Summit Management Group. Michael J. Harris has been a director of Conrad Industries since the consummation of the initial public offering in June 1998. From 2005-2014, Mr. Harris was president of Hope Christian Community Foundation, a charitable organization in Memphis, Tennessee, where he currently serves as President Emeritus. Previously, Mr. Harris was a Managing Director of Morgan Keegan & Company, Inc., where he was employed since 1986. Morgan Keegan was the lead managing underwriter of our initial public offering. Cecil A. Hernandez has been a director of Conrad Industries since March 1998. Mr. Hernandez joined Conrad Industries in January 1998 and served as Vice President-Finance and Administration and Chief Financial Officer of Conrad Industries from 1998 until 2002. During August 2004, Mr. Hernandez returned to Conrad and served as Chief Operating Officer and interim CFO until February 2005, at which time, he assumed the position of Executive Vice-President and Chief Financial Officer. From October 2002 to August 2004, Mr. Hernandez served as the President of Summit Management Group, L.L.C., a company formed by John P. Conrad, Jr. and his immediate family. Mr. Hernandez founded Hernandez & Blackwell CPAs in 1983 and served as its Managing Partner until December 1997. Hernandez & Blackwell CPAs merged with Darnall Sikes & Frederick CPAs in 1996. Additionally, Mr. Hernandez provided accounting and consulting services for Conrad Industries as the outside Certified Public Accountant from 1993 until 1997. From 1982 to 1983, Mr. Hernandez served as Assistant Controller for Oceaneering International, a publicly traded diving company. Mr. Hernandez was employed by the international accounting firm Deloitte Haskins & Sells (now Deloitte & Touche LLP) from 1979 to 1982.
Year First Became a Director

31
Ogden U. Thomas, Jr. has been a director of Conrad Industries since April 2004. Mr. Thomas served on the Board of Directors of Cross Group, Inc., a privately held group of companies servicing the oil and gas, marine services, offshore construction and deepwater services industries until July 2016, and from 2006 to 2011 served as that company’s President and Chief Operating Officer. From 1988 to 2003, Mr. Thomas served as the President of the ENSCO Marine Company Division of ENSCO International, a leading offshore drilling contractor. Prior to that time, Mr. Thomas served in various management positions with Seahorse, Inc., a world-wide operator of offshore supply and anchor handling vessels and a subsidiary of Texas Eastern Corporation, and as President of the Drilling Services Division of Texas Eastern Corporation. Daniel T. Conrad has been a director of Conrad Industries since January 2014. Mr. D. Conrad was appointed to the Board of Directors to fill the vacancy created by the resignation of J. Parker Conrad and to serve as a Class III director. Mr. Conrad joined the company in 1997 and has held numerous positions including Facility Manager, Sales Manager, Business Relations Manager and currently is Senior Vice President of our Conrad Shipyard, Conrad Aluminum and Conrad Orange subsidiaries. From 1989 to 1996, Mr. Conrad served in various positions with Venture Transport, Inc., a specialized carrier in oilfield and energy equipment. Mr. Conrad is the son of John P. Conrad, Jr. Executive Officers Set forth below is certain information concerning our current executive officers, including the business experience of each during the past five years.
Name Age Position with Conrad Industries John P. Conrad, Jr. ...................................... 74 President, Chief Executive Officer and Chairman of the Board Cecil A. Hernandez. .................................... 60 Executive Vice President, Chief Financial Officer and Secretary Scott J. Theriot. ........................................... 58 Executive Vice President, Chief Operating Officer Daniel T. Conrad. ....................................... 53 Senior Vice President Information regarding the business experience of Mr. Conrad, Jr., Mr. Hernandez, and Mr. D. Conrad is set forth above under the heading “Directors.” Scott J. Theriot became Executive Vice President and Chief Operating Officer of Conrad Industries in May 2015. Mr. Theriot has been in the shipyard business since 1976 in various positions spending the majority of his career with Bollinger Shipyards and was a member of Bollinger’s senior management team for a total of 25 years. Mr. Theriot has held positions of Executive Vice President of Sales and Marketing, Executive Vice President of New Construction and Vice President & General Manager. Mr. Theriot’s experience encompasses both marine repair and conversion services and new construction services with energy, commercial, and government marine customers. Independent Directors Committee We have two independent directors, as independence is defined by The NASDAQ Stock Market: Mr. Harris and Mr. Thomas. Messrs. Harris and Thomas serve on our Independent Directors Committee, which has the functions described in the Independent Directors Committee Charter, a copy of which was included with our 2016 proxy statement. These functions include being directly responsible for the appointment, compensation, retention and oversight of the work of our independent auditors, approving all compensation and benefits provided to, and any employment agreement with, an executive officer of our company, and approving related party transactions involving a director or executive officer.

32
Executive Compensation Summary Compensation Table
The following table provides summary information concerning compensation paid or accrued during the last three fiscal years to our Chief Executive Officer and to each of our other current executive officers (each, a “Named Executive Officer” and, together, the “Named Executive Officers”). Except as noted below for fiscal years 2014, 2015 and 2016, none of the Named Executive Officers received perquisites, the aggregate value of which exceeded $10,000.
Name and Principal Position Annual Compensation Year Salary Bonus (1)
John P. Conrad, Jr. .................................................. 2016 360,300 $ — $ 14,888 (2) President, Chief Executive Officer and 2015 367,229 — 11,127 (2)
Chairman of the Board 2014 360,300 531,980 13,203 (2)
Cecil A. Hernandez ................................................. 2016 210,300 — 17,125 (2) Executive Vice President, Chief Financial 2015 214,344 — 14,037 (2)
Officer and Secretary 2014 210,300 310,506 11,808 (2) Scott J. Theriot ........................................................ 2016 210,300 — 44,217 (3)
Executive Vice President and Chief 2015 136,474 — 7,561 (2) Operating Officer
Daniel T. Conrad. ................................................... 2016 159,975 — 17,140(4) Senior Vice President 2015 163,013 — 14,258(4) 2014 158,590 64,747 15,132(4)
(1) Represents bonuses paid in 2015 with respect to fiscal 2014. (2) Represents amounts paid by us under our auto allowance program. (3) (4)
Represents $4,500 paid by us under our 401(k) plan, $13,529 paid by us under our auto allowance plan and $26,188 paid by us as bonuses. Represents $3,950 paid by us under our 401(k) plan and $13,190 paid by us under our auto allowance program in 2016. Represents $4,026 paid by us under our 401(k) plan and $10,232 paid by us under our auto allowance program in 2015. Represents $3,915 paid by us under our 401(k) plan and $11,217 paid by us under our auto allowance program in 2014.
Option Grants During 2016
There were no options granted during the fiscal year ended December 31, 2016. There were no options outstanding at December 31, 2015 and 2016. For additional information, see Note 6 to our financial statements in the attachment.
Annual and Long-Term Incentive Plan We have established an annual incentive plan under which our key employees may be awarded cash bonuses based upon the achievement of certain performance goals. For 2016 and prior years, the executive bonus pool has generally been a percentage of EBITDA. The Company must achieve a minimum return on equity as determined by the Board before bonuses under the plan can be paid. The payment of any bonuses is at the discretion of the Board, which may increase or decrease bonus amounts determined under the plan formulas. The payment of bonuses to executive officers must be approved by the Independent Directors Committee. In 2015, the Committee approved the following cash bonuses under the plan, which was paid in 2015 with respect to 2014, to Messrs. Conrad, Conrad, Jr., Hernandez, and D. Conrad, respectively: $78,077; $531,980; $310,506, and $64,747. With respect to 2015 and 2016 bonuses that would have been paid during 2016 and 2017, the Company did not achieve the minimum return on equity as determined by the Board for 2015 and 2016, and therefore no bonuses were awarded.
All Other Compensation

33
For 2017, our Independent Directors’ Committee has approved a new annual incentive plan pursuant to which our executive officers may receive cash bonuses calculated as a percentage of salary, based upon achieving specified threshold, target and stretch returns on equity. The payment of any bonuses is at the discretion of the Board, which may increase or decrease bonus amounts determined under the plan formulas. All bonuses paid to executive officers must be approved by the Independent Directors’ Committee. In May 2014, the Company adopted a long-term incentive compensation plan, and the Independent Directors Committee made awards under the plan to certain key employees who are not directors, including Terry T. Frickey, our former Chief Operating Officer under which a maximum of approximately $3.0 million in aggregate may be paid by the Company during a three-year period. The plan provides a cash incentive for the employee to remain employed by the Company through a specified vesting date, at which time the cash incentive is due. The plan was designed to encourage the continued service of certain key employees deemed important to the Company’s management succession planning process. Mr. Frickey’s award was $1.47 million and was scheduled to vest on May 6, 2016. If the employee’s employment terminates prior to the vesting of an award, the award is forfeited, except that, if prior to the applicable vesting date, the employee’s employment (i) terminates due to death or disability, (ii) is terminated by the Company without cause, or (iii) is terminated by the employee for good reason, then the employee will fully vest in the award. In May 2015, the Independent Directors Committee made awards under the Company’s long-term incentive plan to John P. Conrad, Jr., Cecil A. Hernandez, Daniel T. Conrad, Scott J. Theriot and another employee pursuant to which if such recipients remain employed for a five year period for Messrs. Conrad, Jr., Hernandez and D. Conrad and for a four year period for the other recipients, they will receive lump sum cash payments totaling $2.3 million ($1.08 million for Mr. Conrad, Jr.; $0.63 million for Mr. Hernandez; $0.32 million for Mr. Theriot and $0.24 million for D. Conrad). If employment terminates prior to vesting, the award is forfeited, except accelerated vesting occurs upon death or disability, and termination by the Company without cause or by the officer for good reason, as defined in the plan. Mr. Frickey retired from the Company effective January 1, 2016. Pursuant to the Company’s long-term incentive plan, the Independent Directors Committee determined to waive the remaining vesting period of Mr. Frickey’s $1.47 million award, which the Company paid at his retirement. Directors’ Compensation Our directors who are employees do not receive any compensation for service on our Board of Directors or any committee. Our directors are, however, reimbursed for expenses incurred in connection with attending each Board and committee meeting. During 2016, directors who are not our employees received a fee of $40,800 annually, plus $1,350 for attendance at each Board of Directors meeting and $500 for each committee meeting attended. Agreements with Directors and Executive Officers We have employment and non-competition agreements with Messrs. Conrad Jr., Hernandez, Theriot, and D. Conrad. The agreements provide that the company will pay base salaries of $360,300 to Mr. Conrad, Jr., $210,300 to Mr. Hernandez, $210,300 to Mr. Theriot, and $158,000 to Mr. D. Conrad. Each of the agreements provide for employment through May 31, 2017 and for annual extensions thereafter, subject to the parties’ mutual agreement In addition, Messrs. Conrad, Jr., Hernandez, Theriot, and D. Conrad receive a monthly automobile allowance of $700, automobile insurance, and reimbursement for fuel and maintenance expenses. The agreements also provide that each executive will be reimbursed for out-of-pocket business expenses and that each executive is eligible to participate in all benefit plans and programs as are maintained from time to time by us. The agreements prohibit the executives from competing with us during the term of their employment and for a period of two years, in the case of Mr. Conrad, Jr. and one year, in the case of the other executives after the termination of their employment. The agreements also prohibit the executives from disclosing our confidential information and trade secrets.
Each agreement is terminable by us for “cause” upon ten days’ written notice to the executive, and without “cause” by us upon the approval of a majority of our Board of Directors. Each agreement may also be terminated by the

34
executive for “good reason” and, in the case of Mr. Conrad, Jr., may be terminated by the executive for any reason upon 30 days written notice to us. In the event the employment of Mr. Conrad, Jr. is terminated by us without “cause” or is terminated by Mr. Conrad, Jr. for “good reason,” Mr. Conrad, Jr. will be entitled to receive his base salary for one year at the rate then in effect, plus the average of the payments made to him pursuant to the Company’s annual incentive plan for each of the three fiscal years immediately preceding termination of employment (the “bonus component”), to be paid in substantially equal installments payable over a period of one year. In addition, the time period during which Mr. Conrad, Jr. will be restricted from competing with us will be shortened from two years to one year. In the event the employment of Messrs. Hernandez, Theriot, or D. Conrad is terminated by us without “cause” or is terminated by Messrs. Hernandez, Theriot, or D. Conrad for “good reason,” each will be entitled to receive his base salary for one year at the rate then in effect, plus the bonus component, to be paid in substantially equal installments payable over a period of one year.
The agreements for Messrs. Conrad Jr., Hernandez, Theriot, and D. Conrad provide that if, within two years following a change in control of the Company, the executive’s employment is terminated by us other than for “cause” or by the executive for “good reason,” or the executive is terminated by us within six months before a change in control at the request of the acquirer in anticipation of the change in control, instead of the severance described above, the executive will be entitled to receive in a lump sum payment the equivalent of the sum of (x) the bonus component prorated by multiplying such amount by the fraction obtained by dividing the number of days in the year through the date of termination of employment by 365, plus (y) an amount equal to 1.5 times the applicable annual premium for health insurance (including any portion thereof paid by executive) under a Company group health plan in which executive and eligible family members are enrolled at the time of termination of employment, plus (z) an amount equal to two times the sum of (I) the executive’s base salary at the rate in effect on executive’s termination date, and (II) the highest annual payment made to executive pursuant to the Company’s annual incentive plan during the three fiscal years immediately preceding the executive’s termination date. If any of these payments are not required to be made in full within 10 business days after termination of employment, the Company or successor must contribute such amounts to a rabbi trust. In addition, the provisions that restrict the executive’s competition with us will no longer apply. For any fiscal year ending during the two years following a change in control during which entire year the executive remains employed, his bonus must be at least equal to the bonus component. The agreements provide for a reduction of any change of control benefits to avoid parachute payment excise taxes if the executive would receive greater after-tax benefits with a reduction than he would receive if he had been paid the unreduced benefit and paid the excise tax. Excess parachute payment tax gross-up provisions in Messrs. Conrad Jr.’s and Mr. Hernandez’ employment agreements were eliminated. We have also entered into indemnity agreements with all of our directors requiring us to indemnify and advance expenses to them in connection with their service to our company to the fullest extent permitted by law. The agreements also require us to maintain directors’ and officers’ liability insurance, unless it is not reasonably available or, in the reasonable business judgment of our directors, there is insufficient benefit to us from the insurance.
Security Ownership of Certain Beneficial Owners and Management and Related Stockholder Matters The following table presents certain information, as of March 10, 2017, regarding the beneficial ownership of our common stock by:
• each person who is known by us to beneficially own more than five percent of our outstanding shares of common stock;
• each of our directors; • the Named Executive Officers; and • all of our current directors and executive officers as a group.

35
Except as described below, each of the persons listed in the table has sole voting and investment power with respect to the shares listed.
Beneficial Owner Number of
Shares % of Total
Outstanding John Parker Conrad Family, L.L.C.………………………………………….. 1,043,267 20.4% J. Parker Conrad(1) .............................................................................................. 95,495 1.9 % John P. Conrad, Jr.(2) .......................................................................................... 2,124,920 41.6 % Katherine C. Court(3) .......................................................................................... 1,043,267 20.4 % Daniel T. Conrad ………………………………………………………………. 13,700 0.3 % Michael J. Harris.................................................................................................. 7,000 * Cecil A. Hernandez .............................................................................................. 50,968 1.0 % Ogden U. Thomas, Jr. .......................................................................................... 2,000 * All directors and executive officers as a group(4) (6 persons) ............................ 2,198,588 43.1 % __________ * Less than one percent. (1) Represents shares held by The Conrad Family Foundation, of which Messrs. Conrad and Conrad, Jr. act as co-
trustees. (2) Includes 374,216 shares held by The John P. Conrad, Jr. Trust for which Mr. Conrad, Jr. exercises sole voting
and investment control as Trustee for the trust. Also includes 95,495 shares held by The Conrad Family Foundation, of which Messrs. Conrad and Conrad, Jr. act as co-trustees. Also includes 1,043,267 shares held by the John Parker Conrad Family, L.L.C., of which John P. Conrad, Jr. and Katherine C. Court are the sole managers.
(3) Includes 1,043,267 shares held by the John Parker Conrad Family, L.L.C., of which John P. Conrad, Jr. and Katherine C. Court are the sole managers. The address of Ms. Court is 979 Coyote Trl., Round Mountain, TX, 78663.
(4) Excludes shares beneficially owned by Katherine C. Court, who is the daughter of J. Parker Conrad and the sister of John P. Conrad, Jr.
Certain Relationships and Related Transactions We purchase in the ordinary course of business certain components from Johnny’s Propeller Shop, Inc. (“JPS”), a company wholly owned indirectly by John P. Conrad, Jr., Chairman of the Board of Directors, President and Chief Executive Officer and members of his immediate family. Total purchases for the three years ended December 31, 2016, 2015, and 2014 were $2,314,000, $4,235,000, and $5,238,000, respectively. We were also leasing a building from JPS for the six months beginning November 1, 2013 for $3,750 a month. During 2013, we purchased furniture from JPS for $16,408. In April 2014, we completed the acquisition of the property and buildings of JPS located within our Morgan City shipyard for $1.3 million, and, accordingly, terminated our lease of a portion of the property. We entered into an occupancy agreement with JPS that permitted JPS to remain until October 30, 2014 on the portion of the premises not occupied by us, provided that JPS paid the required utilities, maintenance, repairs and insurance during its occupancy. In addition, John P. Conrad Jr.’s son purchased an ownership interest in Power Panels, LLC (“PP”), from which we purchased electrical components totaling $384,000 and $338,000 for the year ended December 31, 2016 and 2015, respectively. These transactions were approved by the Independent Directors Committee.
In addition, J. Parker Conrad, the founder and father of John P. Conrad, Jr., is an employee and was paid aggregate compensation for services as an employee of the Company of $132,200, $212,819, and $252,087 during 2016, 2015 and 2014, respectively.

36
Financial Statements and Quarterly Financial Data Our audited Financial Statements for the year ended December 31, 2016 are included as an attachment to this Annual Report. 2016 Quarterly Results of Operations
Financial Data:Revenue
Vessel construction 38,849$ 84.6% 31,237$ 75.6% 27,572$ 80.7% 38,063$ 88.5%Repair and conversions 7,098 15.4% 10,068 24.4% 6,573 19.3% 4,956 11.5%
Total revenue 45,947 100.0% 41,305 100.0% 34,145 100.0% 43,019 100.0%Cost of revenue
Vessel construction 34,936 89.9% 30,194 96.7% 31,895 115.7% 38,180 100.3%Repair and conversions 6,069 85.5% 8,950 88.9% 5,937 90.3% 4,732 95.5%
Total cost of revenue 41,005 89.2% 39,144 94.8% 37,832 110.8% 42,912 99.8%Gross profit/(loss)
Vessel construction 3,913 10.1% 1,043 3.3% (4,323) -15.7% (117) -0.3%Repair and conversions 1,029 14.5% 1,118 11.1% 636 9.7% 224 4.5%
Total gross profit/(loss) 4,942 10.8% 2,161 5.2% (3,687) -10.8% 107 0.2%S G & A expenses 1,577 3.4% 1,585 3.8% 1,556 4.6% 1,765 4.1%Income from operations 3,365 7.3% 576 1.4% (5,243) -15.4% (1,658) -3.9%Interest expense - 0.0% - 0.0% - 0.0% (44) -0.1%Other income/(expense), net 19 0.0% 85 0.2% 46 0.1% 405 0.9%Income/(loss) before income 3,384 7.4% 661 1.6% (5,197) -15.2% (1,297) -3.0%Income tax provision 810 1.8% (639) -1.5% (465) -1.4% (461) -1.1%Net income/(loss) 2,574$ 5.6% 1,300$ 3.1% (4,732)$ -13.9% (836)$ -1.9%
EBITDA 5,055$ 11.0% 2,347$ 5.7% (3,342)$ -9.8% 609$ 1.4%
Net cash provided by/(used in) operating activities (2,051)$ (6,560)$ (14,928)$ (12,680)$ Net cash used in investing activities (1,980)$ (2,166)$ (1,209)$ (1,499)$ Net cash provided by/(used in) financing activities (3,889)$ (790)$ (1,267)$ 13,971$
Quarters endedMarch 31, 2016 June 30, 2016 September 30, 2016 December 31, 2016
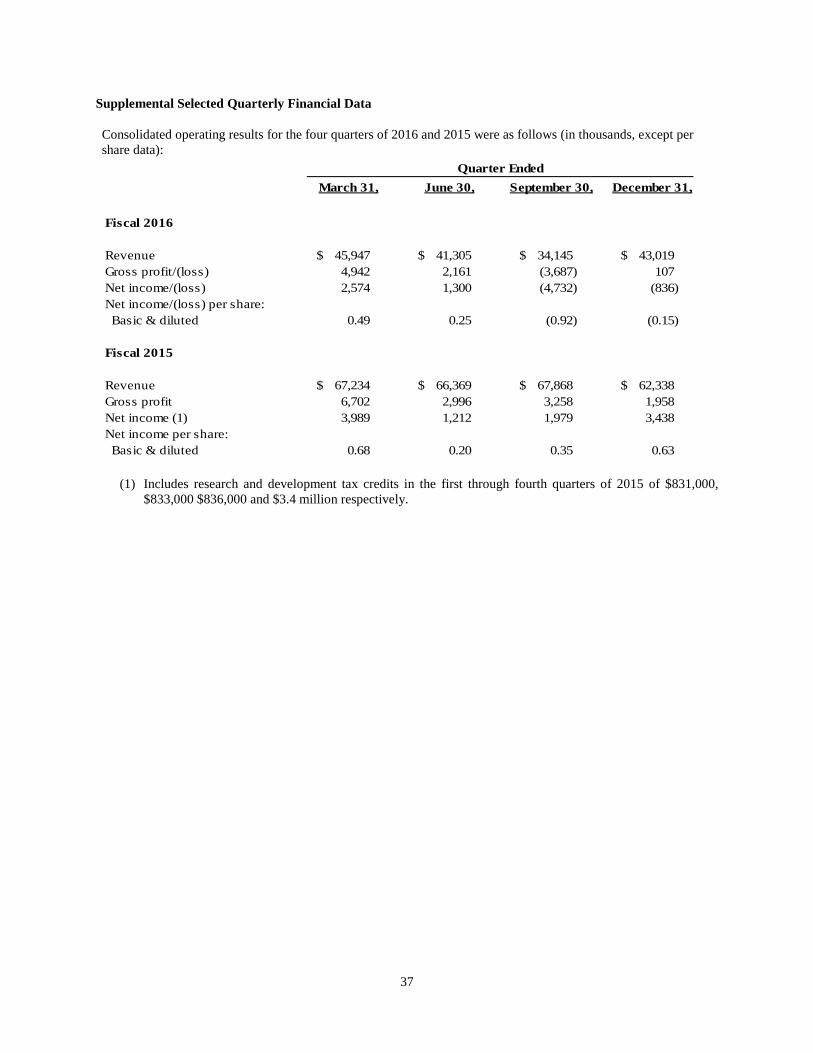
37
Supplemental Selected Quarterly Financial Data
Consolidated operating results for the four quarters of 2016 and 2015 were as follows (in thousands, except per share data):
Quarter EndedMarch 31, June 30, September 30, December 31,
Fiscal 2016
Revenue 45,947$ 41,305$ 34,145$ 43,019$ Gross profit/(loss) 4,942 2,161 (3,687) 107 Net income/(loss) 2,574 1,300 (4,732) (836) Net income/(loss) per share: Basic & diluted 0.49 0.25 (0.92) (0.15)
Fiscal 2015
Revenue 67,234$ 66,369$ 67,868$ 62,338$ Gross profit 6,702 2,996 3,258 1,958 Net income (1) 3,989 1,212 1,979 3,438 Net income per share: Basic & diluted 0.68 0.20 0.35 0.63
(1) Includes research and development tax credits in the first through fourth quarters of 2015 of $831,000, $833,000 $836,000 and $3.4 million respectively.

Section II
CONRAD INDUSTRIES, INC.
AND SUBSIDIARIES
Consolidated Financial Report
December 31, 2016

TABLE OF CONTENTS
Page No. INDEPENDENT AUDITOR’S REPORT 1-2 CONSOLIDATED FINANCIAL STATEMENTS Consolidated Balance Sheets 3 Consolidated Statements of Operations 4 Consolidated Statements of Shareholders’ Equity 5 Consolidated Statements of Cash Flows 6 Notes to Consolidated Financial Statements 7-19

E u g e n e H . D a r n a l l , C P A , D e c e a s e d 2 0 0 9
E . L a r r y S i k e s , C P A / P F S , C V A , C F P ® D a n n y P . F r e d e r i c k , C P A
C l a y t o n E . D a r n a l l , C P A , C V A E u g e n e H . D a r n a l l , I I I , C P A
S t e p h a n i e M . H i g g i n b o t h a m , C P A J o h n P . A r m a t o , C P A / P F S
J . S t e p h e n G a r d e s , C P A J e n n i f e r S . Z i e g l e r , C P A / P F S , C F P ®
C h r i s A . M i l l e r , C P A , C V A S t e v e n G . M o o s a , C P A
M . R e b e c c a G a r d e s , C P A J o a n B . M o o d y , C P A
L a u r e n V . H e b e r t , C P A / P F S E r i c h G . L o e w e r , I I I , C P A , M . S . T a x
J e r e m y C . M e a u x , C P A S t e p h e n R . D i s c h l e r , C P A , M B A
P a m e l a M a y e u x B o n i n , C P A , C V A C r a i g C . B a b i n e a u x , C P A / P F S , C F P ®
A d a m J . C u r r y , C P A , C F P ® K y l e P . S a l t z m a n , C P A , C F E
B l a i n e M . C r o c h e t , C P A , M . S . J a c o b C . R o b e r i e , C P A
K e v i n S . Y o u n g , C P A
C h r i s t y S . D e w , C P A , M P A R a c h e l W . A s h f o r d , C P A
V e r o n i c a L . L e B l e u , C P A , M B A C h r i s t i n e G u i d r y B e r w i c k C P A , M B A
B r a n d o n L . P o r t e r , C P A B r a n d o n R . D u n p h y , C P A
R o b e r t C . D a r n a l l , C P A , M . S . , C V A T a n y a S . N o w l i n , C P A , C G M A , P h . D .
N i c o l e B . B r u c h e z , C P A , M B A J e n i f e r Z . M a r c i a l , C P A
K a i S e a h , C P A K a t i e D e b a i l l o n , C P A
N i c o l a u s D . S i m o n , C P A E m i l e M . J o s e p h I I I , C P A
J e r o m y T . B o u r q u e , C P A B e n B a u d o i n , C P A
B a r r e t t B . P e r r y , C P A , M B A A n d r e J . H u v a l , C P A
A l y s s a M . C a r t , C P A , M . S . A m y D r a u g h o n , C P A , M B A
E l i z a b e t h N . D e b a i l l o n , C P A C h e r i e B o u d r e a u x N a v a r r e , C P A , M . S .
2000 Kaliste Saloom Suite 300
Lafayette, LA 70508 Phone: 337.232.3312
Fax: 337.237.3614
1231 E. Laurel Avenue Eunice, LA 70535
Phone: 337.457.4146 Fax: 337.457.5060
1201 Brashear Avenue Suite 301
Morgan City, LA 70380 Phone: 985.384.6264
Fax: 985.384.8140
203 S. Jefferson Street Abbeville, LA 70510 Phone: 337.893.5470
Fax: 337.893.5470
A Member of:
American Institute of Certified Public Accountants
Society of Louisiana Certified Public Accountants
www.dsfcpas.com
INDEPENDENT AUDITOR’S REPORT
To the Board of Directors and Shareholders of Conrad Industries, Inc. and Subsidiaries Morgan City, Louisiana
We have audited the accompanying consolidated financial statements of Conrad Industries, Inc. and Subsidiaries, which comprise the consolidated balance sheets as of December 31, 2016 and 2015, and the related consolidated statements of operations, shareholders’ equity, and cash flows for the years ended December 31, 2016, 2015, and 2014, and the related notes to the financial statements.
Management’s Responsibility for the Financial Statements
Management is responsible for the preparation and fair presentation of these consolidated financial statements in accordance with accounting principles generally accepted in the United States of America; this includes the design, implementation, and maintenance of internal control relevant to the preparation and fair presentation of consolidated financial statements that are free from material misstatement, whether due to fraud or error.
Auditor’s Responsibility
Our responsibility is to express an opinion on these consolidated financial statements based on our audits. We conducted our audits in accordance with auditing standards generally accepted in the United States of America. Those standards require that we plan and perform the audit to obtain reasonable assurance about whether the consolidated financial statements are free from material misstatement.
An audit involves performing procedures to obtain audit evidence about the amounts and disclosures in the consolidated financial statements. The procedures selected depend on the auditor’s judgment, including the assessment of the risks of material misstatement of the consolidated financial statements, whether due to fraud or error. In making those risk assessments, the auditor considers internal control relevant to the entity’s preparation and fair presentation of the consolidated financial statements in order to design audit procedures that are appropriate in the circumstances, but not for the purpose of expressing an opinion on the effectiveness of the entity’s internal control.
1

Accordingly, we express no such opinion. An audit also includes evaluating the appropriateness of accounting policies used and the reasonableness of significant accounting estimates made by management, as well as evaluating the overall presentation of the consolidated financial statements.
We believe that the audit evidence we have obtained is sufficient and appropriate to provide a basis for our audit opinion.
Opinion
In our opinion, the consolidated financial statements referred to above present fairly, in all material respects, the financial position of Conrad Industries, Inc. and Subsidiaries as of December 31, 2016 and 2015, and the results of their operations and their cash flows for the years ended December 31, 2016, 2015, and 2014, in accordance with accounting principles generally accepted in the United States of America.
Darnall, Sikes, Gardes & Frederick A Corporation of Certified Public Accountants Lafayette, Louisiana March 10, 2017
2

3
December 31, December 31,ASSETS 2016 2015
CURRENT ASSETS: Cash and cash equivalents 11,874$ 46,922$ Accounts receivable, net 7,754 10,136 Costs and estimated earnings, net in excess of billings on uncompleted contracts 55,630 23,643 Inventories 4,799 2,968 Other receivables 5,071 6,172 Other current assets 6,849 4,408
Total current assets 91,977 94,249
PROPERTY, PLANT AND EQUIPMENT, net 72,462 72,705 OTHER ASSETS 94 -
TOTAL ASSETS 164,533$ 166,954$
LIABILITIES AND SHAREHOLDERS' EQUITY
CURRENT LIABILITIES: Accounts payable 9,998$ 9,248$ Accrued employee costs 3,219 3,853 Accrued expenses 747 2,102 Current maturities of long-term debt 1,500 - Billings in excess of costs and estimated earnings, net on uncompleted contracts 10,447 17,770
Total current liabilities 25,911 32,973
LONG-TERM DEBT, less current maturities 13,375 -
DEFERRED INCOME TAXES 9,408 9,598
Total liabilities 48,694 42,571
SHAREHOLDERS' EQUITY: Preferred stock, $0.01 par value, 5,000,000 shares authorized, no shares issued - - Common stock, $0.01 par value 20,000,000 shares authorized, 7,314,837 in 2016 and 2015 73 73 Additional paid-in capital 29,104 29,104 Treasury stock at cost, 2,202,326 in 2016 and 1,956,693 in 2015 (37,105) (32,315) Retained earnings 123,767 127,521
Total shareholders' equity 115,839 124,383
TOTAL LIABILITIES AND SHAREHOLDERS' EQUITY 164,533$ 166,954$
CONRAD INDUSTRIES, INC. AND SUBSIDIARIESCONSOLIDATED BALANCE SHEETS
(In thousands, except share data)
See independent auditor's report and notes to consolidated financial statements.

4
2016 2015 2014REVENUE 164,416$ 263,809$ 309,009$
COST OF REVENUE 160,893 248,895 269,197
GROSS PROFIT 3,523 14,914 39,812
SELLING, GENERAL AND ADMINISTRATIVE EXPENSES 6,483 7,153 8,558
INCOME/(LOSS) FROM OPERATIONS (2,960) 7,761 31,254
INTEREST EXPENSE (44) (82) (11)
OTHER INCOME/(EXPENSE), NET 555 (1,364) 235
INCOME/(LOSS) BEFORE INCOME TAXES (2,449) 6,315 31,478
PROVISION/(BENEFIT) FOR INCOME TAXES (755) (4,303) 8,657
NET INCOME/(LOSS) (1,694)$ 10,618$ 22,821$
Income/(Loss) Per Share Basic and Diluted (0.33)$ 1.86$ 3.84$
Weighted Average Common Shares Outstanding Basic and Diluted 5,174 5,700 5,950
See independent auditor's report and notes to consolidated financial statements.
CONRAD INDUSTRIES, INC. AND SUBSIDIARIESCONSOLIDATED STATEMENTS OF OPERATIONS
(In thousands, except per share data)
Year Ended December 31,

5
Additional
Paid-in Retained
Shares Amount Capital Shares Amount Earnings Total
BALANCE—December 31, 2013 7,314 73 29,102 1,353 (16,730) 105,642 118,087
Purchase of treasury stock - - - 100 (3,200) - (3,200) Stock issued 1 - 2 - - - 2 Dividends on common stock - - - - - (5,862) (5,862) Net income - - - - - 22,821 22,821
BALANCE—December 31, 2014 7,315 73 29,104 1,453 (19,930) 122,601 131,848
Purchase of treasury stock - - - 504 (12,385) - (12,385) Stock issued - - - - - - - Dividends on common stock - - - - - (5,698) (5,698) Net income - - - - - 10,618 10,618
BALANCE—December 31, 2015 7,315 73 29,104 1,957 (32,315) 127,521 124,383
Purchase of treasury stock - - - 245 (4,790) - (4,790) Stock issued - - - - - - - Dividends on common stock - - - - - (2,060) (2,060) Net loss - - - - - (1,694) (1,694)
BALANCE—December 31, 2016 7,315 73$ 29,104$ 2,202 (37,105)$ 123,767$ 115,839$
See independent auditor's report and notes to consolidated financial statements.
CONRAD INDUSTRIES, INC. AND SUBSIDIARIESCONSOLIDATED STATEMENTS OF SHAREHOLDERS' EQUITY
(In thousands)
Common Stock Treasury Stock
$0.01 Par Value at Cost

6
2016 2015 2014
CASH FLOWS FROM OPERATING ACTIVITIES: Net income/(loss) (1,694)$ 10,618$ 22,821$
Adjustments to reconcile net income to cash provided by/ (used in) operating activities: Depreciation and amortization 7,074 6,261 5,676 Deferred income tax benefit (2,675) (813) 490 Loss on sale of assets 25 3 1 Changes in assets and liabilities: Accounts receivable 2,382 13,944 4,851 Net change in billings related to cost and estimated earnings on uncompleted contracts (39,310) (13,303) 16,853 Inventory and other assets (782) 4,530 (9,913) Accounts payable, accrued expenses and other liabilities (1,239) (7,367) (6,911)
Net cash provided by/(used in) operating activities (36,219) 13,873 33,868
CASH FLOWS FROM INVESTING ACTIVITIES: Capital expenditures for plant and equipment (6,854) (17,480) (9,871) Proceeds from sale of assets - - 5 Net cash used in investing activities (6,854) (17,480) (9,866)
CASH FLOWS FROM FINANCING ACTIVITIES: Principal repayments of debt (125) - (1,221) Proceeds from issuance of debt 15,000 - - Increase in additional paid in capital - - 2 Dividends paid or payable (2,060) (5,698) (5,862) Purchase of treasury stock (4,790) (12,385) (3,200) Net cash provided by/(used in) financing activities 8,025 (18,083) (10,281)
NET INCREASE/(DECREASE) IN CASH AND CASH EQUIVALENTS (35,048) (21,690) 13,721
CASH AND CASH EQUIVALENTS, BEGINNING OF PERIOD 46,922 68,612 54,891
CASH AND CASH EQUIVALENTS, END OF PERIOD 11,874$ 46,922$ 68,612$
SUPPLEMENTAL DISCLOSURES CASH FLOW INFORMATION: Interest paid, net of capitalized interest 44$ 82$ 11$ Taxes paid 350$ 654$ 12,770$
See independent auditor's report and notes to consolidated financial statements.
CONRAD INDUSTRIES, INC. AND SUBSIDIARIES
CONSOLIDATED STATEMENTS OF CASH FLOWS(In thousands)
Year Ended December 31,

7
CONRAD INDUSTRIES, INC. AND SUBSIDIARIES NOTES TO CONSOLIDATED FINANCIAL STATEMENTS
1. SUMMARY OF SIGNIFICANT ACCOUNTING POLICIES
Organization and Basis of Presentation—The consolidated financial statements include the accounts of Conrad Industries, Inc. and its wholly-owned subsidiaries (the “Company”) which are primarily engaged in the construction, conversion and repair of a variety of marine vessels for commercial and government customers. New construction work and some repair work are performed on a fixed-price basis. We perform a significant amount of our repair work under time and materials agreements. All significant intercompany transactions have been eliminated.
Use of Estimates—The preparation of financial statements in conformity with accounting principles generally accepted in the United States of America requires management to make estimates and assumptions that affect the reported amounts of assets and liabilities and the disclosure of contingent assets and liabilities at the date of the financial statements, as well as reported amounts of revenues and expenses during the reporting period. Actual results could differ from those estimates.
Revenue Recognition—We are engaged in various types of construction under long-term construction contracts. The accompanying financial statements have been prepared using the percentage-of-completion method of accounting and, therefore, take into account the estimated cost, estimated earnings and revenue to date on contracts not yet completed. The amount of revenue recognized is based on the portion of the total contract price that the labor hours incurred to date bears to the estimated total labor hours, based on current estimates to complete. This method is used because management considers expended labor hours to be the best available measure of progress on these contracts. Revenues from time and materials agreements are recognized on the basis of cost incurred during the period plus the fee earned.
Contract costs include all direct material, labor, and subcontracting costs, and those indirect costs related to contract performance, such as indirect labor, supplies, tools, repairs, depreciation, and insurance costs. Revisions in estimates of cost and earnings during the course of the work are reflected in the accounting period in which the facts which require the revision become known. Provisions for estimated losses on uncompleted contracts are made in the period in which such losses are determined.
The Company provides warranties for the work we perform for periods ranging from six-months to twelve-months. We do not warrant machinery and equipment furnished by other manufacturers that become part of the vessels we build, convert, or repair. The manufacturers’ warranties are passed on to our customers. The warranty exposure for our workmanship, which is subject to our internal quality control programs as well as inspection by governmental agencies and customer representatives, is normally less than one percent of cost of revenue. This potential warranty exposure is recorded as a cost of the job pursuant to Statement of Position (“SOP”) 81-1 (ASC 605-35) Accounting For Performance of Construction-Type and Certain Production Type Contracts.
Indirect costs are allocated to contracts and to certain inventory and capital projects on the basis of direct labor charges.
Cash and Cash Equivalents—Cash and cash equivalents include cash on hand, and on deposit. Short-term investments with original maturities of less than three months are also considered cash and cash equivalents because they can be easily liquidated without penalties.
Allowance for Doubtful Accounts—Accounts receivable is stated at cost, net of any allowance for doubtful accounts. The Company maintains allowances for doubtful accounts for estimated losses resulting from the failure of customers to make required payments. The Company reviews the accounts receivable on a periodic basis and makes allowances where there is doubt as to the collectability of individual balances. In evaluating

8
the collectability of individual receivable balances, the Company considers many factors, including the age of the balance, the customer’s payment history, and current credit worthiness.
Property, Plant and Equipment—Property, plant and equipment is stated at cost. Depreciation is recorded using the straight-line method over the estimated useful lives of the individual assets which range from three to forty years. Ordinary maintenance and repairs which do not extend the physical or economic lives of the plant or equipment are charged to expense as incurred.
Interest Capitalization—Interest costs for the construction of certain long-term assets are capitalized and amortized over the related assets’ estimated useful lives. During the years ended December 31, 2016, 2015 and 2014, no interest costs were capitalized.
Impairment of Long-Lived Assets—Long-lived assets held and used by us are reviewed for impairment whenever events or changes in circumstances indicate that the carrying amount of an asset may not be recoverable. We assess the recoverability of long-lived assets by determining whether the carrying values can be recovered through undiscounted net cash flows expected to result from such operations and assets over their remaining lives. If impairment is indicated, the asset is written down to its fair value, or if fair value is not readily determinable, to its estimated discounted net cash flows.
Inventories—At December 31, 2016, inventories consisted of one stock vessel and steel plate and structurals, and excess job related materials and supplies. At December 31, 2015, inventories consisted of two stock vessels and steel plate and structurals, and excess job related materials and supplies. Inventories are stated at the lower of cost (first-in, first-out basis) or market.
Basic and Diluted Income Per Share—Basic net income per share is computed based on the weighted average number of common shares outstanding during the period. Diluted net income per share uses the weighted average number of common shares outstanding adjusted for the incremental shares attributable to dilutive outstanding options to purchase common stock. The Company did not have any dilutive outstanding options for the years ended December 31, 2016, 2015 and 2014.
Fair Value of Financial Instruments—The carrying amounts of our financial instruments including cash and cash equivalents, receivables and payables approximate fair value at December 31, 2016 and 2015.
Income Taxes—Income taxes are accounted for using the asset and liability method. Deferred income taxes are provided for the tax effect of temporary differences between the tax basis of assets and liabilities and their reported amounts in the financial statements at the enacted statutory rate to be in effect when the taxes are paid.
In July 2006, the FASB issued ASC 740-10-50, Accounting for Uncertainty in Income Taxes — an interpretation of FASB Statement No. 109, which clarifies the accounting and disclosure for uncertain tax positions, as defined. ASC 740-10-50 seeks to reduce the diversity in practice associated with certain aspects of the recognition and measurement related to accounting for income taxes. On January 1, 2007, we adopted the provisions of ASC 740-10-50. Based on our evaluation, we have concluded that there are no significant uncertain tax positions requiring recognition in our financial statements.
Subsequent Events—In May 2009, the FASB issued ASC 855, Subsequent Events which establishes general standards for accounting for and disclosures of events that occur after the balance sheet date but before financial statements are issued or are available to be issued. This is effective for financial periods ending after June 15, 2009. We have evaluated events subsequent to the balance sheet date through March 10, 2017, the date the financial statements were available to be issued.

9
2. RECEIVABLES
Receivables consisted of the following at December 31, 2016 and 2015 (in thousands):
December 31, December 31,2016 2015
U.S. Government: Amounts billed -$ -$ Unbilled costs and estimated earnings on uncompleted contracts 408 10
408 10
Commercial: Amounts billed 7,754 10,136 Unbilled costs and estimated earnings on uncompleted contracts 55,222 23,633
Total 63,384$ 33,779$
Included above in amounts billed is an allowance for doubtful accounts of $1.6 million and $898,000 at December 31, 2016 and 2015, respectively.
Unbilled costs and estimated earnings on uncompleted contracts were not billable to customers at the balance sheet dates under terms of the respective contracts. Of the unbilled costs and estimated earnings at December 31, 2016, majority is expected to be collected within the next twelve months.
Information with respect to uncompleted contracts as of December 31, 2016 and 2015 is as follows (in thousands):
December 31, December 31,2016 2015
Costs incurred on uncompleted contracts 129,014$ 104,526$ Estimated earnings, net (11,646) 7,575
117,368 112,101 Less billings to date (72,185) (106,228)
45,183$ 5,873$
The above amounts are included in the accompanying balance sheets under the following captions (in thousands):
December 31, December 31,2016 2015
Costs and estimated earnings, net in excess of billings on uncompleted contracts 55,630$ 23,643$ Billings in excess of cost and estimated earnings, net on uncompleted contracts (10,447) (17,770)
Total 45,183$ 5,873$
Pursuant to SOP 81-1, Paragraph 85-89 (ASC 605-35), when the current estimates of total contract revenue and contract cost indicate a loss, a provision for the entire loss on the contract should be made in the period it

10
became evident. The provision for the loss should be recorded as an additional contract cost in the income statement. The offsetting liability can be recorded on the balance sheet where related contract costs are accumulated on the balance sheet, in which case the provision may be deducted from the related accumulated costs. The Company recorded charges of $14.2 million for the twelve months ended December 31, 2016 ($4.7 million in 2015 and $2.7 million in 2014) in cost of revenues to reflect revised estimates related to anticipated losses on certain uncompleted vessels in progress. The offsetting credit was recorded in costs and estimated earnings, net in excess of billings on uncompleted contracts. As of December 31, 2016 and December 31, 2015, approximately $13.5 million and $4.3 million respectively, of this provision are included in costs and estimated earnings, net in excess of billings on uncompleted contracts.
3. OTHER RECEIVABLES
Other receivables consisted of the following at December 31, 2016 and 2015 (in thousands):
December 31, December 31,2016 2015
Income tax refund 4,935$ 6,077$ Insurance claims receivable 23 95 MARAD grant reimbursement 113 -
Total 5,071$ 6,172$
Substantially all of these amounts at December 31, 2016 are expected to be collected within the next twelve months.
4. PROPERTY, PLANT AND EQUIPMENT
Property, plant and equipment consisted of the following at December 31, 2016 and 2015 (in thousands):
December 31, December 31,2016 2015
Land 12,806$ 12,380$ Buildings and improvements 64,848 57,005 Machinery and equipment 37,347 31,618 Drydocks and bulkheads 14,943 15,053 Barges and boats 1,055 883 Office and automotive 2,525 3,082 Construction in progress 3,124 10,541
136,648 130,562 Less accumulated depreciation (64,186) (57,857)
72,462$ 72,705$

11
Depreciation is provided on property, plant and equipment based on the following estimates of useful lives:
UsefulLives
Land N/ABuildings and improvements 3-40 yearsMachinery and equipment 5-12 yearsDrydocks and bulkheads 3-30 yearsBarges and boats 10-15 yearsOffice and automotive 3-12 yearsConstruction in progress N/A
Building and improvements include buildings (40 year useful life), fencing, roadways, parking lots, concrete work areas, material storage racks and shelving, launch systems, and storage lockers (5 year useful life). Drydocks and bulkheads include drydocks (30 year useful life), bulkheads, pontoons, and blocking systems (5 year useful life).
5. LONG-TERM DEBT
Long-term debt consists of the following at December 31, 2016 and 2015 (in thousands): December 31, December 31,
2016 2015
Term loan - Bank, 3.5% due November 21, 2026 14,875$ -$
Less current maturities (1,500) -
13,375$ -$
Annual maturities of long-term debt for each of the next five years and thereafter are as follows (in thousands):
Amount
2017 1,500$ 2018 1,500 2019 1,500 2020 1,500
2021 1,500 Thereafter 7,375
14,875$
The Company and its subsidiaries entered into a new loan agreement on November 21, 2016, providing for a $15 million term loan and a $10 million revolving credit facility, superseding all prior loan agreements. The revolving credit facility matures on April 30, 2019 and has a sublimit of up to $4 million for letters of credit. The interest rate is the prime rate, or one-month LIBOR plus 1.5%, at the Company’s option. As of December 31, 2016, no amounts were drawn down on the revolving credit facility. The term loan has a 120-month amortization, a 3.5% fixed interest rate, and can be prepaid without penalty at any time. The loans are secured by accounts receivable, deposit accounts and chattel paper, and by two dry-docks. The loan agreement contains restrictions on mergers and liens on the collateral and the capital stock of our subsidiaries. Subject to compliance with financial covenants, the loan agreement does not restrict our ability to pay dividends, repurchase shares of common stock or incur additional indebtedness.

12
6. SHAREHOLDERS’ EQUITY
Special Cash Dividend
The Company paid a $1.00 per share special dividend on its common stock on January 5, 2015 to shareholders of record on December 23, 2014, totaling $5.9 million.
Dividends
The Company initiated a quarterly dividend during the first quarter of 2015. During 2015, quarterly dividends of $0.25 per share were paid on April 14, 2015, June 16, 2015, September 17, 2015 and December 15, 2015. During 2016, quarterly dividends of $0.10 per share were paid on April 12, 2016, June 14, 2016, September 15, 2016 and December 13, 2016. The declaration of future dividends is at the discretion of the Board each quarter, and will depend upon the Company’s financial performance, cash requirements, outlook and other factors deemed relevant by the Board.
Treasury Stock
In August 2010, the Company’s Board of Directors authorized management to repurchase up to $5.0 million of its outstanding common stock. The stock repurchase plan did not obligate management to acquire any particular amount of common stock, did not have an expiration date and could be amended or terminated at any time without prior notice. Pursuant to the plan, in 2010 the Company purchased 38,075 shares at an average price of $7 per share. During March 2011, our board authorized a 10b5-1 stock purchase plan, in an attempt to increase the amount of stock we repurchase pursuant to the share repurchase program. During 2011, we purchased 255,039 shares at an average price of $14 per share. During 2012, we purchased 209,881 shares at an average price of $15 per share. During February 2013, the board approved an increase in the stock repurchase program of $10 million. No shares were purchased under the program in 2013. During 2014, 100,000 shares were purchased at an average price of $32 per share. On December 11, 2014, the board approved an increase in the stock repurchase program of $20 million. During 2015, we purchased 504,143 shares at an average price of $25 per share. During the first quarter of 2016, we purchased 181,075 shares at an average price of $19 per share. During the second quarter of 2016, we purchased 12,955 shares at an average price of $21 per share. During the third quarter of 2016, we purchased 33,948 shares at an average price of $22 per share. During the fourth quarter of 2016, we purchased 17,655 shares at an average price of $22 per share. Since 2010, the Company has repurchased 1,352,711 shares of common stock. As of December 31, 2016, $2.8 million remained available under the stock repurchase program.
Income per Share
The calculation of basic earnings per share excludes any dilutive effect of stock options, while diluted earnings per share includes the dilutive effect of stock options. The number of weighted average shares outstanding for “basic” income per share was 5,174,337, 5,699,897 and 5,950,166 for the years ended December 31, 2016, 2015 and 2014 respectively. For the years ended December 31, 2016 and December 31, 2015 there were no stock options outstanding.
Stockholders’ Rights Plan
During May 2002, we adopted a rights plan, which was amended in May 2012. The rights plan is intended to protect stockholder interests in the event we become the subject of a takeover initiative that our board of directors believes could deny our stockholders the full value of their investment. The adoption of the rights plan was intended as a means to guard against abusive takeover tactics and was not in response to any particular proposal. The plan does not prohibit the board from considering any offer that it considers advantageous to stockholders.

13
Under the plan, we declared and paid a dividend on June 18, 2002 of one right for each share of common stock held by stockholders of record on June 11, 2002. As amended, each right initially entitles our stockholders to purchase one one-thousandth of a share of our preferred stock for $70 per one one-thousandth, subject to adjustment. However, if a person acquires, or commences a tender offer that would result in ownership of, 15 percent or more of our outstanding common stock while the plan remains in place, then, unless we redeem the rights for $0.001 per right, the rights will become exercisable by all rights holders except the acquiring person or group for shares of common stock or of the acquiring person having a market value of twice the purchase price of the rights.
As amended, the rights will expire on May 23, 2022, unless redeemed or exchanged at an earlier date. The rights trade with shares of our common stock and have no impact on the way in which our shares are traded. There are currently no separate certificates evidencing the rights, and there is no market for the rights.
Stock Option Plan
In May 2002, we established the 2002 Stock Plan, which was amended in November 2005 (the “Stock Plan”). The Stock Plan permitted the granting of any or all of the following types of awards: stock options, restricted stock, and various other stock-based awards. All officers and employees of, and any consultants to us or any affiliate were eligible for participation in all awards under the Stock Plan. Awards granted under the Stock Plan had a maximum term of ten years. The maximum number of shares that could be delivered under the 2002 Stock Plan was the sum of (1) 512,044 shares, plus (2) any shares represented by awards granted under a prior plan that were forfeited, expired or were cancelled without delivery of shares. As of December 31, 2016, and December 31, 2015 no awards remained outstanding under the Stock Plan. The Company does not intend to issue any additional awards under the Stock Plan.
The Company has not granted options since 2004 and as of December 31, 2016 has no outstanding options.
7. EMPLOYEE BENEFITS
We have a 401(k) plan that covers all employees who meet certain eligibility requirements. Contributions to the plan by us are made at the discretion of the Board of Directors. Contribution expense was $255,000, $232,000 and $217,000 for the years ended December 31, 2016, 2015 and 2014, respectively.
8. INCOME TAXES
We have provided for Federal and State income taxes as follows (in thousands):
2016 2015 2014
Current (benefit) provision 1,920$ (3,490)$ 8,167$ Deferred (benefit) provision (2,675) (813) 490
Total (755)$ (4,303)$ 8,657$
State income taxes included above are not significant for the years presented. The total 2015 research and development tax credit of $5.9 million is comprised of an estimate for 2015 of approximately $3.5 million and a credit for 2012 and 2013 for approximately $2.4 million. In 2014, we recorded a research and development tax credit of $2.1 million related to 2014 and 2011. We do not expect to record any additional research and development tax credits for periods prior to 2015 and in 2016.

14
The provision for income taxes varied from the Federal statutory income tax rate due to the following (in thousands):
Amount % Amount % Amount %
Taxes at Federal statutory rate (833)$ 34.0 2,147$ 34.0 10,821$ 34.4 Special Deductions and Credits - - (872) (13.8) (1,065) (3.4) Research & Development Tax Credit - - (5,890) (93.3) (2,085) (6.6) Non-deductible other expenses, net - - of non-reportable income 88 (3.6) 55 0.9 (124) (0.4) State income taxes (10) 0.4 257 4.1 1,110 3.5
Total (755)$ 30.8 (4,303)$ (68.1) 8,657$ 27.5
2016 2015 2014
Deferred income taxes represent the net effects of temporary differences between the carrying amounts of assets and liabilities for financial reporting purposes and their tax bases. The tax effects of significant items comprising our net deferred tax balances at December 31, 2016 and 2015 are as follows (in thousands):
2016 2015Deferred tax liabilities: Differences between book and tax basis of property, plant and equipment 9,413$ 9,608$ Capitalized Intangibles (5) (10)
9,408 9,598
Deferred tax assets (included in other current assets): Contracts in progress (2,057) (587) Accrued expenses not currently deductible (2,940) (1,925)
(4,997) (2,512)
Net deferred tax liabilities 4,411$ 7,086$
9. SALES TO MAJOR CUSTOMERS
Sales to various customers that amounted to 10 percent or more of our total revenues for the three years ended December 31, 2016, 2015 and 2014 are summarized as follows (in thousands):
2016 2015 2014Amount % Amount % Amount %
Customer A 46,762 28% 51,936 20% 37,255 12%Customer B 41,498 25% 7,011 3% 33,000 11%Customer C 9,306 6% 27,907 11% - 0%Customer D 5,929 4% 27,567 10% 9,066 3%

15
10. RELATED PARTY TRANSACTIONS
We purchase in the ordinary course of business certain components from Johnny’s Propeller Shop, Inc. (“JPS”), a company wholly owned indirectly by John P. Conrad, Jr., Chairman of the Board of Directors, President and Chief Executive Officer and members of his immediate family. Total purchases for the three years ended December 31, 2016, 2015, and 2014 were $2,314,000, $4,235,000, and $5,238,000, respectively. We were also leasing a building from JPS for the six months beginning November 1, 2013 for $3,750 a month. In April 2014, we completed the acquisition of the property and buildings of JPS located within our Morgan City shipyard for $1.3 million, and, accordingly, terminated our lease of a portion of the property. We entered into an occupancy agreement with JPS that permitted JPS to remain until October 30, 2014 on the portion of the premises not occupied by us, provided that JPS paid the required utilities, maintenance, repairs and insurance during its occupancy. In addition, John P. Conrad Jr.’s son purchased an ownership interest in Power Panels, LLC (“PP”), from which we purchased electrical components totaling $384,000 and $338,000 for the year ended December 31, 2016 and 2015, respectively. These transactions were approved by the Independent Directors Committee.
11. SEGMENT AND RELATED INFORMATION
Our President and Chief Executive Officer makes operating decisions and measures performance of our business primarily by viewing our two separate lines of business or products and services, which we consider to be building of new vessels and the repair and conversion of existing vessels.
Accordingly, we classify our business into two segments: (1) vessel construction and (2) repair and conversions. Our vessel construction segment involves the building of a new vessel, often including engineering and design, whereas our repair and conversions segment involves work on an existing vessel. Vessel construction jobs are typically of longer duration and have a much larger material component than repair and conversion jobs. Additionally, vessel construction activities are primarily performed in shore-based buildings and dedicated work areas, whereas repair activities primarily occur on floating drydocks or on the vessel itself while afloat. Our vessel construction activities are almost always performed under fixed-price contracts accounted for under the percentage-of-completion method of accounting, whereas our repair activities are primarily performed under cost-plus-fee arrangements.
Our product offerings in vessel construction have changed over time to meet market demands and currently include large and small deck barges, single and double hull tank barges, lift boats, ferries, push boats, offshore tug boats and offshore support vessels including aluminum crew boats. Our repair work involves maintenance and repair of existing vessels, which is often required as a result of periodic inspections required by the U.S. Coast Guard, the American Bureau of Shipping and other regulatory agencies. Our conversion projects primarily consist of lengthening the midbodies of vessels, modifying vessels to permit their use for a different type of activity and other modifications to increase the capacity or functionality of a vessel. Our aluminum new construction and repair/conversion business is not considered a separate operating segment but rather a part of our vessel construction and repair and conversion products and services. Our Conrad Aluminum yard has been specifically designed to handle aluminum work; however, we can also perform steel new construction and repair at the yard and have also performed aluminum work at other of our yards.
We evaluate the performance of our segments based upon gross profit. Selling, general and administrative expenses, executive compensation expense, interest expense, other income, net and income taxes are not allocated to the segments. Accounting policies are the same as those described in Note 1, “Summary of Significant Accounting Policies”. Intersegment sales and transfers are not significant.

16
Selected information as to our operations by segment is as follows (in thousands):
2016 2015 2014
Revenue Vessel construction 135,721$ 235,118$ 241,717$ Repair and conversions 28,695 28,691 67,292
Total revenue 164,416 263,809 309,009 Cost of revenue
Vessel construction 135,205 219,854 207,315 Repair and conversions 25,688 29,041 61,882
Total cost of revenue 160,893 248,895 269,197
Gross profitVessel construction 516 15,264 34,402 Repair and conversions 3,007 (350) 5,410
Total gross profit 3,523 14,914 39,812 Selling, general and administrative expenses 6,483 7,153 8,558
Income from operations (2,960) 7,761 31,254 Interest expense (44) (82) (11) Other income/(expense), net 555 (1,364) 235
Income before income taxes (2,449) 6,315 31,478 Provision for Income tax (755) (4,303) 8,657
Net income (1,694)$ 10,618$ 22,821$
Year Ended December 31,
Certain other financial information by segment is as follows (in thousands):
2016 2015 2014
Depreciation and amortization expense: Vessel construction 4,809$ 3,820$ 3,196$ Repair and conversions 2,046 2,219 2,170 Included in selling, general and administrative expenses 219 222 310
Total depreciation and amortization expense 7,074$ 6,261$ 5,676$
Years Ended December 31,

17
Total assets and capital expenditures by segment are as follows (in thousands):
2016 2015 2014
Total assets: Vessel construction 103,445$ 73,307$ 68,847$ Repair and conversions 33,651 34,691 43,699 Other 27,437 58,956 78,341
Total assets 164,533$ 166,954$ 190,887$
Capital expenditures: Vessel construction 6,902$ 17,281$ 8,731$ Repair and conversions 41 171 886 Other (89) 28 254
Total capital expenditures 6,854$ 17,480$ 9,871$
Years Ended December 31,
Certain assets, including cash and cash equivalents, and capital expenditures are allocated to corporate and are included in the “Other” caption.
Revenues included in our consolidated financial statements are derived exclusively from customers domiciled in the United States and Puerto Rico. All of our assets are located in the United States.
12. COMMITMENTS AND CONTINGENCIES
Legal Matters—We are a party to various routine legal proceedings primarily involving commercial claims and workers’ compensation claims. While the outcome of these routine claims and legal proceedings cannot be predicted with certainty, management believes that the outcome of such proceedings in the aggregate, even if determined adversely, would not have a material adverse effect on our consolidated financial position, results of operation or liquidity.
Employment Agreements— We have employment agreements with certain of our executive officers which provide for employment of the officers through May 31, 2017, and which provide for extensions at the end of the term, subject to the parties’ mutual agreement. As of December 31, 2016, the minimum annual total compensation under these agreements was $950,000.
In May 2014, the Company adopted a long-term incentive compensation program for certain key employees who are not directors, under which a maximum of approximately $3 million in aggregate may be paid by the Company during a three-year period. These costs are accrued and expensed monthly over the vesting periods of the individual awards and are approximately $93,000 per month until December 31, 2015 and $30,000 per month thereafter until April 30, 2017. Mr. Frickey retired from the Company effective January 1, 2016. Pursuant to the Company’s long-term incentive plan, the Independent Directors Committee determined to waive the remaining vesting period of Mr. Frickey’s $1.47 million award, which the Company paid at his retirement.

18
In May 2015, awards were made under the Company’s long-term incentive plan to other key employees, under which a maximum of approximately $2.3 million in aggregate may be paid by the company during a five year period. These costs are accrued and expensed monthly over the vesting periods of the individual awards and are approximately $40,000 per month until May 12, 2019 and $32,000 per month thereafter until May 12, 2020.
Letters of Credit and Bonds— In the normal course of our business, we may be required to provide letters of credit to secure the payment of workers’ compensation obligations. Additionally, under certain contracts we may be required to provide letters of credit and bonds to secure our performance and payment obligations. Bonds relating to these business activities amounted to $63.5 million and $51.3 million at December 31, 2016 and 2015, respectively. We have letters of credit in the amount of $0 and $800,000 at December 31, 2016 and 2015, respectively.
BP Claim – In December 2012 and February 2013, the Company submitted Business Economic Loss claims totaling $22.6 million to the BP Settlement Fund in accordance with the Deepwater Horizon Court-Supervised Settlement Program. Certain of our businesses are located within the economic zones included in the class settlement, and we believe that the damage calculations have been made in accordance with the guidelines established for the BP Settlement Fund; however, the amounts awarded to us may be less than the amounts we submitted and some or all of our claims may be rejected. Conrad’s claims have been under formal review by the BP Claims Administrator. Since June 2013, these claims have been in moratoria review, which is an a secondary review of the claims for certain types of industries (including shipyards) in order to ensure that the losses are related to the BP oil spill and not the federal government’s moratorium on offshore drilling that followed the BP oil spill, as moratoria losses are not recoverable under the settlement program.
There has been a significant delay in the claim review process because BP and class counsel were unable to agree on the criteria to be used to evaluate whether claims are moratoria related. We received a request from the accounting firm which is assisting the BP Claim Administrator for additional information on Conrad Aluminum, LLC’s customer list, revenue, project descriptions, and other information in order for there to be a further evaluation as to whether the claim of Conrad Aluminum, LLC was moratoria related. We provided the requested information and we believe that the documentation provided further establishes that the claim of Conrad Aluminum, LLC is not related to the moratorium. No additional documentation was requested for the other Conrad claimants. The moratoria review related to the Conrad claimants has prolonged the claim review process. As of the date of this report, due to the lack of an agreement between BP and class counsel to establish the criteria for moratoria review, claimants who are subject to moratoria review, such as the Conrad claimants, are not able to establish that their claims are not moratoria related and that they should be placed back into the claim review process, or how to apportion the non-moratoria related and moratoria related parts of a claim. At this point, the Claims Administrator has no agreed-upon criteria pursuant to which it can evaluate such claims to determine if there is any relationship to the moratorium and if so how to apportion the claim between the part related to the moratorium and the part not related to the moratorium. Conrad, along with other similarly situated claimants in moratoria review, are evaluating their options moving forward. We cannot predict the timing of the resolution of this matter or whether Conrad will ultimately receive any award, although the continuing resistance of BP to a reasonable resolution or settlement of the claims in moratoria review leads to significant uncertainty regarding whether we will recover any material amount from the settlement program. Any award we receive will be subject to income taxes. No amounts related to the claims have been recorded in our financial statements at December 31, 2016 or December 31, 2015. Construction Contract – In April 2015, the Company signed a contract for the construction of a panel line building at our Deepwater South location. The contract, including change orders, totals to $5.5 million. At December 31, 2015, the Company owed a remaining balance of $702,000. The construction was completed in the third quarter of 2016.
MARAD – In April 2016, the Company received a grant from the U. S. Maritime Administration to purchase equipment for our Conrad Orange Shipyard. This grant is a portion of a $5 million appropriation by Congress

19
for capital improvements and for maritime training programs at small shipyards. The grant funds must be spent in 2 years or less, and the Company must adhere to various recordkeeping and filing requirements. The Company must maintain title to the purchased equipment for a minimum of 2 years, and “Buy American” as much as practical. The total cost of the project is $1.2 million of which the Federal share for reimbursement is $605,000 and the “required portion” by the Company is $605,000. The Company must expend the required portion before any portion of the Federal share is distributed. At December 31, 2016 we have expended $718,000. The Company has elected to receive reimbursement at the completion of the project; therefore $113,000 is included in “Other Receivables” at December 31, 2016.

Conrad Industries, Inc. OTC PINK BASIC DISCLOSURE GUIDELINES

Conrad Industries, Inc. 2016 Annual Report
OTC Pink Basic Disclosure Guidelines
1) Name of the issuer and its predecessors (if any) Conrad Industries, Inc. 2) Address of the issuer’s principal executive offices Company Headquarters 1100 Brashear Avenue, Suite 200 Morgan City, Louisiana 70380 Phone: 985-702-0195 Website: http://www.conradindustries.com/ IR Contact Cecil A. Hernandez 1100 Brashear Avenue, Suite 200 Morgan City, Louisiana 70380 Email: [email protected] Website: http://www.conradindustries.com/about/investor-information/ 3) Security Information Trading Symbol: CNRD Exact title and class of securities outstanding: Common Stock CUSIP: 208305102 Par or Stated Value $0.01 Total shares authorized: 20,000,000 as of December 31, 2016 Total shares outstanding: 5,112,511 as of December 31, 2016
Additional class of securities: Trading Symbol: No trading symbol Exact title and class of securities outstanding: Preferred Stock CUSIP: No CUSIP number Par or Stated Value $0.01 Total shares authorized: 5,000,000 as of December 31, 2016 Total shares outstanding: None as of December 31, 2016
Transfer Agent American Stock Transfer & Trust Company, LLC 6201 15th Avenue Brooklyn, NY 11219 (800) 937-5449 Is the Transfer Agent registered under the Exchange Act?* Yes: No:

List any restrictions on the transfer of security: As of December 31, 2016, there were 5,112,511 shares of our Common Stock outstanding. Approximately 3 million of these shares are freely tradable and not subject to any restrictions on transfer. The remaining shares of our Common Stock that are outstanding are not registered under the Securities Act of 1933 and may only be sold publicly following registration or pursuant to an exemption therefrom. Additionally, our Common Stock is subject to our Shareholders’ Rights Plan, which was adopted in 2002 and amended in 2012 (as amended, the “Plan”). In accordance with the Plan, we declared and paid a dividend on June 22, 2002 of one “right” for each share of Common Stock. Each right entitles our stockholders to purchase one one-thousandth of a share of our preferred stock for $70 per on one-thousandth of a share, subject to adjustment. However, if a person or group of persons (the “Acquiring Person”) acquires 15 percent or more of our outstanding Common Stock or commences a tender offer that would result in the ownership of 15 percent or more of our outstanding Common Stock while the Plan remains in place, then, unless we redeem the rights for $0.001 per right, such rights will become exercisable by all holders, except the Acquiring Person, for shares of Common Stock (or of the Acquiring Person) having a market value of twice the purchase price of the rights. The Plan will expire on May 23, 2022, unless the rights are redeemed or exchanged at an earlier date. The rights trade with shares of our Common Stock and have no impact on the way in which our shares are traded. There is currently no separate certificate evidencing the rights. Describe any trading suspension orders issued by the SEC in the past 12 months. There have been no trading suspension orders issued by the SEC in the past 12 months. List any stock split, stock dividend, recapitalization, merger, acquisition, spin-off, or reorganization either currently anticipated or that occurred within the past 12 months: None. 4) Issuance History List below any events, in chronological order, that resulted in changes in total shares outstanding by the issuer in the past two fiscal years and any interim period. The list shall include all offerings of equity securities, including debt convertible into equity securities, whether private or public, and all shares or any other securities or options to acquire such securities issued for services, describing (1) the securities, (2) the persons or entities to whom such securities were issued and (3) the services provided by such persons or entities. The list shall indicate:
A. The nature of each offering (e.g., Securities Act Rule 504, intrastate, etc.); None
B. Any jurisdictions where the offering was registered or qualified;
None
C. The number of shares offered;
None

D. The number of shares sold; None
E. The price at which the shares were offered, and the amount actually paid to the issuer;
Not applicable.
F. The trading status of the shares; and
Not applicable.
G. Whether the certificates or other documents that evidence the shares contain a legend (1) stating
that the shares have not been registered under the Securities Act and (2) setting forth or referring to the restrictions on transferability and sale of the shares under the Securities Act. Not applicable.
5) Financial Statements See Section II of our Annual Report, the Consolidated Financial Report, which contains audited financial statements for the fiscal years ended December 31, 2016 and December 31, 2015. A copy of Sections I and II of our Annual Report is attached to this Disclosure and such financial statements are incorporated by reference herein. Section II includes the following:
A. An Audit Letter from our independent auditor. B. Consolidated Balance Sheets. C. Consolidated Statements of Operation. D. Consolidated Statements of Shareholders Equity. E. Consolidated Statements of Cash Flow. F. Notes to the Consolidated Financial Statements.
All such financial statements were prepared in accordance with generally accepted accounting principles in the United States by persons with sufficient financial skills. 6) Describe the Issuer’s Business, Products and Services Describe the issuer’s business so a potential investor can clearly understand the company. In answering this item, please include the following:
A. a description of the issuer’s business operations;
Conrad Industries specializes in the construction, repair and conversion of a wide variety of steel and aluminum marine vessels, including barges, tug boats, tow boats, ferries, and lift boats. Through our subsidiaries, we operate five shipyards in Louisiana and Texas that serve a variety of customers and markets. In 2016, 3.2 percent of our total revenue was related to the Gulf of Mexico oil and gas industry, 87.6 percent was related to other commercial markets, and 9.2 percent was government related. For additional information regarding our business operations, please see Section I of our Annual Report – “Business Overview,” beginning on page 5, which is attached to this Disclosure.

B. Date and State (or Jurisdiction) of Incorporation:
The company was incorporated on June 3, 1998, in the State of Delaware. C. the issuer’s primary and secondary SIC Codes;
3730 – Ship and Boat Building and Repairing D. the issuer’s fiscal year end date;
December 31 E. principal products or services, and their markets;
Conrad Industries specializes in the construction, repair and conversion of marine vessels at
its shipyards in Louisiana and Texas. The company serves a variety of markets. For additional information regarding our products and principal markets, please see Section I of our Annual Report – “Business Overview,” beginning on page 5, which is attached to this Disclosure.
7) Describe the Issuer’s Facilities Through our subsidiaries, we own and operate 5 shipyards: one in Morgan City, Louisiana, three in Amelia, Louisiana, and one in Orange, Texas. For a detailed description of our facilities, please see Section I of our Annual Report – “Properties,” beginning on page 18, which is attached to this Disclosure. 8) Officers, Directors, and Control Persons
For detailed information regarding our directors and executive officers, please see Section I of our Annual Report – “Directors and Executive Officers,” beginning on page 30. For more information regarding the beneficial ownership of our Common Stock, including the identify and ownership of control persons, as defined in subsection A of this Item 8, please see Section I of our Annual Report – “Security Ownership of Certain Beneficial Owners and Management and Related Stockholder Matters,” beginning on page 34.
A. Names of Officers, Directors, and Control Persons. In responding to this item, please provide the names of each of the issuer’s executive officers, directors, general partners and control persons (control persons are beneficial owners of more than five percent (5%) of any class of the issuer’s equity securities), as of the date of this information statement.
Executive Officers
1. John P. Conrad, Jr – President, Chief Executive Officer and Chairman of the Board 2. Cecil A. Hernandez – Executive Vice President, Chief Financial Officer and Secretary 3. Scott J. Theriot – Executive Vice President and Chief Operating Officer 4. Daniel T. Conrad – Senior Vice President

Current Directors
1. John P. Conrad, Jr., Chairman 2. Cecil A. Hernandez 3. Michael J. Harris 4. Ogden U. Thomas, Jr. 5. Daniel T. Conrad
Control Persons (as defined above)
John Parker Conrad Family, L.L.C.
The John Parker Conrad Family, L.L.C. is the beneficial owner of 1,043,267 shares, or 20.4%, of our Common Stock. John P. Conrad, Jr. and Katherine C. Court are the sole managers of the John Parker Conrad Family L.L.C.
John P. Conrad, Jr.
Mr. Conrad is the beneficial owner of 2,124,920 shares, or 41.6%, of our Common Stock. This includes the 1,043,267 shares of Common Stock beneficially owned by the John Parker Conrad Family, L.L.C., of which Mr. Conrad and Ms. Court are the sole managers.
Katherine C. Court
Ms. Court is the beneficial owner of 1,043,267 shares, or 20.4%, of our Common Stock. This includes the 1,043,267 shares of Common Stock beneficially owned by the John Parker Conrad Family, L.L.C., of which Mr. Conrad and Ms. Court are the sole managers.
B. Legal/Disciplinary History. Please identify whether any of the foregoing persons have, in the last
five years, been the subject of:
1. A conviction in a criminal proceeding or named as a defendant in a pending criminal proceeding (excluding traffic violations and other minor offenses);
No 2. The entry of an order, judgment, or decree, not subsequently reversed, suspended or vacated,
by a court of competent jurisdiction that permanently or temporarily enjoined, barred, suspended or otherwise limited such person’s involvement in any type of business, securities, commodities, or banking activities;
No
3. A finding or judgment by a court of competent jurisdiction (in a civil action), the Securities
and Exchange Commission, the Commodity Futures Trading Commission, or a state securities regulator of a violation of federal or state securities or commodities law, which finding or judgment has not been reversed, suspended, or vacated; or
No

4. The entry of an order by a self-regulatory organization that permanently or temporarily barred suspended or otherwise limited such person’s involvement in any type of business or securities activities.
No C. Beneficial Shareholders. Provide a list of the name, address and shareholdings or the percentage
of shares owned by all persons beneficially owning more than ten percent (10%) of any class of the issuer’s equity securities. If any of the beneficial shareholders are corporate shareholders, provide the name and address of the person(s) owning or controlling such corporate shareholders and the resident agents of the corporate shareholders.
John Parker Conrad Family, L.L.C.
The John Parker Conrad Family, L.L.C. is the beneficial owner of 1,043,267 shares, or 20.4%, of our Common Stock. John P. Conrad, Jr. and Katherine C. Court are the sole managers of the John Parker Conrad Family L.L.C. Mr. Conrad’s address is 1100 Brashear Avenue, Suite 200, Morgan City, Louisiana, 70380. Ms. Court’s address is 979 Coyote Trl., Round Mountain, Texas, 78663.
John P. Conrad, Jr.
Mr. Conrad is the beneficial owner of 2,124,920 shares, or 41.6%, of our Common Stock. This includes the 1,043,267 shares of Common Stock beneficially owned by the John Parker Conrad Family, L.L.C., of which Mr. Conrad and Ms. Court are the sole managers. Mr. Conrad’s address is 1100 Brashear Avenue, Suite 200, Morgan City, Louisiana, 70380.
Katherine C. Court
Ms. Court is the beneficial owner of 1,043,267 shares, or 20.4%, of our Common Stock. This includes the 1,043,267 shares of Common Stock beneficially owned by the John Parker Conrad Family, L.L.C., of which Mr. Conrad and Ms. Court are the sole managers. Ms. Court’s address is 979 Coyote Trl., Round Mountain, Texas, 78663.
9) Third Party Providers
Please provide the name, address, telephone number, and email address of each of the following outside providers that advise your company on matters relating to operations, business development and disclosure: Legal Counsel Jones Walker, LLP 8555 United Plaza Boulevard Baton Rouge, Louisiana 70809 (225) 248-2000 [email protected]

Accountant or Auditor Darnall, Sikes, Grades & Frederick 2000 Kaliste Saloom Road Lafayette, Louisiana 70508 (337) 232-3312 [email protected] Investor Relations Consultant None Other Advisor: Any other advisor(s) that assisted, advised, prepared or provided information with respect to this disclosure statement. None 10) Issuer Certification The issuer shall include certifications by the chief executive officer and chief financial officer of the issuer (or any other persons with different titles, but having the same responsibilities). The certifications shall follow the format below: I, John P. Conrad, Jr. and Cecil A. Hernandez, certify that:
1. I have reviewed this annual report of Conrad Industries, Inc.; 2. Based on my knowledge, this disclosure statement does not contain any untrue statement of a material fact or omit to state a material fact necessary to make the statements made, in light of the circumstances under which such statements were made, not misleading with respect to the period covered by this disclosure statement; and 3. Based on my knowledge, the financial statements, and other financial information included or incorporated by reference in this disclosure statement, fairly present in all material respects the financial condition, results of operations and cash flows of the issuer as of, and for, the periods presented in this disclosure statement.
March 29, 2017 /s/ John P. Conrad, Jr. John P. Conrad, Jr. Chief Executive Officer
/s/ Cecil A. Hernandez Cecil A. Hernandez Chief Financial Officer