conocophillips test results and data analysis
TRANSCRIPT

ConocoPhillips test results and data analysis
Brian J. Anderson Associate Professor, Chemical Engineering, West Virginia University
Methane Hydrate Advisory Committee Meeting, Thursday, June 06, 2013

• North Slope reservoir‐scale field trial to evaluate CO2/CH4 exchange
• Short‐term test to demonstrate concepts at larger‐than‐lab scale
• Validate exchange mechanism results from laboratory work – Confirm injectivity into naturally occurring methane
hydrates
– Confirm methane release without production of water or sand
– Obtain reaction rate data to facilitate reservoir‐scale modeling
• Demonstrate stable production of natural gas hydrates by depressurization
Overall Iġnik Sikumi Project Goals

• 2008 – 2010 – Select site and gain access – Characterize reservoir
• 2011 – Drill, log, complete and suspend Iġnik Sikumi #1 – Design field test
• 2012 – Re-enter well and perforate – Perform exchange test – Perform depressurization test – P & A well and remediate site – Prepare datasets – Begin data analysis
• 2013 – Data analysis and history matching
Project History

• Data Correction/Reconsolidation in Progress – Outliers/spikes removed – Time stamps for each source corrected – GC data reprocessed – Three DTS data sets obtained
• Un‐normalized and 2 types of normalization
– Created 1 and 5 min time average datasets – Adding corrections for dead volumes/wellbore storage
• Path Forward – Perform material balance of test – Injectivity analysis, using simulation
• Infer hydrate saturation changes
– Production analysis using cell‐to‐cell model • Gas phase composition history match
– Issue final database and report – DOE workshop
July 2012 Status

Capillary-bound water
Clay-bound water
Movable water
39% Φavg
“C” Sand
25% SWavg
41% movable

Tem
per
atu
re
Tem
per
atu
re c
han
ge si
nce
6F
eb2
01
2
Initial Period before any well work Temperature linear with geothermal gradient (~1.79oF/100ft), Temperature change ~0

Injection
Tem
per
atu
re c
han
gesi
nce
6F
eb2
01
2
Days since 6 Feb 2012
100
75
50
25
Rat
e (m
scf/
d)
PerforationInjection started
Injection endedWell shut in
1700
1300
1500
1600
1400
BH
Pre
ssu
re p
sia)

Overall Production – Gas rates, Pressure, and Temperature

Ignik Sikumi #1 Production

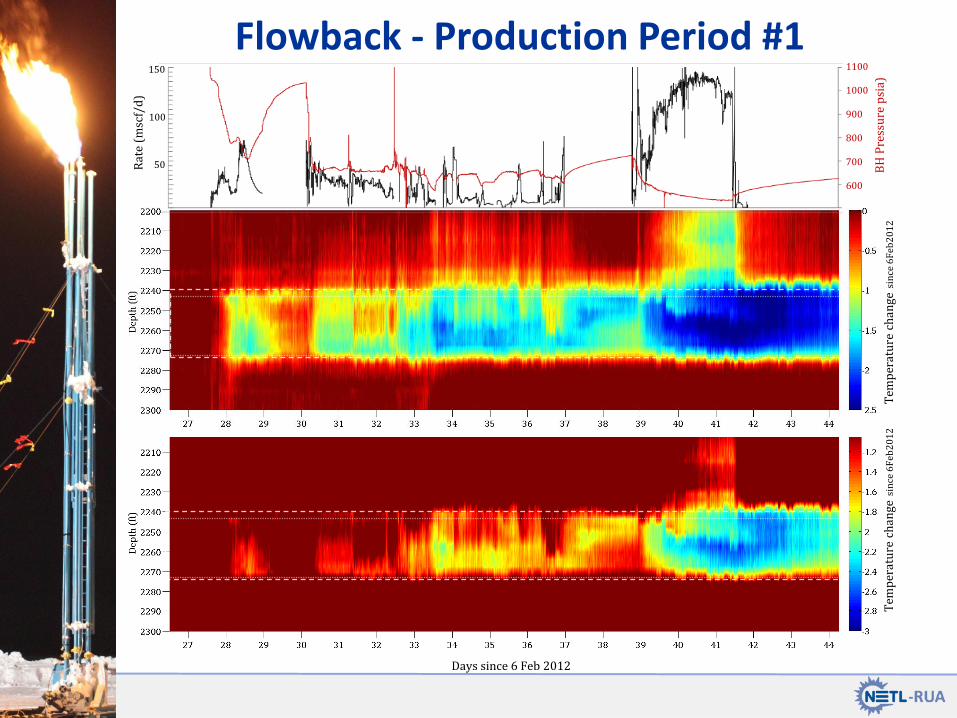
Flowback - Production Period #1
Days since 6 Feb 2012
Tem
per
atu
re c
han
gesi
nce
6F
eb2
01
2
100
50
Rat
e (m
scf/
d)
700
900
1000
800
BH
Pre
ssu
re p
sia)
600
1100150
Well openedUnassisted flow
Well shut-inJet pump installed
Well shut-inReplace sep. valve
Well shut-inFlare line freeze
Well shut-inReplace jet pump
Well shut-inReplace sep. valve

Tem
per
atu
re c
han
gesi
nce
6F
eb2
01
2T
emp
erat
ure
ch
ange
sin
ce 6
Feb
20
12
Days since 6 Feb 2012
50
25
Rat
e (m
scf/
d)
Well openedJet pump #2
Shut-inGlycol injected below jet pump End of production procedure started
800
300
400
600
700
500
BH
Pre
ssu
re p
sia)
Flowback - Production Period #2

Successful injection of CO2 mixture into hydrate reservoir
Methane produced both above / below CH4-stability
pressure CO2 was retained in the reservoir compared with N2
Indicates the possibility of CO2 exchange
Depressurization sustained below CH4-stability pressure Steady increase in production rate Over 850 mscf (24,000 scm) of CH4 produced in total Low BHP achieved (~250 psi)
Solids production significant
Evidence for heterogeneous injection / production
Summary Observations
12

• Diagrams of the operations included – PI&D’s + dead volumes of surface equipment and well
• Master Variable List – Where to go for complete info on any recorded variable
• e.g., what instrument recorded the data, calibration, etc
• Supporting Data Document – Where to go for notes on calculations and data corrections
• Operation Event Log – Where to go to see what was happening at every step of the
test
• All raw data in MySQL and CSV format
• All final data available in MS SQL database format, CSV, Matlab – Clean, 1 min averaged, and 5 min averaged data
Database Summary
13

Data Streams
• Composition
– On-line GC (~15 min sampling int.)
• Continuous downhole conditions
– 3 downhole pressure gauges (P&T)
– Distributed Temperature Sensing (T per ft)
• Continuous surface conditions
– Pump rates
– Flow rates (gas, jet pump fluid)
– Line pressures and temperatures
– Separator P&T
• Produced fluid measurements
– Collected on regular intervals
– Water prod rate
• Tank straps (~30min int.)
– Water (~1hr int.)
• pH, salinity, SG
– Gas (~1hr int.)
• Gas gravity
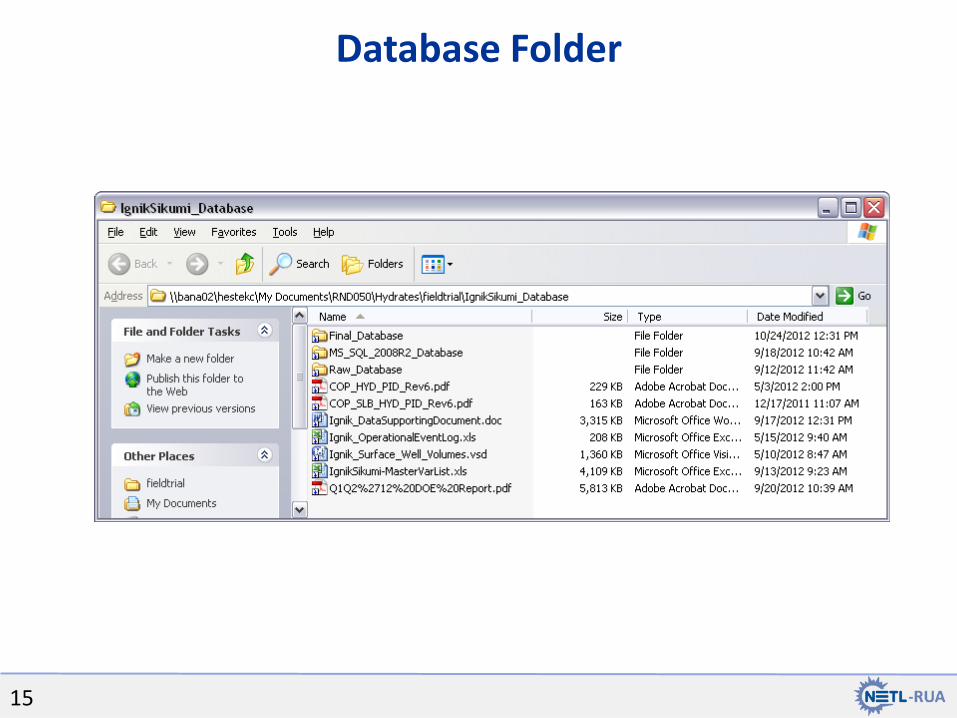
Database Folder
15

• Adiabatic CTC Model (ConocoPhillips)
– Cell Volume (3.5 ft), SH = 65%, Pi = 1000 psi, Ti = 40.5 F
• Solids production
• Heterogeneous production
• History-match simulations of the Iġnik Sikumi field test with newly-developed Mix3HRS software
• Complex pressure, temperature, and composition history
– CO2+N2 injected into a CH4 reservoir with all 3 gases produced
– Competing thermodynamics for hydrate formation and dissociation in the reservoir
Modeling and Simulation Efforts
Hydrate
Saturation

Hall Plot – Varying Permeability
17
Hall Plot
0
1000
2000
3000
4000
5000
0 25 50 75 100 125 150 175 200 225
Cumulative injection (MSCF)
Su
m(d
P*d
t)
Hydrate pilot Gas injection model with k variation
Hall Plot
0
1000
2000
3000
4000
0 25 50 75 100 125 150 175 200
Cumulative injection (MSCF)
Su
m(d
P*d
t)
0.0
1.0
2.0
3.0
4.0
5.0
6.0
7.0
8.0
In-s
itu
pe
rm (
mD
)
Gas Injectivity Estimated in-situ perm
Hall Plot
0
1000
2000
3000
4000
0 25 50 75 100 125 150 175 200
Cumulative injection (MSCF)
Su
m(d
P*d
t)
0.650
0.700
0.750
0.800
0.850
Hy
dra
te s
atu
rati
on
Gas Injectivity Estimated average Sh
A.
B.
Permeability adjusted over time
One possibility is Δ hydrate sat.
Good match obtained
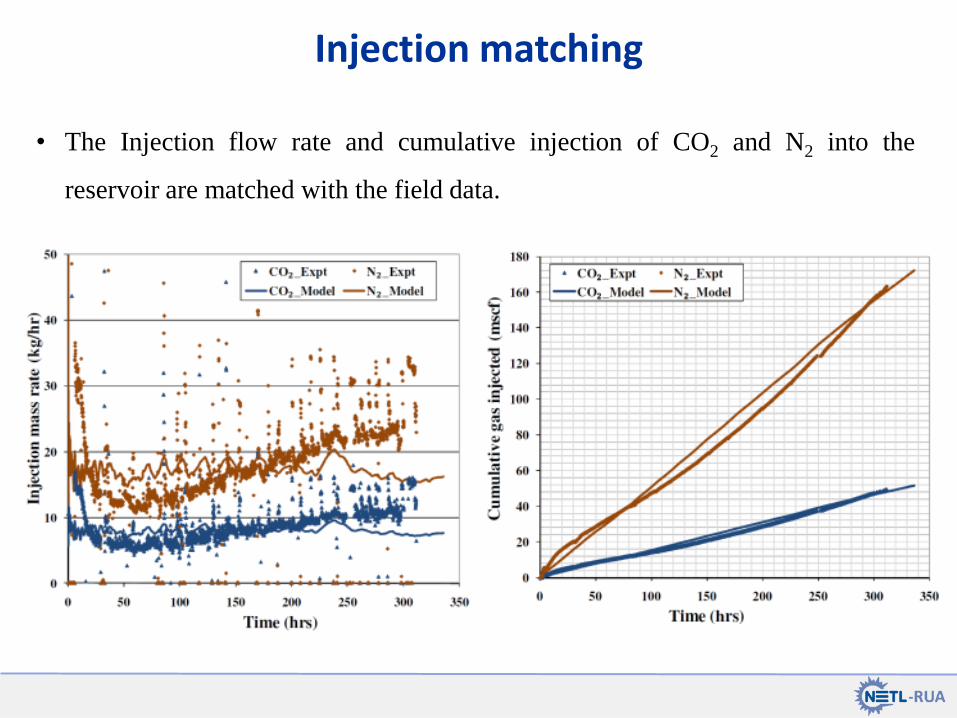
• The Injection flow rate and cumulative injection of CO2 and N2 into the
reservoir are matched with the field data.
Injection matching

Post-Injection Period
Tem
per
atu
re c
han
ge si
nce
6F
eb2
01
2
Days since 6 Feb 2012
BH
Pre
ssu
re p
sia)
1340
1220
1300
1260

Post-Injection Period

Production
0
200
400
600
800
1000
1200
1400
0
200
400
600
800
1000
1200
1400
4-Mar 8-Mar 12-Mar 16-Mar 20-Mar 24-Mar 28-Mar 1-Apr 5-Apr 9-Apr
Cu
mu
lati
ve P
rod
uce
d G
as (m
scf)
an
d W
ate
r (b
bl)
Do
wn
ho
le P
ress
ure
(p
sia)
Unassisted Flowback
4-Mar 14:00 – 6-Mar 00:00
Jet-Pump Flowback #1
7-Mar 04:00 – 13-Mar 23:30
Jet-Pump Flowback #2
15-Mar 18:52 – 18-Mar 10:40
Jet-Pump Flowback #3
23-Mar 06:20 – 11-Apr 00:00
CH4 Hydrate Stability P
(based on downhole T)
0
200
400
600
800
1000
1200
1400
0
200
400
600
800
1000
1200
1400
4-Mar 8-Mar 12-Mar 16-Mar 20-Mar 24-Mar 28-Mar 1-Apr 5-Apr 9-Apr
Cu
mu
lati
ve P
rod
uce
d G
as (m
scf)
an
d W
ate
r (b
bl)
Do
wn
ho
le P
ress
ure
(p
sia)
Unassisted Flowback
4-Mar 14:00 – 6-Mar 00:00
Jet-Pump Flowback #1
7-Mar 04:00 – 13-Mar 23:30
Jet-Pump Flowback #2
15-Mar 18:52 – 18-Mar 10:40
Jet-Pump Flowback #3
23-Mar 06:20 – 11-Apr 00:00
CH4 Hydrate Stability P
(based on downhole T)
First 200 mscf produced above CH4 Hydrate stability conditions
Cumulative Gas
Cumulative
Water

More CH4 produced than Equilibrium Model predicts.
CH4 composition in produced gas
0
20
40
60
80
100
0 100 200 300 400 500 600 700 800 900
Cumulative produced gas (MSCF)
CH
4 c
om
po
sit
ion
Pilot 3.5 ft tank
Model predicts exchange significantly depletes CH4 from the near well region.
Pi = 1000 psia Shi = 65 % Ti = 40.5 F

% Recovered based on Injected Amounts
23
0
10
20
30
40
50
60
70
80
90
100
4-Mar 9-Mar 14-Mar 19-Mar 24-Mar 29-Mar 3-Apr 8-Apr 13-Apr
% R
eco
vere
d
N2
CO2

Observations: Field versus Model
• Not enough CH4 from model • Not enough water from
model • Temperature increase too
high in model • Recovery of N2 to CO2
reversed in model • Examining potential
mechanisms of gas production
1. Dissociation in place w/o permeability enhancement
2. Dissociation in place w/sand migration + permeability enhancement
3. Production of solid hydrate (< 200 μm) and subsequent dissociation in wellbore above the jetpump when contacted with warm power fluid
N2 and CO2 recovery
0
20
40
60
80
100
0 100 200 300 400 500 600 700 800 900
Cumulative produced gas (MSCF)
N2
an
d C
O2
re
co
ve
ry f
ac
tor
N2_recovery CO2_recovery

Sand Production
25
0
10
20
30
40
50
60
70
5-Mar 10-Mar 15-Mar 20-Mar 25-Mar 30-Mar 4-Apr 9-Apr
Esti
mat
ed
San
d P
rod
uct
ion
(bb
l)
Jet-Pump Flowback #1
7-Mar 04:00 – 13-Mar 23:30
Jet-Pump Flowback #2
15-Mar 18:52 – 18-Mar 10:40
Jet-Pump Flowback #3
23-Mar 06:20 – 11-Apr 00:00

From: Kurihara, et al., Proceedings of the 7th International Conference on Gas Hydrates (ICGH 2011), Edinburgh, Scotland,
United Kingdom, July 17-21, 2011
Figure 17 Schemata of reservoir performances through 2007 and 2008 tests inferred from history matching simulation
Mechanism 2 – Experience at Mallik

Mechanism 2
From: Kurihara, et al., Proceedings of the 7th International Conference on Gas Hydrates (ICGH 2011),
Edinburgh, Scotland, United Kingdom, July 17-21, 2011
Figure 11 Concept expressing overall grid block permeability as a function of MH saturation with
growth of high permeability conduits

Mechanism 3: Solid CH4 – Hydrate produced?
CH4 Hydrate - CO2(l)
contact
Local
disassociation of
CH4 Hydrate
Reformation of
mixed CO2-CH4
Hydrate
CH4 Hydrate - CO2(l)
contact
Local
disassociation of
CH4 Hydrate
Reformation of
mixed CO2-CH4
Hydrate CH4 Hydrate - CO2(l)
contact
Local
disassociation of
CH4 Hydrate
Reformation of
mixed CO2-CH4
Hydrate
CH4 Hydrate - CO2(l)
contact
Local
disassociation of
CH4 Hydrate
Reformation of
mixed CO2-CH4
Hydrate
CH4 Hydrate - CO
2(l) contactLocal disassociation of CH
4 Hydrate
Reformation of mixed CO2-CH
4Hydrate
CH4 Hydrate - CO
2(l) contactLocal disassociation of CH
4 Hydrate
Reformation of mixed CO2-CH
4Hydrate
CH4 Hydrate - CO
2(l) contactLocal disassociation of CH
4 Hydrate
Reformation of mixed CO2-CH
4Hydrate
CH4 Hydrate - CO
2(l) contactLocal disassociation of CH
4 Hydrate
Reformation of mixed CO2-CH
4Hydrate
Native State Exchange Depressurization
Well Screen
Largest source of CH4 & water = CH4 Hydrate
Solids (sand) were produced

Mechanism 3: CTC Model Solids Recombination – CH4 Match
CH4 composition in produced gas
0
20
40
60
80
100
0 100 200 300 400 500 600 700 800 900
Cumulative produced gas (MSCF)
CH
4 c
om
po
sit
ion
Field data Hypothesis

Mechanism 3: CTC Model Solids Recombination – Recovery
CO2 and N2 recovery factor
0
20
40
60
80
100
0 100 200 300 400 500 600 700 800 900
Cumulative produced gas (MSCF)
CO
2 a
nd
N2
re
co
ve
ry f
ac
tor
N2 CO2
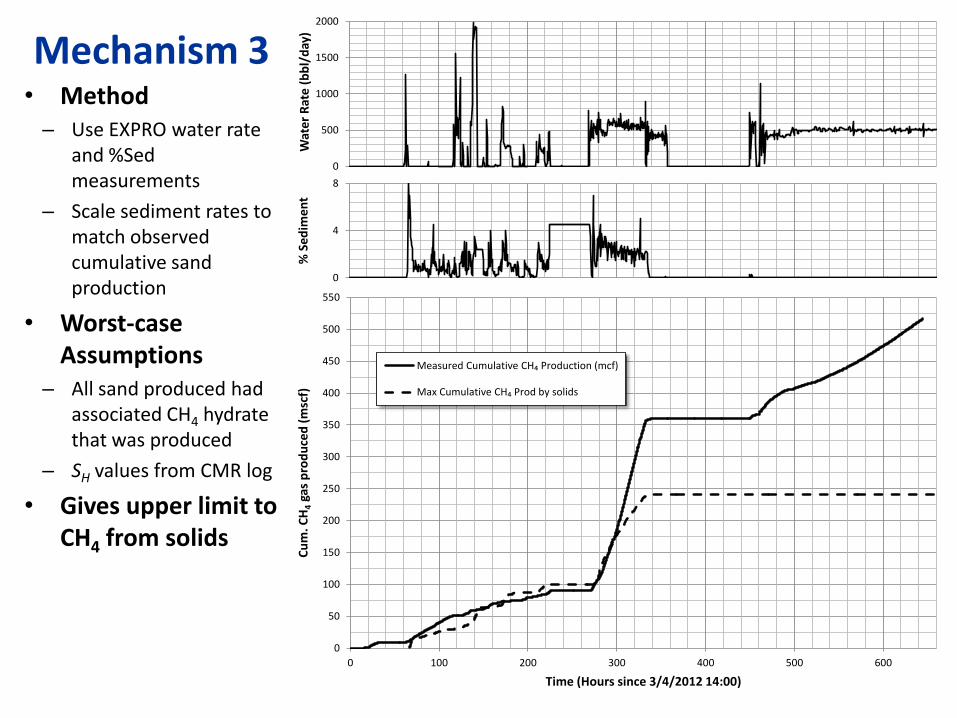
Mechanism 3 • Method
– Use EXPRO water rate and %Sed measurements
– Scale sediment rates to match observed cumulative sand production
• Worst-case Assumptions
– All sand produced had associated CH4 hydrate that was produced
– SH values from CMR log
• Gives upper limit to CH4 from solids
0
50
100
150
200
250
300
350
400
450
500
550
0 100 200 300 400 500 600
Cu
m. C
H4
gas
pro
du
ced
(m
scf)
Time (Hours since 3/4/2012 14:00)
Measured Cumulative CH₄ Production (mcf)
Max Cumulative CH₄ Prod by solids
0
4
8
% S
edim
ent
0
500
1000
1500
2000
Wat
er R
ate
(bb
l/d
ay)
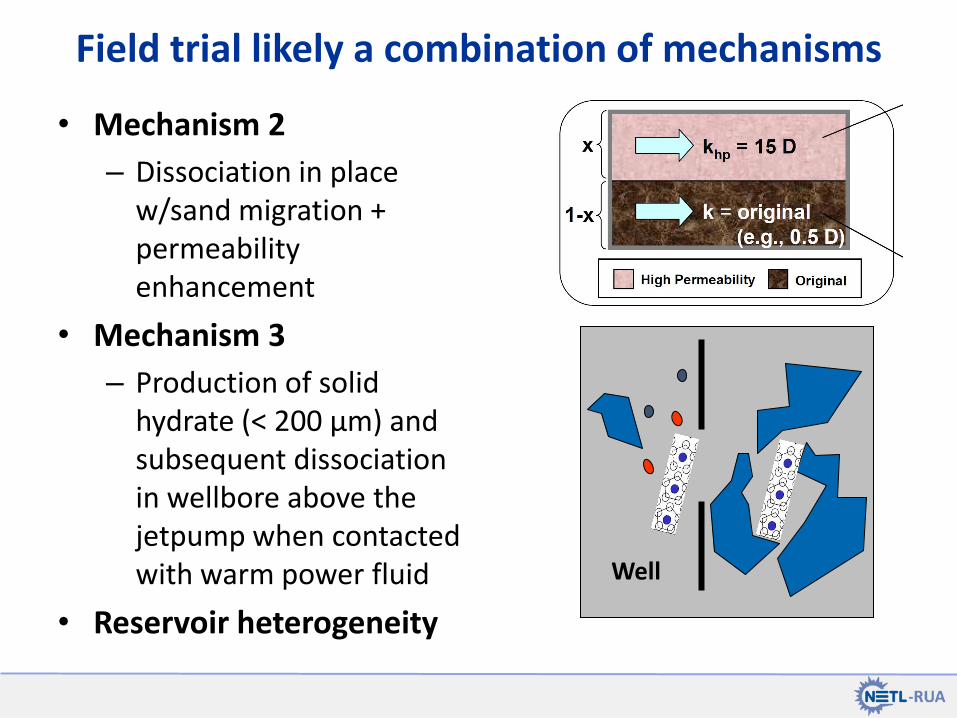
• Mechanism 2
– Dissociation in place w/sand migration + permeability enhancement
• Mechanism 3
– Production of solid hydrate (< 200 μm) and subsequent dissociation in wellbore above the jetpump when contacted with warm power fluid
• Reservoir heterogeneity
Field trial likely a combination of mechanisms
CH4 Hydrate - CO
2(l) contactLocal disassociation of CH
4 Hydrate
Reformation of mixed CO2-CH
4Hydrate
CH4 Hydrate - CO
2(l) contactLocal disassociation of CH
4 Hydrate
Reformation of mixed CO2-CH
4Hydrate
CH4 Hydrate - CO
2(l) contactLocal disassociation of CH
4 Hydrate
Reformation of mixed CO2-CH
4Hydrate
CH4 Hydrate - CO
2(l) contactLocal disassociation of CH
4 Hydrate
Reformation of mixed CO2-CH
4Hydrate
Well

Tracer … Argument for Heterogeneity?
0
10
20
30
40
50
60
70
80
90
4-Mar 9-Mar 14-Mar 19-Mar 24-Mar 29-Mar 3-Apr 8-Apr 13-Apr
% T
race
r R
eco
very
R114
SF6
Jet-Pump Flowback #1
7-Mar 04:00 – 13-Mar 23:30
Jet-Pump Flowback #2
15-Mar 18:52 – 18-Mar 10:40
Jet-Pump Flowback #3
23-Mar 06:20 – 11-Apr 00:00
Unassisted Flowback
4-Mar 14:00 – 6-Mar 00:00

Heterogeneous Injection / Production
SH = High
SH = Low
SF6
SF6 R114 Inject SF6 / R114
SF6
SF6 R114
Produce

Tem
per
atu
re c
han
gesi
nce
6F
eb2
01
2
Days since 6 Feb 2012
100
75
50
25
Rat
e (m
scf/
d)
PerforationInjection started
1700
1300
1500
1600
1400
BH
Pre
ssu
re p
sia)
0.0 0.2 0.4 0.6 0.8 1.0
Saturation (v/v)
CMR Free FluidBound FluidNPORHydrate Saturation
Heterogeneous Injection

Tem
per
atu
re c
han
gesi
nce
6F
eb2
01
2
Days since 6 Feb 2012
Tem
per
atu
re c
han
gesi
nce
6F
eb2
01
2
150
100
50Rat
e (m
scf/
d)
1100
700
900
1000
800
BH
Pre
ssu
re p
sia)
600
Flowback - Production Period #1
0.0 0.5 1.0Hydrate Saturation

Days since 6 Feb 2012
Tem
per
atu
re c
han
ge si
nce
6F
eb2
01
2
2,240
2,245
2,250
2,255
2,260
2,265
2,270
2,275
0 2 4 6 8
de
pth
(ft
)
Temperature (°C)
T(°C) 6.1hrs
T(°C) 18.7hrs
T(°C) 33.6hrs pre-shutin
T(°C) 61.7hrs end-shutin
T(°C) 100hrs end_of_sim
Production Period #1

Production Simulations Production
− Production phase is modeled by maintaining fixed-state boundary as
aqueous phase at the bottom-hole pressure.
− Still attempting to match sand production and each gas rate (with recovery
factors)

• Demonstrated injection of CO2 mixture into water filled hydrate reservoir – Possibly some injection out-of-zone
• Confirmed mixture / CH4-Hydrate Exchange – CH4 produced above CH4-hydrate stability pressure
– Produced CO2 : N2 ratios altered from injectant value
– Injectivity decline consistent w hydrate exchange
• Low BHP are achievable during depressurization – Icing not observed @ 250 psi BHP
• Heterogeneous injection / production observed (DTS)
• Temperature record consistent w hydrate association / dissociation during injection / production cycles
Tentative Conclusions
39

• Datasets and ConocoPhillips project reports can be downloaded from the NETL website.
– http://www.netl.doe.gov/technologies/oil-gas/FutureSupply/MethaneHydrates/rd-program/ANSWell/co2_ch4exchange.html
– google “ignik sikumi” or see the announcement in the latest Fire in the Ice
• Organizing a problem for the Code Comparison Project on the Ignik Sikumi Results
• DOE has previously facilitated creation of Special Volumes in peer-reviewed journals to consolidate reporting
Going Forward

Questions?

Backup Slides – do not print

CPAI - Iġnik Sikumi #1 and PBU L-pad

“E sand:” 31ft hydrate
Sagavanirktok “F Sand:” Ice-filled
Target: Upper C Sand
base permafrost
“D sand:” 49ft hydrate
“C sand:” 67ft hydrate
Iġnik Sikumi #1

Wellbore Construction
Upper Completion
Lower Completion
Tem
per
atu
re c
han
gesi
nce
6F
eb2
01
2
Days since 6 Feb 2012
Tem
per
atu
re c
han
gesi
nce
6F
eb2
01
2
150
100
50Rat
e (m
scf/
d)
1100
700
900
1000
800
BH
Pre
ssu
re p
sia)
600
Flowback - Production Period #1

− Two data files are incorporated into
Teq = f(P,y1,y2) and Peq = f(T,y1,y2)
where T is temperature ( C), P is
pressure (MPa), y1 is CH4 composition
in gas phase and y2 is CO2 composition
in gas phase (yN2 is not independent)
• Two new primary variables for each phase
state and two governing equations are added
for the binary (CO2) and ternary (N2) gases
• Gas-Hydrate (GsH) system was added to
consider the possibility of converting all
available free water to form hydrate with
injected gas
• The phase equilibrium data for a three-component (CH4-CO2-N2) gas hydrate are incorporated
using tri-linear interpolation, where in the code can interpolate data from a table containing
stability pressure, temperature and composition of the hydrate phase
– Based on predictions using our statistical mechanics model that has been validated against
experimental data for 1-, 2-, and 3-component gas mixtures with low error
Prediction of stability pressure for the CH4-CO2 mixed hydrate
system
Ternary Hydrate Modeling