conns 01.31.2021 10-k
TRANSCRIPT

Table of Contents
UNITED STATES SECURITIES AND EXCHANGE COMMISSION
Washington, D.C. 20549
Form 10-K (Mark One)
� ANNUAL REPORT PURSUANT TO SECTION 13 OR 15(d) OF THE SECURITIES EXCHANGE ACT OF 1934 For the fiscal year ended January 31, 2021
or
� TRANSITION REPORT PURSUANT TO SECTION 13 OR 15(d) OF THE SECURITIES EXCHANGE ACT OF 1934
For the transition period from to . Commission File Number 001-34956
CONN’S, INC. (Exact name of registrant as specified in its charter)
Delaware 06-1672840 (State or other jurisdiction of incorporation or organization) (I.R.S. Employer Identification Number)
2445 Technology Forest Blvd., Suite 800, The Woodlands, TX 77381
(Address of principal executive offices) (Zip Code)
Registrant’s telephone number, including area code: (936) 230-5899 Securities registered pursuant to Section 12(b) of the Act:
Title of Each Class Trading Symbol Name of Each Exchange on Which Registered Common Stock, par value $0.01 per share CONN NASDAQ Global Select Market
Securities registered pursuant to Section 12(g) of the Act: None Indicate by check mark if the registrant is a well-known seasoned issuer, as defined in Rule 405 of the Securities Act. Yes No Indicate by check mark if the registrant is not required to file reports pursuant to Section 13 or Section 15(d) of the Act. Yes No Indicate by check mark whether the registrant (1) has filed all reports required to be filed by Section 13 or 15(d) of the Securities Exchange Act of 1934 during the preceding 12 months (or for such shorter period that the registrant was required to file such reports), and (2) has been subject to such filing requirements for the past 90 days. Yes No Indicate by check mark whether the registrant has submitted electronically every Interactive Data File required to be submitted pursuant to Rule 405 of Regulation S-T (§232.405 of this chapter) during the preceding 12 months (or for such shorter period that the registrant was required to submit such files). Yes No Indicate by check mark whether the registrant is a large accelerated filer, an accelerated filer, a non-accelerated filer, or a smaller reporting company. See definitions of “large accelerated filer,” “accelerated filer” and “smaller reporting company” in Rule 12b-2 of the Exchange Act.
Large accelerated filer � Accelerated filer Non-accelerated filer � Smaller reporting company �
Emerging growth company �
If an emerging growth company, indicate by check mark if the registrant has elected not to use the extended transition period for complying with any new or revised financial accounting standards provided pursuant to Section 13(a) of the Exchange Act. ☐ Indicate by check mark whether the registrant has filed a report on and attestation to its management’s assessment of the effectiveness of its internal control over financial reporting under Section 404(b) of the Sarbanes-Oxley Act (15 U.S.C. 7262(b)) by the registered public accounting firm that prepared or issued its audit report. ☒

Table of Contents
Indicate by check mark whether the registrant is a shell company (as defined in Rule 12b-2 of the Act). Yes ☐ No The aggregate market value of the voting and non-voting common equity held by non-affiliates as of July 31, 2020, was $140.4 million based on the closing price of the registrant’s common stock as reported on the NASDAQ Global Select Market on such date. There were 29,314,850 shares of common stock, $0.01 par value per share, outstanding on March 22, 2021.
DOCUMENTS INCORPORATED BY REFERENCE Certain information required to be furnished pursuant to Part III of this Form 10-K is set forth in, and is hereby incorporated by reference herein from, Conn’s definitive proxy statement for its 2021 Annual Meeting of Stockholders, to be filed by Conn’s with the Securities and Exchange Commission (“SEC”) pursuant to Regulation 14A within 120 days after January 31, 2021.

Table of Contents
2
CONN’S INC. AND SUBSIDIARIES
FORM 10-K FOR THE FISCAL YEAR ENDED JANUARY 31, 2021
TABLE OF CONTENTS
Page No. PART I
ITEM 1. BUSINESS 3 ITEM 1A. RISK FACTORS 12 ITEM 1B. UNRESOLVED STAFF COMMENTS 33 ITEM 2. PROPERTIES 33 ITEM 3. LEGAL PROCEEDINGS 33 ITEM 4. MINE SAFETY DISCLOSURES 34
PART II ITEM 5. MARKET FOR REGISTRANT’S COMMON EQUITY, AND RELATED STOCKHOLDER
MATTERS AND ISSUER PURCHASES OF EQUITY SECURITIES 35 ITEM 6. SELECTED FINANCIAL DATA 37 ITEM 7. MANAGEMENT’S DISCUSSION AND ANALYSIS OF FINANCIAL CONDITION AND
RESULTS OF OPERATIONS 39 ITEM 7A. QUANTITATIVE AND QUALITATIVE DISCLOSURES ABOUT MARKET RISK 58 ITEM 8. FINANCIAL STATEMENTS AND SUPPLEMENTARY DATA 59 ITEM 9. CHANGES IN AND DISAGREEMENTS WITH ACCOUNTANTS ON ACCOUNTING AND
FINANCIAL DISCLOSURE 96 ITEM 9A. CONTROLS AND PROCEDURES 96 ITEM 9B. OTHER INFORMATION 99
PART III ITEM 10. DIRECTORS, EXECUTIVE OFFICERS AND CORPORATE GOVERNANCE 99 ITEM 11. EXECUTIVE COMPENSATION 99 ITEM 12. SECURITY OWNERSHIP OF CERTAIN BENEFICIAL OWNERS AND MANAGEMENT
AND RELATED STOCKHOLDER MATTERS 99 ITEM 13. CERTAIN RELATIONSHIPS AND RELATED TRANSACTIONS AND DIRECTOR
INDEPENDENCE 99 ITEM 14. PRINCIPAL ACCOUNTANT FEES AND SERVICES 99
PART IV ITEM 15. EXHIBITS AND FINANCIAL STATEMENT SCHEDULES 100 EXHIBIT INDEX 100 ITEM 16. FORM 10-K SUMMARY 105 SIGNATURES 106
This Annual Report on Form 10-K includes our trademarks such as “Conn’s,” “Conn’s HomePlus,” “YE$ YOU’RE APPROVED,” “YES Money,” “YE$ Money,” “YES Lease,” “YE$ Lease,” and our logos, which are protected under applicable intellectual property laws and are the property of Conn’s, Inc. This report also contains trademarks, service marks, trade names and copyrights of other companies, which are the property of their respective owners. Solely for convenience, trademarks and trade names referred to in this Annual Report may appear without the ® or TM symbols, but such references are not intended to indicate, in any way, that we will not assert, to the fullest extent under applicable law, our rights or the rights of the applicable licensor to these trademarks and trade names.
References to “we,” “our,” “us,” “the Company,” “Conn’s” or “CONN” refer to Conn’s, Inc. and, as apparent from the context, its consolidated bankruptcy-remote variable-interest entities (“VIEs”), and its wholly-owned subsidiaries.

Table of Contents
3
PART I
Forward-Looking Statements
This report contains forward-looking statements within the meaning of the federal securities laws, including but not limited to, the Private Securities Litigation Reform Act of 1995, that involve risks and uncertainties. Such forward-looking statements include information concerning our future financial performance, business strategy, plans, goals and objectives. Statements containing the words “anticipate,” “believe,” “could,” “estimate,” “expect,” “intend,” “may,” “plan,” “project,” “should,” “predict,” “will,” “potential,” or the negative of such terms or other similar expressions are generally forward-looking in nature and not historical facts. Such forward-looking statements are based on our current expectations. We can give no assurance that such statements will prove to be correct, and actual results may differ materially. A wide variety of potential risks, uncertainties, and other factors could materially affect our ability to achieve the results either expressed or implied by our forward-looking statements, including, but not limited to: general economic conditions impacting our customers or potential customers; our ability to execute periodic securitizations of future originated customer loans on favorable terms; our ability to continue existing customer financing programs or to offer new customer financing programs; changes in the delinquency status of our credit portfolio; unfavorable developments in ongoing litigation; increased regulatory oversight; higher than anticipated net charge-offs in the credit portfolio; the success of our planned opening of new stores; expansion of our e-commerce business; technological and market developments and sales trends for our major product offerings; our ability to manage effectively the selection of our major product offerings; our ability to protect against cyber-attacks or data security breaches and to protect the integrity and security of individually identifiable data of our customers and employees; our ability to fund our operations, capital expenditures, debt repayment and expansion from cash flows from operations, borrowings from our Revolving Credit Facility (as defined herein); proceeds from accessing debt or equity markets; the effects of epidemics or pandemics, including the COVID-19 outbreak; the impact of the restatement and correction of the Company’s previously issued financial statements; and other risks detailed in Part I, Item 1A, Risk Factors, of this Annual Report on Form 10-K and other reports filed with the SEC. If one or more of these or other risks or uncertainties materialize (or the consequences of such a development changes), or should our underlying assumptions prove incorrect, actual outcomes may vary materially from those reflected in our forward-looking statements. You are cautioned not to place undue reliance on these forward-looking statements, which speak only as of the date of this report. We disclaim any intention or obligation to update publicly or revise such statements, whether as a result of new information, future events or otherwise, or to provide periodic updates or guidance. All forward-looking statements attributable to us, or to persons acting on our behalf, are expressly qualified in their entirety by these cautionary statements.
ITEM 1. BUSINESS.
Company Overview
Conn’s, Inc., a Delaware corporation, is a holding company with no independent assets or operations other than its investments in its subsidiaries. References to “we,” “our,” “us,” “the Company,” “Conn’s” or “CONN” refer to Conn’s, Inc. and, as apparent from the context, its subsidiaries. Conn’s is a leading specialty retailer that offers a broad selection of quality, branded durable consumer goods and related services in addition to proprietary credit solutions for its core credit-constrained consumers. We operate an integrated and scalable business through our retail stores and website. Our complementary product offerings include furniture and mattresses, home appliances, consumer electronics and home office products from leading global brands across a wide range of price points. Our credit offering provides financing solutions to a large, under-served population of credit-constrained consumers who typically have limited credit alternatives. We provide customers the opportunity to comparison shop across brands with confidence in our competitive prices as well as affordable monthly payment options, next day delivery and installation in the majority of our markets and product repair service. We believe our large, attractively merchandised stores and credit solutions offer a distinctive value proposition compared to other retailers that target our core customer demographic.
Our fiscal year ends on January 31. References to a fiscal year refer to the calendar year in which the fiscal year ends.
Operating Segments
We operate two reportable segments: retail and credit. Information regarding segment performance is included in Part II, Item 7., Management’s Discussion and Analysis of Financial Condition and Results of Operations, and Part II, Item 8. in Note 14, Segment Information, of the Consolidated Financial Statements of this Annual Report on Form 10-K.
Retail Segment. We began as a small plumbing and heating business in 1890 and started selling home appliances to the retail market in 1937 through one store located in Beaumont, Texas. As of January 31, 2021, we operated 146 retail stores located in 15 states. Our stores typically range in size from 25,000 to 50,000 square feet and are predominantly located in areas densely populated by our core customers.
Table of Contents
4
We utilize a merchandising strategy that offers a wide range of quality, branded products across a broad spectrum of price points. This wide selection allows us to offer products and price points that appeal to the majority of our core consumers. Our primary retail product categories include:
• Furniture and mattress, including furniture and related accessories for the living room, dining room and bedroom, as well as both traditional and specialty mattresses. We offer brands such as Corinthian, Catnapper, Serta and Simmons Beautyrest.
• Home appliance, including refrigerators, freezers, washers, dryers, dishwashers and ranges. We offer brands such as Samsung, LG, General Electric, and Frigidaire.
• Consumer electronics, including LED, OLED, QLED, 4K Ultra HD, 8K televisions, gaming products, next generation video game consoles and home theater and portable audio equipment. We offer brands such as Samsung, LG, Sony, Bose and Microsoft Xbox.
• Home office, including computers, printers and accessories. We offer brands such as HP, Apple, and Microsoft.
We strive to ensure that our customers’ shopping experience at Conn’s is equal to, or exceeds, their experience with other providers of durable consumer goods targeting our core customer demographic. We offer a high level of customer service through our commissioned and trained sales force, next day delivery and installation in the majority of our markets and product repair or replacement services for most items sold in our stores. We also sell and offer our services through our website. Flexible payment alternatives offered through our proprietary in-house credit programs and third-party financing alternatives provide our customers the ability to make aspirational purchases. We believe our extensive brand and product selection, competitive pricing, financing alternatives and supporting services, combined with our customer service-focused store, delivery and service associates make us an attractive alternative to appliance and electronics superstores, department stores and other national, regional, local and internet retailers. We believe our attractive credit programs generate strong customer loyalty and repeat business.
Credit Segment. Our in-house consumer credit programs are an integral part of our business and are a major driver of customer loyalty. We believe our in-house credit programs are a significant competitive advantage that we have developed over our 50-plus years in providing credit. We have developed proprietary underwriting models that provide standardized credit decisions, including down payment, limit amounts and credit terms, based on customer risk and income level. We use our proprietary auto-decision algorithms as well as in-depth evaluations of creditworthiness performed by qualified in-house credit underwriters to complete all credit decisions. In order to improve the speed and consistency of underwriting decisions, we continually review our auto-decision algorithms. Additionally, we provide access to alternative financing options to a wider range of consumers through our relationship with third-party payment solution providers. These third parties manage their own respective underwriting decisions and are responsible for their own collections. Our in-house credit programs and access to third-party payment solutions allows us to provide credit to a large and under-served customer base and differentiates us from our competitors that do not offer similar programs.
Our goal is to provide every customer that enters our stores or applies for credit on our website an affordable monthly payment option. Currently, we make the following payment options available to our customers based on a review of their credit worthiness:
• For customers with credit scores that are typically above 650, we offer special no-interest or lower interest option financing programs on select products through a Conn’s branded revolving credit card from Synchrony or we may offer an in-house financing program;
• For customers with credit scores that are typically between 550 and 650, we offer our proprietary in-house financing program, which is a fixed term, fixed payment installment and consumer loan contract; and
• For customers that do not qualify for our credit programs, we offer a lease-to-own payment option through an arrangement with our third-party lease-to-own providers.
We continuously evaluate alternative financing programs that may give us the ability to provide more customers with the ability to purchase the products and services we offer.
Our retail business and credit business operate independently from each other. The retail segment is not involved in credit approval decisions or collections. Decisions to extend consumer credit to our retail customers under our in-house programs are made by our internal credit underwriting department. In addition to underwriting, we manage the collection process of our in-house consumer credit portfolio. Sales financed through our in-house credit programs are secured by the products purchased, which we believe gives us a distinct advantage over other creditors when pursuing collections. Also, the products we sell and finance are typically necessities for the home.

Table of Contents
5
We mitigate credit risk by originating to a substantial number of customers who have purchased from us in the past. These repeat customers have historically exhibited a lower probability of default than new customers. For fiscal year 2021 and 2020, 50% and 49%, respectively, of our originations were to repeat customers who financed a purchase through our in-house credit programs more than five months after financing an initial purchase through our in-house credit programs. As of January 31, 2021 and 2020, 60% and 60%, respectively, of balances due under our in-house credit programs were from repeat customers who have previously financed with us.
Industry and Market Overview
The products we sell are typically considered home necessities, used by our customers in their everyday lives. Many factors influence sales, including consumer confidence, economic conditions, and household formations. We also benefit from the introduction of new products and technologies driving consumers to upgrade existing appliances, electronics and home office products.
As of January 31, 2021, we operated 71 of our 146 stores in Texas. According to the U.S. Department of Commerce’s Bureau of Economic Analysis (the “Bureau of Economic Analysis”), Texas was the second largest state by nominal GDP in 2020. In addition, from calendar year 2015 to 2020, Texas experienced population growth of 6.9% compared to the United States (“U.S.”) population growth of 2.7% over the same period.
Furniture and Mattress. According to the Bureau of Economic Analysis, personal consumption expenditures for household furniture and mattresses were $152.2 billion for calendar year 2020, an increase of 14.5% from $132.9 billion in 2019. The household furniture and mattress market is highly fragmented with sales coming from manufacturer-owned stores, independent dealers, furniture centers, specialty sleep product stores, national and local chains, mass market retailers, department stores, internet retailers, and, to a lesser extent, home improvement centers, decorator showrooms, wholesale clubs and catalog retailers. For fiscal year 2021, we generated 33.2% of total product sales from the sale of furniture and mattresses. The furniture and mattress category generated our highest individual product category gross margin. Given our ability to provide customer financing and next day delivery, we believe that we have strong competitive advantages and significant growth opportunities in this market and expect to continue to grow the balance of sale of our furniture and mattress product category. Product design, innovation and technological advancements have been key drivers of sales in this market.
Home Appliance. According to the Bureau of Economic Analysis, personal consumption expenditures for home appliances were $63.4 billion for calendar year 2020, an increase of 7.8% from $58.8 billion in 2019. Major household appliances, such as refrigerators and washer/dryers, accounted for 83.0% of this total at $52.6 billion in 2020. For fiscal year 2021, we generated 40.2% of total product sales from the sale of home appliances. The retail appliance market is large and concentrated among a few major dealers, with sales coming primarily from home improvement centers, large appliance and electronics superstores, national chains, warehouse clubs, department stores, regional chains, local dealers/single-store operators, manufacturer-direct websites and internet retailers.
Key drivers of sales in the appliance market include product design and innovation, brand and quality. In addition, there was an increase in the demand for appliances during the COVID-19 pandemic as a result of stay at home orders. We carry products with features that include large-capacity, high-efficiency laundry appliances, refrigerator design innovation, technological advancements such as smart home connectivity and variations on these features from leading brands.
Consumer Electronics and Home Office. According to the Bureau of Economic Analysis, electronics spending was $295.6 billion for calendar year 2020, an increase of 13.4% from $260.7 billion for calendar year 2019. Televisions accounted for $35.6 billion of the overall personal consumption expenditures, versus $34.8 billion in the prior year. Personal computers and peripheral equipment accounted for $68.7 billion of the overall expenditures, compared to $57.3 billion in the prior year. For fiscal year 2021, we generated 17.8% of total product sales from the sale of consumer electronics and 6.7% of total product sales from the sale of home office products. The electronics market is highly fragmented with sales coming from large appliance and electronics superstores, national chains, warehouse clubs, regional chains, local dealers/single-store operators, manufacturer-direct websites, manufacturer-direct stores, consumer electronics departments of selected department and discount stores and internet retailers.
Technological advancements and the introduction of new products largely drive demand in the electronics market. Historically, industry growth has been fueled primarily by the introduction of products that incorporate new technologies and advances in existing technologies, including OLED, QLED, 4K Ultra HD, 8K televisions, gaming products, next generation video game consoles, home theater and touch-screen computers. New technologies offer better clarity and quality of video, increased computer processing speed, availability of additional 4K content and other significant advantages.
Consumer Credit. Based on data from the Federal Reserve System, estimated total consumer credit outstanding, which primarily excludes loans secured by real estate, was $4.2 trillion as of December 31, 2020, remaining flat from $4.2 trillion at December 31, 2019. Consumers obtain credit from banks, credit unions, finance companies and non-financial businesses that
Table of Contents
6
offer credit, including retailers. The credit obtained takes many forms, including revolving (e.g., credit cards) and fixed-term (e.g., automobile loans), and at times is secured by the products being purchased.
Competition. Our competitive strength is based on offering financing options, including our proprietary in-house credit programs, to our core credit-constrained customers, enhanced customer service and customer shopping experience through our unique sales force training and product knowledge, next day delivery capabilities, low payment guarantee, and product repair service. Currently, we compete against a diverse group of retailers, including national mass merchants such as Wal-Mart, Target, Sam’s Club, Sears and Costco, specialized national retailers such as Best Buy, Ashley Furniture and Mattress Firm, home improvement stores such as Lowe’s and Home Depot, and locally-owned regional or independent retail specialty stores that sell furniture and mattresses, home appliances, and consumer electronics similar, and often identical, to those items we sell. We also compete with internet retailers such as Amazon, Wayfair and manufacturer-direct websites. In addition, there are few barriers to entry into our current and contemplated markets, and new competitors may enter our current or future markets at any time. Certain of our competitors are beginning to offer third party financing or provide other forms of credit, which compete with our in-house credit programs for credit-constrained consumers. We also compete against companies offering credit-constrained consumers products for the home similar to those offered by us under weekly or monthly lease-to-own payment options. Competitors include Aaron’s and Rent-A-Center, as well as many smaller, independent companies.
Customers
We have a well-defined core consumer base that is comprised of working individuals who typically earn between $25,000 to $60,000 in annual income, live in densely populated and mature neighborhoods, and typically shop at our stores to replace older household goods with newer items. Our product line is comprised of durable home necessities which enables us to appeal to a diverse range of cultural and socioeconomic backgrounds and to operate stores in diverse markets. No single customer accounts for more than 10% of our total revenues and we do not have a significant concentration of sales with any individual customer. Therefore, the loss of any one customer would not have a material impact on our business.
Seasonality
Our business is seasonal which typically means that a higher portion of sales and operating profit are realized during the fourth quarter due primarily to the holiday selling season. In addition, during the first quarter, our portfolio performance benefits from the timing of personal income tax refunds received by our customers, which typically results in higher cash collection rates.
Merchandising
Vendors. We purchase products from a wide range of manufacturers and distributors. Our agreements with these manufacturers and distributors typically cover a one-year time period and are renewable at the option of the parties. Similar to other specialty retailers, we purchase a significant portion of our total inventory from a limited number of vendors. During fiscal year 2021, 76.0% of our total inventory purchases were from six vendors, including 28.9%, 15.4% and 14.0% of our total inventory purchases from Samsung, LG and GE, respectively. The loss of any one or more of these key vendors or our failure to establish and maintain relationships with these and other vendors could have a material adverse effect on our results of operations and financial condition. During the year ended January 31, 2021, the COVID-19 pandemic caused industry-wide shortages of merchandise due to supply chain disruptions that negatively impacted our in-stock position. However, our relationship with our vendors allowed us to maintain a competitive in-stock position.
Merchandise. We focus on providing a selection of quality merchandise at a wide range of price points to appeal to a broad range of potential customers. We primarily sell brand name merchandise with manufacturer’s warranties. Our established relationships with furniture and mattress, home appliance and consumer electronics vendors give us purchasing power that allows us to offer name brand appliances and electronics at prices that are comparable with national retailers and provides us a competitive selling advantage over smaller independent retailers. We are able to purchase furniture inventory in volumes that allow us to import container load quantities that reduce our costs and allow us to offer our products at competitive prices. Additionally, we provide next-day delivery to a majority of our customers, giving us a competitive advantage over smaller furniture retailers in the marketplace today.
Credit Operations
General. We sell our products by offering our customers financing through our proprietary in-house credit programs, the use of third-party financing, and by taking cash or credit card payments. For the fiscal year 2021, approximately 52.1% of purchases were financed through our proprietary in-house credit programs, approximately 28.9% of purchases were financed through the use of third-party financing, and approximately 19.0% of purchases were made with cash or credit card.
Underwriting. Decisions to extend credit to our retail customers are made by our internal credit underwriting department, which is separate and distinct from our other operations, including credit monitoring and collections and retail sales. In addition to auto-decision algorithms, we employ a team of credit underwriting personnel of approximately 50 individuals to make credit granting decisions using our proprietary underwriting process. Our underwriting process considers one or more of

Table of Contents
7
the following elements: credit bureau information; income and address verification; current income and debt levels; a review of the customer’s previous credit history with us; and the particular products being purchased. Our underwriting models determine the finance terms, including down payment, limit amounts and credit terms. During fiscal year 2021, for the credit applications that were approved and utilized, 71.2% were approved automatically. The remaining credit decisions were based on the evaluation of the customer’s creditworthiness by a qualified in-house credit underwriter or required additional documentation from the applicant. For certain credit applicants that may have past credit problems, lack credit history or be potential fraudulent applications, we use stricter underwriting criteria. The additional requirements include verification of employment and recent work history, heightened ID verification and potentially a required down payment. Our underwriting employees are trained and monitored to ensure they follow our methodology in approving credit.
Part of our ability to control delinquency and net charge-off is based on the total approval amount, the finance product offering, i.e. interest free period or down payment amounts, the maximum contract terms we allow and the purchase money security interest that we obtain in the product financed, which reduce our credit risk and increase our customers’ ability and willingness to meet their future obligations. We require the customer to provide proof of property insurance coverage on all purchases financed through our credit offerings to offset potential losses relating to theft or damage of the product financed. We do not require customers to purchase property insurance from us if they have or acquire such insurance from another third-party.
Credit monitoring and collections. Our collection activities involve a combination of efforts that take place primarily in our San Antonio, Texas and Tempe, Arizona, collection centers. As of January 31, 2021, we employed approximately 360 full and part time individual collectors and support personnel who service our active customer credit portfolio. We also utilize collection agencies to service portions of our charged-off portfolio, which provide approximately 200 additional agents. Our in-house, credit-financed sales are secured by the products purchased, which we believe gives us a distinct advantage over other creditors when pursuing collections, especially given that many of the products we finance are generally necessities for the home. We utilize a credit collection strategy that includes telephone calls and messages, internal collectors that contact borrowers, collection letters, e-mails, text messages and third-party legal services that process claims and attend bankruptcy hearings and voluntary repossession. Our employees are trained to follow our methodology in collecting our accounts and charging off any uncollectible accounts based on pre-determined aging criteria, depending on their area of responsibility. All collection personnel are required to complete classroom training, which includes negotiation techniques and credit policy training to ensure customer retention and compliance with debt collection regulations. Post-graduation, the collection trainees undergo skill assessment training, coaching and call monitoring within their respective departments. Our personnel are required to complete regular refresher training and testing.
We closely monitor the credit portfolio to identify delinquent accounts early and dedicate resources to contact customers concerning past due accounts. We believe that our unique underwriting models, secured interest in the products financed, required down payments and credit limits, local presence, ability to work with customers relative to their product and service needs, and our flexible financing alternatives help mitigate the loss experience on our portfolio.
Customers can make payments through our web portal, over the phone, by ACH, third-party bill pay arrangements, by mail to our lock box or in-person at our store locations. During fiscal year 2021, we received 21.1% of the payments on credit accounts in our store locations, which helps us maintain a relationship with the customer that keeps losses lower while encouraging repeat purchases. We may extend or “re-age” a portion of our delinquent customer accounts as a part of our normal collection procedures to protect our investment. Generally, extensions are granted to customers who have experienced a financial difficulty (such as the temporary loss of employment), which is subsequently resolved and when the customer indicates a willingness and ability to resume making monthly payments. These re-ages involve modifying the payment terms to defer a portion of the cash payments currently required of the debtor to help the debtor improve his or her financial condition and eventually be able to pay the account balance. Our re-aging of customer accounts does not change the interest rate or the total principal amount due from the customer and typically does not reduce the monthly contractual payments. We typically charge the customer an extension fee, where permitted, which approximates the interest owed for the time period the contract was past due. Our re-age programs consist of extensions and two payment updates, which include unilateral extensions to customers who make two full payments in three calendar months in certain states. During the second quarter of fiscal year 2021, we changed our re-age policy to increase the number of days required for a customer to qualify for a unilateral re-age. Re-ages are not granted to debtors who demonstrate a lack of intent or ability to service the obligation or have reached our limits for account re-aging. To a much lesser extent, we may provide the customer the ability to re-age their obligation by refinancing the account, which does not change the total principal amount due from the customer but does reduce the monthly contractual payments and extends the term. Under these options the customer must demonstrate a willingness and ability to resume making contractual monthly payments.
We deem an account to be uncollectible and charge it off when the account is more than 209 days past due at the end of a month. Our credit and accounting staff consistently monitor trends in charge-offs by examining the various characteristics of the charge-offs, including by market, product type, customer credit and income information, down payment amounts and other identifying information. We track our charge-offs both gross, before recoveries, and net, after recoveries. We periodically

Table of Contents
8
adjust our credit granting, collection and charge-off policies based on this information. It is to our advantage to manage the portfolio to balance the combined servicing costs and net losses on the credit portfolio with the benefit of repeat retail sales. We may incur higher servicing costs in order to build customer relationships that may result in future retail sales. Collection activity continues after an account is charged off by both internal staff and third-party collection agencies who are typically paid on a contingency basis.
Store Operations
Stores. We operate retail stores in 15 states. The following table summarizes the number of stores in operation at January 31, 2021 in each of our markets:
Geographic Location Number of Locations
Retail Square Feet
Other Square Feet
Alabama 5 195,548 33,830 Arizona 11 384,283 73,936 Colorado 7 243,383 47,623 Florida 1 35,555 11,350 Georgia 1 40,935 8,446 Louisiana 10 407,899 98,227 Mississippi 2 73,780 13,892 Nevada 3 118,511 26,072 New Mexico 4 138,285 23,325 North Carolina 11 419,584 83,889 Oklahoma 4 135,215 27,740 South Carolina 4 140,145 21,516 Tennessee 6 214,116 46,455 Texas 71 2,552,300 405,863 Virginia 6 207,538 43,235
Store totals 146 5,307,077 965,399 Distribution and Service Centers and Cross-dock Facilities (excluding
cross-docks within stores) 21 — 3,613,515 Corporate Offices 5 — 159,073
Total 172 5,307,077 4,737,987
Our stores have an average selling space of approximately 36,000 square feet, plus a storage area for fast-moving and smaller products that customers prefer to carry out rather than wait for in-home delivery. Thirty-three of our retail stores also contain cross-dock facilities.
We continuously evaluate our existing and potential sites to position our stores in desirable locations and relocate stores that are not properly positioned. We typically lease rather than purchase our stores, distribution and service centers and cross-dock facilities to retain the flexibility of managing our financial commitment to a location if we later decide that a store or market is performing below our standards or the market would be better served by a relocation. As of January 31, 2021, we leased almost all of our store, distribution and service center and cross-dock locations.
Personnel and compensation. We staff a typical store with a store manager, an assistant manager, an operations manager, an average of 17 sales personnel and other support staff, including cashiers and porters based on store size and location. Managers have an average tenure with us of approximately five years and typically have prior sales floor experience. In addition to store managers, we have 19 district managers.
We compensate the majority of our sales associates on a straight commission arrangement. Store managers and assistant store managers receive a salary and are eligible for a bonus. We believe that our store compensation plans, which are primarily tied to sales, generally help us attract and motivate employees.
Advertising
We design our marketing programs to increase awareness of our brand, which we expect will create and maintain customer loyalty, increase the number of customers that shop in our stores and on our website and increase sales. We employ a multi-touch point approach utilizing direct mail, television, newspaper, digital, radio and out-of-home targeted advertising. Our
Table of Contents
9
promotional programs include the use of free delivery and free product promotions, in conjunction with product discounts and various no-interest option financing offers.
E-Commerce
We are focused on expanding the capabilities of our website to generate customer traffic for both our digital and physical stores. Our website provides new and existing customers with the ability to purchase substantially all of our product offerings, view prices, apply for credit and make payments on their credit accounts. We update our website regularly to reflect new products, product availability and current promotional offers. Our website is a significant component of our advertising strategy. We believe our website represents a possible source for future sales and growth in our credit collections. We are focused on improving the customer experience by making it easier for customers to apply for and be approved for credit on-line. In late fiscal year 2019, we started to offer certain credit-qualified customers the ability to complete an entire purchase transaction financed online through our proprietary in-house credit programs. Our website averaged approximately 68,000 credit applications per month during fiscal year 2021. This compares to average monthly website applications of approximately 65,000 and 59,000 during fiscal year 2020 and 2019, respectively. In fiscal year 2021, we updated our website to begin accepting personal credit cards, further improving the customer experience by expanding online payment options.
The website is supported by a call center, allowing us to better assist customers with their credit and product needs.
Distribution and Inventory Management
We currently operate 11 regional distribution centers, which are located in Houston, San Antonio, Dallas, El Paso, and McAllen, Texas; Port Allen, Louisiana; Phoenix, Arizona; Denver, Colorado; Charlotte, North Carolina; Nashville, Tennessee; and Lakeland, Florida, one service center located in Houston, Texas, 9 smaller cross-dock facilities and 33 stores with cross-dock facilities. This enables us to deliver products to our customers quickly, reduces inventory requirements at the individual stores and facilitates regional inventory and accounting controls.
In our retail stores, we maintain an inventory of certain fast-moving items and products that the customer is likely to carry out of the store. Our computer system and the use of scanning technology in our distribution centers allow us to determine, on a real-time basis, the location of any product we sell. If we do not have a product at the desired retail store at the time of sale, we can typically provide it through one of our distribution centers on a next day basis.
We primarily use third-party providers to move products from distribution centers to stores and between markets to meet customer needs. We outsource our in-home deliveries to third-party providers and, for most purchases, we offer next day delivery to our customers. These third-party providers use a fleet of home delivery vehicles that enables a highly trained staff of delivery and installation specialists to quickly complete the sales process and provide a high-quality customer experience. We also may receive a delivery fee based on the products sold and the services needed to complete the delivery.
Product Support Services
Next-day delivery and installation. We provide next-day delivery and installation services in most of the markets in which we operate. We believe next-day delivery of our goods is a highly valued service to our customers.
Credit insurance. Acting as licensed agents for third-party insurance companies, we offer property, life, disability and involuntary unemployment credit insurance, which we collectively refer to as credit insurance, at all of our stores on sales financed through our in-house credit programs. These insurance products protect the customer’s purchase by covering their payments on their credit account if covered events occur. Property insurance purchased through us can be canceled at any time with proof of alternative coverage. We receive sales commissions from the third-party insurance companies at the time we sell the coverage, and we may receive retrospective commissions, which are additional commissions paid by the insurance carrier if insurance claims are less than earned premiums.
We require proof of property insurance on all purchases financed through our in-house credit offerings; however, we do not require that customers purchase this insurance from us if they have or acquire such insurance from another third-party provider. Premiums charged on the credit products we sell are regulated and vary by state.
Product repair service. We believe that providing product repair and replacement services is an important differentiation and reinforces customer loyalty. We provide in-home and shop repair services for most of the products we sell and primarily service products purchased from us. Customer repair needs are primarily serviced with an employee-based technician workforce. We believe this staffing model allows us to control the post-sale customer service experience.
Repair service agreements. Customers may purchase repair service agreements that we sell for third-party insurers at the time a product is purchased. These agreements broaden and extend the period of covered manufacturer warranty service for up to four years from the date of purchase, depending on the product, and protect the customer against repair costs. Customers may finance the cost of the agreements along with the purchase price of the associated product.

Table of Contents
10
We have contracts with third-party insurers that issue the initial repair service agreements to cover the costs of repairs performed under these agreements. The initial service agreement is between the customer and the third-party insurance company, and, through our agreements with the third-party insurance company, we provide service when it is needed under each agreement sold. We receive a commission on the sale of the contract and we may receive retrospective commissions, which are additional commissions paid by the insurance carrier over time if the cost of repair claims are less than earned premiums. Additionally, we bill the insurance company for the cost of the service work that we perform.
Human Capital Management
We employ approximately 4,100 full-time employees and 160 part-time employees in the U.S. across 15 states, all of whom are expected to be guided by our values and by an underlying set of ethical principles. Incorporated into our Code of Business Conduct & Ethics, our values and principles define our culture and strengthen our workforce. We strive to demonstrate to our customers, shareholders, business partners, communities and employees that we are worthy of their trust and continually strive to enhance our brand reputation. We invest in employees at all levels who are expected to integrate our values and principles in all that we do.
Our Board of Directors oversees human capital management activities (including assessing the effectiveness of employee programs and advising management with regard to the quality of the workforce to carry out our strategic goals and overall human resource strategies), other committees of the Board of Directors also have responsibilities that impact our human capital management as outlined in their respective charters. Our Human Resources function has management responsibility for advising and assisting the business on human resource matters and executing our overall human capital management strategies.
We are committed to fostering work environments that value diversity and inclusion. A variety of perspectives enriches our culture, leads to innovative solutions for our business and enables us to better meet the needs of a diverse customer base and reflects the communities we serve. Our aim is to develop inclusive leaders and an inclusive culture, while also recruiting, developing, mentoring, training, and retaining a diverse workforce.
We have a Diversity and Inclusion function which is responsible for strategic management and planning for diversity and inclusion within the Company, as well as enhancing our understanding, providing training and development, and partnering with and assisting all of us to be accountable. During the year, our Diversity and Inclusion function drove a number of initiatives to enhance our focus on diversity and inclusion and raise our awareness. We have a number of these and related initiatives disclosed on our website at conns.com/esg.
We strive to engage and retain our employees throughout the employment life-cycle with effective recruiting and onboarding; competitive pay, benefits and other rewards; mandatory and optional programs for professional development and career advancement; compliance training; and a safe, healthy and respectful workplace.
In response to the COVID-19 pandemic, we quickly implemented safety and health standards and protocols for our employees while continuing to offer a safe environment as an essential service to our customers. Many of our employees in our corporate offices have been working from home from time to time since March 2020. Our store locations are provided with personal protective equipment, other equipment and enhanced cleaning supplies, and are required to adhere to appropriate protocols for social distancing, limiting density, reporting and documenting exposures and wearing masks at all times, all as recommended by the Centers for Disease Control or mandated by local regulations.
We maintain an Ethics Hotline that is available to all employees to report (anonymously if desired) any matter of concern. Communications to the hotline are routed to appropriate functions (whether Human Resources, Legal or other departments) for investigation and resolution. In addition, any shareholder or other interested party may send communications to the Board of Directors, either individually or as a group.
Regulation
The extension of credit to consumers is a highly regulated area of our business. Numerous federal and state laws impose disclosure and other requirements and limitations on the origination, servicing and enforcement of retail installment sale accounts and consumer loans as well as our acts and practices in connection with these activities. Applicable federal laws include, but are not limited to, the Truth in Lending Act (“TILA”), the Equal Credit Opportunity Act (“ECOA”), the Fair Credit Reporting Act (“FCRA”), the Fair Debt Collection Practices Act (“FDCPA”), the Telephone Consumer Protection Act (“TCPA”), the Gramm-Leach-Bliley Act (“GLBA”), the Electronic Fund Transfer Act (“EFTA”), the Military Lending Act (“MLA”), the Servicemembers Civil Relief Act (“SCRA”) and the implementing regulations of the foregoing statutes. The Federal Trade Commission (“FTC”) has broad consumer protection enforcement authority under Section 5 of the Federal Trade Commission Act (“FTCA”), which prohibits “unfair or deceptive acts or practices in or affecting commerce.” The FTC also can enforce specific consumer protection statutes, such as the ECOA, FCRA, FDCPA, TCPA, GLBA, EFTA, MLA, SCRA and TILA, and has authority to issue regulations in respect of certain of these.

Table of Contents
11
The Consumer Financial Protection Bureau (“CFPB”) was created in 2010 upon the enactment of the Dodd-Frank Wall Street Reform and Consumer Protection Act (“Dodd-Frank Act”). The CFPB has rulemaking and enforcement authority over nonbanks engaging in offering or providing a consumer financial product or service (such as extending credit and servicing loans) as well as any affiliate of such “covered person” that acts as a “service provider” to such covered person. The federal consumer financial laws over which the CFPB has enforcement and rulemaking authority include TILA, ECOA, FCRA, FDCPA, and GLBA as well as authority under Title X of the Dodd-Frank Act to prohibit “unfair, deceptive or abusive acts or practices” (“UDAAP”) in connection with consumer financial products and services. The scope of UDAAP is broad and often uncertain, but the CFPB has been active in enforcing UDAAP claims. The CFPB has broad power to impose civil monetary penalties, restitution, and other corrective action under the various laws described above and, for this reason, poses a significant regulatory risk to the origination, servicing, and collection of our retail installment contracts and consumer loans.
In addition to its rulemaking and enforcement authority described in the preceding paragraph, the CFPB also has supervisory and examination authority over mortgage lending, payday lending, and private student lending, as well as “larger participants” in other markets for consumer financial products or services (including debt collection), and any covered person if the CFPB has “reasonable cause to determine” that such covered person is engaging, or has engaged, in conduct that poses risks to consumers with regard to the offering or provision of consumer financial products or services, whether based on consumer complaints or “information from other sources.” Although we are not automatically subject to CFPB supervisory or examination authority based on the foregoing categories, the CFPB has authority to investigate and take enforcement action against us with respect to any alleged violation by us of a federal consumer financial law over which the CFPB has jurisdiction, including the prohibition on UDAAP. The mere receipt by us of a “civil investigative demand” from the CFPB requiring production of documents, written responses, reports or oral testimony could result in required public disclosure, adverse publicity, and substantial cost to us regardless of the outcome. The CFPB may become more active in its investigations and enforcement due to changes in the political landscape.
Regulatory rulemaking by the CFPB could adversely affect origination, servicing, and collection of our retail installment sale and consumer loan products by making it more difficult and costly for us to offer, service or collect these products. In addition, CFPB rulemaking could make it possible, or easier for our customers to bring class action claims against us, or prohibit or limit the use of arbitration clauses and class action waivers, both of which we include in our installment contracts and loan agreements.
In Texas, Oklahoma, Louisiana and Tennessee, Conn Credit Corporation, Inc., an affiliate of Conn Appliances, Inc., offers a consumer loan product to our customers. In conjunction with our direct loan program, Conn Credit Corporation, Inc., Conn Appliances, Inc., and Conn Credit I, LP, each hold consumer lender licenses as required by their respective state laws. For customers of most stores located outside of Texas, Oklahoma, Louisiana, and Tennessee, Conn Appliances, Inc. offers a retail installment sale contract.
State laws impose disclosure and other requirements and limitations on retail installment sale contracts and consumer loan agreements and impose maximum amounts of finance charges and interest, as well as regulation of other fees and charges, together with restrictions on credit terms, collection and enforcement and other aspects of extending and collecting consumer credit. State consumer finance laws vary from state to state. The originating and servicing of consumer loans typically requires state licensing which entails heightened supervision, examination, and other requirements which may not be applicable to retail sellers extending credit under retail installment sale contracts. Pursuant to the Dodd-Frank Act, state attorneys general and designated state consumer finance regulatory agencies may enforce specified federal consumer finance laws and impose penalties and remedies for their violation. We routinely review our contracts and procedures to ensure compliance with applicable consumer credit laws. Failure on our part to comply with applicable laws could expose us to consumer litigation and government enforcement action, possibly resulting in substantial penalties and claims for damages and, in certain circumstances, may subject us to injunctions, require us to refund finance charges already paid, forgo finance charges not yet paid under credit accounts, change our credit extension, servicing, collection, and marketing practices or a combination of the foregoing. We believe that we are in substantial compliance with all applicable federal and state consumer credit and collection laws.
Our sale of credit insurance products, insured by an unaffiliated third-party insurance provider, that include property, life, disability and involuntary unemployment credit insurance is also highly regulated. These products are only offered with a retail installment sales or loan contract agreement purchase. State laws currently impose disclosure obligations and other restrictions with respect to our sales of these products, impose limitations on the amount of premiums that we may charge and require licensing of certain of our employees and operating entities. State laws with respect to these products vary from state to state. Failure to comply with these laws could expose us to consumer litigation and government enforcement action, possibly resulting in substantial penalties and claims for damages, and in certain circumstances, may subject us to injunctions or require us to refund premiums or change our policies and procedures with respect to these products and the marketing of these products or a combination of the foregoing. We believe that we are in substantial compliance with all applicable federal and state consumer credit and collection laws.

Table of Contents
12
In conjunction with the sale of merchandise, we offer our customers the opportunity to purchase repair service agreements on specified products. These contracts are entered into between the customer and an unaffiliated third-party service provider. The contracts enable the customer to obtain repair and/or replacement of certain eligible products in the event of specified failures as described in the terms and conditions of the contract. The service provider, which is financially and legally obligated to perform under these contracts, has entered into a contract with our affiliate to administer the contracts. We post descriptions of these contracts and links to the contract terms on our website. Service contracts require payment of a segregated fee which may be paid by cash, check or financed by customers entering into retail installment sale contracts with Conn Appliances, Inc. or loan agreements with Conn Credit Corporation, Inc. The federal Magnusson-Moss Warranty Act governs written warranties and service contracts. For service contracts entered into with Texas customers, state law requires registration of the service provider and Conn Appliances, Inc. as an administrator, a reimbursement insurance policy and other requirements on the service provider, responsibilities on service contract sellers, record-keeping requirements, restrictions on the sale or marketing of service contracts, required contract terms and disclosures, and cancellation requirements, among other requirements and prohibitions. Other states vary in their regulation of these contracts. Violation of these laws can result in injunctive relief, civil penalties, and/or other remedies. We believe that we are in substantial compliance with all applicable federal and state consumer credit and collection laws.
Tradenames and Trademarks
We have registered the trademarks “Conn’s,” “Conn’s HomePlus,” “YE$ YOU’RE APPROVED,” “YES Money,” “YE$ Money,” “YES Lease,” “YE$ Lease,” and our logos, which are protected under applicable intellectual property laws and are the property of Conn’s, Inc. Our trademark registrations generally last for ten-year periods and are renewed prior to expiration for additional ten-year periods.
Available Information
We are subject to reporting requirements of the Securities and Exchange Act of 1934, as amended (“Exchange Act”), and the rules and regulations promulgated thereunder. The Exchange Act requires us to file reports, proxy and other information statements and other information with the SEC. You may also obtain these materials electronically by accessing the SEC’s website at www.sec.gov.
The Board of Directors of the Company (“Board of Directors”) has adopted a code of business conduct and ethics for our employees, code of ethics for our Chief Executive Officer and senior financial professionals and a code of business conduct and ethics for our Board of Directors. A copy of these codes are published on our website at www.conns.com under “Investor Relations — Corporate Governance.” We intend to make all required disclosures concerning any amendments to, or waivers from, these codes on our website. In addition, we make available, free of charge on our website, our Annual Report on Form 10-K, Quarterly Reports on Form 10-Q, Current Reports on Form 8-K and amendments to these reports filed or furnished pursuant to Section 13(a) or 15(d) of the Exchange Act as soon as reasonably practicable after we electronically file this material with, or furnish it to, the SEC. You may review these documents, under the heading “Investor Relations — SEC Filings,” by accessing our website at www.conns.com.
We make available on our website at www.conns.com under “Investor Relations — Asset Backed Securities” updated monthly reports to the holders of our asset-backed notes. This information reflects the performance of the securitized portfolio only, in contrast to the financial statements contained herein, which reflect the performance of all of the Company’s outstanding receivables, including those originated subsequent to those included in the securitized portfolio.
Our website and the information contained on our website is not incorporated in this Annual Report on Form 10-K or any other document filed with the SEC.
ITEM 1A. RISK FACTORS.
You should consider carefully the risks described below and other information presented in this Form 10-K, including Item 7. Management’s Discussion and Analysis of Financial Condition and Results of Operations and the consolidated financial statements and related notes included in this Form 10-K, as well as information provided in other reports, registration statements and materials that we file with the SEC and the other information incorporated by reference in this Form 10-K. If any of the risks described below or elsewhere in this Form 10-K were to materialize, our business, financial condition, results of operations, cash flows or prospects could be materially adversely affected. In such case, the trading price of our common stock could decline and you could lose part or all of your investment. Additional risks and uncertainties not currently known to us or that we currently deem immaterial may also adversely affect our business, financial condition, results of operations, cash flows, prospects or stock price, which we refer to collectively as a material adverse effect on us (or comparable phrases).
Summary Risk Factors
Risks Related to Our Business

Table of Contents
13
• The COVID-19 outbreak in the United States may continue to cause, and other pandemics, epidemics or outbreaks may cause, effects which materially and adversely affect our business, results of operations and financial condition.
• An economic downturn, outbreaks, including the COVID-19 outbreak, or other events may affect consumer purchases from us as well as their ability to repay their credit obligations to us, which could result in a material adverse effect on us.
• We may not be able to open or profitably operate new stores in existing, adjacent or new geographic markets.
• We have plans for significant future capital needs and the inability to access our Revolving Credit Facility or the capital markets on favorable terms or at all may have a material adverse effect on us.
• Our existing and future levels of indebtedness could adversely affect our financial health, ability to obtain financing in the future, ability to react to changes in our business and ability to fulfill our obligations under such indebtedness.
• Our debt securities may receive ratings that may increase our borrowing costs.
• We might not be able to access the securitization market for capital from time to time in the future, which may require us to seek alternative and more costly sources of financing.
• One of our operating subsidiaries may be required to repurchase certain finance receivables if representations and warranties about the quality and nature of such receivables are breached, which may negatively impact our results of operations, financial condition, and liquidity.
• A decrease in our credit sales, a decline in credit quality of our customers or other factors outside of our control could lead to a decrease in our product sales and profitability.
• Covenants in our debt agreements impose various operating and financial restrictions on us, and if we are not able to comply with such covenants, our lenders could accelerate our indebtedness, proceed against certain collateral we have provided or exercise other remedies, which could have a material adverse effect on us.
• Deterioration in the performance of our customer receivables portfolio could materially adversely affect our liquidity position and profitability.
• In deciding whether to extend credit to customers, we rely on the accuracy and completeness of information furnished to us by or on behalf of our credit customers, and we assume certain behavior and attributes on the basis of prior customers. If we and our systems are unable to detect any misrepresentations in this information, or if our assumptions prove inaccurate, it may have a material adverse effect on us.
• Our policy of re-aging certain delinquent borrowers affects our delinquency statistics and the timing and amount of our write-offs, and may lead to higher delinquency statistics in the future, which could have a material adverse effect on our financial results.
• We rely on internal models to manage risk and to provide accounting estimates. We could suffer a material adverse effect if those models do not provide reliable accounting estimates or predictions of future activity.
• We benefit from the collection of customer and non-customer recoveries on our customer accounts receivables. Our inability to continue to collect these recoveries could adversely affect our financial results.
• Our reported results require the judgment of management, and we could be subject to risks associated with these judgments or could be adversely affected by the implementation of new, or changes in the interpretation of existing, accounting principles or financial reporting requirements.
• Changes in customer demand and product mix could materially adversely affect our business.
• We may experience significant price pressures over the life cycle of our products from competing technologies and our competitors.
• A disruption in our relationships with, the operations of, or the supply of product from any of our key suppliers, including those suppliers and manufacturers located in Asia and Mexico, whether due to COVID-19 or otherwise, could have a material adverse effect on us.
• Our stores are concentrated in the southern region of the U.S., especially Texas, which subjects us to regional risks, such as the economy, outbreaks, the performance of energy markets, weather conditions, hurricanes and other natural or man-made disasters.
• Our information technology systems for our key business processes are vulnerable to damage that could harm our business.
Table of Contents
14
• Our information technology systems may not be adequate to meet our evolving business and emerging regulatory needs and the failure to successfully implement new systems could negatively impact our business and financial results.
• If we cannot continue to offer third party payment solutions for customers who do not qualify for our proprietary credit offerings, our business may be impaired.
• If we are unable to continue to offer third-party repair service agreements to our customers, we could incur additional costs or repair expenses, which could materially adversely affect us.
• Our costs to protect our intellectual property rights, infringement of which could impair our name and reputation, could be significant.
• Failure to protect the security of our customers’, employees’ or suppliers’ information or failure to comply with data privacy and protection laws could expose us to litigation, compromise the integrity of our products, damage our reputation and materially adversely affect us.
• Failure to successfully utilize and manage e-commerce, and to compete effectively with the growing e-commerce sector, could materially adversely affect our business and prospects.
• If we fail to maintain adequate systems and processes to detect and prevent fraudulent activity, including in our e-commerce business, our business could be materially adversely impacted.
• Because we maintain a significant supply of cash and inventories in our stores, we may be subject to employee and third-party robberies, burglaries, thefts, riots and looting, and may be subject to liability as a result of crimes at our stores.
• We face risks with respect to product liability claims and product recalls, which could materially adversely affect our reputation, our business, and our consolidated results of operations.
Risks Related to Laws and Regulation
• Our business could be materially adversely affected by changes in consumer protection laws and regulations.
• The CFPB may reshape the consumer financial laws and there continues to be uncertainty as to how the agency’s actions will impact our business.
• Judicial or administrative decisions, CFPB rule-making or amendments to the Federal Arbitration Act could render the arbitration agreements we use illegal or unenforceable.
• We are required to comply with laws and regulations regulating extensions of credit and other dealings with customers and our failure to comply with applicable laws and regulations, or any adverse change in those laws or regulations, could have a negative impact on our business.
• We face the risk of litigation resulting from calls and text messages in violation of the TCPA.
• A large number of our stores are located in the State of Texas, which subjects us to concentrated regulatory risks.
Risks Related to Our Business
The COVID-19 outbreak in the United States may continue to cause, and other pandemics, epidemics or outbreaks may cause, effects which materially and adversely affect our business, results of operations and financial condition. COVID-19 has created significant worldwide volatility, uncertainty and disruption. In particular, COVID-19 has resulted in a substantial decline in business activities, a significant number of business closures, slowdowns, suspensions or delays of production and commercial activity, and weakened economic conditions, both in the U.S. and abroad.
In response to the continuing COVID-19 outbreak in the United States, further store closure and stay-at-home orders may reduce our customer traffic and lead to additional temporary reductions in operating hours. Furthermore, the COVID-19 outbreak may impact the number and timing of new store openings. The extent of these disruptions to our business and operations, and the full scale and scope of their effect, is currently uncertain and not possible to reasonably predict at this time.
In addition, the significant economic disruption caused by the outbreak could have an adverse effect on our credit segment if, for example, customers are unable to make timely payments on their accounts due to job loss, reduction of hours or furlough.
As the COVID-19 pandemic continues to unfold, or if other widespread epidemics, pandemics, or outbreaks were to occur, particularly if any such epidemic, pandemic or outbreak were to affect regions where we derive a significant amount of our revenue or profit or where our suppliers are located (as with the COVID-19 pandemic), governmental and public responses could materially and adversely disrupt our business and operations, and our business and results of operations may be materially and adversely affected.

Table of Contents
15
We could also be materially and adversely affected if government authorities impose restrictions (or additional restrictions) on operations of retailers, or restrict the import or export of products, or if suppliers issue mass recalls of products. Even if such measures are not implemented and an outbreak of virus or other disease does not spread significantly, the perceived risk of infection or health risk may adversely affect our business, results of operations and financial condition.
In addition, the impacts of COVID-19 and efforts to contain it have heightened the other risks described in this Annual Report on Form 10-K.
An economic downturn, outbreaks, including the COVID-19 outbreak, or other events may affect consumer purchases from us as well as their ability to repay their credit obligations to us, which could result in a material adverse effect on us. Many factors affect consumer spending, including regional or world events, war, diseases, outbreaks or epidemics (including the ongoing COVID-19 crisis), conditions in financial markets, local, state and national budgets and fiscal operations and conditions, general business conditions, interest rates, inflation, energy prices, consumer debt levels, the availability of consumer credit, taxation, unemployment trends and other matters that influence consumer confidence. Consumer purchases of our products and customers making payments to us decline during periods when disposable income is lower or periods of actual or perceived unfavorable economic conditions. Decreases in consumer confidence, instability in financial markets and political environment and volatile oil prices have negatively impacted our markets and may present significant challenges to our operations in the future. Additionally, we believe a portion of our customer base continues to experience significant economic challenges and uncertainty, including stagnant incomes or incomes that have not returned to pre-recession levels, and that those challenges could be intensified by various macroeconomic factors, including increasing inflationary pressures and significant recent disruption in financial markets in connection with the COVID-19 outbreak, increased unemployment, dramatic price swings in the cost of energy, and other factors.
We may not be able to open or profitably operate new stores in existing, adjacent or new geographic markets. There are a number of factors that could affect our ability to successfully execute our store growth strategy, including:
• The duration, scope, and severity of COVID-19;
• Difficulties associated with the hiring, training and retention of skilled personnel, including store managers;
• The availability of financial resources;
• The availability of favorable sites in existing, adjacent or new markets on terms, including price, consistent with our business plan;
• Competition in existing, adjacent or new markets;
• Competitive conditions, consumer tastes and discretionary spending patterns in adjacent or new markets that are different from those in our existing markets or changes in competitive conditions, consumer tastes and discretionary spending patterns in our existing markets;
• A lack of consumer demand for our products or financing programs at levels that can support store growth or the profitability of existing stores;
• Inability to make customer financing programs available that allow consumers to purchase products at levels that can support store growth;
• An inability to manage a greater number of new customers from new stores;
• Limitations created by covenants and conditions under our debt agreements, including our Revolving Credit Facility, the indenture governing our senior notes and our asset-backed notes;
• An inability or unwillingness of vendors to supply product on a timely basis or at competitive prices;
• An inability to secure consumer lending licenses in new or adjacent states or markets;
• The failure to open enough stores in new markets to achieve a sufficient market presence and realize the benefits of leveraging our advertising and distribution systems;
• Unfamiliarity with local real estate markets and demographics in adjacent and new markets;
• Problems in adapting our distribution and other operational and management systems to an expanded network of stores; and
• Higher costs for direct mail, television, newspaper, digital, radio and out-of-home targeted advertising.
These and other similar factors may also limit the ability of any newly opened stores to achieve sales and profitability levels consistent with our projections or comparable with our existing stores or to become profitable at all. As a result, we may

Table of Contents
16
determine that we need to close or reduce the hours of operation of certain stores, which could have a material adverse effect on us.
If we are unable to effectively manage the growth of our business, our revenues may not increase, our cost of operations may rise and our results of operations may decline. As we continue to grow and expand our store base, we will face various business risks associated with growth, including the risk that our management, financial controls and information systems will be inadequate to support our expansion. Our growth will require management to expend significant time, effort, and additional resources to ensure the continuing adequacy of our financial controls, operating procedures, information systems, product purchasing, warehousing and distribution systems and employee training programs. While we have engaged in and focused on these elements, we cannot predict whether we will be able to effectively manage the increased demand resulting from expansion in current markets or into new markets, or respond on a timely basis to the changing demands that our expansion will impose on our management, financial controls and information systems. If we fail to successfully manage the challenges of growth, do not continue to improve our systems and controls or encounter unexpected difficulties during expansion, our growth plan may not yield the results we currently anticipate and we could be materially adversely affected.
We have plans for significant future capital needs and the inability to access our Revolving Credit Facility or the capital markets on favorable terms or at all may have a material adverse effect on us. We generally finance our operations primarily through a combination of cash flow generated from operations, borrowings under our Revolving Credit Facility, and securitizations of customer receivables through the capital markets. Our ability to access capital through our existing Revolving Credit Facility, raise additional capital by expanding our Revolving Credit Facility, or undertake future securitization or other debt or equity transactions on economically favorable terms or at all, depends in large part on factors that are beyond our control, including:
• Conditions in the securities and finance markets generally, including as a result of the COVID-19 outbreak, and for securitized instruments in particular;
• A negative bias toward our industry by capital market participants;
• Our credit rating or the credit rating of any securities we may issue;
• General economic conditions and the results of our earnings, cash flows and balance sheet;
• Security or collateral requirements;
• The credit quality and performance of our customer receivables;
• Regulatory restrictions applicable to us;
• Our overall business and industry prospects;
• Our overall sales performance, profitability, cash flow, balance sheet quality, regulatory restrictions;
• Our ability to provide or obtain financial support for required credit enhancement;
• Our ability to adequately service our financial instruments;
• Our ability to make required representations and warranties;
• Our ability to meet debt covenant requirements; and
• Prevailing interest rates.
The amount of our planned capital expenditures may be limited by, among other factors, the availability of capital to fund new store openings and customer receivable portfolio growth. If adequate capital is not available at the time we need it, we may have to curtail future growth or change our expansion plans, which could have a material adverse effect on us.
We use our customer receivables, in addition to our inventory, as collateral to support our capital needs. As the aggregate amount and performance of our customer receivables has fluctuated, from time to time we have required amendments to our credit facilities in order to stay in compliance with our obligations thereunder. If we require such amendments in the future and are unable to obtain them, or if we are unable to arrange substitute financing facilities or other sources of capital, then we may be unable to continue drawing funds under our Revolving Credit Facility, which would force us to limit or cease offering credit through our finance programs. Likewise, if the borrowing base under our Revolving Credit Facility is reduced, or otherwise becomes unavailable, or we are unable to arrange substitute financing facilities or other sources of capital, we may have to limit the amount of credit that we make available through our customer credit programs. A reduction in our ability to offer customer credit could have a material adverse effect on us. Further, our inability, or limitations on our ability, to obtain funding through securitization facilities or other sources may materially adversely affect our ability to provide additional credit to existing customers, which could have a material adverse effect on our profitability under our credit programs if such existing customers fail to repay outstanding credit. Additionally, the inability of any of the financial institutions providing our financing facilities

Table of Contents
17
to fund their respective commitments could materially adversely affect our ability to fund our credit programs, capital expenditures and other general corporate needs.
Our existing and future levels of indebtedness could adversely affect our financial health, ability to obtain financing in the future, ability to react to changes in our business and ability to fulfill our obligations under such indebtedness. As of January 31, 2021, we had aggregate outstanding indebtedness, including under our Revolving Credit Facility, senior notes and various classes of asset-backed notes, of $607.2 million. This level of indebtedness could:
• Make it more difficult for us to satisfy our obligations with respect to our outstanding notes and other indebtedness, resulting in possible defaults on and acceleration of such indebtedness;
• Require us to dedicate a substantial portion of our cash flow from operations to the payment of principal and interest on our indebtedness, thereby reducing the availability of such cash flows to fund working capital, acquisitions, new store openings, capital expenditures and other general corporate purposes;
• Limit our ability to obtain additional financing for working capital, acquisitions, new store openings, capital expenditures, debt service requirements and other general corporate purposes;
• Limit our ability to refinance indebtedness or cause the associated costs of such refinancing to increase;
• Increase our vulnerability to general adverse economic and industry conditions, including interest rate fluctuations (because a portion of our borrowings are at variable rates of interest); and
• Place us at a competitive disadvantage compared to our competitors with proportionately less debt or comparable debt at more favorable interest rates which, as a result, may be better positioned to withstand economic downturns.
Any of the foregoing impacts of our level of indebtedness could have a material adverse effect on us.
Our debt securities may receive ratings that may increase our borrowing costs. We may elect to issue securities for which we may seek to obtain a rating from a rating agency. It is possible, however, that one or more rating agencies may independently determine to assign a rating to any of our issued debt securities. If any ratings are assigned to any of our debt, or the asset-backed notes or other securities with a rating, such ratings, if they are lower than market expectations or are subsequently lowered or withdrawn, whether as a result of our actions or factors which are beyond our control, could increase our future borrowing costs and impair our ability to access capital and credit markets on terms commercially acceptable to us, or at all. Inability to access the credit markets on acceptable terms, if at all, could have a material adverse effect on our financial condition.
We might not be able to access the securitization market for capital from time to time in the future, which may require us to seek alternative and more costly sources of financing. We have successfully consummated a number of securitization transactions, however, there can be no assurances that we will be able to complete additional securitization transactions if securitization markets become constrained. The economic recession that began in 2009 and events in the securitization markets, as well as the debt markets and the economy generally, caused significant dislocations, lack of liquidity in the market for asset-backed securities, and a severe disruption in the wider global financial markets, including a significant reduction of investor demand for, and purchases of, asset-backed securities and structured financial products. Additional or prolonged disruptions in the securitization market, such as a recession triggered by the effects of the ongoing COVID-19 crisis, could preclude our ability to use securitization as a financing source, or could render it an inefficient source of financing making us more dependent on alternative sourcing of financing that might not be as favorable as securitizations or might be otherwise unfavorable or unavailable altogether.
Securitization structures are subject to an evolving regulatory environment that may affect the availability and attractiveness of securitization as a financing option. In the U.S., following the economic recession that began in 2009, there has been increased political and regulatory scrutiny of the asset-backed securities industry, which has resulted in increased regulation. The impact of such regulations on investors in securitization markets and the incentives for certain investors to hold asset-backed securities remain unclear, and may have a material adverse effect on the liquidity of such securities, which could have a material adverse effect on our liquidity. Additionally, rules from various agencies now require sponsors of asset-backed securities to retain an ownership stake in securitization transactions. Any adverse changes to these regulations could effectively limit our access to securitization as a source of financing or alter the structure of securitizations, which could pose risks to our participation in any securitizations or could reduce or eliminate the economic incentives to us of participating in securitizations.
One of our operating subsidiaries may be required to repurchase certain finance receivables if representations and warranties about the quality and nature of such receivables are breached, which may negatively impact our results of operations, financial condition, and liquidity. We have entered into certain financing arrangements, including issuances of asset-backed notes and a warehouse financing facility (collectively, “Financing Transactions”), that are secured by retail installment contracts and direct consumer loans originated by our operating subsidiaries (the “Receivables”). In connection

Table of Contents
18
with the Financing Transactions, our operating subsidiaries sold the Receivables to certain of our wholly-owned special purpose VIEs and made certain representations and warranties about the quality and nature of the Receivables.
If there is a breach of those representations and warranties, one of our operating subsidiaries may be obligated to repurchase the affected Receivables. If our operating subsidiary is required to repurchase Receivables that were previously sold in connection with the Financing Transactions, this could have a materially adverse impact on our results of operations, financial condition, and liquidity.
A decrease in our credit sales, a decline in credit quality of our customers or other factors outside of our control could lead to a decrease in our product sales and profitability. A significant portion of our credit portfolio is comprised of credit provided to customers considered to be sub-prime borrowers who have limited credit history, low income or past credit problems. Entering into credit arrangements with such customers entails a higher risk of customer default, higher delinquency rates and higher losses than extending credit to more creditworthy customers. While we believe that our pricing and the underwriting criteria and collection methods we employ enable us to effectively and appropriately manage the higher risks inherent in issuing credit to sub-prime customers, no assurance can be given that such pricing and underwriting criteria and methods will afford adequate protection against such risks. We have experienced volatility in delinquency and charge-off rates on our customer receivables, each of which has the effect of decreasing our profitability. Some of our customer receivables become delinquent from time to time. Some accounts end up in default, due to various factors, such as general and local economic conditions, including the impact of rising interest rates, living costs and unemployment rates. As we continue to expand into new markets, we will obtain new customer receivables that may present a higher risk than our existing customer receivables since new customer receivables do not have an established credit history with us.
If we reduce the amount of credit we grant to our customers (whether due to financial or regulatory constraints, including regulatory constraints relating to interest rates), or if our customers curtail entering into credit arrangements with us, whether as a result of prolonged economic uncertainty in the U.S., increases in unemployment or other factors, we likely would sell fewer products, which could result in a material adverse effect on us. Further, because a significant number of payments we receive on credit accounts are made in person by customers in one of our store locations, any decrease in credit sales could reduce traffic in our stores and result in lower revenues. A decline in the credit quality of our credit accounts could also cause an increase in our credit losses, which would result in an adverse effect on our earnings. A decline in credit quality could also lead to stricter underwriting criteria which could have a negative impact on net sales.
We maintain an allowance for doubtful accounts on our customer accounts receivable. If the allowance for doubtful accounts is inadequate, we would recognize losses in excess of the allowance, which could have a material adverse effect on us.
Covenants in our debt agreements impose various operating and financial restrictions on us, and if we are not able to comply with such covenants, our lenders could accelerate our indebtedness, proceed against certain collateral we have provided or exercise other remedies, which could have a material adverse effect on us. The covenants in our Revolving Credit Facility, the indenture governing our senior notes, and our asset-backed notes contain a number of restrictions that impose operating and financial restrictions on us and may limit our ability to execute our growth strategy or engage in acts that may be in our long-term best interest, including restrictions on our ability to incur additional indebtedness, grant liens on assets, make distributions on equity interests, dispose of assets, make loans, pay other indebtedness, engage in mergers, and other matters. In addition, we must maintain compliance with certain financial covenants. Our ability to meet those financial covenants can be affected by events beyond our control, and we may be unable to meet them.
A breach of the covenants could result in an event of default under our Revolving Credit Facility or the indenture governing our senior notes or our asset backed notes. Such a default may allow the applicable creditors to accelerate the related debt and may result in the acceleration of any other debt to which a cross-default provision applies. Furthermore, if we are unable to repay the amounts due and payable under our Revolving Credit Facility, the lenders thereunder could proceed against the collateral granted to them to secure that indebtedness, which could have a material adverse effect on us. In the event our lenders accelerate the repayment of our borrowings, we may not have sufficient funds to repay that indebtedness.
Increased borrowing costs will negatively impact our results of operations. Because most of our consumer credit programs have interest rates equal to the highest rate allowable under applicable state law, we would generally not be able to pass higher borrowing costs along to future consumer credit customers and our results of operations could be negatively impacted. The interest rates on our Revolving Credit Facility are variable based upon an applicable margin determined by a pricing grid plus a London Interbank Offered Rate (“LIBOR”) or alternate base rate, and increases in such rates would reduce our margins. The level of interest rates in the market in general will impact the interest rate on any debt instruments we issue in the future. Additionally, we may issue debt securities or enter into credit facilities under which we pay interest at a higher rate than we have historically paid, which would further reduce our earnings and negatively impact our results of operations.
We may be adversely affected by changes in the method of determining LIBOR or the replacement of LIBOR with an alternative reference rate, including the Secured Overnight Financing Rate (“SOFR”). As of January 31, 2021, we had approximately $52.0 million of variable-rate indebtedness, which uses LIBOR as a benchmark for establishing the interest rate.

Table of Contents
19
The U.K. Financial Conduct Authority (the “FCA”) has announced its expectation that the publication of non-U.S. dollar LIBOR rates will cease after publication on December 31, 2021 and the publication of U.S. dollar LIBOR rates for the most common tenors (overnight and one, three, six and twelve months) will cease after publication on June 30, 2023, instead of on December 31, 2021 as previously expected. The FCA and the LIBOR Administrator have emphasized that, despite any continued publication of U.S. dollar LIBOR rates through June 30, 2023, no new contracts using U.S. dollar LIBOR rates should be entered into after December 31, 2021. Accordingly, the transition away from the widespread use of LIBOR to alternative rates is expected to occur over the next couple of years. Further, there is no assurance that LIBOR, of any particular currency and tenor, will continue to be published until any particular date. The timing of the transition and the consequences of these developments cannot be entirely predicted but could include an increase in the cost of our variable-rate indebtedness and other commercial arrangements tied to LIBOR.
Furthermore, the Federal Reserve Board and the Federal Reserve Bank of New York organized the Alternative Reference Rates Committee (“ARRC”), which identified the Secured Overnight Financing Rate (“SOFR”) as its preferred alternative to U.S. dollar-LIBOR in derivatives and other financial contracts. SOFR is a broad U.S. Treasury repo financing rate that represents overnight secured funding transactions and is fundamentally different from LIBOR for two key reasons. First, SOFR is a secured rate, while LIBOR is an unsecured rate. Second, SOFR is an overnight rate, while LIBOR represents interbank funding over different maturities. As a result, there can be no assurance that SOFR will perform in the same way as LIBOR would have at any time, including as a result of changes in interest and yield rates in the market, market volatility or global or regional economic, financial, political, regulatory, judicial or other events, and since its publication began in 2018, daily changes in SOFR have, on occasion, been more volatile than daily changes in comparable benchmark or other market rates. Accordingly, we cannot predict whether changes related to the phase-out of LIBOR, including insufficient liquidity in the SOFR markets, alternative reference rates or other reforms, as they occur, will not have an adverse effect on the amount of interest paid on, or the market value of, our current or future debt obligations.
In addition, we have incurred and expect to incur further expenses to renegotiate or clarify the rate provisions in certain of our variable-rate arrangements to affect the transition away from LIBOR-based rates and implement replacement indices, as necessary, but may not be able to do so on terms favorable to us. Furthermore, uncertainty regarding the continued use and reliability of LIBOR as a benchmark rate and uncertainty regarding its replacement could disrupt the financial markets or adversely affect the value of our arrangements tied to LIBOR.
Deterioration in the performance of our customer receivables portfolio could materially adversely affect our liquidity position and profitability. Our liquidity position and profitability are heavily dependent on our ability to collect our customer receivables. If the performance of our customer receivables portfolio were to substantially deteriorate, that could have a material adverse effect on the liquidity available to us and our ability to comply with the covenants and borrowing base calculations under our Revolving Credit Facility, and our earnings may decline due to higher provisions for bad debt expense, higher servicing costs, higher net charge-off rates and lower interest and fee income.
Our ability to collect from credit customers may be impaired by store closings. In the event of store closings, whether due to the COVID-19 outbreak or otherwise, credit customers may not pay balances in a timely fashion, or may not pay at all, since a large number of our customers remit payments in store and have not traditionally made payments to a non-store location.
In deciding whether to extend credit to customers, we rely on the accuracy and completeness of information furnished to us by or on behalf of our credit customers, and we assume certain behavior and attributes on the basis of prior customers. If we and our systems are unable to detect any misrepresentations in this information, or if our assumptions prove inaccurate, it may have a material adverse effect on us. In deciding whether to extend credit to customers, we rely heavily on information furnished to us by or on behalf of our credit customers, including employment and personal financial information, and our ability to validate such information through third-party services. We also assume certain behavior and attributes observed for prior customers. Our ability to effectively manage our credit risk could be impaired, and could have a material adverse effect on us, if a significant percentage of our credit customers intentionally or negligently misrepresent any of this information, and our systems do not detect such misrepresentations, or if unexpected changes in behavior caused by macroeconomic conditions, changes in consumer preferences, availability of alternative products or other factors cause our assumptions to be inaccurate.
Our policy of re-aging certain delinquent borrowers affects our delinquency statistics and the timing and amount of our write-offs, and may lead to higher delinquency statistics in the future, which could have a material adverse effect on our financial results. Re-aging is offered to certain of our past-due customers if they meet the conditions of our re-age policy. Our decision to offer a delinquent customer a re-age program is based on that borrower’s specific condition, our history with the borrower, the amount of the loan and various other factors. When we re-age a customer’s account, we move the account from a delinquent status to a current status. Management exercises a considerable amount of discretion over the re-aging process and has the ability to re-age an account multiple times during its life. Treating an otherwise uncollectible account as current affects our delinquency statistics, as well as impacts the timing and amount of charge-offs and, potentially, our future financial results. If these accounts had been charged off sooner, our net loss rates for earlier periods might have been higher. If the customer

Table of Contents
20
defaults on the re-aged account, our re-aging may have simply postponed a delinquency, and our future delinquency statistics will be correspondingly higher.
If we fail to properly staff and train our collections personnel or timely contact delinquent borrowers, the number of delinquent customer receivables eventually being charged off could increase. We contact customers with delinquent credit account balances soon after the account becomes delinquent. During periods of increased delinquencies, it is important that we are proactive in dealing with customers rather than simply allowing customer receivables to go to charge-off. Historically, when our servicing becomes involved at an earlier stage of delinquency with credit counseling and workout programs, there is a greater likelihood that the customer receivable will not be charged off.
The success of our collection efforts depends on our collection center being properly staffed and our staff being properly trained to assist borrowers in bringing delinquent balances current and ultimately avoiding charge-off. If we do not properly staff and train our collections personnel, or if we incur any downtime or other issues with our information systems that assist us with our collection efforts, then the number of accounts in a delinquent status or charged-off could increase. In addition, managing a substantially higher volume of delinquent customer receivables typically increases our operational costs. A rise in delinquencies or charge-offs could result in a material adverse effect on us.
We rely on internal models to manage risk and to provide accounting estimates. We could suffer a material adverse effect if those models do not provide reliable accounting estimates or predictions of future activity. We make significant use of business and financial models in connection with our efforts to measure and monitor our risk exposures and to manage our credit portfolio. For example, we use models as a basis for credit underwriting decisions, portfolio delinquency, charge-off and collection expectations and other market risks, based on economic factors and our experience. The information provided by these models is used in making business decisions relating to strategies, initiatives, transactions and pricing, as well as the size of our allowance for doubtful accounts, among other accounting estimates.
Models are inherently imperfect predictors of actual results because they are based on current and historical data available to us and our assumptions about factors such as credit demand, payment rates, default rates, delinquency rates and other factors that may overstate or understate future experience. Our models could produce unreliable results for a number of reasons, including the limitations of historical data to predict results due to unprecedented or unforeseen events or circumstances, invalid or incorrect assumptions underlying the models, the need for manual adjustments in response to rapid changes in economic conditions, changes in credit policies, incorrect coding of the models, incorrect data being used by the models or inappropriate application of a model to products or events outside of the model’s intended use. In particular, models are less dependable when the prevailing economic environment is different than historical experience.
In addition, we continually receive new economic data. Our critical accounting estimates, such as the size of our allowance for doubtful accounts, are subject to change, often significantly, due to the nature and magnitude of changes in economic conditions. However, there is generally a lag between the availability of this economic information and the preparation of corresponding internal models. When economic conditions change quickly or in unforeseen ways, there is increased risk that the assumptions and inputs reflected in our models are not representative of current economic conditions.
Changes in the economy, regulatory landscape, credit policies and practices, and the credit and capital markets have required, and will continue to require, frequent adjustments to our models and the application of greater management judgment in the interpretation and adjustment of the results produced by our models, including in connection with market uncertainty driven by the COVID-19 pandemic and other matters. The application of greater management judgment reflects the need to take into account updated information while continuing to maintain controlled processes for model updates, including model development, testing, independent validation and implementation. As a result of the time and resources, including technical and staffing resources, that are required to perform these processes effectively, it may not be possible to replace existing models quickly enough to ensure that they will always properly account for the impacts of recent information and actions.
If circumstances prove our models to be undependable or not representative of our results, then we may deem it necessary to increase our allowance for doubtful accounts in the future. If our actual charge-offs exceed the assumption used to establish the allowance, our provision for losses would increase and could result in a material adverse effect on us.
We benefit from the collection of customer and non-customer recoveries on our customer accounts receivables. Our inability to continue to collect these recoveries could adversely affect our financial results. Once an account is charged-off, we continue to pursue collections from various recovery sources, including the customer, various state taxing jurisdictions in which sales tax was remitted and our third party insurance and warranty carriers that sold insurance and warranty products. If we are unable to continue to pursue our collections efforts as a result of operational, legislative, contractual or other changes, our financial results could be adversely affected.
Our reported results require the judgment of management, and we could be subject to risks associated with these judgments or could be adversely affected by the implementation of new, or changes in the interpretation of existing, accounting principles or financial reporting requirements. The preparation of our financial statements requires management to make

Table of Contents
21
estimates and assumptions that affect the reported amounts of assets and liabilities, and disclosure of contingent assets and liabilities, at the dates of the consolidated financial statements and the reported amounts of revenue and expenses during the reporting periods. In addition, we prepare our financial statements in accordance with generally accepted accounting principles (“GAAP”), and GAAP and its interpretations are subject to change over time. If new rules, different judgments, or interpretations of existing rules require us to change our financial reporting, our results of operations and financial condition could be materially adversely affected, and we could be required to restate historical financial reporting.
Some of our customers may be recent immigrants and some may not be US citizens. Changes in immigration policies that affect states that share a border with Mexico may negatively impact our retail sales. We follow customer identification procedures including accepting government-issued picture identification, but we do not verify the immigration status of our customers. If we or the retail credit offering sector receive negative publicity around making loans to potentially undocumented immigrants, it may draw additional attention from regulatory agencies or advocacy groups, which may harm our sales and collections results. While our credit models look to approve customers who have stability of residency and employment, it is possible that a significant change in immigration patterns, policies or enforcement could cause our customers to reduce their business with us, or not engage in business transactions with us, and cause a reduction in sales or an increase in account delinquencies. Changes in immigration policies that affect states that share a border with Mexico may continue to create sales challenges and to negatively impact our retail sales in stores along the Mexican border. There is no assurance that a significant change in US immigration patterns, laws, regulations or enforcement will not occur, and any such significant change could have a material adverse impact on us.
If we lose key management or are unable to attract and retain the qualified sales and credit granting and collection personnel required for our business, our operating results could suffer. Our success depends to a significant degree on the skills, experience and continued service of our key executives and the identification of suitable successors for them. While our key executives are subject to non-competition restrictions and other negative contractual covenants, if we lose the services of any of these individuals and we are unable to identify a suitable successor, or if one or more of them or other key personnel decide to join a competitor or otherwise compete directly or indirectly with us, our business and operations could be harmed, and we could have difficulty in implementing our strategy. In addition, our sales and credit operations are largely dependent upon our labor force. As our business grows, and as we incur turnover in current positions, we will need to locate, hire and retain additional qualified sales personnel in a timely manner and develop, train and manage an increasing number of management level sales associates and other employees. Additionally, if we are unable to attract and retain qualified credit granting and collection personnel, our ability to perform quality underwriting of new credit transactions and maintain workloads for our collections personnel at a manageable level could be materially adversely affected, and our operations could be materially adversely impacted, resulting in higher delinquency and net charge-offs on our credit portfolio. Competition for qualified employees could require us to pay higher wages, and increases in the federal, state or local minimum wage or other employee benefits costs could increase our operating expenses. If we are unable to attract and retain personnel as needed in the future or our operating expenses increase, our net sales and operating results could suffer.
We depend on hiring an adequate number of hourly employees to run our business and are subject to government regulations concerning these and our other employees, including wage and hour regulations. Our workforce is comprised primarily of employees who work on an hourly basis. In certain markets where we operate, there is significant competition for hourly employees. The lack of availability of an adequate number of hourly employees or an increase in wages and benefits to current employees could have a material adverse effect on us. We are subject to applicable rules and regulations relating to our relationship with our employees, including wage and hour regulations, health and workers’ compensation benefits, unemployment taxes, overtime and working conditions and immigration status. Accordingly, legislated increases in the federal, state or local minimum wage, as well as increases in additional labor cost components such as employee benefit costs, workers’ compensation insurance rates, compliance costs and fines, would increase our labor costs, which could have a material adverse effect on us.
We face significant competition from national, regional, local and internet retailers of furniture and mattresses, home appliances, and consumer electronics. The retail market for consumer electronics, furniture and mattresses is highly fragmented and intensely competitive and the market for home appliances is concentrated among a few major dealers. We currently compete against a diverse group of retailers, including national mass merchants, specialized national retailers, home improvement stores, and locally-owned regional or independent retail specialty stores that sell furniture and mattresses, home appliances, and consumer electronics, similar, and often identical, to those items we sell. We also compete with retailers that market products using store catalogs and the internet. In addition, there are few barriers to entry into our current and contemplated markets, and new competitors may enter our current or future markets at any time. Additionally, we compete to some extent against companies offering weekly or monthly lease-to-own payment options to credit constrained consumers for products for the home similar to those offered by us.
We may not be able to compete successfully against existing and future competitors. Some of our competitors have financial resources that may be substantially greater than ours and they may be able to purchase inventory at lower costs and better

Table of Contents
22
endure economic downturns. If we cannot offer competitive prices to our customers, our sales may decline or we may be required to accept lower profit margins. Our competitors may respond more quickly to new or emerging technologies and may have greater resources to devote to promotion and sale of products and services. If two or more competitors consolidate their businesses or enter into strategic partnerships, they may be able to compete more effectively against us.
Our existing competitors or new entrants into our industry may use a number of different strategies to compete against us, including:
• Expansion by our existing competitors or entry by new competitors into markets where we currently operate;
• Lower pricing;
• Aggressive advertising and marketing;
• Extension of credit to customers on terms more favorable than we offer;
• Extension of credit options to customers with lower credit quality than qualifies for the credit programs we offer;
• Larger store size, or innovative store formats, which may result in greater operational efficiencies; and
• Adoption of improved retail sales methods.
Competition from any of these sources could cause us to lose market share, sales and customers, limit our ability to attract new customers, increase expenditures or reduce prices, any of which could have a material adverse effect on us.
Changes in customer demand and product mix could materially adversely affect our business. Our products must appeal to a broad range of consumers whose preferences cannot be predicted with certainty and are subject to change. Our ability to maintain and increase sales depends to a large extent on the introduction and availability of new products and technologies and our ability to respond timely to customer demands and preferences for such new products. It is possible that the introduction of new products will never achieve widespread consumer acceptance or will be supplanted by alternative products and technologies that do not offer us a similar sales opportunity or are sold at lower price points or margins. We may be unable to anticipate these buying patterns, which could result in a material adverse effect on us. In addition, we often make commitments to purchase products from our vendors several months in advance of proposed delivery dates. Significant deviation from the projected demand for products that we sell could affect our inventory strategies, which may have an adverse effect on us, either from lost sales or lower margins due to the need to reduce prices to dispose of excess inventory.
Furthermore, due to our increasing emphasis on furniture and mattress offerings, we are building larger new stores and investing additional capital to expand existing stores to accommodate those offerings. If we are unable to execute on our furniture and mattress offering strategy, it could have a material adverse effect on us.
We may experience significant price pressures over the life cycle of our products from competing technologies and our competitors. Prices for many of our products decrease over their life cycle. Such decreases often result in decreased gross profit margins. Suppliers may also take various steps, including manufacturing lower-cost inventory in higher volumes, to increase their own profitability, which may negatively impact our margins and, as a result, our profitability. Typically, new products, such as OLED, QLED, 4K Ultra HD and 8K televisions are introduced at relatively high price points that are then gradually reduced as the product becomes mainstream. To sustain same store sales growth, unit sales must increase at a rate greater than the decline in product prices. The affordability of products helps drive unit sales growth. However, as a result of relatively short product life cycles in the consumer electronics industry, which limit the amount of time available for sales volume to increase, combined with rapid price erosion in the industry, retailers are challenged to maintain overall gross margin levels and positive same store sales. We continue to adjust our marketing strategies to address this challenge through the introduction of new product categories, new products within our existing categories and product innovations. If we fail to accurately anticipate the introduction of new technologies, we may possess significant amounts of obsolete inventory that can only be sold at substantially lower prices than we anticipated. In addition, we may not be able to maintain our historical margin levels in the future due to increased sales of lower margin products, such as personal electronics products, and declines in average selling prices of key products, such as consumer electronics and home appliances. If sales of lower margin items continue to increase and replace sales of higher margin items, or if our consumer electronics products average selling prices decrease due to the maturity of their life cycle, our gross margin and overall gross profit levels may be materially adversely affected.
A disruption in our relationships with, the operations of, or the supply of product from any of our key suppliers, including those suppliers and manufacturers located in Asia and Mexico, whether due to COVID-19 or otherwise, could have a material adverse effect on us. The success of our business and growth strategies depends to a significant degree on our relationships with our suppliers, particularly our brand name suppliers. We do not have long-term supply agreements or exclusive arrangements with a number of our vendors. We typically order our inventory through the issuance of individual purchase orders to vendors. We have limited contractual assurance of the continued supply of merchandise we currently, or

Table of Contents
23
would like to, offer our customers. We also rely on our suppliers for funds in the form of vendor allowances. We may be subject to rationing by suppliers with respect to a number of limited distribution items. In addition, while we purchase products from approximately 75 manufacturers and distributors, we rely heavily on a relatively small number of suppliers. For example, during fiscal year 2021, 76.0% of our total inventory purchases were from six vendors. The loss of any one or more of our key suppliers or failure to establish and maintain relationships with these and other vendors, and limitations on the availability of inventory or repair parts, could have a material adverse effect on our supply and assortment of products, as we may not be able to find suitable replacements to supply products at competitive prices, and on our results of operations and financial condition.
If one of our vendors were to go out of business or were to be unable to fund amounts due to us, including payments due for returns of product and warranty claims, it could have a material adverse effect on our results of operations and financial condition. Catastrophic or other unforeseen events, including outbreaks such as COVID-19, whether inside or outside the U.S., could materially adversely impact the supply and delivery to us of products manufactured far from our sales facilities, including manufacturers or suppliers located in Asia and Mexico, which could materially adversely impact our results of operations. In addition, because many of the products we sell are manufactured outside of the U.S., we may experience labor unrest or an increase in the cost of imported vendor products, or an inability to secure imported merchandise, as a result of border taxes, tariffs, or trade disputes at any time for reasons beyond our control. Any slow-downs, disruptions or strikes at any of the ports may have a material adverse effect on our relationships with our customers and our business, potentially resulting in canceled orders by customers and reduced revenues and earnings. If imported merchandise becomes more expensive, unavailable or difficult to obtain, we may not be able to meet the demands of our customers. Products from alternative sources may also be more expensive than those our vendors currently import.
Our ability to enter new markets successfully depends, to a significant extent, on the willingness and ability of our vendors to supply merchandise to additional distribution centers and stores. If vendors are unwilling or unable to supply some or all of their products to us at acceptable prices in one or more markets, we could be materially adversely affected.
Furthermore, we rely on credit from vendors to purchase our products. A substantial change in credit terms from vendors or vendors’ willingness to extend credit to us, including providing inventory under consignment arrangements, would reduce our ability to obtain the merchandise that we sell, which could have a material adverse effect on us. In addition, if our vendors fail to continue to offer vendor allowances, or we are restricted in our ability to earn such funds, our results of operations could be materially adversely affected.
Turmoil in financial markets and economic disruptions around the world may also negatively impact our suppliers’ access to capital and liquidity with which to maintain their inventory, production levels, and product quality, and operate their businesses, all of which could materially adversely affect our supply chain. It may also cause them to change their pricing policies, which could adversely impact demand for their products. Economic disruptions and market instability may make it difficult for us and our suppliers to accurately forecast future product demand trends, which could cause us to carry too much or too little merchandise in various product categories. In addition, to the extent that any manufacturer utilizes labor practices that are not commonly accepted in the U.S., we could be materially adversely affected by any resulting negative publicity.
Our same store sales fluctuate significantly. Our same store sales have fluctuated significantly from quarter to quarter historically and may fluctuate in the future. A number of factors have historically affected, or may in the future affect, our same store sales, including:
• Changes in competition, such as pricing pressure, and the opening of new stores by competitors in our markets;
• General economic conditions;
• Economic challenges faced by our customer base;
• New product introductions;
• Changes in our marketing programs;
• Consumer trends;
• Changes in our merchandise mix;
• Changes in the relative sales price points of our major product categories;
• Underwriting standards for our customers purchasing merchandise on credit;
• Our ability to offer credit programs attractive to our customers;
• The impact of any new stores on our existing stores;
• Our ability to manage our supply chain and inventory as a result of relocations of and restructurings to our distribution centers;

Table of Contents
24
• Weather events and conditions in our markets;
• COVID-19 and other outbreaks;
• Timing of promotional events;
• Timing, location and participants of major sporting events;
• The number of new store openings;
• The percentage of our stores that are mature stores that tend to be smaller or have fewer assortment of higher margin products, such as furniture;
• The locations of our stores and the traffic drawn to those areas;
• How often we update our stores;
• Our ability to execute our business strategy effectively;
• Staffing levels; and
• Lease-to-own penetration rates.
We have been named as a defendant in multiple securities class action lawsuits and shareholder derivative lawsuits. Potential similar or related litigation or investigations could result in substantial damages and may divert management’s time and attention from our business. We and certain of our current and former officers and directors are named as defendants in securities class action lawsuits and in related shareholder derivative lawsuits. Each of these matters is described in more detail in Part II, Item 8., in Note 12, Contingencies, of the Consolidated Financial Statements of this Annual Report on Form 10-K.
The lawsuits could result in the diversion of management’s time and attention away from business operations, which could harm our business and also harm our relationships with existing customers and vendors. They may also materially damage our reputation and the value of our brand. Our legal expenses incurred in defending the lawsuits could be significant, and a ruling against us, or a settlement of any of these matters, could have a material adverse effect on us.
There can be no assurance that any litigation to which we are, or in the future may become, a party will be resolved in our favor. These lawsuits and any other lawsuits that we may become party to are subject to inherent uncertainties, and the costs to us of defending litigation matters will depend upon many unknown factors. Any claim that is successfully decided against us may require us to pay substantial damages, including punitive damages, and other related fees, or prevent us from selling certain of our products. Regardless of whether lawsuits are resolved in our favor or if we are the plaintiff or the defendant in the litigation, any lawsuits to which we are or may become a party will likely be expensive and time consuming to defend or resolve.
Pending litigation relating to the sale of credit insurance and the sale of repair service agreements in the retail industry could have a material adverse effect on us. State attorneys generals and private plaintiffs have filed lawsuits against other retailers relating to improper practices in connection with the sale of credit insurance and repair service agreements in several jurisdictions around the country. We offer credit insurance in our stores on sales financed under our credit programs and require customers to purchase credit insurance from us, or provide evidence from a third-party insurance provider, at their election, in connection with sales of merchandise on credit. Therefore, similar litigation could be brought against us. While we believe we are in full compliance with applicable laws and regulations, if we are found liable in any future lawsuit regarding credit insurance or repair service agreements, we could be required to pay substantial damages or incur substantial costs as part of an out-of-court settlement or require us to modify or suspend certain operations, any of which could have a material adverse effect on us. An adverse judgment or any negative publicity associated with our repair service agreements or any potential credit insurance litigation could also affect our reputation, which could have a negative impact on our cash flow and results of operations.
Pending or unforeseen litigation and the potential for adverse publicity associated with litigation could have a material adverse effect on us. We are involved from time to time in various legal proceedings arising in the ordinary course of our business, including primarily commercial, consumer finance, debt collections, product liability, employment and intellectual property claims. We currently do not expect the outcome of any pending matters to have a material adverse effect on our consolidated results of operations, financial position or cash flows. Litigation, however, is inherently unpredictable, and it is possible that the ultimate outcome of one or more pending claims asserted against us, or claims that may be asserted in the future that we are currently not aware of, or adverse publicity resulting from any such litigation, could adversely impact our business, reputation, sales, profitability, cash flows and financial condition.
In recent years many participants in the manufacturing, retail and software industries have been the target of patent litigation claimants making demands or filing claims based upon alleged patent infringement through the manufacturing and selling,

Table of Contents
25
either in merchandise or through software and internet websites, of product or merely providing access through website portals. We, in conjunction with multiple other parties, have been (and remain) the targets of such claims. While we believe that we have not violated or infringed any third-party alleged patent rights, and intend to defend vigorously any such claims, the cost to defend, settle or pay any such claims could be substantial and could have a material adverse effect on us.
Failure to effectively manage our costs could have a material adverse effect on our profitability. Certain elements of our cost structure are largely fixed in nature. Consumer spending remains uncertain, which makes it more challenging for us to maintain or increase our operating income. The competitiveness in our industry and increasing price transparency means that the focus on achieving efficient operations is greater than ever. As a result, we must continuously focus on managing our cost structure. Failure to manage our labor and benefit rates, advertising and marketing expenses, operating leases, charge-offs, other store expenses or indirect spending could materially adversely affect us.
Our stores are concentrated in the southern region of the U.S., especially Texas, which subjects us to regional risks, such as the economy, outbreaks, the performance of energy markets, weather conditions, hurricanes and other natural or man-made disasters. If the southern region of the U.S. suffers an economic downturn or any other adverse regional event, such as an outbreak, a collapse of the oil and gas market, or inclement weather, it could have a material adverse effect on us as a result of the concentration of our stores in such region. Several of our competitors operate stores in various regions across the U.S. and thus may not be as vulnerable to the risks associated with operating in a concentrated region. The states and the local economies where many of our stores are located are dependent, to a degree, on the oil and gas industries, which can be very volatile due to fluctuations of commodities prices or other causes. Because of fears of climate change and adverse effects of drilling explosions and oil spills, legislation has been considered, and governmental regulations and orders have been issued, which, combined with the local economic and employment conditions caused by both, could materially adversely impact the oil and gas industries and the economic health of areas in which a significant number of our stores are located.
Acts of violence at or threatened against our stores or the centers in which they are located, including active shooter situations, protests and terrorism, could unfavorably impact our sales, which could have a material adverse effect on us. Any act of violence at or threatened against our stores or the centers in which they are located, including active shooter situations, protests and terrorist activities, may result in restricted access to our stores and/or store closures in the short-term, and in the long-term, may cause our customers to avoid our stores. Any such situation could adversely impact cash flows and make it more difficult to fully staff our stores, which could have a material adverse effect on us.
Our information technology systems for our key business processes are vulnerable to damage that could harm our business. Our ability to operate our business, including our ability to manage our credit and collections, operations and inventory levels, largely depends on the efficient operation of our computer hardware and software systems. We use management information systems, including our credit underwriting, loan management, inventory management and collections systems, to track inventory information at the store level, communicate customer information, aggregate daily sales and expense information and manage our credit portfolio, including processing credit applications and managing collections. In addition, we license these systems from third parties. These systems and our operations are subject to damage or interruption from, among other things:
• Power loss, computer systems failures and internet, telecommunications or data network failures;
• Operator negligence, unauthorized access or improper operation by, or supervision of, employees;
• Physical and electronic loss of data or security breaches, misappropriation and similar events;
• Computer viruses;
• Intentional acts of vandalism and similar events;
• Failures on behalf of third parties from which we license certain of these systems to provide timely, quality and regular access to or maintenance of such systems; and
• Hurricanes, fires, floods and other natural disasters.
In addition, the software that we have developed internally to use in our daily operations may contain undetected errors that could cause our network to fail or our expenses to increase. Any failure of our owned or licensed systems due to any of these or other causes could cause an interruption in our operations and result in reduced net sales and results of operations. Though we have implemented contingency and disaster recovery processes in the event of one or several technology failures, any unforeseen failure, interruption or compromise of our systems or our security measures could adversely affect our business and harm our reputation. The risk of possible failures or interruptions may not be adequately addressed by us or the third-parties on which we rely, and such failures or interruptions could occur. The occurrence of any failures or interruptions could have a material adverse effect on us.
Our information technology systems may not be adequate to meet our evolving business and emerging regulatory needs and the failure to successfully implement new systems could negatively impact our business and financial results. We are

Table of Contents
26
investing capital in new information technology systems and implementing modifications and upgrades to existing systems to support our growth plan. These investments include replacing legacy systems, making changes to existing systems, building redundancies, and acquiring new systems and hardware with updated functionality. We are taking actions to ensure the successful implementation of these initiatives, including the testing of new systems and the transfer of existing data, with minimal disruptions to our business and collections, but there can be no guarantee of success. These efforts may take longer and may require greater financial and other resources than anticipated, may cause distraction of key personnel, may cause disruptions to our existing systems and our business, and may not provide the anticipated benefits. Any disruption in our information technology systems, or our inability to improve, or failure to upgrade, integrate or expand our systems to meet our evolving business and emerging regulatory requirements, could impair our ability to achieve critical strategic initiatives and could have a material adverse effect on us.
We could lose our access to customer and credit data sources, which could cause us competitive harm and have a material adverse effect on us. We are heavily dependent on customer and credit data provided by third party providers. Our data providers could stop providing data, provide untimely, incorrect or incomplete data, or increase the costs for their data for a variety of reasons, including a perception that our systems are insecure as a result of a data security breach or regulatory concerns or for competitive reasons. We could also become subject to increased legislative, regulatory or judicial restrictions or mandates on the collection, disclosure or use of such data, in particular if such data is not collected by our providers in a way that allows us to legally use the data. If we were to lose access to this external data or if our access or use were restricted or were to become less economical or desirable, our business would be negatively impacted, which would adversely affect our operating results and financial condition. We cannot provide assurance that we will be successful in maintaining our relationships with these external data source providers or that we will be able to continue to obtain data from them on acceptable terms or at all. Furthermore, we cannot provide assurance that we will be able to obtain comparable data from alternative sources on favorable terms or at all if our current sources become unavailable.
If we cannot continue to offer third party payment solutions for customers who do not qualify for our proprietary credit offerings, our business may be impaired. Currently, if a customer does not qualify for our credit offering for a particular purchase in our stores, but qualifies with a payment solutions provider not affiliated with us but with whom we have a commercial relationship, then we sell the applicable merchandise to such payment solutions provider, which leases the merchandise to the customer under a lease-to-own arrangement, and we record a cash sale. In fiscal year 2021, our third-party payment solution providers providing lease-to-own arrangements, represented approximately 8.5% of our retail revenue. Our third-party payment and credit solutions providers’ business models are subject to various risks that are outside of our control. If, as a result of any of these risks, our third-party payment and credit solutions providers are unable to, or otherwise determine not to continue operating with us at a level or on terms similar to the level or on terms we have historically operated, or if we are unable to establish new partnerships with different providers on favorable terms or at all, then we could lose sales or revenue, our financial results could be adversely affected, our ability to execute our growth plan could be impeded and we could otherwise suffer a material adverse effect.
If we are unable to continue to offer third-party repair service agreements to our customers, we could incur additional costs or repair expenses, which could materially adversely affect us. There are a limited number of insurance carriers that provide repair service agreement programs. If repair service agreement programs become unavailable from our current providers for any reason, we may be unable to provide repair service agreements to our customers on the same or similar terms, or at all. Even if we are able to obtain a substitute provider, higher premiums may be required, which could have a material adverse effect on our profitability if we are unable to pass along the increased cost of such coverage to our customers. Inability to maintain the repair service agreement program could cause fluctuations in our repair expenses, impact our credit portfolio losses, and cause greater volatility of earnings and could require us to become the obligor under new contracts we sell.
If we are unable to maintain group credit insurance policies from insurance carriers, which allow us to offer their credit insurance products to our customers purchasing our merchandise on credit, our revenues may be reduced or our credit losses may increase. There are a limited number of insurance carriers that provide credit insurance coverage for sale to our customers. If credit insurance becomes unavailable for any reason we may be unable to offer substitute coverage on the same or similar terms, or at all. Even if we are able to obtain substitute coverage, it may be at higher rates or reduced coverage, which could affect customer acceptance of these products, reduce our revenues or increase our credit losses.
We utilize a limited number of home delivery service providers. The loss of any one provider could have a material negative impact on our home delivery operations. If our third-party merchandise delivery services are unable to meet our promised delivery schedule, unable to maintain expense controls, or cease operations, including due to the economic impact of various factors including the COVID-19 outbreak or energy market disruption, our net sales may decline due to a decline in customer satisfaction, and profitability levels may be negatively impacted. For many purchases, we offer next day delivery to our customers that we outsource to one of our third-party delivery service providers. The loss of any one service provider, or the failure to establish and maintain relationships with these or other similar service providers, could have a material negative impact on our home delivery operations. These third-parties are subject to risks that are beyond our control and, if they fail to

Table of Contents
27
timely or satisfactorily deliver our products, we may lose business from customers in the future and could suffer damage to our reputation. The loss of customers or damage to our reputation could have a material adverse effect on us. Further, if our third-party delivery service providers are unable to maintain expense controls, our profitability and results of operations may be negatively impacted.
Changes in trade policy, currency exchange rate fluctuations and other factors beyond our control could materially adversely affect our business. A significant portion of our inventory is manufactured or assembled overseas in Asia and in Mexico. Changes in U.S. and foreign governments’ trade policies have resulted in, and may continue to result in, tariffs on imports into and exports from the U.S. Throughout 2018 and 2019, the U.S. imposed tariffs on imports from several countries, including China, and created the potential for significant additional changes in trade policies. While the impact of the tariffs was minimal to the Company in fiscal year 2020 and 2021, because many of the products that we sell are manufactured in foreign jurisdictions, including China, such tariffs could have a negative impact on our business in the future. The new administration in Washington, D.C. may likely take a different view on tariffs with China and other nations than the preceding administration, but the impact of any changes cannot be predicted accurately at this time. Additionally, in November 2018, the U.S., Mexico and Canada signed the United States-Mexico-Canada Agreement (the “USMCA”), which is designed to overhaul and update the North American Free Trade Agreement (“NAFTA”). The three countries agreed to a revised version of the USMCA in December 2019. The USMCA has been ratified by all three countries, and as a result, has replaced NAFTA. If the U.S. were to withdraw from or materially modify other international trade agreements, certain foreign-sourced goods that we sell may no longer be available at commercially attractive prices or at all, resulting in a material adverse effect on us. Continued diminished trade relations between the U.S. and other countries, as well as the continued escalation of tariffs, could have a material adverse effect on us. Additionally, currency fluctuations, including a devaluation of the U.S. dollar, border taxes, import tariffs, or other factors beyond our control may increase the cost of items we purchase or create shortages of these items, which in turn could have a material adverse effect on us. Conversely, significant reductions in the cost of these items in U.S. dollars may cause a significant reduction in the retail prices of those products, resulting in a material adverse effect on us.
Our costs to protect our intellectual property rights, infringement of which could impair our name and reputation, could be significant. We believe that our success and ability to compete depends in part on consumer identification of the name “Conn’s” and we rely on certain trademark registrations and common law rights to protect the distinctiveness of our brand. We intend to protect vigorously our trademarks against infringement, misappropriation or dilution by others. A third-party, however, could attempt to misappropriate our intellectual property or claim that our intellectual property infringes or otherwise violates third-party trademarks in the future. Any litigation or claims relating to our intellectual property brought by or against us, whether with or without merit, or whether successful or not, could result in substantial costs and diversion of our resources, which could have a material adverse effect on us.
Failure to protect the security of our customers’, employees’ or suppliers’ information or failure to comply with data privacy and protection laws could expose us to litigation, compromise the integrity of our products, damage our reputation and materially adversely affect us. Our business regularly captures, collects, handles, processes, transmits and stores significant amounts of sensitive information about our customers, employees, suppliers and others, including financial records, credit and business information, and certain other personally identifiable or other sensitive personal information. A number of other retailers have experienced security breaches, including a number of highly publicized incidents involving well-known retailers. To our knowledge, we have not suffered a significant security breach. While we have implemented systems and processes to protect against unauthorized access to or use of secured data and to prevent data loss and theft, there is no guarantee that these procedures are adequate to safeguard against all data security breaches or misuse of data. In addition, we rely on the secure operation of our website and other third-party systems generally to assist us in the collection and transmission of the sensitive data we collect. Our information systems are vulnerable to damage or interruption from power outages, computer and telecommunications failures, computer viruses, security breaches (including credit card information breaches), vandalism, catastrophic events and human error or malfeasance. A compromise of our information security controls or of those businesses with which we interact, which results in confidential information being accessed, obtained, damaged, or used by unauthorized or improper persons, could harm our reputation and expose us to regulatory actions and claims from customers, employees, financial institutions, payment card associations and other persons, any of which could materially adversely affect us. Moreover, a data security breach could require that we expend significant resources related to our information systems and infrastructure, and could distract management and other key personnel from performing their primary operational duties. If our information systems are damaged, fail to work properly or otherwise become unavailable, we may incur substantial costs to repair or replace them, and may experience loss of critical information, customer disruption and interruptions or delays in our ability to perform essential functions and implement new and innovative services. In addition, compliance with changes in privacy and information security laws and standards may result in considerable expense due to increased investment in technology and the development of new operational processes.
We maintain data breach and network security liability insurance, but we cannot be certain that our coverage will be adequate for any liabilities actually incurred or that insurance will continue to be available to us on economically reasonable terms or at

Table of Contents
28
all. We may need to devote significant resources to protect against security breaches or to address problems caused by breaches, which would divert resources from the growth and expansion of our business.
Our tax liabilities could be materially impacted by any changes in the tax laws of the jurisdictions in which we operate, beginning operations in new states, and assessments as a result of tax audits. Legislation could be introduced at any time that changes our tax liabilities in a way that has a material adverse effect on us. In particular, because of the extent of our operations in Texas, the Texas margin tax, which is based on gross profit rather than earnings, can create significant volatility in our effective tax rate. In addition, our entry into new states in the future could subject us to additional tax rate volatility, dependent upon the tax laws in place in those states. Moreover, we periodically review our indirect tax audit reserve based on recent assessments of prior year periods. In the event that actual results differ from our estimate, we may revise our estimate of post-audit periods, which could materially impact our financial condition and results of operations.
We are subject to sales, income and other taxes, which can be difficult and complex to calculate due to the nature of our business. A failure to correctly calculate and pay such taxes could result in substantial tax liabilities and have a material adverse effect on us. The application of indirect taxes, such as sales tax, is a complex and evolving issue and we may not have accrued or remitted required amounts to various jurisdictions. Many of the fundamental statutes and regulations that impose these taxes were established before the growth of e-commerce and, therefore, in many cases it is not clear how existing statutes apply to certain aspects of our business and we rely on advice from our third-party tax advisors. In addition, governments are increasingly looking for ways to increase revenues, which has resulted in discussions about tax reform and other legislative action to increase tax revenues, including through indirect taxes. This also could result in other adverse changes in or interpretations of existing sales, income and other tax regulations, the exact nature or effect of which cannot be reasonably calculated, but which could have a material adverse effect on us.
Failure to successfully utilize and manage e-commerce, and to compete effectively with the growing e-commerce sector, could materially adversely affect our business and prospects. Our website provides new and existing customers with the ability to review our product offerings and prices, apply for credit, and make payments on their credit accounts. Customers may apply for credit, be approved for credit, and complete a transaction to purchase merchandise on our website. Customers may also purchase certain products on our website using a credit card. Our website is a significant component of our advertising strategy. We believe our website represents a possible source for future sales and growth in our credit sales. In order to promote our products and services, allow our customers to complete credit applications in the privacy of their homes and on their mobile devices and make payments on their accounts, and drive traffic to our stores, we must effectively create, design, publish and distribute content over the internet. In late fiscal year 2020, we started to offer certain credit-qualified customers the ability to complete an entire purchase transaction financed online through our proprietary in-house credit programs. We are monitoring and adjusting the availability of our new online sales channels for credit performance and profitability. There can be no assurance that we will be able to design and publish web content with a high level of effectiveness or grow our e-commerce business in a profitable manner. Certain of our competitors, and a number of e-commerce retailers, have established e-commerce operations against which we compete for customers. It is possible that the increasing competition from the e-commerce sector may reduce our market share, gross margin or operating margin, and may have a material adverse effect on us.
If we fail to maintain adequate systems and processes to detect and prevent fraudulent activity, including in our e-commerce business, our business could be materially adversely impacted. Criminals are using increasingly sophisticated methods to engage in illegal activities such as paper instrument counterfeiting, fraudulent payment or refund schemes and identity theft. As we make more of our services available over the internet and other media, and as we expand into new geographic regions without an established customer base, we subject ourselves to increased consumer fraud risk. While we believe past incidents of fraudulent activity have been relatively isolated, we cannot be certain that our systems and processes will always be adequate in the face of increasingly sophisticated and ever-changing fraud schemes. We use a variety of tools to protect against fraud, but these tools may not always be successful at preventing such fraud. Instances of fraud may result in increased costs, including possible settlement and litigation expenses, and could have a material adverse effect on us.
Our reputation, ability to do business and operating results may be impaired by improper conduct by any of our employees, agents or business partners. Our employees, agents or business partners may violate the policies and procedures we have implemented to ensure compliance with applicable laws. Improper actions by any of the foregoing could subject us to civil, criminal or administrative investigations, could lead to substantial civil and criminal, monetary and non-monetary penalties, and related shareholder lawsuits, could cause us to incur significant legal fees, and could damage our reputation.
Because we maintain a significant supply of cash and inventories in our stores, we may be subject to employee and third-party robberies, burglaries, thefts, riots and looting, and may be subject to liability as a result of crimes at our stores. Our business requires us to maintain a significant supply of cash, loan collateral and inventories in most of our stores. As a result, we are subject to the risk of robberies, burglaries, thefts, riots and looting. Although we have implemented various programs in an effort to reduce these risks, maintain insurance coverage for robberies, burglaries and thefts and utilize various security measures at our facilities, there can be no assurance that robberies, burglaries, thefts, riots and looting will not occur. The extent of our cash, loan collateral and inventory, losses or shortages could increase as we expand the nature and scope of our

Table of Contents
29
products and services. Robberies, burglaries, thefts, riots and looting could lead to losses and shortages and could have a material adverse effect on us. It is also possible that violent crimes such as armed robberies may be committed at our stores. We could experience liability or adverse publicity arising from such crimes. For example, we may be liable if an employee, customer, guard or bystander suffers bodily injury or other harm. Any such event may have a material adverse effect on us.
We are subject to risks associated with leasing substantial amounts of space, including future increases in occupancy costs. We lease almost all of our store locations, our corporate headquarters and our distribution centers. Our continued growth and success depends in part on our ability to locate property for new stores and renew leases for existing locations. There is no assurance that we will be able to locate real estate and negotiate leases for new stores, or renegotiate leases for existing locations, on the same or similar terms, or on favorable terms at all, and we could be forced to move or exit a market as a result. Furthermore, a significant rise in real estate prices or real property taxes could result in an increase in store lease expense as we open new locations and renew leases for existing locations, thereby negatively impacting our results of operations. Our inability to enter into new leases or renew existing leases on terms acceptable to us, or be released from our obligations under leases for stores that we close, could materially adversely affect us.
We depend primarily on cash flow from operations to pay our lease expenses. If our business does not generate sufficient cash flow from operating activities to fund these expenses, we may not be able to service our lease expenses, which could materially adversely affect us. If an existing or future store is not profitable, and we decide to close it, we may be nonetheless committed to perform our obligations under the applicable lease including, among other things, paying the base rent for the balance of the lease term. Moreover, even if a lease has an early cancellation clause, we might not satisfy the contractual requirements for early cancellation under that lease.
Failure to maintain positive brand perception and recognition could have a negative impact on our business. Maintaining a good reputation is critical to the success of our business. The considerable expansion of the use of social media by our customers (including, but not only, as a result of our technological outreach), has increased the risk that our reputation could be negatively impacted in a short amount of time. If we are unable to quickly and effectively respond to criticism of our brand or reputation (on any basis), we may suffer declines in customer loyalty and traffic, vendor relationship issues, and other consequences, all of which could have a material adverse effect on us.
We face risks with respect to product liability claims and product recalls, which could materially adversely affect our reputation, our business, and our consolidated results of operations. We purchase merchandise from third-parties and offer this merchandise to customers for sale. This merchandise could be subject to recalls and other actions by regulatory authorities. Changes in laws and regulations could also impact the type of merchandise we offer to customers. We have experienced, and may in the future experience, recalls of merchandise. In addition, individuals may in the future assert claims that they have sustained injuries from third-party merchandise offered by us, and we may be subject to future lawsuits relating to these claims. These claims or liabilities may exceed, or fall outside the scope of, our insurance coverage. Any of the issues mentioned above could result in damage to our reputation, diversion of management resources, or reduced sales and increased costs, any of which could have a material adverse effect on us.
We previously identified a material weakness in our internal controls over financial reporting. If we fail to maintain an effective system of internal controls, our ability to product accurate and timely financial statements could be impaired, which could harm our business and have a material adverse effect on the price of our common stock. In 2020, management and our independent registered public accounting firm identified a material weakness in our internal controls over financial reporting related to information technology general controls (“ITGCs”). During fiscal year 2021, we implemented measures to remediate this material weakness, and we concluded that it had been fully remediated as of January 31, 2021. However, our remedial actions may not prevent this or similar weaknesses from occurring in the future.
We are required to comply with a variety of reporting, accounting and other rules and regulations. As a result, we maintain a system of internal control over financial reporting, but there are limitations inherent in internal control systems and significant deficiencies or material weaknesses are possible. A control system can provide only reasonable, not absolute, assurance that the objectives of the control system are met. In addition, the design of a control system must reflect the fact that there are resource constraints and the benefit of controls must be appropriate relative to their costs. Furthermore, compliance with existing requirements is expensive and we may need to implement additional finance and accounting and other systems, procedures and controls to satisfy our reporting requirements. If our internal control over financial reporting is determined to be ineffective, or if we are unable to appropriately or timely remediate any such effectiveness, such failure could cause us to restate financial results that have been made public, cause investors to lose confidence in our reported financial information, negatively affect the market price of our common stock, subject us to regulatory investigations and penalties, require us to expend significant resources to remediate the deficiencies, impair our access to capital and otherwise materially adversely impact us.
Our governance documents and Delaware law provide certain anti-takeover measures which could discourage, delay or prevent a change in control of the Company, even if such changes would be beneficial to our stockholders. Provisions of our amended and restated certificate of incorporation and amended and restated bylaws, as well as provisions of the Delaware

Table of Contents
30
General Corporation Law (“DGCL”) could discourage, delay or prevent a merger, acquisition or other change in control of the Company, even if such change in control would be beneficial to our stockholders. These provisions include:
• A prohibition on stockholder action without a meeting, unless such action has been approved in advance by our Board of Directors;
• A prohibition on stockholders’ ability to call special meetings of stockholders;
• Express powers to adjourn, postpone, reschedule or cancel meetings of stockholders, and rules regarding presiding, and conduct, at such meetings;
• Significant advance notice requirements for nominations for election to the Board of Directors or for proposing matters that can be acted upon by stockholders at stockholder meetings; and
• Authorization of the issuance of “blank check” preferred stock that could be issued by our Board of Directors to increase the number of outstanding shares and thwart a takeover attempt.
Further, we are subject to Section 203 of the DGCL, which limits certain transactions and business combinations between a corporation and a stockholder owning 15% or more of the corporation’s outstanding voting stock for a period of three years from the date the stockholder becomes a 15% stockholder. These provisions and our stockholders’ rights plan, either alone or in combination with each other, could delay, deter or prevent a change of control, whether or not it is desired by, or beneficial to, our stockholders.
Our corporate actions may be substantially controlled by our principal stockholders and affiliated entities. A large proportion of our outstanding common stock is beneficially owned by a small group of principal stockholders and their affiliates, including Stephens Inc., Stephens Group, BlackRock, Inc. and Dimensional Fund Advisors LP. Large holders, such as these, may be able to affect matters requiring approval by Company stockholders, including the election of directors and the approval of mergers or other business combination transactions. The concentration of ownership of our shares of common stock by the relatively small number of investors and hedge funds may:
• Have significant influence in determining the outcome of any matter submitted to stockholders for approval, including the election of directors, mergers, consolidations, and the sale of all or substantially of our assets or other significant corporate actions;
• Delay or deter a change of control of the Company;
• Deprive stockholders of an opportunity to receive a premium for their shares as part of a sale of the Company; and
• Affect the market price volatility and liquidity of our shares of common stock.
The interests of these investors and their respective affiliates may differ from or be adverse to the interests of our other stockholders. If any of these investors sells a substantial number of shares in the public market, the market price of our shares could fall. The perception among the public that these sales will occur could also contribute to a decline in the market price of our shares.
Risk Related to Laws and Regulations
We may expand our retail or credit offerings and become subject to different operating, regulatory or legal requirements. In addition to the retail and consumer finance products we currently offer, we may offer other products and services in the future, including new financing products and services. These products and services may require additional or different operating and compliance systems or have additional or different legal or regulatory requirements than the products and services we currently offer.
To the extent we undertake expansion into additional states that allow for direct consumer lending, and do not have the proper legal and regulatory compliance infrastructure, consumer lending licenses or personnel, or otherwise do not successfully execute such an expansion, or our customers do not positively respond to such an expansion, it could have a material adverse effect on us.
Our business could be materially adversely affected by changes in consumer protection laws and regulations. Federal and state consumer protection laws, regulations and agencies, such as the FCRA and the CFPB, heavily regulate the way we conduct business and could limit the manner in which we may offer and extend credit and collect on our accounts. Because a substantial portion of our sales are financed through our credit offerings any adverse change in the regulation of consumer credit could have a material adverse effect on us.
New laws or regulations, or new interpretations of existing laws or regulations, could limit the amount of interest or fees that may be charged on consumer credit accounts, including by reducing the maximum interest rate that can be charged in the states in which we operate, or impose limitations on our ability to collect on account balances, which could have a material adverse

Table of Contents
31
effect on us. New consumer protection laws and regulations are more likely due to the changes in the Presidency and Congress following the 2020 election. Compliance with existing and future laws or regulations, including regulations that may be applicable to us under the Dodd-Frank Act, could require the expenditure of substantial resources. Failure to comply with these laws or regulations, even if inadvertent, could result in negative publicity, fines or additional licensing expenses, any of which could result in a material adverse effect on us.
We have procedures and controls in place that we believe are reasonable to monitor compliance with the numerous federal and state laws and regulations and believe we are in compliance with such laws and regulations. However, these laws and regulations are complex, differ between jurisdictions and are often subject to interpretation. As we expand into additional jurisdictions and offer new credit products such as our direct consumer loans, the complexities grow. Compliance with these laws and regulations is expensive and requires the time and attention of management. If we do not successfully comply with laws, regulations, or policies, we could incur fines or penalties, lose existing or new customers, or suffer damage to our reputation. Changes in these laws and regulations can significantly alter our business environment, limit business operations, and increase costs of doing business, and we may not be able to predict the impact such changes would have on our profitability.
The CFPB may reshape the consumer financial laws and there continues to be uncertainty as to how the agency’s actions will impact our business. The Dodd-Frank Act comprehensively overhauled the financial services industry within the U.S. and established the CFPB. The CFPB has enforcement and rulemaking authority under certain federal consumer financial laws, including, but not limited to, the TILA, ECOA, FCRA, FDCPA, and GLBA. This means, for example, that the CFPB has the ability to adopt rules that interpret provisions of the FDCPA, potentially affecting all facets of debt collection. Recently the CFPB published a revised final rule under the FDCPA that would, among other things, limit the timing and number of calls that can be made to a consumer debtor by a third-party collection agency. This rule could impact our ability to contact our consumers and collect amounts owed. In addition, the CFPB has issued guidance in the form of bulletins on debt collection and credit furnishing activities generally, including bulletins that address furnisher requirements and the application of the CFPB’s prohibition on “unfair, deceptive, or abusive” acts or practices with respect to debt collection.
In addition, the CFPB maintains an online complaint system that allows consumers to log complaints with respect to the products we offer. The system could inform future agency decisions with respect to regulatory, enforcement, or examination focus. The CFPB is authorized to collect fines and provide consumer restitution in the event of violations of certain consumer financial service laws, engage in consumer financial education, request data, and promote the availability of financial services to under-served consumers and communities. There continues to be uncertainty as to how, or if, the CFPB and its strategies and priorities will impact our businesses and our results of operations going forward and could result in new regulatory requirements and regulatory costs for us.
Although we have committed substantial resources to enhancing our compliance programs, changes in regulatory expectations, interpretations or practices could increase the risk of enforcement actions, fines and penalties. Actions by the CFPB, FTC and various state agencies could result in requirements to alter our products and services that would make our products less attractive to consumers or impair our ability to offer them profitably. Future actions by regulators that discourage the use of products we offer or steer consumers to other products or services could result in reputational harm and a loss of customers. Should the CFPB, FTC and various state agencies change regulations adopted in the past by other regulators, or modify past regulatory guidance, our compliance costs and litigation exposure could increase. This additional focus and regulatory oversight could significantly increase operating costs.
Judicial or administrative decisions, CFPB rule-making or amendments to the Federal Arbitration Act could render the arbitration agreements we use illegal or unenforceable. Dispute arbitration provisions are commonplace in our customer credit arrangements. These provisions are designed to allow us to resolve customer disputes through individual arbitration rather than in court. Our arbitration provisions explicitly provide that all arbitrations will be conducted on an individual and not on a class basis. In the past, various courts and administrative authorities have concluded that arbitration agreements with class action waivers are unenforceable, particularly where a small dollar amount is in controversy on an individual basis.
Any judicial or administrative decisions, federal legislation or final CFPB or other administrative rule that would impair our ability to enter into and enforce consumer dispute arbitration agreements with class action waivers could significantly increase our exposure to class action litigation as well as litigation in plaintiff-friendly jurisdictions. Such litigation could have a material adverse effect on us.
We are required to comply with laws and regulations regulating extensions of credit and other dealings with customers and our failure to comply with applicable laws and regulations, or any adverse change in those laws or regulations, could have a negative impact on our business. A substantial portion of our customers finance purchases through our credit offerings. The extension of credit to consumers and related collection efforts is a highly regulated area of our business. Numerous federal and state laws impose disclosure and other requirements on the origination, servicing and enforcement of credit accounts. These laws include, but are not limited to, TILA, ECOA, the Dodd-Frank Act, FCRA, GLBA, FTCA, FDCPA, MLA, SCRA, the

Table of Contents
32
Texas Debt Collection Act and the Telephone Consumer Protection Act (“TCPA”). Our business practices, marketing and advertising terms, procedures and practices for credit applications and underwriting, terms of credit extensions and related disclosures, data privacy and protection practices, and collection practices, may be subject to periodic or special reviews by regulatory and enforcement authorities under the foregoing laws. These reviews could range from investigations of specific consumer complaints or concerns to broader inquiries into our practices generally. If, as part of these reviews, the regulatory authorities conclude that we are not complying with applicable laws or regulations, they could request or impose a wide range of sanctions and remedies including requiring changes in advertising and collection practices, changes in our credit application and underwriting practices, changes in our data privacy or protection practices, changes in the terms of our credit or other financial products (such as decreases in interest rates or fees), the imposition of fines or penalties, or the paying of restitution or the taking of other remedial action with respect to affected customers. They also could require us to stop offering some of our credit or other financial products within one or more states, or nationwide.
Negative publicity relating to any specific inquiry or investigation, regardless of whether we have violated any applicable law or regulation or the extent of any such violation, could negatively affect our reputation, our brand and our stock price, which could have a material adverse effect on us. If any deficiencies or violations of law or regulations are identified by us or asserted by any regulator or other person, or if any regulatory or enforcement authority or court requires us to change any of our practices, the correction of such deficiencies or violations, or the making of such changes, could have a material adverse effect on us. We face the risk that restrictions or limitations resulting from the enactment, change, or interpretation of federal or state laws and regulations, such as the Dodd-Frank Act, could negatively affect our business activities, require us to make significant expenditures or effectively eliminate credit products or other financial products currently offered to customers.
Any failure on our part to comply with legal requirements in connection with credit or other financial products, or in connection with servicing or collecting our accounts or otherwise dealing with consumers, could significantly impair our ability to collect the full amount of the account balances and could subject us to substantial liability for damages or penalties. The institution of any litigation of this nature, or the rendering of any judgment against us in any litigation of this nature, could have a material adverse effect on us.
We may also expand into additional jurisdictions or offer new credit products in existing jurisdictions. We must comply with the laws of each jurisdiction we operate in, which are not uniform. New or different laws in new jurisdictions into which we expand, or changes to the laws in those jurisdictions or the ones in which we currently operate, could increase our compliance costs, expose us to litigation risk or otherwise have a material adverse effect on us.
We face the risk of litigation resulting from calls and text messages in violation of the TCPA. Contacting current and prospective customers in connection with delinquent accounts and marketing efforts are parts of our business. The TCPA restricts certain calling and the use of automated SMS text messages without proper consent. This has resulted and may in the future result in civil claims against us. The scope and interpretation of the TCPA applicable to calling and texting are continuously evolving and developing, and there are differing interpretations of the TCPA among the jurisdictions in which we operate. In some cases, violations of the TCPA may be enforced by individual customers through class actions, and statutory penalties for TCPA violations range from $500 to $1,500 per violation. If we do not comply with the TCPA or if we become liable under the TCPA, we could face direct liability and our business and financial condition could be materially adversely affected.
A large number of our stores are located in the State of Texas, which subjects us to concentrated regulatory risks. Negative or unexpected legislative or regulatory changes in Texas could have a material adverse effect on us. In Texas, the Office of the Consumer Credit Commissioner (“OCCC”) issues the consumer loan licenses that permit us to offer direct consumer loans. The OCCC also regulates us as a licensee. We currently have 71 retail stores in Texas. If we fail to establish or implement a proper regulatory infrastructure to comply with Texas’ regulatory requirements, the OCCC could restrict or rescind our consumer loan licenses. A restriction on or a loss of such licenses issued could have a material adverse effect on our financial performance and cause reputational harm. Failure on our part to comply with applicable consumer lending laws of the State of Texas could also expose us to consumer litigation and regulatory enforcement action, possibly resulting in substantial penalties and claims for damages and, in certain circumstances, may subject us to injunctions, require us to refund finance charges already paid, forgo finance charges not yet paid under credit accounts, change our credit extension, servicing, collection, and marketing practices or a combination of the foregoing. Should Texas or the OCCC change laws, regulations or codes related to consumer loans, or modify past regulatory guidance, our compliance costs and litigation exposure could increase. We believe that we are in substantial compliance with the applicable consumer credit laws in the State of Texas.
Our inability to maintain our insurance licenses requirements in the states in which we operate and changes in premium and commission rates on the insurance products we sell could have a material adverse effect on us. We derive a significant portion of our revenues and operating income from the commissions we earn from the sale of various insurance products of third-party insurers to our customers. These products include credit insurance, repair service agreements and product replacement policies. Most states and many local jurisdictions in which we operate require registration and licenses to sell these products or otherwise conduct our business. These states and local jurisdictions have, in many cases, established criteria

Table of Contents
33
we must satisfy in order to obtain, maintain and renew these licenses. For example, certain states or other jurisdictions require us to meet or exceed certain operational, advertising, disclosure, collection and recordkeeping requirements and to maintain a minimum amount of net worth or equity. From time to time, we are subject to audits in these jurisdictions to ensure we are satisfying the applicable requirements in order to maintain these necessary licenses. If, for any reason, we are unable to satisfy these requirements, we might be unable to maintain our insurance licenses in the states and other jurisdictions in which we operate, we might be subject to various fines and penalties or store closures, or our requests for new or renewed licenses may be denied, any of which consequences could have a material adverse effect on us. In addition, any material claims or future material litigation involving our credit insurance agreements, repair service agreements or product replacement policies, or any decline in the commissions we retain from our sales of these insurance products, may have a material adverse effect on us. Commissions earned on our credit insurance, repair service agreement or product replacement agreement products could also be materially adversely affected by changes in statutory premium rates, commission rates, adverse claims experience and other factors.
General Risk Factors
Stock market volatility may materially adversely affect the market price of our common stock. Our common stock price has been and is likely to continue to be subject to significant volatility. A variety of factors could cause the price of our common stock to fluctuate substantially, including:
• General market fluctuations resulting from factors not directly related to our operations or the inherent value of our common stock;
• State or federal legislative or regulatory proposals, initiatives, actions or changes that are, or are perceived to be, adverse to our operations;
• Announcements of developments related to our business or our competitors;
• Fluctuations in our operating results and the provision for bad debts;
• General conditions in the consumer financial service industry, the domestic or global economy or the domestic or global credit or capital markets;
• Changes in financial estimates by securities analysts;
• Our failure to meet the expectations of securities analysts or investors;
• Negative commentary regarding us and corresponding short-selling market behavior;
• Adverse developments in our relationships with our customers or vendors;
• Legal proceedings brought against us or our officers and directors; and
• Changes in our senior management team.
Due to the volatility of our stock price, we are and may be in the future the target of securities litigation. Such lawsuits generally result in the diversion of management’s time and attention away from business operations, which could materially adversely affect us. In addition, the costs of defense and any damages resulting from such litigation, a ruling against us, or a settlement of any such litigation could materially adversely affect our financial results.
We may incur property, casualty or other losses not covered by insurance. We maintain a program of insurance coverage for various types of property, casualty and other risks. The types and amounts of insurance that we obtain vary from time to time, depending on availability, cost and our decisions with respect to risk retention. The insurance policies are subject to deductibles and exclusions that result in our retention of a level of risk on a self-insurance basis. Losses not covered by insurance could be substantial and may increase our expenses, which could harm our results of operations and financial condition.
ITEM 1B. UNRESOLVED STAFF COMMENTS.
None.
ITEM 2. PROPERTIES.
The number of stores, distribution centers/cross-dock facilities, and corporate offices we operate, together with location and square footage information, are disclosed in Part I, Item 1., Business, under the caption “Store Operations,” of this Annual Report on Form 10-K and is incorporated herein by reference.
ITEM 3. LEGAL PROCEEDINGS.
The information set forth in Part II, Item 8., in Note 12, Contingencies, of the Consolidated Financial Statements of this Annual Report on Form 10-K is incorporated herein by reference.

Table of Contents
34
ITEM 4. MINE SAFETY DISCLOSURES.
Not applicable.

Table of Contents
35
PART II
ITEM 5. MARKET FOR REGISTRANT’S COMMON EQUITY, RELATED STOCKHOLDER MATTERS AND ISSUER PURCHASES OF EQUITY SECURITIES.
Market Information and Holders
As of March 22, 2021, we had approximately 461 common stockholders of record and an estimated 5,965 beneficial owners of our common stock. The principal market for our common stock is the NASDAQ Global Select Market, where it is traded under the symbol “CONN.”
Dividends
No cash dividends were declared or paid in fiscal year 2021 or fiscal year 2020. We do not anticipate paying dividends in the foreseeable future. Any future payment of dividends will be at the discretion of our Board of Directors and will depend upon our results of operations, financial condition, cash requirements and other factors deemed relevant by the Board of Directors, including the terms of our indebtedness. Provisions in agreements governing our long-term indebtedness restrict the amount of dividends that we may pay to our stockholders. See Item 7., Management’s Discussion and Analysis of Financial Condition and Results of Operations, under the heading “Liquidity and Capital Resources.”
Securities Authorized for Issuance Under Equity Compensation Plans
The following table summarizes information as of January 31, 2021, relating to our equity compensation plans to which grants of options, restricted stock units or other rights to acquire shares of our common stock may be granted from time to time:
Number of Securities to be
Issued upon Exercise of
Outstanding Options, Warrants and Rights (a) (1)
Weighted-Average Exercise Price of
Outstanding Options, Warrants and Rights (b) (2)
Number of Securities
Remaining Available for Future
Issuance Under Equity
Compensation Plans (Excluding
Securities Reflected in Column (a))
Plan Category: Equity compensation plans approved by stockholders 1,739,640 $ 12.62 3,209,718 Equity compensation plans not approved by stockholders — — —
Total 1,739,640 $ 12.62 3,209,718
(1) Inclusive of 720,166 stock options, 749,894 restricted stock units (“RSUs”) and 269,580 performance-based RSUs (“PSUs”).
(2) The $12.62 is inclusive of the 749,894 shares related to RSUs which only have a service requirement and the 269,580 PSUs that have a service, performance and/or market requirement. Neither the RSUs nor PSUs have an exercise price. The weighted-average exercise price of the 720,166 outstanding stock options is $30.49.

Table of Contents
36
Performance Graph
The following graph compares the cumulative total stockholder return on our common stock for the last five fiscal years with the cumulative total returns of the NASDAQ U.S. Stock Market Index and a customized peer group index comprised of Restoration Hardware, First Cash, Aaron’s, Rent-A-Center, La-Z-Boy, Sleep Number, Ethan Allen, EZCORP, Haverty Furniture and Tuesday Morning (the “Peer Group”). The graph assumes an investment of $100 at the close of trading on January 31, 2016, and reinvestment of any dividends. The stock performance shown below is based solely on historical data and is not necessarily indicative of future performance.
Base Period Value for the Fiscal Years Ended January 31,
January 31,
2016 2017 2018 2019 2020 2021 Company/Index: Conn’s, Inc. $ 100.00 $ 85.63 $ 270.29 $ 169.97 $ 71.10 $ 127.68 NASDAQ U.S. Stock Market Index $ 100.00 $ 123.23 $ 164.43 $ 163.31 $ 207.46 $ 298.92 Peer Group $ 100.00 $ 99.88 $ 158.26 $ 181.54 $ 222.76 $ 313.25
The information set forth under the heading “Performance Graph” is not deemed to be “soliciting material” or to be “filed” with the SEC or subject to the SEC’s proxy rules or to the liabilities of Section 18 of the Exchange Act, and the graph shall not be deemed to be incorporated into any of our prior or subsequent filings under the Securities Act of 1933, as amended (“Securities Act”), or the Exchange Act.
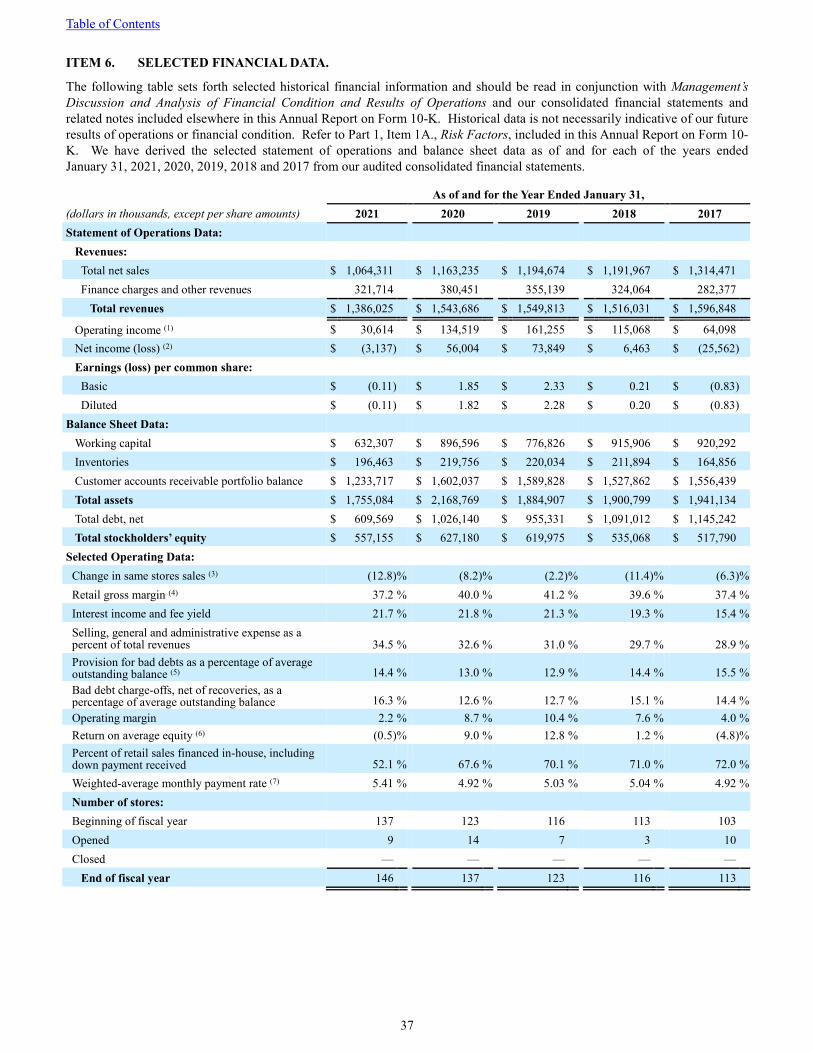
Table of Contents
37
ITEM 6. SELECTED FINANCIAL DATA.
The following table sets forth selected historical financial information and should be read in conjunction with Management’s Discussion and Analysis of Financial Condition and Results of Operations and our consolidated financial statements and related notes included elsewhere in this Annual Report on Form 10-K. Historical data is not necessarily indicative of our future results of operations or financial condition. Refer to Part 1, Item 1A., Risk Factors, included in this Annual Report on Form 10-K. We have derived the selected statement of operations and balance sheet data as of and for each of the years ended January 31, 2021, 2020, 2019, 2018 and 2017 from our audited consolidated financial statements.
As of and for the Year Ended January 31, (dollars in thousands, except per share amounts) 2021 2020 2019 2018 2017 Statement of Operations Data:
Revenues: Total net sales $ 1,064,311 $ 1,163,235 $ 1,194,674 $ 1,191,967 $ 1,314,471 Finance charges and other revenues 321,714 380,451 355,139 324,064 282,377
Total revenues $ 1,386,025 $ 1,543,686 $ 1,549,813 $ 1,516,031 $ 1,596,848 Operating income (1) $ 30,614 $ 134,519 $ 161,255 $ 115,068 $ 64,098 Net income (loss) (2) $ (3,137) $ 56,004 $ 73,849 $ 6,463 $ (25,562) Earnings (loss) per common share:
Basic $ (0.11) $ 1.85 $ 2.33 $ 0.21 $ (0.83) Diluted $ (0.11) $ 1.82 $ 2.28 $ 0.20 $ (0.83)
Balance Sheet Data: Working capital $ 632,307 $ 896,596 $ 776,826 $ 915,906 $ 920,292 Inventories $ 196,463 $ 219,756 $ 220,034 $ 211,894 $ 164,856 Customer accounts receivable portfolio balance $ 1,233,717 $ 1,602,037 $ 1,589,828 $ 1,527,862 $ 1,556,439 Total assets $ 1,755,084 $ 2,168,769 $ 1,884,907 $ 1,900,799 $ 1,941,134 Total debt, net $ 609,569 $ 1,026,140 $ 955,331 $ 1,091,012 $ 1,145,242 Total stockholders’ equity $ 557,155 $ 627,180 $ 619,975 $ 535,068 $ 517,790
Selected Operating Data: Change in same stores sales (3) (12.8) % (8.2) % (2.2) % (11.4) % (6.3) % Retail gross margin (4) 37.2 % 40.0 % 41.2 % 39.6 % 37.4 % Interest income and fee yield 21.7 % 21.8 % 21.3 % 19.3 % 15.4 % Selling, general and administrative expense as a percent of total revenues 34.5 % 32.6 % 31.0 % 29.7 % 28.9 % Provision for bad debts as a percentage of average outstanding balance (5) 14.4 % 13.0 % 12.9 % 14.4 % 15.5 % Bad debt charge-offs, net of recoveries, as a percentage of average outstanding balance 16.3 % 12.6 % 12.7 % 15.1 % 14.4 % Operating margin 2.2 % 8.7 % 10.4 % 7.6 % 4.0 % Return on average equity (6) (0.5) % 9.0 % 12.8 % 1.2 % (4.8) % Percent of retail sales financed in-house, including down payment received 52.1 % 67.6 % 70.1 % 71.0 % 72.0 % Weighted-average monthly payment rate (7) 5.41 % 4.92 % 5.03 % 5.04 % 4.92 % Number of stores: Beginning of fiscal year 137 123 116 113 103 Opened 9 14 7 3 10 Closed — — — — —
End of fiscal year 146 137 123 116 113

Table of Contents
38
(1) Operating income includes the following charges and credits:
Year Ended January 31, (in thousands) 2021 2020 2019 2018 2017 Store and facility closure and relocation costs $ — $ 1,933 $ — $ 2,381 $ 1,089 Legal and professional fees, securities-related litigation, a legal judgment and other legal matters 3,589 — 5,100 1,177 101
Indirect tax audit reserve — — 1,943 2,595 1,434 Impairment from disposal — — — — 1,986
Employee severance 2,737 — 737 1,317 1,868 Write-off of capitalized software costs — 1,209 — 5,861 —
Charges and credits $ 6,326 $ 3,142 $ 7,780 $ 13,331 $ 6,478
(2) Net income (loss) includes pre-tax loss (gain) from extinguishment of debt for fiscal years 2021, 2020, 2019 and 2018 of $(0.4) million, $1.1 million, $1.8 million and $3.3 million, respectively.
(3) Change in same store sales is calculated by comparing the reported sales for all stores that were open during both comparative fiscal years, starting in the first period in which the store has been open for a full quarter. Sales from closed stores, if any, are removed from each period. Sales from relocated stores have been included in each period as each such store was relocated within the same general geographic market. Sales from expanded stores have also been included in each period.
(4) Retail gross margin percentage is defined as total net sales, which includes product sales, repair service agreement commissions, and service revenues, less cost of goods sold divided by total net sales. The presentation of our retail gross margin and costs and expenses may not be comparable to other retailers since we include delivery, transportation and handling costs in cost of goods sold, and we include the cost of merchandising our products in selling, general and administrative expense (“SG&A”). Other retailers may treat such costs differently.
(5) Amount does not include retail segment provision for bad debts.
(6) Return on average equity is calculated as net income (loss) divided by the average of the beginning and ending equity.
(7) Represents the weighted-average of monthly gross cash collections received on the credit portfolio as a percentage of the average monthly beginning portfolio balance for each period.

Table of Contents
39
ITEM 7. MANAGEMENT’S DISCUSSION AND ANALYSIS OF FINANCIAL CONDITION AND RESULTS OF OPERATIONS.
Overview
We continue to monitor the evolving nature of COVID-19 and respond to its impact on our business. We have experienced and continue to experience challenges related to the pandemic. These challenges have increased the complexity of our business and impacted our supply chain and sales for fiscal year 2021 and we expect it to continue into fiscal year 2022. Increased complexity, supply chain issues and reduced sales will likely continue until the effects of COVID-19 diminish. The full impact of COVID-19 remains uncertain and will depend on future developments, including the duration and spread of the pandemic and related actions taken by federal, state and local government officials to prevent and manage disease spread, all of which are uncertain and unpredictable.
This section provides a discussion of our historical financial condition, cash flows and results of operations for the periods indicated herein. We encourage you to read this Management’s Discussion and Analysis of Financial Condition and Results of Operations in conjunction with the consolidated financial statements and related notes included herein and the discussion in Item 1. Business of this annual report on Form 10-K. This discussion contains forward-looking statements that involve numerous risks and uncertainties. The forward-looking statements are subject to a number of important factors, including those factors discussed in Item 1A. Risk Factors and Part I Forward-Looking Statements that could cause actual results to differ materially from the results described or implied by such forward-looking statements.
Our fiscal year ends on January 31. References to a fiscal year refer to the calendar year in which the fiscal year ends.
Executive Summary
Total revenues were $1.39 billion for fiscal year 2021 compared to $1.54 billion for fiscal year 2020, a decrease of $157.7 million or 10.2%. Retail revenues were $1.07 billion for fiscal year 2021 compared to $1.16 billion for fiscal year 2020, a decrease of $98.9 million or 8.5%. The decrease in retail revenue was primarily driven by a decrease in same store sales of 12.8% and a decrease in RSA commissions, partially offset by new store sales growth. The decrease in same store sales reflects proactive tightening of underwriting standards, reductions in store hours, state mandated stay-at-home orders and industry wide supply chain disruptions in certain product categories, each of which was the result of the COVID-19 pandemic. Credit revenues were $320.9 million for the fiscal year 2021 compared to $379.6 million for fiscal year 2020, a decrease of $58.7 million or 15.5%. The decrease in credit revenue was primarily due to a decrease of 11.0% in the average outstanding balance of the customer accounts receivable portfolio, a decrease in insurance commissions due to a decline in the balance of sale of our in-house credit financing and a decrease in insurance retrospective income. The yield rate for the year ended January 31, 2021 was 21.7% compared to 21.8% for the year ended January 31, 2020.
Retail gross margin for fiscal year 2021 was 37.2%, a decrease of 280 basis points from the 40.0% reported in fiscal year 2020. The year-over-year decrease in retail gross margin was primarily driven by the impact of fixed logistics costs on lower sales, a decrease in RSA commissions and retrospective income and a shift in sales from higher margin products to lower margin products.
SG&A for fiscal year 2021 was $478.8 million compared to $503.0 million for fiscal year 2020, a decrease of $24.2 million, or 4.8%, over the prior year. The SG&A decrease in the retail segment was primarily due to a decrease in advertising, labor and general operating costs partially offset by an increase in occupancy costs and corporate overhead allocation. The SG&A decrease in the credit segment was primarily due to a decrease in labor costs and third-party legal expenses partially offset by an increase in corporate overhead allocation. The increase in the corporate overhead allocation made to each of the segments was driven by an increase in employee incentive compensation costs.
Provision for bad debts was $202.0 million for fiscal year 2021 compared to $205.2 million in fiscal year 2020, a decrease of $3.2 million, or 1.6%. The decrease was driven by a decrease in the allowance for bad debts during the year ended January 31, 2021 compared to an increase during the year ended January 31, 2020, partially offset by an increase in net charge-offs of $28.0 million. The decrease in the allowance for bad debts was primarily driven by the year-over-year decrease in the customer accounts receivable portfolio partially offset by a $42.5 million increase driven by an increase in forecasted unemployment rates stemming from the COVID-19 pandemic and the impact of COVID-19 on portfolio performance related to accounts that received a COVID-19 deferral.
Interest expense decreased to $50.4 million for fiscal year 2021 compared to $59.1 million for fiscal year 2020, a decrease of $8.7 million, or 14.7%. The decrease was driven by a lower weighted average cost of borrowing and a lower average outstanding balance of debt.
Net loss for fiscal year 2021 was $3.1 million, or $0.11 per diluted share, compared to net income of $56.0 million, or $1.82 per diluted share, for fiscal year 2020.

Table of Contents
40
How We Evaluate Our Operations
Senior management focuses on certain key indicators to monitor our performance including:
• Same store sales - Our management considers same store sales, which consists of both brick and mortar and e-commerce sales, to be an important indicator of our performance because they are important to our attempts to leverage our SG&A costs, which include rent and other store expenses, and they have a direct impact on our total net sales, net income, cash and working capital. Same store sales is calculated by comparing the reported sales for all stores that were open during both comparative fiscal years, starting in the first period in which the store has been open for a full quarter. Sales from closed stores, if any, are removed from each period. Sales from relocated stores have been included in each period as each such store was relocated within the same general geographic market. Sales from expanded stores have also been included in each period.
• Retail gross margin - Our management views retail gross margin as a key indicator of our performance because it reflects our pricing power relative to the prices we pay for our products. Retail gross margin is calculated by comparing retail total net sales to the cost of goods sold.
• 60+ Day Delinquencies - Our management views customer account delinquencies as a key indicator of our performance because it is a reflection of the quality of our credit portfolio, it drives future credit performance and credit offerings, and it impacts the interest rates we pay on our asset-backed securitizations. Delinquencies are measured as the percentage of balances that are 60+ days past due.
• Net Yield - Our management considers yield to be a key performance metric because it drives future credit decisions and credit offerings and directly impacts our net income. Yield reflects the amount of interest we receive from our portfolio.
Company Initiatives
In fiscal year 2021, we took decisive actions to respond to the COVID-19 pandemic and focused on supporting our employees, customers, and communities, while de-risking our business and enhancing our balance sheet. Our financial results demonstrate the resiliency of our business model, which is supported by the benefits of our home related product focus and the diversity of our financing options. This allowed us to mitigate credit risk associated with the COVID-19 pandemic, while supporting retail sales through our third-party partnerships. We delivered the following financial and operational results in fiscal year 2021:
Fiscal Year 2021 Financial Highlights:
• Grew cash and third-party credit sales by 32%, reflecting strong demand for home-related products and our ability to serve a broader customer segment;
• Same store sales declined 12.8% for the fiscal year, primarily due to a nearly 22.9% decline in sales financed by Conn’s in-house credit because of tighter underwriting associated with the COVID-19 crisis;
• Increased e-commerce sales by $13.7 million, or 109.4% during fiscal year 2021, compared to the prior fiscal year period;
• Improved net cash provided by operating activities to $462.1 million for the fiscal year 2021 as compared to $80.1 million for fiscal year 2020;
• Reduced overall debt balance by $416.6 million as compared to January 31, 2020, representing the lowest level in seven fiscal years;
• Carrying value of customer accounts receivable 60+ days past due at January 31, 2021 24% lower than the prior fiscal year period; and
• Carrying value of re-aged customer accounts receivable at January 31, 2021 33% lower than the prior fiscal year period.
Management’s Response to the COVID-19 Pandemic:
We responded to the COVID-19 pandemic by focusing on protecting the health and safety of our customers, employees, and communities. We made adjustments to respond to national, state and local restrictions on retail sales activities, including some such restrictions that uniquely affected consumer retail companies with in-person sales and purchases. Despite these unprecedented challenges, the Company continued to offer, sell and deliver essential home merchandise as consumers also adjusted to the societal and economic impacts of the pandemic. Throughout fiscal year 2021, the Company successfully executed the following operational changes in the face of the pandemic:
• Instituted health and safety measures, including enhanced cleaning in our stores and offices, a mask requirement for in-store personnel, and social distancing;

Table of Contents
41
• Kept a majority of stores open while observing local and state emergency declaration restrictions;
• Temporarily increased hourly wages by $2 per hour to support our front-line employees and implemented a work from home program for our corporate teams;
• Implemented payment deferral programs to provide relief to credit customers who were economically impacted by COVID-19; and
• Tightened underwriting standards to control delinquencies and charge-offs, which included reducing originations of higher risk applicants, selectively increasing down payments and lowering credit limits
Despite the challenges presented by COVID-19 during the fiscal year 2021, we believe we are at an inflection point in our growth strategy and have identified the following strategic priorities for fiscal year 2022:
• Increase net income by improving performance across our core operational financial metrics: same store sales, retail margin, portfolio yield, charge-off rate and interest expense;
• Grow sales by leveraging the best mix of Conn’s in-house financing and our multiple third-party credit options;
• Increase e-commerce sales by accelerating investments in our digital and e-commerce offerings;
• Continue to refine and enhance our underwriting platform; and
• Open 9 to 11 stores in our current geographic footprint to leverage our existing infrastructure.
Results of Operations
The following tables present certain financial and other information, on a consolidated basis:
Consolidated: Year Ended January 31, Change
(in thousands) 2021 2020 2019 2021 vs.
2020 2020 vs.
2019 Revenues: Total net sales $ 1,064,311 $ 1,163,235 $ 1,194,674 $ (98,924) $ (31,439) Finance charges and other revenues 321,714 380,451 355,139 (58,737) 25,312
Total revenues 1,386,025 1,543,686 1,549,813 (157,661) (6,127) Costs and expenses: Cost of goods sold 668,315 697,784 702,135 (29,469) (4,351) Selling, general and administrative expense 478,767 503,024 480,561 (24,257) 22,463 Provision for bad debts 202,003 205,217 198,082 (3,214) 7,135 Charges and credits 6,326 3,142 7,780 3,184 (4,638)
Total costs and expenses 1,355,411 1,409,167 1,388,558 (53,756) 20,609 Operating income 30,614 134,519 161,255 (103,905) (26,736)
Interest expense 50,381 59,107 62,704 (8,726) (3,597) (Gain) loss on extinguishment of debt (440) 1,094 1,773 (1,534) (679)
Income (loss) before income taxes (19,327) 74,318 96,778 (93,645) (22,460) Provision (benefit) for income taxes (16,190) 18,314 22,929 (34,504) (4,615)
Net income (loss) $ (3,137) $ 56,004 $ 73,849 $ (59,141) $ (17,845)
Supplementary Operating Segment Information
Operating segments are defined as components of an enterprise that engage in business activities and for which discrete financial information is available that is evaluated on a regular basis by the chief operating decision maker to make decisions about how to allocate resources and assess performance. We are a leading specialty retailer and offer a broad selection of quality, branded durable consumer goods and related services in addition to a proprietary credit solution for our core credit-constrained consumers. We have two operating segments: (i) retail and (ii) credit. Our operating segments complement one another. The retail segment operates primarily through our stores and website and its product offerings include furniture and mattresses, home appliances, consumer electronics and home office products from leading global brands across a wide range of price points. Our credit segment offers affordable financing solutions to a large, under-served population of credit-constrained consumers who typically have limited credit alternatives. Our operating segments provide customers the opportunity to comparison shop across brands with confidence in our competitive prices as well as affordable monthly payment options, next

Table of Contents
42
day delivery and installation in the majority of our markets, and product repair service. We believe our large, attractively merchandised retail stores and credit solutions offer a distinctive value proposition compared to other retailers that target our core customer demographic. The operating segments follow the same accounting policies used in our consolidated financial statements.
We evaluate a segment’s performance based upon operating income (loss). SG&A includes the direct expenses of the retail and credit operations, allocated corporate overhead expenses, and a charge to the credit segment to reimburse the retail segment for expenses it incurs related to occupancy, personnel, advertising and other direct costs of the retail segment which benefit the credit operations by sourcing credit customers and collecting payments. The reimbursement received by the retail segment from the credit segment is calculated using an annual rate of 2.5% multiplied by the average outstanding portfolio balance for each applicable period.
The following table represents total revenues, costs and expenses, operating income (loss) and income (loss) before taxes attributable to these operating segments for the periods indicated:
Retail Segment: Year Ended January 31, Change
(dollars in thousands) 2021 2020 2019 2021 vs.
2020 2020 vs.
2019 Revenues: Product sales $ 973,031 $ 1,042,424 $ 1,078,635 $ (69,393) $ (36,211) Repair service agreement commissions 78,838 106,997 101,928 (28,159) 5,069 Service revenues 12,442 13,814 14,111 (1,372) (297)
Total net sales 1,064,311 1,163,235 1,194,674 (98,924) (31,439) Finance charges and other 816 810 447 6 363
Total revenues 1,065,127 1,164,045 1,195,121 (98,918) (31,076) Costs and expenses: Cost of goods sold 668,315 697,784 702,135 (29,469) (4,351) Selling, general and administrative expense (1) 335,954 346,108 328,628 (10,154) 17,480 Provision for bad debts 443 905 1,009 (462) (104) Charges and credits 4,092 1,933 2,980 2,159 (1,047)
Total costs and expenses 1,008,804 1,046,730 1,034,752 (37,926) 11,978 Operating income $ 56,323 $ 117,315 $ 160,369 $ (60,992) $ (43,054)
Number of stores: Beginning of fiscal year 137 123 116 Opened 9 14 7
End of fiscal year 146 137 123
Credit Segment: Year Ended January 31, Change
(in thousands) 2021 2020 2019 2021 vs.
2020 2020 vs.
2019 Revenues: Finance charges and other revenues $ 320,898 $ 379,641 $ 354,692 $ (58,743) $ 24,949 Costs and expenses: Selling, general and administrative expense (1) 142,813 156,916 151,933 (14,103) 4,983 Provision for bad debts 201,560 204,312 197,073 (2,752) 7,239 Charges and credits 2,234 1,209 4,800 1,025 (3,591)
Total costs and expenses 346,607 362,437 353,806 (15,830) 8,631 Operating income (loss) (25,709) 17,204 886 (42,913) 16,318
Interest expense 50,381 59,107 62,704 (8,726) (3,597) (Gain) loss on extinguishment of debt (440) 1,094 1,773 (1,534) (679)
Loss before income taxes $ (75,650) $ (42,997) $ (63,591) $ (32,653) $ 20,594

Table of Contents
43
(1) For the years ended January 31, 2021, 2020 and 2019, the amount of overhead allocated to each segment reflected in SG&A was $32.0 million, $30.0 million and $36.4 million, respectively. For the years ended January 31, 2021, 2020 and 2019, the amount of reimbursement made to the retail segment by the credit segment was $34.8 million, $39.1 million and $38.1 million, respectively.
Year ended January 31, 2021 compared to the year ended January 31, 2020
Revenues. The following table provides an analysis of retail net sales by product category in each period, including repair service agreement commissions and service revenues, expressed both in dollar amounts and as a percent of total net sales:
Year Ended January 31, % Same Store (dollars in thousands) 2021 % of Total 2020 % of Total Change Change % Change Furniture and mattress $ 322,770 30.3 % $ 370,931 31.9 % $ (48,161) (13.0) % (17.5) % Home appliance 390,964 36.7 360,441 31.0 30,523 8.5 3.8 Consumer electronics 172,932 16.2 221,449 19.0 (48,517) (21.9) (25.2) Home office 65,405 6.1 73,074 6.3 (7,669) (10.5) (14.2) Other 20,960 2.0 16,529 1.4 4,431 26.8 22.6
Product sales 973,031 91.3 1,042,424 89.6 (69,393) (6.7) (10.9) Repair service agreement
commissions (1) 78,838 7.4 106,997 9.2 (28,159) (26.3) (26.9) Service revenues 12,442 1.3 13,814 1.2 (1,372) (9.9)
Total net sales $ 1,064,311 100.0 % $ 1,163,235 100.0 % $ (98,924) (8.5) % (12.8) %
(1) The total change in sales of repair service agreement commissions includes retrospective commissions, which are not reflected in the change in same store sales.
The decrease in product sales for the year ended January 31, 2021 was primarily due to a decrease in same store sales of 12.8% and a decrease in RSA commissions, partially offset by new store growth. The decrease in same store sales reflects proactive tightening of underwriting standards, reductions in store hours, state mandated stay-at-home orders and industry wide supply chain disruptions in certain product categories, each of which was the result of the COVID-19 pandemic.
The following table provides the change of the components of finance charges and other revenues:
Year Ended January 31, (in thousands) 2021 2020 Change Interest income and fees $ 303,209 $ 341,224 $ (38,015) Insurance income 17,689 38,417 (20,728) Other revenues 816 810 6
Finance charges and other revenues $ 321,714 $ 380,451 $ (58,737)
The decrease in finance charges and other revenues was primarily due to a decrease of 11.0% in the average outstanding balance of the customer accounts receivable portfolio, a decrease in insurance commissions due to a decline in the balance of sale of our in-house credit financing and a decrease in insurance retrospective income. The yield rate for the year ended January 31, 2021 was 21.7% compared to 21.8% for the year ended January 31, 2020.
The following table provides key portfolio performance information:
Year Ended January 31, (dollars in thousands) 2021 2020 Change Interest income and fees $ 303,209 $ 341,224 $ (38,015) Net charge-offs (227,134) (196,795) (30,339) Interest expense (50,381) (59,107) 8,726
Net portfolio income $ 25,694 $ 85,322 $ (59,628) Average outstanding portfolio balance $ 1,395,428 $ 1,567,878 $ (172,450) Interest income and fee yield 21.7 % 21.8 % Net charge-off % 16.3 % 12.6 %

Table of Contents
44
Retail Gross Margin
Year Ended January 31, (dollars in thousands) 2021 2020 Change Retail total net sales $ 1,064,311 $ 1,163,235 $ (98,924) Cost of goods sold 668,315 697,784 (29,469)
Retail gross margin $ 395,996 $ 465,451 $ (69,455) Retail gross margin percentage 37.2 % 40.0 %
The year-over-year decrease in retail gross margin was primarily driven by the impact of fixed logistics costs on lower sales, a decrease in RSA commissions and retrospective income and a shift in sales from higher margin products to lower margin products.
Selling, General and Administrative Expense
Year Ended January 31, (dollars in thousands) 2021 2020 Change Retail segment $ 335,954 $ 346,108 $ (10,154) Credit segment 142,813 156,916 (14,103)
Selling, general and administrative expense - Consolidated $ 478,767 $ 503,024 $ (24,257) Selling, general and administrative expense as a percent of total revenues 34.5 % 32.6 %
The SG&A decrease in the retail segment was primarily due to a decrease in advertising, labor and general operating costs partially offset by an increase in occupancy costs and corporate overhead allocation. The SG&A decrease in the credit segment was primarily due to a decrease in labor costs and third-party legal expenses partially offset by an increase in corporate overhead allocation. As a percent of average total customer portfolio balance, SG&A for the credit segment for the year ended January 31, 2021 increased 20 basis points as compared to the year ended January 31, 2020. The increase in the corporate overhead allocation made to each of the segments was driven by an increase in employee incentive compensation costs.
Provision for Bad Debts
Year Ended January 31, (dollars in thousands) 2021 2020 Change Retail segment $ 443 $ 905 $ (462) Credit segment 201,560 204,312 (2,752)
Provision for bad debts - Consolidated $ 202,003 $ 205,217 $ (3,214) Provision for bad debts - Credit segment, as a percent of average
outstanding portfolio balance 14.4 % 13.0 % The provision for bad debts decreased to $202.0 million for the year ended January 31, 2021 from $205.2 million for the year ended January 31, 2020, a decrease of $3.2 million. The decrease was driven by a decrease in the allowance for bad debts during the year ended January 31, 2021 compared to an increase during the year ended January 31, 2020, partially offset by an increase in net charge-offs of $28.0 million. The decrease in the allowance for bad debts was primarily driven by the year-over-year decrease in the customer accounts receivable portfolio partially offset by a $42.5 million increase driven by an increase in forecasted unemployment rates stemming from the COVID-19 pandemic and the impact of COVID-19 on portfolio performance related to accounts that received a COVID-19 deferral.

Table of Contents
45
Charges and Credits
Year Ended January 31, (in thousands) 2021 2020 Change Store and facility closure and relocation costs $ — $ 1,933 $ (1,933) Legal and professional fees, securities-related litigation, a legal judgment and other legal matters 3,589 — 3,589
Employee severance 2,737 — 2,737 Write-off of capitalized software costs — 1,209 (1,209) $ 6,326 $ 3,142 $ 3,184
During the year ended January 31, 2021, we recognized $3.6 million in professional fees associated with non-recurring expenses and $2.7 million in severance costs related to a change in the executive management team. During the year ended January 31, 2020, we recognized $3.2 million in impairments from the exiting of certain leases upon the relocation of three distribution centers into one facility. These facility closure costs were offset by a $0.7 million gain from increased sublease income related to the consolidation of our corporate headquarters and a $0.6 million gain from the sale of a cross-dock. In addition, we recognized $1.2 million in impairments of software costs for a loan management system that was abandoned during the third quarter of fiscal year 2020 related to the implementation of a new loan management system.
Interest Expense
Interest expense decreased to $50.4 million for the year ended January 31, 2021 from $59.1 million for the year ended January 31, 2020, a decrease of $8.7 million. The decrease was driven by a lower weighted average cost of borrowing and a lower average outstanding balance of debt.
(Gain) loss on Extinguishment of Debt
During the year ended January 31, 2021, we incurred a gain of $0.4 million related to the retirement of $85.8 million aggregate principal amount of our 7.250% senior notes due 2022 (“Senior Notes”) in connection with a tender offer. During the year ended January 31, 2020, we wrote-off $1.1 million of debt issuance costs related to an amendment of our revolving credit facility that effected the resignation of Bank of America, N.A. as agent and lender, and replaced it with JPMorgan Chase Bank, N.A. as agent.
Provision (benefit) for Income Taxes
Year Ended January 31, (dollars in thousands) 2021 2020 Change Provision (benefit) for income taxes $ (16,190) $ 18,314 $ (34,504) Effective tax rate 83.8 % 24.6 % The decrease in the income tax expense for the year ended January 31, 2021 compared to the year ended January 31, 2020 was primarily driven by a $93.6 million decrease of pre-tax book income at the statutory rate of 21%. In addition, a benefit of $14.9 million was also recognized for the year ended January 31, 2021 as a result of net operating loss provisions within the CARES Act that provide for a five year carryback of losses.

Table of Contents
46
Year ended January 31, 2020 compared to the year ended January 31, 2019
Revenues. The following table provides an analysis of retail net sales by product category in each period, including RSA commissions and service revenues, expressed both in dollar amounts and as a percent of total net sales:
Years Ended January 31, % Same store (dollars in thousands) 2020 % of Total 2019 % of Total Change Change % change Furniture and mattress $ 370,931 31.9 % $ 382,975 32.1 % $ (12,044) (3.1) % (7.8) % Home appliance 360,441 31.0 332,609 27.8 27,832 8.4 2.3 Consumer electronics 221,449 19.0 262,088 21.9 (40,639) (15.5) (20.4) Home office 73,074 6.3 86,260 7.2 (13,186) (15.3) (18.4) Other 16,529 1.4 14,703 1.2 1,826 12.4 4.9
Product sales 1,042,424 89.6 1,078,635 90.2 (36,211) (3.4) (8.3) Repair service agreement
commissions (1) 106,997 9.2 101,928 8.5 5,069 5.0 (7.3) Service revenues 13,814 1.2 14,111 1.3 (297) (2.1)
Total net sales $ 1,163,235 100.0 % $ 1,194,674 100.0 % $ (31,439) (2.6) % (8.2) %
(1) The total change in sales of repair service agreement commissions includes retrospective commissions, which are not reflected in the change in same store sales.
The decrease in product sales for the year ended January 31, 2020 was primarily due to a decrease in same store sales of 8.2%, partially offset by new store growth. The decrease in same store sales was 14.0% in markets impacted by Hurricane Harvey and 7.1% in markets not impacted by Hurricane Harvey. We believe the decrease in markets impacted by Hurricane Harvey were impacted by rebuilding efforts during the year ended January 31, 2019. The decrease in same store sales reflects a combination of significant price deflation for premium large screen televisions and an increase in production by second- and third-tier manufacturers, which has made cash purchases of large screen televisions more accessible to our core customer, negatively impacted same store sales during the year ended January 31, 2020. In addition, underwriting adjustments made during the year ended January 31, 2020 further negatively impacted same store sales.
The following table provides the change of the components of finance charges and other revenues:
Year Ended January 31, (in thousands) 2020 2019 Change Interest income and fees $ 341,224 $ 325,136 $ 16,088 Insurance income 38,417 29,556 8,861 Other revenues 810 447 363
Finance charges and other revenues $ 380,451 $ 355,139 $ 25,312
The increase in interest income and fees was due to an increase in the yield rate to 21.8% for the year ended January 31, 2020 from 21.3% for the year ended January 31, 2019, an increase of 50 basis points, and by an increase of 2.7% in the average outstanding balance of the customer accounts receivable portfolio. The increase in the yield rate resulted from the origination of our higher-yielding direct loan product, which represented approximately 75% of our fiscal year 2020 originations. In addition, insurance income contributed to an increase in credit revenue over the prior year period primarily due to an increase in insurance retrospective income for the year ended January 31, 2020.

Table of Contents
47
The following table provides key portfolio performance information:
Year Ended January 31, (dollars in thousands) 2020 2019 Change Interest income and fees $ 341,224 $ 325,136 $ 16,088 Net charge-offs (196,795) (194,017) (2,778) Interest expense (59,107) (62,704) 3,597
Net portfolio loss $ 85,322 $ 68,415 $ 16,907 Average outstanding portfolio balance $ 1,567,878 $ 1,526,728 $ 41,150 Interest income and fee yield 21.8 % 21.3 % Net charge-off % 12.6 % 12.7 %
Retail Gross Margin
Year Ended January 31, (dollars in thousands) 2020 2019 Change Retail total net sales $ 1,163,235 $ 1,194,674 $ (31,439) Cost of goods sold 697,784 702,135 (4,351)
Retail gross margin $ 465,451 $ 492,539 $ (27,088) Retail gross margin percentage 40.0 % 41.2 % The decrease in retail gross margin was primarily driven by higher margins realized in fiscal year 2019 due to the one-time benefit of increases in appliance retail pricing related to tariff adjustments and the associated forward purchases of inventory, coupled with increased logistics costs to help support future growth in fiscal year 2020. The decrease was partially offset by an increase in retrospective income on our RSAs for the year ended January 31, 2020.
Selling, General and Administrative Expense
Year Ended January 31, (dollars in thousands) 2020 2019 Change Retail segment $ 346,108 $ 328,628 $ 17,480 Credit segment 156,916 151,933 4,983
Selling, general and administrative expense - Consolidated $ 503,024 $ 480,561 $ 22,463 Selling, general and administrative expense as a percent of total revenues 32.6 % 31.0 %
The SG&A increase in the retail segment was primarily due to an increase in new store occupancy costs, compensation costs and advertising expense, partially offset by a decrease in the corporate overhead allocation. The SG&A increase in the credit segment was primarily due to an increase in general operational expenses and third-party legal expenses related to collection efforts on charged off accounts. As a percent of average total customer portfolio balance, SG&A for the credit segment for the year ended January 31, 2020 remained flat at 10.0% as compared to the year ended January 31, 2019. The decrease in the corporate overhead allocation made to each of the segments was driven by a decrease in employee incentive compensation costs.
Provision for Bad Debts
Year Ended January 31, (dollars in thousands) 2020 2019 Change Retail segment $ 905 $ 1,009 $ (104) Credit segment 204,312 197,073 7,239
Provision for bad debts - Consolidated $ 205,217 $ 198,082 $ 7,135 Provision for bad debts - Credit segment, as a percent of average
outstanding portfolio balance 13.0 % 12.9 %
The provision for bad debts increased to $205.2 million for the year ended January 31, 2020 from $198.1 million for the year ended January 31, 2019, an increase of $7.1 million. The increase was driven by a greater increase in the allowance for bad
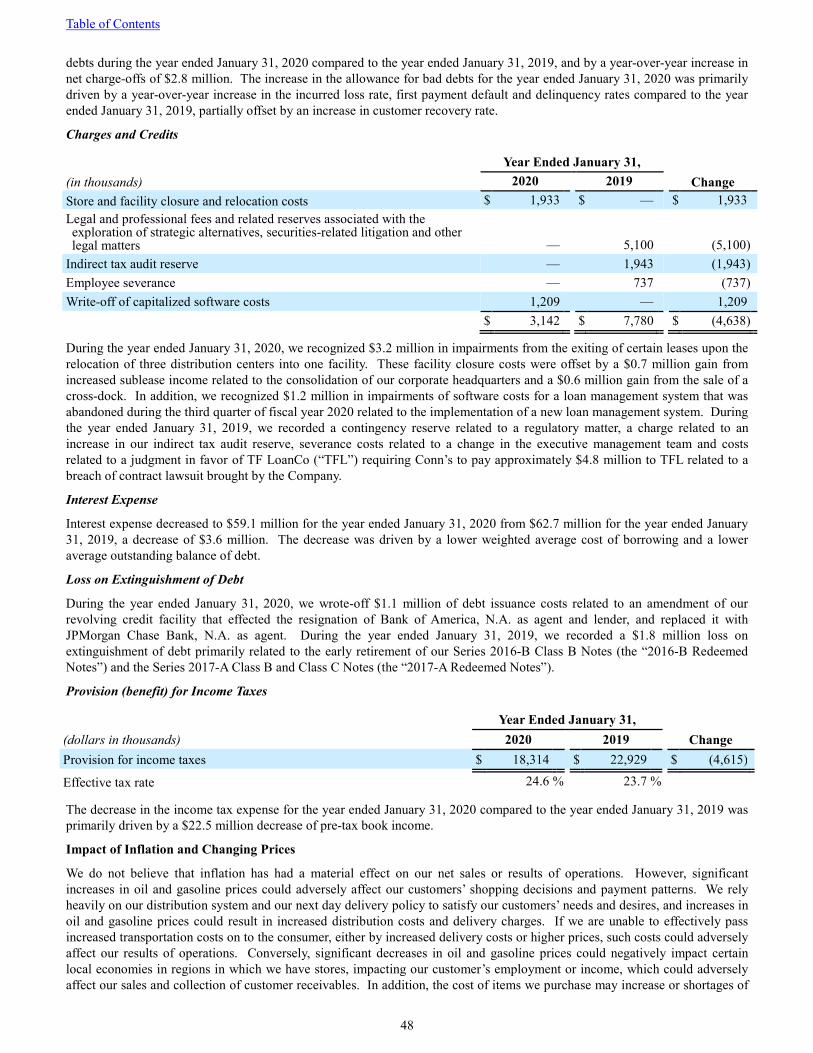
Table of Contents
48
debts during the year ended January 31, 2020 compared to the year ended January 31, 2019, and by a year-over-year increase in net charge-offs of $2.8 million. The increase in the allowance for bad debts for the year ended January 31, 2020 was primarily driven by a year-over-year increase in the incurred loss rate, first payment default and delinquency rates compared to the year ended January 31, 2019, partially offset by an increase in customer recovery rate.
Charges and Credits
Year Ended January 31, (in thousands) 2020 2019 Change Store and facility closure and relocation costs $ 1,933 $ — $ 1,933 Legal and professional fees and related reserves associated with the exploration of strategic alternatives, securities-related litigation and other legal matters — 5,100 (5,100)
Indirect tax audit reserve — 1,943 (1,943) Employee severance — 737 (737) Write-off of capitalized software costs 1,209 — 1,209 $ 3,142 $ 7,780 $ (4,638) During the year ended January 31, 2020, we recognized $3.2 million in impairments from the exiting of certain leases upon the relocation of three distribution centers into one facility. These facility closure costs were offset by a $0.7 million gain from increased sublease income related to the consolidation of our corporate headquarters and a $0.6 million gain from the sale of a cross-dock. In addition, we recognized $1.2 million in impairments of software costs for a loan management system that was abandoned during the third quarter of fiscal year 2020 related to the implementation of a new loan management system. During the year ended January 31, 2019, we recorded a contingency reserve related to a regulatory matter, a charge related to an increase in our indirect tax audit reserve, severance costs related to a change in the executive management team and costs related to a judgment in favor of TF LoanCo (“TFL”) requiring Conn’s to pay approximately $4.8 million to TFL related to a breach of contract lawsuit brought by the Company.
Interest Expense
Interest expense decreased to $59.1 million for the year ended January 31, 2020 from $62.7 million for the year ended January 31, 2019, a decrease of $3.6 million. The decrease was driven by a lower weighted average cost of borrowing and a lower average outstanding balance of debt.
Loss on Extinguishment of Debt
During the year ended January 31, 2020, we wrote-off $1.1 million of debt issuance costs related to an amendment of our revolving credit facility that effected the resignation of Bank of America, N.A. as agent and lender, and replaced it with JPMorgan Chase Bank, N.A. as agent. During the year ended January 31, 2019, we recorded a $1.8 million loss on extinguishment of debt primarily related to the early retirement of our Series 2016-B Class B Notes (the “2016-B Redeemed Notes”) and the Series 2017-A Class B and Class C Notes (the “2017-A Redeemed Notes”).
Provision (benefit) for Income Taxes
Year Ended January 31, (dollars in thousands) 2020 2019 Change Provision for income taxes $ 18,314 $ 22,929 $ (4,615) Effective tax rate 24.6 % 23.7 %
The decrease in the income tax expense for the year ended January 31, 2020 compared to the year ended January 31, 2019 was primarily driven by a $22.5 million decrease of pre-tax book income.
Impact of Inflation and Changing Prices
We do not believe that inflation has had a material effect on our net sales or results of operations. However, significant increases in oil and gasoline prices could adversely affect our customers’ shopping decisions and payment patterns. We rely heavily on our distribution system and our next day delivery policy to satisfy our customers’ needs and desires, and increases in oil and gasoline prices could result in increased distribution costs and delivery charges. If we are unable to effectively pass increased transportation costs on to the consumer, either by increased delivery costs or higher prices, such costs could adversely affect our results of operations. Conversely, significant decreases in oil and gasoline prices could negatively impact certain local economies in regions in which we have stores, impacting our customer’s employment or income, which could adversely affect our sales and collection of customer receivables. In addition, the cost of items we purchase may increase or shortages of

Table of Contents
49
these items may arise as a result of changes in trade regulations, currency fluctuations, border taxes, import tariffs, or other factors beyond our control. Throughout 2018, 2019, and 2020 the U.S. imposed tariffs on imports from several countries, including China. It is unclear if, or to what extent, those tariffs will remain under the newly elected President and Congress. While many of the products that we sell are manufactured in foreign jurisdictions, including China, such tariffs have had a minimal impact on our business to date.
Seasonality
Our business is seasonal which typically means that a higher portion of sales and operating profit are realized during the fourth quarter due primarily to the holiday selling season. In addition, during the first quarter, our portfolio performance benefits from the timing of personal income tax refunds received by our customers, which typically results in higher cash collection rates.
Quarterly Results of Operations
Our quarterly results may fluctuate materially depending on factors such as the following:
• timing of new product introductions, new store openings and store relocations;
• sales contributed by new stores;
• changes in our merchandise mix;
• increases or decreases in comparable store sales;
• changes in delinquency rates and amount of charge-offs with respect to customer accounts receivable;
• the pace of growth or decline in the customer accounts receivable balance;
• adverse weather conditions;
• shifts in the timing of certain holidays and promotions; and
• charges incurred in connection with store closures or other non-routine events.
Results for any quarter are not necessarily indicative of the results that may be achieved for any other quarter or for a full fiscal year.
Customer Accounts Receivable Portfolio
We provide in-house financing to individual consumers on a short- and medium-term basis (contractual terms generally range from 12 to 36 months) for the purchase of durable products for the home. A significant portion of our customer credit portfolio is due from customers that are considered higher-risk, subprime borrowers. Our financing is executed using contracts that require fixed monthly payments over fixed terms. We maintain a secured interest in the product financed. If a payment is delayed, missed or paid only in part, the account becomes delinquent. Our collection personnel attempt to contact a customer once their account becomes delinquent. Our loan contracts generally reflect an interest rate of between 18% and 36%. We have implemented our direct consumer loan program across all Texas, Louisiana, Tennessee and Oklahoma locations. The states of Texas, Louisiana, Tennessee and Oklahoma represent approximately 74% of our fiscal year 2021 originations, with maximum equivalent interest rates of up to 27% in Oklahoma, up to 30% in Texas and Tennessee, and up to 36% in Louisiana. In states where regulations do not generally limit the interest rate charged, our loan contracts generally reflect an interest rate between 29.99% and 35.99%. These states represented 12.7% of our fiscal year 2021 originations.
We offer qualified customers a 12-month no-interest option finance program. If the customer is delinquent in making a scheduled monthly payment or does not repay the principal in full by the end of the no-interest option program period (grace periods are provided), the account does not qualify for the no-interest provision and none of the interest earned is waived.
We regularly extend or “re-age” a portion of our delinquent customer accounts as a part of our normal collection procedures to protect our investment. Generally, extensions are granted to customers who have experienced a financial difficulty (such as the temporary loss of employment), which is subsequently resolved, and when the customer indicates a willingness and ability to resume making monthly payments. These re-ages involve modifying the payment terms to defer a portion of the cash payments currently required of the debtor to help the debtor improve his or her financial condition and eventually be able to pay the account balance. Our re-aging of customer accounts does not change the interest rate or the total principal amount due from the customer and typically does not reduce the monthly contractual payments. We may also charge the customer an extension fee, which approximates the interest owed for the time period the contract was past due. Our re-age programs consist of extensions and two payment updates, which include unilateral extensions to customers who make two full payments in three calendar months in certain states. During the second quarter of fiscal year 2021, we changed our re-age policy to increase the number of days required for a customer to qualify for a unilateral re-age. Re-ages are not granted to debtors who demonstrate a lack of intent or ability to service the obligation or have reached our limits for account re-aging. To a much lesser extent, we may provide the customer the ability to re-age their obligation by refinancing the account, which typically does not change the
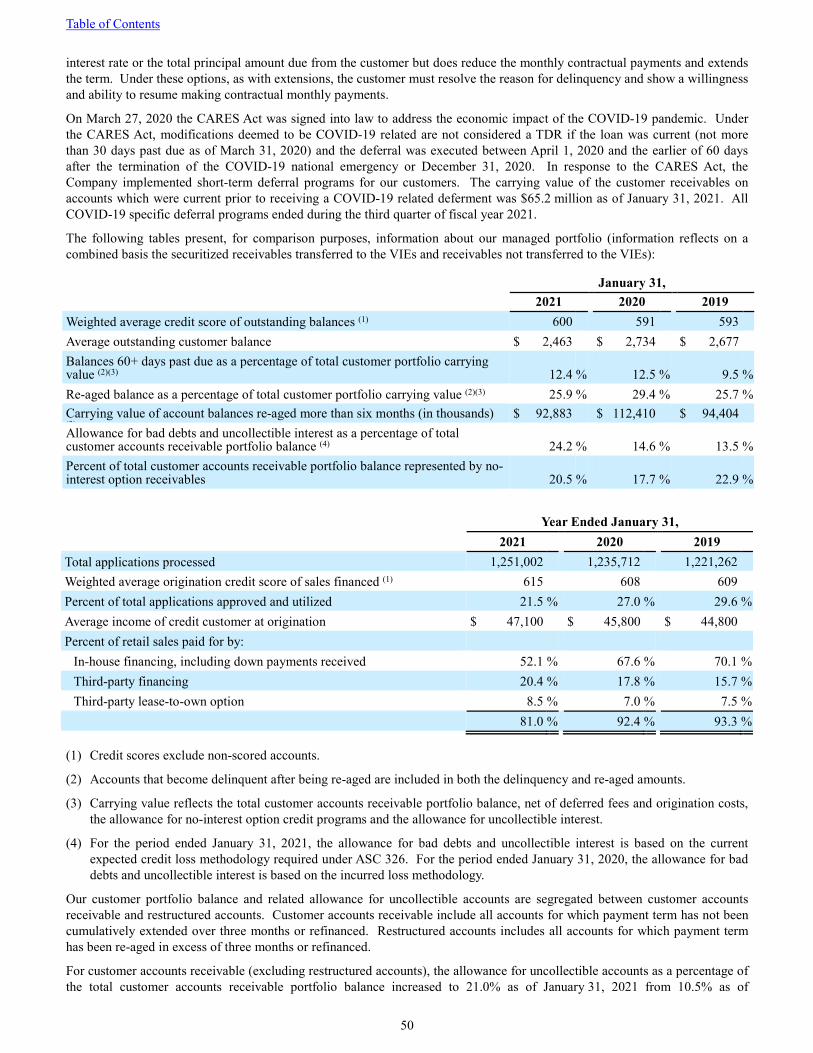
Table of Contents
50
interest rate or the total principal amount due from the customer but does reduce the monthly contractual payments and extends the term. Under these options, as with extensions, the customer must resolve the reason for delinquency and show a willingness and ability to resume making contractual monthly payments.
On March 27, 2020 the CARES Act was signed into law to address the economic impact of the COVID-19 pandemic. Under the CARES Act, modifications deemed to be COVID-19 related are not considered a TDR if the loan was current (not more than 30 days past due as of March 31, 2020) and the deferral was executed between April 1, 2020 and the earlier of 60 days after the termination of the COVID-19 national emergency or December 31, 2020. In response to the CARES Act, the Company implemented short-term deferral programs for our customers. The carrying value of the customer receivables on accounts which were current prior to receiving a COVID-19 related deferment was $65.2 million as of January 31, 2021. All COVID-19 specific deferral programs ended during the third quarter of fiscal year 2021.
The following tables present, for comparison purposes, information about our managed portfolio (information reflects on a combined basis the securitized receivables transferred to the VIEs and receivables not transferred to the VIEs):
January 31, 2021 2020 2019 Weighted average credit score of outstanding balances (1) 600 591 593 Average outstanding customer balance $ 2,463 $ 2,734 $ 2,677 Balances 60+ days past due as a percentage of total customer portfolio carrying value (2)(3) 12.4 % 12.5 % 9.5 % Re-aged balance as a percentage of total customer portfolio carrying value (2)(3) 25.9 % 29.4 % 25.7 % Carrying value of account balances re-aged more than six months (in thousands) (3)
$ 92,883 $ 112,410 $ 94,404 Allowance for bad debts and uncollectible interest as a percentage of total customer accounts receivable portfolio balance (4) 24.2 % 14.6 % 13.5 % Percent of total customer accounts receivable portfolio balance represented by no-interest option receivables 20.5 % 17.7 % 22.9 %
Year Ended January 31, 2021 2020 2019 Total applications processed 1,251,002 1,235,712 1,221,262 Weighted average origination credit score of sales financed (1) 615 608 609 Percent of total applications approved and utilized 21.5 % 27.0 % 29.6 % Average income of credit customer at origination $ 47,100 $ 45,800 $ 44,800 Percent of retail sales paid for by:
In-house financing, including down payments received 52.1 % 67.6 % 70.1 % Third-party financing 20.4 % 17.8 % 15.7 % Third-party lease-to-own option 8.5 % 7.0 % 7.5 %
81.0 % 92.4 % 93.3 %
(1) Credit scores exclude non-scored accounts.
(2) Accounts that become delinquent after being re-aged are included in both the delinquency and re-aged amounts.
(3) Carrying value reflects the total customer accounts receivable portfolio balance, net of deferred fees and origination costs, the allowance for no-interest option credit programs and the allowance for uncollectible interest.
(4) For the period ended January 31, 2021, the allowance for bad debts and uncollectible interest is based on the current expected credit loss methodology required under ASC 326. For the period ended January 31, 2020, the allowance for bad debts and uncollectible interest is based on the incurred loss methodology.
Our customer portfolio balance and related allowance for uncollectible accounts are segregated between customer accounts receivable and restructured accounts. Customer accounts receivable include all accounts for which payment term has not been cumulatively extended over three months or refinanced. Restructured accounts includes all accounts for which payment term has been re-aged in excess of three months or refinanced.
For customer accounts receivable (excluding restructured accounts), the allowance for uncollectible accounts as a percentage of the total customer accounts receivable portfolio balance increased to 21.0% as of January 31, 2021 from 10.5% as of

Table of Contents
51
January 31, 2020. The increase in our allowance for uncollectible accounts was primarily related to the implementation of CECL during the first quarter of fiscal year 2021, which transitioned our allowance from an incurred loss reserve to a lifetime reserve, and an increase in our economic adjustment related to the COVID-19 pandemic.
The percentage of the carrying value of non-restructured accounts greater than 60 days past due decreased 80 basis points over the prior year period to 8.9% as of January 31, 2021 from 9.7% as of January 31, 2020.
For restructured accounts, the allowance for uncollectible accounts as a percentage of the portfolio balance was 41.6% as of January 31, 2021 as compared to 40.0% as of January 31, 2020. This 160 basis point increase reflects the impact of higher restructured account delinquencies.
The percent of bad debt charge-offs, net of recoveries, to average outstanding portfolio balance was 16.3% for fiscal year 2021 compared to 12.6% for fiscal year 2020. The increase was driven by a decrease in the average portfolio balance and an increase in bad debt charge-offs, net of recoveries. Bad debt charge-offs, net of recoveries, increased primarily due to an increase in new customer mix and the impact of difficulties in collection efforts related to the implementation of our new loan management system during the fourth quarter of fiscal year 2020.
As of January 31, 2021 and 2020, balances under no-interest programs included within customer receivables were $252.8 million and $283.2 million, respectively.
Liquidity and Capital Resources
We require liquidity and capital resources to finance our operations and future growth as we add new stores to our operations, which in turn requires additional working capital for increased customer receivables and inventory. We generally finance our operations through a combination of cash flow generated from operations, the use of our Revolving Credit Facility, and through periodic securitizations of originated customer receivables. We plan to execute periodic securitizations of future originated customer receivables.
We believe, based on our current projections, that we have sufficient sources of liquidity to fund our operations, store expansion and renovation activities, and capital expenditures for at least the next 12 months.
Operating cash flows. For the year ended January 31, 2021, net cash provided by operating activities was $462.1 million compared to $80.1 million for the year ended January 31, 2020. The increase in net cash provided by operating activities was primarily driven by a decrease in receivables resulting from both an increase in collections on customer accounts and a decrease in loan originations, a decrease in inventory driven by industry wide supply chain disruptions in certain product categories and the general timing of payments. These increases were partially offset by a decrease in net income when adjusted for non-cash activity.
For the year ended January 31, 2020, net cash provided by operating activities was $80.1 million compared to $151.8 million for the year ended January 31, 2019. The decrease in net cash provided by operating activities was primarily driven by a decrease in cash provided by working capital, primarily due to general timing of payments and a decrease in accrued compensation, the collection of an income tax refund of $34.5 million during fiscal year 2019 and a decrease in net income when adjusted for non-cash activity.
Investing cash flows. For the year ended January 31, 2021, net cash used in investing activities was $55.9 million compared to $56.8 million for the year ended January 31, 2020. The cash used during the year ended January 31, 2021 was primarily for investments in new stores, two new distribution centers and technology investments. The cash used during the year ended January 31, 2020 was primarily for investments in new stores, renovations and expansions of select existing stores and a new distribution center.
For the year ended January 31, 2020, net cash used in investing activities was $56.8 million compared to $32.8 million for the year ended January 31, 2019. The increase was primarily the result of higher capital expenditures due to investments in new stores, renovations and expansions of select existing stores and a new distribution center.
Financing cash flows. For the year ended January 31, 2021, net cash used in financing activities was $426.8 million compared to net cash used in financing activities of $7.3 million for the year ended January 31, 2020 and net cash used in financing activities of $150.2 million for the year ended January 31, 2019. During the year ended January 31, 2021, we issued 2020-A VIE asset backed notes resulting in net proceeds to us of approximately $238.5 million, net of transaction costs. The proceeds from the 2020-A VIE asset-backed notes were used to pay down the balance of the Company’s Revolving Credit Facility outstanding at the time of issuance and for other general corporate purposes. Cash collections from the securitized receivables were used to make payments on the asset-backed notes of approximately $599.1 million during the year ended January 31, 2021 compared to approximately $559.1 million in the comparable prior year period. During the year ended January 31, 2021, net borrowings under our Revolving Credit Facility were $22.9 million compared to net payments of $239.6 million during the year ended January 31, 2020. During the year ended January 31, 2021, we retired $85.8 million aggregate principal amount of our

Table of Contents
52
Senior Notes in connection with a tender offer, resulting in a payment on extinguishment of debt of $84.3 million, net of transaction costs paid.
During the year ended January 31, 2020, we issued 2019-A VIE and 2019-B VIE asset-backed notes resulting in net proceeds to us of approximately $862.0 million, net of transaction costs and restricted cash held by the Issuer, which were used to pay down the balance of the Company’s Revolving Credit Facility outstanding at the time of issuance and for other general corporate purposes. During the year ended January 31, 2019, the issuance of asset-backed notes resulted in net proceeds to us of approximately $355.7 million, net of transaction costs and restricted cash held by the Issuer, which were used to repay indebtedness under the Company’s asset-based credit facility and for other general corporate purposes.
Share Repurchase Program. On May 30, 2019, we entered into a stock repurchase program pursuant to which we had the authorization to repurchase up to $75.0 million of our outstanding common stock. The stock repurchase program expired on May 30, 2020. No shares were repurchased during the year ended January 31, 2021. For the year ended January 31, 2020, we repurchased 3,485,441 shares of our common stock at an average weighted cost per share of $19.02 for an aggregate amount of $66.3 million.
Senior Notes. On July 1, 2014, we issued $250.0 million of the unsecured Senior Notes due July 2022 bearing interest at 7.25%, pursuant to an indenture dated July 1, 2014 (as amended, the “Indenture”), among Conn’s, Inc., its subsidiary guarantors (the “Guarantors”) and U.S. Bank National Association, as trustee. The effective interest rate of the Senior Notes after giving effect to the discount and issuance costs is 7.8%.
The Indenture restricts the Company’s and certain of its subsidiaries’ ability to: (i) incur indebtedness; (ii) pay dividends or make other distributions in respect of, or repurchase or redeem, our capital stock (“restricted payments”); (iii) prepay, redeem or repurchase debt that is junior in right of payment to the notes; (iv) make loans and certain investments; (v) sell assets; (vi) incur liens; (vii) enter into transactions with affiliates; and (viii) consolidate, merge or sell all or substantially all of our assets. These covenants are subject to a number of important exceptions and qualifications. During any time when the Senior Notes are rated investment grade by either of Moody’s Investors Service, Inc. or Standard & Poor’s Ratings Services and no default (as defined in the Indenture) has occurred and is continuing, many of such covenants will be suspended and we will cease to be subject to such covenants during such period. As of January 31, 2021, $188.6 million was free from the restricted payments covenant contained in the Indenture. Events of default under the Indenture include customary events, such as a cross-acceleration provision in the event that we fail to make payment of other indebtedness prior to the expiration of any applicable grace period or upon acceleration of indebtedness prior to its stated maturity date in an amount exceeding $25.0 million, as well as in the event a judgment is entered against us in excess of $25.0 million that is not discharged, bonded or insured.
On December 28, 2020, the Company retired $85.8 million aggregate principal amount of its Senior Notes in connection with a tender offer.
Asset-backed Notes. From time to time, we securitize customer accounts receivables by transferring the receivables to various bankruptcy-remote VIEs. In turn, the VIEs issue asset-backed notes secured by the transferred customer accounts receivables and restricted cash held by the VIEs.
Under the terms of the securitization transactions, all cash collections and other cash proceeds of the customer receivables go first to the servicer and the holders of issued notes, and then to us as the holder of non-issued notes, if any, and residual equity. We retain the servicing of the securitized portfolios and receive a monthly fee of 4.75% (annualized) based on the outstanding balance of the securitized receivables. In addition, we, rather than the VIEs, retain all credit insurance income together with certain recoveries related to credit insurance and repair service agreements on charge-offs of the securitized receivables, which are reflected as a reduction to net charge-offs on a consolidated basis.
The asset-backed notes were offered and sold to qualified institutional buyers pursuant to the exemptions from registration provided by Rule 144A under the Securities Act. If an event of default were to occur under the indenture that governs the respective asset-backed notes, the payment of the outstanding amounts may be accelerated, in which event the cash proceeds of the receivables that otherwise might be released to the residual equity holder would instead be directed entirely toward repayment of the asset-backed notes, or if the receivables are liquidated, all liquidation proceeds could be directed solely to repayment of the asset-backed notes as governed by the respective terms of the asset-backed notes. The holders of the asset-backed notes have no recourse to assets outside of the VIEs. Events of default include, but are not limited to, failure to make required payments on the asset-backed notes or specified bankruptcy-related events.

Table of Contents
53
The asset-backed notes outstanding as of January 31, 2020 consisted of the following:
(dollars in thousands)
Asset-Backed Notes
Original Principal Amount
Original Net
Proceeds (1)
Current Principal Amount
Issuance Date
Maturity Date
Contractual Interest
Rate
Effective Interest Rate (2)
2019-A Class A Notes $ 254,530 $ 253,026 $ 19,521 4/24/2019 10/16/2023 3.40% 4.43% 2019-A Class B Notes 64,750 64,276 25,069 4/24/2019 10/16/2023 4.36% 4.84% 2019-A Class C Notes 62,510 61,898 24,202 4/24/2019 10/16/2023 5.29% 5.74% 2019-B Class A Notes 317,150 315,417 17,860 11/26/2019 6/17/2024 2.66% 4.32% 2019-B Class B Notes 85,540 84,916 85,540 11/26/2019 6/17/2024 3.62% 4.16% 2019-B Class C Notes 83,270 82,456 83,270 11/26/2019 6/17/2024 4.60% 4.96% 2020-A Class A Notes 174,900 173,716 93,326 10/16/2020 6/16/2025 1.71% 4.08% 2020-A Class B Notes 65,200 64,754 65,200 10/16/2020 6/16/2025 4.27% 5.12% Total $ 1,107,850 $ 1,100,459 $ 413,988
(1) After giving effect to debt issuance costs.
(2) For the year ended January 31, 2021, and inclusive of the impact of changes in timing of actual and expected cash flows.
On October 16, 2020, the Company completed the issuance and sale of $240.1 million aggregate principal amount of asset-backed notes secured by the transferred customer accounts receivables and restricted cash held by a consolidated VIE, which resulted in net proceeds to us of $238.5 million, net of debt issuance costs. Net proceeds from the offering were used to repay indebtedness under the Company’s Revolving Credit Facility, as defined below, and for other general corporate purposes. The asset-backed notes mature on June 16, 2025 and consist of $174.9 million of 1.71% Asset Backed Fixed Rate Notes, Class A, Series 2020-A and $65.2 million of 4.27% Asset Backed Fixed Rate Notes, Class B, Series 2020-A. Additionally, the Company issued $62.9 million in aggregate principal amount of 7.10% Asset Backed Fixed Rate Notes, Class C, Series 2020-A which mature on June 16, 2025. The interest rate on the Class C, Series 2020-A Notes was reduced to 4.20% in connection with a sale of such notes on February 24, 2021. See Note 17. Subsequent Events, for details.
Revolving Credit Facility. On May 23, 2018, Conn’s, Inc. and certain of its subsidiaries (the “Borrowers”) entered into the Fourth Amended and Restated Loan and Security Agreement (the “Fourth Amendment”), dated as of October 30, 2015, with certain lenders, which provides for a $650.0 million asset-based revolving credit facility (as amended, the “Revolving Credit Facility”) under which credit availability is subject to a borrowing base and a maturity date of May 23, 2022.
The Revolving Credit Facility provides funding based on a borrowing base calculation that includes customer accounts receivable and inventory, and provides for a $40.0 million sub-facility for letters of credit to support obligations incurred in the ordinary course of business. The obligations under the Revolving Credit Facility are secured by substantially all assets of the Company, excluding the assets of the VIEs. As of January 31, 2021, we had immediately available borrowing capacity of $336.0 million under our Revolving Credit Facility, net of standby letters of credit issued of $22.5 million. We also had $239.5 million that may become available under our Revolving Credit Facility if we grow the balance of eligible customer receivables and total eligible inventory balances.
On June 5, 2020 we entered into the Third Amendment to our Revolving Credit Facility (the “Third Amendment”). Under the Third Amendment, loans under the Revolving Credit Facility bear interest, at our option, at a rate of LIBOR plus a margin ranging from 3.00% to 3.75% per annum (depending on a pricing grid determined by our total leverage ratio) or the alternate base rate plus a margin ranging from 2.00% to 2.75% per annum (depending on a pricing grid determined by our total leverage ratio). The alternate base rate is a rate per annum equal to the greatest of the prime rate, the federal funds effective rate plus 0.5%, or LIBOR for a 30-day interest period plus 1.0%. We also pay an unused fee on the portion of the commitments that is available for future borrowings or letters of credit at a rate ranging from 0.25% to 0.50% per annum, depending on the average outstanding balance and letters of credit of the Revolving Credit Facility in the immediately preceding quarter. The weighted-average interest rate on borrowings outstanding and including unused line fees under the Revolving Credit Facility was 5.9% for the year ended January 31, 2021.
The Revolving Credit Facility places restrictions on our ability to incur additional indebtedness, grant liens on assets, make distributions on equity interests, dispose of assets, make loans, pay other indebtedness, engage in mergers, and other matters. The Revolving Credit Facility restricts our ability to make dividends and distributions unless no event of default exists and a liquidity test is satisfied. Subsidiaries of the Company may pay dividends and make distributions to the Company and other obligors under the Revolving Credit Facility without restriction. As of January 31, 2021, we were restricted from making distributions, including repayments of the Senior Notes or other distributions, in excess of $240.1 million as a result of the

Table of Contents
54
Revolving Credit Facility distribution restrictions. The Revolving Credit Facility contains customary default provisions, which, if triggered, could result in acceleration of all amounts outstanding under the Revolving Credit Facility.
Debt Covenants. We were in compliance with our debt covenants at January 31, 2021. A summary of the significant financial covenants that govern our Revolving Credit Facility compared to our actual compliance status at January 31, 2021 is presented below:
Actual
Required Minimum/ Maximum
Interest Coverage Ratio for the quarter must equal or exceed minimum 5.05:1.00 1.00:1.00 Interest Coverage Ratio for the trailing two quarters must equal or exceed minimum 4.53:1.00 1.50:1.00 Leverage Ratio must not exceed maximum 1.61:1.00 4.50:1.00 ABS Excluded Leverage Ratio must not exceed maximum 0.95:1.00 2.50:1.00 Capital Expenditures, net, must not exceed maximum $34.7 million $100.0 million
All capitalized terms in the above table are defined by the Revolving Credit Facility and may or may not agree directly to the financial statement captions in this document. The covenants are calculated quarterly, except for capital expenditures, which is calculated for a period of four consecutive fiscal quarters, as of the end of each fiscal quarter.
Capital Expenditures. We lease the majority of our stores under operating leases, and our plans for future store locations anticipate operating leases, but do not exclude store ownership. Our capital expenditures for future new store projects should primarily be for our tenant improvements to the property leased (including any new distribution centers and cross-dock facilities), the cost of which is estimated to be between $1.6 million and $2.5 million per store (before tenant improvement allowances), and for our existing store remodels, estimated to range between $0.7 million and $1.2 million per store remodel (before tenant improvement allowances), depending on store size. In the event we purchase existing properties, our capital expenditures will depend on the particular property and whether it is improved when purchased. We are continuously reviewing new relationships and funding sources and alternatives for new stores, which may include “sale-leaseback” or direct “purchase-lease” programs, as well as other funding sources for our purchase and construction of those projects. If we do not purchase the real property for new stores, our direct cash needs should include only our capital expenditures for tenant improvements to leased properties and our remodel programs for existing stores. We opened 9 new stores during fiscal year 2021, and currently plan to open 9 to 11 new stores during fiscal year 2022. Additionally, we plan to renovate several of our showrooms during fiscal year 2022. Our anticipated capital expenditures for fiscal year 2022 are between $35.0 and $45.0 million.
Cash Flow. We periodically evaluate our liquidity requirements, capital needs and availability of resources in view of inventory levels, expansion plans, debt service requirements and other operating cash needs. To meet our short- and long-term liquidity requirements, including payment of operating expenses, funding of capital expenditures and repayment of debt, we rely primarily on cash from operations. As of January 31, 2021, beyond cash generated from operations we had (i) immediately available borrowing capacity of $336.0 million under our Revolving Credit Facility and (ii) $9.7 million of cash on hand. However, we have, in the past, sought to raise additional capital.
We expect that, for the next 12 months, cash generated from operations, proceeds from potential accounts receivable securitizations and our Revolving Credit Facility will be sufficient to provide us the ability to fund our operations, provide the increased working capital necessary to support our strategy and fund planned capital expenditures discussed above in Capital Expenditures.
We may repurchase or otherwise retire our debt and take other steps to reduce our debt or otherwise improve our financial position. These actions could include open market debt repurchases, negotiated repurchases, other retirements of outstanding debt and opportunistic refinancing of debt. The amount of debt that may be repurchased or otherwise retired, if any, will depend on market conditions, the Company’s cash position, compliance with debt covenant and restrictions and other considerations.

Table of Contents
55
Off-Balance Sheet Liabilities and Other Contractual Obligations
We do not have any off-balance sheet arrangements as defined by Item 303(a)(4) of Regulation S-K. The following table presents a summary of our minimum contractual commitments and obligations as of January 31, 2021:
Payments due by period
(in thousands) Total
Less Than 1
Year 1-3
Years 3-5
Years More Than
5 Years Debt, including estimated interest payments (1)(2): Revolving Credit Facility (1)(3) $ 54,548 $ 1,950 $ 52,598 $ — $ — Senior Notes (4) (5) 156,034 10,235 145,799 — — 2019-A Class A Notes (4) 21,318 664 20,654 — — 2019-A Class B Notes (4) 28,028 1,093 26,935 — — 2019-A Class C Notes (4) 27,667 1,280 26,387 — — 2019-B Class A Notes (4) 19,464 475 950 18,039 — 2019-B Class B Notes (4) 96,001 3,097 6,193 86,711 — 2019-B Class C Notes (4) 96,209 3,830 7,661 84,718 — 2020-A Class A Notes (4) 100,309 1,596 3,192 95,521 — 2020-A Class B Notes (4) 77,381 2,784 5,568 69,029 —
Financing lease obligations 8,005 1,247 2,058 1,506 3,194 Operating leases:
Real estate 541,180 82,792 161,800 126,116 170,472 Equipment 333 227 83 23 —
Contractual commitments (6) 114,488 106,217 7,762 509 — Total $ 1,340,965 $ 217,487 $ 467,640 $ 482,172 $ 173,666
(1) Estimated interest payments are based on the outstanding balance as of January 31, 2021 and the interest rate in effect at that time.
(2) On February 24, 2021, the Company completed the sale of $62.9 million of 4.20% Asset Backed Fixed Rate Notes, Class C, Series 2020-A which were previously issued and retained by the Company. The asset-backed notes are secured by the transferred customer accounts receivables and restricted cash held by a consolidated VIE, which resulted in net proceeds to us of $62.5 million, net of debt issuance costs. Net proceeds from the sale were used to repay amounts outstanding under the Company’s Revolving Credit Facility. See Note 17., Subsequent Events, for details.
(3) On March 29, 2021, the Company entered into the Fifth Amended and Restated Loan and Security Agreement (the “Fifth Amended and Restated Loan Agreement”). The Fifth Amended and Restated Loan Agreement, among other things, extended the maturity date of our existing revolving credit facility to March 2025 (originally scheduled to mature in May 2022). See Note 17., Subsequent Events, for details.
(4) The payments due by period for the Senior Notes and asset-backed notes were based on their respective maturity dates at their respective fixed annual interest rate. Actual principal and interest payments on the asset-backed notes will reflect actual proceeds from the securitized customer accounts receivables.
(5) On March 15, 2021, the Company issued a notice of redemption to holders of our 7.250% Senior Notes due 2022 (the “Senior Notes”) for the redemption of all $141,172,000 outstanding aggregate principal amount of the Senior Notes. See Note 17., Subsequent Events, for details.
(6) Contractual commitments primarily include commitments to purchase inventory of $87.9 million.
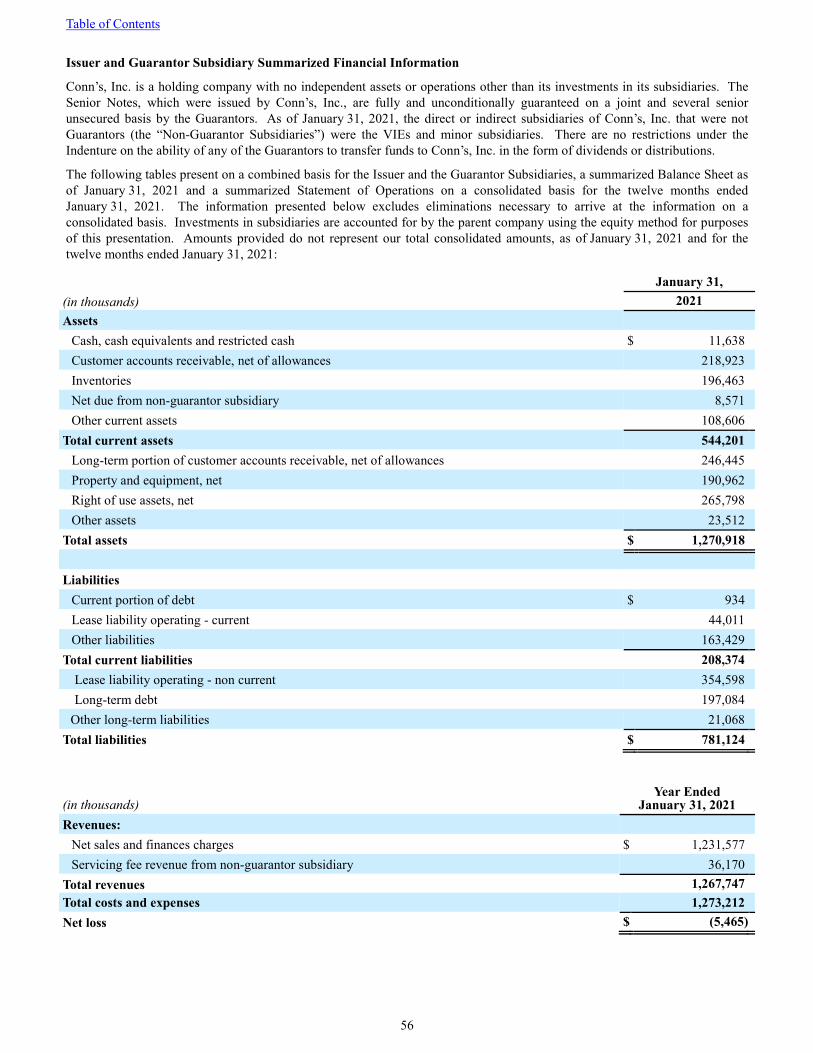
Table of Contents
56
Issuer and Guarantor Subsidiary Summarized Financial Information
Conn’s, Inc. is a holding company with no independent assets or operations other than its investments in its subsidiaries. The Senior Notes, which were issued by Conn’s, Inc., are fully and unconditionally guaranteed on a joint and several senior unsecured basis by the Guarantors. As of January 31, 2021, the direct or indirect subsidiaries of Conn’s, Inc. that were not Guarantors (the “Non-Guarantor Subsidiaries”) were the VIEs and minor subsidiaries. There are no restrictions under the Indenture on the ability of any of the Guarantors to transfer funds to Conn’s, Inc. in the form of dividends or distributions.
The following tables present on a combined basis for the Issuer and the Guarantor Subsidiaries, a summarized Balance Sheet as of January 31, 2021 and a summarized Statement of Operations on a consolidated basis for the twelve months ended January 31, 2021. The information presented below excludes eliminations necessary to arrive at the information on a consolidated basis. Investments in subsidiaries are accounted for by the parent company using the equity method for purposes of this presentation. Amounts provided do not represent our total consolidated amounts, as of January 31, 2021 and for the twelve months ended January 31, 2021:
January 31, (in thousands) 2021 Assets
Cash, cash equivalents and restricted cash $ 11,638 Customer accounts receivable, net of allowances 218,923 Inventories 196,463 Net due from non-guarantor subsidiary 8,571 Other current assets 108,606
Total current assets 544,201 Long-term portion of customer accounts receivable, net of allowances 246,445 Property and equipment, net 190,962 Right of use assets, net 265,798 Other assets 23,512
Total assets $ 1,270,918 Liabilities
Current portion of debt $ 934 Lease liability operating - current 44,011 Other liabilities 163,429
Total current liabilities 208,374 Lease liability operating - non current 354,598 Long-term debt 197,084
Other long-term liabilities 21,068 Total liabilities $ 781,124
(in thousands) Year Ended
January 31, 2021 Revenues:
Net sales and finances charges $ 1,231,577 Servicing fee revenue from non-guarantor subsidiary 36,170
Total revenues 1,267,747 Total costs and expenses 1,273,212 Net loss $ (5,465)

Table of Contents
57
Critical Accounting Policies and Estimates
The preparation of financial statements and related disclosures in conformity with U.S. GAAP requires us to make estimates that affect the reported amounts of assets, liabilities, revenues and expenses, and the disclosure of contingent assets and liabilities. Certain accounting policies, as described below, are considered “critical accounting policies” because they are particularly dependent on estimates made by us about matters that are inherently uncertain and could have a material impact to our consolidated financial statements. We base our estimates on historical experience and on other assumptions that we believe are reasonable. As a result, actual results could differ because of the use of estimates. A summary of all of our significant accounting policies is included in Note 1, Summary of Significant Accounting Policies, of the Consolidated Financial Statements in Part II, Item 8., of this Annual Report on Form 10-K.
Allowance for doubtful accounts. The determination of the amount of the allowance for credit losses is, by nature, highly complex and subjective. Future events that are inherently uncertain could result in material changes to the level of the allowance for credit losses. General economic conditions, changes to state or federal regulations and a variety of other factors that affect the ability of borrowers to service their debts or our ability to collect will impact the future performance of the portfolio.
We establish an allowance for credit losses, including estimated uncollectible interest, to cover expected credit losses on our customer accounts receivable resulting from the failure of customers to make contractual payments. Our customer accounts receivable portfolio balance consists of a large number of relatively small, homogeneous accounts. None of our accounts are large enough to warrant individual evaluation for impairment.
On February 1, 2021, we adopted ASU 2016-13, Financial Instruments-Credit Losses (Topic 326): Measurement of Credit Losses on Financial Instruments (“ASC 326”). The allowance for credit losses is measured on a collective (pool) basis where similar risk characteristics exist. The allowance for credit losses is determined for each pool and added to the pool’s carrying amount to establish a new amortized cost basis.
We have elected to use a risk-based, pool-level segmentation framework to calculate the expected loss rate. This framework is based on our historical gross charge-off history. In addition to adjusted historical gross charge-off rates, estimates of post-charge-off recoveries, including cash payments from customers, sales tax recoveries from taxing jurisdictions, and payments received under credit insurance and repair service agreement (“RSA”) policies are also considered. We also consider forward-looking economic forecasts based on a statistical analysis of economic factors (specifically, forecast of unemployment rates over the reasonable and supportable forecasting period). To the extent that situations and trends arise which are not captured in our model, management will layer on additional qualitative adjustments.
Pursuant to ASC 326 requirements, the Company uses a 24-month reasonable and supportable forecast period for the Customer Accounts Receivable portfolio. We estimate losses beyond the 24-month forecast period based on historic loss rates experienced over the life of our historic loan portfolio by loan pool type. We revisit our measurement methodology and assumption annually, or more frequently if circumstances warrant.
As of January 31, 2021 and 2020, the balance of allowance for doubtful accounts and uncollectible interest for non-TDR customer receivables was $219.7 million and $145.7 million, respectively. As of January 31, 2021 and 2020, the amount included in the allowance for doubtful accounts associated with principal and interest on TDR accounts was $78.3 million and $88.1 million, respectively. A 100 basis point increase in our estimated gross charge-off rate would increase our allowance for doubtful accounts on our customer accounts receivable by $8.1 million based on the balance outstanding at January 31, 2021.
Interest income on customer accounts receivable. Interest income, which includes interest income and amortization of deferred fees and origination costs, is recorded using the interest method and is reflected in finance charges and other revenues. Typically, interest income is recorded until the customer account is paid off or charged-off, and we provide an allowance for estimated uncollectible interest. Any contractual interest income received from customers in excess of the interest income calculated using the interest method is recorded as deferred revenue on our balance sheets. At January 31, 2021 and 2020, there were $8.9 million and $10.6 million, respectively, of deferred interest included in deferred revenues and other credits and other long-term liabilities. The deferred interest will ultimately be brought into income as the accounts pay off or charge-off.
We offer a 12-month no-interest option program. If the customer is delinquent in making a scheduled monthly payment or does not repay the principal in full by the end of the no-interest option program period (grace periods are provided), the account does not qualify for the no-interest provision and none of the interest earned is waived. Interest income is recognized based on estimated accrued interest earned to date on all no-interest option finance programs with an offsetting reserve for those customers expected to satisfy the requirements of the program based on our historical experience.
We recognize interest income on TDR accounts using the interest income method, which requires reporting interest income equal to the increase in the net carrying amount of the loan attributable to the passage of time. Cash proceeds and other adjustments are applied to the net carrying amount such that it equals the present value of expected future cash flows.

Table of Contents
58
We place accounts in non-accrual status when legally required. Payments received on non-accrual loans will be applied to principal and reduce the amount of the loan. At January 31, 2021 and 2020, the carrying value of customer accounts receivable in non-accrual status was $8.5 million and $12.5 million. At January 31, 2021 and 2020, the carrying value of customer accounts receivable that were past due 90 days or more and still accruing interest totaled $111.5 million and $132.7 million, respectively. At January 31, 2021 and 2020, the carrying value of customer accounts receivable in a bankruptcy status that were less than 60 days past due of $5.2 million and $12.1 million, respectively, were included within the customer receivables balance carried in non-accrual status.
Inventories. Inventories consist of merchandise purchased for resale and service parts and are recorded at the lower of cost or net realizable value. The carrying value of the inventory is reduced to its net realizable value for any product lines with excess of carrying amount, typically weighted-average cost, over the amount we expect to realize from the ultimate sale or other disposition of the inventory, with a corresponding charge to cost of sales. The write-down of inventory to net realizable value is estimated based on assumptions regarding inventory aging and historical product sales. A 10% difference in our actual inventory reserve at January 31, 2021, would have affected our cost of goods sold by $0.5 million.
Impairment of Long-Lived Assets. Long-lived assets are evaluated for impairment, primarily at the asset group level. The asset group is defined as stores and cross-docks within a distribution center’s service area. We monitor asset group performance in order to assess if events or changes in circumstances indicate that the carrying amount of the assets may not be recoverable. The most likely condition that would necessitate an assessment would be an adverse change in historical and estimated future results of an asset group's performance. For property and equipment held and used, we recognize an impairment loss if the carrying amount is not recoverable through its undiscounted cash flows and measure the impairment loss based on the difference between the carrying amount and estimated fair value. During the year ended January 31, 2020, we recognized $3.2 million in impairments from the exiting of certain leases. See Note 4, Charges and Credits, for details. For the years ended January 31, 2021 and 2019 there were no impairments.
Vendor allowances. We receive funds from vendors for price protection, product rebates (earned upon purchase or sale of product), marketing, and promotion programs, collectively referred to as vendor allowances, which are recorded on an accrual basis. We estimate the vendor allowances to accrue based on the progress of satisfying the terms of the programs based on actual and projected sales or purchase of qualifying products. If the programs are related to product purchases, the vendor allowances are recorded as a reduction of product cost in inventory still on hand with any remaining amounts recorded as a reduction of cost of goods sold. During the years ended January 31, 2021, 2020 and 2019, we recorded $122.7 million, $156.6 million and $143.3 million, respectively, as reductions in cost of goods sold from vendor allowances.
Recent Accounting Pronouncements
The information related to recent accounting pronouncements as set forth in Note 1, Summary of Significant Accounting Policies, of the Consolidated Financial Statements in Part II, Item 8., of this Annual Report on Form 10-K is incorporated herein by reference.
ITEM 7A. QUANTITATIVE AND QUALITATIVE DISCLOSURES ABOUT MARKET RISK.
The market risk inherent in our financial instruments represents the potential loss arising from adverse changes in interest rates. We have not been materially impacted by fluctuations in foreign currency exchange rates, as substantially all of our business is transacted in, and is expected to continue to be transacted in, U.S. dollars or U.S. dollar-based currencies. Our Senior Notes and asset-backed notes bear interest at a fixed rate and would not be affected by interest rate changes.
Loans under the Revolving Credit Facility bear interest, at our option, at a rate of LIBOR plus a margin ranging from 3.00% to 3.75% per annum (depending on a pricing grid determined by our total leverage ratio) or the alternate base rate plus a margin ranging from 2.00% to 2.75% per annum (depending on a pricing grid determined by our total leverage ratio). The alternate base rate is a rate per annum equal to the greatest of the prime rate, the federal funds effective rate plus 0.5%, or LIBOR for a 30-day interest period plus 1.0%. Accordingly, changes in our total leverage ratio and LIBOR or the alternate base rate will affect the interest rate on, and therefore our costs under, the Revolving Credit Facility. As of January 31, 2021, the balance outstanding under our Revolving Credit Facility was $52.0 million. A 100 basis point increase in interest rates on the Revolving Credit Facility would increase our borrowing costs by $0.5 million over a 12-month period, based on the balance outstanding at January 31, 2021.

Table of Contents
59
ITEM 8. FINANCIAL STATEMENTS AND SUPPLEMENTARY DATA.
INDEX TO CONSOLIDATED FINANCIAL STATEMENTS
Page No. Report of Independent Registered Public Accounting Firm 60 Consolidated Balance Sheets 62 Consolidated Statements of Operations 63 Consolidated Statements of Stockholders’ Equity 64 Consolidated Statements of Cash Flows 65 Notes to Consolidated Financial Statements 66

Table of Contents
60
Report of Independent Registered Public Accounting Firm
To the Stockholders and the Board of Directors of Conn’s, Inc.
Opinion on the Financial Statements
We have audited the accompanying consolidated balance sheets of Conn’s, Inc. and subsidiaries (the “Company”) as of January 31, 2021 and 2020, the related consolidated statements of operations, stockholders' equity and cash flows for each of the three years in the period ended January 31, 2021, and the related notes (collectively referred to as the “consolidated financial statements”). In our opinion, the consolidated financial statements present fairly, in all material respects, the financial position of the Company at January 31, 2021 and 2020, and the results of its operations and its cash flows for each of the three years in the period ended January 31, 2021, in conformity with U.S. generally accepted accounting principles.
We also have audited, in accordance with the standards of the Public Company Accounting Oversight Board (United States) (the “PCAOB”), the Company's internal control over financial reporting as of January 31, 2021, based on criteria established in Internal Control-Integrated Framework issued by the Committee of Sponsoring Organizations of the Treadway Commission (2013 framework) and our report dated March 31, 2021 expressed an unqualified opinion thereon.
Adoption of New Accounting Standards
As discussed in Note 1 to the consolidated financial statements, the Company changed its method of accounting for 1) credit losses in fiscal year 2021 due to the adoption of ASU No. 2016-13, Credit Losses 2) leases in fiscal year 2020 due to the adoption of ASU No. 2016-02, Leases and 3) internal-use software in fiscal year 2020 due to the adoption of ASU No. 2018-15, Intangibles Goodwill and Other-Internal-Use Software.
Basis for Opinion
These financial statements are the responsibility of the Company's management. Our responsibility is to express an opinion on the Company’s financial statements based on our audits. We are a public accounting firm registered with the PCAOB and are required to be independent with respect to the Company in accordance with the U.S. federal securities laws and the applicable rules and regulations of the Securities and Exchange Commission and the PCAOB.
We conducted our audits in accordance with the standards of the PCAOB. Those standards require that we plan and perform the audit to obtain reasonable assurance about whether the financial statements are free of material misstatement, whether due to error or fraud. Our audits included performing procedures to assess the risks of material misstatement of the financial statements, whether due to error or fraud, and performing procedures that respond to those risks. Such procedures included examining, on a test basis, evidence regarding the amounts and disclosures in the financial statements. Our audits also included evaluating the accounting principles used and significant estimates made by management, as well as evaluating the overall presentation of the financial statements. We believe that our audits provide a reasonable basis for our opinion.
Critical Audit Matter
The critical audit matter communicated below is a matter arising from the current period audit of the financial statements that was communicated or required to be communicated to the audit committee and that: (1) relates to accounts or disclosures that are material to the financial statements and (2) involved our especially challenging, subjective or complex judgments. The communication of the critical audit matter does not alter in any way our opinion on the consolidated financial statements, taken as a whole, and we are not, by communicating the critical audit matter below, providing a separate opinion on the critical audit matter or on the accounts or disclosures to which it relates.

Table of Contents
61
Allowance for Credit Losses Description of the Matter
At January 30, 2021 the Company’s balance of customer accounts receivable was $1.233 billion and the related allowance for credit losses was $276.6 million. As discussed in Note 1 to the consolidated financial statements, the Company recognizes an allowance for expected credit losses over the life of customer accounts receivable. Management measures expected losses on a pool basis where similar risk characteristics exist using historical charge-off experience to estimate an allowance. In addition to adjusted historical gross charge-off rates, estimates of post-charge-off recoveries as well as forward-looking macro-economic forecasts are also considered. To the extent that situations and trends arise which are not captured in management’s model, management will layer on additional qualitative adjustments.
Auditing management’s estimates of the allowance for credit losses for customer accounts receivable involves a high degree of complexity in testing the model and modeling assumptions used to derive the segmentation level loss estimates utilized in the allowance calculation. Additionally, in light of the current economic environment, auditing the estimate is complex due to the judgments necessary to evaluate management’s qualitative assessments of how to adjust the historical charge-off and recovery experiences, as well as the macro-economic forecast to estimate current expected credit losses over the life of the customer accounts receivable portfolio.
How We Addressed the Matter in Our Audit
We obtained an understanding, evaluated the design, and tested the operating effectiveness of the Company’s controls over the allowance for credit losses process, including management’s review and approval of models used to calculate the estimate and the evaluation of the completeness and accuracy of data inputs, assumptions, and outputs of those models. We also evaluated the Company’s controls over the identification and measurement of qualitative adjustments, review of portfolio trends and overall evaluation of the recorded allowance estimate, as well as the controls specific to the adoption of ASU 2016-13.
With the assistance of our specialists, we tested the quantitative model methodology, modeling assumptions, model calculation and clerical accuracy of the segmentation level loss estimates. We tested the completeness and accuracy of historical data. We evaluated management’s identification of historical loss periods used in the models. We also assessed management’s adjustments to historical loss data and evaluated whether those adjustments were reflective of management’s current expected loss estimates, and consistent with the underlying supporting documentation for any such quantitative adjustments. We evaluated the inputs used by management in determining the qualitative adjustments for consistency with management’s evaluation framework. We tested the completeness and accuracy of underlying portfolio and macro-economic data considered by management in determining the qualitative adjustments. We also inspected management’s documentation of the evaluation of adjustments considered for consistency with the underlying data and evaluated the reasonableness of the qualitative adjustments recorded. We evaluated the reasonableness of the overall allowance estimate, inclusive of the adjustments for qualitative factors, through comparison of historical estimation results to actual recorded losses. We also reviewed subsequent events and transactions and considered whether they corroborated or contradicted the Company’s estimation conclusion.
/s/ Ernst & Young LLP We have served as the Company’s auditor since 2001.
Houston, Texas March 31, 2021

Table of Contents
62
CONN’S, INC. AND SUBSIDIARIES CONSOLIDATED BALANCE SHEETS
(dollars in thousands, except per share amounts)
January 31, 2021 2020
Assets Current assets: Cash and cash equivalents $ 9,703 $ 5,485 Restricted cash (includes VIE balances of $48,622 and $73,214, respectively) 50,557 75,370 Customer accounts receivable, net of allowance (includes VIE balances of $259,811 and
$393,764, respectively) 478,734 673,742 Other accounts receivable 61,716 68,753 Inventories 196,463 219,756 Income taxes receivable 38,059 4,315 Prepaid expenses and other current assets 8,831 11,445
Total current assets 844,063 1,058,866 Long-term portion of customer accounts receivable, net of allowances (includes VIE balances of
$184,304 and $420,454, respectively) 430,749 663,761 Property and equipment, net 190,962 173,031 Operating lease right-of-use assets 265,798 242,457 Deferred income taxes 9,448 18,599 Other assets 14,064 12,055
Total assets $ 1,755,084 $ 2,168,769 Liabilities and Stockholders’ Equity
Current liabilities: Current finance lease obligations $ 934 $ 605 Accounts payable 69,367 48,554 Accrued compensation and related expenses 24,944 10,795 Accrued expenses 58,046 52,295 Operating lease liability - current 44,011 35,390 Income taxes payable 1,447 2,394 Deferred revenues and other credits 13,007 12,237
Total current liabilities 211,756 162,270 Operating lease liability - non current 354,598 329,081 Long-term debt and finance lease obligations (includes VIE balances of $411,551 and $768,121
respectively) 608,635 1,025,535 Other long-term liabilities 22,940 24,703
Total liabilities 1,197,929 1,541,589 Commitments and contingencies Stockholders’ equity: Preferred stock ($0.01 par value, 1,000,000 shares authorized; none issued or outstanding) — — Common stock (0.01 par value, 100,000,000 shares authorized; 32,711,623 and 32,125,055
shares issued, respectively) 327 321 Treasury stock (at cost; 3,485,441 shares and 3,485,441 shares, respectively) (66,290) (66,290) Additional paid-in capital 132,108 122,513 Retained earnings 491,010 570,636
Total stockholders’ equity 557,155 627,180 Total liabilities and stockholders’ equity $ 1,755,084 $ 2,168,769
See notes to consolidated financial statements.

Table of Contents
63
CONN’S, INC. AND SUBSIDIARIES CONSOLIDATED STATEMENTS OF OPERATIONS
(dollars in thousands, except per share amounts)
Year Ended January 31, 2021 2020 2019 Revenues: Product sales $ 973,031 $ 1,042,424 $ 1,078,635 Repair service agreement commissions 78,838 106,997 101,928 Service revenues 12,442 13,814 14,111
Total net sales 1,064,311 1,163,235 1,194,674 Finance charges and other revenues 321,714 380,451 355,139
Total revenues 1,386,025 1,543,686 1,549,813 Costs and expenses: Cost of goods sold 668,315 697,784 702,135 Selling, general and administrative expense 478,767 503,024 480,561 Provision for bad debts 202,003 205,217 198,082 Charges and credits 6,326 3,142 7,780
Total costs and expenses 1,355,411 1,409,167 1,388,558 Operating income 30,614 134,519 161,255
Interest expense 50,381 59,107 62,704 (Gain) loss on extinguishment of debt (440) 1,094 1,773
Income (loss) before income taxes (19,327) 74,318 96,778 Provision (benefit) for income taxes (16,190) 18,314 22,929
Net income (loss) $ (3,137) $ 56,004 $ 73,849 Earnings (loss) per share:
Basic $ (0.11) $ 1.85 $ 2.33 Diluted $ (0.11) $ 1.82 $ 2.28
Weighted average common shares outstanding: Basic 29,060,512 30,275,662 31,668,370 Diluted 29,060,512 30,814,775 32,374,375
See notes to consolidated financial statements.

Table of Contents
64
CONN’S, INC. AND SUBSIDIARIES CONSOLIDATED STATEMENTS OF STOCKHOLDERS’ EQUITY
(in thousands, except for number of shares)
Additional Common Stock Paid-in Retained Treasury Stock Shares Amount Capital Earnings Shares Amount Total Balance January 31, 2018 31,435,775 $ 314 $ 101,087 $ 433,667 — $ — $ 535,068 Adoption of ASU 2014-09 — — — 956 — — 956 Exercise of options and vesting of restricted stock, net of withholding tax 317,465 3 (2,957) — — — (2,954) Issuance of common stock under Employee Stock Purchase Plan 34,922 1 838 — — — 839 Stock-based compensation — — 12,217 — — — 12,217 Net income — — — 73,849 — — 73,849 Balance January 31, 2019 31,788,162 $ 318 $ 111,185 $ 508,472 — $ — $ 619,975 Adoption of ASU 2016-02 — — — 6,160 — — 6,160 Exercise of options and vesting of restricted stock, net of withholding tax 283,434 2 (1,987) — — — (1,985) Issuance of common stock under Employee Stock Purchase Plan 53,459 1 765 — — — 766 Stock-based compensation — — 12,550 — — — 12,550 Common stock repurchase — — — — (3,485,441) (66,290) (66,290) Net income — — — 56,004 — — 56,004 Balance January 31, 2020 32,125,055 $ 321 $ 122,513 $ 570,636 (3,485,441) $ (66,290) $ 627,180 Adoption of ASU 2016-13 — — — (76,489) — — (76,489) Exercise of options and vesting of restricted stock, net of withholding tax 445,895 5 (1,687) — — — (1,682) Issuance of common stock under Employee Stock Purchase Plan 140,673 1 697 — — — 698 Stock-based compensation — — 10,585 — — — 10,585 Net loss — — — (3,137) — — (3,137) Balance January 31, 2021 32,711,623 $ 327 $ 132,108 $ 491,010 (3,485,441) $ (66,290) $ 557,155
See notes to consolidated financial statements.

Table of Contents
65
CONN’S, INC. AND SUBSIDIARIES CONSOLIDATED STATEMENTS OF CASH FLOWS
(in thousands)
Year Ended January 31, 2021 2020 2019 Cash flows from operating activities: Net income (loss) $ (3,137) $ 56,004 $ 73,849
Adjustments to reconcile net income (loss) to net cash provided by operating activities: Depreciation 41,068 36,841 31,584 Change in right-of-use asset 29,956 27,577 — Amortization of debt issuance costs 8,527 9,828 10,640 Provision for bad debts and uncollectible interest 265,929 269,295 250,076 Stock-based compensation expense 9,330 12,550 12,217 Charges, net of credits 6,326 3,142 — Deferred income taxes 31,323 7,488 (6,224) Gain on early termination of debt (440) — — Loss (gain) from current and deferred sale/disposal of property and equipment 497 90 (809) Tenant improvement allowances received from landlords 21,224 25,914 16,821 Change in operating assets and liabilities:
Customer accounts receivable 63,871 (266,997) (300,745) Other accounts receivables 6,595 (5,346) 5,582 Inventories 23,293 278 (8,140) Other assets 393 (6,983) 20,950 Accounts payable 17,507 (23,041) (499) Accrued expenses 15,905 (21,689) 11,158 Operating leases (40,384) (35,816) — Income taxes (35,270) (9,930) 49,685 Deferred revenues and other credits (398) 861 (14,344)
Net cash provided by operating activities 462,115 80,066 151,801 Cash flows from investing activities:
Purchases of property and equipment (55,927) (57,546) (32,814) Proceeds from asset dispositions — 724 —
Net cash used in investing activities (55,927) (56,822) (32,814) Cash flows from financing activities:
Proceeds from issuance of asset-backed notes 240,100 867,750 358,300 Payments on asset-backed notes (599,144) (505,442) (739,875) Borrowings under revolving credit facility 1,355,362 1,625,440 1,836,822 Payments on revolving credit facility (1,332,462) (1,865,069) (1,647,322) Borrowings from warehouse facility — — 173,286 Payments on warehouse facility — (53,635) (119,650) Payment for share repurchases — (66,290) — Payment of debt issuance costs and amendment fees (4,753) (7,876) (7,418) Proceeds from stock issued under employee stock purchase plan 698 988 1,237 Tax payments associated with equity-based compensation transactions (1,682) (2,216) (3,342) Payment for extinguishment of debt (84,324) — (1,178) Other (578) (976) (1,068)
Net cash used in financing activities (426,783) (7,326) (150,208) Net change in cash, cash equivalents and restricted cash (20,595) 15,918 (31,221) Cash, cash equivalents and restricted cash, beginning of period 80,855 64,937 96,158
Cash, cash equivalents and restricted cash, end of period $ 60,260 $ 80,855 $ 64,937
(continued on next page)

Table of Contents
66
Year Ended January 31, 2021 2020 2019 Non-cash investing and financing activities:
Right-of-use assets obtained in exchange for new operating lease liabilities $ 72,741 $ 75,296 $ — Right-of-use assets obtained in exchange for new financing lease liabilities $ 1,653 $ 1,110 $ — Capital lease asset additions and related obligations $ — $ — $ 1,193 Property and equipment purchases not yet paid $ 7,890 $ 9,717 $ 5,557
Supplemental cash flow data: Cash interest paid $ 41,059 $ 50,491 $ 50,568 Cash income taxes paid (refunded), net $ (11,586) $ 17,169 $ (20,447)
See notes to consolidated financial statements.

Table of Contents CONN’S, INC. AND SUBSIDIARIES
NOTES TO CONSOLIDATED FINANCIAL STATEMENTS
67
1. Summary of Significant Accounting Policies
Business. Conn’s, Inc., a Delaware corporation, is a holding company with no independent assets or operations other than its investments in its subsidiaries. References to “we,” “our,” “us,” “the Company,” “Conn’s” or “CONN” refer to Conn’s, Inc. and, as apparent from the context, its subsidiaries. Conn’s is a leading specialty retailer that offers a broad selection of quality, branded durable consumer goods and related services in addition to proprietary credit solutions for its core credit-constrained consumers. We operate an integrated and scalable business through our retail stores and website. Our complementary product offerings include furniture and mattresses, home appliances, consumer electronics and home office products from leading global brands across a wide range of price points. Our credit offering provides financing solutions to a large, under-served population of credit-constrained consumers who typically have limited credit alternatives.
We operate two reportable segments: retail and credit. Our retail stores bear the “Conn’s HomePlus” name with all of our stores providing the same products and services to a common customer group. Our stores follow the same procedures and methods in managing their operations. Our retail business and credit business are operated independently from each other. The credit segment is dedicated to providing short- and medium-term financing to our retail customers. The retail segment is not involved in credit approval decisions or collection efforts. Our management evaluates performance and allocates resources based on the operating results of the retail and credit segments.
The consolidated financial statements have been prepared in accordance with U.S. generally accepted accounting principles (“GAAP”) and prevailing industry practices.
Fiscal Year. Our fiscal year ends on January 31. References to a fiscal year refer to the calendar year in which the fiscal year ends.
Principles of Consolidation. The consolidated financial statements include the accounts of Conn’s, Inc. and its wholly-owned subsidiaries. All material intercompany transactions and balances have been eliminated in consolidation.
Variable Interest Entities. Variable Interest Entities (“VIEs”) are consolidated if the Company is the primary beneficiary. The primary beneficiary of a VIE is the party that has (i) the power to direct the activities that most significantly impact the performance of the VIE and (ii) the obligation to absorb losses or the right to receive benefits that could potentially be significant to the VIE.
We securitize customer accounts receivables by transferring the receivables to various bankruptcy-remote VIEs. We retain the servicing of the securitized portfolio and have a variable interest in each corresponding VIE by holding the residual equity. We have determined that we are the primary beneficiary of each respective VIE because (i) our servicing responsibilities for the securitized portfolio give us the power to direct the activities that most significantly impact the performance of the VIE and (ii) our variable interest in the VIE gives us the obligation to absorb losses and the right to receive residual returns that potentially could be significant. As a result, we consolidate the respective VIEs within our consolidated financial statements.
Refer to Note 6, Debt and Financing Lease Obligations, and Note 13, Variable Interest Entities, for additional information.
Use of Estimates. The preparation of financial statements in accordance with GAAP requires management to make informed judgments and estimates that affect the reported amounts of assets, liabilities, revenues and expenses, and the disclosure of contingent assets and liabilities. Changes in facts and circumstances or additional information may result in revised estimates, and actual results may differ, even significantly, from these estimates. Management evaluates its estimates and related assumptions regularly, including those related to the allowance for doubtful accounts and allowances for no-interest option credit programs, which are particularly sensitive given the size of our customer portfolio balance.
Cash and Cash Equivalents. As of January 31, 2021 and 2020, cash and cash equivalents included cash, credit card deposits in transit, and highly liquid debt instruments purchased with a maturity date of three months or less. Credit card deposits in transit included in cash and cash equivalents were $7.9 million and $4.0 million as of January 31, 2021 and 2020, respectively.
Restricted Cash. The restricted cash balance as of January 31, 2021 and 2020 includes $41.6 million and $59.7 million, respectively, of cash we collected as servicer on the securitized receivables that was subsequently remitted to the VIEs and $7.0 million and $13.9 million, respectively, of cash held by the VIEs as additional collateral for the asset-backed notes.
Customer Accounts Receivable. Customer accounts receivable reported in the Consolidated Balance Sheet includes total receivables managed, including both those transferred to the VIEs and those not transferred to the VIEs. Customer accounts receivable are recognized at the time the customer takes possession of the product. As discussed in more detail below, effective February 1, 2020 the Company adopted ASC 2016-13, Financial Instruments-Credit Losses (Topic 326): Measurement of Credit Losses on Financial Instruments. Under the newly adopted standard, expected lifetime losses on customer accounts receivable are recognized upon origination through an allowance for credit losses account that is deducted from the customer account receivable balance and presented net thereof. Customer accounts receivable include the net of unamortized deferred

Table of Contents CONN’S, INC. AND SUBSIDIARIES
NOTES TO CONSOLIDATED FINANCIAL STATEMENTS
68
fees charged to customers and origination costs. Customer receivables are considered delinquent if a payment has not been received on the scheduled due date. Accounts that are delinquent more than 209 days as of the end of a month are charged-off against the allowance for doubtful accounts along with interest accrued subsequent to the last payment.
In an effort to mitigate losses on our accounts receivable, we may make loan modifications to a borrower experiencing financial difficulty. The loan modifications are intended to maximize net cash flow after expenses and avoid the need to exercise legal remedies available to us. We may extend or “re-age” a portion of our customer accounts, which involves modifying the payment terms to defer a portion of the cash payments due. Our re-aging of customer accounts does not change the interest rate or the total principal amount due from the customer and typically does not reduce the monthly contractual payments. To a much lesser extent, we may provide the customer the ability to refinance their account, which typically does not change the interest rate or the total principal amount due from the customer but does reduce the monthly contractual payments and extend the term. We consider accounts that have been re-aged in excess of three months or refinanced as Troubled Debt Restructurings (“TDR” or “Restructured Accounts”).
On March 27, 2020 the Coronavirus Aid, Relief and Economic Security Act (“CARES Act”) was signed into law to address the economic impact of the COVID-19 pandemic. Under the CARES Act, modifications deemed to be COVID-19 related are not considered a TDR if the loan was current (not more than 30 days past due as of March 31, 2020) and the deferral was executed between April 1, 2020 and the earlier of 60 days after the termination of the COVID-19 national emergency or December 31, 2020. In response to the CARES Act, the Company implemented short-term deferral programs for our customers. The carrying value of the customer receivables on accounts which were current prior to receiving a COVID-19 related deferment was $65.2 million as of January 31, 2021.
Interest Income on Customer Accounts Receivable. Interest income, which includes interest income and amortization of deferred fees and origination costs, is recorded using the interest method and is reflected in finance charges and other revenues. Typically, interest income is recorded until the customer account is paid off or charged-off, and we provide an allowance for estimated uncollectible interest. We reserve for interest that is more than 60 days past due. Any contractual interest income received from customers in excess of the interest income calculated using the interest method is recorded as deferred revenue on our balance sheets. At January 31, 2021 and 2020, there were $8.9 million and $10.6 million, respectively, of deferred interest included in deferred revenues and other credits and other long-term liabilities. The deferred interest will ultimately be brought into income as the accounts pay off or charge-off.
We offer a 12-month no-interest option program. If the customer is delinquent in making a scheduled monthly payment or does not repay the principal in full by the end of the no-interest option program period (grace periods are provided), the account does not qualify for the no-interest provision and none of the interest earned is waived. Interest income is recognized based on estimated accrued interest earned to date on all no-interest option finance programs with an offsetting reserve for those customers expected to satisfy the requirements of the program based on our historical experience.
We recognize interest income on TDR accounts using the interest income method, which requires reporting interest income equal to the increase in the net carrying amount of the loan attributable to the passage of time. Cash proceeds and other adjustments are applied to the net carrying amount such that it equals the present value of expected future cash flows.
We place accounts in non-accrual status when legally required. Payments received on non-accrual loans will be applied to principal and reduce the balance of the loan. At January 31, 2021 and 2020, the carrying value of customer accounts receivable in non-accrual status was $8.5 million and $12.5 million, respectively. At January 31, 2021 and 2020, the carrying value of customer accounts receivable that were past due 90 days or more and still accruing interest totaled $111.5 million and $132.7 million, respectively. At January 31, 2021 and January 31, 2020, the carrying value of customer accounts receivable in a bankruptcy status that were less than 60 days past due of $5.2 million and $12.1 million, respectively, were included within the customer receivables balance carried in non-accrual status.
Inventories. Inventories consist of merchandise purchased for resale and service parts and are recorded at the lower of cost or net realizable value. The carrying value of the inventory is reduced to its net realizable value for any product lines with excess of carrying amount, typically weighted-average cost, over the amount we expect to realize from the ultimate sale or other disposition of the inventory, with a corresponding charge to cost of sales. The write-down of inventory to net realizable value is estimated based on assumptions regarding inventory aging and historical product sales.
Vendor Allowances. We receive funds from vendors for price protection, product rebates (earned upon purchase or sale of product), marketing, and promotion programs, collectively referred to as vendor allowances, which are recorded on an accrual basis. We estimate the vendor allowances to accrue based on the progress of satisfying the terms of the programs based on actual and projected sales or purchase of qualifying products. If the programs are related to product purchases, the vendor allowances are recorded as a reduction of product cost in inventory still on hand with any remaining amounts recorded as a

Table of Contents CONN’S, INC. AND SUBSIDIARIES
NOTES TO CONSOLIDATED FINANCIAL STATEMENTS
69
reduction of cost of goods sold. During the years ended January 31, 2021, 2020 and 2019, we recorded $122.7 million, $156.6 million and $143.3 million, respectively, as reductions in cost of goods sold from vendor allowances.
Property and Equipment. Property and equipment, including any major additions and improvements to property and equipment, are recorded at cost. Normal repairs and maintenance that do not materially extend the life of property and equipment are expensed as incurred. Depreciation, which includes amortization of financed leases, is computed using the straight-line method over the estimated useful lives of the assets, or in the case of leasehold improvements, over the shorter of the estimated useful lives or the remaining terms of the leases.
Internal-Use Software Costs. Costs related to software developed or obtained for internal use and cloud-based computing arrangements are expensed as incurred until the application development stage has been reached. Once the application development stage has been reached, certain qualifying costs are capitalized until the software is ready for its intended use. Costs incurred during the post implementation stage are expensed as incurred. Once placed into service, capitalized costs are amortized over periods of up to 10 years. No software costs were written-off in the years ended January 31, 2021 and 2019. For the year ended January 31, 2020, we incurred a $1.2 million loss on impairments of software costs for a loan management system that was abandoned during fiscal year 2020. See Note 4, Charges and Credits, for further details regarding fiscal year 2020 write-offs.
Impairment of Long-Lived Assets. Long-lived assets are evaluated for impairment, primarily at the asset group level. The asset group is defined as stores and cross-docks within a distribution center’s service area. We monitor asset group performance in order to assess if events or changes in circumstances indicate that the carrying amount of the assets may not be recoverable. The most likely condition that would necessitate an assessment would be an adverse change in historical and estimated future results of an asset group's performance. For property and equipment held and used, we recognize an impairment loss if the carrying amount is not recoverable through its undiscounted cash flows and measure the impairment loss based on the difference between the carrying amount and estimated fair value. During the year ended January 31, 2020, we recognized $3.2 million in impairments from the exiting of certain leases. See Note 4, Charges and Credits, for details. For the years ended January 31, 2021 and 2019 there were no impairments.
Leases. We determine if an arrangement is a lease at inception. Operating lease right-of-use assets and liabilities are recognized at the commencement date based on the present value of lease payments over the lease term. As most of our leases do not provide an implicit rate, we use our estimated incremental borrowing rate based on the information available at the commencement date in determining the present value of lease payments. If the estimate of our incremental borrowing rate was changed, our operating lease assets and liabilities could differ materially.
We record lease incentives as a reduction to the operating lease right-of-use assets upon commencement of the lease and amortize the balance on a straight-line basis over the life of the lease. Leases with an initial term of 12 months or less are not recorded on the balance sheet. Lease terms may include options to extend or terminate the lease when it is reasonably certain that we will exercise the option. Lease expense is recognized on a straight-line basis over the lease term.
We have made a policy election for all classifications of leases to combine lease and non-lease components and to account for them as a single lease component.
Debt Issuance Costs. Costs that are direct and incremental to debt issuance are deferred and amortized to interest expense using the effective interest method over the expected life of the debt. All other costs related to debt issuance are expensed as incurred. We present debt issuance costs associated with long-term debt as a reduction of the carrying amount of the debt. Unamortized costs related to the Revolving Credit Facility, as defined in Note 6, Debt and Financing Lease Obligations, are included in other assets on our Consolidated Balance Sheet and were $3.5 million and $3.5 million as of January 31, 2021 and 2020, respectively.
Revenue Recognition. The Company accounts for revenue under ASC 606 and has the following material revenue streams: the sale of products (e.g. appliances, electronics) including delivery; the sale of third party warranty and insurance programs, including retrospective income; service income; interest income generated from the financing of point of sale transactions; and volume rebate incentives received from a third party financier.
Sale of Products Including Delivery: The Company has a single performance obligation associated with these contracts: the delivery of the product to the customer, at which point control transfers. Revenue for the sale of products is recognized at the time of delivery, net of any adjustments for sales incentives such as discounts, coupons, rebates or other free products or services. Sales financed through third-party no-interest option programs typically require us to pay a fee to the third party on each completed sale, which is recorded as a reduction of net sales in the retail segment.
Sale of Third Party Warranty and Insurance Programs, Including Retrospective Income: We sell repair service agreements (“RSA”) and credit insurance contracts on behalf of unrelated third-parties. The Company has a single performance obligation

Table of Contents CONN’S, INC. AND SUBSIDIARIES
NOTES TO CONSOLIDATED FINANCIAL STATEMENTS
70
associated with these contracts: the delivery of the product to the customer, at which point control transfers. Commissions related to these contracts are recognized in revenue upon delivery of the product. We also may serve as the administrator of the RSAs sold and defer 5% of the revenue received from the sale of RSAs as compensation for this performance obligation as 5% represents the estimated stand-alone sales price to serve as the administrator. The deferred RSA administration fee is recorded in income ratably over the life of the RSA contract sold. Retrospective income on RSA contracts is recognized upon delivery of the product based on an estimate of claims and is adjusted throughout the life of the contracts as actual claims materialize. Retrospective income on insurance contracts is recognized when earned as that is the point at which we no longer believe a significant reversal of income is probable as the consideration is highly susceptible to factors outside of our influence.
Service Income: The Company has a single performance obligation associated with these contracts: the servicing of the RSA claims. Service revenues are recognized at the time service is provided to the customer.
Volume Rebate Incentive: As part of our agreement with our third-party provider of no-interest option programs, we may receive a volume rebate incentive based on the total dollar value of sales made under our third-party provider. The Company has a single performance obligation associated with this contract: the delivery of the product to the customer, at which point control transfers. Revenue for the volume rebate incentive is recognized upon delivery of the product to the customer based on the projected total annual dollar value of sales to be made under our third-party provider.
Deferred Revenue. Deferred revenue related to contracts with customers consists of deferred customer deposits and deferred RSA administration fees. During the twelve months ended January 31, 2021, we recognized $1.2 million of revenue for customer deposits deferred as of the beginning of the period compared to $1.0 million recognized during the twelve months ended January 31, 2020. During the twelve months ended January 31, 2021, we recognized $4.0 million of revenue for RSA administrative fees deferred as of the beginning of the period compared to $5.1 million recognized during the twelve months ended January 31, 2020.
Expense Classifications. We record as cost of goods sold, the direct cost of products and parts sold and related costs for delivery, transportation and handling, inbound freight, receiving, inspection, and other costs associated with the operations of our distribution system, including occupancy related to our warehousing operations. The costs associated with our merchandising, advertising, sales commissions, and all store occupancy costs, are included in selling, general and administrative expense (“SG&A”).
Advertising Costs. Advertising costs are expensed as incurred. For fiscal years 2021, 2020 and 2019, advertising expense was $72.5 million, $84.8 million and $80.5 million, respectively.
Stock-based Compensation. Stock-based compensation expense is recorded for share-based compensation awards, net of actual forfeitures, over the requisite service period using the straight-line method. For equity-classified share-based compensation awards, expense is recognized based on the grant-date fair value. For stock option grants, we use the Black-Scholes model to determine fair value. For grants of restricted stock units, the fair value of the grant is the market value of our stock at the date of issuance. For grants of performance-based restricted stock units, the fair value of the grant is the market value of our stock at the date of issuance adjusted for any market conditions.
Self-insurance. We are self-insured for certain losses relating to group health, workers’ compensation, automobile, general and product liability claims. We have stop-loss coverage to limit the exposure arising from these claims. Self-insurance losses for claims filed and claims incurred, but not reported, are accrued based upon our estimates of the net aggregate liability for claims incurred using development factors based on historical experience.
Income Taxes. We are subject to U.S. federal income tax as well as income tax in multiple state jurisdictions. We follow the liability method of accounting for income taxes. Under this method, deferred tax assets and liabilities are determined based on temporary differences between GAAP and tax bases of assets and liabilities and for operating loss and tax credit carryforwards, as measured using the enacted tax rates expected to be in effect when the temporary differences are expected to be realized or settled. The effect on deferred tax assets and liabilities of a change in tax rates is recognized in income in the period in which the enactment occurs. A valuation allowance is provided when it is more-likely-than-not that some portion or all of a deferred tax asset will not be realized. The ultimate realization of deferred tax assets is dependent upon the generation of future taxable income during the periods in which those temporary differences become realizable. To the extent penalties and interest are incurred, we record these charges as a component of our provision for income taxes.
We review and update our tax positions as necessary to add any new uncertain tax positions taken, or to remove previously identified uncertain positions that have been adequately resolved. Additionally, uncertain positions may be remeasured as warranted by changes in facts or law. Accounting for uncertain tax positions requires estimating the amount, timing and likelihood of ultimate settlement.

Table of Contents CONN’S, INC. AND SUBSIDIARIES
NOTES TO CONSOLIDATED FINANCIAL STATEMENTS
71
Earnings per Share. Basic earnings per share is calculated by dividing net income by the weighted-average number of common shares outstanding during the period. Diluted earnings per share includes the dilutive effects of any stock options, restricted stock unit awards (“RSUs”) and performance stock awards (“PSUs”), which are calculated using the treasury-stock method. The following table sets forth the shares outstanding for the earnings per share calculations:
Year Ended January 31, 2021 2020 2019 Weighted-average common shares outstanding - Basic 29,060,512 30,275,662 31,668,370 Dilutive effect of stock options, RSUs and PSUs — 539,113 706,005 Weighted-average common shares outstanding - Diluted 29,060,512 30,814,775 32,374,375
For the years ended January 31, 2021, 2020 and 2019, the weighted-average number of stock options, RSUs, and PSUs not included in the calculation due to their anti-dilutive effect, was 1,097,996, 898,449 and 578,951, respectively.
Contingencies. An estimated loss from a contingency is recorded if it is probable that an asset has been impaired or a liability has been incurred at the date of the financial statements and the amount of the loss can be reasonably estimated. Gain contingencies are not recorded until realization is assured beyond a reasonable doubt. Legal costs related to loss contingencies are expensed as incurred.
Fair Value of Financial Instruments. Fair value is defined as the price that would be received to sell an asset or paid to transfer a liability in an orderly transaction between market participants at the measurement date. Assets and liabilities recorded at fair value are categorized using defined hierarchical levels related to subjectivity associated with the inputs to fair value measurements as follows:
• Level 1 – Inputs represent unadjusted quoted prices in active markets for identical assets or liabilities.
• Level 2 – Inputs other than quoted prices included within Level 1 that are observable for the asset or liability, either directly or indirectly (for example, quoted market prices for similar assets or liabilities in active markets or quoted market prices for identical assets or liabilities in markets not considered to be active, inputs other than quoted prices that are observable for the asset or liability, or market-corroborated inputs).
• Level 3 – Inputs that are not observable from objective sources such as our internally developed assumptions used in pricing an asset or liability (for example, an estimate of future cash flows used in our internally developed present value of future cash flows model that underlies the fair-value measurement).
In determining fair value, we use observable market data when available, or models that incorporate observable market data. When we are required to measure fair value and there is not a market-observable price for the asset or liability or for a similar asset or liability, we use the cost or income approach depending on the quality of information available to support management’s assumptions. The cost approach is based on management’s best estimate of the current asset replacement cost. The income approach is based on management’s best assumptions regarding expectations of future net cash flows and discounts the expected cash flows using a commensurate risk-adjusted discount rate. Such evaluations involve significant judgment, and the results are based on expected future events or conditions such as sales prices, economic and regulatory climates, and other factors, most of which are often outside of management’s control. However, we believe assumptions used reflect a market participant’s view of long-term prices, costs, and other factors and are consistent with assumptions used in our business plans and investment decisions.
In arriving at fair-value estimates, we use relevant observable inputs available for the valuation technique employed. If a fair-value measurement reflects inputs at multiple levels within the hierarchy, the fair-value measurement is characterized based on the lowest level of input that is significant to the fair-value measurement.
The fair value of cash and cash equivalents, restricted cash and accounts payable approximate their carrying amounts because of the short maturity of these instruments. The fair value of customer accounts receivable, determined using a Level 3 discounted cash flow analysis, approximates their carrying value, net of the allowance for doubtful accounts. The fair value of our Revolving Credit Facility approximates carrying value based on the current borrowing rate for similar types of borrowing arrangements. At January 31, 2021, the fair value of the Senior Notes outstanding approximates their carrying value and was determined using Level 1 inputs. At January 31, 2021, the fair value of the asset-backed notes was $416.3 million, compared to the carrying value of $414.0 million, which was determined using Level 2 inputs based on inactive trading activity.
Recent Accounting Pronouncements Adopted. In June 2016, the FASB issued ASU 2016-13, Financial Instruments-Credit Losses (Topic 326): Measurement of Credit Losses on Financial Instruments (“ASC 326”). ASU 2016-13 replaces the incurred loss methodology with an expected loss methodology that is referred to as the current expected credit loss (CECL)

Table of Contents CONN’S, INC. AND SUBSIDIARIES
NOTES TO CONSOLIDATED FINANCIAL STATEMENTS
72
methodology. Under the new guidance entities must reserve an allowance for expected credit losses over the life of the loan. The measurement of expected credit losses is applicable to financial assets measured at amortized cost. The allowance for credit losses is a valuation account that is deducted from the customer account receivable’s amortized cost basis to present the net amount expected to be collected. Customer receivables are charged off against the allowance when management deems an account to be uncollectible. In April 2019, the FASB issued ASU 2019-04, Codification Improvements to Topic 326, Financial Instruments - Credit Losses. ASU 2019-04 requires that the current estimate of recoveries are included in the allowance for credit losses.
Effective February 1, 2020, the Company adopted ASU 2016-13 and ASU 2019-04 using the modified retrospective approach. The Company has reviewed its entire portfolio of assets recognized on the balance sheet as of January 31, 2020 and identified Customer Accounts Receivables as the materially impacted asset in-scope of ASC 326. The risk of credit losses from the remaining portfolio of assets was concluded to be immaterial. Upon adoption of ASC 326 the Company recorded a net decrease to retained earnings of $76.5 million as of February 1, 2020. Results for reporting periods prior to February 1, 2020 are not adjusted and continue to be reported in accordance with the Company’s historic accounting policies under previously applicable GAAP.
The allowance for credit losses is measured on a collective (pool) basis where similar risk characteristics exist. Upon adoption of ASC 326, the Company elected to maintain the pools of customer accounts receivable that were previously accounted for under ASC 310 (Non-TDR Non-Re-aged, Non-TDR Re-aged, and TDR). These pools are further segmented based on shared risk attributes, which include the borrower’s FICO score, product class, length of customer relationship and delinquency status. The allowance for credit losses is determined for each pool and added to the pool’s carrying amount to establish a new amortized cost basis. Changes to the allowance for credit losses after adoption are recorded through provision expense.
We have elected to use a risk-based, pool-level segmentation framework to calculate the expected loss rate. This framework is based on our historical gross charge-off history. In addition to adjusted historical gross charge-off rates, estimates of post-charge-off recoveries, including cash payments from customers, sales tax recoveries from taxing jurisdictions, and payments received under credit insurance and repair service agreement (“RSA”) policies are also considered. We also consider forward-looking economic forecasts based on a statistical analysis of economic factors (specifically, forecast of unemployment rates over the reasonable and supportable forecasting period). To the extent that situations and trends arise which are not captured in our model, management will layer on additional qualitative adjustments.
The Company uses a 24-month reasonable and supportable forecast period for the Customer Accounts Receivable portfolio. We estimate losses beyond the 24-month forecast period based on historic loss rates experienced over the life of our historic loan portfolio by loan pool type. We revisit our measurement methodology and assumption annually, or more frequently if circumstances warrant.
The cumulative effect of the changes made to the Company’s Consolidated Balance Sheet as a result of the adoption of ASC 326 were as follows:
Impact of Adoption of ASC 326
(in thousands) Balance at January
31, 2020 Adjustments due to
ASC 326 Balance at
February 1, 2020 Assets
Customer accounts receivable $ 673,742 $ (49,700) $ 624,042 Long-term portion of customer accounts receivable 663,761 (48,962) 614,799 Deferred Income Taxes 18,599 22,173 40,772
Stockholders’ Equity Retained Earnings $ 570,636 $ (76,489) $ 494,147
Leases. In February 2016 the Financial Accounting Standards Board (“FASB”) issued ASU 2016-02, Leases (Topic 842), which requires lessees to recognize assets and liabilities for most leases. Effective February 1, 2019, the Company adopted ASU 2016-02 using the modified retrospective approach. For most leases, a liability was recorded on the balance sheet based on the present value of future lease obligations with a corresponding right-of-use asset. Primarily for those leases currently classified by us as operating leases, we recognize a single lease cost on a straight line basis. Other leases are required to be accounted for as financing arrangements similar to how we previously accounted for capital leases. Upon adoption we elected a package of practical expedients permitted under the transition guidance within the new standard. The practical expedients adopted allowed us to carry forward the historical lease classification, allowed us to not separate and allocate the consideration paid between lease and non-lease components included within a contract and allowed us to carry forward our

Table of Contents CONN’S, INC. AND SUBSIDIARIES
NOTES TO CONSOLIDATED FINANCIAL STATEMENTS
73
accounting treatment for land easements on existing agreements. We also adopted an optional transition method that waived the requirement to apply this ASU in the comparative periods presented within the financial statements in the year of adoption.
Additionally, we have elected the short-term policy election for the Company for any lease that, at the commencement date, has a lease term of twelve months or less. We will not recognize a lease liability or right-of-use asset on the balance sheet for any of our short-term leases. Rather, the short-term lease payments will be recognized as an expense on a straight-line basis over the lease term. The current period short-term lease expense reasonably reflects our short-term lease commitments.
The cumulative effect of the changes made to the Company’s Condensed Consolidated Balance Sheet as a result of the adoption of ASC 842 were as follows (in thousands):
Impact of Adoption of ASC 842
(in thousands) Balance at January
31, 2019 Adjustments due to
ASC 842 Balance at February
1, 2019 Assets Current assets (1) $ 1,014,394 $ (2,983) $ 1,011,411 Operating lease right-of-use assets (2) — 227,421 227,421 Deferred income taxes (3) 27,535 (1,447) 26,088 Liabilities Current liabilities (4) 237,568 (12,426) 225,142 Operating lease liability - current (5) — 29,815 29,815 Deferred rent (4) 93,127 (93,127) — Operating lease liability - non-current (5) — 300,170 300,170 Other long-term liabilities (3) 33,015 (7,606) 25,409 Stockholder’s equity (3) 619,975 6,160 626,135 (1) Reclassification of the $3.0 million January 31, 2019 balance of accounts receivable for tenant improvement allowances to
a reduction in the operating lease liability.
(2) The operating lease right-of-use assets represent the present value of the lease liability offset by the full value of deferred rent and tenant improvement allowances received from the lessor which had not been utilized as of the date of adoption.
(3) A net cumulative-effect adjustment to increase retained earnings by $6.2 million to recognize the $7.6 million January 31, 2019 balance of deferred gains which resulted from sale and operating leaseback transactions made at off-market terms offset by the $1.4 million impact on our deferred tax asset related to the sale-leaseback transactions.
(4) Reclassification of the full value of deferred rent and tenant improvement allowances received from lessors, which were previously recorded as liabilities as they had not been utilized as of the date of adoption, to a reduction of the operating lease right-of-use assets.
(5) The operating lease liability represents the $340.5 million present value of future operating lease obligations as of January 31, 2019, offset by $10.5 million of accounts receivable for tenant improvement allowances.
Cloud Computing Arrangements. In August 2018, the FASB issued ASU 2018-15, Customer’s Accounting for Implementation Costs Incurred in a Cloud Computing Arrangement That Is a Service Contract. ASU 2018-15 requires companies to apply the accounting guidance as prescribed by ASC 350- 40, Internal Use Software, in determining which cloud-based implementation costs should be capitalized as assets or expensed as incurred. The internal-use software guidance requires the capitalization of certain costs incurred during the application development stage of an internal-use software project, while requiring companies to expense all costs incurred during preliminary project and post-implementation project stages. The standard may be applied either prospectively to all implementation costs incurred after the adoption date or retrospectively. ASU 2018-15 is effective for annual and interim periods beginning after December 15, 2019, with early adoption permitted. The Company elected to early adopt ASU 2018-15 on a prospective basis effective February 1, 2019. Costs eligible for capitalization are capitalized within prepaid expenses and other assets and expensed through operating expenses in the consolidated balance sheets and statements of operations, respectively. Prior to adoption, eligible costs were capitalized within property and equipment and expensed through depreciation.
Changes due to Securities and Exchange Commission Regulation S-X Rules 13-01 and 13-02. In March 2020, the Securities and Exchange Commission (“SEC”) amended Regulation S-X to create Rules 13-01 and 13-02. These new rules reduce and

Table of Contents CONN’S, INC. AND SUBSIDIARIES
NOTES TO CONSOLIDATED FINANCIAL STATEMENTS
74
simplify financial disclosure requirements for issuers and guarantors of registered debt offerings. Previously, with limited exceptions, a parent entity was required to provide detailed disclosures with regard to guarantors of registered debt offerings within the footnotes to the consolidated financial statements. Under the new regulations, disclosure exceptions have been expanded and required disclosures may be provided within Item 2. Management’s Discussion and Analysis of Financial Condition and Results of Operations rather than in the notes to the financial statements. Further, summarized guarantor balance sheet and income statements are permitted, with the requirement to provide guarantor cash flow statements eliminated. Summarized guarantor financial statements only need be disclosed for the current fiscal year rather than all years presented in the financial statements as was previously required. The guidance will become effective for filings on or after January 4, 2021, with early adoption permitted.
The Company elected to early adopt the new regulations beginning with the first quarter of fiscal year 2021. Our summarized guarantor financial statements are presented outside the audited financial statements in Item 2. Management’s Discussion and Analysis of Financial Condition and Results of Operations.
Recent Accounting Pronouncements Yet To Be Adopted.
Simplifying the Accounting for Income Taxes. In December 2019, the FASB issued ASU 2019-12, Income Taxes (Topic 740): Simplifying the Accounting for Income Taxes, an update intended to simplify various aspects related to accounting for income taxes. This guidance removes certain exceptions to the general principles in Topic 740 and also clarifies and amends existing guidance to improve consistent application. This accounting standards update will be effective for us beginning in the first quarter of fiscal 2022, with early adoption permitted. We do not expect the adoption to have a material impact on our consolidated financial statements.
Reference Rate Reform on Financial Reporting. In March 2020, the FASB issued ASU 2020-04, Reference Rate Reform (Topic 848): Facilitation of the Effects of Reference Rate Reform on Financial Reporting, an update that provides optional expedients and exceptions for applying GAAP to contracts, hedging relationships, and other transactions affected by reference rate reform if certain criteria are met. The amendments in this update apply only to contracts, hedging relationships, and other transactions that reference LIBOR or another reference rate expected to be discontinued because of reference rate reform. This accounting standards update was effective upon issuance, with adoption permitted through December 31, 2022. We expect to adopt ASC 2020-04 in the first quarter of fiscal 2022. We do not expect the adoption to have a material impact on our consolidated financial statements.
No other new accounting pronouncements issued or effective as of January 31, 2021 have had or are expected to have a material impact on our consolidated financial statements.
2. Customer Accounts Receivable
Customer accounts receivable consisted of the following:
(in thousands) January 31,
2021 January 31,
2020 Customer accounts receivable (1) $ 1,233,717 $ 1,602,037 Deferred fees and origination costs, net (14,212) (15,746) Allowance for no-interest option credit programs (11,985) (14,984) Allowance for uncollectible interest (21,427) (23,662) Carrying value of customer accounts receivable 1,186,093 1,547,645 Allowance for credit losses (2) (276,610) (210,142) Carrying value of customer accounts receivable, net of allowance for bad debts 909,483 1,337,503
Short-term portion of customer accounts receivable, net (478,734) (673,742) Long-term customer accounts receivable, net $ 430,749 $ 663,761
Carrying Value
(in thousands) January 31,
2021 January 31,
2020 Customer accounts receivable 60+ days past due (3) $ 146,820 $ 193,797 Re-aged customer accounts receivable (4) 306,845 455,704 Restructured customer accounts receivable (5) 178,374 211,857

Table of Contents CONN’S, INC. AND SUBSIDIARIES
NOTES TO CONSOLIDATED FINANCIAL STATEMENTS
75
(1) As of January 31, 2021 and 2020, the customer accounts receivable balance included $31.1 million and $43.7 million, respectively, in interest receivable. Net of the allowance for uncollectible interest, interest receivable outstanding as of January 31, 2021 and 2020 was $9.7 million and $20.0 million, respectively.
(2) Our current methodology to estimate expected credit losses utilized macroeconomic forecasts as of January 31, 2021, which incorporated the continued estimated impact of the global COVID-19 outbreak on the U.S. economy. Our forecast utilized economic projections from a major rating service reflecting an increase in unemployment. The allowance for credit losses as of January 31, 2020 is based on an incurred loss model, which reserves for incurred losses in the portfolio as of January 31, 2020.
(3) As of January 31, 2021 and 2020, the carrying value of customer accounts receivable past due one day or greater was $340.8 million and $527.0 million, respectively. These amounts include the 60+ days past due balances shown above.
(4) The re-aged carrying value as of January 31, 2021 and 2020 includes $88.0 million and $131.4 million, respectively, in carrying value that are both 60+ days past due and re-aged.
(5) The restructured carrying value as of January 31, 2021 and 2020 includes $57.1 million and $64.8 million, respectively, in carrying value that are both 60+ days past due and restructured.
The allowance for credit losses included in the current and long-term portion of customer accounts receivable, net as shown in the Condensed Consolidated Balance Sheet were as follows:
(in thousands) January 31, 2021 Customer accounts receivable - current $ 643,903 Allowance for credit losses for customer accounts receivable - current (165,169) Customer accounts receivable, net of allowances 478,734 Customer accounts receivable - non current 563,617 Allowance for credit losses for customer accounts receivable - non current (132,868) Long-term portion of customer accounts receivable, net of allowances 430,749 Total customer accounts receivable, net $ 909,483
The following presents the activity in our allowance for credit losses and uncollectible interest for customer accounts receivable:
January 31, 2021
(in thousands) Customer Accounts
Receivable Restructured
Accounts Total Allowance at beginning of period $ 145,680 $ 88,124 $ 233,804 Impact of adoption ASC 326 95,136 3,526 98,662 Provision (1) 185,210 80,276 265,486 Principal charge-offs (2)(5) (178,777) (81,142) (259,919) Interest charge-offs (50,060) (22,721) (72,781) Recoveries (3) 22,550 10,235 32,785
Allowance at end of period $ 219,739 $ 78,298 $ 298,037
Average total customer portfolio balance $ 1,184,174 $ 211,254 $ 1,395,428

Table of Contents CONN’S, INC. AND SUBSIDIARIES
NOTES TO CONSOLIDATED FINANCIAL STATEMENTS
76
January 31, 2020
(in thousands) Customer Accounts
Receivable Restructured
Accounts Total Allowance at beginning of period $ 147,123 $ 67,756 $ 214,879 Provision (4) 177,250 91,356 268,606 Principal charge-offs (2) (158,773) (63,074) (221,847) Interest charge-offs (37,850) (15,037) (52,887) Recoveries (2) 17,930 7,123 25,053
Allowance at end of period $ 145,680 $ 88,124 $ 233,804
Average total customer portfolio balance $ 1,367,260 $ 200,618 $ 1,567,878
January 31, 2019
(in thousands) Customer Accounts
Receivable Restructured
Accounts Total Allowance at beginning of period $ 148,856 $ 54,716 $ 203,572 Provision (4) 174,552 74,514 249,066 Principal charge-offs (2) (157,789) (55,024) (212,813) Interest charge-offs (32,432) (11,310) (43,742) Recoveries (2) 13,936 4,860 18,796
Allowance at end of period $ 147,123 $ 67,756 $ 214,879
Average total customer portfolio balance $ 1,355,011 $ 171,717 $ 1,526,728
(1) Includes provision for uncollectible interest, which is included in finance charges and other revenues, and changes in expected future recoveries.
(2) Charge-offs include the principal amount of losses (excluding accrued and unpaid interest). Recoveries include the principal amount collected during the period for previously charged-off balances. Net charge-offs are calculated as the net of principal charge-offs and recoveries.
(3) Recoveries include the principal amount collected during the period for previously charged-off balances.
(4) Includes provision for uncollectible interest, which is included in finance charges and other revenues.
(5) The increase in bad debt charge-offs, net of recoveries, was primarily due to an increase in new customer mix and the impact of difficulties in collection efforts related to the implementation of our new loan management system during the fourth quarter of fiscal year 2020.
We manage our Customer Accounts Receivable portfolio using delinquency as a key credit quality indicator. The following table presents the delinquency distribution of the carrying value of customer accounts receivable by calendar year of origination as of January 31, 2021:
(dollars in thousands) Delinquency Bucket 2021 2020 2019 2018 Prior Total % of Total Current $53,855 $458,502 $249,148 $75,599 $8,146 $845,250 71.2% 1-30 — 60,308 61,061 25,190 4,964 151,523 12.8% 31-60 — 14,216 17,613 8,302 2,369 42,500 3.6% 61-90 — 10,601 13,753 6,589 2,009 32,952 2.8% 91+ — 28,041 52,722 24,962 8,143 113,868 9.6% Total $53,855 $571,668 $394,297 $140,642 $25,631 $1,186,093 100.0%

Table of Contents CONN’S, INC. AND SUBSIDIARIES
NOTES TO CONSOLIDATED FINANCIAL STATEMENTS
77
3. Property and Equipment
Property and equipment consist of the following:
Estimated January 31, (dollars in thousands) Useful Lives 2021 2020 Land — $ 1,644 $ 1,644 Buildings 30 years 4,115 4,115 Leasehold improvements 5 to 15 years 313,926 285,524 Equipment and fixtures 3 to 5 years 97,407 92,634 Finance leases 3 to 20 years 9,027 8,032 Construction in progress — 14,702 8,846
440,821 400,795 Less accumulated depreciation (249,859) (227,764)
$ 190,962 $ 173,031
Depreciation expense was approximately $41.1 million, $36.8 million and $31.6 million for the years ended January 31, 2021, 2020 and 2019, respectively. Construction in progress is comprised primarily of the construction of leasehold improvements related to unopened retail stores and internal-use software under development. Finance lease assets primarily include retail locations.
4. Charges and Credits
Charges and credits consisted of the following:
Year Ended January 31, (in thousands) 2021 2020 2019 Store and facility closure and relocation costs $ — $ 1,933 $ — Legal and professional fees, securities-related litigation, a legal judgment and other legal matters 3,589 — 5,100
Indirect tax audit reserve — — 1,943 Employee severance 2,737 — 737 Write-off of capitalized software costs — 1,209 — $ 6,326 $ 3,142 $ 7,780
During the year ended January 31, 2021, we recognized $3.6 million in professional fees associated with non-recurring expenses. In addition, we recognized $2.7 million in severance costs related to a change in the executive management team. During the year ended January 31, 2020, we recognized $3.2 million in impairments from the exiting of certain leases upon the relocation of three distribution centers into one facility. These facility closure costs were offset by a $0.7 million gain from increased sublease income related to the consolidation of our corporate headquarters and a $0.6 million gain from the sale of a cross-dock. In addition, we recognized $1.2 million in impairments of software costs for a loan management system that was abandoned during the third quarter of fiscal year 2020 related to the implementation of a new loan management system. During the year ended January 31, 2019, we recorded a contingency reserve related to a regulatory matter, a charge related to an increase in our indirect tax audit reserve, severance costs related to a change in the executive management team and costs related to a judgment in favor of TF LoanCo (“TFL”) requiring Conn’s to pay approximately $4.8 million to TFL related to a breach of contract lawsuit brought by the Company.

Table of Contents CONN’S, INC. AND SUBSIDIARIES
NOTES TO CONSOLIDATED FINANCIAL STATEMENTS
78
5. Finance Charges and Other Revenues
Finance charges and other revenues consisted of the following:
Year Ended January 31, (in thousands) 2021 2020 2019 Interest income and fees $ 303,209 $ 341,224 $ 325,136 Insurance income 17,689 38,417 29,556 Other revenues 816 810 447
Total finance charges and other revenues $ 321,714 $ 380,451 $ 355,139
Interest income and fees and insurance income are derived from the credit segment operations, whereas other revenues are derived from the retail segment operations. Insurance income is comprised of sales commissions from third-party insurance companies that are recognized when coverage is sold and retrospective income paid by the insurance carrier if insurance claims are less than earned premiums.
For the years ended January 31, 2021, 2020 and 2019, interest income and fees reflected provisions for uncollectible interest of $63.9 million, $64.1 million and $52.0 million, respectively. The amount included in interest income and fees related to TDR accounts for the years ended January 31, 2021, 2020 and 2019 is $37.5 million, $35.3 million and $27.2 million, respectively.
6. Debt and Financing Lease Obligations
Debt and financing lease obligations consisted of the following:
January 31, (in thousands) 2021 2020 Revolving Credit Facility $ 52,000 $ 29,100 Senior Notes 141,172 227,000 2017-B VIE Asset-backed Class C Notes — 59,655 2018-A VIE Asset-backed Class A Notes — 34,112 2018-A VIE Asset-backed Class B Notes — 20,572 2018-A VIE Asset-backed Class C Notes — 20,572 2019-A VIE Asset-backed Class A Notes 19,521 76,241 2019-A VIE Asset-backed Class B Notes 25,069 64,750 2019-A VIE Asset-backed Class C Notes 24,202 62,510 2019-B VIE Asset-backed Class A Notes 17,860 265,810 2019-B VIE Asset-backed Class B Notes 85,540 85,540 2019-B VIE Asset-backed Class C Notes 83,270 83,270 2020-A VIE Asset-backed Class A Notes 93,326 — 2020-A VIE Asset-backed Class B Notes 65,200 — Financing lease obligations 6,072 5,209
Total debt and financing lease obligations 613,232 1,034,341 Less:
Discount on debt (524) (1,404) Deferred debt issuance costs (3,139) (6,797) Current maturities of long-term debt and financing lease obligations (934) (605) Long-term debt and financing lease obligations $ 608,635 $ 1,025,535
Future maturities of debt, excluding financing lease obligations, as of January 31, 2021 are as follows:

Table of Contents CONN’S, INC. AND SUBSIDIARIES
NOTES TO CONSOLIDATED FINANCIAL STATEMENTS
79
(in thousands) Year Ended January 31,
2022 $ — 2023 193,172 2024 68,792 2025 186,670 2026 158,526
Total $ 607,160
Senior Notes. On July 1, 2014, we issued $250.0 million of unsecured Senior Notes due July 2022 bearing interest at 7.25%, (the “Senior Notes”) pursuant to an indenture dated July 1, 2014 (as amended, the “Indenture”), among Conn’s, Inc., its subsidiary guarantors (the “Guarantors”) and U.S. Bank National Association, as trustee. The effective interest rate of the Senior Notes after giving effect to the discount and issuance costs is 7.8%.
The Indenture restricts the Company’s and certain of its subsidiaries’ ability to: (i) incur indebtedness; (ii) pay dividends or make other distributions in respect of, or repurchase or redeem, our capital stock (“restricted payments”); (iii) prepay, redeem or repurchase debt that is junior in right of payment to the notes; (iv) make loans and certain investments; (v) sell assets; (vi) incur liens; (vii) enter into transactions with affiliates; and (viii) consolidate, merge or sell all or substantially all of our assets. These covenants are subject to a number of important exceptions and qualifications. During any time when the Senior Notes are rated investment grade by either of Moody’s Investors Service, Inc. or Standard & Poor’s Ratings Services and no default (as defined in the Indenture) has occurred and is continuing, many of such covenants will be suspended and we will cease to be subject to such covenants during such period. As of January 31, 2021, $188.6 million was free from the restricted payments covenant contained in the Indenture. Events of default under the Indenture include customary events, such as a cross-acceleration provision in the event that we fail to make payment of other indebtedness prior to the expiration of any applicable grace period or upon acceleration of indebtedness prior to its stated maturity date in an amount exceeding $25.0 million, as well as in the event a judgment is entered against us in excess of $25.0 million that is not discharged, bonded or insured.
On December 28, 2020, the Company retired $85.8 million aggregate principal amount of its Senior Notes in connection with a tender offer.
Asset-backed Notes. From time to time, we securitize customer accounts receivables by transferring the receivables to various bankruptcy-remote VIEs. In turn, the VIEs issue asset-backed notes secured by the transferred customer accounts receivables and restricted cash held by the VIEs.
Under the terms of the securitization transactions, all cash collections and other cash proceeds of the customer receivables go first to the servicer and the holders of issued notes, and then to us as the holder of non-issued notes, if any, and residual equity. We retain the servicing of the securitized portfolios and receive a monthly fee of 4.75% (annualized) based on the outstanding balance of the securitized receivables. In addition, we, rather than the VIEs, retain all credit insurance income together with certain recoveries related to credit insurance and repair service agreements on charge-offs of the securitized receivables, which are reflected as a reduction to net charge-offs on a consolidated basis.
The asset-backed notes were offered and sold to qualified institutional buyers pursuant to the exemptions from registration provided by Rule 144A under the Securities Act. If an event of default were to occur under the indenture that governs the respective asset-backed notes, the payment of the outstanding amounts may be accelerated, in which event the cash proceeds of the receivables that otherwise might be released to the residual equity holder would instead be directed entirely toward repayment of the asset-backed notes, or if the receivables are liquidated, all liquidation proceeds could be directed solely to repayment of the asset-backed notes as governed by the respective terms of the asset-backed notes. The holders of the asset-backed notes have no recourse to assets outside of the VIEs. Events of default include, but are not limited to, failure to make required payments on the asset-backed notes or specified bankruptcy-related events.

Table of Contents CONN’S, INC. AND SUBSIDIARIES
NOTES TO CONSOLIDATED FINANCIAL STATEMENTS
80
The asset-backed notes outstanding as of January 31, 2021 consisted of the following:
(dollars in thousands)
Asset-Backed Notes
Original Principal Amount
Original Net
Proceeds (1)
Current Principal Amount
Issuance Date
Maturity Date
Contractual Interest Rate
Effective Interest Rate (2)
2019-A Class A Notes $ 254,530 $ 253,026 $ 19,521 4/24/2019 10/16/2023 3.40% 4.43% 2019-A Class B Notes 64,750 64,276 25,069 4/24/2019 10/16/2023 4.36% 4.84% 2019-A Class C Notes 62,510 61,898 24,202 4/24/2019 10/16/2023 5.29% 5.74% 2019-B Class A Notes 317,150 315,417 17,860 11/26/2019 6/17/2024 2.66% 4.32% 2019-B Class B Notes 85,540 84,916 85,540 11/26/2019 6/17/2024 3.62% 4.16% 2019-B Class C Notes 83,270 82,456 83,270 11/26/2019 6/17/2024 4.60% 4.96% 2020-A Class A Notes 174,900 173,716 93,326 10/16/2020 6/16/2025 1.71% 4.08% 2020-A Class B Notes 65,200 64,754 65,200 10/16/2020 6/16/2025 4.27% 5.12% Total $ 1,107,850 $ 1,100,459 $ 413,988
(1) After giving effect to debt issuance costs.
(2) For the year ended January 31, 2021, and inclusive of the impact of changes in timing of actual and expected cash flows.
On October 16, 2020, the Company completed the issuance and sale of $240.1 million aggregate principal amount of asset-backed notes secured by the transferred customer accounts receivables and restricted cash held by a consolidated VIE, which resulted in net proceeds to us of $238.5 million, net of debt issuance costs. Net proceeds from the offering were used to repay indebtedness under the Company’s Revolving Credit Facility, as defined below, and for other general corporate purposes. The asset-backed notes mature on June 16, 2025 and consist of $174.9 million of 1.71% Asset Backed Fixed Rate Notes, Class A, Series 2020-A and $65.2 million of 4.27% Asset Backed Fixed Rate Notes, Class B, Series 2020-A. Additionally, the Company issued $62.9 million in aggregate principal amount of 7.10% Asset Backed Fixed Rate Notes, Class C, Series 2020-A which mature on June 16, 2025. The interest rate on the Class C, Series 2020-A Notes was reduced to 4.20% in connection with a sale of such notes on February 24, 2021. See Note 17. Subsequent Events, for details.
Revolving Credit Facility. On May 23, 2018, Conn’s, Inc. and certain of its subsidiaries (the “Borrowers”) entered into the Fourth Amended and Restated Loan and Security Agreement (the “Fourth Amendment”), dated as of October 30, 2015, with certain lenders, which provides for a $650.0 million asset-based revolving credit facility (as amended, the “Revolving Credit Facility”) under which credit availability is subject to a borrowing base and a maturity date of May 23, 2022.
The Revolving Credit Facility provides funding based on a borrowing base calculation that includes customer accounts receivable and inventory, and provides for a $40.0 million sub-facility for letters of credit to support obligations incurred in the ordinary course of business. The obligations under the Revolving Credit Facility are secured by substantially all assets of the Company, excluding the assets of the VIEs. As of January 31, 2021, we had immediately available borrowing capacity of $336.0 million under our Revolving Credit Facility, net of standby letters of credit issued of $22.5 million. We also had $239.5 million that may become available under our Revolving Credit Facility if we grow the balance of eligible customer receivables and total eligible inventory balances.
On June 5, 2020 we entered into the Third Amendment to our Revolving Credit Facility (the “Third Amendment”). Under the Third Amendment, loans under the Revolving Credit Facility bear interest, at our option, at a rate of LIBOR plus a margin ranging from 3.00% to 3.75% per annum (depending on a pricing grid determined by our total leverage ratio) or the alternate base rate plus a margin ranging from 2.00% to 2.75% per annum (depending on a pricing grid determined by our total leverage ratio). The alternate base rate is a rate per annum equal to the greatest of the prime rate, the federal funds effective rate plus 0.5%, or LIBOR for a 30-day interest period plus 1.0%. We also pay an unused fee on the portion of the commitments that is available for future borrowings or letters of credit at a rate ranging from 0.25% to 0.50% per annum, depending on the average outstanding balance and letters of credit of the Revolving Credit Facility in the immediately preceding quarter. The weighted-average interest rate on borrowings outstanding and including unused line fees under the Revolving Credit Facility was 5.9% for the year ended January 31, 2021.
The Revolving Credit Facility places restrictions on our ability to incur additional indebtedness, grant liens on assets, make distributions on equity interests, dispose of assets, make loans, pay other indebtedness, engage in mergers, and other matters. The Revolving Credit Facility restricts our ability to make dividends and distributions unless no event of default exists and a liquidity test is satisfied. Subsidiaries of the Company may pay dividends and make distributions to the Company and other obligors under the Revolving Credit Facility without restriction. As of January 31, 2021, we were restricted from making

Table of Contents CONN’S, INC. AND SUBSIDIARIES
NOTES TO CONSOLIDATED FINANCIAL STATEMENTS
81
distributions, including repayments of the Senior Notes or other distributions, in excess of $240.1 million as a result of the Revolving Credit Facility distribution restrictions. The Revolving Credit Facility contains customary default provisions, which, if triggered, could result in acceleration of all amounts outstanding under the Revolving Credit Facility.
Debt Covenants. We were in compliance with our debt covenants at January 31, 2021. A summary of the significant financial covenants that govern our Revolving Credit Facility compared to our actual compliance status at January 31, 2021 is presented below:
Actual
Required Minimum/ Maximum
Interest Coverage Ratio for the quarter must equal or exceed minimum 5.05:1.00 1.00:1.00 Interest Coverage Ratio for the trailing two quarters must equal or exceed minimum 4.53:1.00 1.50:1.00 Leverage Ratio must not exceed maximum 1.61:1.00 4.50:1.00 ABS Excluded Leverage Ratio must not exceed maximum 0.95:1.00 2.50:1.00 Capital Expenditures, net, must not exceed maximum $34.7 million $100.0 million
All capitalized terms in the above table are defined by the Revolving Credit Facility and may or may not agree directly to the financial statement captions in this document. The covenants are calculated quarterly, except for capital expenditures, which is calculated for a period of four consecutive fiscal quarters, as of the end of each fiscal quarter.
7. Income Taxes
Deferred tax assets and liabilities consisted of the following:
January 31, (in thousands) 2021 2020 Deferred tax assets:
Allowance for doubtful accounts $ — $ 18,642 Deferred revenue 788 807 Employment tax 1,661 — Indirect tax reserve 2,927 3,039 Inventories 1,866 1,796 Lease liability 89,411 81,241 Stock-based compensation 2,121 1,982 Net operating loss carryforwards 25,131 904 Other 2,192 2,614 Total deferred tax assets 126,097 111,025
Deferred tax liabilities: Allowance for doubtful accounts (9,829) — Right-of-use asset (59,725) (54,492) Vendor prepayments (1,165) (1,147) Sales tax receivable (5,085) (4,842) Property and equipment (40,454) (31,627) Other (391) (318) Total deferred tax liabilities (116,649) (92,426) Net deferred tax asset $ 9,448 $ 18,599
As of January 31, 2021, the Company had a tax-effected federal net operating loss carryforward of $21.1 million and tax-effected state net operating loss carryforwards of $4.0 million. Our state net operating loss carryforwards begin to expire starting with fiscal year 2030.
Realization of our deferred tax asset ultimately depends on the existence of sufficient taxable income, which may include future taxable income and tax planning strategies. Based on the weight of available evidence at January 31, 2021, we believe that it is more likely than not that we will generate sufficient taxable income to utilize our entire deferred tax asset prior to its expiration.

Table of Contents CONN’S, INC. AND SUBSIDIARIES
NOTES TO CONSOLIDATED FINANCIAL STATEMENTS
82
Provision for income taxes consisted of the following:
Year Ended January 31, (in thousands) 2021 2020 2019 Current:
Federal $ (47,829) $ 9,215 $ 29,919 State 316 1,611 2,308 Total current (47,513) 10,826 32,227
Deferred: Federal 31,083 7,590 (9,419) State 240 (102) 121 Total deferred 31,323 7,488 (9,298) Provision (benefit) for income taxes $ (16,190) $ 18,314 $ 22,929
A reconciliation of the provision (benefit) for income taxes at the U.S. federal statutory tax rate and the total tax provision for each of the periods presented in the statements of operations follows:
Year Ended January 31, (in thousands) 2021 2020 2019 Income tax provision (benefit) at U.S. federal statutory rate $ (4,059) $ 15,607 $ 20,323 State income taxes, net of federal benefit 843 2,011 2,068 Tax Act and other deferred tax adjustments (15,009) (910) — Employee benefits 1,350 1,873 1,096 Other 685 (267) (558)
Provision (benefit) for income taxes $ (16,190) $ 18,314 $ 22,929
A benefit of $14.9 million was recognized in the current period as a result of net operating loss provisions within the CARES Act (the “Tax Act”) that provide for a five-year carryback of losses.
Federal tax returns for fiscal years subsequent to January 31, 2017, remain subject to examination. Generally, state tax returns for fiscal years subsequent to January 31, 2017 remain subject to examination.
Changes in the balance of unrecognized tax benefits, including interest and penalties on uncertain tax positions, were as follows:
Year Ended January 31, (in thousands) 2021 2020 2019 Balance at February 1 $ (11,384) $ (11,625) $ — Increases related to prior year tax positions — — (12,084) Decreases related to prior year tax positions 1,531 241 459
Balance at January 31 $ (9,853) $ (11,384) $ (11,625)
As of January 31, 2021, 2020 and 2019 there are $5.3 million, $3.5 million, and $3.5 million, respectively of unrecognized tax benefits that, if recognized, would favorably affect the Company’s annual effective tax rate.
The Company recognizes interest and penalties related to unrecognized tax benefits in its provision for income taxes. During the years ended January 31, 2021, 2020 and 2019, the Company recognized interest and penalties of approximately $1.0 million, $0.7 million and $0.1 million, respectively.

Table of Contents CONN’S, INC. AND SUBSIDIARIES
NOTES TO CONSOLIDATED FINANCIAL STATEMENTS
83
8. Leases
We lease most of our current store locations and certain of our facilities and operating equipment under operating leases. The fixed, non-cancelable terms of our real estate leases are generally five years to fifteen years and generally include renewal options that allow us to extend the term beyond the initial non-cancelable term. However, prior to the expiration of the existing contract, the Company will typically renegotiate any lease contracts as opposed to continuing in the current lease under the renewal terms. As such, the lease renewal options are not recognized as part of the right-of-use assets and liabilities. Most of the real estate leases require payment of real estate taxes, insurance and certain common area maintenance costs in addition to future minimum lease payments. Equipment leases generally provide for initial lease terms of three years to five years and provide for a purchase right at the end of the lease term at the then fair market value of the equipment.
Certain operating leases contain tenant allowance provisions, which obligate the landlord to remit cash to us as an incentive to enter into the lease agreement. We record the full amount to be remitted by the landlord as a reduction to the operating lease right-of-use assets upon commencement of the lease and amortize the balance on a straight-line basis over the life of the lease.
Supplemental lease information is summarized below:
January 31, (in thousands) Balance sheet classification 2021 2020 Assets
Operating lease assets Operating lease right-of-use assets $ 265,798 $ 242,457 Finance lease assets Property and equipment, net 5,813 5,028
Total leased assets $ 271,611 $ 247,485 Liabilities
Operating (1) Operating lease liability - current $ 53,958 $ 47,118 Finance Current maturities of debt and finance lease obligations 934 605 Operating Operating lease liability - non current 354,598 329,081 Finance Long-term debt and finance lease obligations 5,138 4,604
Total lease liabilities $ 414,628 $ 381,408
(1) Represents the gross operating lease liability before tenant improvement allowances. As of January 31, 2021 and 2020, we had $9.9 million and $11.7 million of tenant improvement allowances to be remitted by the landlord.
Lease Cost Year Ended January 31, (in thousands) Income statement classification 2021 2020 Operating lease costs (1) Selling, general and administrative expense $ 63,970 $ 57,501 Impairment of ROU asset Charges and credits — 1,933 Total operating lease cost $ 63,970 $ 59,434
(1) Includes short-term and variable lease costs, which are not significant.
Operating lease right-of-use assets (“ROU Assets”) and liabilities are recognized at the commencement date based on the present value of lease payments over the lease term. As most of our leases do not provide an implicit rate, we use our estimated incremental borrowing rate based on the information available at commencement date in determining the present value of lease payments.
Operating lease ROU Assets are regularly reviewed for impairment under the long-lived assets impairment guidance in ASC Subtopic 360-10, Property, Plant, and Equipment - Overall. No impairment was recognized for the year ended January 31, 2021. For the year ended January 31, 2020, we recognized $1.9 million of impairments of ROU Assets on the consolidated statement of operations from the exiting of certain leases upon relocation of three of our distribution centers into one facility. See Note 4, Charges and Credits, for additional details.

Table of Contents CONN’S, INC. AND SUBSIDIARIES
NOTES TO CONSOLIDATED FINANCIAL STATEMENTS
84
Additional details regarding the Company’s leasing activities as a lessee are presented below:
Other Information Year Ended January 31, (dollars in thousands) 2021 2020 Cash paid for amounts included in the measurement of lease liabilities
Operating cash flows for operating leases $ 73,983 $ 69,829 Weighted-average remaining lease term (in years)
Finance leases 9.5 11.2 Operating leases 7.2 7.1
Weighted-average discount rate Finance leases 5.1 % 6.1 % Operating leases (1) 7.7 % 8.3 %
(1) Upon adoption of ASC 842, discount rates for existing operating leases were established as of February 1, 2019.
For the years ended January 31, 2021, 2020 and 2019, total rent expense was $65.1 million, $58.1 million and $52.7 million, respectively.
The following table presents a summary of our minimum contractual commitments and obligations as of January 31, 2021:
(in thousands) Operating
Leases Finance Leases Total
Year ending January 31, 2022 $ 83,433 $ 1,247 $ 84,680 2023 82,826 994 83,820 2024 78,176 1,064 79,240 2025 67,984 900 68,884 2026 56,372 606 56,978 Thereafter 165,334 3,194 168,528 Total undiscounted cash flows 534,125 8,005 542,130
Less: Interest 125,569 1,933 127,502 Total lease liabilities $ 408,556 $ 6,072 $ 414,628
9. Stock-Based Compensation
On May 28, 2020, our stockholders approved the Conn’s, Inc. 2020 Omnibus Incentive Plan (“2020 Plan”). Upon the effectiveness of the 2020 Plan, no further awards were, or may in the future, be granted under any of our prior plans, which include the 2016 Omnibus Incentive Plan (“2016 Plan”), 2011 Non-Employee Director Restricted Stock Plan (“2011 Director Plan”) and the 2003 Non-Employee Director Stock Option Plan (“2003 Director Plan”). The 2020 plan provides for the issuance of 1,800,000 shares of Company common stock plus such number of shares as were, and may become, available under our prior plans. As such, shares subject to an award under the 2020 Plan, the 2016 Plan, the 2011 Plan, the 2011 Director Plan, the 2003 Director Plan or our Amended and Restated 2003 Incentive Stock Option Plan (“2003 Plan”) that lapse, expire, are forfeited or terminated, or are settled in cash will again become available for future grant under the 2020 Plan. During fiscal year 2021, a total of 937,514 shares were transferred to the 2020 Plan from the prior plans: 746,299 shares from the 2016 Omnibus Incentive Plan, 2,224 shares from the 2011 Omnibus Incentive Plan, and 48,991 shares from the 2011 Non-Employee Director Restricted Stock Plan, 140,000 shares from the 2003 Non-Employee Director Stock Option Plan.
Our 2020 Plan is an equity-based compensation plan that allows for the grant of a variety of awards, including stock options, restricted stock awards, RSUs, PSUs, stock appreciation rights and performance and cash awards. Awards are generally granted once per year, with the amount and type of awards determined by the Compensation Committee of our Board of Directors (the “Committee”). Stock options, RSUs and PSUs are subject to early termination provisions but generally vest over a period of three years or four years from the date of grant. Stock options under the various plans are issued with exercise prices equal to the market value on the date of the grant and, typically, expire ten years after the date of grant.
In the event of a change in control of the Company, as defined in the 2020 Plan, the Board of Directors of the Company (“Board of Directors”) may cause some or all outstanding awards to fully or partially vest, either upon the change in control or

Table of Contents CONN’S, INC. AND SUBSIDIARIES
NOTES TO CONSOLIDATED FINANCIAL STATEMENTS
85
upon a subsequent termination of employment or service, and may provide that any applicable performance criteria be deemed satisfied at the target or any other level. The Board of Directors may also cause outstanding awards to terminate in exchange for a cash or stock payment or to be substituted or assumed by the surviving corporation.
As of January 31, 2021, shares authorized for future issuance were: 2,632,127 under the 2020 Plan.
Stock-Based Compensation Expense. Total stock-based compensation expense, recognized primarily in SG&A, from stock-based compensation consisted of the following:
Year Ended January 31, (in thousands) 2021 2020 2019 Stock options $ 3,908 $ 3,978 $ 3,414 RSUs and PSUs 5,058 8,316 8,540 Employee stock purchase plan 364 256 263 Accelerated RSU expense charged to severance 1,255 — — $ 10,585 $ 12,550 $ 12,217
During the years ended January 31, 2021, 2020, and 2019, we recognized tax benefits related to stock-based compensation of $2.3 million, $1.4 million and $1.7 million, respectively. As of January 31, 2021, the total unrecognized compensation cost related to all unvested stock-based compensation awards was $7.9 million and is expected to be recognized over a weighted-average period of 1.9 years. The total fair value of RSUs, PSUs and stock options vested during fiscal years 2021, 2020 and 2019 was $5.1 million, $8.4 million and $12.6 million, respectively, based on the market price at the vesting date.
Stock Options. No stock options were awarded during fiscal year 2021 and 2020. During fiscal year 2019, 620,166 stock options were awarded with an exercise price of $32.35 per share. The stock options awarded vest in equal installments three years and four years from the date of grant and expire ten years from the date of grant. The fair values of the stock options at grant date ranged from $20.00 to $21.67 per share. The fair values of the stock option awards were determined using the Black-Scholes option pricing model. The weighted-average assumptions for the option awards granted in fiscal year 2019 included expected volatility of 68%, an expected term of six years to seven years and risk-free interest rate of 2.69%. No dividend yield was included in the weighted-average assumptions for the options awards granted in fiscal year 2019.
The following table summarizes the activity for outstanding stock options:
Shares Under Option
Weighted- Average Exercise
Price
Weighted- Average
Remaining Contractual
Life Outstanding, January 31, 2020 744,191 $ 29.73 Granted — $ — Exercised — $ — Forfeited and expired (24,025) $ 6.81 Outstanding, January 31, 2021 720,166 $ 30.49 7.0 Vested and expected to vest, January 31, 2021 720,166 $ 30.49 7.0 Exercisable, January 31, 2021 100,000 $ 18.98 5.9
No stock options were exercised during the year ended January 31, 2021. During the years ended January 31, 2020 and 2019, the total intrinsic value of stock options exercised was $0.4 million and $0.4 million, respectively. The aggregate intrinsic value of stock options outstanding, vested and expected to vest and exercisable at January 31, 2021 was approximately $0.1 million. The total fair value of common stock options vested during fiscal years 2021, 2020 and 2019 was $0.3 million, $0.3 million and $0.5 million, respectively, based on the market price at the vesting date.
Restricted Stock Units. The restricted stock program consists of a combination of PSUs and RSUs. As of January 31, 2021 there are two PSU awards outstanding. Under the first award, the number of PSUs issued is dependent upon a measurement of earnings before interest, taxes, depreciation and amortization (“EBITDA”) target for the period identified in the grant, which is two fiscal years. In the event EBITDA exceeds the respective predefined target, shares for up to a maximum of 150% of the target award may be awarded. In the event the EBITDA falls below the respective predefined target, a reduced number of shares may be awarded. If the EBITDA falls below the respective threshold performance level, no shares will be awarded.

Table of Contents CONN’S, INC. AND SUBSIDIARIES
NOTES TO CONSOLIDATED FINANCIAL STATEMENTS
86
Under the second PSU award the number of PSUs issued is dependent upon attainment of an annualized Total Shareholder Return (“TSR”) target for the period identified in the award, which is three fiscal years. In the event TSR exceeds the respective defined target, shares for up to a maximum of 150% of the target award will be awarded. In the event TSR falls below the respective predefined target, a reduced number of shares will be awarded. If TSR falls below the respective threshold level, no shares will be awarded. PSUs vest on predetermined schedules, which occurs over three years. RSUs vest on a straight-line basis over their term, which is generally three years to five years.
The following table summarizes the activity for RSUs and PSUs:
Time-Based RSUs Performance-Based RSUs
Number of
Units
Weighted-Average
Grant Date Fair Value
Number of Units
Weighted-Average
Grant Date Fair Value
Total Number of Units
Balance, January 31, 2020 588,823 $ 19.92 493,894 $ 12.47 1,082,717 Granted 625,808 $ 9.17 270,828 $ 8.36 896,636 Vested and converted to common stock (336,304) $ 15.93 (356,844) $ 11.67 (693,148) Forfeited (128,433) $ 15.32 (138,298) $ 12.08 (266,731) Balance, January 31, 2021 749,894 $ 13.53 269,580 $ 9.61 1,019,474
The total fair value of restricted and performance shares vested during fiscal years 2021, 2020 and 2019 was $4.8 million, $8.1 million, and $12.1 million, respectively, based on the market price at the vesting date. The total fair value of restricted and performance shares granted during fiscal years 2021, 2020 and 2019 was $8.0 million, $2.9 million and $7.6 million, respectively.
Employee Stock Purchase Plan. Our Employee Stock Purchase Plan is available to our employees, subject to minimum employment conditions and maximum compensation limitations. At the end of each calendar quarter, employee contributions are used to acquire shares of common stock at 85% of the lower of the fair market value of the common stock on the first or last day of the calendar quarter. During the years ended January 31, 2021, 2020 and 2019, we issued 140,672, 53,459 and 34,922 shares of common stock, respectively, to employees participating in the plan, leaving 577,591 shares remaining reserved for future issuance under the plan as of January 31, 2021.
10. Significant Vendors
As shown in the table below, a significant portion of our merchandise purchases were made from six vendors:
Year Ended January 31, 2021 2020 2019 Vendor A 28.9 % 33.6 % 25.3 % Vendor B 15.4 16.3 16.1 Vendor C 14.0 11.0 7.0 Vendor D 7.8 9.6 6.7 Vendor E 6.8 9.5 5.2 Vendor F 3.1 5.7 5.0 76.0 % 85.7 % 65.3 %
The vendors shown above represent the top six vendors with the highest volume in each period shown. The same vendor may not necessarily be represented in all periods presented.
11. Defined Contribution Plan
We have established a defined contribution 401(k) plan for eligible employees. Employees may contribute up to 50% of their eligible pretax compensation to the plan and we match 100% of the first 3% of the employees’ contributions and an additional 50% of the next 2% of the employees’ contributions. At our option, we may make supplemental contributions to the plan, but have not made such supplemental contributions in the past three years. Due to the COVID-19 pandemic, matching contributions were suspended in fiscal year 2021. The matching contributions made by us totaled $1.9 million and $1.4 million during the years ended January 31, 2020 and 2019, respectively.

Table of Contents CONN’S, INC. AND SUBSIDIARIES
NOTES TO CONSOLIDATED FINANCIAL STATEMENTS
87
12. Contingencies
Securities Litigation. On April 2, 2018, MicroCapital Fund, LP, MicroCapital Fund, Ltd., and MicroCapital LLC (collectively, “MicroCapital”) filed a lawsuit against us and certain of our former executive officers in the U.S. District Court for the Southern District of Texas, Cause No. 4:18-CV-01020 (the “MicroCapital Action”). The plaintiffs in this action allege that the defendants made false and misleading statements or failed to disclose material facts about our credit and underwriting practices, accounting and internal controls. Plaintiffs allege violations of sections 10(b) and 20(a) of the Securities Exchange Act of 1934 and Rule 10b-5 promulgated thereunder, Texas and Connecticut common law fraud, and Texas common law negligent misrepresentation against all defendants; as well as violations of section 20A of the Securities Exchange Act of 1934; and Connecticut common law negligent misrepresentation against certain defendants arising from plaintiffs’ purchase of Conn’s, Inc. securities between April 3, 2013 and February 20, 2014. The complaint does not specify the amount of damages sought.
The Court previously stayed the MicroCapital Action pending resolution of other outstanding litigation (In re Conn’s Inc. Sec. Litig., Cause No. 14-CV-00548 (S.D. Tex.) (the “Consolidated Securities Action”)), which was settled in October 2018. After that settlement, the stay was lifted, and the defendants filed a motion to dismiss plaintiff’s complaint in the MicroCapital Action on November 6, 2018. On July 26, 2019, the magistrate judge issued a report recommending that defendants’ motion to dismiss the complaint be granted in part and denied in part. On September 25, 2019, the district court adopted the magistrate judge’s report, which permitted MicroCapital to file an amended complaint, which MicroCapital filed on October 30, 2019. Defendants filed their answer to the amended complaint on November 27, 2019.
We intend to vigorously defend our interests in the MicroCapital Action. It is not possible at this time to predict the timing or outcome of this litigation, and we cannot reasonably estimate the possible loss or range of possible loss from these claims.
Derivative Litigation. On December 1, 2014, an alleged shareholder, purportedly on behalf of the Company, filed a derivative shareholder lawsuit against us and certain of our current and former directors and former executive officers captioned as Robert Hack, derivatively on behalf of Conn’s, Inc., v. Theodore M. Wright (former executive officer and former director), Bob L. Martin, Jon E.M. Jacoby (former director), Kelly M. Malson, Douglas H. Martin, David Schofman, Scott L. Thompson (former director), Brian Taylor (former executive officer) and Michael J. Poppe (former executive officer) and Conn’s, Inc., Case No. 4:14-cv-03442 (S.D. Tex.) (the “Original Derivative Action”). The complaint asserts claims for breach of fiduciary duty, unjust enrichment, gross mismanagement, and insider trading based on substantially similar factual allegations as those asserted in the Consolidated Securities Action. The plaintiff seeks unspecified damages against these persons and does not request any damages from Conn’s. Setting forth substantially similar claims against the same defendants, on February 25, 2015, an additional federal derivative action, captioned 95250 Canada LTEE, derivatively on Behalf of Conn’s, Inc. v. Wright et al., Cause No. 4:15-cv-00521 (S.D. Tex.), which was consolidated with the Original Derivative Action.
The Court previously approved a stipulation among the parties to stay the Original Derivative Action pending resolution of the Consolidated Securities Action. The stay was lifted on November 1, 2018, and the defendants filed a motion to dismiss plaintiff’s complaint. Briefing on the motion to dismiss was completed December 3, 2018. On May 29, 2019, the magistrate judge issued a report, recommending that defendants’ motion to dismiss the complaint be granted, but recommended that the plaintiff be permitted to replead his claims. The district court adopted the recommendation on July 5, 2019.
On July 19, 2019, plaintiff filed an amended complaint. On November 1, 2019, the magistrate judge heard argument on the motion to dismiss and postponed certain deadlines. Adopting the report and recommendation issued by the magistrate judge on July 22, 2020, the district court entered an order on September 25, 2020 denying defendant’s motion on the breach of fiduciary duty claims and granting defendants’ motion on the insider trading claims. The district court also allowed plaintiff leave to amend to add 95250 Canada LTEE, which had been omitted from the amended complaint, as a party to the case. Plaintiffs filed a corrected amended complaint on October 21, 2020 in accordance with the district court’s order.
Another derivative action was filed on January 27, 2015, captioned as Richard A. Dohn v. Wright, et al., Cause No. 2015-04405, in the 281st Judicial District Court, Harris County, Texas. This action makes substantially similar allegations to the Original Derivative Action against the same defendants. This case is stayed until at least July 15, 2021.
Prior to filing a lawsuit, an alleged shareholder, Robert J. Casey II (“Casey”), submitted a demand under Delaware law, which our Board of Directors refused. On May 19, 2016, Casey, purportedly on behalf of the Company, filed a lawsuit against us and certain of our current and former directors and former executive officers in the 55th Judicial District Court, Harris County, Texas, captioned as Casey, derivatively on behalf of Conn’s, Inc., v. Theodore M. Wright (former executive officer and former director), Michael J. Poppe (former executive officer), Brian Taylor (former executive officer), Bob L. Martin, Jon E.M. Jacoby (former director), Kelly M. Malson (former director), Douglas H. Martin, David Schofman, Scott L. Thompson (former director) and William E. Saunders Jr., and Conn’s, Inc., Cause No. 2016-33135. The complaint asserts claims for breach of fiduciary duties and unjust enrichment based on substantially similar factual allegations as those asserted in the Original

Table of Contents CONN’S, INC. AND SUBSIDIARIES
NOTES TO CONSOLIDATED FINANCIAL STATEMENTS
88
Derivative Action. The complaint does not specify the amount of damages sought. This case is abated until at least July 31, 2021.
Other than Casey, none of the plaintiffs in the other derivative actions made a demand on our Board of Directors prior to filing their respective lawsuits. The defendants in the derivative actions intend to vigorously defend against these claims. It is not possible at this time to predict the timing or outcome of any of this litigation, and we cannot reasonably estimate the possible loss or range of possible loss from these claims.
We are involved in other routine litigation and claims, incidental to our business from time to time which, individually or in the aggregate, are not expected to have a material adverse effect on us. As required, we accrue estimates of the probable costs for the resolution of these matters. These estimates have been developed in consultation with counsel and are based upon an analysis of potential results, assuming a combination of litigation and settlement strategies. However, the results of these proceedings cannot be predicted with certainty, and changes in facts and circumstances could impact our estimate of reserves for litigation. The Company believes that any probable and reasonably estimable loss associated with the foregoing has been adequately reflected in the accompanying financial statements.
13. Variable Interest Entities
From time to time, we securitize customer accounts receivables by transferring the receivables to various bankruptcy-remote VIEs. Under the terms of the respective securitization transactions, all cash collections and other cash proceeds of the customer receivables go first to the servicer and the holders of the asset-backed notes, and then to the residual equity holder. We retain the servicing of the securitized portfolio and receive a monthly fee of 4.75% (annualized) based on the outstanding balance of the securitized receivables, and we currently hold all of the residual equity. In addition, we, rather than the VIEs, will retain certain credit insurance income together with certain recoveries related to credit insurance and RSAs on charge-offs of the securitized receivables, which will continue to be reflected as a reduction of net charge-offs on a consolidated basis for as long as we consolidate the VIEs.
We consolidate VIEs when we determine that we are the primary beneficiary of these VIEs, we have the power to direct the activities that most significantly impact the performance of the VIEs and our obligation to absorb losses and the right to receive residual returns are significant.

Table of Contents CONN’S, INC. AND SUBSIDIARIES
NOTES TO CONSOLIDATED FINANCIAL STATEMENTS
89
The following table presents the assets and liabilities held by the VIEs (for legal purposes, the assets and liabilities of the VIEs will remain distinct from Conn’s, Inc.):
(in thousands) January 31,
2021 January 31,
2020 Assets: Restricted cash $ 48,622 $ 73,214 (Due to) due from Conn’s, Inc., net (5,661) 307 Customer accounts receivable:
Customer accounts receivable 509,574 838,210 Restructured accounts 105,395 147,971 Allowance for uncollectible accounts (159,849) (151,263) Allowance for no-interest option credit programs (5,502) (12,445) Deferred fees and origination costs (5,503) (8,255) Total customer accounts receivable, net 444,115 814,218
Total assets $ 487,076 $ 887,739 Liabilities: Accrued expenses $ 3,707 $ 5,517 Other liabilities 4,459 7,584 Long-term debt:
2017-B Class C Notes — 59,655 2018-A Class A Notes — 34,112 2018-A Class B Notes — 20,572 2018-A Class C Notes — 20,572 2019-A Class A Notes 19,521 76,241 2019-A Class B Notes 25,069 64,750 2019-A Class C Notes 24,202 62,510 2019-B Class A Notes 17,860 265,810 2019-B Class B Notes 85,540 85,540 2019-B Class C Notes 83,270 83,270 2020-A Class A Notes 93,326 — 2020-A Class B Notes 65,200 —
413,988 773,032 Less deferred debt issuance costs (2,437) (4,911) Total debt 411,551 768,121
Total liabilities $ 419,717 $ 781,222
The assets of the VIEs serve as collateral for the obligations of the VIEs. The holders of asset-backed notes have no recourse to assets outside of the respective VIEs.
14. Segment Information
Operating segments are defined as components of an enterprise that engage in business activities and for which discrete financial information is available that is evaluated on a regular basis by the chief operating decision maker to make decisions about how to allocate resources and assess performance. We are a leading specialty retailer and offer a broad selection of quality, branded durable consumer goods and related services in addition to a proprietary credit solution for our core credit-constrained consumers. We have two operating segments: (i) retail and (ii) credit. Our operating segments complement one another. The retail segment operates primarily through our stores and website. Our retail segment product offerings include furniture and mattresses, home appliances, consumer electronics and home office products from leading global brands across a wide range of price points. Our credit segment offers affordable financing solutions to a large, under-served population of

Table of Contents CONN’S, INC. AND SUBSIDIARIES
NOTES TO CONSOLIDATED FINANCIAL STATEMENTS
90
credit-constrained consumers who typically have limited credit alternatives. Our operating segments provide customers the opportunity to comparison shop across brands with confidence in our competitive prices as well as affordable monthly payment options, next day delivery and installation in the majority of our markets, and product repair service. The operating segments follow the same accounting policies used in our consolidated financial statements.
We evaluate a segment’s performance based upon operating income before taxes. SG&A includes the direct expenses of the retail and credit operations, allocated overhead expenses, and a charge to the credit segment to reimburse the retail segment for expenses it incurs related to occupancy, personnel, advertising and other direct costs of the retail segment which benefit the credit operations by sourcing credit customers and collecting payments. The reimbursement received by the retail segment from the credit segment is calculated using an annual rate of 2.5% times the average outstanding portfolio balance for each applicable period.
As of January 31, 2021, we operated retail stores in 15 states with no operations outside of the United States. No single customer accounts for more than 10% of our total revenues.
Financial information by segment is presented in the following tables:
Year Ended January 31, 2021 (in thousands) Retail Credit Total Revenues: Furniture and mattress $ 322,770 $ — $ 322,770 Home appliance 390,964 — 390,964 Consumer electronics 172,932 — 172,932 Home office 65,405 — 65,405 Other 20,960 — 20,960
Product sales 973,031 — 973,031 Repair service agreement commissions 78,838 — 78,838 Service revenues 12,442 — 12,442
Total net sales 1,064,311 — 1,064,311 Finance charges and other revenues 816 320,898 321,714
Total revenues 1,065,127 320,898 1,386,025 Costs and expenses: Cost of goods sold 668,315 — 668,315 Selling, general and administrative expense (1) 335,954 142,813 478,767 Provision for bad debts 443 201,560 202,003 Charges and credits 4,092 2,234 6,326
Total costs and expenses 1,008,804 346,607 1,355,411 Operating income (loss) 56,323 (25,709) 30,614
Interest expense — 50,381 50,381 (Gain) on extinguishment of debt — (440) (440)
Income (loss) before income taxes $ 56,323 $ (75,650) $ (19,327) Additional Disclosures: Property and equipment additions $ 55,172 $ 824 $ 55,996 Depreciation expense $ 39,968 $ 1,100 $ 41,068
January 31, 2021 (in thousands) Retail Credit Total Total assets $ 655,666 $ 1,099,418 $ 1,755,084

Table of Contents CONN’S, INC. AND SUBSIDIARIES
NOTES TO CONSOLIDATED FINANCIAL STATEMENTS
91
Year Ended January 31, 2020 (in thousands) Retail Credit Total Revenues: Furniture and mattress $ 370,931 $ — $ 370,931 Home appliance 360,441 — 360,441 Consumer electronics 221,449 — 221,449 Home office 73,074 — 73,074 Other 16,529 — 16,529
Product sales 1,042,424 — 1,042,424 Repair service agreement commissions 106,997 — 106,997 Service revenues 13,814 — 13,814
Total net sales 1,163,235 — 1,163,235 Finance charges and other revenues 810 379,641 380,451
Total revenues 1,164,045 379,641 1,543,686 Costs and expenses: Cost of goods sold 697,784 — 697,784 Selling, general and administrative expense (1) 346,108 156,916 503,024 Provision for bad debts 905 204,312 205,217 Charges and credits 1,933 1,209 3,142
Total costs and expenses 1,046,730 362,437 1,409,167 Operating income 117,315 17,204 134,519
Interest expense — 59,107 59,107 Loss on extinguishment of debt — 1,094 1,094
Income (loss) before income taxes $ 117,315 $ (42,997) $ 74,318 Additional Disclosures: Property and equipment additions $ 62,244 $ 200 $ 62,444 Depreciation expense $ 35,783 $ 1,058 $ 36,841 January 31, 2020 (in thousands) Retail Credit Total Total assets $ 641,812 $ 1,526,957 $ 2,168,769

Table of Contents CONN’S, INC. AND SUBSIDIARIES
NOTES TO CONSOLIDATED FINANCIAL STATEMENTS
92
Year Ended January 31, 2019 (in thousands) Retail Credit Total Revenues: Furniture and mattress $ 382,975 $ — $ 382,975 Home appliance 332,609 — 332,609 Consumer electronics 262,088 — 262,088 Home office 86,260 — 86,260 Other 14,703 — 14,703
Product sales 1,078,635 — 1,078,635 Repair service agreement commissions 101,928 — 101,928 Service revenues 14,111 — 14,111
Total net sales 1,194,674 — 1,194,674 Finance charges and other revenues 447 354,692 355,139
Total revenues 1,195,121 354,692 1,549,813 Costs and expenses: Cost of goods sold 702,135 — 702,135 Selling, general and administrative expense (1) 328,628 151,933 480,561 Provision for bad debts 1,009 197,073 198,082 Charges and credits 2,980 4,800 7,780
Total costs and expenses 1,034,752 353,806 1,388,558 Operating income 160,369 886 161,255
Interest expense — 62,704 62,704 Loss on extinguishment of debt — 1,773 1,773
Income (loss) before income taxes $ 160,369 $ (63,591) $ 96,778 Additional Disclosures: Property and equipment additions $ 36,110 $ 1,384 $ 37,494 Depreciation expense $ 30,739 $ 845 $ 31,584
January 31, 2019 (in thousands) Retail Credit Total Total assets $ 405,542 $ 1,479,365 $ 1,884,907
(1) For the years ended January 31, 2021, 2020 and 2019, the amount of overhead allocated to each segment reflected in SG&A was $32.0 million, $30.0 million and $36.4 million, respectively. For the years ended January 31, 2021, 2020 and 2019, the amount of reimbursement made to the retail segment by the credit segment was $34.8 million, $39.1 million and $38.1 million, respectively.
15. Stockholders’ Equity
Share Repurchases. On May 30, 2019, we entered into a stock repurchase program pursuant to which we had the authorization to repurchase up to $75.0 million of our outstanding common stock. The stock repurchase program expired on May 30, 2020. No shares were repurchased during the year ended January 31, 2021. For the year ended January 31, 2020, we repurchased 3,485,441 shares of our common stock at an average weighted cost per share of $19.02 for an aggregate amount of $66.3 million.

Table of Contents CONN’S, INC. AND SUBSIDIARIES
NOTES TO CONSOLIDATED FINANCIAL STATEMENTS
93
16. Quarterly Information (Unaudited)
The following tables set forth certain quarterly financial data for the years ended January 31, 2021, 2020 and 2019 that have been prepared on a consistent basis as the accompanying audited consolidated financial statements and include all adjustments necessary for a fair presentation, in all material respects, of the information shown:
(dollars in thousands, except per share amounts)
Fiscal Year 2021 Quarter Ended
April 30 July 31 October 31 January 31 Revenues:
Retail Segment $ 230,565 $ 279,932 $ 259,940 $ 294,690 Credit Segment 86,595 86,984 74,218 73,101 Total revenues $ 317,160 $ 366,916 $ 334,158 $ 367,791 Percent of annual revenues 22.9 % 26.5 % 24.1 % 26.5 %
Costs and expenses: Cost of goods sold $ 147,014 $ 176,623 $ 160,378 $ 184,300 Operating income (loss):
Retail Segment $ 5,209 $ 23,188 $ 15,245 $ 12,681 Credit Segment (67,451) 18,248 8,884 14,610
Total operating income (loss) $ (62,242) $ 41,436 $ 24,129 $ 27,291 Net income (loss) $ (56,202) $ 20,520 $ 7,419 $ 25,126 Income (loss) per share
Basic (1) $ (1.95) $ 0.71 $ 0.25 $ 0.86 Diluted (1) $ (1.95) $ 0.70 $ 0.25 $ 0.85
(dollars in thousands, except per share amounts)
Fiscal Year 2020 Quarter Ended
April 30 July 31 October 31 January 31
Revenues: Retail Segment $ 262,181 $ 306,265 $ 280,319 $ 315,280 Credit Segment 91,331 94,794 95,808 97,708 Total revenues $ 353,512 $ 401,059 $ 376,127 $ 412,988 Percent of annual revenues 22.9 % 26.0 % 24.4 % 26.7 %
Costs and expenses: Cost of goods sold $ 157,228 $ 182,065 $ 170,453 $ 188,038 Operating income (loss):
Retail Segment $ 25,897 $ 36,072 $ 19,598 $ 35,748 Credit Segment 13,122 5,702 10,706 (12,326)
Total operating income $ 39,019 $ 41,774 $ 30,304 $ 23,422 Net income $ 19,509 $ 19,974 $ 11,469 $ 5,052 Income per share:
Basic (1) $ 0.61 $ 0.64 $ 0.39 $ 0.18 Diluted (1) $ 0.60 $ 0.62 $ 0.39 $ 0.17
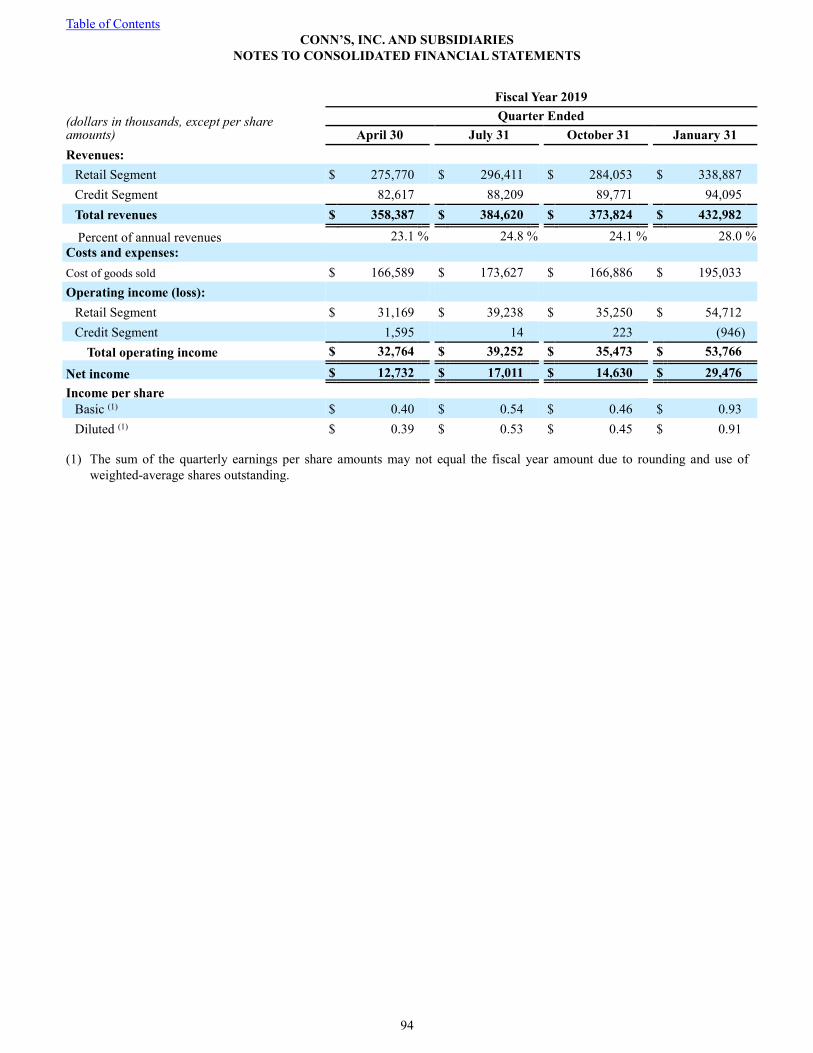
Table of Contents CONN’S, INC. AND SUBSIDIARIES
NOTES TO CONSOLIDATED FINANCIAL STATEMENTS
94
Fiscal Year 2019 (dollars in thousands, except per share amounts)
Quarter Ended April 30 July 31 October 31 January 31
Revenues: Retail Segment $ 275,770 $ 296,411 $ 284,053 $ 338,887 Credit Segment 82,617 88,209 89,771 94,095 Total revenues $ 358,387 $ 384,620 $ 373,824 $ 432,982 Percent of annual revenues 23.1 % 24.8 % 24.1 % 28.0 %
Costs and expenses: Cost of goods sold $ 166,589 $ 173,627 $ 166,886 $ 195,033 Operating income (loss):
Retail Segment $ 31,169 $ 39,238 $ 35,250 $ 54,712 Credit Segment 1,595 14 223 (946)
Total operating income $ 32,764 $ 39,252 $ 35,473 $ 53,766 Net income $ 12,732 $ 17,011 $ 14,630 $ 29,476 Income per share
Basic (1) $ 0.40 $ 0.54 $ 0.46 $ 0.93 Diluted (1) $ 0.39 $ 0.53 $ 0.45 $ 0.91
(1) The sum of the quarterly earnings per share amounts may not equal the fiscal year amount due to rounding and use of weighted-average shares outstanding.

Table of Contents CONN’S, INC. AND SUBSIDIARIES
NOTES TO CONSOLIDATED FINANCIAL STATEMENTS
95
17. Subsequent Events
Sale of Asset Backed Notes. On February 24, 2021, the Company completed the sale of $62.9 million aggregate principal amount of 4.20% Asset Backed Fixed Rate Notes, Class C, Series 2020-A, which were previously issued and held by the Company. The asset-backed notes are secured by the transferred customer accounts receivables and restricted cash held by a consolidated VIE, which resulted in net proceeds to us of $62.5 million, net of debt issuance costs. Net proceeds from the sale were used to repay amounts outstanding under the Company’s Revolving Credit Facility.
Amendment and Restatement of Revolving Credit Facility. On March 29, 2021 the Company entered into the Fifth Amended and Restated Loan and Security Agreement (the “Fifth Amended and Restated Loan Agreement”), by and among the Company, as parent and guarantor, Conn Appliances, Inc., Conn Credit I, LP and Conn Credit Corporation, Inc., as borrowers, certain banks and financial institutions named therein, as lenders, and JPMorgan Chase Bank, N.A., as Administrative Agent for the Lenders.
The Fifth Amended and Restated Loan Agreement, among other things, (1) extended the maturity date of the existing revolving credit facility to March 2025 (originally scheduled to mature in May 2022), (2) expanded the eligibility criteria of certain component definitions of the borrowing base and increased the inventory advance rate thereunder, (3) changed the rates included in the definition of Applicable Margin (as defined in the Fifth Amended and Restated Loan Agreement) and the rate floor included in the definition of LIBOR contained in the Fifth Amended and Restated Loan Agreement, (4) permitted borrowings under the Letter of Credit Subline (as defined in the Fifth Amended and Restated Loan Agreement) to exceed the cap of $40 million to $100 million, solely at the discretion of the Lenders for such amounts in excess of $40 million, (5) modified the incremental facility provisions to hardwire the ability for the borrowers to have such incremental facilities structured as a first-in, last-out (FILO) tranche, and (6) eliminated the additional covenants and certain other restrictions placed on the borrowers during the covenant relief period provided for under the existing revolving credit facility, which included removing the (i) minimum liquidity covenant, (ii) minimum availability covenant, (iii) anti-cash hoarding covenant and (iv) restrictions on (x) making acquisitions and certain other investments, (y) making certain non-ordinary course restricted payments and (z) prepaying certain indebtedness.
The foregoing description of the Fifth Amended and Restated Loan Agreement does not purport to be complete and is qualified in its entirety by the full text of the Fifth Amended and Restated Loan Agreement, which is filed with this Annual Report on Form 10-K as Exhibit 10.15, which is incorporated by reference herein.
High Yield Note Redemption. On March 15, 2021, we issued a notice of redemption to holders of our Senior Notes for the redemption of all 141,172,000 outstanding aggregate principal amount of the Senior Notes. The redemption date for the Senior Notes will be April 15, 2021. The redemption price for the Senior Notes will be calculated in accordance with the indenture governing the Senior Notes and will be equal to 100% of the principal amount of the Senior Notes being redeemed plus accrued and unpaid interest to, but excluding, the redemption date. After such redemptions, no Senior Notes will remain outstanding. We expect to fund the redemption with borrowings under our revolving credit agreement. The foregoing does not constitute a notice of redemption with respect to the Senior Notes.

Table of Contents
96
ITEM 9. CHANGES IN AND DISAGREEMENTS WITH ACCOUNTANTS ON ACCOUNTING AND FINANCIAL DISCLOSURE.
None.
ITEM 9A. CONTROLS AND PROCEDURES.
Evaluation of Disclosure Controls and Procedures
In connection with the preparation of this Annual Report on Form 10-K, our management conducted an assessment of the effectiveness of our internal controls over financial reporting as of the end of the period covered by this report (under the supervision and with the participation of our Chief Executive Officer (“CEO”) and Chief Financial Officer (“CFO”)). Based on that assessment, our CEO and CFO have concluded that our disclosure controls and procedures (as defined in Rules 13a-15(e) and 15d-15(e) under the Exchange Act) are effective to ensure that information required to be disclosed by us in reports that we file or submit under the Exchange Act is recorded, processed, summarized and reported within the time periods specified in SEC rules and forms, and is accumulated and communicated to management, including our principal executive officer and principal financial officer, as appropriate to allow timely decisions regarding required disclosure.
Remediation of Previously Identified Material Weakness
As previously described in Part II, Item 9A of our Annual Report on Form 10-K for the fiscal year ended January 31, 2020 (“2020 10-K”), in connection with the preparation of our 2020 10-K, our CEO and CFO concluded that our disclosure controls and procedures (as defined in Rules 13a-15(e) and 15d-15(e) under the Exchange Act) were not effective because of certain individual control deficiencies in our information technology general controls (“ITGCs”) in the areas of user access and program change management related to the implementation of certain new financially significant applications that, when viewed in combination, aggregated to the material weakness described in our 2020 10-K. As previously disclosed, during fiscal year 2021, we implemented a remediation plan to address this material weakness. We believe these actions have strengthened our ITGCs. Based on our testing of these strengthened controls, management determined that, as of January 31, 2021, we have remediated the material weakness previously disclosed in our 2020 10-K.
Changes in Internal Controls Over Financial Reporting
There have been no changes in our internal controls over financial reporting that occurred in the quarter ended January 31, 2021 that have materially affected, or are reasonably likely to materially affect, our internal controls over financial reporting.
Management’s Report on Internal Control Over Financial Reporting
Our management is responsible for establishing and maintaining adequate internal control over financial reporting as defined in Rule 13a-15(f) or Rule 15(d)-15(f) under the Exchange Act. Our internal control over financial reporting is designed to provide reasonable assurance regarding the reliability of financial reporting and the preparation of financial statements for external purposes in accordance with generally accepted accounting principles.
Because of its inherent limitations, internal control over financial reporting may not prevent or detect misstatements. Therefore, even those systems determined to be effective can provide only reasonable assurance with respect to financial statement preparation and presentation.
Our management (under the supervision and with the participation of our principal executive officer and our principal financial officer) assessed the effectiveness of our internal control over financial reporting as of January 31, 2021. In making this assessment, management used the criteria established in Internal Control – Integrated Framework issued by the Committee of Sponsoring Organizations of the Treadway Commission (2013 framework) (the COSO criteria). Based on our assessment and those criteria, management believes that, as of January 31, 2021, our internal controls over financial reporting is effective.
The effectiveness of our internal control over financial reporting as of January 31, 2021 has been audited by Ernst & Young LLP, an independent registered public accounting firm, as stated in their report which is included elsewhere herein.
Conn’s, Inc. The Woodlands, Texas March 31, 2021

Table of Contents
97
/s/ George L. Bchara George L. Bchara Executive Vice President and Chief Financial Officer /s/ Norman Miller Norman Miller Chief Executive Officer and President

Table of Contents
98
Report of Independent Registered Public Accounting Firm
To the Stockholders and the Board of Directors of Conn’s, Inc.
Opinion on Internal Control over Financial Reporting
We have audited Conn’s, Inc. and subsidiaries’ internal control over financial reporting as of January 31, 2021, based on criteria established in Internal Control-Integrated Framework issued by the Committee of Sponsoring Organizations of the Treadway Commission (2013 framework) (the COSO criteria). In our opinion, Conn’s, Inc. and subsidiaries (the Company) maintained, in all material respects, effective internal control over financial reporting as of January 31, 2021, based on the COSO criteria.
We also have audited, in accordance with the standards of the Public Company Accounting Oversight Board (United States) (PCAOB), the consolidated balance sheets of the Company as of January 31, 2021 and 2020, the related consolidated statements of operations, stockholders’ equity, and cash flows for each of the three years in the period ended January 31, 2021, and the related notes and our report dated March 31, 2021 expressed an unqualified opinion thereon.
Basis for Opinion
The Company’s management is responsible for maintaining effective internal control over financial reporting and for its assessment of the effectiveness of internal control over financial reporting included in the accompanying Management’s Report on Internal Control Over Financial Reporting. Our responsibility is to express an opinion on the Company’s internal control over financial reporting based on our audit. We are a public accounting firm registered with the PCAOB and are required to be independent with respect to the Company in accordance with the U.S. federal securities laws and the applicable rules and regulations of the Securities and Exchange Commission and the PCAOB.
We conducted our audit in accordance with the standards of the PCAOB. Those standards require that we plan and perform the audit to obtain reasonable assurance about whether effective internal control over financial reporting was maintained in all material respects.
Our audit included obtaining an understanding of internal control over financial reporting, assessing the risk that a material weakness exists, testing and evaluating the design and operating effectiveness of internal control based on the assessed risk, and performing such other procedures as we considered necessary in the circumstances. We believe that our audit provides a reasonable basis for our opinion.
Definition and Limitations of Internal Control Over Financial Reporting
A company’s internal control over financial reporting is a process designed to provide reasonable assurance regarding the reliability of financial reporting and the preparation of financial statements for external purposes in accordance with generally accepted accounting principles. A company’s internal control over financial reporting includes those policies and procedures that (1) pertain to the maintenance of records that, in reasonable detail, accurately and fairly reflect the transactions and dispositions of the assets of the company; (2) provide reasonable assurance that transactions are recorded as necessary to permit preparation of financial statements in accordance with generally accepted accounting principles, and that receipts and expenditures of the company are being made only in accordance with authorizations of management and directors of the company; and (3) provide reasonable assurance regarding prevention or timely detection of unauthorized acquisition, use, or disposition of the company’s assets that could have a material effect on the financial statements.
Because of its inherent limitations, internal control over financial reporting may not prevent or detect misstatements. Also, projections of any evaluation of effectiveness to future periods are subject to the risk that controls may become inadequate because of changes in conditions, or that the degree of compliance with the policies or procedures may deteriorate.
/s/ Ernst & Young LLP
Houston, Texas
March 31, 2021

Table of Contents
99
ITEM 9B. OTHER INFORMATION.
Amendment and Restatement of Revolving Credit Facility.
On March 29, 2021 the Company entered into the Fifth Amended and Restated Loan and Security Agreement (the “Fifth Amended and Restated Loan Agreement”), by and among the Company, as parent and guarantor, Conn Appliances, Inc., Conn Credit I, LP and Conn Credit Corporation, Inc., as borrowers, certain banks and financial institutions named therein, as lenders, and JPMorgan Chase Bank, N.A., as Administrative Agent for the Lenders.
The Fifth Amended and Restated Loan Agreement, among other things, (1) extended the maturity date of the existing revolving credit facility to March, 2025 (originally scheduled to mature in May, 2022), (2) expanded the eligibility criteria of certain component definitions of the borrowing base and increased the inventory advance rate thereunder, (3) changed the rates included in the definition of Applicable Margin (as defined in the Fifth Amended and Restated Loan Agreement) and the rate floor included in the definition of LIBOR contained in the Fifth Amended and Restated Loan Agreement, (4) permitted borrowings under the Letter of Credit Subline (as defined in the Fifth Amended and Restated Loan Agreement) to exceed the cap of $40 million to $100 million, solely at the discretion of the Lenders for such amounts in excess of $40 million, (5) modified the incremental facility provisions to hardwire the ability for the borrowers to have such incremental facilities structured as a first-in, last-out (FILO) tranche, and (6) eliminated the additional covenants and certain other restrictions placed on the borrowers during the covenant relief period provided for under the existing revolving credit facility, which included removing the (i) minimum liquidity covenant, (ii) minimum availability covenant, (iii) anti-cash hoarding covenant and (iv) restrictions on (x) making acquisitions and certain other investments, (y) making certain non-ordinary course restricted payments and (z) prepaying certain indebtedness.
The foregoing description of the Fifth Amended and Restated Loan Agreement does not purport to be complete and is qualified in its entirety by the full text of the Fifth Amended and Restated Loan Agreement, which is filed with this Annual Report on Form 10-K as Exhibit 10.15, which is incorporated by reference herein.
PART III
ITEM 10. DIRECTORS, EXECUTIVE OFFICERS AND CORPORATE GOVERNANCE.
The information required by this Item is incorporated herein by reference to our definitive Proxy Statement in connection with the 2021 Annual Meeting of Stockholders.
ITEM 11. EXECUTIVE COMPENSATION.
The information required by this Item is incorporated herein by reference to our definitive Proxy Statement in connection with the 2021 Annual Meeting of Stockholders.
ITEM 12. SECURITY OWNERSHIP OF CERTAIN BENEFICIAL OWNERS AND MANAGEMENT.
The information required by this Item is incorporated herein by reference to our definitive Proxy Statement in connection with the 2021 Annual Meeting of Stockholders.
ITEM 13. CERTAIN RELATIONSHIPS AND RELATED TRANSACTIONS AND DIRECTOR INDEPENDENCE.
The information required by this Item is incorporated herein by reference to our definitive Proxy Statement in connection with the 2021 Annual Meeting of Stockholders.
ITEM 14. PRINCIPAL ACCOUNTANT FEES AND SERVICES.
The information required by this Item is incorporated herein by reference to our definitive Proxy Statement in connection with the 2021 Annual Meeting of Stockholders.

Table of Contents
100
PART IV
ITEM 15. EXHIBITS AND FINANCIAL STATEMENT SCHEDULES.
(a) The following documents are filed as a part of this report:
(1) Financial statements:
See listing of financial statements included in Item 8. of this Annual Report on Form 10-K.
(2) Financial Statement Schedules:
Financial statement schedules are omitted because they are not applicable or the required information is shown in the consolidated financial statements or notes thereto.
(3) Exhibits:
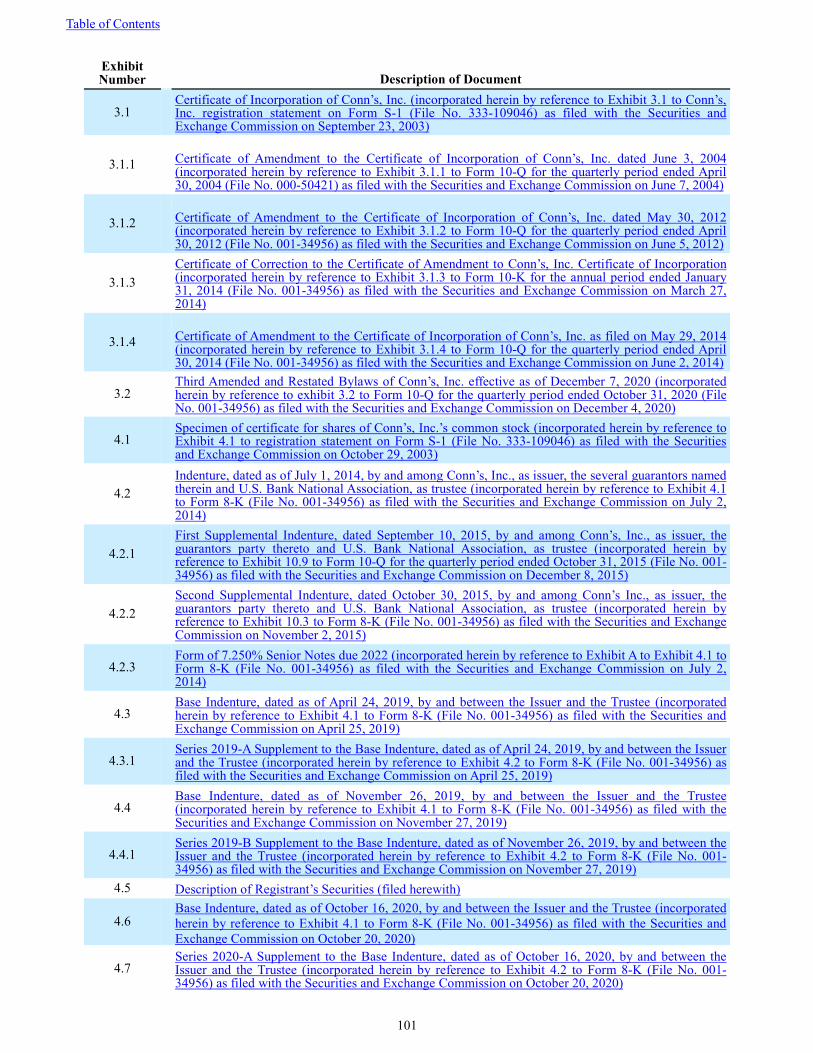
Table of Contents
101
Exhibit Number Description of Document
3.1
Certificate of Incorporation of Conn’s, Inc. (incorporated herein by reference to Exhibit 3.1 to Conn’s, Inc. registration statement on Form S-1 (File No. 333-109046) as filed with the Securities and Exchange Commission on September 23, 2003)
3.1.1
Certificate of Amendment to the Certificate of Incorporation of Conn’s, Inc. dated June 3, 2004 (incorporated herein by reference to Exhibit 3.1.1 to Form 10-Q for the quarterly period ended April 30, 2004 (File No. 000-50421) as filed with the Securities and Exchange Commission on June 7, 2004)
3.1.2
Certificate of Amendment to the Certificate of Incorporation of Conn’s, Inc. dated May 30, 2012 (incorporated herein by reference to Exhibit 3.1.2 to Form 10-Q for the quarterly period ended April 30, 2012 (File No. 001-34956) as filed with the Securities and Exchange Commission on June 5, 2012)
3.1.3
Certificate of Correction to the Certificate of Amendment to Conn’s, Inc. Certificate of Incorporation (incorporated herein by reference to Exhibit 3.1.3 to Form 10-K for the annual period ended January 31, 2014 (File No. 001-34956) as filed with the Securities and Exchange Commission on March 27, 2014)
3.1.4
Certificate of Amendment to the Certificate of Incorporation of Conn’s, Inc. as filed on May 29, 2014 (incorporated herein by reference to Exhibit 3.1.4 to Form 10-Q for the quarterly period ended April 30, 2014 (File No. 001-34956) as filed with the Securities and Exchange Commission on June 2, 2014)
3.2
Third Amended and Restated Bylaws of Conn’s, Inc. effective as of December 7, 2020 (incorporated herein by reference to exhibit 3.2 to Form 10-Q for the quarterly period ended October 31, 2020 (File No. 001-34956) as filed with the Securities and Exchange Commission on December 4, 2020)
4.1
Specimen of certificate for shares of Conn’s, Inc.’s common stock (incorporated herein by reference to Exhibit 4.1 to registration statement on Form S-1 (File No. 333-109046) as filed with the Securities and Exchange Commission on October 29, 2003)
4.2
Indenture, dated as of July 1, 2014, by and among Conn’s, Inc., as issuer, the several guarantors named therein and U.S. Bank National Association, as trustee (incorporated herein by reference to Exhibit 4.1 to Form 8-K (File No. 001-34956) as filed with the Securities and Exchange Commission on July 2, 2014)
4.2.1
First Supplemental Indenture, dated September 10, 2015, by and among Conn’s, Inc., as issuer, the guarantors party thereto and U.S. Bank National Association, as trustee (incorporated herein by reference to Exhibit 10.9 to Form 10-Q for the quarterly period ended October 31, 2015 (File No. 001-34956) as filed with the Securities and Exchange Commission on December 8, 2015)
4.2.2
Second Supplemental Indenture, dated October 30, 2015, by and among Conn’s Inc., as issuer, the guarantors party thereto and U.S. Bank National Association, as trustee (incorporated herein by reference to Exhibit 10.3 to Form 8-K (File No. 001-34956) as filed with the Securities and Exchange Commission on November 2, 2015)
4.2.3
Form of 7.250% Senior Notes due 2022 (incorporated herein by reference to Exhibit A to Exhibit 4.1 to Form 8-K (File No. 001-34956) as filed with the Securities and Exchange Commission on July 2, 2014)
4.3
Base Indenture, dated as of April 24, 2019, by and between the Issuer and the Trustee (incorporated herein by reference to Exhibit 4.1 to Form 8-K (File No. 001-34956) as filed with the Securities and Exchange Commission on April 25, 2019)
4.3.1
Series 2019-A Supplement to the Base Indenture, dated as of April 24, 2019, by and between the Issuer and the Trustee (incorporated herein by reference to Exhibit 4.2 to Form 8-K (File No. 001-34956) as filed with the Securities and Exchange Commission on April 25, 2019)
4.4
Base Indenture, dated as of November 26, 2019, by and between the Issuer and the Trustee (incorporated herein by reference to Exhibit 4.1 to Form 8-K (File No. 001-34956) as filed with the Securities and Exchange Commission on November 27, 2019)
4.4.1
Series 2019-B Supplement to the Base Indenture, dated as of November 26, 2019, by and between the Issuer and the Trustee (incorporated herein by reference to Exhibit 4.2 to Form 8-K (File No. 001-34956) as filed with the Securities and Exchange Commission on November 27, 2019)
4.5 Description of Registrant’s Securities (filed herewith)
4.6
Base Indenture, dated as of October 16, 2020, by and between the Issuer and the Trustee (incorporated herein by reference to Exhibit 4.1 to Form 8-K (File No. 001-34956) as filed with the Securities and Exchange Commission on October 20, 2020)
4.7
Series 2020-A Supplement to the Base Indenture, dated as of October 16, 2020, by and between the Issuer and the Trustee (incorporated herein by reference to Exhibit 4.2 to Form 8-K (File No. 001-34956) as filed with the Securities and Exchange Commission on October 20, 2020)

Table of Contents
102
* 10.1
Amended and Restated 2003 Incentive Stock Option Plan (incorporated herein by reference to Exhibit 10.1 to registration statement on Form S-1 (File No. 333-109046) as filed with the Securities and Exchange Commission on September 23, 2003)
* 10.1.1
Amendment to the Conn’s, Inc. Amended and Restated 2003 Incentive Stock Option Plan (incorporated herein by reference to Exhibit 10.1.1 to Form 10-Q for the quarterly period ended April 30, 2004 (File No. 000-50421) as filed with the Securities and Exchange Commission on June 7, 2004)
* 10.1.2
Form of Stock Option Agreement under the Amended and Restated 2003 Incentive Stock Option Plan (incorporated herein by reference to Exhibit 10.1.2 to Form 10-K for the annual period ended January 31, 2005 (File No. 000-50421) as filed with the Securities and Exchange Commission on April 5, 2005)
* 10.2
2011 Employee Omnibus Incentive Plan (incorporated by reference to Exhibit 10.1.3 to Form 10-Q for the quarterly period ended April 30, 2011 (File No. 001-34956) filed the Securities and Exchange Commission on May 26, 2011)
* 10.2.1
Form of Restricted Stock Award Agreement under the 2011 Employee Omnibus Incentive Plan (incorporated herein by reference to Exhibit 10.1.4 to Form 10-Q for the quarterly period ended April 30, 2011 (File No. 001-34956) as filed with the Securities and Exchange Commission on May 26, 2011)
* 10.3
2003 Non-Employee Director Stock Option Plan (incorporated herein by reference to Exhibit 10.2 to registration statement on Form S-1 (File No. 333-109046) as filed with the Securities and Exchange Commission on September 23, 2003)
* 10.3.1
Form of Stock Option Agreement under the 2003 Non-Employee Director Stock Option Plan (incorporated herein by reference to Exhibit 10.2.1 to Form 10-K for the annual period ended January 31, 2005 (File No. 000-50421) as filed with the Securities and Exchange Commission on April 5, 2005)
* 10.4
2011 Non-Employee Director Restricted Stock Plan (incorporated by reference to Exhibit 10.2.2 to Form 10-Q for the quarterly period ended April 30, 2011 (File No. 001-34956) as filed with the Securities and Exchange Commission on May 26, 2011)
*10.4.1
First Amendment to 2011 Non-Employee Director Restricted Stock Plan effective August 27, 2013 (incorporated herein by reference to Exhibit 10.1 to Form 10-Q for the quarterly period ended July 31, 2013 (File No. 001-34956) as filed with the Securities and Exchange Commission on September 5, 2013)
*10.4.2
Form of Restricted Stock Award Agreement under the 2011 Non-Employee Director Restricted Stock Plan (incorporated by reference to Exhibit 10.2.3 to Form 10-Q for the quarterly period ended April 30, 2011 (File No. 001-34956) as filed with the Securities and Exchange Commission on May 26, 2011)
*10.4.3
Revised Form of Restricted Stock Award Agreement under the 2011 Non-Employee Director Restricted Stock Plan (incorporated herein by reference to Exhibit 10.2 to Form 10-Q for the quarterly period ended July 31, 2013 (File No. 001-34956) as filed with the Securities and Exchange Commission on September 5, 2013)
*10.4.4
Revised Form of Restricted Stock Award Agreement under the 2011 Non-Employee Director Restricted Stock Plan (incorporated herein by reference to Exhibit 10.1 to Form 10-Q for the quarterly period ended April 30, 2015 (File No. 001-34956) as filed with the Securities and Exchange Commission on June 2, 2015)
*10.4.5
Form of Deferral Election Form under the 2011 Non-Employee Director Restricted Stock Plan (incorporated herein by reference to Exhibit 10.3 to Form 10-Q for the quarterly period ended July 31, 2013 (File No. 001-34956) as filed with the Securities and Exchange Commission on September 5, 2013)
*10.4.6
Revised Form of Deferral Election Form under the 2011 Non-Employee Director Restricted Stock Plan (incorporated herein by reference to Exhibit 10.2 to Form 10-Q for the quarterly period ended April 30, 2015 (File No. 001-34956) as filed with the Securities and Exchange Commission on June 2, 2015)
* 10.5
2016 Omnibus Stock Incentive Plan (incorporated herein by reference to Exhibit 99.1 to registration statement on Form S-8 (File No. 333-211584) as filed with the Securities and Exchange Commission on May 25, 2016)
*10.5.1
Amended 2016 Omnibus Stock Incentive Plan (incorporated herein by reference to Appendix A to Conn’s, Inc. Definitive Proxy Statement on Schedule 14A (File No. 001-34956) as filed with the Securities and Exchange Commission on April 17, 2017)
*10.5.2
Form of Restricted Stock Unit Award Agreement (Time-based and Performance-based Vesting) under the 2016 Omnibus Stock Incentive Plan (incorporated herein by reference to Exhibit 10.4 to Form 10-Q for the quarterly period ended July 31, 2016 (File No. 001-34956) as filed with the Securities and Exchange Commission on September 8, 2016)

Table of Contents
103
*10.5.3
Form of Restricted Stock Unit Award Agreement (Time-based vesting) under the 2016 Omnibus Stock Incentive Plan (incorporated herein by reference to Exhibit 10.5 to Form 10-Q for the quarterly period ended July 31, 2016 (File No. 001-34956) as filed with the Securities and Exchange Commission on September 8, 2016)
*10.5.4
Form of Performance-Based Restricted Stock Unit Award Agreement relating to fiscal year 2017 Special Equity Awards under the 2016 Omnibus Stock Incentive Plan (incorporated herein by reference to Exhibit 10.5.3 to Form 10-K for the annual period ended January 31, 2017 (File No. 001-34956) as filed with the Securities and Exchange Commission on April 4, 2017)
*10.5.5
Form of Restricted Stock Unit Award Agreement relating to fiscal year 2017 Special Equity Awards under the 2016 Omnibus Stock Incentive Plan (incorporated herein by reference to Exhibit 10.5.4 to Form 10-K for the annual period ended January 31, 2017 (File No. 001-34956) as filed with the Securities and Exchange Commission on April 4, 2017)
*10.6
Conn’s, Inc. 2020 Omnibus Equity Plan (incorporated herein by reference to Appendix A of the Company’s Definitive Proxy Statement on Schedule 14A (File No. 001-34956) as filed with the Securities and Exchange Commission on April 14, 2020)
* 10.7
Employee Stock Purchase Plan (incorporated herein by reference to Exhibit 10.3 to registration statement on Form S-1 (File No. 333-109046) as filed with the Securities and Exchange Commission on September 23, 2003)
* 10.8
Conn’s 401(k) Retirement Savings Plan (incorporated herein by reference to Exhibit 10.4 to registration statement on Form S-1 (File No. 333-109046) as filed with the Securities and Exchange Commission on September 23, 2003)
* 10.9
Executive Severance Agreement by and between Norman Miller and Conn’s Inc., dated as of September 7, 2015 (incorporated herein by reference to Exhibit 10.2 to Form 8-K (File No. 001-34956) as filed with the Securities and Exchange Commission on September 9, 2015)
*10.9.1
Letter Agreement from Conn’s, Inc. to Norman L. Miller, dated as of January 2, 2017 (incorporated by reference to Exhibit 10.1 to Form 8-K (File No. 001-34956) filed with the Securities and Exchange Commission on January 6, 2017)
*10.10
Offer of employment from Conn’s Inc. to Lee A. Wright, dated as of May 31, 2016 (incorporated herein by reference to Exhibit 10.1 to Form 8-K (File No. 001-34956) filed with the Securities and Exchange Commission on June 2, 2016)
*10.10.1
Executive Severance Agreement by and between Lee A. Wright and Conn’s Inc., dated as of May 31, 2016 (incorporated herein by reference to Exhibit 10.2 to Form 8-K (File No. 001-34956) filed with the Securities and Exchange Commission on June 2, 2016)
*10.11
Offer of employment from Conn’s Inc. to George Bchara, dated as of December 9, 2016 (incorporated by reference to Exhibit 10.1 to Form 8-K (File No. 001-34956) filed with the Securities and Exchange Commission on December 14, 2016)
*10.12
Executive Severance Agreement by and between Rodney Lastinger and Conn’s Inc., dated as of June 3, 2019 (incorporated herein by reference to Exhibit 10.1 to Form 10-Q (File No. 001-34956) filed with the Securities and Exchange Commission on September 3, 2019)
*10.13
Executive Severance Plan (incorporated herein by reference to Exhibit 10.14 to Form 10-Q for the quarterly period ended October 31, 2014 (File No. 001-34956) as filed with the Securities and Exchange Commission on December 8, 2015)
10.14
Amended and Restated Executive Severance Plan (incorporated herein by reference to Exhibit 10.1 to Form 10-Q for the quarterly period ended July 31, 2020 (File No. 001-34956) as filed with the Securities and Exchange Commission on September 3, 2020)
**10.15
Fifth Amended and Restated Loan Agreement, dated March 29, 2021, by and among the Company, as parent and guarantor, Conn Appliances, Inc., Conn Credit I, LP and Conn Credit Corporation, Inc., as borrowers, certain banks and financial institutions named therein, as lenders, and Bank of America N.A., in its capacity as agent for lenders (filed herewith)
10.16
Omnibus Amendment and Reaffirmation of Existing Ancillary Documents, dated as of October 30, 2015, by and among Conn’s Inc., Conn Appliances, Inc., Conn Credit I, LP, and Conn Credit Corporation, Inc., the guarantors party thereto and Bank of America, N.A., in its capacity as agent for lenders (incorporated herein by reference to Exhibit 10.2 to Form 8-K (File No. 001-34956) as filed with the Securities and Exchange Commission on November 2, 2015)
10.17
Form of Indemnification Agreement (incorporated herein by reference to Exhibit 10.16 to registration statement on Form S-1 (file no. 333-109046) as filed with the Securities and Exchange Commission on September 23, 2003)

Table of Contents
104
10.18
Note Purchase Agreement, dated December 12, 2017, by and among Conn’s Inc., Conn’s Receivables Funding 2017-B, LLC, Conn Appliances, Inc., Credit Suisse Securities (USA) LLC, JP Morgan Securities LLC, MUFG Securities Americas Inc. and Deutsche Bank Securities Inc., as initial purchasers (incorporated herein by reference to Exhibit 1.1 to Form 8-K (File No. 001-34956) as filed with the Securities and Exchange Commission on December 26, 2017)
10.19
First Receivables Purchase Agreement, dated December 20, 2017, by and between Conn Credit I, L.P. and Conn Appliances Receivables Funding, LLC (incorporated herein by reference to Exhibit 10.1 to Form 8-K (File No. 001-34956) as filed with the Securities and Exchange Commission on December 26, 2017)
10.20
Second Receivables Purchase Agreement, dated December 20, 2017, by and between Conn Credit I, L.P. and Conn Appliances Receivables Fund, LLC (incorporated herein by reference to Exhibit 10.2 to Form 8-K (File No. 001-34956) as filed with the Securities and Exchange Commission on December 26, 2017)
10.21
Purchase and Sale Agreement, dated December 20, 2017 by and between Conn Appliances Receivables Funding, LLC and Conn’s Receivables 2017-B Trust (incorporated herein by reference to Exhibit 10.3 to Form 8-K (File No. 001-34956) as filed with the Securities and Exchange Commission on December 26, 2017)
10.22
Servicing Agreement dated as of December 20, 2017, among Conn’s Receivables Funding 2017-B, LLC, Conn’s Receivables 2017-B Trust, Conn Appliances, Inc. and Wilmington Trust, National Association (incorporated herein by reference to Exhibit 10.4 to Form 8-K (File No. 001-34956) as filed with the Securities and Exchange Commission on December 26, 2017)
10.23
First Receivables Purchase Agreement, dated August 15, 2018, by and between the Seller and the Depositor (incorporated herein by reference to Exhibit 10.1 to Form 8-K (File No. 001-34956) as filed with the Securities and Exchange Commission on August 17, 2018)
10.24
Second Receivables Purchase Agreement, dated August 15, 2018, by and between the Seller and the Receivables Trust (incorporated herein by reference to Exhibit 10.2 to Form 8-K (File No. 001-34956) as filed with the Securities and Exchange Commission on August 17, 2018)
10.25
Purchase and Sale Agreement, dated August 15, 2018, by and between the Seller and the Receivables Trust (incorporated herein by reference to Exhibit 10.3 to Form 8-K (File No. 001-34956) as filed with the Securities and Exchange Commission on August 17, 2018)
10.26
Servicing Agreement dated as of August 15, 2018, by and among the Issuer, the Receivables Trust, the Servicer and the Trustee (incorporated herein by reference to Exhibit 10.4 to Form 8-K (File No. 001-34956) as filed with the Securities and Exchange Commission on August 17, 2018)
10.27
First Receivables Purchase Agreement, dated April 24, 2019, by and between the Seller and the Depositor (incorporated herein by reference to Exhibit 10.1 to Form 8-K (File No. 001-34956) as filed with the Securities and Exchange Commission on April 25, 2019)
10.28
Second Receivables Purchase Agreement, dated April 24, 2019, by and between the Seller and the Receivables Trust (incorporated herein by reference to Exhibit 10.2 to Form 8-K (File No. 001-34956) as filed with the Securities and Exchange Commission on April 25, 2019)
10.29
Purchase and Sale Agreement, dated April 24, 2019, by and between the Seller and the Receivables Trust (incorporated herein by reference to Exhibit 10.3 to Form 8-K (File No. 001-34956) as filed with the Securities and Exchange Commission on April 25, 2019)
10.30
Servicing Agreement dated as of April 24, 2019, by and among the Issuer, the Receivables Trust, the Servicer and the Trustee (incorporated herein by reference to Exhibit 10.4 to Form 8-K (File No. 001-34956) as filed with the Securities and Exchange Commission on April 25, 2019)
10.31
Note Purchase Agreement, dated November 19, 2019, by and among Conn Appliances, Inc., Conn’s Receivables Funding 2019-B, LLC, Conn Appliances Receivables Funding, LLC, Conn’s, Inc. and the Initial Purchasers (incorporated herein by reference to Exhibit 1.1 to Form 8-K (File No. 001-34956) as filed with the Securities and Exchange Commission on November 22, 2019)
10.32
First Receivables Purchase Agreement, dated November 26, 2019, by and between the Seller and the Depositor (incorporated herein by reference to Exhibit 10.1 to Form 8-K (File No. 001-34956) as filed with the Securities and Exchange Commission on November 27, 2019)
10.33
Second Receivables Purchase Agreement, dated November 26, 2019, by and between the Seller and the Receivables Trust (incorporated herein by reference to Exhibit 10.2 to Form 8-K (File No. 001-34956) as filed with the Securities and Exchange Commission on November 27, 2019)
10.34
Purchase and Sale Agreement, dated November 26, 2019, by and between the Seller and the Receivables Trust (incorporated herein by reference to Exhibit 10.3 to Form 8-K (File No. 001-34956) as filed with the Securities and Exchange Commission on November 27, 2019)
10.35
Servicing Agreement dated as of November 26, 2019, by and among the Issuer, the Receivables Trust, the Servicer and the Trustee (incorporated herein by reference to Exhibit 10.4 to Form 8-K (File No. 001-34956) as filed with the Securities and Exchange Commission on November 27, 2019)

Table of Contents
105
10.36
Note Purchase Agreement, dated October 9, 2020, by and among Conn Appliances, Inc., Conn’s Receivables Funding 2020-A, LLC, Conn Appliances Receivables Funding, LLC, Conn’s, Inc. and the Initial Purchasers (incorporated herein by reference to Exhibit 1.1 to Form 8-K (File No. 001-34956) as filed with the Securities and Exchange Commission on October 13, 2020)
10.37
First Receivables Purchase Agreement, dated October 16, 2020, by and between the Seller and the Depositor (incorporated herein by reference to Exhibit 10.1 to Form 8-K (File No. 001-34956) as filed with the Securities and Exchange Commission on October 20, 2020)
10.38
Second Receivables Purchase Agreement, dated October 16, 2020, by and between the Seller and the Receivables Trust (incorporated herein by reference to Exhibit 10.2 to Form 8-K (File No. 001-34956) as filed with the Securities and Exchange Commission on October 20, 2020)
10.39
Purchase and Sale Agreement, dated October 16, 2020, by and between the Seller and the Receivables Trust (incorporated herein by reference to Exhibit 10.3 to Form 8-K (File No. 001-34956) as filed with the Securities and Exchange Commission on October 20, 2020)
10.40
Servicing Agreement dated as of October 16, 2020, by and among the Issuer, the Receivables Trust, the Servicer and the Trustee (incorporated herein by reference to Exhibit 10.4 to Form 8-K (File No. 001-34956) as filed with the Securities and Exchange Commission on October 20, 2020)
10.41
Third Omnibus Amendment, dated as of February 6, 2018, among Conn’s Receivables Warehouse, LLC, Conn Appliances, Inc., Wells Fargo Bank, National Association, Credit Suisse AG, New York Branch, Conn’s Receivables Warehouse Trust, Conn Appliances Receivables Funding, LLC, Credit Suisse AG, Cayman Islands Branch and Conn Credit I, LP. (incorporated herein by reference to Exhibit 10.1 to Form 8-K/A (File No. 001-34956) as filed with the Securities and Exchange Commission on February 13, 2018)
10.42
Fourth Omnibus Amendment, dated as of July 9, 2018, among Conn’s Receivables Warehouse, LLC, Conn Appliances, Inc., Wells Fargo Bank, National Association, Credit Suisse AG, New York Branch, Conn’s Receivables Warehouse Trust, Conn Appliances Receivables Funding, LLC, Credit Suisse AG, Cayman Islands Branch and Conn Credit I, LP (incorporated herein by reference to Exhibit 10.1 to Form 8-K (File No. 001-34956) as filed with the Securities and Exchange Commission on July 12, 2018)
10.43
Master Services Agreement for Professional Services, dated April 14, 2020, between Conn Appliances, Inc. and John Davis (incorporated herein by reference to Exhibit 10.2 to Form 10-Q (File No. 001-34956) as filed with the Securities and Exchange Commission on June 9, 2020)
*10.44 General Release and Waiver, dated as of January 29, 2021, between Conn’s, Inc. and Lee Wright (filed herewith)
21 Subsidiaries of Conn’s, Inc. (filed herewith) 23.1 Consent of Ernst & Young LLP (filed herewith) 31.1 Rule 13a-14(a)/15d-14(a) Certification (Chief Executive Officer) (filed herewith) 31.2 Rule 13a-14(a)/15d-14(a) Certification (Chief Financial Officer) (filed herewith) 32.1 Section 1350 Certification (Chief Executive Officer and Chief Financial Officer) (furnished herewith)
101
The following financial information from our Annual Report on Form 10-K for the annual period ended January 31, 2021, filed with the SEC on March 31, 2021, formatted in Inline Extensible Business Reporting Language (iXBRL): (i) consolidated balance sheets as of January 31, 2021 and 2020, (ii) consolidated statements of operations for the fiscal years ended January 31, 2021, 2021 and 2020, (iii) consolidated statements of comprehensive income for the fiscal years ended January 31, 2021, 2020 and 2019, (iv) consolidated statements of stockholders’ equity for the fiscal years ended January 31, 2021, 2020 and 2019, (v) consolidated statements of cash flows for the fiscal years ended January 31, 2021, 2020 and 2019, and (vi) notes to consolidated financial statements
104 Cover Page Interactive Data File (embedded within the Inline XBRL Document and included in Exhibit 101)
* Management contract or compensatory plan or arrangement.
** Schedules and exhibits to this Exhibit have been omitted pursuant to Item 601(a)(5) of Regulation S-K. The Company hereby undertakes to furnish supplemental copies of any of the omitted schedules and exhibits upon request by the SEC.
ITEM 16. FORM 10-K SUMMARY.
None.

Table of Contents
106
SIGNATURES
Pursuant to the requirements of Section 13 or 15(d) of the Securities Exchange Act of 1934, the registrant has duly caused this report to be signed on its behalf by the undersigned, thereunto duly authorized.
CONN’S, INC. (Registrant) By: /s/ Norman Miller Date: Norman Miller March 31, 2021 Chief Executive Officer and President
Pursuant to the requirements of the Securities Exchange Act of 1934, this report has been signed below by the following persons on behalf of the registrant and in the capacities and on the dates indicated.
Signature Title Date /s/ Norman Miller Norman Miller
Chairman of the Board, Chief Executive Officer and President (Principal Executive Officer)
March 31, 2021
/s/ George L. Bchara George L. Bchara
Executive Vice President and Chief Financial Officer (Principal Financial Officer)
March 31, 2021
/s/ Ryan R. Nelson Ryan R. Nelson
Chief Accounting Officer (Principal Accounting Officer)
March 31, 2021
/s/ Bob L. Martin Bob L. Martin Director March 31, 2021 /s/ William E. Saunders Jr. William E. Saunders Jr. Director March 31, 2021 /s/ Douglas H. Martin Douglas H. Martin Director March 31, 2021 /s/ David Schofman David Schofman Director March 31, 2021 /s/ James Haworth James Haworth Director March 31, 2021 /s/ Oded Shein Oded Shein Director March 31, 2021 /s/ Sue Gove Sue Gove Director March 31, 2021