connectnow - tech mahindra report 2007 - 2008 connectnow ... tech mahindra are committed more than...
TRANSCRIPT

ANNUAL REPORT 2007 - 2008
ConnectNow
IT Services and Telecom Solutions
CREATE THE NEXT WAVECREATE THE NEXT WAVE
IT Services and Telecom Solutions
CREATE THE NEXT WAVECREATE THE NEXT WAVE

Board of Directors
1
Board of Directors
Committees of Directors
Assistant Company Secretary & Compliance Officer
Mr. Anand G. Mahindra – Chairman
Mr. Vineet Nayyar – Vice Chairman, Managing Director & CEO
Hon. Akash Paul
Mr. Al-Noor Ramji
Mr. Anupam Puri
Mr. Arun Seth
Mr. Bharat N. Doshi
Mr. Clive Goodwin
Mr. Paul Zuckerman
Dr. Raj Reddy
Mr. Ulhas N. Yargop
Mr. Paul Ringham (Alternate Director to Mr. Clive Goodwin)
Mr. Anupam Puri – Chairman upto 19 May 2008
Mr. Paul Zuckerman – Chairman w.e.f. 19 May 2008
Mr. Clive Goodwin
Dr. Raj Reddy
Hon. Akash Paul – Chairman
Mr. Anupam Puri w.e.f. 19 May 2008
Mr. Arun Seth
Mr. Paul Zuckerman w.e.f. 19 May 2008
Mr. Ulhas N. Yargop
Mr. Ulhas N. Yargop – Chairman
Mr. Clive Goodwin
Mr. Vineet Nayyar
Mr. Vikrant C. Gandhe
Audit Sub-committee
Compensation Committee
Investor Grievances-cum-Share Transfer Committee
th
th
th
th
Registered Office
Corporate Office
Auditors
Bankers
Gateway Building,
Apollo Bunder,
Mumbai – 400 001
Sharada Centre,
Off. Karve Road,
Erandawane,
Pune - 411 004
Deloitte Haskins & Sells,
Chartered Accountants
Industrial Development Bank of India Ltd.
The Hongkong and Shanghai Banking
State Bank of India
Kotak Mahindra Bank Ltd.
Punjab National Bank
Corporation Ltd.

“We must become the change we want to see”
- Mahatma Gandhi
Rapid progress in the field of communication technology has shrunk the world more than
ever before. Distributed virtual teams performing specialized tasks are the order of the
day and collaboration is the key. The ability to connect across functions, geographies and
cultures and to be able to deliver collaboratively amidst fierce competition will become a
key differentiator in the global market place. All collaboration starts with the most critical
asset of any organization - people. Collaboration is not about technology but about
mindsets; and at Tech Mahindra, this year, we launched ConnectNow - our focused
initiative of collaboration among teams.
The program focuses on mentoring employees via interactive workshops and
encouraging and empowering teams to see the big picture and to understand their role
in it. This initiative will involve and educate our employees about the needs of our clients'
customers, identify the touch points and channels for collaboration, coach them in
productive communication styles and empower them to deliver an enhanced end- to -
end customer experience.
ConnectNow demonstrates the key values of open communication, shared goals, trust,
diversity, respect and accountability that Tech Mahindra stands for.
Connecting teams across Tech Mahindra
6
c km y

Table of Contents
Directors’ Report 5
Management Discussion and Analysis 13
Corporate Governance 22
Accounts 35
Statement pursuant to Section 212 75
Consolidated Accounts 77
c km y

Vice Chairman's Message
Letter to the Shareholders
The year 2007-2008 has been a landmark year for Tech Mahindra in
many ways. A year full of challenges and cheer, it has been one that
has been marked by several distinctions.
The year saw us strengthening our relationship with our clients and
partnering with them in their transformation and innovation
journeys. Technology, Applications, Operations, Business Processes,
Networks in isolation are but tools that when interconnected enable
our clients to deliver a superior customer experience, and improve
their own operating performance. Our industry has excelled in
providing offshore application development & maintenance, BPO,
and infrastructure management services with distinction over the
past two decades. As we move into the core of our clients’ business
processes, our ability to integrate these offerings with innovative
delivery and business models will be a key differentiator.
‘ConnectNow’ is our transformation initiative that enables our
employees to think like our customers and what makes them
successful, and then apply their unique talent, skills, and capability in
a connected approach.
At a time when the industry is passing through tough times with
mounting currency pressures, and overall global slowdown, we at
Tech Mahindra are committed more than ever to deliver significant
value to our customers and to our stakeholders. My belief is that the
recent economic events are an opportunity for us to realign our
business models and offer these differentiated solutions to our
customers. There is an increased interest across our customer base for
deriving the benefits of the global delivery model.
We have had a healthy growth in all the markets we serve. We added
24 clients during the year which we believe are the key to our growth
in the future. We continue to focus on emerging markets and see a
greater demand for telecom transformation, greenfield
TM
implementations and next generation services. We have been
successful in enabling rapid realization of new products and services
while delivering significant cost savings.
BT continues to be our key customer. We further strengthened this
strategic partnership by signing a five year deal valued in excess of
US$350 Million to provide Application Support & Maintenance for
their business critical BSS and OSS applications and platforms. Such
deals enable us to take a long term view on innovation and service
excellence.
We have delivered well on the BT Global Services business
transformation contract and we continue to be a key component of
BT’s growth strategy. Unique skills and capabilities developed while
servicing this challenging contract will serve the company well as it
positions itself as a business transformation partner in our next phase
of evolution.
As we usher in a new year, I want to thank all our employees and their
families for their unstinting support and dedication. They are truly the
cornerstones of all our successes. I also take this opportunity to thank
our customers who’ve entrusted us with their critical systems and all
our share holders for your support and confidence in our company –
my team and I assure you we are committed to do everything in our
might to justify the faith reposed in us by all of you.
Sincerely,
Vineet Nayyar
Vice Chairman, Managing Director & CEO
Vineet Nayyar
Vice Chairman,
Managing Director & CEO
3
c km y

A N N U A L R E P O R T 2 0 0 7
CONSOLIDATED FINANCIAL PERFORMANCE SNAPSHOT
Particulars 2004 2005 2006 2007 2008
Rs. Mn US$Mn Rs. Mn US$Mn Rs. Mn US$Mn Rs. Mn US$Mn Rs. Mn US$ Mn
Revenue 7,417 163.4 9,456 210.4 12,427 280.1 29,290 648.0 37,661 934.7
Total Income 7,565 166.7 9,542 212.2 12,767 287.7 29,350 649.5 38,705 960.8
EBIDTA (Operating Profit)* 798 17.6 1,350 30.2 2,679 60.2 7,384 163.3 8,257 205.3
PBT 720 15.9 1,115 24.9 2,621 58.9 6,867 152.0 8,443 210.1
PAT before exceptionalitem 637 14.0 1,024 22.8 2,354 52.9 6,127 135.6 7,695 191.5
PAT after exceptional item 637 14.0 1,024 22.8 2,354 52.9 1,215 24.3 3,299 81.7
EBIDTA Margin % 10.8% 10.8% 14.3% 14.3% 21.6% 21.6% 25.2% 25.2% 21.9% 21.9%
PAT Margin %* 8.6% 8.6% 10.8% 10.8% 18.9% 18.9% 20.9% 20.9% 20.4% 20.4%
Equity Capital 203 4.5 203 4.6 208 4.7 1,212 27.9 1,214 30.3
Net Worth 4,067 89.8 4,861 111.1 6,155 138.0 9,185 211.2 12,572 313.4
Net Block Incl CWIP 1,544 34.1 1,781 40.7 2,898 65.0 4,421 101.7 5,996 149.5
Current Assets 3,228 71.3 3,740 85.4 5,676 127.2 10,395 239.0 15,562 387.9
Current Liabilities &Provisions 1,241 27.4 1,906 43.5 4,036 90.5 6,435 148.0 9,268 231.0
Net Working Capital 1,987 43.9 1,834 41.9 1,640 36.8 3,960 91.0 6,294 156.9
Total Assets 5,309 117.2 6,767 154.6 10,191 228.4 15,869 364.9 22,251 554.6
Current Ratio 2.6 2.6 2.0 2.0 1.4 1.4 1.6 1.6 1.7 1.7
Total Assets Turnover 1.4 1.4 1.4 1.4 1.2 1.2 1.8 1.8 1.7 1.7
Fixed Assets Turnover 4.8 4.8 5.3 5.3 4.3 4.3 6.6 6.6 6.3 6.3
ROCE % * 18.3% 18.3% 25.0% 25.0% 47.6% 47.6% 88.7% 88.7% 75.8% 75.8%
* Before exceptional item
2007-082006-072005-06
Revenue
12,427
29,290
37,661
2007-082006-072005-06
Profit After Tax before Exceptional Item
2,354
6,127
7,695
2007-082006-072005-06
SG&A %18.9%
14.9% 14.7%
Geographywise Revenue 2007-08
Europe 73.6%
Rest of World 7.0%
North America19.4%
2007-082006-072005-06
Headcount
10,493
19,749
22,884
2007-082006-072005-06
No. of Active Customers
62
83
107

5
DIRECTORS’ REPORT TO THE SHAREHOLDERSYour Directors present their Twenty-first Annual Report together with the audited accounts of your Company for the yearended 31st March 2008.
FINANCIAL RESULTS Rs. in Million
For the year ended 31st March 2008 2007
Income 37,023 27,586
Profit before Depreciation and tax 9,083 6,980
Depreciation (736) (463)
Profit before tax 8,347 6,517
Provision for taxation (689) (615)
Profit after tax before non-recurring / exceptional items 7,658 5,902
Non-recurring / exceptional items (4,401) (5,250)
Profit for the year after tax and non-recurring / exceptional items 3,257 652
Provision in respect of earlier years written back 165 339
Balance brought forward from previous year 4,261 4,540
Profit available for appropriation 7,683 5,531
Dividend – Interim (Paid) NIL (266)
– Final (Proposed) (668) NIL
Tax on dividend – On interim dividend NIL (37)
– On final dividend (113) NIL
Transfer to General Reserve (1,700) (65)
Balance carried forward 5,202 5,163
DIVIDEND
Your Directors have recommended a dividend of 55%(Rs. 5.50 per share of face value of Rs. 10) for the financialyear ended on 31st March 2008.
CHANGES IN SHARE CAPITAL
During the year under review, your Company allotted146,168 shares of Rs. 10 each on the exercise of stockoptions under its various Employee Stock Option Planswhich increased the number of issued, subscribedand paid-up equity shares from 121,216,701 to121,362,869.
BUSINESS PERFORMANCE / FINANCIAL OVERVIEW
Your Company continues to excel in providing effectivebusiness solutions to its customers. Your Company’sstrategy of providing end to end solutions to leadingtelecom companies around the world by leveraging itstelecom domain knowledge, excellence in technology androbust processes has resulted in strong growth inengagements of larger scale and scope. Your Company hasemerged as an integrated service provider, combining itsstrength in the areas of Application Development andMaintenance, Infrastructure Management Services, IT
Enabled Services, Business Process Management, SecurityServices and Business Intelligence Services.
During the year, your Company made significant progressin partnering customers in the networked IT solution space,helping Telecom Service Providers (TSPs) deliver servicesto enterprise customers. Substantial growth has beenachieved in the billion dollar business transformation dealsigned with BT last year. Your Company’s ability to learn,delivery capability, domain expertise and projectmanagement capability has been greatly appreciated bythe client.
In continuation with its efforts to enhance its leadershipin the telecom domain, your Company continues to investin developing competence in its chosen areas of focus.Your Company has made progress in delivering servicesfor network solutions which form a significant area ofspend by TSPs and cover traditional areas of networkoperations as well as new technologies such as WiMaxand IPV6. These emerging businesses, in the opinion ofyour Company, have significant potential to scale up inthe coming years.
Keeping in line with its strategy of expanding serviceofferings, your Company has significantly ramped up itsBPO operations during the year under review. Your

6
A N N U A L R E P O R T 2 0 0 7
Company offers focused BPO and KPO solutions in theareas of service provisioning, service activation, incidentand problem management, contract management, marketresearch, customer care and billing.
During the year under review, your Company has madegood progress on its strategy to target multi-year dealswith end to end ownership of customer systems and theCompany processes. This initiative has helped the Companyfurther its objective of long term partnership with thecustomers. The Company seeks to become an integral partof the customer’s transformation journey by offeringsuperior value propositions.
Your Company has been continuously pursuing growthopportunities in related industries where the strongcapabilities acquired by your Company can be leveragedeffectively. In the previous year, your Company has beensuccessful in making inroads into the cable industry. YourCompany continues to invest in strengthening itsmarketing infrastructure across geographies.
Your Company continued to see strong and profitablegrowth in the financial year 2007-08 across all marketsdriven by good performance in existing and new areas ofbusiness.
During the year under review, total income increased toRs. 37,023 Million from Rs. 27,586 Million in the previousyear, at a growth rate of 34%. On a consolidated level,total income increased to Rs. 38,705 Million fromRs. 29,350 Million in the previous year.
During the year, 77% revenue came from Europe, 17% camefrom USA and 6% came from Rest of the World (ROW).Your Company added 24 new clients across geographies,which include large global corporations.
The Profit before depreciation amounts to Rs. 9,083 Million(25% of revenue) as against Rs. 6,980 Million (25% ofrevenue) in the previous year.
Profit after tax, before exceptional items, has increased toRs. 7,658 Million from Rs. 5,902 Million. On a consolidatedlevel, profit after tax, before exceptional items, increasedto Rs. 7,695 Million from Rs. 6,127 Million in the previousyear, a growth of 26%.
During the year, your Company has entered into anagreement with a customer under which the Companyhas made an exclusivity payment of Rs. 4,401 Million tothe customer. Accordingly, this payment has been disclosedas an exceptional item in the Profit and Loss account.
MANAGEMENT DISCUSSION AND ANALYSIS REPORT
A detailed analysis of your Company’s performance isdiscussed in the Manaement Discussion and AnalysisReport, which forms part of this Annual Report.
INITIAL PUBLIC OFFERING (IPO)
Pursuant to the Listing Agreement with the StockExchanges, given below is the utilisation statement of thefunds raised through IPO:
Rs. in Million
Year Projections Actual
Fiscal 2007 842 281
Fiscal 2008 269 830
Total 1,111 1,111
AMALGAMATION OF SUBSIDIARIES
With a view to streamline the operations, it was consideredappropriate to merge two of the wholly owned subsidiariesof your Company, namely, iPolicy Networks Limited andTech Mahindra (R & D Services) Limited with your Company.Necessary approvals were obtained from the respectiveBoards of Directors and Shareholders after which petitionswere filed with the jurisdictional High Courts. The Hon’bleHigh Court of Bombay, the Hon’ble High Court of Karnatakaand the Hon’ble High Court of Delhi, at their hearings heldon 28th March 2008, 3rd April 2008 and 4th April 2008respectively have approved the Scheme of Amalgamationbetween iPolicy Networks Limited and Tech Mahindra (R& D Services) Limited with your Company. The necessaryOrders of the Courts have been received and filed withthe respective Registrar of Companies and effective20th May 2008 iPolicy Networks Limited and Tech Mahindra(R & D Services) Limited stand dissolved withoutwinding-up.
QUALITY
Your Company remains committed to the highest qualitystandards and has achieved several quality accreditationslike ISO 9001:2000, ISO/IEC 20000-1:2005, ISO/IEC27001:2005, SEI-CMMI Level 5 P-CMM Level 5 and SSE-CMMLevel 3. These accreditations are a manifestation of thestrength of your Company’s processes and maturity of itssystem.
Your Company’s Quality Management Group (QMG) isresponsible for continuously improving business processeswhich are bench marked against the highest industrystandards. Your Company’s goal is to ensure greatercustomer satisfaction by improved quality, productivity andcycle time.
HUMAN RESOURCES
During the fiscal year 2007-08, your Company along withits subsidiaries made a net addition of 3,135 employees.The employee strength increased to 22,884 as at 31st March2008, compared to 19,749 a year before, an increase of

7
16%. BPO services registered significant growth, almostdoubling the headcount to 3,445 from 1,755, a year before.
Employee Learning and Development/Interface withAcademia
The endeavour at your Company is to foster a competencydriven organization and instill a culture of highperformance.
Career enrichment is of key importance and the EducationServices Group (ESG) at your Company actively involvesitself in fostering a learning culture among all employees.Extending higher education opportunities for employeesforms a core focus of the ESG and it coordinates post-graduate education programs from IIT Mumbai and BITSPilani.
Along with technical know-how, your Company alsoensures an all round development of its employeesthrough its in-house soft skill training programs. TheBehavioral training team handles mentoring, guidance andcareer outlining for all employees and is focused onfacilitating organization-wide capability building throughcontinuously enhancing the knowledge, skills and attitude.
Leadership Development
In order to strengthen organization capability, yourCompany continues to focus on developing talent throughtwo unique programs the ‘Global Leadership Cadre’ (GLC)and the Management Trainee (MT) program which hiresthe best talent from top academic campuses and groomsthem through a focused program to take up highermanagerial and decision making responsibilities.
In addition, the Technical GLC program is offered to internalcandidates who have been outstanding performers in theircurrent assignments and have the potential to take uptechno commercial roles at critical positions.
INFRASTRUCTURE
Your Company continued to invest in creating best in classfacilities across the world in accordance with its businessplans. Your Company is in final stages of completion of thefirst phase of its campus in Hinjewadi SEZ in Pune with9,000 seats. During the year, your Company set up adevelopment center at Belfast, Northern Ireland, having aseating capacity of 400 to provide end to end IT and BPOsolutions to customers primarily in the European and USmarkets. A new development center with state of the artfacilities was also opened in Chennai SEZ with a capacityof 1,400 seats.
SUBSIDIARY COMPANIES
During the year under review, Tech Mahindra (Malaysia)Sdn Bhd. and Tech Mahindra (Beijing) IT Services Limitedbecame subsidiaries of your Company.
As on 31st March 2008, your Company has 11 subsidiariesand 2 step-down subsidiaries. There has not been anymaterial change in the nature of the business of thesubsidiaries. As already reported in the previous AnnualReport, Tech Mahindra (R&D Services) Pte. Limited,Singapore, a dormant step-down subsidiary of yourCompany had applied for voluntary closure and was struckoff the Register of Companies with effect from8th April 2007.
As required under the Listing Agreements with the StockExchanges, the Consolidated Financial Statements of yourCompany and all its subsidiaries are attached. TheConsolidated Financial Statements have been prepared inaccordance with Accounting Standard AS 21, AS 23 andAS 27 issued by The Institute of Chartered Accountants ofIndia and show the financial resources, assets, liabilities,income, profits and other details of your Company and itssubsidiaries and associate companies as a single entity,after elimination of minority interest.
Your Company has been granted exemption for the yearended 31st March 2008 by the Ministry of Corporate Affairsvide its letter dated 12th March 2008 from attaching to itsBalance Sheet, the individual Annual Reports of each of itssubsidiaries. Documents of the subsidiaries will besubmitted on request to any member wishing to peruse acopy, on receipt of such request by the Assistant CompanySecretary of the Company. However, as directed by theCentral Government, the financial details of the subsidiarieshave been separately furnished forming part of this AnnualReport. These documents will also be available forinspection by any member at the registered office of theCompany and the office of the respective subsidiarycompanies during working hours upto the date of AnnualGeneral Meeting.
EMPLOYEE STOCK OPTION PLAN
Details required to be provided under the Securities andExchange Board of India (Employee Stock Option Schemeand Employee Stock Purchase Scheme) Guidelines, 1999are set out in Annexure I to this Report.
CORPORATE SOCIAL RESPONSIBILITY
Your Company, as a responsible corporate entity, believesfirmly in meeting its social responsibility towards thedevelopment of the underprivileged in today’s society. TheTech Mahindra Foundation is the CSR arm of yourCompany. Your Company contributes 1% of its PAT everyyear to fund the CSR activities undertaken on its behalf bythe Foundation. During the year 2007-08, the TechMahindra Foundation has made total donations of Rs. 30Million to meet its charitable objectives. Your Companyand its employees have added Rs. 84 Million to the corpusaccount which stands at Rs. 304 Million.

8
A N N U A L R E P O R T 2 0 0 7
The Tech Mahindra Foundation believes in the power ofeducation to bring about a transformation in the lives ofthe underprivileged, besides being the essential and criticalelement in national development. The Foundation hasfocused on bringing about positive changes in the area ofeducation for the economically disadvantaged bydeveloping partnerships with reputed NGOs who sharethe Foundation’s vision. It also seeks out organizationswhich have effective vocational training programs toenable young people to advance towards a bettereconomic future.
Some of the activities undertaken by the Foundation inassociation with its NGO partners include providingeducational support to the children of waste pickers andconstruction workers and to children with various physicaldisabilities. The Foundation has supported organizationsrunning educational centres for slum children and seekingto improve quality of education in municipal schools. Ithas encouraged its partners to pay special attention tothe needs of the girl child.
The year under review saw the Foundation launching someinnovative initiatives such as:
• setting up of an employability portal which will helptowards personal development and training ofpersons with disability; the software will be developedby employees of your Company;
• development of an English language competencecourse for underprivileged school dropouts; and
• a scheme to improve education in Delhi Municipalschools by instituting a scheme to recognize andhonour outstanding teachers (Shikshak SammanScheme).
Your Company continued its policy of donating computerhardware to schools and charitable institutions.
During the year under review, your Company set up aneducational Trust, “Mahindra Education Foundation”, alongwith another company from the Mahindra Group for thepurpose of setting up educational college campuses toimprove the availability of qualified professionals forindustry.
CORPORATE GOVERNANCE PHILOSOPHY
Your Company believes that Corporate Governance is avoluntary code of self-discipline. In line with thisphilosophy, it follows healthy Corporate Governancepractices and reports to the shareholders the progressmade on the various measures undertaken. Your Directorshave reported the initiatives on Corporate Governanceadopted by your Company which are included in thesection ‘Corporate Governance’ in the Annual Report.
DIRECTORS
Mr. Bharat N. Doshi, Hon. Akash Paul and Mr. Arun Sethretire by rotation, and being eligible, offer themselves forre-appointment.
DIRECTORS’ RESPONSIBILITY STATEMENT
Pursuant to section 217(2AA) of the Companies Act, 1956,your Directors, based on the representation received fromthe Operating Management, and after due enquiry, confirmthat:
i. in the preparation of the annual accounts, theapplicable accounting standards have been followed;
ii. they have, in the selection of the accounting policies,consulted the Statutory Auditors and these have beenapplied consistently and reasonable and prudentjudgments and estimates have been made so as togive a true and fair view of the state of affairs of theCompany as at 31st March 2008 and of the profit ofthe Company for the year ended on that date;
iii. proper and sufficient care has been taken for themaintenance of adequate accounting records inaccordance with the provisions of the Companies Act,1956 for safeguarding the assets of the Company andfor preventing and detecting fraud and otherirregularities;
iv. the annual accounts have been prepared on a goingconcern basis.
AUDITORS
M/s. Deloitte Haskins & Sells, Chartered Accountants, theAuditors of your Company, hold office up to the conclusionof the forthcoming Annual General Meeting of theCompany and have given their consent for re-appointment.The shareholders will be required to elect auditors for thecurrent year and fix their remuneration. Your Company hasreceived a written confirmation from M/s. Deloitte Haskins& Sells to the effect that their appointment, if made, wouldbe in conformity with the limits prescribed in Section 224of the Companies Act, 1956.The Board recommends there-appointment of M/s. Deloitte Haskins & Sells as theAuditors of the Company.
CONSERVATION OF ENERGY AND TECHNOLOGYABSORPTION
In view of the nature of activities that are being carried onby your Company, Rule 2A and 2B of the Companies(Disclosure of Particulars in the Report of Board ofDirectors) Rules, 1988, concerning conservation of energyand technology absorption, respectively are not applicable

9
Particulars of loans/advances and investment in its own shares by listed companies, their subsidiaries, associates,etc., required to be disclosed in the annual accounts of the Company pursuant to Clause 32 of the Listing Agreement
Loans and advances in the nature of loans to subsidiaries:
Rs. in Million
Name of the Company Balance as on 31st March 2008 Maximum outstanding during the year
Tech Mahindra (Americas) Inc. 100 218
Loans and advances in the nature of loans to associates, loans and advances in the nature of loans where there is norepayment schedule or repayment beyond seven years or no interest or interest below section 372A of the CompaniesAct, 1956 and loans and advances in the nature of loans to firms/companies in which directors are interested – Nil
to your Company. Your Company being a software solutionprovider requires minimal energy consumption and everyendeavour has been made to ensure the optimal use ofenergy, avoid wastage and conserve energy as far aspossible.
FOREIGN EXCHANGE EARNINGS AND OUTGO
The foreign exchange earnings of your Company duringthe year were Rs. 35,637 Million (Previous Year Rs. 27,381Million), while the outgoings were Rs. 18,133 Million(Previous Year Rs. 16,340 Million).
PARTICULARS OF EMPLOYEES
Your Company had 510 employees who were in receipt ofremuneration of not less than Rs. 2,400,000 during theyear or Rs. 200,000 per month during any part of the saidyear. However, as per the provisions of Section 219 (1) (b)(iv) of the Companies Act, 1956, the Directors’ Report beingsent to the shareholders does not include this Annexure.Any shareholder interested in perusing a copy of theAnnexure may write to the Assistant Company Secretaryat the Registered Office / Corporate Office of the Company.
DEPOSITS AND LOANS/ADVANCES
Your Company has not accepted any deposits from thepublic or its employees during the year under review.
The particulars of loans/advances and investment in itsown shares by listed companies, their subsidiaries,associates, etc., required to be disclosed in the annualaccounts of the Company pursuant to Clause 32 of theListing Agreement are furnished separately.
AWARDS/RECOGNITION
Your Company continued its quest for excellence in itschosen area of business to emerge as a true global brand.
Several awards and rankings continue to endorse yourCompany as a thought leader in telecom industry.
Awards for the year
• Selected in the Leaders Category in ‘The 2008 GlobalOutsourcing 100’
(IAOP’s Annual Listing of the World’s Best OutsourcingService Providers)
• Winners of the ‘Best Overall Recruiting & StaffingOrganization of the Year Award’ (RASBIC Awards 2008)
• Employer Branding Award in ‘Innovation in therecruitment category’(RASBIC Awards 2008)
• Product Innovation Award for Enterprise DRM (Frost& Sullivan, Mar’08)
• Vertical Growth Leadership in Telecom Software (Frost& Sullivan, Mar’08)
• ‘Excellence in Information Technology’ (IT PeoplesAward)
ACKNOWLEDGEMENTS
Your Directors gratefully acknowledge the contributionsmade by employees towards the success of your Company.Your Directors are also thankful for the co-operation andassistance received from its customers, vendors, bankers,STPI, regulatory and Governmental authorities in India andabroad and its shareholders.
For and on behalf of the Board
Mumbai Anand G. Mahindra28th May 2008 Chairman

10
A N N U A L R E P O R T 2 0 0 7
Tota
l o
pti
on
s g
ran
ted
un
der
th
e p
lan
a)O
pti
on
s g
ran
ted
du
rin
g t
he
year
b)
The
pri
cin
g f
orm
ula
c)O
pti
on
s ve
sted
d)
Op
tio
ns
exer
cise
d
e)Th
e to
tal n
um
ber
of
shar
es a
risi
ng
as
a re
sult
of
exer
cise
of
op
tio
n
f)O
pti
on
s la
pse
d
g)
Vari
atio
n o
f te
rms
of
op
tio
ns
h)
Mo
ney
rea
lised
by
exer
cise
of
op
tio
ns
i)To
tal n
um
ber
of
op
tio
ns
in f
orc
e
j)E
mp
loye
e
wis
e
de
tail
s o
f o
pti
on
sg
ran
ted
to
i.Se
nio
r m
anag
eria
l p
erso
nn
el
ii.A
ny
oth
er e
mp
loye
e w
ho
rec
eive
s a
gra
nt
in a
ny
on
e y
ear
of
op
tio
nam
ou
nti
ng
to
5%
or
mo
re o
f o
pti
on
gra
nte
d d
uri
ng
th
at y
ear
iii.
Ide
nti
fie
d e
mp
loye
es
wh
o w
ere
gra
nte
d o
pti
on
, du
rin
g a
ny
on
e ye
ar,
equ
al t
o o
r ex
ceed
ing
1%
of
the
issu
ed
ca
pit
al
(exc
lud
ing
ou
tsta
nd
ing
w
arra
nts
an
dco
nve
rsio
ns)
of
the
com
pan
y at
th
eti
me
of
gra
nt
ESO
P 2
00
0
3,77
9,85
0
Nil
Un
der
th
e sc
hem
e, a
ll th
e o
pti
on
s w
ere
gra
nte
d p
rio
r to
th
e lis
tin
g o
f C
om
pan
y’s
shar
es. T
hes
e o
pti
on
s w
ere
gra
nte
d, b
ased
on
th
e
ann
ual
va
luat
ion
d
on
e
by
anin
dep
end
ent
char
tere
d a
cco
un
tan
t.
244,
390
111,
930
111,
930
6,62
0
In t
he
An
nu
al G
en
era
l M
ee
tin
g o
f th
eC
om
pan
y h
eld
on
20
th J
uly
20
07
, th
eS
che
me
was
am
en
de
d t
o i
ncl
ud
e t
he
pro
visi
on
fo
r re
cove
ry o
f FB
T fr
om
th
eem
plo
yees
.
Rs.
8.0
7 M
illio
n
350,
090
Nil
Nil
Nil
ESO
P 2
00
4
10,2
19,8
60
Nil
Un
der
th
e sc
hem
e, a
ll th
e o
pti
on
s w
ere
gra
nte
d p
rio
r to
th
e lis
tin
g o
f C
om
pan
y’s
shar
es. T
hes
e o
pti
on
s w
ere
gra
nte
d, b
ased
on
th
e va
luat
ion
do
ne
by
an i
nd
epen
den
tch
arte
red
acc
ou
nta
nt.
2,27
1,08
1
Nil
Nil
Nil
In t
he
An
nu
al G
en
era
l M
ee
tin
g o
f th
eC
om
pan
y h
eld
on
20
th J
uly
20
07
, th
eS
che
me
was
am
en
de
d t
o i
ncl
ud
e t
he
pro
visi
on
fo
r re
cove
ry o
f FB
T fr
om
th
eem
plo
yees
.
Nil
5,67
7,70
1
Nil
Nil
Mr.
Vin
eet
Nay
yar
: 3,4
06,6
20
Mr.
C P
Gu
rnan
i : 3
,406
,620
Mr.
San
jay
Kal
ra :
3,40
6,62
0
ESO
P 2
00
6
5,35
7,30
5
72,0
00
The
op
tio
ns
gra
nte
d p
rio
r to
th
e lis
tin
g o
fC
om
pan
y’s
shar
es, w
ere
gra
nte
d, b
ased
on
the
an
nu
al
valu
atio
n
do
ne
b
y an
ind
epen
den
t ch
arte
red
acc
ou
nta
nt.
Th
e
gra
nts
m
ade
p
ost
-lis
tin
g
of
the
Co
mp
any’
s sh
ares
on
Sto
ck E
xch
ang
es h
ave
be
en
mad
e a
s p
er
the
lat
est
ava
ilab
lecl
osi
ng
pri
ce o
n t
he
Sto
ck E
xch
ang
e w
ith
hig
hes
t tr
adin
g v
olu
me,
pri
or
to t
he
dat
e o
fth
e
me
eti
ng
o
f th
e
Co
mp
en
sati
on
Co
mm
itte
e in
wh
ich
op
tio
ns
are
gra
nte
d.
680,
543
34,2
38
34,2
38
Nil
In t
he
An
nu
al G
en
era
l M
ee
tin
g o
f th
eC
om
pan
y h
eld
on
20
th J
uly
20
07
, th
eS
che
me
was
am
en
de
d t
o i
ncl
ud
e t
he
pro
visi
on
fo
r re
cove
ry o
f FB
T fr
om
th
eem
plo
yees
.
Rs.
3.4
2 M
illio
n
4,19
3,02
8
Nil
Nil
Nil
An
nex
ure
I t
o t
he
Dir
ecto
rs’
Rep
ort
fo
r th
e ye
ar e
nd
ed 3
1st
Mar
ch 2
00
8 i
n t
erm
s o
f cl
ause
12
.1 o
f th
e S
ecu
riti
es a
nd
Exc
han
ge
Bo
ard
of
Ind
ia(E
mp
loye
e St
ock
Op
tio
n S
chem
e an
d E
mp
loye
e St
ock
Pu
rch
ase
Sch
eme)
Gu
idel
ines
, 19
99

11
An
nex
ure
I t
o t
he
Dir
ecto
rs’
Rep
ort
fo
r th
e ye
ar e
nd
ed 3
1st
Mar
ch 2
00
8 i
n t
erm
s o
f cl
ause
12
.1 o
f th
e S
ecu
riti
es a
nd
Exc
han
ge
Bo
ard
of
Ind
ia(E
mp
loye
e St
ock
Op
tio
n S
chem
e an
d E
mp
loye
e St
ock
Pu
rch
ase
Sch
eme)
Gu
idel
ines
, 19
99
(C
on
td.)
k)D
ilu
ted
E
arn
ing
s P
er
Sh
are
(E
PS
)p
urs
uan
t to
iss
ue
of
shar
es o
n e
xerc
ise
of
op
tio
n c
alcu
late
d in
acc
ord
ance
wit
hA
cco
un
tin
g S
tan
dar
d (
AS)
20
‘Ear
nin
gs
Per
Shar
e’
l)W
her
e th
e co
mp
any
has
cal
cula
ted
th
eem
plo
yee
com
pen
sati
on
co
st u
sin
g t
he
intr
insi
c va
lue
of
the
sto
ck o
pti
on
s, t
he
dif
fere
nce
b
etw
ee
n
the
e
mp
loye
eco
mp
ensa
tio
n c
ost
so
co
mp
ute
d a
nd
the
emp
loye
e co
mp
ensa
tio
n c
ost
th
atsh
all h
ave
bee
n re
cog
niz
ed if
it h
ad u
sed
the
fair
val
ue
of
the
op
tio
ns,
sh
all
be
dis
clo
sed
. Th
e im
pac
t o
f th
is d
iffer
ence
on
pro
fits
and
on
EPS
of
the
com
pan
ysh
all
also
be
dis
clo
sed
m)
Wei
gh
ted
-ave
rag
e ex
erci
se p
rice
s an
dw
eig
hte
d-a
vera
ge
fair
val
ues
of
op
tio
ns
shal
l be
dis
clo
sed
sep
arat
ely
for
op
tio
ns
wh
ose
exe
rcis
e p
rice
eit
her
eq
ual
s o
rex
ceed
s o
r is
less
th
an t
he
mar
ket
pri
ceo
f th
e st
ock
n)
A
de
scri
pti
on
o
f th
e
me
tho
d
and
sig
nifi
can
t as
sum
pti
on
s u
sed
du
rin
g t
he
year
to
est
imat
e t
he
fai
r va
lue
s o
fo
pti
on
s,
incl
ud
ing
th
e
foll
ow
ing
wei
gh
ted
-ave
rag
e in
form
atio
n:
i.ri
sk-f
ree
inte
rest
rat
e
ii.ex
pec
ted
life
iii.
exp
ecte
d v
ola
tilit
y
iv.
exp
ecte
d d
ivid
end
s an
d
v.th
e p
rice
of
the
un
der
lyin
g s
har
e in
mar
ket
at t
he
tim
e o
f o
pti
on
gra
nt.
ESO
P 2
00
0
Rs.
26.
17
The
Co
mp
any
use
s th
e in
trin
sic
valu
e-b
ased
met
ho
d o
f ac
cou
nti
ng
fo
r st
ock
op
tio
ns
gra
nte
d
afte
r 1
st
Ap
ril
20
05
. H
ad
the
com
pen
sati
on
co
st fo
r th
e C
om
pan
y’s
sto
ckb
ased
co
mp
ensa
tio
n p
lan
bee
n d
eter
min
edin
th
e m
ann
er c
on
sist
ent
wit
h t
he
fair
val
ue
app
roac
h, t
he
Co
mp
any’
s n
et in
com
e w
ou
ldb
e lo
wer
by
Rs
32.4
8 M
illio
n a
nd
ear
nin
gs
per
sh
are
(Bas
ic)
as r
epo
rted
wo
uld
hav
eb
een
Rs
27.9
4
No
op
tio
ns
wer
e g
ran
ted
du
rin
g t
he
year
.
NA
ESO
P 2
00
4
Rs.
26.
17
The
Co
mp
any
use
s th
e in
trin
sic
valu
e-b
ased
met
ho
d o
f ac
cou
nti
ng
fo
r st
ock
op
tio
ns
gra
nte
d
afte
r 1
st
Ap
ril
20
05
. H
ad
the
com
pen
sati
on
co
st fo
r th
e C
om
pan
y’s
sto
ckb
ased
co
mp
ensa
tio
n p
lan
bee
n d
eter
min
edin
th
e m
ann
er c
on
sist
ent
wit
h t
he
fair
val
ue
app
roac
h, t
he
Co
mp
any’
s n
et in
com
e w
ou
ldb
e lo
wer
by
Rs
32.4
8 M
illio
n a
nd
ear
nin
gs
per
sh
are
(Bas
ic)
as r
epo
rted
wo
uld
hav
eb
een
Rs
27.9
4
No
op
tio
ns
wer
e g
ran
ted
du
rin
g t
he
year
.
NA
ESO
P 2
00
6
Rs.
26.
17
The
Co
mp
any
use
s th
e in
trin
sic
valu
e-b
ased
met
ho
d o
f ac
cou
nti
ng
fo
r st
ock
op
tio
ns
gra
nte
d
afte
r 1
st
Ap
ril
20
05
. H
ad
the
com
pen
sati
on
co
st fo
r th
e C
om
pan
y’s
sto
ckb
ased
co
mp
ensa
tio
n p
lan
bee
n d
eter
min
edin
th
e m
ann
er c
on
sist
ent
wit
h t
he
fair
val
ue
app
roac
h, t
he
Co
mp
any’
s n
et in
com
e w
ou
ldb
e lo
wer
by
Rs
32.4
8 M
illio
n a
nd
ear
nin
gs
per
sh
are
(Bas
ic)
as r
epo
rted
wo
uld
hav
eb
een
Rs
27.9
4
9th
May
22
nd J
anu
ary
Gra
nt
Dat
e2
00
72
00
8
Exer
cise
pri
ce (
Rs.
)1,
559.
0082
6
Fair
Val
ue
(Rs.
)60
6.78
190.
61
9th
May
22
nd J
anu
ary
Gra
nt
Dat
e2
00
72
00
8
8.07
%7.
52%
4 ye
ars
4 ye
ars
58.3
1%52
.25%
5.52
%7.
68%
1,54
4.25
706.
25
Every time we buy a product, or a service, it is best when our expectations are met or
exceeded. Large and complex “virtual” teams that pan across different countries,
cultures and time zones make this possible for our clients.
ConnectNow enables diverse and dispersed teams to focus on a single objective –
ensuring that our end customers receive the products and services that were committed
to them: right first time, every time. ConnectNow empowers our teams to define and
deliver end-to-end outcomes thereby enhancing customer experience.
Right First Time
7
C km y

13
MANAGEMENT DISCUSSION AND ANALYSIS
Industry structure, developments and Outlook
Overview
Tech Mahindra Limited is a leading provider of IT servicesand solutions to the global telecommunications industry.In fiscal 2007, it was ranked by NASSCOM as the sixthlargest Indian IT services company in terms of exportrevenue. It was formed in 1986 as a joint venture betweenMahindra and Mahindra Limited, one of the India’s leadingmanufacturers of tractors and utility vehicles and BritishTelecommunications plc, one of the world’s leadingtelecommunications company.
Global Telecom Market
Tech Mahindra’s coverage spans the entire telecomecosystem comprising Telecom Service Providers (TSP),Telecom Equipment Manufacturers (TEM) and IndependentSoftware Vendors (ISV).
The size of the global telecom services market grew by anestimated 8.9% in 2007, reaching US$ 1.4 trillion. Anindependent research agency forecasts that the globaltelecom market will show a compound annual growth rate(CAGR) of 4.5% between 2008 and 2011, reachingUS$ 1.7 trillion. The mobile services sector continues toenjoy brisk growth and since 2006, it has become largerthan the fixed line services sector. It is estimated that therevenue from mobile services will top US$1 trillion by 2011.
The key feature in the service provider industry is theincreased competition due to the emergence of largernumber of players. Convergence of traditionally distinctchannels like cable, internet service providers and telecomservice providers has presented new challenges to thetelecom service providers. New technology adoption hasenabled bundling of voice, video, data and mobility servicescausing disruption of historical boundaries between theplayers in each of these markets.
IT spend in the Communications Industry
The communications industry is a significant contributorto the global spend on information technology services.According to an independent research agency, theworldwide IT spending by the communications vertical willreach US$ 315 billion in 2011 from US$ 275 billion in 2007.Out of this, IT services are expected to account for US$101 billion in 2011 from US$ 82 billion in 2007.
Due to increased competition in the segment, there arehuge challenges for the traditional TSPs to maintain theirrevenue growth and profitability. The commoditization ofvoice as a service has resulted in voice becoming cheaperand declining voice revenue per subscriber. Newer valueadded services are being offered to attract new and retainexisting customers.
To facilitate efficient launch of new services TSPs arelooking to transform their systems and processes, reducetheir operating expense, achieve greater efficiencies andfaster time to market. This trend of telco transformation isexpected to drive increased information technologyspending by the service providers.
In response to the growing competitive pressures on thetraditional voice revenue stream, more and more TSPs arelooking at the enterprise segment as a growth area. TSPsare offering managed network services which helpcorporations realize the benefits of scale and optimization.This is one of the fastest growing segments for TSPs aroundthe globe.
Opportunities
Rapid Adoption of Outsourcing
With mounting margin pressures and greater need forfaster delivery of technology solutions, TSPs across theglobe are adopting outsourcing at an increased pace.Outsourcing vendors, with their global delivery models,have demonstrated the ability to add value by offeringquality solutions at a competitive price. Traditional industrychallenges like data security and quality control have beenovercome through adoption of international standards forthe same. Because of these factors outsourcing todayseems to be a viable option to most of the TSPs. WhileTech Mahindra continues to increase its presence in TSPsfavorable towards outsourcing, it is also expanding itsfootprint by targeting newer geographies and newer TSPs,which are yet to adopt outsourcing.
Dynamic Technology Landscape
The changing customer needs are driving the change intechnology landscape. Providing innovative services tocustomers at a rapid pace, in a cost effective manner, isone of the biggest challenges faced by TSPs. TSPs todayembark on transformation journeys to fulfill the objectivesof faster time to market and cost effectiveness. TechMahindra with its focus on the telecom vertical has beeninvesting in new technologies to position itself to takeadvantage of the changing landscape.
Emergence of New Players
Countries across the world are witnessing an increasingnumber of players in the TSP market. By enabling afavorable environment, governments are encouraging newroll outs in the TSP space. Due to the surge in competition,TSPs increasingly focus on cost efficiencies and productdifferentiation. Vendors with an ability to provide end-to-end solution to new entrants, benefit from this increasedpotential client base.

14
A N N U A L R E P O R T 2 0 0 7
Tech Mahindra has successfully assisted new roll-outsacross the world. With its comprehensive services portfolio,Tech Mahindra has the ability to service end-to-end needsof emerging telecom players.
Threats
Emerging low cost destinations such as China,Philippines and Indonesia
India remains the preferred offshore destination for ITServices for its cost effective solutions and huge talentpool. However several countries like China, Malaysia, Chile,Philippines, Singapore, Thailand and the Czech Republicare emerging as offshoring destinations due to their abilityto provide low cost solutions as well.
Global IT service providers emerging as competitorsthrough a growing Indian presence
Global IT service providers, most of them are fortune500 companies, such as Accenture, EDS, CapGemini andIBM are expanding their presence in India and pose achallenge to home grown IT service companies with theirglobal client relationships, deep pockets and domainknowledge.
Availability of skilled/trained manpower
A few other factors have diluted the Indian advantage –namely the expansion of global IT service and consultingcompanies in India. This has created significant pricingpressures and also created a strain on availability of skilledresources. While India has a large pool of trained and skilledresources, the demand has outpaced the supply leadingto salary hikes and increased attrition. There is increasedcompetition due to higher costs, skilled resources andwage inflation pressures.
Risks
Economic slowdown
The primary business of Tech Mahindra is the provision ofIT services to the global telecommunications industry.Future revenue and profitability are dependent on growthin spending on IT services by companies in thetelecommunications industry. This growth may not besustained in future periods. IT spending bytelecommunication companies will be impacted by therate at which they increase their capital expenditures andoperating expenditures to respond to growth in voice anddata traffic and the commercial development of newservices. If the clients’ businesses do not grow in themarkets in which they operate, in particular the UnitedKingdom and the United States, our clients may reducetheir spending on the services and solutions we provide,which would have a material adverse effect on the businessand prospects of the company.
High customer concentration
In fiscal 2008, our top five clients and top ten clientsaccounted for 83% and 89% of the revenue, respectively.As service providers increase in size and furtherconsolidation takes place in the industry, it is possible thatan even greater percentage of our revenue will beattributable to a smaller number of large service providersand the loss of any such client could have a materialadverse effect on our revenue and profitability.
Ability to attract and retain talent
Our ability to develop new applications and attract newclients depends significantly on our ability to attract, train,motivate and retain highly qualified IT professionals. Weface significant competition in hiring IT professionals, bothin our university recruitment programs and in our lateralhiring. If we are unable to recruit talent or if our attritionrates increase, our ability to meet our client needs andwin new clients will be constrained, we could lose marketshare and our business could be adversely affected.
Withdrawal of Tax benefits
Currently, we benefit from certain tax incentives underSection 10A of the Income Tax Act for the IT services thatwe provide from specially designated “Software TechnologyParks” or STPs. As a result of these incentives, our operationsin India have been subject to relatively low tax liabilities.Under current laws, the tax incentives available to theseunits terminate on the earlier of the ten year anniversaryof the commencement of operations of the unit or 31st
March 2010. To counter this, we plan to set up facilities inSEZ units at various locations as the units set up in SEZarea would also provide us with tax benefits similar tothose in STPI. We have commenced operations at ChennaiSEZ and more units are coming up at Chandigarh,Hinjewadi (Pune), Hyderabad, Jaipur and Bantala (Kolkata).There is no assurance that the Indian government will notenact laws in the future that would adversely impact ourtax incentives and consequently, our tax liabilities andprofits. When our tax incentives expire or are terminated,our tax expense will materially increase, reducing ourprofitability.
Currency Exchange Risks
The exchange rate between the Indian rupee and theBritish pound and the rupee and the U.S. dollar haschanged substantially in last year and may continue tofluctuate significantly in the future. During fiscal 2008, thevalue of the rupee against the British pound appreciatedby approx 4.9% and the value of the rupee against theU.S. dollar appreciated by approx 10.8%.
Accordingly, our operating results have been and willcontinue to be impacted by fluctuations in the exchangerate between the Indian rupee and the British pound and

15
the Indian rupee and the U.S. dollar, as well as exchangerates with other foreign currencies. Any strengthening ofthe Indian rupee against the British pound, the U.S. dollaror other foreign currencies could adversely affect ourprofitability.
Discussion on Financial Performance withrespect to Operational PerformanceOverview
The financial statements have been prepared incompliance with the requirements of the Companies Act,1956 and Generally Accepted Accounting Principles (GAAP)in India.
The Consolidated financial statements have been preparedin compliance with the Accounting Standard AS 21, AS 23and AS 27 issued by The Institute of Chartered Accountantsof India (ICAI).
The discussions on financial performance in theManagement Discussion and Analysis relate primarily tothe stand alone accounts of Tech Mahindra Limited.Wherever it is appropriate, information pertaining toconsolidated accounts for Tech Mahindra Limited isprovided. For purposes of comparison with other firms inthis industry as well as to see the positioning and impactthat Tech Mahindra Limited has in the marketplace, it isessential to take the figures as reflected in the ConsolidatedFinancial Statements.
A. FINANCIAL POSITION
1. Share Capital
The authorized share capital of the company isRs. 1,750 Million, divided into 175 Million equity sharesof Rs. 10/- each. The paid up share capital stands atRs. 1,214 Million as on 31st March 2008 compared to
Rs. 1,212 Million on 31st March 2007. The increase inpaid up capital during the year is due to conversionof options into shares by employees under EmployeeStock Option Plan.
2. Reserves and surplus
a) Share premium account
The addition to the share premium account ofRs. 10 Million during the year is due to thepremium received on issue of 146,168 equityshares on exercise of option under stock optionplans.
b) General reserve
General reserve stands at Rs. 2714 Million on31st March 2008 compared to Rs. 1,014 Millionon 31st March 2007. Rs. 1,700 Million has beentransferred to general reserve from profit and lossaccount during the year.
c) Profit and loss account
The balance retained in the profit and lossaccount as of 31st March 2008 is Rs. 5,202 Millioncompared to Rs. 4,261 Million as of 31st March2007.
3. Loan Funds
Loan funds as at 31st March 2008 stand at Rs. 950 Millionof unsecured loans, compared to Rs. 490 Million in theprevious year comprising of Rs. 390 Million of unsecuredloans and Rs. 100 Million of secured loans.
4. Fixed Assets
The movement in Fixed Assets is shown in the tablebelow-
Rs. in Million
As of 31st March 2008 2007Gross Book ValueLand - free-hold 82 82
- lease-hold 325 221Buildings 1,411 1,411Leasehold Improvements 279 84Plant and machinery 999 739Computer equipments 1,656 1,245Furniture and fixtures 667 546Vehicles
- Leased 50 67- Owned 36 33
Intangible assets — —Total 5,505 4,428Less: Accumulated depreciation & amortization 2,596 1,957Net block 2,909 2,471Add: Capital work-in-progress 1,385 546Net fixed assets 4,294 3,017

16
A N N U A L R E P O R T 2 0 0 7
5. Investments
The summary of company’s investments is given below Rs. in Million
Investments As at As at31st March 2008 31st March 2007
Investment in Subsidiaries 3,340 2,471
Investment in Mutual Funds — 727
Total Investments 3,340 3,198
Less : Provision for diminution of value 354 366
Net Investments 2,986 2,832
I . Investment in Subsidiaries
The company had investment in the followingsubsidiaries
a) Tech Mahindra R&D Services Limited
Tech Mahindra R&D Services Limited (formerlyknown as Axes Technologies) was acquired inNovember 2005. TMR&D provides technologysolutions to leading Telecom EquipmentManufacturers (TEM) in the areas of Research &Development (R&D), Product Engineering andLife Cycle Support. This acquisition has helpedTech Mahindra to strengthen its capabilities inthe TEM (Telecom Equipment Manufacturer)segment. The board of the company (TML) hasapproved scheme of amalgamation foramalgamating TMR&D with itself, in its meetingdated 19th October 2007. As per the scheme, allthe assets and liabilities of TMR&D would becomethe assets and liabilities of TML from theappointed date i.e. 1st April 2008. Thejurisdictional High Courts of Mumbai andKarnataka have approved the schemes on28th March 2008 and 3rd April 2008 respectively.The merger would result in operational synergies,enhance financial strength and rationalization ofcosts.
b) CanvasM Technologies Limited
CanvasM was set up as a joint venture betweenTech Mahindra Limited and Motorola CyprusHolding Limited in October 2006 with anobjective to provide software services andsolutions to wire line and wireless telecom serviceproviders, cable companies, enterprise, media and
broadcast companies, using SI expertise of TechMahindra and R&D investments of MotorolaCyprus. Tech Mahindra owns 80.1% of theshareholding while the balance 19.9% is held byMotorola Cyprus.
c) Tech Mahindra (Americas) Inc.
Tech Mahindra (Americas) inc. was incorporatedin November 1993 to provide marketing supportservices for the USA and Canada region. It actsas a service provider for sales, marketing, onsitesoftware development and other related services.
d) Tech Mahindra GmbH
Tech Mahindra GmbH was established in July2001 to provide marketing support in centralEurope region.
e) Tech Mahindra (Singapore) Pte. Limited
Tech Mahindra (Singapore) Pte. Limited is TechMahindra’s representative in Singapore and actsas a service provider for sales, marketing, onsitesoftware development and other related services.
f) Tech Mahindra (Thailand) Limited
Tech Mahindra ( Thailand) Limited wasestablished in August 2005 to strengthen itsmarketing infrastructure in Thailand.
g) PT Tech Mahindra Indonesia
PT Tech Mahindra Indonesia is Tech Mahindra’srepresentative in Indonesia and acts as a serviceprovider for sales, marketing, onsite softwaredevelopment and other related services.
The Net Block of Fixed Assets and Capital Work in Progressincreased to Rs. 4,294 Million from Rs. 3,017 Million as at31st March 2007. During the year, company incurred capitalexpenditure of Rs. 1,928 Million (previous year Rs. 1,700
Million). The major items of Capital Expenditure includedLeasehold –land and improvements, Plant and Machinery,Computer equipment and Furniture & Fixtures besidesamount spent on civil works for Hinjewadi, Pune campus.

17
h) iPolicy Networks Limited
Tech Mahindra acquired Noida based iPolicyNetworks Limited (iPolicy) in January 2007 tocomplement Tech Mahindra’s strong securityservices capabilities. The board of the company(TML) approved Scheme of amalgamation foramalgamating iPolicy with itself, in its meetingdated 19th October 2007. As per the scheme, allthe assets and liabilities of iPolicy became theassets and liabilities of TML from 1st April 2008.The jurisdictional High Courts of Mumbai andDelhi have approved the schemes on28th March 2008 and 4th April 2008 respectively.The merger would result in operational synergies,enhance financial strength and rationalization ofcosts.
i) Tech Mahindra Foundation
Tech Mahidndra Foundation was promoted byTech Mahindra Limited as section 25 companywith the objective of promoting social andcharitable activities. TechM Foundationprimarily concentrate on rendering assistanceto the needy and under privileged people inthe society.
j) Tech Mahindra (Beijing) IT Services Limited
Tech Mahindra (Beijing) IT Services Limited wasestablished in December 2007 to strengthen itsmarketing capabilities in China.
k) Tech Mahindra (Malaysia) Sdn. Bhd.
Tech Mahindra (Malaysia) Sdn. Bhd. wasestablished in May 2007 as Tech Mahindra’srepresentative in Malaysia. It acts as a serviceprovider for sales, marketing, onsite softwaredevelopment and other related services.
II. Investment in liquid mutual funds
The company has been investing in various mutualfunds. These are typically investments in short-termfunds to gainfully use the excess cash balance withthe company. The investments as at 31st March 2008were Rs. Nil compared to Rs. 727 Million as at31st March 2007.
6. Deferred Tax Asset
Deferred tax asset remained unchanged at Rs. 14Million as of 31st March 2008. Deferred tax assetrepresent timing differences in the financial and taxbooks arising from depreciation of assets, provisionof debtors and leave encashment. company assessesthe likelihood that the deferred tax asset will berecovered from future taxable income.
7. Sundry Debtors
Sundry debtors increased to Rs.10, 574 Million (net ofprovision for doubtful debts amounting to Rs. 80Million) as of 31st March 2008 from Rs. 7,920 million(net of provision for doubtful debts amounting toRs. 219 million) as of 31st March 2007. The increase ismainly on account of increase in volume of business.Debtor days as of 31st March 2008, (calculated basedon per-day sales in the last quarter) were 98 days,compared to 84 days as of 31st March 2007. Wecontinue to focus on reducing receivables period byimproving our collection efforts.
8. Cash and Bank Balance
The bank balances in India include both Rupeeaccounts and foreign currency accounts. The bankbalances in overseas current accounts are maintainedto meet the expenditure of the overseas branches andoverseas project-related expenditure.
Rs. in Million
As of 31st March 2008 2007
Bank balances in India & Overseas
Current accounts 799 90
Deposit accounts 14 161
Unclaimed dividend account 1 1
Total cash and bank balances* 814 252
* excluding unrealised (gain)/loss on foreign currency
9. Loans and Advances
Loans and advances as on 31st March 2008 wereRs. 3,477 Million (Rs. 1,596 Million as on 31st March2007). Significant items of loans and advances includepayments towards other deposits and foreign exchangegains.
10. Current Liabilities and Provisions
Current liabilities and provisions were Rs. 8,925 Million asof 31st March 2008 compared to Rs. 6,360 Million as of31st March 2007. Liabilities and provisions increased mainlybecause of higher employee-related liabilities followingincrease in headcount.

18
A N N U A L R E P O R T 2 0 0 7
B. RESULTS OF OPERATIONS
The following table sets forth certain income statement items as well as these items as a percentage of our totalincome for the periods indicated:
Fiscal 2008 Fiscal 2007
% %Rs. in Million of Revenue Rs. in Million of Revenue
INCOME
Revenue from Services 36,047 100.0% 27,577 100.0%
Other Income 976 9
Total Income 37,023 27,586
EXPENDITURE
Personnel 12,224 33.9% 8,445 30.6%
Operating and Other Expenses 15,616 43.3% 12,092 43.8%
Depreciation 736 2.1% 463 1.7%
Interest 100 0.3% 69 0.3%
Total Expenditure 28,676 79.6% 21,069 76.4%
Profit before tax and exceptional items 8,347 23.2% 6,517 23.6%
Provision for Taxation (689) 1.9% (615) 2.2%
Profit after taxation and before exceptional item 7,658 21.3% 5,902 21.4%
Exceptional items (4,401) 12.3% (5,250) 19.0%
Net profit for the year 3,257 9.0% 652 2.4%
Provision in respect of earlier year written back 165 0.5% — —
Excess provision for income-tax in respect of earlierperiod written back — — 339 1.2%
Profit available for appropriations 3,422 9.5% 991 3.6%
1. Revenue
The company derives revenue principally fromtechnology services provided to clients in thetelecommunications industry.
The revenue increased by 30.7% to Rs. 36,047 Millionin fiscal 2008 from Rs. 27,577 Million in fiscal 2007.This reflected an increase in the number of clientsserved during the respective years as well as anincrease in the amount of business from these clients.Revenue from Europe as a percentage of total revenuewere 76.9% in fiscal 2008 compared to 77.1% in fiscal2007. Revenue from the United States increased to17.3% in fiscal 2008 from 15.0% in fiscal 2007 while
the share of revenue attributable to the Rest of theWorld segment was 5.8% in fiscal 2008 compared to7.9% in the previous year.
Consolidated Revenue
Consolidated Revenue for the fiscal 2008 stood atRs. 37,661 Million compared to Rs. 29,290 Million lastfiscal, a growth of 28.6%. Consolidated revenue grewat a CAGR of 58.5% over the last 3 years.
Consolidated revenue by Geography
Europe contributed 73.6% of the consolidatedrevenue in fiscal 2008 while Americas and Rest of theWorld contributed 19.4% and 7.0% respectively. The

19
revenue share from Europe, Americas and Rest of theWorld in fiscal 2007 was 72.5%, 18.4% and 9.1%respectively.
Consolidated Revenue by Segment
For fiscal 2008, 89.2% of revenue came from TSPsegment, 5.1% from TEM, 3.5% came from BPOsegment while 2.2% from others. The revenue sharein fiscal 2007 from TSP, TEM, BPO and Others segmentwas 91.3%, 6.3%, 0.2% and 2.2% respectively.
2. Other Income
Other income includes interest income, dividendincome, profit on sale of current investments,
foreign exchange gain/loss and sundry balanceswritten back.
Interest income mainly consists of interest receivedon bank deposits. Dividend income includes dividendreceived on long term investments as well as thatreceived on current investments. Exchange gain/lossconsists of mainly realized or revaluation gain or losson foreign currency transactions.
Other income is higher at Rs. 976 Million in fiscal 2008compared to Rs. 9 Million in fiscal 2007. This wasprimarily due to high exchange gain of Rs. 765 Millionin this fiscal.
3. Expenditure
Particulars 2007-08 2006-07 % Inc./(Dec.)
Rs. in Million % of Revenue Rs. in Million % of Revenue
Personnel Cost 12,224 33.9% 8,445 30.6% 44.7%
Operating andOther Expenses 15,616 43.3% 12,092 43.8% 29.1%
Depreciation 736 2.1% 463 1.7% 59.0%
Interest 100 0.3% 69 0.3% 44.9%
Total Expenses 28,676 79.6% 21,069 76.4% 36.1%
Personnel cost includes salaries, wages and bonus,contribution to provident fund and other funds andstaff welfare costs. The increase in personnel cost inabsolute value is mainly due to increase in headcountand annual increments.
Operating and other expenses mainly includeSubcontracting costs, Travelling expenses,Communication expenses, Rent, Software Packagesand Repairs and Maintenance. The increase is due toincrease in business volumes, increase in number ofoffice locations in India and overseas and overallgrowth in business activity.
Increase in depreciation is mainly due to increase ininvestment in infrastructure and equipment to serviceour growing business.
The company incurred interest expense of Rs. 100million during the year on borrowings.
4. Profit before tax
Profit before tax increased by 28.1% to Rs. 8,347Million in fiscal 2008 from Rs. 6,517 Million in fiscal
2007. Profit before tax as a percentage of revenuewas 23.2% in fiscal 2008 compared to 23.6% in fiscal2007.
5. Income Taxes
The provision of current tax, deferred tax and fringebenefit tax for the year ended 31st March 2008 wasRs. 689 Million as compared to Rs. 615 Million in theprevious year, a growth of 12%. As a percentage ofrevenue, provision for taxes reduced to 1.9% in fiscal2008 from 2.2% in fiscal 2007. The effective tax rate inthese years was 8.3% and 9.4% respectively.
6. Profit after tax before exceptional items
Profit after tax before exceptional items increased by29.8% to Rs. 7,658 Million in fiscal 2008 from Rs. 5,902Million in fiscal 2007. Profit after tax as a percentageof revenue was 21.2% in fiscal 2008 and 21.4% in fiscal2007.
Consolidated PAT
Consolidated PAT before exceptional item andminority interest for the fiscal 2008 was Rs. 7,695

20
A N N U A L R E P O R T 2 0 0 7
Million compared to Rs. 6,127 Million last fiscal, agrowth of 25.6%. PAT as a percentage of revenue was20.4% in fiscal 2008 compared to 20.9% infiscal 2007.
7. Exceptional itemsDuring the year, the company entered in to anagreement with a customer under which it will haveexclusivity for 90 days in negotiating an engagement.As per the terms of the agreement the company hasmade an ‘exclusivity’ payment of Rs. 4,401 million tothe customer which is unconditional, irrevocable and
non refundable. Accordingly, this payment has beendisclosed as an exceptional item in the Profit and Lossaccount. The project will be executed with aconsortium partner who will bear part of theexclusivity payment. This payment from theconsortium partner will be accounted when it iscontractually firmed up.
C. CASH FLOW
The cash flow position for fiscal 2008 and fiscal 2007is summarized in the table below
Particulars Fiscal Year
2008 2007
Rs. in Million Rs. in Million
Net cash flow from operating activities* 2,097 32
Net cash flow from (used in) investing activities (1,983) (1,424)
Net cash flow from (used in) financing activities 356 1,191
Cash and cash equivalents at the beginning of the year 295 496
Cash and cash equivalents at the end of the year 765 295
* includes unrealized gain/(loss) on foreign currency
D. Internal Control Systems
The company maintains adequate internal controlsystem, which provides, among other things,reasonable assurance of recording the transactionsof its operations in all material aspects and ofproviding protection against significant misuse or lossof company’s assets. The company uses an EnterpriseResource Planning (ERP) package, which enhances theinternal control mechanism.
E. Material developments in human resourcesincluding number of people employed
During fiscal 2008, the company made substantialaddition to human resources. The company had a netaddition of 3,135 (previous year 9,256) employeesmainly through campus recruitment in addition tolateral hiring. The global headcount of the companyas on 31st March 2008 was 22,884, compared to 19,749as on 31st March 2007, a growth of 15.9%. Thecompany used various sources for attracting talentduring the year. It hired Engineering Graduates andScience Graduates for technical positions whereas
MBA’s were recruited from premier managementinstitutes such as IIM’s, ISB, XLRI, London BusinessSchool etc for the future leadership positions.
The attrition rate for the year 2008 and 2007 was29.6% and 20.7% respectively. The higher attrition inthe year 2008 was primarily due to high attrition inthe BPO business. The company has been workingtowards containing the attrition rate by continuouslyinvesting in learning and development programs forassociates, competitive compensation, creating acompelling work environment, empowering associatesat all levels as well as a well-structured reward andrecognition mechanism.
The company believes in promoting and nurturingwork environment which is conducive to thedevelopment and growth of an individual employee,by employing the best HR practices such asperformance management, reward and recognitionpolicy, leadership development program, successionplanning, open work culture and effective employeecommunication.

An enterprise wants success “faster”, a consumer wants his service “faster”, a creator
wants his product in the market “faster”. Corporations have to be nimble and agile to the
ever changing demands of consumers and businesses. ConnectNow provides the right
environment that fosters open communication within teams, reduces complexity and
promotes rapid problem resolution to achieve Reduced Cycle Time in our clients’
Business Processes.
Reduced cycle time
8
C km y

22
CORPORATE GOVERNANCE REPORT
I. COMPANY’S PHILOSOPHY ON CODE OF CORPORATE GOVERNANCE:
Your Company believes that Corporate Governance is a set of guidelines to help fulfill its responsibilities to all itsstakeholders. It is a voluntary code of self-discipline to ensure that the company abides by high ethical standards. Inline with this philosophy, your Company follows healthy Corporate Governance practices and reports the same tothe shareholders. Although the Company’s shares were listed on 28th August 2006, your Directors have been reportingthe initiatives on Corporate Governance adopted by your Company for last 7 years.
II. BOARD OF DIRECTORS:
Your Company has a balanced mix of executive, non-executive and independent directors on the Board. The totalstrength of Board of Directors is eleven. Mr. Clive Goodwin, Director of the Company has appointed Mr. Paul Ringhamas his alternate. Your Company has a Non-executive Chairman and the number of Independent Directors is fourwhich is more than 1/3rd of the total number of Directors. The number of Non-Executive Directors is ten which ismore than 50% of the total number of Directors. During the year under review, the composition of the Board was inconformity with Clause 49 of the Listing Agreement.
The Company is managed by the Vice Chairman, Managing Director & CEO and the Management Team. The Boardreviews and approves strategy and oversees the performance to ensure that the long term objectives of enhancingstakeholder value are met.
The Independent Directors and the Senior Management have made disclosures to the Board confirming that thereare no material financial and/or commercial transactions between them and the Company which could have potentialconflict of interest with the Company at large.
The Board meets at least four times a year and the maximum gap between two meetings is not more than fourmonths. During the year 2007-08, 4 meetings of the Board of Directors were held on 7th May 2007, 19th July 2007,19th October 2007 and 22nd January 2008.
Agenda papers containing all necessary information / documents, are made available to the Board in advance toenable the Board to discharge its responsibilities effectively and take informed decisions. In some instances, documentsare tabled at the meetings and the concerned manager also makes presentations to the Board or Committees.
The names and categories of the Directors on the Board, their attendance at the Board and the Annual GeneralMeeting held during the year and the number of Directorships and Committee Chairmanships / Memberships heldby them in other companies as on 31st March 2008 is given below:
Sr. Name Category No. of Board Attendance at the Directorship in No. of Committee positionsNo. Meetings AGM held on other held in other
attended (Held = 4) 20th July 2007 Companies (*) public companies (**)
As Chairman As Member
1 Mr. Anand G. Mahindra Non-Executive Chairman 3 Yes 12 Nil 1
2 Mr. Vineet Nayyar Vice Chairman, 4 Yes 7 Nil NilManaging Director & CEO
3 Hon. Akash Paul Non-Executive, Independent 3 Yes Nil Nil Nil
4 Mr. Al-Noor Ramji Non-Executive 2 Yes Nil Nil Nil
5 Mr. Anupam Puri Non-Executive, Independent 4 Yes 3 Nil Nil
6 Mr. Arun Seth Non-Executive 2 Yes 2 Nil Nil
7 Mr. Bharat N. Doshi Non-Executive 3 Yes 10 2 2
8 Mr. Clive Goodwin Non-Executive 3 Yes Nil Nil Nil
9 Mr. Paul Zuckerman Non-Executive, Independent 3 No 2 Nil Nil
10 Dr. Raj Reddy Non-Executive, Independent 4 Yes 1 Nil Nil
11 Mr. Ulhas N. Yargop Non-Executive 3 Yes 7 2 Nil
Mr. Paul Ringham Alternate to Mr. Clive Goodwin Nil No Nil Nil Nil
(*) This does not include private companies, foreign companies and companies under Section 25 of the CompaniesAct, 1956
(**) Committees include Audit Committee and Investor Grievances Committee.

23
Necessary information as required by Annexure 1A to Clause 49 of the Listing agreement is placed before the Board.
Directors seeking re-appointment : Mr. Bharat N. Doshi, Hon. Akash Paul and Mr. Arun Seth retire by rotation andbeing eligible, have offered themselves for re-appointment. As required by clause 49 (G)(i) of the Listing Agreement,details of Directors seeking re-appointment are setout at the end of this Report.
Code of Conduct
All the Directors and senior management personnel have affirmed compliance with the Code of Conduct/Ethics asapproved and adopted by the Board of Directors and a declaration to that effect signed by the Managing Directorand CEO is attached and forms part of this report.
Insider Trading Policy
In compliance with the provisions of SEBI (Prohibition of Insider Trading) Regulations, 1992, (as amended from timeto time) and to preserve the confidentiality and prevent misuse of unpublished price sensitive information, theCompany has adopted an Insider Trading Policy for Directors and specified employees of the Company, relating todealing in the shares of the Company.
This policy also provides for periodical disclosures from employees as well as pre-clearance of transactions by suchpersons.
III. COMMITTEES OF THE BOARD:
In compliance with the Listing Agreements (both mandatory and non-mandatory) and the SEBI Regulations, theBoard has constituted a set of committees with specific terms of reference and scope to deal with specified mattersexpediently. The details of the committees constituted by the Board are given below:
A. AUDIT SUB-COMMITTEE:
The Audit Sub-Committee of the Board of Directors has been constituted in line with the provisions of Section 292Aof the Companies Act, 1956, read with Clause 49 of the Listing Agreement. The Committee meets at least four timesa year and the maximum gap between two meetings is not more than four months.
1. The composition of the Audit Sub-Committee and particulars of meetings attended by the members is asbelow:
Four meetings of the Audit sub-committee were held during the Financial Year 2007-08. The meetings were held on6th May 2007, 19th July 2007, 18th October 2007 and 22nd January 2008.
The details of the number of Audit Sub-Committee meetings attended by its members are given below:
Name of Director Category Number of Audit sub-committeemeetings attended (Held = 4)
Mr. Anupam Puri, Chairman Non-Executive, Independent 4
Mr. Clive Goodwin Non-Executive 4*
Dr. Raj Reddy Non-Executive, Independent 4
Mr. Paul Zuckerman Non-Executive, Independent 3
* participated in one meeting through teleconference
The necessary quorum was present at all the meetings.
2. Recommendations of the committee:
All the recommendations of the Audit Sub-committee were accepted by the Board of Directors.
3. Brief terms of reference:
The terms of reference of this Committee are very wide. Besides having access to all the required information fromwithin the Company, the Committee can obtain external professional advice whenever required. The Committee actsas a link between the Statutory and the Internal Auditors and the Board of Directors of the Company. It is authorised

24
to select and establish accounting policies, review reports of the Statutory and the Internal Auditors and meet withthem to discuss their findings, suggestions and other related matters. The Committee is empowered to review theremuneration payable to the Statutory Auditors and to recommend a change in Auditors, if felt necessary. It is alsoempowered to review Financial Statements and investments of unlisted subsidiary companies, ManagementDiscussion & Analysis and material individual transactions with related parties not in normal course of business orwhich are not on an arm’s length basis. Generally all items listed in Clause 49 II (D) of the Listing Agreement arecovered in the terms of reference. The Audit Sub-Committee has been granted powers as prescribed under Clause49 II (C).
The Meetings of the Audit Committee are, generally, also attended by the Vice Chairman, Managing Director & CEO,President – International Affairs, President – Strategic Initiatives, Chief Financial Officer (CFO), the Statutory Auditorsand the Internal Auditor.
The Chairman of the Committee, Mr. Anupam Puri was present at the Annual General Meeting of the Company heldon 20th July 2007.
The Assistant Company Secretary is the Secretary to the Committee.
Necessary information as required by Clause 49 II (E) of the Listing Agreement is reviewed by the Audit Sub-Committee.
B. COMPENSATION (REMUNERATION) COMMITTEE:
1. The composition of the Compensation Committee and particulars of meetings attended by the members is asbelow :
Three meetings of the Compensation Committee were held during the Financial Year 2007-08. The meetings wereheld on 19th July 2007, 2nd November 2007 and 22nd January 2008.
The details of the number of Compensation Committee meetings attended by its members are given below:
Name of Director Category Number of Compensation
Committee meetings attended (Held = 3)
Hon. Akash Paul, Chairman Non-Executive, Independent 2
Mr. Arun Seth Non-Executive 3
Mr. Ulhas N. Yargop Non-Executive 3
The necessary quorum was present at all the meetings.
2. Brief terms of reference:
The Compensation committee was constituted for the purpose of determining the terms and conditions includingthe remuneration payable to Managing Director of the Company as well as the Employee Stock Option Plans (ESOPs)of the Company.
3. Remuneration Policy:
While deciding on the remuneration for Directors, the Board and Compensation Committee (Committee) considersthe performance of the Company, the current trends in the industry, the qualification of the appointee(s), theirexperience, past performance and other relevant factors. The Board / Committee regularly keeps track of the markettrends in terms of compensation levels and practices in relevant industries through participation in structuredsurveys. This information is used to review the Company’s remuneration policies.
4. Compensation of Directors:
i. Remuneration to Non-Executive Directors:
Our Non-Executive Directors are entitled to sitting fees and/ or commission and actual expenses for attendingthe Board/ Committee meetings. Presently, we do not pay sitting fees to our Directors. The eligible Non-Executive

25
Directors are paid commission upto a maximum of 1% of the net profits of the Company, as specifically computedfor this purpose. A commission of Rs. 17.83 Million has been provided as payable to the eligible Non-ExecutiveDirectors in the accounts of the current year. The number of stock options granted till date to the Non-ExecutiveDirectors and the commission of Rs. 9.63 Million (provided in the accounts for the year ended 31st March 2007),paid to them during the year is as under:
Sr. Name of Non-Executive Commission for FY 2007, Stock options granted till dateNo. Director paid during the current year
1. Mr. Anand G. Mahindra N. A. N. A.
2. Hon. Akash Paul 2,471,090 30,000
3. Mr. Al-Noor Ramji Nil 20,000
4. Mr. Anupam Puri 2,385,880 25,000
5. Mr. Arun Seth Nil 25,000*
6. Mr. Bharat N. Doshi N. A. 20,000
7. Mr. Clive Goodwin Nil 25,000
8. Mr. Paul Zuckerman 2,300,670 20,000
9. Dr. Raj Reddy 2,471,090 30,000
10. Mr. Ulhas N. Yargop Nil 35,000
Total 9,628,730 230,000
All Directors except Mr. Paul Zuckerman have been granted stock options under ESOP 2000. Mr. Paul Zuckerman hasbeen granted stock options under ESOP 2006.All these options are granted prior to the listing of Company’s shares, based on the annual valuation by an independentchartered accountant. Under ESOP 2000, options vest over a period of three years in the ratio of 33%, 33% and 34%.Under ESOP 2006, options vest over five years in the ratio of 10%, 15%, 20%, 25% and 30%.* 5000 options lapsed pursuant to his resignation from the Board in his earlier appointment.
ii. Remuneration paid / payable to Managing Director for the year ended 31st March 2008:
Remuneration to Managing Director is fixed by the Compensation Committee and thereafter approved by theshareholders at a General Meeting.
Following is the remuneration paid / payable to the Managing Director during the year ended 31st March 2008:
Director Salary Company’s Benefits, Commission Total Contract No. of optionscontribution perquisites & Period (underto Provident allowances ESOP 2004)
Fund
Rs. in Million
Mr. Vineet Nayyar, 15.99 0.82 0.29 6.35 23.45 17th January 2005 3,406,620Vice Chairman, toManaging Director & CEO 16th January 2010
5. Details of Equity Shares of the Company held by the Directors as on 31st March 2008:
Sr. No. Name of Director No. of Shares held % to total paid-up Capital
1 Mr. Anand G. Mahindra 47,138 0.04
2 Mr. Vineet Nayyar 1,215,608 1.00
3 Hon. Akash Paul 7,685 0.01
4 Mr. Anupam Puri 11,670 0.01
5 Mr. Arun Seth 2,712 0.00
6 Mr. Bharat N. Doshi 15,501 0.01
7 Dr. Raj Reddy 10,000 0.01
8 Mr. Ulhas N. Yargop 25,010 0.02
Total 1,335,324 1.10
Except above, no other director holds any shares of the Company.

26
C. INVESTOR GRIEVANCES-CUM-SHARE TRANSFER COMMITTEE:
The Board of Directors constituted the Investor Grievances-cum-Share Transfer Committee of the Board in its meetingheld on 4th May 2006. Mr. Ulhas N. Yargop, a Non-Executive Director is the Chairman of the Committee. Mr. VineetNayyar and Mr. Clive Goodwin are the other members of the Committee. Mr. Vikrant C. Gandhe, Assistant CompanySecretary is the Compliance Officer. The Committee held its meetings over audio and reviewed the status of investorcomplaints during the year and passed circular resolutions on 15th June 2007, 25th October 2007, 13th December2007 and 15th February 2008 for transfer of shares / issue of duplicate share certificates etc.
Terms of reference : The Investor Grievances-cum-Share Transfer Committee looks into redressal of shareholder andinvestor complaints, issue of duplicate/ consolidated share certificates, allotment and listing of shares and review ofcases for refusal of transfer/ transmission of shares and debentures and reference to statutory and regulatoryauthorities.
The Company also has an Investor Relations Department focused on servicing the needs of the investors, analysts,brokers and the general public. The status of complaints received and resolved during the year is as under:
Opening balance of Number of Shareholders’ Number of Shareholders’ Number of Shareholders’the number of complaints/requests complaints/requests complaints/requestsShareholders’ received during disposed during pending as oncomplaints as on the year the year 31st March 20081st April 2007
Nil 552 552 Nil
Number of Complaints received during the year as a percentage of total number of members as on 31st March 2008is 0.34%.
D. EXECUTIVE COMMITTEE (a voluntary initiative of the Company) :
The Committee was formed to deal with urgent matters in the event circumstances arise requiring immediate actionof the Board of Directors before a meeting of the Board could be convened. The Committee also approves themaking of loans and investments in accordance with the guidelines prescribed by the Board.
Mr. Vineet Nayyar is the Chairman of the Committee. Mr. Ulhas N. Yargop and Mr. Clive Goodwin are the otherMembers of the Committee.
E. SHARE ALLOTMENT COMMITTEE (a voluntary initiative of the Company) :
The Committee was formed to enable exercise and allotment of shares under ESOP on a monthly basis instead ofapproving this quarterly in the Board Meetings. Mr. Vineet Nayyar is the Chairman of the Committee. Mr. Ulhas N.Yargop and Mr. Clive Goodwin are the other Members of the Committee.
IV. SUBSIDIARY COMPANIES:
Clause 49 defines a material non-listed Indian subsidiary as an unlisted subsidiary, incorporated in India,whose turnover or net worth (i.e. paid up capital and free reserves) exceeds 20% of the consolidated turnover or networth respectively, of the listed holding company and its subsidiaries in the immediately preceding accountingyear. Under this definition, the Company does not have any material non-listed Indian subsidiary during the yearunder review.

27
V. GENERAL BODY MEETINGS:
The details of the last three Annual General Meetings of the Company and the Special Resolutions passed thereatare as under:
Year Location of AGM Date Time Special Resolutions passed
2005 Oberoi Estate Gardens, 19th July 2005 2.30 p.m. 1. Authority to the Board to issue sharesChandivali, Andheri (E), under Employee Stock Option PlanMumbai 400 072 as required under Section 81(1A) of
the Companies Act,1956
2. Increase in Authorised Share Capitalfrom Rs. 250 Million to Rs. 300 Millionand consequential amendments tothe Memorandum and Articles ofAssociation of the Company.
2006 Mahindra Towers, Worli, 18th July 2006 2.30 p.m. N. A.Mumbai 400 018
2007 Birla Matushri Sabhagar, 20th July 2007 3.00 p.m. To amend Employee Stock Option Plans19, New Marine Lines, (ESOPs) to recover from the employees,Mumbai 400 020 Fringe Benefit Tax (FBT) in respect of any
grant, vesting or exercise of stock optionsunder the Schemes on or after 1st April2007
None of the Special Resolutions passed last year required Postal Ballot. No resolution is proposed to be passedthrough postal ballot.
VI. DISCLOSURES:
i) There have been no materially significant transactions, pecuniary transactions or relationships between theCompany and directors, management, subsidiary or related parties except those disclosed in the financialstatements for the year ended 31st March 2008.
ii) Details of non-compliance by the Company, penalties, strictures imposed on the Company by Stock Exchangesor SEBI or any statutory authority, on any matter related to capital markets, during the period from 28th August2006 (date of listing of the Company’s equity shares) to 31st March 2008 : Nil.
iii) No personnel has been denied access to the Audit Sub-Committee.
iv) The Company has complied with the mandatory requirements of Clause 49.
v) The Company has complied with the following non-mandatory requirements as prescribed in Annexure I D toClause 49 of the Listing Agreement with the Stock Exchanges :
(a) The Company has set up a Compensation Committee long before it got listed. Please see the para onCompensation Committee for details.
(b) The financial statements of the Company are unqualified.
VII. COMMUNICATION OF RESULTS:
� The Company has 159,978 Shareholders as on 31st March 2008. The main channel of communication to theshareholders is through the annual report which includes inter alia, the Directors’ report, the report on theCorporate Governance and the quarterly and annual audited financial results advertisements.
� The website of the Company www.techmahindra.com acts as the primary source of information regarding theoperations of the Company.
The quarterly, half-yearly and annual results of the Company are published in leading newspapers in Indiawhich include Business Standard, Economic Times and Maharashtra Times. The results are also displayed on theCompany’s website www.techmahindra.com. Official Press Releases made by the Company from time to timeare also displayed on the website. A Fact sheet providing a gist of the quarterly, half yearly and annual results ofthe Company is displayed on the Company’s website. The Company was regularly posting information relating

28
to its financial results and shareholding pattern on the SEBI EDIFAR website at www.sebiedifar.nic.in uptoquarter ended 30th September 2007 and thereafter on Corporate Filing and Dissemination system (CFDS) viz.www.corpfiling.co.in.
� A Management Discussion and Analysis forms part of this Annual Report.
VIII. GENERAL SHAREHOLDER INFORMATION:
1. Annual General Meeting:
Date Tuesday, 22nd July 2008
Time 3.00 P.M.
Venue Birla Matushri Sabhagar,19, New Marine Lines, Mumbai – 400 020
2. Financial year: The financial year is 1st April to 31st March.
Financial Calendar:
Tentative schedule (subject to change) Likely Board Meeting schedule
Financial reporting for the quarter ending 30th June 2008 Second fortnight of July 2008
Financial reporting for the quarter ending 30th September 2008 Second fortnight of October 2008
Financial reporting for the quarter ending 31stDecember 2008 Second fortnight of January 2009
Financial reporting for the quarter ending 31st March 2009 First fortnight of May 2009
Annual General Meeting for the year ending 31st March 2009 Second fortnight of July 2009
3. Book Closure / Record date for the purpose of dividend: 19th July 2008 to 22nd July 2008 (both days inclusive)for the purpose of Annual General Meeting and for payment of dividend.
4. Listing on Stock Exchanges: The Company’s equity shares are listed on The National Stock Exchange of IndiaLimited (NSE) and Bombay Stock Exchange Limited (BSE).
Listing Fee for 2008-09 has been paid in full for both the stock exchanges.
5. Stock Code:
National Stock Exchange of India Limited - TECHM
Bombay Stock Exchange Limited - 532755
6. Demat International Security Identification Number (ISIN) in NSDL and CDSL for equity shares:INE669C01028
7. Market Price Data : High, Low during each month in last financial year:
Month Equity SharesNSE BSE
High (Rs.) Low (Rs.) High (Rs.) Low (Rs.)
April 2007 1,609.95 1,329.00 1,616.00 1,331.00
May 2007 1,728.80 1,460.00 1,687.00 1,462.00
June 2007 1,562.00 1,391.00 1,562.70 1,390.00
July 2007 1,548.70 1,315.00 1,547.95 1,318.00
August 2007 1,350.00 1,027.70 1,320.10 1,177.00
September 2007 1,371.95 1,255.00 1,371.90 1,255.00
October 2007 1,550.00 1,201.05 1,550.00 1,201.00
November 2007 1,219.95 970.00 1,222.00 974.00
December 2007 1,240.00 921.00 1,248.00 1,023.00
January 2008 1,159.75 575.00 1,150.00 615.00
February 2008 814.00 652.70 814.00 661.00
March 2008 746.00 605.00 747.00 614.80

29
8. Performance in comparison to broad-based indices such as BSE Sensex, CRISIL index etc.:
The performance of the Company’s shares relative to the NSE (NIFTY) Index is given in the chart below:
9. Registrar and Transfer Agents:
Share transfer, dividend payment and all other investor related matters are attended to and processed by ourRegistrar and Transfer Agents :
Intime Spectrum Registry LimitedBlock No. 202, 2nd Floor,Akshay Complex,Near Ganesh Temple,Off Dhole Patil Road,Pune 411 001
Tel No. +91 20 2605 3503, 2605 1629, 6520 3395,Fax: +91 20 2605 3503Contact Person : Mr. Bhagavant SawantEmail address: [email protected]
10. Share Transfer System:
The Company’s shares are covered under the compulsory dematerialization list and are transferable throughthe depository system. Shares sent for transfer in physical form are registered and returned within a period ofthirty days from the date of receipt of the documents, provided the documents are valid and complete in allrespects.
Last trading day of the month
Tech
Mah
indr
a on
NSE
NSE
Inde
x
TECH M NSE
0
1500
3000
4500
6000
7500
0
400
800
1200
1600
2000
Mar 08Feb 08Jan 08Dec 07Nov 07Oct 07Sep 07Aug 07Jul 07Jun 07May 07Apr 07

30
11. Distribution of shareholding as on 31st March 2008:
No. of EquityShareholders Equity shares held
Shares held
No. of Shareholders % to Total No. of shares % to Total
001 - 250 155,999 97.51 4,571,351 3.77
251 - 500 2,022 1.26 748,447 0.62
501 - 1,000 947 0.59 710,894 0.59
1,001 - 2,000 527 0.33 749,104 0.62
2,001 - 3,000 157 0.10 383,729 0.32
3,001 - 4,000 68 0.04 240,916 0.20
4,001 - 5,000 54 0.03 248,610 0.20
5,001 - 10,000 93 0.06 682,689 0.56
10,001 & above 111 0.07 113,027,129 93.13
Total 159,978 100.00 121,362,869 100.00
Shareholding Pattern as on 31st March 2008
Category No. of shares held % to Total
Promoters holdings 101,424,813 83.57
Public Share holding:
Mutual Funds 2,539,819 2.09
Banks, Financial Institutions & others 193,024 0.16
Insurance Companies 2,029,505 1.67
Foreign Institutional Investors 1,564,380 1.29
Bodies Corporate 2,299,282 1.89
NRI/Foreign Nationals 504,019 0.42
Indian Public 10,808,027 8.91
Total 121,362,869 100.00
12. Dematerialization of shares and liquidity:
91.44 % of the total equity share capital of the Company is held in a dematerialized form with National SecuritiesDepository Limited and Central Depository Services (India) Limited as on 31st March 2008. The market lot is oneshare as the trading in equity shares of the Company is permitted only in dematerialized form. Other than thecapital which is locked post IPO for the specified periods, the stock is highly liquid.
The scrip has also been included in F&O segment by the National Stock Exchange of India Limited with effectfrom 6th September 2007.
13. Outstanding GDRs / ADRs / Warrants or any Convertible instruments, conversion date and likely impacton equity:
As on 31st March 2008, the Company did not have any outstanding GDRs/ADRs/Warrants or any Convertibleinstruments (excluding ESOPs).
14. Plant Locations:
The Company is in software business and does not require any manufacturing plants but it has softwaredevelopment centres in India and abroad. The addresses of the global development centres / offices of theCompany are given elsewhere in the annual report.

31
15. Address for correspondence :
Shareholders’ Correspondence: Shareholders may correspond with –
i) Registrar & Transfer Agents for all matters relating to transfer / dematerialization of shares, payment ofdividend, IPO refunds / demat credits at :
Intime Spectrum Registry LimitedBlock No. 202, 2nd Floor,Akshay Complex,Near Ganesh TempleOff Dhole Patil RoadPune 411 001
Tel No. +91 20 2605 3503, 2605 1629, 6520 3395,Fax: +91 20 2605 3503Contact Person : Mr. Bhagavant SawantEmail address: [email protected]
ii) Respective Depository Participants for shares held in demat mode.
iii) For all investor related matters.
Mr. Vikrant C. Gandhe,Assistant Company Secretary,Tech Mahindra Limited,Sharada Centre, Erandawane,Pune 411 004, INDIA.
Tel No. +91 20 6601 8100Email address: [email protected]

32
Particulars
Date of Birth
Date of Appointment
Qualifications
Brief Profile and expertise inspecific functional areas
Directorships held in otherpublic companies (excludingforeign companies)
Memberships/Chairmanships ofcommittees of other publiccompanies (includes only Audit,and Shareholders/InvestorsGrievance Committee)
No. of shares held in theCompany
Hon. Akash Paul
20th December 1957
23rd October 2000
Bachelor of Science, MBA
Hon. Akash Paul, a British national, is aNon-Executive Independent Director of theCompany. He holds an MBA degree fromMassachusetts Institute of Technology anda Bachelor of Science degree in ChemicalEngineering and Economics from Carnegie-Mellon University. He has been with theCaparo Group, a steel and engineeringcompany, one of the UK’s largest privatecompanies. He has an interest in educationand sits on the School of Engineering,Dean’s Advisory Council at Carnegie-MellonUniversity and the Dean’s Advisory Councilat the Sloan School of Management, MIT.
Nil
Nil
7,685
Mr. Arun Seth
19th November 1951
14th February 2005
BE, MBA
Mr. Arun Seth, an Indian national, is a Non-Executive Director of the Company. He is analumnus of the Indian Institute ofTechnology, Kanpur and the Indian Instituteof Management, Kolkata. Having over 30years of experience in the Information &Communication Technology industry, Mr.Seth is currently the Chairman of BT IndiaPvt. Ltd. and looks after the interests of BTGroup in India for its offshoring activities.He is on the Executive Committee ofNASSCOM and is a regular speaker atseminars relating to telecom and IT.
He is an independent director in AcmeTelepower Ltd.
Mr. Seth has an active interest inhumanitarian and educational activities andserves on the Board of the Indian Instituteof Management, Lucknow as well as theBoard of Governors of Helpage India, acharity that works for senior citizens.
Nil
Nil
2,712
DETAILS OF DIRECTORS SEEKING RE-APPOINTMENT PURSUANT TO CLAUSE 49 (IV) (G) (I)
Mr. Bharat N. Doshi
12th June 1949
6th June 1997
FCA, FCS, LL.M
Mr. Bharat N. Doshi, an Indian national, is aNon-Executive Director of the Company. Heis a fellow member of both, the Institute ofChartered Accountants of India and theInstitute of Company Secretaries of India andhas a Master’s Degree in Law from theUniversity of Bombay. He has participated inthe Program for Management Developmentat the Harvard Business School.
In August 1992, Mr. Bharat N. Doshi joinedthe Board of Mahindra & Mahindra Limitedas Executive Director in charge of Finance &Accounts, Corporate Affairs and InformationTechnology. He was the President of theTrade & Financial Services Sector fromDecember 1994 to October 2007.
Mr. Bharat N. Doshi is presently designatedas Executive Director and Group ChiefFinancial Officer (Group CFO), Mahindra &Mahindra Limited.
Mr. Bharat N. Doshi is actively involved withthe work of several Chambers ofCommerce and Industry in India. He was amember of the Managing Committee ofBombay Chamber of Commerce & Industry(“BCCI”) from May 2005 to May 2007. Hewas also a member of the Advisory Boardand Think Tank of the BCCI Trust forEconomic Management Studies. He wasthe Chairman of Expert Committee onEconomic Affairs of BCCI during 1996-97.He was the Convenor of the BCCI “ThinkTank”, constituted as a special body tosupport the Chamber’s initiatives on policyissues. He was a founding member andmember of the Governing Council ofIndian Association of Corporate CFOs andTreasurers (InAct).
He is on the Board of Governors of theMahindra United World College of India. Hewas a Member of the Governing Council ofIndian Institute of Management, Kozhikode,from September 1997 to March 2008.
He was a member of the High PoweredExpert Committee constituted by theMinistry of Finance, Government of India,on Making Mumbai an InternationalFinancial Centre and is a member of theSEBI (Securities and Exchange Board ofIndia) Committee on Disclosures andAccounting Standards (SCODA).
Mr. Bharat N. Doshi has been elected as VicePresident of Bombay Chamber ofCommerce & Industry (BCCI) for the year2008-09.
Mr. Bharat N. Doshi was adjudged ‘India’s BestCFO’ by the leading business fortnightly“Business Today” (India Today GroupPublication) in April 2005. He was alsoconferred the ‘CFO of the Year’ Award,honouring financial excellence, instituted byIMA India, an associate of The EconomistGroup, in December 2005. In November 2007,Bharat N. Doshi was honoured with theprestigious CNBC CFO of the Year 2007 award.
10
Membership : 2
Chairmanship: 2
15,501

33
CERTIFICATETo the Members of Tech Mahindra Limited
We have examined the compliance of the conditions of Corporate Governance by Tech Mahindra Limited for the year endedon March 31, 2008, as stipulated in Clause 49 of the Listing Agreement of the said Company with the stock exchanges.
The compliance of conditions of Corporate Governance is the responsibility of the management. Our examination was limitedto procedures and implementation thereof, adopted by the Company for ensuring the compliance of the conditions of theCorporate Governance. It is neither an audit nor an expression of opinion on the financial statements of the Company.
In our opinion and to the best of our information and according to the explanations given to us and the representations madeby the directors and the management, we certify that the Company has complied with the conditions of Corporate Governanceas stipulated in the abovementioned Listing Agreement.
We further state that such compliance is neither an assurance as to the future viability of the Company nor the efficiency oreffectiveness with which the management has conducted the affairs of the Company.
For Deloitte Haskins & SellsChartered Accountants
Hemant M. JoshiPlace: Pune PartnerDate: 21st May, 2008 Membership No. 38019
DECLARATION REGARDING COMPLIANCE BY BOARD MEMBERS AND
SENIOR MANAGEMENT PERSONNEL WITH THE COMPANY’S CODE OF CONDUCT
PURSUANT TO CLAUSE 49 OF THE LISTING AGREEMENT
As required by Clause 49 I (D) (ii) of the Listing Agreement, this is to confirm that the Company has adopted a Code ofConduct for all Board Members and Senior Management of the Company. The Code is available on the Company’s website.
I confirm that the Company has in respect of the financial year ended 31st March 2008, received from the senior manage-ment team of the Company and the Members of the Board, a declaration of compliance with the Code of Conduct asapplicable to them.
For the purpose of this declaration, Senior Management Team comprises of employees in the President and ExecutiveVice President cadre as on 31st March 2008 and Chief Financial Officer of the Company.
For Tech Mahindra Limited
Vineet Nayyar12th May 2008 Vice Chairman, Managing Director & CEO

Financial Statements of Tech Mahindra Limited
5
C km y

35
AUDITORS’ REPORT
To the Members of Tech Mahindra Limited
1. We have audited the attached Balance Sheet of TECH MAHINDRA LIMITED as at March 31, 2008, and also the Profitand Loss Account and the Cash Flow Statement for the year ended on that date, both annexed thereto. Thesefinancial statements are the responsibility of the Company’s management. Our responsibility is to express an opinionon these financial statements based on our audit.
2. We conducted our audit in accordance with the auditing standards generally accepted in India. Those Standardsrequire that we plan and perform the audit to obtain reasonable assurance about whether the financial statementsare free of material misstatement. An audit includes examining, on a test basis, evidence supporting the amountsand disclosures in the financial statements. An audit also includes assessing the accounting principles used andsignificant estimates made by management, as well as evaluating the overall financial statement presentation. Webelieve that our audit provides a reasonable basis for our opinion.
3. As required by Companies (Auditor’s Report) Order, 2003 issued by the Central Government in terms ofsection 227 (4A) of the Companies Act, 1956, we enclose in the Annexure a statement on the matters specified inparagraphs 4 and 5 of the said Order.
4. Further, to our comments in the Annexure referred to in paragraph 3 above, we report that:
a) We have obtained all the information and explanations, which to the best of our knowledge and belief werenecessary for the purposes of our audit;
b) In our opinion, proper books of account as required by law have been kept by the company so far as appearsfrom our examination of those books;
c) The Balance Sheet, Profit and Loss Account and Cash Flow Statement dealt with by this report are in agreementwith the books of account;
d) In our opinion the Balance Sheet, Profit and Loss Account and Cash Flow Statement dealt with by this reportcomply with the Accounting Standards referred to in sub-section (3C) of section 211 of the Companies Act,1956;
e) On the basis of written representations received from the directors as on 31st March, 2008 and taken on recordby the Board of Directors, we report that none of the directors is disqualified as on 31st March, 2008 from beingappointed as a director in terms of clause (g) of sub- section (1) of section 274 of the Companies Act, 1956; and
f ) In our opinion and to the best of our information and according to the explanations given to us, the saidaccounts, give the information required by the Companies Act, 1956, in the manner so required and give a trueand fair view in conformity with the accounting principles generally accepted in India:
i) in the case of the Balance Sheet, of the state of affairs of the company as at March 31, 2008;
ii) in the case of the Profit and Loss Account, of the profit for the year ended on that date; and
iii) in the case of the Cash Flow Statement, of the cash flows for the year ended on that date.
For Deloitte Haskins & SellsChartered Accountants
Hemant M. JoshiPune, PartnerDated: 21st May, 2008 Membership No. 38019

36
A N N U A L R E P O R T 2 0 0 7
ANNEXURE TO THE AUDITORS’ REPORT
(Referred to in Paragraph 3 of our report of even date)
i) The nature of the Company’s activities are such that clauses (xiii) and (xiv) of paragraph 4 of the Companies(Auditor’s Report) Order, 2003 are not applicable to the Company for the year.
ii) (a) The Company has maintained proper records showing full particulars, including quantitative details andsituation of fixed assets.
(b) As explained to us, the fixed assets are physically verified by the management according to a phased programmedesigned to cover all the items at reasonable intervals, having regard to the size of the company and thenature of its assets. Pursuant to the programme, the major portion of these fixed assets have been physicallyverified by the management during the year and no material discrepancies were noted on such verification.
(c) The fixed assets disposed off during the year, in our opinion, do not constitute substantial part of the fixedassets of the Company and such disposal has, in our opinion, not affected the going concern status of theCompany.
iii) The activities of the Company and the nature of its business do not involve use of inventory. Accordingly, clause (ii)of the Companies (Auditor’s Report) Order, 2003 is not applicable.
iv) In our opinion and according to the information and explanations given to us, the Company has not granted ortaken any loan, secured or unsecured, to or from companies, firms or other parties covered in the register maintainedunder Section 301 of the Companies Act, 1956. Accordingly, the provisions of Sub Clauses (b), (c), (d), (f ) and (g), ofClause 4 (iii) of Companies (Auditor’s Report) Order, 2003 are not applicable to the company.
v) In our opinion, and according to the information and explanations given to us, there is an adequate internalcontrol system commensurate with the size of the Company and nature of its business with regard to purchase offixed assets and sale of services. The activities of the Company do not involve purchase of inventory and sale ofgoods. During the course of our audit we have not observed any continuing failure to correct major weaknesses inthe internal control system.
vi) According to the information and explanations given to us, we are of the opinion that there are no contracts orarrangements that need to be entered into the register referred to in Section 301 of the Companies Act, 1956.Accordingly, the provisions of Sub Clauses (a) and (b) of Clause 4 (v) of Companies (Auditor’s Report) Order, 2003are not applicable to the company.
vii) The Company has not accepted any deposits from the public to which the provisions of the Sections 58(A) and58(AA) of the Companies Act, 1956 and the rules framed there under apply.
viii) In our opinion, the company has an internal audit system commensurate with the size of the Company and natureof its business.
ix) According to the information and explanations given to us, the Central Government has not prescribed maintenanceof cost records under clause (d) of sub-section (1) of Section 209 of the Act. Therefore the provisions of clause (viii)of the Companies (Auditor’s Report) Order, 2003 is not applicable to the Company.
x) According to information and explanations given to us in respect of statutory and other dues:
(a) The company has been generally regular in depositing undisputed statutory dues in respect of Provident Fund,Investor Education and Protection Fund, Employees’ State Insurance (ESI), Income-tax, Sales-tax, Wealth tax,Service tax, Custom duty, cess and any other material statutory dues with the appropriate authorities duringthe year.
(b) According to the information and explanations given to us, undisputed amounts payable in respect of servicetax dues of Rs. 51.79 million were in arrears, as at March 31, 2008 for a period of more than six months fromthe date they became payable.

37
(c) According to information and explanations given to us there are no dues of Sales tax / Income-tax / Customsduty / wealth tax / Service tax / excise duty and cess, which have not been deposited with the appropriateauthorities on account of any dispute, except in following cases:
Forum where dispute is pending Nature of dues Amount Financial Year(Rs. in Million) to which amount relates
Income tax Appellate Tribunal Corporate tax 3.90 1997-1998
Income tax Appellate Tribunal Corporate tax 27.10 1998-1999
Income tax Appellate Tribunal Corporate tax 6.39 1999-2000
Income tax Appellate Tribunal Corporate tax 48.34 2001-2002
Commissioner of Income tax(Appeals) Corporate tax 72.27 2003-2004
Assistant Commissioner ofSales Tax, Mumbai Sales Tax 0.86 April 2000 to March 2001
xi) The Company does not have any accumulated losses at the end of the financial year and has not incurred cashlosses during the financial year covered by our audit and the immediately preceding financial year.
xii) In our opinion and according to the information and explanations given to us, the Company has not defaulted inrepayment of dues to banks. There are no dues payable to financial institutions or debenture holders.
xiii) According to the information and explanations given to us, the Company has not granted any loans or advanceson the basis of security by way of pledge of shares, debentures and other securities.
xiv) According to the information and explanations given to us, the Company has not given any guarantee for loanstaken by others from banks or financial institutions.
xv) The Company has not availed any term loans during the year.
xvi) According to information and explanations given to us and on an overall examination of the Balance Sheet of theCompany, funds raised on short term basis have, prima facie, not been used during the year for long term investment.
xvii) The Company has not made any preferential allotment of shares to parties and companies covered in the Registermaintained under Section 301 of the Companies Act, 1956.
xviii) In our opinion and according to the information and explanations given to us, the Company has not issued anysecured debentures during the period covered by our audit. Accordingly, the provisions of clause 4 (xix) of theCompanies (Auditor’s Report) Order, 2003 are not applicable to the Company.
xix) The management has disclosed the end use of money raised by public issue and the same has been verified by us.
xx) According to the information and explanations given to us, no fraud on or by the Company was noticed orreported during the year.
For Deloitte Haskins & SellsChartered Accountants
Hemant M. JoshiPune, PartnerDated: 21st May, 2008 Membership No. 38019

38
A N N U A L R E P O R T 2 0 0 7
BALANCE SHEET AS AT MARCH 31, 2008
Rs. in MillionAs at As at
Schedule March 31, 2008 March 31, 2007
SOURCES OF FUNDS:SHAREHOLDERS’ FUNDS:Share Capital I 1,214 1,212Share Application Money - 1Reserves and Surplus II 11,070 7,568
12,284 8,781LOAN FUNDS: IIISecured Loan - 100Unsecured Loan 950 390
950 490
13,234 9,271
APPLICATION OF FUNDS:FIXED ASSETS: IVGross Block 5,505 4,428Less: Depreciation 2,596 1,957
Net Block 2,909 2,471Capital Work-in-Progress, including Advances 1,385 546
4,294 3,017INVESTMENTS: V 2,986 2,832DEFERRED TAX ASSET (NET): 14 14(Refer note 23 (a) to schedule XIII)CURRENT ASSETS, LOANS AND ADVANCES: VISundry Debtors 10,574 7,920Cash and Bank balances 814 252Loans and Advances 3,477 1,596
14,865 9,768Less: CURRENT LIABILITIES AND PROVISIONS:Liabilities VII 6,341 4,967Provisions VIII 2,584 1,393
8,925 6,360
Net Current Assets 5,940 3,408
13,234 9,271
SIGNIFICANT ACCOUNTING POLICIESAND NOTES ON ACCOUNTS: XIII
As per our attached report of even dateFor Deloitte Haskins & Sells For Tech Mahindra LimitedChartered Accountants
Anand G. Mahindra Vineet NayyarChairman Vice Chairman, Managing Director & CEO
Hon. Akash Paul Al-Noor Ramji Bharat DoshiDirector Director Director
Hemant M. Joshi Clive Goodwin Dr. Raj Reddy Ulhas N. YargopPartner Director Director Director
Vikrant GandheAsst. Company Secretary
Pune, Dated: 21st May, 2008 Boston, Dated: May 19, 2008

39
PROFIT AND LOSS ACCOUNT FOR THE YEAR ENDED MARCH 31, 2008
Rs. in Million except earning per share
Year ended Year endedSchedule March 31, 2008 March 31, 2007
INCOME:Income from operations 36,047 27,577Other Income IX 976 9
Total Income 37,023 27,586
EXPENDITURE:Personnel X 12,224 8,445Operating and other expenses XI 15,616 12,092Depreciation IV 736 463Interest XII 100 69
28,676 21,069
PROFIT BEFORE TAX AND EXCEPTIONAL ITEM 8,347 6,517Provision for Taxation- Current tax (Refer note 29 of schedule XIII) (620) (573)- Deferred tax - 9- Fringe benefit tax (69) (51)
PROFIT AFTER TAX AND BEFORE EXCEPTIONAL ITEM 7,658 5,902Exceptional item (Refer note 12 of schedule XIII) 4,401 5,250
NET PROFIT FOR THE YEAR 3,257 652Provision in respect of earlier year written back 165 -(Refer note 11 of schedule XIII)Excess provision for income-tax in respect of earlier year written back - 339(Refer note 23 (b) of schedule XIII)Balance brought forward from previous year 4,261 4,540
Balance available for appropriation 7,683 5,531Interim Dividend - I - (90)Interim Dividend - II - (176)Final Dividend (668) -Dividend Tax (113) (37)
Transfer to General Reserve (1,700) (65)
Balance carried to Balance Sheet 5,202 5,163
Earning Per Share (Refer note 27 of schedule XIII)Before exceptional item
- Basic 64.49 54.24- Diluted 59.84 47.84
After exceptional item- Basic 28.21 8.62- Diluted 26.17 7.60
SIGNIFICANT ACCOUNTING POLICIESAND NOTES ON ACCOUNTS XIII
As per our attached report of even dateFor Deloitte Haskins & Sells For Tech Mahindra LimitedChartered Accountants
Anand G. Mahindra Vineet NayyarChairman Vice Chairman, Managing Director & CEO
Hon. Akash Paul Al-Noor Ramji Bharat DoshiDirector Director Director
Hemant M. Joshi Clive Goodwin Dr. Raj Reddy Ulhas N. YargopPartner Director Director Director
Vikrant GandheAsst. Company Secretary
Pune, Dated: 21st May, 2008 Boston, Dated: May 19, 2008

40
A N N U A L R E P O R T 2 0 0 7
CASH FLOW FOR THE YEAR ENDED MARCH 31, 2008
Rs. in Million
Year Ended Year EndedParticulars March 31, 2008 March 31, 2007
A. Cash flow from operating activities:
Net profit before taxation and exceptional item 8,347 6,517
Less: Exceptional item (4,401) (5,250)
Add: Provision in respect of earlier year written back 165 -
Net profit before taxation and after exceptional item 4,111 1,267
Adjustments for:
Depreciation 736 463
Loss on sale of fixed assets (net) 4 2
Provision in respect of earlier year written back (165) -
Interest expense 100 69
Decrease in fair value of current investment - -
Exchange Loss/(Gain) (net) (88) 62
Exchange Loss/(Gain) on mark to market on Hedges (184) -(Refer note 1(j) (c) of schedule XIII)
Dividend from current investments (34) (56)
Interest income (38) (88)
Profit on sale of current investments (22) (15)
309 437
Operating profit before working capital changes 4,420 1,704
Adjustments for:
Trade and other receivables (3,068) (4,630)
Trade and other payables 1,714 3,161
(1,354) (1,469)
Cash generated from operations before tax 3,066 235
Income taxes paid (969) (203)
(969) (203)
Net cash from/(used in) operating activities 2,097 32
B. Cash flow from investing activities:
Purchase of fixed assets (1,928) (1,700)
Purchase of current investments (2,268) (5,214)
Acquisition/Investments in subsidiaries (870) (276)(Refer note 5,6,7,8 and 9 of schedule XIII)
Sale of current investments 3,017 5,620
Sale of fixed assets 3 2
Interest received 38 88
Dividend received on current investments 25 56
Net cash from/(used in) investing activities (1,983) (1,424)

41
CASH FLOW FOR THE YEAR ENDED MARCH 31, 2008 (Contd.)
Rs. in Million
Year Ended Year EndedParticulars March 31, 2008 March 31, 2007
C. Cash flow from financing activities:
Proceeds from issue of shares(including securities premium) 10 950
Issue of equity shares - 1,163
Share application money - 1
Dividend (including dividend tax paid) - (1,347)
Payment of principal on car lease (14) -
Proceeds from borrowing 460 491
Interest paid (100) (67)
Net cash from/(used in) financing activities 356 1,191
Net increase/(decrease) in cash and cashequivalents (A+B+C) 470 (201)
Cash and cash equivalents at the beginningof the year 295 496
Cash and cash equivalents at the end of the year 765 295
Notes:1. Components of cash and cash equivalents includes cash, bank balances in current and deposit accounts as disclosed
under schedule VI (b) of the accounts.2. Purchase of fixed assets are stated inclusive of movements of capital work-in-progress between the commencement
and end of the year and are considered as part of investing activity.March 31, 2008 March 31, 2007
3. Cash and cash equivalents :Cash and Bank balances 814 252
Unrealised (Gain)/Loss on foreign currency cashand cash equivalents (49) 43
Total cash and cash equivalents 765 295
4. Cash and cash equivalents include equity share application money of Rs. Nil (previous year: Rs. 1 million) andunclaimed dividend of Rs. 1 million (previous year: Rs. 1 million)
As per our attached report of even dateFor Deloitte Haskins & Sells For Tech Mahindra LimitedChartered Accountants
Anand G. Mahindra Vineet NayyarChairman Vice Chairman, Managing Director & CEO
Hon. Akash Paul Al-Noor Ramji Bharat DoshiDirector Director Director
Hemant M. Joshi Clive Goodwin Dr. Raj Reddy Ulhas N. YargopPartner Director Director Director
Vikrant GandheAsst. Company Secretary
Pune, Dated: 21st May, 2008 Boston, Dated: May 19, 2008

42
A N N U A L R E P O R T 2 0 0 7
Schedules forming part of the Balance Sheet
Rs. in MillionAs at As at
March 31, 2008 March 31, 2007
Schedule I
SHARE CAPITAL:
Authorised:
175,000,000 (previous year: 175,000,000)Equity shares of Rs. 10/- (previous year: Rs. 10/-) each 1,750 1,750
1,750 1,750
Issued, subscribed and paid up:
121,362,869 (previous year: 121,216,701)Equity shares of Rs. 10/- (previous year: Rs. 10/-) each fully paid up 1,214 1,212
1,214 1,212
Notes:
1. Out of the above 9,931,638 (previous year: 9,931,638) Equity share of Rs. 10/- (previous year: Rs. 10/- paid up) eachfully paid up are held by Mahindra BT Investment Company (Mauritius) Limited, a subsidiary of Mahindra andMahindra Limited and 53,776,252 (previous year: 53,776,252) Equity share of Rs. 10/- each (previous year:Rs. 10/- each) are held by Mahindra & Mahindra Limited, the ultimate holding company.
2. The above includes 51,000,100 and 25,000,000 Equity shares originally of Rs. 2/- each issued as fully paid up bonusshares by capitalisation of balance of Profit and Loss account and General Reserve, respectively.
3. The above includes 90,148,459 Equity shares of Rs. 10/- each allotted as fully paid up bonus shares by way ofcapitalisation of Profit and Loss account (Refer note 4 of schedule XIII).
4. The above includes 5 Equity shares of Rs. 2/- each consolidated into 1 Equity share of Rs. 10/- each (Refer note 4 ofschedule XIII).
5. Refer note 21 of schedule XIII for stock options.
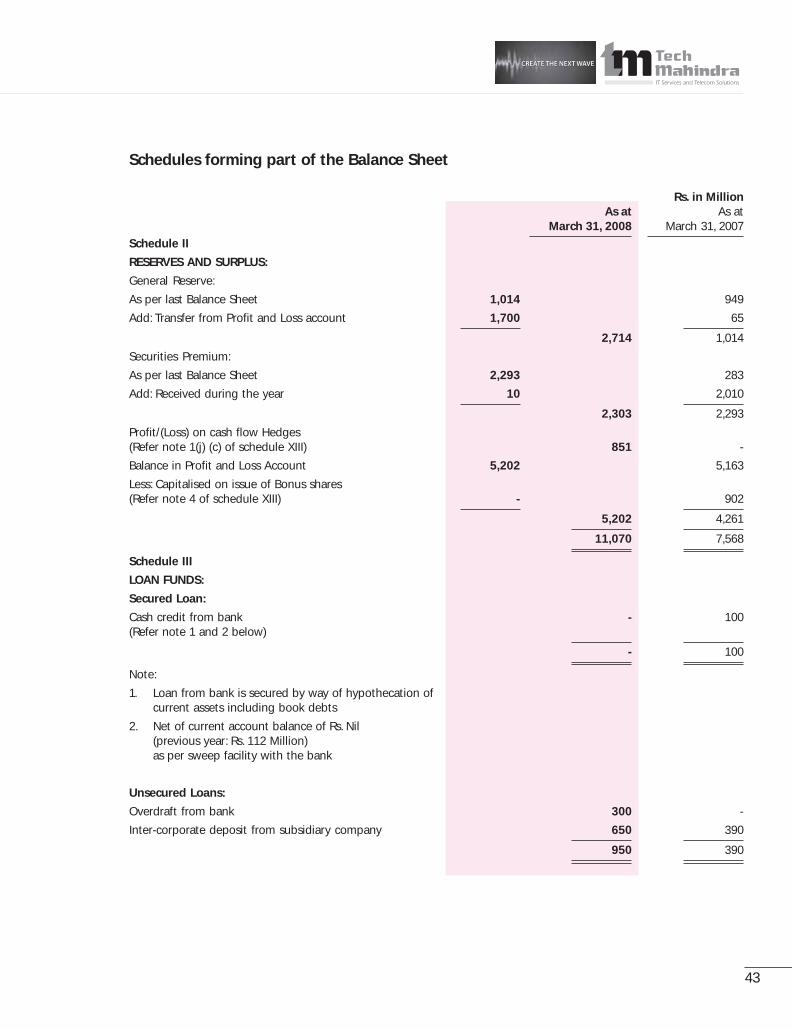
43
Schedules forming part of the Balance Sheet
Rs. in MillionAs at As at
March 31, 2008 March 31, 2007
Schedule II
RESERVES AND SURPLUS:
General Reserve:
As per last Balance Sheet 1,014 949
Add: Transfer from Profit and Loss account 1,700 65
2,714 1,014
Securities Premium:
As per last Balance Sheet 2,293 283
Add: Received during the year 10 2,010
2,303 2,293
Profit/(Loss) on cash flow Hedges(Refer note 1(j) (c) of schedule XIII) 851 -
Balance in Profit and Loss Account 5,202 5,163
Less: Capitalised on issue of Bonus shares(Refer note 4 of schedule XIII) - 902
5,202 4,261
11,070 7,568
Schedule III
LOAN FUNDS:
Secured Loan:
Cash credit from bank - 100(Refer note 1 and 2 below)
- 100
Note:
1. Loan from bank is secured by way of hypothecation ofcurrent assets including book debts
2. Net of current account balance of Rs. Nil(previous year: Rs. 112 Million)as per sweep facility with the bank
Unsecured Loans:
Overdraft from bank 300 -
Inter-corporate deposit from subsidiary company 650 390
950 390

44
A N N U A L R E P O R T 2 0 0 7
Sch
edu
les
form
ing
par
t o
f th
e B
alan
ce S
hee
tSc
hed
ule
IV
FIX
ED A
SSET
S:
Rs.
in
Mil
lio
n
GR
OSS
BLO
CK
DEP
REC
IAT
ION
NET
BLO
CK
Des
crip
tion
of
asse
tsCo
st a
s at
Add
itio
nsD
educ
tion
sCo
st a
s at
Upt
oFo
rD
educ
tion
sU
pto
As
atA
s at
Apr
il 01
,du
ring
duri
ngM
arch
31,
Mar
ch 3
1,th
e ye
ardu
ring
Mar
ch 3
1,M
arch
31,
Mar
ch 3
1,20
07 t
he y
ear
the
yea
r 2
008
200
7th
e ye
ar 2
008
2008
200
7
Leas
ed A
sset
s:
Veh
icle
s67
-17
50
3813
123
91
129
(Ref
er n
ote
19
of
sch
edu
le X
III)
Oth
er A
sset
s:
Free
ho
ld L
and
82-
-8
2-
--
-8
282
Leas
eho
ld L
and
221
104
-3
25
13
-4
32
122
0
Leas
eho
ld I
mp
rove
men
ts84
195
-2
79
655
-6
12
18
78
Off
ice
Bu
ildin
g/P
rem
ises
1,41
1-
-1
,41
150
994
-6
03
80
890
2
Co
mp
ute
rs1,
245
491
801
,65
672
833
380
98
16
75
517
Plan
t an
d M
ach
iner
y73
926
11
99
933
113
61
46
65
33
408
Furn
itu
re a
nd
Fix
ture
s54
612
65
66
733
391
44
20
24
721
3
Veh
icle
s33
41
36
1111
02
21
422
Tota
l4
,42
81
,18
11
04
5,5
05
1,9
57
73
69
72
,59
62
,90
92
,47
1
Prev
iou
s ye
ar3,
070
1,36
911
4,42
81,
501
463
71,
957
Cap
ital
Wo
rk-i
n-P
rog
ress
(in
clu
des
cap
ital
ad
van
ces
Rs.
1,3
82
Mil
lio
n (
pre
vio
us
year
: Rs.
517
Mill
ion
))1,
385
546
Tota
l4
,29
43,
017
No
te: F
ixed
ass
ets
incl
ud
e ce
rtai
n l
ease
d v
ehic
les
agg
reg
atin
g t
o R
s. 1
4 M
illi
on
(p
revi
ou
s ye
ar: R
s. 38
Mill
ion
) (a
t co
st)
on
wh
ich
ven
do
rs h
ave
a lie
n.
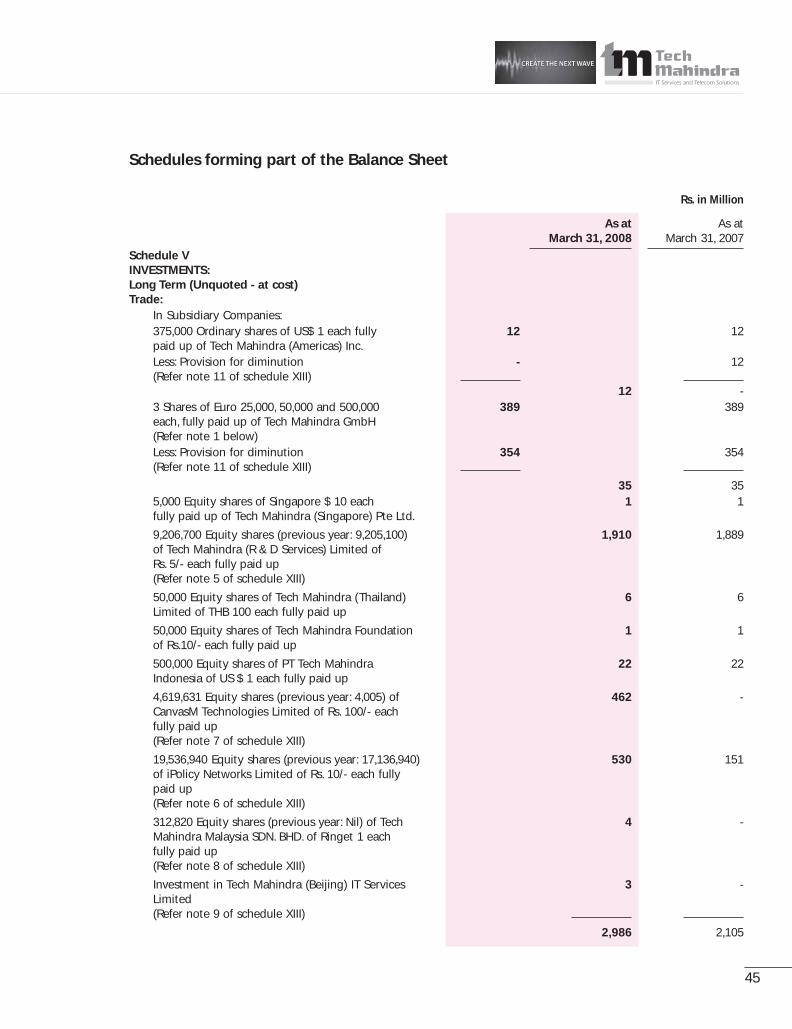
45
Schedules forming part of the Balance Sheet
Rs. in Million
As at As atMarch 31, 2008 March 31, 2007
Schedule VINVESTMENTS:Long Term (Unquoted - at cost)Trade:
In Subsidiary Companies:375,000 Ordinary shares of US$ 1 each fully 12 12paid up of Tech Mahindra (Americas) Inc.Less: Provision for diminution - 12(Refer note 11 of schedule XIII)
12 -3 Shares of Euro 25,000, 50,000 and 500,000 389 389each, fully paid up of Tech Mahindra GmbH(Refer note 1 below)Less: Provision for diminution 354 354(Refer note 11 of schedule XIII)
35 355,000 Equity shares of Singapore $ 10 each 1 1fully paid up of Tech Mahindra (Singapore) Pte Ltd.
9,206,700 Equity shares (previous year: 9,205,100) 1,910 1,889of Tech Mahindra (R & D Services) Limited ofRs. 5/- each fully paid up(Refer note 5 of schedule XIII)
50,000 Equity shares of Tech Mahindra (Thailand) 6 6Limited of THB 100 each fully paid up
50,000 Equity shares of Tech Mahindra Foundation 1 1of Rs.10/- each fully paid up
500,000 Equity shares of PT Tech Mahindra 22 22Indonesia of US $ 1 each fully paid up
4,619,631 Equity shares (previous year: 4,005) of 462 -CanvasM Technologies Limited of Rs. 100/- eachfully paid up(Refer note 7 of schedule XIII)
19,536,940 Equity shares (previous year: 17,136,940) 530 151of iPolicy Networks Limited of Rs. 10/- each fullypaid up(Refer note 6 of schedule XIII)
312,820 Equity shares (previous year: Nil) of Tech 4 -Mahindra Malaysia SDN. BHD. of Ringet 1 eachfully paid up(Refer note 8 of schedule XIII)
Investment in Tech Mahindra (Beijing) IT Services 3 -Limited(Refer note 9 of schedule XIII)
2,986 2,105

46
A N N U A L R E P O R T 2 0 0 7
Schedules forming part of the Balance Sheet
Rs. in Million
As at As atMarch 31, 2008 March 31, 2007
Schedule V (Contd.)
Current Investments (Unquoted - at lowerof cost or fair value)
Non Trade:
Nil (previous year: 15,000,000.00) units of - 150Rs. Nil (previous year: Rs. 10.00) each ofBirla Mutual Fund-FTP-Quarterly-Series 8-Dividend-Payout
Nil (previous year: 11,533,845.61) units - 116of Rs. Nil (previous year: Rs. 10.02) eachof Birla Mutual Fund-Cash Plus-InstitutionalPrem. Weekly Dividend -Reinvestment(Cost: previous year Rs. 116 million)
Nil (previous year: 5,000,000.00) units of - 50Rs. Nil (previous year: Rs. 10.00) each ofHSBC Mutual Fund - Fixed Maturity Plan
Nil (previous year: 10,233,630.44) units - 102of Rs. Nil (previous year: Rs. 10.00) eachof J M Mutual Fund - FMP Series IVQuarterly Plan Dividend Plan
Nil (previous year: 5,000,000.00) units - 50of Rs. Nil (previous year: Rs. 10.00)each of Kotak Mutual Fund - FMPGrowth
Nil (previous year: 5,402,783.71) units - 56of Rs. Nil (previous year: Rs. 10.44) eachof Reliance Mutual Fund - Short TermFund -Retail Plan - Dividend Option
Nil (previous year: 5,000,000.00) units - 50of Rs. Nil (previous year: Rs. 9.99) eachof Reliance Fixed Tenor Fund GrowthPlan[Cost: Rs. Nil (previous year: Rs. 50 Million)]

47
Rs. in Million
As at As atMarch 31, 2008 March 31, 2007
Schedule V (Contd.)
Nil (previous year: 5,084,276.05) units - 51of Rs. Nil (previous year: Rs. 10.00) eachof Chola FMP series-6 Quarterlyplan - 3-Dividend
Nil (previous year: 5,000,000.00) units of - 50Rs. Nil (previous year: Rs. 9.98) each ofGrindlays - FMP -16 month(Cost : previous year: Rs. 50 Million)
Nil (previous year: 5,235,028.52) units of - 52Rs. Nil (previous year: Rs. 10.00) each ofABN AMRO Mutual Fund - FTP Series 4Quarterly Plan Dividend on Maturity
- 727
2,986 2,832
Note:
1. Includes Rs. 360 Million (previous year: Rs. 360 Million) invested towards capital reserve of the company in accordancewith the German Commercial Code.
2. The above “non trade” investments made during previous year are out of proceeds of public issue (Refer note 25 ofschedule XIII).
3. Refer note 30 of schedule XIII for details of investment purchased and sold during the year.

48
A N N U A L R E P O R T 2 0 0 7
Schedules forming part of the Balance Sheet
Rs. in Million
As at As atMarch 31, 2008 March 31, 2007
Schedule VICURRENT ASSETS, LOANS AND ADVANCES:Current Assets:(a) Sundry Debtors * :
(Unsecured)Debts outstanding for a period exceeding six months
: considered good ** 1,155 626: considered doubtful 80 66
1,235 692Other debts, considered good *** 9,419 7,294
: considered doubtful - 153
10,654 8,139Less: Provision (Refer note 11 of schedule XIII) 80 219
10,574 7,920* Debtors include on account of unbilled revenue
aggregating to Rs. 3,121 Million (previous year:Rs. 1,868 Million)
** Net of advances aggregating to Rs. 98 Million(previous year: Rs. 179 Million) pendingadjustments with invoices
*** Net of advances aggregating to Rs. 159 Million(previous year: Rs. 1,598 Million) pendingadjustments with invoices
(b) Cash and Bank Balances:Balance with scheduled banks : (i) In Current Accounts 782 90
(ii) In Fixed DepositAccounts 14 161
Balance with other banks:with Commonwealth Bank of AustraliaIn Current Accounts @ 18 1
814 252@ Maximum balance outstanding during the year :Rs. 18 Million (previous year: Rs. 8 Million)
(c) Loans and Advances:(Unsecured, considered good unless otherwise stated)Loans to Subsidiaries 100 218Advance to Subsidiary - 27Bills of Exchange (considered doubtful) - 5Less: Provision - 5
- -Advances recoverable in cash or in kind or forvalue to be received - considered good 1,900 1,023
- considered doubtful 10 6
1,910 1,029Less: Provision 10 6
1,900 1,023Fair values of foreign exchange forward andcurrency option contracts 1,036 151(Refer note 1(j) (c ) of schedule XIII)Advance Taxes (net of provisions) 441 177
3,477 1,596
14,865 9,768

49
Schedules forming part of the Balance Sheet
Rs. in Million
As at As atMarch 31, 2008 March 31, 2007
Schedule VIICURRENT LIABILITIES:
(a) Sundry Creditors:
Total outstanding dues to Micro, Medium and Small enterprises - -(Refer note 28 of schedule XIII)
Total outstanding dues of Creditors other than Micro, Mediumand Small enterprises * 5,091 4,215
* includes -
Rs. 249 Million (previous year: Rs. 293 Million) due toTech Mahindra (Americas) Inc. USA, a subsidiary company.
Rs. 110 Million (previous year: Rs. 169 Million) due toTech Mahindra GmbH, a subsidiary company.
Rs. 49 Million (previous year: Rs.102 Million) due toTech Mahindra (Singapore) Pte. Ltd., a subsidiary company.
Rs. Nil (previous year: Rs. 4 Million) due toTech Mahindra (R&D Services) Limited, a subsidiary company.
Rs. 1 Million (previous year: Rs. 40 Million) due toTech Mahindra (Thailand) Limited, a subsidiary company.
Rs. 2 Million (previous year: Rs. Nil) due toTech Mahindra (Malaysia) SDN. BHD., a subsidiary company.
Rs. 4 Million (previous year: Rs. Nil) due toCanvasM Technologies Limited, a subsidiary company.
Rs. 1 Million (previous year: Rs. Nil) due toiPolicy Networks Limited, a subsidiary company.
(b) Other Liabilities 1,249 751
(c) Unclaimed Dividend 1 1
6,341 4,967
Schedule VIII
PROVISIONS:
Provision for taxation (net of advance taxes) 793 810
Provision for Fringe benefit tax (net of advance taxes) 6 5
Proposed Dividend 668 -
Provision for Dividend tax 113 -
Provision for Gratuity (Refer note 13 of schedule XIII) 454 266
Provision for Leave Encashment (Refer note 13 of schedule XIII) 550 312
2,584 1,393

50
A N N U A L R E P O R T 2 0 0 7
Schedules forming part of the Profit and Loss Account
Rs. in Million
Year ended Year endedMarch 31, 2008 March 31, 2007
Schedule IX
OTHER INCOME:
Interest on:
Deposits with banks 26 40[Tax deducted at source Rs. 1 Million(previous year: Rs. 4 Million)]
Income tax refund (refer note 23 (b) of schedule XIII) - 37
Others [Tax deducted at source Rs. 2 Million 12 12(previous year: Rs. Nil)]
38 89
Dividend received on current investments (non trade) 34 56
Profit on sale of current investments (non trade) (Net) 22 14
Exchange fluctuations (Net) 765 (155)
Sundry balances written back 89 -
Miscellaneous income [Tax deducted at source 28 5Rs. 1 Million (previous year: Rs. Nil)]
976 9
Schedule X
PERSONNEL:
Salaries, wages and bonus 10,695 7,518
Contribution to provident and other funds 883 534
Staff welfare 646 393
12,224 8,445

51
Schedules forming part of the Profit and Loss Account
Rs. in Million
Year ended Year endedMarch 31, 2008 March 31, 2007
Schedule XIOPERATING AND OTHER EXPENSES:
Power 278 148
Rent 759 368
Rates and taxes 34 19
Communication expenses 766 501
Traveling expenses [Net of recoveries Rs. 55 Million 4,845 3,273(previous year: Rs.189 Million)]
Recruitment expenses 75 111
Hire charges 183 171
Sub-contracting costs 6,938 5,564
Repairs and maintenance :
Buildings (including leased premises) 26 20
Machinery 50 34
Others 103 59
179 113
Insurance 97 72
Professional and legal fees 149 198
Software packages (Refer note 1 (i) of schedule XIII) 307 816
Project transition cost 233 -
Training 164 121
Advertising, marketing and selling expenses 34 29
Commission on income from service 169 221
Loss on sale of fixed assets (net) 4 2
Provision for doubtful debts 14 39
Provision for doubtful advances 4 3
Advances/bad debts written off 21 7
Donations 76 59
Miscellaneous expenses 287 257(Refer note 14 of schedule XIII)
15,616 12,092
Schedule XIIINTEREST:
Interest on
- Cash credit/Overdraft 62 61
- Inter-corporate deposit 38 8
100 69

52
A N N U A L R E P O R T 2 0 0 7
Schedule XIII
SIGNIFICANT ACCOUNTING POLICIES AND NOTES ONACCOUNTS FOR THE YEAR ENDED MARCH 31, 2008
1. Significant accounting policies:
(a) Basis for preparation of accounts:
The accounts have been prepared to comply inall material aspects with applicable accountingprinciples in India, the Accounting Standards andthe relevant provisions of the Companies Act,1956.
(b) Use of Estimates:
The preparation of financial statements, inconformity with the generally acceptedaccounting principles, requires estimates andassumptions to be made that affect the reportedamounts of assets and liabilities on the date offinancial statements and the reported amountsof revenues and expenses during the reportedyear. Differences between the actual results andestimates are recognised in the year in whichthe results are known/materialised.
(c) Fixed Assets:
Fixed assets are stated at cost less depreciation.Costs comprise of purchase price andattributable costs, if any.
(d) Leases:
Assets taken on lease are accounted for as fixedassets in accordance with Accounting Standard19 on “Leases”, (AS-19).
(i) Finance lease:
Assets taken on finance lease are accountedfor as fixed assets at fair value. Leasepayments are apportioned between financecharge and reduction of outstandingliability.
(ii) Operating lease:
Assets taken on lease under which all risksand rewards of ownership are effectivelyretained by the lessor are classified asoperating lease. Lease payments underoperating leases are recognised as expenseson accrual basis in accordance with therespective lease agreements.
(e) Depreciation on Fixed Assets:
(i) The Company computes depreciation for allfixed assets including for assets taken onlease using the straight-line method basedon estimated useful lives. Depreciation ischarged on a pro-rata basis for assetspurchased or sold during the year.Management’s estimate of the useful life offixed assets is as follows:
Buildings 15 years
Computers 3 years
Plant and machinery 3-5 years
Furniture and fixtures 5 years
Vehicles 3-5 years
(ii) Leasehold land is amortised over the periodof lease.
(iii) Leasehold improvements are amortised overthe period of lease.
(f ) Impairment of Assets:
At the end of each year, the company determineswhether a provision should be made forimpairment loss on assets by considering theindications that an impairment loss may haveoccurred in accordance with AccountingStandard 28 on ‘‘Impairment of Assets’’. Where therecoverable amount of any asset is lower than itscarrying amount, a provision for impairment losson assets is made for the difference. Recoverableamount is the higher of an assets net selling priceand value in use. In assessing value in use, theestimated future cash flows expected from thecontinuing use of the asset and from its disposalare discounted to their present value using a pre-tax discount rate that reflects the current marketassessments of time value of money and the risksspecific to the asset.
Reversal of impairment loss if any, is recognisedimmediately as income in the profit and lossaccount.
(g) Investments:
Current investments are carried at lower of costand fair value. Long term investments are carriedat cost. Provision is made to recognise a declineother than temporary in the carrying amount oflong term investment.
Schedules forming part of the Balance Sheet and Profit and Loss Account
53
(h) Revenue recognition:
Revenue from software services and businessprocess outsourcing services include revenueearned from services performed on ‘time andmaterial’ basis, time bound fixed priceengagements and system integration projects.
The related revenue is recognized as and whenservices are performed. Income from servicesperformed by the Company pending receipt ofpurchase orders from customers, which areinvoiced subsequently on receipt thereof, arerecognized as unbilled revenue.
Unbilled revenue is recognised at month closingrate. On receipt of POs, the amounts are billed tothe customer & the revenue is booked at theprevailing rate.
The Company also performs time bound fixedprice engagements, under which revenue isrecognized using the proportionate completionmethod of accounting, unless work completedcannot be reasonably estimated. Provision forestimated losses, if any on uncompleted contractsare recorded in the year in which such lossesbecome probable based on the current contractestimates.
Dividend income is recognized when theCompany’s right to receive dividend isestablished. Interest income is recognized ontime proportion basis.
(i) Expenditure:
The cost of software purchased for use insoftware development and services is chargedto cost of revenues in the year of acquisition.
(j) a) Foreign currency transactions:
Transactions in foreign currencies arerecorded at the exchange rates prevailingon the date of transaction. Monetary itemsare translated at the year-end rates. Theexchange difference between the rateprevailing on the date of transaction and onthe date of settlement as also on translationof monetary items at the end of the year isrecognised as income or expense, as the casemay be.
Any premium or discount arising at theinception of the forward exchange contractis recognized as income or expense over thelife of the contract, except in the case wherethe contract is designated as a cash flowhedge.
b) Derivative instruments and hedgeaccounting:
The Company uses foreign currency forwardcontracts to hedge its risks associated withforeign currency fluctuations relating tocertain firm commitments and forecastedtransactions. The Company designates theseas cash flow hedges applying therecognition and measurements principlesset out in the Accounting Standard 30 “Financial Instruments: Recognition andMeasurements”(AS-30).
The use of foreign currency forwardcontracts is governed by the Company’spolicies approved by the board of directors,which provide written principles on the useof such financial derivatives consistent withthe Company’s risk management strategy.The Company does not use derivativefinancial instruments for speculativepurposes.
Foreign currency forward contract derivativeinstruments are initially measured at fairvalue and are remeasured at subsequentreporting dates. Changes in the fair value ofthese derivatives that are designated andeffective as hedges of future cash flows arerecognized directly in reserves and theineffective portion is recognizedimmediately in profit and loss account.
Changes in the fair value of derivativefinancial instruments that do not qualify forhedge accounting are recognized in theprofit and loss account as they arise.
Hedge accounting is discontinued when thehedging instrument expires or is sold,terminated, or exercised, or no longerqualifies for hedge accounting. If a hedgedtransaction is no longer expected to occur,the net cumulative gain or loss recognizedin reserves is transferred to profit and lossaccount.
c) Exchange Gain/(Loss) (Net) accountedduring the year:
The Company enters into foreign exchangeforward contracts to off set the foreigncurrency risk arising from the amountsdenominated in currencies other than theIndian Rupee. The counter party to the

54
A N N U A L R E P O R T 2 0 0 7
Company’s foreign currency forwardcontracts is generally a bank.
Pending the issue of an accounting standardunder Indian GAAP to cover forwardexchange contracts entered into to hedgeforeign currency risk of a firm commitmentor highly probable forecast transactions, theexchange differences arising on suchcontracts upto March 31, 2007 wererecognized in the statement of profit or lossin the reporting year.
Effective April 1, 2007, the Company hasdesignated the outstanding forwardexchange contracts as cash flow hedges.Changes in the fair value of effective forwardexchange contract are recognized directlyin reserves and the ineffective portion isrecognized immediately in profit and lossaccount.
Consequent to this change in accounting forsuch contracts, the profit for the year endedMarch 31, 2008 is lower by Rs. 851 Millionand reserves and surplus are higher byRs. 851 Million.
(k) Employee Retirement Benefits:
a) Gratuity :
The Company provides for gratuity, a definedretirement benefit plan covering eligibleemployees. The gratuity plan provides for alump sum payment to employees atretirement, death, incapacitation ortermination of the employment based onthe respective employee’s salary and thetenure of the employment. Liabilities withregard to a gratuity plan are determinedbased on the actuarial valuation carried outby independent actuary as at the balancesheet date.
b) Provident fund :
The eligible employees of the Company areentitled to receive the benefits of providentfund, a defined contribution plan, in whichboth employees and the Company makemonthly contributions at a specifiedpercentage of the covered employees’ salary(currently at 12% of the basic salary). Thecontributions as specified under the law arepaid to the Regional Provident FundCommissioner by the Company.
c) Compensated absences:
The Company provides for the encashment ofleave subject to certain company’s criteria. Theemployees are entitled to accumulate leavesubject to certain limits, for future encashmentor availment. The liability is provided based onthe number of days of unavailed leave at eachbalance sheet date on the basis of anindependent actuarial valuation.
Actuarial gains and losses are recognised in fullin the profit and loss account for the year inwhich they occur.
(l) Borrowing costs:
Borrowing costs that are attributable to theacquisition or construction of qualifying assetsare capitalized as part of the cost of such assets.A qualifying asset is one that necessarily takes asubstantial period of time to get ready for itsintended use or sale. All other borrowing costsare charged to revenue.
(m) Taxation:
Tax expense comprises of current tax, deferredtax and fringe benefit tax. Current tax andDeferred tax are accounted for in accordancewith Accounting Standard 22 on “Accounting ForTaxes on Income”, (AS-22). Current tax is measuredat the amount expected to be paid to/recoveredfrom the tax authorities, using the applicable taxrates.
Minimum alternative tax (MAT ) paid inaccordance with the tax laws, which gives rise tofuture economic benefits in the form ofadjustment of future income tax liability isconsidered as an asset if there is convincingevidence that the Company will pay normal taxafter the tax holiday period. Accordingly, it isrecognized as an asset in the balance sheet whenit is probable that the future economic benefitassociated with it will flow to the Company andthe asset can be measured reliably. Deferred taxassets and liabilities are recognised for future taxconsequences attributable to timing differencesbetween taxable income and accounting incomethat are capable of reversal in one or moresubsequent years and are measured usingrelevant enacted tax rates. The carrying amountof deferred tax assets at each balance sheet dateis reduced to the extent that it is no longerreasonably certain that sufficient future taxableincome will be available against which thedeferred tax asset can be realized.

55
Fringe benefit tax is recognized in accordancewith the relevant provisions of the Income-taxAct, 1961 and the Guidance Note on FringeBenefits Tax issued by the Institute of CharteredAccountants of India (ICAI).
Tax on distributed profits payable in accordancewith the provisions of the Income-tax Act, 1961is disclosed in accordance with the GuidanceNote on Accounting for Corporate Dividend Taxissued by the ICAI.
(n) Contingent liabilities:
These, if any, are disclosed in the notes onaccounts. Provision is made in the accounts if itbecomes probable that any outflow of resourcesembodying economic benefits will be requiredto settle the obligation arising out of past events.
Notes on Accounts:
2. The estimated amount of contracts remaining to beexecuted on capital account (Net of capital advances),and not provided for as at March 31, 2008 Rs. 1,378Million (previous year: Rs. 1,291 Million).
3. Contingent Liabilities:
i) The Company has received demand notices fromIncome Tax authorities resulting in a contingentliability of Rs. 158 Million (previous year: Rs. 100Million). This is mainly on account of disallowanceof software maintenance activity, deductionunder section 80HHE amounting to Rs. 37Million and a further sum of Rs. 121 Millionrelating to Section 10A. The Company hasappealed before Appellate Authorities and ishopeful of succeeding in the same.
ii) The Company has received demand notice fromSales Tax authority for Rs. 1 Million (previousyear: Nil) towards purchases made fromunregistered dealers for the financial year2000-01.The Company has filed appeal againstthe same.
iii) Bank Guarantees outstanding Rs.160 Million(previous year: Rs. 224 Million).
4. During the previous year, pursuant to the resolutionpassed by the shareholders at the Extra OrdinaryGeneral Meeting held on June 1, 2006, the Companyconsolidated its share capital from 112,685,573 equityshares of Rs.2/- each into 22,537,114 equity shares ofRs.10/- each.
Further, during the previous year the Company hasissued 90,148,459 equity shares of Rs. 10/- each asbonus shares at the rate of 4 shares for each shareheld as at June 1, 2006, aggregating to Rs.902 Million
by way of capitalization from the balance of profitand loss account.
5. During the year ended March 31, 2006, the Companyhad acquired Tech Mahindra (R&D services) Limited( TMRDL) vide Share Purchase Agreement datedNovember 15, 2005, for a initial consideration ofRs. 1,755 Million (including stamp duty). As a result,TMRDL and its two wholly owned subsidiaries havebecome subsidiary / step subsidiaries of the Companywith effect from the date of acquisition i.e.November 28, 2005.
During the year, the company has acquired additional1,600 shares at total consideration of Rs. 0.30 Millionand the same has been accounted as additionalinvestment.
The terms of purchase also provide for payment ofcontingent consideration to all the sellingshareholders, payable over three years i.e. up toMarch 31, 2008 and calculated based on achievementof specific targets. The contingent consideration ispayable in cash and cannot exceed Rs. 641 Million.
The consideration so payable would be accounted inthe books of account in the year of achieving themilestones under the agreement. AccordinglyRs. 16 Million (previous year: Rs. 101 Million) has beenaccounted for during the year as additional cost ofacquisition, in accordance with the terms ofagreement and Rs. 5 Million has been accounted asadditional consideration due to revision inmanagement estimates made in the previous year.The total earn out payment amounts toRs.155 Million.
6. During the previous year, the Company had acquiredentire shareholding of iPolicy Networks Limited(formerly known as iPolicy Networks Private Limited)vide Share Purchase Agreement dated January 18,2007 for a consideration of Rs. 29 Million. As a result,iPolicy Networks Limited has become a wholly ownedsubsidiary of the Company with effect from the dateof acquisition.
During the year, the Company has made an additionalinvestment of Rs. 381 Million (previous year: Rs. 120Million) after the acquisition.
7. During the year, the Company has made investmentof Rs. 462 Million in CanvasM Technologies Limited.The Company holds 80.10 percent shareholding ofCanvasM Technologies Limited.
8. During the year, the Company has made investmentof Rs. 4 Million in Tech Mahindra (Malaysia) SDN. BHD.

56
A N N U A L R E P O R T 2 0 0 7
As a result, Tech Mahindra (Malaysia) SDN. BHD. hasbecome a wholly owned subsidiary of the Companywith effect from the date of this investment.
9. During the year, the Company has made investmentof Rs.3 Million in Tech Mahindra (Beijing) IT ServicesLimited, (TMCHN). As a result, TMCHN has become awholly owned subsidiary of the Company with effectfrom the date of this investment.
10. The board of the Company ( TML) has approvedScheme of amalgamation for amalgamating TechMahindra (R & D Services) Limited and iPolicyNetworks Limited, it ’s wholly owned subsidiarycompanies with itself, in its meeting dated October19, 2007. As per the Scheme, all the assets andliabilities of both the Transferor Companies wouldbecome the assets and liabilities of TML from theappointed date viz., April 1, 2008. The jurisdictionalHigh Courts of Mumbai, Delhi & Karnataka haveapproved the Schemes on March 28, 2008, April 04,2008 and April 03, 2008 respectively. The mergerswould result in operational synergies, enhancefinancial strength and rationalization of costs.
11. The Company holds investments (unquoted) in twosubsidiaries, viz., Tech Mahindra (Americas) Inc.(TMA),Tech Mahindra GmbH (TMGMBH) aggregating toRs. 12 Million and Rs. 389 Million respectively (Refernote 1 of Schedule V), which are held as strategic long-term investments.
The Company had made provision in the year endedMarch 31, 2005, to the extent of accumulated lossesin TMA, aggregating to Rs. 12 Million towardsdiminution in the value of investments andRs.153 Million towards debts recoverable from TMA.
As per the latest available audited accounts of TMAas at March 31, 2008, the subsidiary has becomeprofitable and its net worth has become positive.Similarly debtors recoverable from TMA have beenreduced substantially to Rs. 26 Million. TMA hasgrowth plans and is expected to earn profits insubsequent years as well. In view of this the provisionmade earlier are no longer required and accordinglythe Company has reversed the provision of
Rs. 165 Million made earlier and the same has beendisclosed as a provision in respect of earlier yearwritten back in profit and loss account.
The Company had made provision in the year endedMarch 31, 2005, to the extent of accumulated lossesin TMGMBH aggregating to Rs. 354 Million towardsdiminution in the value of its investments. WhileTMGMBH has started earning profits from financialyear 2006 onwards, the net worth of TMGMBH is stillsubstantially eroded as per the latest available auditedaccounts of TMGMBH at March 31, 2008. In view ofthis no change in provision is required.
12. During the year, the Company has entered in to anagreement with a customer under which it will haveexclusivity for 90 days in negotiating an engagement.
As per the terms of the agreement the company hasmade an ‘exclusivity’ payment of Rs. 4401 million tothe customer which is unconditional, irrevocable andnon-refundable. Accordingly, this payment has beendisclosed as an exceptional item in the profit and lossaccount.
The project will be executed with a consortiumpartner who will bear part of the ‘exclusivity payment’.The payment from consortium partner will beaccounted when it is contractually firmed up.
During the previous year, the Company had enteredinto Global Sourcing Agreement relating to thedevelopment of a global sourcing model for strategicoutsourcing services, with a customer for a term offive years.
As per the terms of agreement, the Company hadmade an upfront payment of Rs. 5,250 Million to thecustomer which was unconditional, irrevocable andnon-refundable. Accordingly, this payment had beendisclosed as an exceptional item in the previous yearprofit and loss account.
13. The revised Accounting Standard 15 on “EmployeeBenefits”, (AS-15), is adopted by the company witheffect from April 1, 2006.

57
The disclosure as required under AS 15 regarding the Company’s gratuity plan is as follows:Rs. in Million
Particulars March 31, 2008 March 31, 2007
Projected benefit obligation, beginning of the year 266 185
Service cost 153 101
Interest cost 27 16
Actuarial Loss/(Gain) 22 (23)
Benefits paid (14) (13)
Projected benefit obligation, end of the year 454 266
The Company’s gratuity plan is not funded and the liability is provided for in the books of account.Rs. in Million
Particulars March 31, 2008 March 31, 2007
Service cost 153 101
Interest cost 27 16
Amortisation of actuarial Loss/(Gain) 22 (23)
Net periodic gratuity cost 202 94
Assumptions:
Discount rate 7.75% 8.00 %
Rate of increase in compensation levels of covered employees 8.00% 7.75 %
The disclosure as required under AS 15 regarding the Company’s leave encashment is as follows:Rs. in Million
Particulars March 31, 2008 March 31, 2007
Projected benefit obligation, beginning of the year 272 204
Service cost 85 68
Interest cost 24 16
Actuarial Loss 152 19
Past service cost (vested) 7 -
Benefits paid (58) (35)
Projected benefit obligation, end of the year 482 272

58
A N N U A L R E P O R T 2 0 0 7
The Company’s leave encashment liability is not funded and is provided for in the books of account.Rs. in Million
Particulars March 31, 2008 March 31, 2007
Service cost 85 68
Interest cost 24 16
Amortisation of past service cost (vested) 7 -
Amortisation of actuarial loss 152 19
Net periodic leave encashment cost 268 103
The Company has in addition to above accounted for short term leave encashment and provident fund contributionamounting to Rs. 68 Million (previous year: Rs. 40 Million).
14. Payment to Auditors (Including Service Tax):Rs. in Million
Particulars March 31, 2008 March 31, 2007
1. Audit Fees 4 2
2. As advisor or in any other capacity inrespect of taxation matters etc. - 1
3. In any other manner for certification and IPO work etc. 2 6
Total 6 9
15. (a) Value of Imports on C.I.F. Basis:Rs. in Million
Particulars March 31, 2008 March 31, 2007
Capital goods [includes Rs. 171 Million (previous year:Rs.15 Million) towards assets purchased in UK office] 453 234
(b) Expenditure in Foreign Currency:Rs. in Million
Particulars March 31, 2008 March 31, 2007
Professional fees 106 151
Subcontracting cost 6,507 4,862
Traveling expenses 3,569 2,887
Salaries 2,235 1,969
Software packages 501 596
Exclusivity payment / Upfront discount 4,401 5,250
Others [including UK Corporation TaxRs.203 Million (previous year: Rs. 166 Million)] 814 625
Total 18,133 16,340

59
16. Remittance in foreign currency on account of dividends to non-resident shareholders:
Number of Shareholders Number of Equity Amount remitted Dividend relatingShares Rs. in Million to year ended
2007-2008
Nil - Nil Nil -
2006-2007
Nine Final 53,485,923 180 March 31, 2006
Nine Interim – 1 53,610,263 43 March 31, 2007
One thousand twohundred four Interim – 2 48,071,389 72 March 31, 2007
Nine Interim – 4 53,485,923 216 March 31, 2006
17. Earnings in foreign currency:Rs. in Million
Particulars March 31, 2008 March 31, 2007
Income from services 35,593 27,352
Interest on deposits with banks 22 19
Interest on loan to subsidiaries 6 10
Other income 16 -
18. Managerial remuneration paid to Managing Director, Executive Director and non-Executive Directors:
Rs. in Million
Particulars March 31, 2008 March 31, 2007
Managerial remuneration 17 17
Commission 24 17
Total 41 34
The above remuneration excludes provision for gratuity and leave encashment since these are based on actuarialvaluation done on an overall Company basis.

60
A N N U A L R E P O R T 2 0 0 7
Computation of Net Profit in accordance with Section 309(5) of the Companies Act, 1956, for the year endedMarch 31, 2008.
Rs. in Million
Particulars March 31, March 31,2008 2007
Profit before tax and after exceptional items as per profit andloss account 3,946 1,267
Add:
Depreciation charged in the accounts 736 463
Loss on sale of assets as per section 349 ofthe Companies Act, 1956 (Net) 4 2
Director’s remuneration 41 34
Provision for doubtful debts and advances 18 42
799 541
4,745 1,808Less:
Loss on sale of assets as per books 4 2
Profit on sale of investments 22 14
Depreciation u/s 350 of the Companies Act, 1956 736 463
762 479
Total 3,983 1,329
Commission payable to the Managing Director andExecutive Director. 6 7
Commission payable to non-Executive Directors 18 10
19. Assets acquired on lease:
The Company has acquired vehicles on lease, the fair value of which aggregates to Rs. 50 Million (previous year:Rs.67 Million). As per AS 19, the Company has capitalised the said vehicles at their fair values as the leases are in thenature of finance leases as defined in AS 19. Lease payments are apportioned between finance charge and deductionof outstanding liabilities. The details of lease rentals payable in future are as follows:
Rs. in Million
Particulars Not later than 1 year Later than 1 yearnot later than 5 years
Minimum lease rentals payable (previous year: Rs. 13 Millionand Rs. 4 Million respectively) 4 -
Present value of lease rentals payable (previous year:Rs. 12 Million and Rs. 4 Million respectively) 4 -

61
The Company has taken vehicles on operating lease for a period of three to four years. The lease rentals recognizedin the profit and loss account for the year are Rs. 8 Million (previous year: Rs. 1 Million). The future lease payments ofoperating lease are as follows:
Rs. in Million
Particulars Not later than 1 year Later than 1 yearnot later than 5 years
Minimum lease rentals payable (previous year:Rs. 1 Million and Rs. 3 Million respectively) 11 18
20. With the focus on customers in the Telecom Service Providers (TSP) and TEM segments of the telecom vertical, theCompany has reorganised its management structure to cater to the Company’s business segments. Consequently,the Company is of the view that as per the requirements of Accounting Standard 17 on ‘Segment Reporting’ (AS-17),the primary segment of the Company is business segment by category of customers in the TSP, TEM, BusinessProcess Outsourcing (BPO) and Other sectors and the secondary segment is the geographical segment by locationof its customers.
The Accounting principles consistently used in the preparation of the financial statements are also applied to recordincome and expenditure in the individual segments. There are no inter-segment transactions during the year.
A. PRIMARY SEGMENTS
For the year ended March 31, 2008Rs. in Million
PARTICULARS TELECOM TELECOM BUSINESS OTHERS TOTALSERVICE EQUIPMENT PROCESS
PROVIDER MANUFACTURER OUTSOURCING
Revenues 32,892 1,060 1,297 798 36,047
Less: Direct expenses 20,919 830 807 556 23,112
Segmental Operating Results 11,973 230 490 242 12,935
Less: Unallocable expenses
Depreciation 736
Interest 100
Other unallocable expenses 4,728
Total unallocable expenses 5,564
Operating income 7,371
Add: Other income 976
Net Profit before taxes & exceptional item 8,347
Less: Provision for taxation
Current tax (620)
Deferred tax -
Fringe benefit tax (69)
Net Profit after taxes & before exceptional item 7,658
Exceptional item (4,401)
Net Profit for the year 3,257
Provision in respect of earlier year written back 165
Net Profit 3,422
Segregation of assets, liabilities, depreciation and other non-cash expenses into various primary segments has notbeen done as the assets are used interchangeably between segments and Company is of the view that it is notpractical to reasonably allocate liabilities and other non-cash expenses to individual segments and an adhoc allocationwill not be meaningful.

62
A N N U A L R E P O R T 2 0 0 7
B. SECONDARY SEGMENTS:Revenues from secondary segments are as under:
Rs. in Million
Sector
Europe 27,718USA 6,228Rest of World 2,101
Total 36,047
Segregation of assets into secondary segments has not been done as the assets are used interchangeably betweensegments. Consequently the carrying amounts of assets by location of assets are not given.
A. PRIMARY SEGMENTS
For the year ended March 31, 2007Rs. in Million
PARTICULARS TELECOM TELECOM BUSINESS OTHERS TOTALSERVICE EQUIPMENT PROCESS
PROVIDER MANUFACTURER OUTSOURCING
Revenues 26,183 600 141 653 27,577
Less: Direct expenses 15,797 483 156 483 16,919
Segmental Operating Income 10,386 117 (15) 170 10,658
Less: Unallocable expensesDepreciation 463Interest 69Other unallocable expenses 3,618
Total unallocable expenses 4,150
Operating income 6,508Add: Other income 9
Net Profit before taxes & exceptional item 6,517Less: Provision for taxation
Current tax (573)Deferred tax 9Fringe benefit tax (51)
Net Profit after taxes & before exceptional item 5,902Exceptional item (5,250)
Net profit for the year 652Excess provision for income-tax in respect of earlieryears written back (Refer note 24 (b) below) 339
Net profit 991
Segregation of assets, liabilities, depreciation and other non-cash expenses into various primary segments has notbeen done as the assets are used interchangeably between segments and Company is of the view that it is not practi-cal to reasonably allocate liabilities and other non-cash expenses to individual segments and an adhoc allocation willnot be meaningful.
B. SECONDARY SEGMENTS:Revenues from secondary segments are as under:
Sector Rs. in Million
Europe 21,278USA 4,126Rest of World 2,173Total 27,577

63
Segregation of assets into secondary segments has not been done as the assets are used interchangeably betweensegments. Consequently the carrying amounts of assets by location of assets are not given.
21. (A) The Company has instituted “ Employee Stock Option Plan 2000” (ESOP) for its employees and Directors. For thispurpose it had created a trust viz. MBT ESOP Trust. In terms of the said Plan, the trust has granted options to theemployees and directors in form of warrant which vest at the rate of 33.33% on each successive anniversary of thegrant date. The options can be exercised over a period of 5 years from the date of grant. Each warrant carries withit the right to purchase one equity share of the Company at the exercise price determined by the trust on the basisof fair value of the equity shares at the time of grant.
The details of the options are as under:
Particulars March 31, 2008 March 31, 2007
Options outstanding at the beginning of the year 489,120 1,220,000Options granted during the year - -Options lapsed during the year 6,620 18,480Options cancelled during the year 20,480 37,860Options exercised during the year 111,930 674,540Options outstanding at the end of the year 350,090 489,120
Out of the options outstanding at the end of year, 244,390 (previous year: 100,420) (Net of exercised & lapsed)options have vested, which have not been exercised.
(B) The Company has instituted “Employee Stock Option Plan 2004” (ESOP 2004) for its employees. In terms of the saidPlan, the compensation committee has granted options to employees of the Company. The options are dividedinto upfront options and performance options. The upfront options are divided into three sets which will entitleholders to subscribe to option shares at the end of first year, second year and third year. The vesting of theperformance options will be decided by the compensation Committee based on the performance of employees.
Particulars March 31, 2008 March 31, 2007
Options outstanding at the beginning of the year 5,677,701 10,219,860Options granted during the year - -Options lapsed during the year - -Options cancelled during the year - -Options exercised during the year - 4,542,159Options outstanding at the end of the year 5,677,701 5,677,701
Out of the options outstanding at the end of the year, there are 2,271,081 (previous year: Nil) (Net of exercised &lapsed) vested options which have not been exercised.
(C) The Company has instituted “Employee Stock Option Plan 2006 “(ESOP 2006) for the employees and directors ofTML and its subsidiary companies. In terms of the said plan, the compensation committee has granted options tothe employees of the Company. The vesting of the options is 10% , 15%, 20%, 25%,and 30 % of total optionsgranted after 12, 24, 36, 48 and 60 months, respectively from the date of grant. The maximum exercise period is 7years from the date of grant.
The details of the options are as under:
Particulars March 31, 2008 March 31, 2007
Options outstanding at the beginning of the year 4,493,116 4,612,380
Options granted during the year 72,000 656,625
Options lapsed during the year - -
Options cancelled during the year 337,850 402,890
Options exercised during the year 34,238 372,999
Options outstanding at the end of the year 4,193,028 4,493,116
Weighted average share price of the above options on the date of the exercise Rs. 83 Rs. 83

64
A N N U A L R E P O R T 2 0 0 7
Out of the options outstanding at the end of the year, 680,543 (previous year: 56,456) (Net of exercised & lapsed)options have vested which have not been exercised.
(D) The Company uses the intrinsic value-based method of accounting for stock options granted after April 1, 2005.Had the compensation cost for the Company’s stock based compensation plan been determined in the mannerconsistent with the fair value approach, the Company’s net income would be lower by Rs. 32 Million (previousyear: Rs. 10 Million) and earnings per share as reported would be lower as indicated below:
Rs. in Million except earning per share
Particulars March 31, 2008 March 31, 2007Net profit after tax and before exceptional item (As reported) 7,658 5,902Less: Exceptional items (4,401) (5,250)Net profit for the year 3,257 652Add: Provision in respect of earlier year written back 165 -Add: Excess provision for income-tax in respect of earlier yearwritten back - 339Net Profit 3,422 991Less: Total stock-based employee compensation expense
determined under fair value base method 32 10Adjusted net profit 3,390 981Basic earnings per share (in Rs.)
- As reported 28.21 8.62- Adjusted 27.94 8.53
Diluted earnings per share (in Rs.)- As reported 26.17 7.60- Adjusted 25.93 7.52
The fair value of each warrant is estimated on the date of grant basedon the following assumptions:Dividend yield (%) 6.60 6.89Expected life 5 years 5 yearsRisk free interest rate (%) 7.83 7.72Volatility (%) 55.28 62.69
22. As required under Accounting Standard 18 “Related Party Disclosures” (AS-18), following are details of transactionsduring the year with the related parties of the Company as defined in AS 18:
(a) List of Related Parties and Relationships
Name of Related Party RelationMahindra & Mahindra Ltd. Holding CompanyBritish Telecommunications, plc. Promoter holding more than 20% stakeTech Mahindra (Americas) Inc, USA 100% subsidiary companyTech Mahindra GmbH 100% Subsidiary companyTech Mahindra (Singapore) Pte Ltd. 100% Subsidiary companyTech Mahindra (R & D Services) Ltd. 100% Subsidiary companyTech Mahindra (Thailand) Ltd. 100% Subsidiary companyPT Tech Mahindra Indonesia 100% Subsidiary companyCanvasM Technologies Ltd. 80.10% Subsidiary companyiPolicy Networks Ltd. 100% Subsidiary companyCanvasM (Americas) Inc. 80.10% Subsidiary companyTech Mahindra (Malaysia) Sdn. Bhd 100% Subsidiary companyTech Mahindra (Beijing) IT Services Ltd. 100% Subsidiary companyTech Mahindra (R & D Services) Inc. 100% Subsidiary companyTech Mahindra Foundation 100% Subsidiary company
Mahindra Engineering and Chemical Products Ltd. Fellow Subsidiary CompanyMahindra Engineering Design and Development Company Ltd. Fellow Subsidiary CompanyBristlecone India Ltd. Fellow Subsidiary CompanyMahindra World City (Jaipur) Ltd. Fellow Subsidiary Company
Mr. Vineet Nayyar Key Management PersonnelVice Chairman, Managing Director and Chief Executive Officer

65
(b) Related Party Transactions for year ended March 31, 2008Rs. in Million
Transactions Promoter Subsidiary Fellow *Key Companies Companies Subsidiary Management
Companies Personnel
Reimbursement of Expenses (Net)- (92) 128 - -Paid/(Receipt) [(348)] [(276)] - -Income from Services & 24,060 901 3 - Management Fees [19,001] [1,387] [3] -Paid for Services Received 71 - - -
[(24)] - - -Project Transition Cost 233 - - -
[-] - - -Interest on Loan Given - 10 - -
[-] [10] [-] [-]Interest on Loan Taken - 38 - -
[-] [8] [-] [-]Sub-contracting Cost - 3,635 8 -
[-] [3,213] [21] [-]Dividend Paid - - - -
[1143] [-] [-] [1]Investment - 849 - -
[-] [276] [-] [-]Loan Given - 170 - -
[-] [-] [-] [-]Loan Given-Repaid - 270 - -
[-] [-] [-] [-]Loan received - 860 - -
[-] [390] [-] [-]Loan Received-Repaid - 600 - -
[-] [-] [-] [-]Salary and Perquisites - - - 24
[-] [-] [-] [24]Donation - 76 - -
[-] [56] [-] [-]Stock Options [-] [-] [-] [-]*
[-] [-] [-] [-]Rent Paid/Payable - 6 - [-]
[-] [6] [-] [-]Rent Received/Receivable - 4 - -
[-] [1] [-] [-]Deposit Paid - - - -
[-] [10] [-] [-]Deposit Received - 15 - -
[-] [-] [-] [-]Purchase of Fixed Asset 17 2 - -
[9] [-] [-] [-]Advance Given - - 57 -
[-] [4] [-] [-]Payment for Exclusivity / 4,401 - - -Upfront Discount [5,250] [-] [-] [-]Debit / (Credit) balances (Net)(inclusive of unbilled) outstanding 6,904 345 57 -as on March 31, 2008 [5,349] [236] [1] [-]
Figures in brackets “[ ]”are for previous year.
* Options exercised during the year are for Nil (previous year: 1,514,053) equity shares and options granted andoutstanding as at year end are 1,892,567 (previous year: 1,892,567).
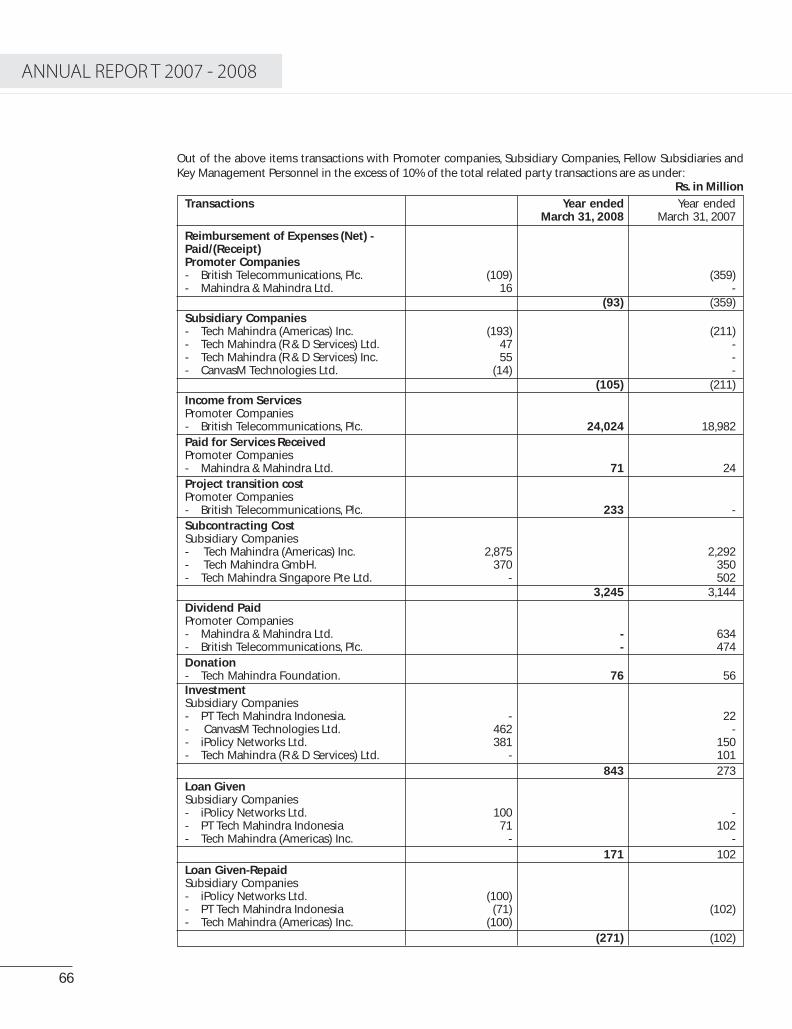
66
A N N U A L R E P O R T 2 0 0 7
Out of the above items transactions with Promoter companies, Subsidiary Companies, Fellow Subsidiaries andKey Management Personnel in the excess of 10% of the total related party transactions are as under:
Rs. in Million
Transactions Year ended Year endedMarch 31, 2008 March 31, 2007
Reimbursement of Expenses (Net) -Paid/(Receipt)Promoter Companies- British Telecommunications, Plc. (109) (359)- Mahindra & Mahindra Ltd. 16 -
(93) (359)Subsidiary Companies- Tech Mahindra (Americas) Inc. (193) (211)- Tech Mahindra (R & D Services) Ltd. 47 -- Tech Mahindra (R & D Services) Inc. 55 -- CanvasM Technologies Ltd. (14) -
(105) (211)Income from ServicesPromoter Companies- British Telecommunications, Plc. 24,024 18,982Paid for Services ReceivedPromoter Companies- Mahindra & Mahindra Ltd. 71 24Project transition costPromoter Companies- British Telecommunications, Plc. 233 -Subcontracting CostSubsidiary Companies- Tech Mahindra (Americas) Inc. 2,875 2,292- Tech Mahindra GmbH. 370 350- Tech Mahindra Singapore Pte Ltd. - 502
3,245 3,144Dividend PaidPromoter Companies- Mahindra & Mahindra Ltd. - 634- British Telecommunications, Plc. - 474Donation- Tech Mahindra Foundation. 76 56InvestmentSubsidiary Companies- PT Tech Mahindra Indonesia. - 22- CanvasM Technologies Ltd. 462 -- iPolicy Networks Ltd. 381 150- Tech Mahindra (R & D Services) Ltd. - 101
843 273Loan GivenSubsidiary Companies- iPolicy Networks Ltd. 100 -- PT Tech Mahindra Indonesia 71 102- Tech Mahindra (Americas) Inc. - -
171 102Loan Given-RepaidSubsidiary Companies- iPolicy Networks Ltd. (100)- PT Tech Mahindra Indonesia (71) (102)- Tech Mahindra (Americas) Inc. (100)
(271) (102)

67
Rs. in Million
Transactions Year ended Year endedMarch 31, 2008 March 31, 2007
Loan Received/ReceivableSubsidiary Companies- Tech Mahindra (R & D Services) Ltd. 860 (390)Loan Received-RepaidSubsidiary Companies- Tech Mahindra (R & D Services) Ltd. 600 -Deposit PaidSubsidiary Companies- Tech Mahindra (R & D Services) Ltd. - 10Deposit ReceivedSubsidiary Companies- CanvasM Technologies Ltd. 15 -Interest Received/ReceivableSubsidiary Companies- Tech Mahindra (Americas) Inc. 6 9- iPolicy Networks Ltd. 4 -- PT Tech Mahindra Indonesia - -
10 9Interest Paid/PayableSubsidiary Companies- Tech Mahindra (R & D Services) Ltd. 38 8Rent Paid/PayableSubsidiary Companies- Tech Mahindra (R & D Services) Ltd. 6 6Rent Received/ReceivablesSubsidiary CompaniesCanvasM Technologies Ltd. 4 1Fellow Subsidiary Company- Mahindra World City (Jaipur) Ltd 57 -Advances GivenSubsidiary Companies- Tech Mahindra (R & D Services) Ltd. - 4Purchase of Fixed AssetsPromoter Companies- Mahindra & Mahindra Ltd. - 9- British Telecommunications, Plc 16 -Exclusivity payment /Upfront DiscountPromoter Companies- British Telecommunications, plc. 4,401 5,250Salary and PerquisitesKey Management Personnel- Mr. Vineet Nayyar 24 24

68
A N N U A L R E P O R T 2 0 0 7
Other related parties of the Company are as under:
• First Choice Wheels Ltd. ( Earlierknown as Automartindia Ltd.) Fellow Subsidiary
• Bristlecone Ltd. Fellow Subsidiary
• Bristlecone Inc. Fellow Subsidiary
• Mahindra Consulting Engineers Ltd. Fellow Subsidiary
• Mahindra-BT Investment Company(Mauritius) Ltd. Holding company
• Bristlecone GmbH Fellow Subsidiary
• Bristlecone Singapore Pte. Ltd. Fellow Subsidiary
• Mahindra (China) TractorCompany Ltd. Fellow Subsidiary
• Mahindra Europe s.r.l. Fellow Subsidiary
• Mahindra Gujarat Tractor Ltd. Fellow Subsidiary
• Mahindra Holdings & Finance Ltd. Fellow Subsidiary
• Mahindra Holidays & ResortsIndia Ltd. Fellow Subsidiary
• Mahindra Holidays & Resorts(USA) Inc. Fellow Subsidiary
• Mahindra Insurance Brokers Ltd. Fellow Subsidiary
• Mahindra Intertrade Ltd. Fellow Subsidiary
• Bristlecone UK Ltd. Fellow Subsidiary
• Mahindra International Ltd. Fellow Subsidiary
• Mahindra Logisoft BusinessSolutions Ltd. Fellow Subsidiary
• Mahindra Middleeast ElectricalSteel Service Centre (FZE) Fellow Subsidiary
• Mahindra & Mahindra FinancialServices Ltd. Fellow Subsidiary
• Mahindra & Mahindra SouthAfrica (Pty) Ltd. Fellow Subsidiary
• Mahindra Overseas InvestmentCompany (Mauritius) Ltd. Fellow Subsidiary
• Mahindra Renault Pvt. Ltd. Fellow Subsidiary
• Mahindra Steel Service Centre Ltd. Fellow Subsidiary
• Mahindra Shubhlabh Services Ltd. Fellow Subsidiary
• Mahindra SAR Transmission Pvt. Ltd. Fellow Subsidiary
• Mahindra USA Inc. Fellow Subsidiary
• Mahindra Ugine Steel Company Ltd. Fellow Subsidiary
• NBS International Ltd. Fellow Subsidiary
• Stokes Group Ltd. Fellow Subsidiary
• Jensand Ltd. Fellow Subsidiary
• Stokes Forgings Dudley Ltd. Fellow Subsidiary
• Stokes Forgings Ltd. Fellow Subsidiary
• Plexion Technologies (UK) Ltd. Fellow Subsidiary
• Plexion Technologies GmbH Fellow Subsidiary
• Plexion Technologies Incorporated Fellow Subsidiary
• Mahindra Forgings International Ltd. Fellow Subsidiary
• Mahindra Forgings Global Ltd. Fellow Subsidiary
• Gesenkschmiede Schneider GmbH Fellow Subsidiary
• Falkenroth Umformtechnik GmbH Fellow Subsidiary
• Jeco-Jellinghaus GmbH Fellow Subsidiary
• Mahindra Forgings Europe AG Fellow Subsidiary
• Mahindra Hinoday Industries Ltd. Fellow Subsidiary
• Schöneweiss & Co. GmbH Fellow Subsidiary
• Mahindra Life Space Developers Ltd. Fellow Subsidiary
• Mahindra InfrastructureDevelopers Ltd. Fellow Subsidiary
• Mahindra Integrated Township Ltd. Fellow Subsidiary
• Mahindra World City Developers Ltd. Fellow Subsidiary
• Mahindra World City(Maharashtra) Ltd. Fellow Subsidiary
• MHR Hotel Management GmbH Fellow Subsidiary
• Bristlecone (Malaysia) Sdn Bhd Fellow Subsidiary
• Mahindra Automotive Ltd. Fellow Subsidiary
• Mahindra Castings Private Ltd. Fellow Subsidiary
• Mahindra Forgings Ltd. Fellow Subsidiary
• Mahindra Hotels and ResidencesIndia Ltd. Fellow Subsidiary
• Mahindra Holdings Ltd. Fellow Subsidiary
• Mahindra Logistics Ltd. Fellow Subsidiary
• Mahindra Rural HousingFinance Ltd. Fellow Subsidiary
• Mahindra Retail Private Ltd. Fellow Subsidiary
• Mahindra Technology Park Ltd. Fellow Subsidiary
• Punjab Tractors Ltd. Fellow Subsidiary
• Mahindra ResidentialDevelopers Ltd. Fellow Subsidiary
• Mahindra Aerospace Pvt. Ltd. Fellow Subsidiary
• Heritage Bird (M) Sdn Bhd Fellow Subsidiary
• Mahindra First ChoiceServices Ltd. Fellow Subsidiary
• Mahindra Graphic ResearchDesign srl Fellow Subsidiary
• Mahindra Navistar EnginesPrivate Ltd. Fellow Subsidiary
There have been no transactions with the aforesaid companies during the year.

69
23. (a) The tax effect of significant timing differences that has resulted in deferred tax assets and liabilities are givenbelow:
Rs. in Million
Particulars March 31, 2008 March 31, 2007
a) Deferred tax liability:
Depreciation (1) (1)
b) Deferred tax asset:
Gratuity, Leave Encashment etc. 14 11
Doubtful Debts 1 4
Total Deferred Tax Asset (Net) 14 14
(b) Consequent to completion of Income-tax assessments by the tax authorities in the United Kingdom for the financialyears 2001-02, 2002-03 and 2003-04 the Company has received tax refunds aggregating to Rs.321 Million (includinginterest aggregating to Rs.37 Million) in previous year. Accordingly, in previous year the excess provision for Income-tax relating to the aforesaid years has been written back to the profit and loss account and the interest received isdisclosed under Other Income.
24. Exchange Gain/(Loss)(Net) accounted during the year:
(a) The Company enters into foreign Exchange Forward Contracts and Currency Option Contracts to offset the foreigncurrency risk arising from the amounts denominated in currencies other than the Indian rupee. The counter partyto the Company’s foreign currency Forward Contracts and Currency Option Contracts is generally a bank. Thesecontracts are entered into to hedge the foreign currency risks of firm commitments. Forward Exchange Contractsand Currency Option Contracts in UK Pound exposure are split into two parts, which are GBP to USD andUSD to INR.
(b) The following are the outstanding GBP:USD Currency Exchange Contracts entered into by the company whichhave been designated as Cash Flow Hedges as on March 31, 2008:
Type of cover Amount outstanding Fair Value Gain/(Loss) Amount outstanding Exposure toat year end in (Rs. in Million) at year end Buy/SellForeign currency (Rs. in Million)(in Million)
Forward GBP 36 26 2,865 Sell(previous year: Nil) (previous year: Nil) (previous year: Nil)
Option GBP 292 920 23,217(previous year: Nil) (previous year: Nil) (previous year: Nil) Sell
(c) The following are the outstanding USD:INR Currency Exchange Contracts entered into by the company whichhave been designated as Cash Flow Hedges as on March 31, 2008:
Type of cover Amount outstanding Fair Value Gain/(Loss) Amount outstanding Exposure toat year end in (Rs in Million) at year end Buy/ SellForeign currency (Rs. in Million)(in Million)
Forward USD 318 (141) 12,738 Sell(previous year: Nil) (previous year: Nil) (previous year: Nil)
Option USD 539 46 21,625 Sell(previous year: Nil) (previous year: Nil) (previous year: Nil)

70
A N N U A L R E P O R T 2 0 0 7
The movement in hedging reserve during period ended March 31, 2008 for derivatives designated as Cash FlowHedges is as follows:
Particulars Year ended Year endedMarch 31, 2008 March 31, 2007
Balance at the beginning of the year - -
Gain/(Loss) transferred to income statement onoccurrence of forecasted hedge transaction - -
Changes in the fair value of effective portion of outstandingcash flow derivative 851 -
Net derivative Gain/(Loss) related to discounted cash flow hedge - -
Balance at the end of the year 851 -
(d) In addition to the above cash flow hedges, the Company has few outstanding Foreign Exchange Forward Contractsand Currency Options Contracts aggregating to Rs. 10,630 Million (previous year: Rs. 20,851 Million) whose fairvalue showed a gain of Rs. 184 Million (previous year: Rs. 151 Million), which do not qualify for hedge accountingand accordingly these are accounted as derivative instruments at fair value with changes in fair value recorded inthe profit and loss account.
(e) The year end foreign currency exposures that have not been specifically hedged by a derivative instrument orotherwise are given below:
Amounts receivable in foreign currency on account of the following:
Particulars Rs. in Million Foreign currency in Million
Current Year Previous Year
Debtors 3,272 GBP 34 GBP -(previous year: AUD 3 AUD -1481) CAD 2 CAD -
EUR 4 EUR 3NZD 3 NZD -SGD 1 SGD 5THB 0 THB 23USD - USD 25PHP 27 PHP -MYR 1 MYR -
Loans and advances 16 USD - USD 5(previous year: AUD 0 AUD -229) NZD 0 NZD -
SGD 0 SGD -TWD 0 TWD 0CAD 0 CAD -EUR 1 EUR 0
Cash/Bank balances (Net) 265 USD 4 USD -(previous year: AUD 1 AUD -99) NZD 1 NZD -
TWD 15 TWD 39PHP 13 PHP -CAD 0 CAD -EUR 0 EUR -

71
Amounts payable in foreign currency on account of the following:
Particulars Rs. in Million Foreign currency in MillionCurrent Year Previous Year
Creditors (Net) 672 EUR 2 EUR 3
(previous year: GBP 4 GBP 1
796) SGD 2 SGD 4
THB 1 THB 32
USD 4 USD 8
MYR 0 MYR -
PHP 0 PHP -
CNY 0 CNY -
AUD 0 AUD -
Other current liabilities (Net) 733 GBP 9 GBP 7
previous year: USD - USD 0
566)
(f ) Exchange Gain/(Loss)(Net) accounted during the year:Rs. in Million
Particulars March 31, 2008 March 31, 2007
Others 765 (155)
25. The public issue of the Company’s Equity Shares consisting of a fresh issue of 3,186,480 Equity Shares by the Companyand an offer for sale of 9,559,520 Equity Shares, by certain existing Shareholders was made pursuant to a prospectusdated August 11, 2006. The Equity Shares were issued for cash at a price of Rs.365 per Equity Share (including a securitiespremium of Rs.355 per Equity Share).
The statement of proceeds from the public issue and utilisation thereof is as under:
Particulars No. of shares Price Rs. in Million
Proceeds received after payment to selling shareholders 3,186,480 365 1,163
Less : Expenses (Net) relating to the issue after recoveryfrom the selling shareholders :
Professional fees 35
Advertising expenses 8Rates and taxes 1Miscellaneous expenses 1Printing and stationery 4Traveling expenses 3
Net Proceeds 1,111
Deployment up to March 31, 2008
Used for the capitailsation work at Hinjewadi 1,111
Total 1,111

72
A N N U A L R E P O R T 2 0 0 7
26. Particulars of loans/advances and investment in its own shares by listed companies, their subsidiaries, Associates, etc,required to be disclosed in the annual accounts of the Company pursuant to Clause 32 of the Listing Agreement
Loans and advances in the nature of loans to subsidiaries and investment in subsidiaries:Rs. in Million
Name of the Company Balance as on Maximum Investment inMarch 31, 2008 outstanding subsidiary
During the year
- Tech Mahindra (Americas) Inc. 100 218 -[218] [234] [-]
- PT Tech Mahindra Indonesia - 35 -[-] [102] [22]
iPolicy Networks Ltd. - 94 381[-] [-] [150]
Tech Mahindra (R & D Services) Ltd. - - 21[-] [-] [101]
CanvasM Technologies Ltd. - - 462[-] [-] [-]
Tech Mahindra (Malaysia) SDN. BHD - - 4[-] [-] [-]
Tech Mahindra (Beijing) IT Services Ltd. - - 3[-] [-] [-]
Figures in brackets “[ ]” indicate previous year figures.
There are no loans and advances in the nature of loans to associates, loans and advances in the nature of loans wherethere is no repayment schedule or repayment beyond seven years or no interest or interest under section 372A of theCompanies Act, 1956 and loans and advances in the nature of loans to firms/companies in which directors are interested.
27. Earning Per Share is calculated as follows:Rs. in Million except earning per share
Particulars Year ended Year endedMarch 31, 2008 March 31, 2007
Profit after taxation and before exceptional item 7,658 5,902Less: Exceptional items 4,401 5,250
Profit after taxation and exceptional item 3,257 652
Add: Provision in respect of earlier year written back 165 -Add: Excess provision for tax in respect of earlier year written back - 339
Net Profit attributable to shareholders 3,422 991
Equity Shares outstanding as at the year end (in nos.) 121,362,869 121,216,701Weighted average Equity Shares outstanding as at the year end ( in nos.) 121,292,103 115,071,417Weighted average number of Equity Shares used as denominator forcalculating Basic Earnings Per Share 121,292,103 115,071,417Add: Diluted number of SharesESOP outstanding at the end of the year. 9,427,640 15,381,480Number of Equity Shares used as denominator for calculating DilutedEarnings Per Share 130,719,743 130,452,897Nominal Value per Equity Share (in Rs.) 10.00 10.00Earning Per ShareBefore exceptional item.
Earnings Per Share (Basic) (in Rs.) 64.49 54.24Earnings Per Share (Diluted) (in Rs.) 59.84 47.84
After exceptional item
Earnings Per Share (Basic) (in Rs.) 28.21 8.62Earnings Per Share (Diluted) (in Rs.) 26.17 7.60

73
Signatures to Schedules I to XIII
For Deloitte Haskins & Sells For Tech Mahindra LimitedChartered Accountants
Anand G. Mahindra Vineet NayyarChairman Vice Chairman, Managing Director & CEO
Hon. Akash Paul Al-Noor Ramji Bharat DoshiDirector Director Director
Hemant M. Joshi Clive Goodwin Dr. Raj Reddy Ulhas N. YargopPartner Director Director Director
Vikrant GandheAsst. Company Secretary
Pune, Dated: Boston, Dated: May 19, 2008
28. Based on the information available with the Company, no creditors have been identified as “supplier” within the meaningof “ Micro, Small and Medium Enterprises Development (MSMED) Act 2006”.
29. Current tax includes taxes for foreign branches amounting to Rs. 190 Million (previous year: Rs. 128 Million)
30. Details of Investments purchased and sold during the year:
March 31, 2008
Cost Rs. inTYPE OF FUND Units Million
ICICI PRUDENTIAL MUTUAL FUND:28 ICICI Prudential’s Flexible Income Plan 14,229,879 150
ABN AMRO MUTUAL FUND:ABN AMRO Flexible Short Term Plan Ser. B Qtly Div - Reinvested 5,235,029 52ABN AMRO Money Plus Institutional Weekly Dividend 5,240,770 52
BIRLA SUNLIFE MUTUAL FUND:Birla Sun Life Liquid Plus - Institutional Daily Dividend – Reinvestment 39,972,818 400Birla Sun Life Liquid Plus – Institutional - Weekly Dividend- Reinvested 4,712,065 47
DBS CHOLA MUTUAL FUND:DBS Chola FMP - Series 7 (Quarterly Plan - 4) - Dividend 5,085,445 51
DSP MERRILL LYNCH MUTUAL FUND:DSP Merrill Lynch Liquid Plus Institutional Plan - Daily Dividend 399,780 400
GRINDLAYS MUTUAL FUND:Grindlays Cash Fund - Institutional Plan B - Daily Dividend 5,173,225 55Grindlays Floating Rate Fund - LT Institutional Plan B - Weekly Dividend 5,476,371 55
HSBC MUTUAL FUND:HSBC Liquid Plus - Institutional Plus - Weekly Dividend 5,406,969 54
JM MUTUAL FUND:JM Fixed Maturity fund - Series V - Quarterly Plan 4 - Institutional Dividend Plan 10,370,469 104JM Fixed Maturity Fund - Series V - Quarterly Plan 4 - Institutional Dividend Plan 10,569,489 106JM Money Manager Fund - Super Plus Plan - Weekly Dividend 10,682,893 107
KOTAK MUTUAL FUND:Kotak Flexi Debt Scheme - Quarterly Dividend 5,354,364 55Kotak Flexi Debt Scheme Daily Dividend 44,860,484 450Kotak Liquid (Institutional Premium) - Daily Divided 4,470,643 55
RELIANCE MUTUAL FUND:Reliance Liquid Plus Fund - Institutional Tenor Fund Plan A - Growth Plan 49,941 50
11. Previous year’s figures have been regrouped wherever necessary, to confirm to the current year’s classification.
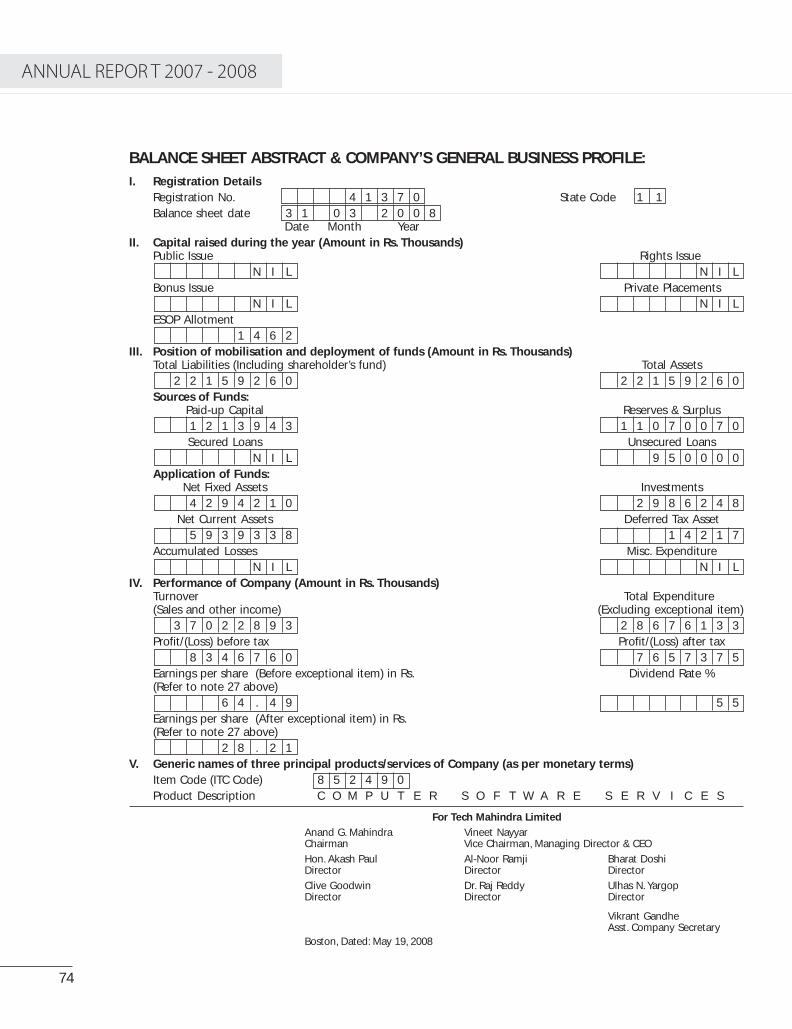
74
A N N U A L R E P O R T 2 0 0 7
BALANCE SHEET ABSTRACT & COMPANY’S GENERAL BUSINESS PROFILE:
I. Registration DetailsRegistration No. 4 1 3 7 0 State Code 1 1Balance sheet date 3 1 0 3 2 0 0 8
Date Month YearII. Capital raised during the year (Amount in Rs. Thousands)
Public Issue Rights IssueN I L N I L
Bonus Issue Private PlacementsN I L N I L
ESOP Allotment1 4 6 2
III. Position of mobilisation and deployment of funds (Amount in Rs. Thousands)Total Liabilities (Including shareholder’s fund) Total Assets
2 2 1 5 9 2 6 0 2 2 1 5 9 2 6 0Sources of Funds:
Paid-up Capital Reserves & Surplus1 2 1 3 9 4 3 1 1 0 7 0 0 7 0Secured Loans Unsecured Loans
N I L 9 5 0 0 0 0Application of Funds:
Net Fixed Assets Investments4 2 9 4 2 1 0 2 9 8 6 2 4 8
Net Current Assets Deferred Tax Asset5 9 3 9 3 3 8 1 4 2 1 7
Accumulated Losses Misc. ExpenditureN I L N I L
IV. Performance of Company (Amount in Rs. Thousands)Turnover Total Expenditure(Sales and other income) (Excluding exceptional item)
3 7 0 2 2 8 9 3 2 8 6 7 6 1 3 3Profit/(Loss) before tax Profit/(Loss) after tax
8 3 4 6 7 6 0 7 6 5 7 3 7 5Earnings per share (Before exceptional item) in Rs. Dividend Rate %(Refer to note 27 above)
6 4 . 4 9 5 5Earnings per share (After exceptional item) in Rs.(Refer to note 27 above)
2 8 . 2 1V. Generic names of three principal products/services of Company (as per monetary terms)
Item Code (ITC Code) 8 5 2 4 9 0Product Description C O M P U T E R S O F T W A R E S E R V I C E S
For Tech Mahindra Limited
Anand G. Mahindra Vineet NayyarChairman Vice Chairman, Managing Director & CEO
Hon. Akash Paul Al-Noor Ramji Bharat DoshiDirector Director Director
Clive Goodwin Dr. Raj Reddy Ulhas N. YargopDirector Director Director
Vikrant GandheAsst. Company Secretary
Boston, Dated: May 19, 2008

75
Stat
emen
t p
urs
uan
t to
Sec
tio
n 2
12 o
f th
e C
om
pan
ies
Act
, 195
6 re
lati
ng
to
su
bsi
dia
ry c
om
pan
ies.
Nam
es o
f th
e S
ub
sid
iary
Co
mp
anie
s
Tech
Tech
Tech
Tech
Tech
Tech
Mah
indr
aTe
chM
ahin
dra
Mah
indr
aM
ahin
dra
Tech
Mah
indr
aPa
rtic
ular
sM
ahin
dra
Tech
(Si
ngap
ore)
Mah
indr
aTe
ch(R
& D
(R&
D (R
&D
Pt T
ech
Canv
asM
Canv
asM
iPol
icy
Mah
indr
a(B
eijin
g)(A
mer
icas
)M
ahin
dra
Pte
( Th
aila
nd)
Mah
indr
aSe
rvic
es)
Serv
ices
)Se
rvic
es)
Mah
indr
aTe
chno
logi
esA
mer
icas
Net
wor
ks(M
alay
sia)
IT S
ervi
ces
Inc.
Gm
bHLi
mit
edLi
mit
edFo
unda
tion
Lim
ited
Inc.
Pte
Lim
ited
Indo
nesi
aLi
mit
edIn
c.Li
mit
edSD
N. B
HD
Lim
ited
The
Fina
ncia
l Yea
r of
Mar
ch 3
1,M
arch
31,
Mar
ch 3
1,M
arch
31,
Mar
ch 3
1,M
arch
31,
Mar
ch 3
1,M
arch
31,
Mar
ch 3
1,M
arch
31,
Mar
ch 3
1,M
arch
31,
Mar
ch 3
1,M
arch
31,
the
Subs
idai
ry e
nded
on
2008
2008
2008
2008
2008
2008
2008
2008
2008
2008
2008
2008
2008
2008
US
$Eu
roSG
DTH
BIN
RIN
RU
S $
SGD
US
$IN
RU
S $
INR
RMRM
B
Num
ber
of s
hare
s of
the
subs
idai
ry c
ompa
ny h
eld
by T
ech
Mah
indr
a Li
mite
dat
the
abo
ve d
ate
Equi
ty37
5,00
03
5,00
050
,000
50,0
009,
206,
700
500,
000
-50
0,00
04,
619,
631
80.1
019
,536
,940
312,
820
469,
340
Exte
nt o
f hol
ding
100%
100%
100%
100%
100%
100%
100%
-10
0%80
.10%
80.1
0%10
0%10
0%10
0%
The
net
Aggr
egat
e of
prof
its/lo
sses
of
the
Subs
idia
ry c
ompa
ny f
or it
sfin
anci
al y
ear
so fa
r as
the
yco
ncer
n th
e m
embe
rsof
Tec
h M
ahin
dra
Lim
ited
a)D
ealt
with
in t
heac
coun
ts o
f Tec
hM
ahin
dra
for
the
Year
ende
d M
arch
31,
200
8
b)N
ot d
ealt
with
in t
heac
coun
ts o
f Tec
hM
ahin
dra
for
the
Year
ende
d M
arch
31,
200
82,
598,
974
350,
528
494,
354
4,20
7,79
5-
(60,
238,
158)
246,
903
-27
6,31
28,
329,
319
36,2
66(4
0,69
8,45
2)37
,953
(443
,023
)
The
Net
Agg
rega
te o
fpr
ofits
/loss
es o
f th
eSu
bsid
iary
com
pany
for
its p
revi
ous
finan
cial
yea
rso
far
as t
hey
conc
ern
the
mem
bers
of
Tech
Mah
indr
a Li
mite
d
a)D
ealt
with
in t
heac
coun
ts o
f Tec
hM
ahin
dra
for
the
Year
end
edM
arch
31,
200
7
b)N
ot d
ealt
with
inth
e ac
coun
ts o
f Tec
hM
ahin
dra
for
the
Year
ende
d M
arch
31,
200
71,
578,
202
350,
163
969,
809
3,49
0,92
88,
458,
399
93,0
56,0
4823
4,17
61,
331
844,
976
3,47
0,57
1-
(113
,339
,980
)-
-
For
Tech
Mah
ind
ra L
imit
ed
An
and
G. M
ahin
dra
Vin
eet
Nay
yar
Ch
airm
anV
ice
Ch
airm
an, M
anag
ing
Dir
ecto
r &
CEO
Ho
n. A
kash
Pau
lA
l-N
oo
r R
amji
Bh
arat
Do
shi
Dir
ecto
rD
irec
tor
Dir
ecto
r
Cliv
e G
oo
dw
inD
r. R
aj R
edd
yU
lhas
N. Y
arg
op
Dir
ecto
rD
irec
tor
Dir
ecto
r
Vik
ran
t G
and
he
Ass
t. C
om
pan
y Se
cret
ary
Bo
sto
n, D
ated
: May
19,
200
8

ConnectNow encourages a collaborative work culture that enables teams to
share knowledge, ideas and thoughts. Through a sound network of processes
and expertise, collaborative working reduces rework, facilitates agile deliveries,
drives innovation and improves customer orientation.Our Co-location center in
Pune is an example of collaborative working with partner vendors who service a
common customer.
Co- locate and collaborate
9
C km y

77
Auditors’ Report
To the Board of Directors of Tech Mahindra Limited
1. We have audited the attached Consolidated Balance Sheet of TECH MAHINDRA LIMITED and its subsidiaries as atMarch 31, 2008, and also the Consolidated Profit and Loss account for the year ended on that date and theConsolidated Cash Flow Statement for the year ended on that date, annexed thereto. These consolidated financialstatements are the responsibility of the Company’s management and have been prepared by the management onthe basis of separate financial statements and other financial information regarding components. Our responsibilityis to express an opinion on these financial statements based on our audit.
2. We conducted our audit in accordance with the auditing standards generally accepted in India. Those Standardsrequire that we plan and perform the audit to obtain reasonable assurance about whether the financial statementsare free of material misstatement. An audit includes examining, on a test basis, evidence supporting the amountsand disclosures in the financial statements. An audit also includes assessing the accounting principles used andsignificant estimates made by management, as well as evaluating the overall financial statement presentation. Webelieve that our audit provides a reasonable basis for our opinion.
3. We did not audit the financial statements of the subsidiaries, whose financial statements reflect total assets ofRs. 832 million as at March 31, 2008 total revenues of Rs. 2,089 million for the year ended March 31, 2008 and netcash outflows of Rs. 40 million for the year ended March 31, 2008. These financial statements and other financialinformation have been subjected to audit by other auditors whose reports have been furnished to us and ouropinion is based solely on the reports of other auditors.
4. We report that the consolidated financial statements have been prepared by the Company in accordance with therequirements of Accounting Standard (AS) 21 on, Consolidated Financial Statements, notified under the Companies(Accounting Standards) Rules, 2006 (the rules).
5. Based on our audit and on consideration of reports of other auditors on separate financial statements and on theother financial information of the components, and to the best of our information and according to the explanationgiven to us, we are of the opinion that the attached consolidated financial statements give a true and fair view inconformity with the accounting principles generally accepted in India:
(a) in the case of the Consolidated Balance Sheet, of the state of affairs of Tech Mahindra Limited and its subsidiariesas at March 31, 2008;
(b) in the case of the Consolidated Profit and Loss Account, of the profit for the year ended on that date; and
(c) in the case of the Consolidated Cash Flow Statement, of the cash flows for the year ended on that date.
Deloitte Haskins and SellsChartered Accountants
Hemant M. JoshiPune, PartnerDated: 21st May, 2008 Membership No. 38019
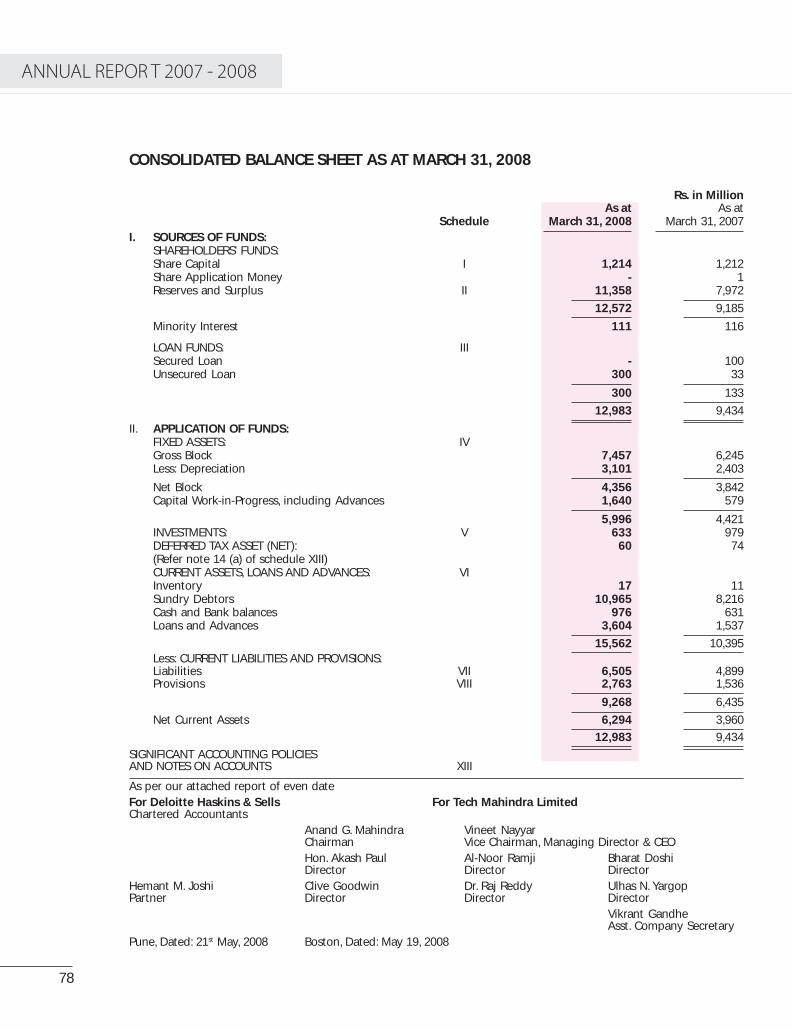
78
A N N U A L R E P O R T 2 0 0 7
CONSOLIDATED BALANCE SHEET AS AT MARCH 31, 2008
Rs. in MillionAs at As at
Schedule March 31, 2008 March 31, 2007I. SOURCES OF FUNDS:
SHAREHOLDERS’ FUNDS:Share Capital I 1,214 1,212Share Application Money - 1Reserves and Surplus II 11,358 7,972
12,572 9,185
Minority Interest 111 116
LOAN FUNDS: IIISecured Loan - 100Unsecured Loan 300 33
300 133
12,983 9,434
II. APPLICATION OF FUNDS:FIXED ASSETS: IVGross Block 7,457 6,245Less: Depreciation 3,101 2,403
Net Block 4,356 3,842Capital Work-in-Progress, including Advances 1,640 579
5,996 4,421INVESTMENTS: V 633 979DEFERRED TAX ASSET (NET): 60 74(Refer note 14 (a) of schedule XIII)CURRENT ASSETS, LOANS AND ADVANCES: VIInventory 17 11Sundry Debtors 10,965 8,216Cash and Bank balances 976 631Loans and Advances 3,604 1,537
15,562 10,395Less: CURRENT LIABILITIES AND PROVISIONS:Liabilities VII 6,505 4,899Provisions VIII 2,763 1,536
9,268 6,435
Net Current Assets 6,294 3,960
12,983 9,434
SIGNIFICANT ACCOUNTING POLICIESAND NOTES ON ACCOUNTS XIII
As per our attached report of even dateFor Deloitte Haskins & Sells For Tech Mahindra LimitedChartered Accountants
Anand G. Mahindra Vineet NayyarChairman Vice Chairman, Managing Director & CEOHon. Akash Paul Al-Noor Ramji Bharat DoshiDirector Director Director
Hemant M. Joshi Clive Goodwin Dr. Raj Reddy Ulhas N. YargopPartner Director Director Director
Vikrant GandheAsst. Company Secretary
Pune, Dated: 21st May, 2008 Boston, Dated: May 19, 2008

79
CONSOLIDATED PROFIT AND LOSS ACCOUNT FOR THE YEAR ENDED MARCH 31, 2008
Rs. in Million except earnings per share
Year ended Year endedSchedule March 31, 2008 March 31, 2007
INCOME:Income from operations 37,661 29,290Other Income IX 1,044 60
Total Income 38,705 29,350
EXPENDITURE:Personnel X 15,599 11,134Operating and Other expenses XI 13,805 10,773Depreciation IV 796 515Interest XII 62 61
30,262 22,483
PROFIT BEFORE TAX, MINORITY INTERESTAND EXCEPTIONAL ITEM 8,443 6,867Provision for Taxation
- Current tax (689) (648)- Deferred tax 15 (36)- Fringe benefit tax (74) (56)
PROFIT AFTER TAX AND BEFORE MINORITYINTEREST AND EXCEPTIONAL ITEM 7,695 6,127Exceptional item 4,401 5,250(Refer note 8 of schedule XIII)Minority Interest Share in (Profit)/Loss 5 (1)
NET PROFIT FOR THE YEAR 3,299 876Excess Provision for income-tax in respect of earlier year written back - 339(Refer note 14 (b) of schedule XIII)Balance brought forward from previous year 4,644 4,699
Balance available for appropriation 7,943 5,914Interim Dividend - I - (90)Interim Dividend - II - (176)Final Dividend (668) -Dividend Tax (113) (37)Transfer to General Reserve (1,700) (65)
Balance Carried to Balance Sheet 5,462 5,546
Earning Per Share (Refer note 17 of schedule XIII)Before exceptional item (in Rs.)
- Basic 63.49 56.18- Diluted 58.91 49.56
After exceptional item (in Rs.)- Basic 27.20 10.56- Diluted 25.24 9.32
SIGNIFICANT ACCOUNTING POLICIESAND NOTES ON ACCOUNTS XIIIAs per our attached report of even dateFor Deloitte Haskins & Sells For Tech Mahindra LimitedChartered Accountants
Anand G. Mahindra Vineet NayyarChairman Vice Chairman, Managing Director & CEOHon. Akash Paul Al-Noor Ramji Bharat DoshiDirector Director Director
Hemant M. Joshi Clive Goodwin Dr. Raj Reddy Ulhas N. YargopPartner Director Director Director
Vikrant GandheAsst. Company Secretary
Pune, Dated: 21st May, 2008 Boston, Dated: May 19, 2008

80
A N N U A L R E P O R T 2 0 0 7
CONSOLIDATED CASH FLOW FOR THE YEAR ENDED MARCH 31, 2008Rs. in Million
Year Ended Year EndedParticulars March 31, 2008 March 31, 2007
A. Cash flow from operating activities:
Net profit before taxation and exceptional item 8,443 6,867
Less:
Exceptional item (4,401) (5,250)
4,042 1,617
Adjustments for:
Depreciation 796 515
Loss on sale of fixed assets, (net) 4 2
Interest expense 62 61
Decrease in fair value of current investment - -
Exchange Loss/(Gain) (Net) (251) 63
Currency translation adjustment 7 5
Dividend from current investments (70) (66)
Interest income (46) (88)
Profit on sale of current investments (43) (14)
459 478
Operating profit before working capital changes 4,501 2,095
Adjustments for:
Trade and other receivables (3,589) (4,716)
Trade and other payables 2,033 3,282
(1,556) (1,434)
Cash generated from operations before tax 2,945 661
Income taxes paid (999) (324)
(999) (324)
Net cash from/(used in) operating activities 1,946 337
B. Cash flow from investing activities:
Additional consideration on acquisition of subsidiary 98 -
Purchase of fixed assets (2,394) (1,941)
Acquisition of business (net of cash) - 10
Purchase of current investments (5,021) (6,147)
Sale of current investments 5,410 6,687
Sale of fixed assets 3 3
Interest received 48 80
Dividend on current investments received 61 66
Net cash from/(used in) investing activities (1,795) (1,242)

81
C. Cash flow from financing activities:
Proceeds from issue of shares(including securities premium) 11 951
Issue of equity shares - 1,163
Dividend (including dividend tax paid) - (1,347)
Payment of principal on car lease (14) -
Proceeds from borrowing 167 133
Interest paid (62) (61)
Net cash from/(used in) financing activities 102 839
Net increase/(decrease) in cash andcash equivalents (A+B+C) 253 (66)
Cash and cash equivalents at the beginningof the period 674 740
Cash and cash equivalents at the end of the period 927 674
Notes:
1. Components of cash and cash equivalents include cash, bank balances in current and deposit accounts as disclosedunder schedule VI (b) of the accounts.
2. Purchase of fixed assets are stated inclusive of movements of capital work-in-progress between the commencementand end of the year and are considered as part of investing activity.
March 31, 2008 March 31, 2007
3. Cash and cash equivalents:
Cash and Bank balances 976 631
Unrealised (Gain)/Loss on foreign currency cashand cash equivalents (49) 43
Total cash and cash equivalents 927 674
4. Cash and cash equivalents include equity share application money of Rs. Nil (previous year Rs. 1 million) andunclaimed dividend of Rs. 1 million (previous year Rs. 1 million).
CONSOLIDATED CASH FLOW FOR THE YEAR ENDED MARCH 31, 2008 (Contd.)Rs. in Million
As at As atParticulars March 31, 2008 March 31, 2007
As per our attached report of even dateFor Deloitte Haskins & Sells For Tech Mahindra LimitedChartered Accountants
Anand G. Mahindra Vineet NayyarChairman Vice Chairman, Managing Director & CEOHon. Akash Paul Al-Noor Ramji Bharat DoshiDirector Director Director
Hemant M. Joshi Clive Goodwin Dr. Raj Reddy Ulhas N. YargopPartner Director Director Director
Vikrant GandheAsst. Company Secretary
Pune, Dated: 21st May, 2008 Boston, Dated: May 19, 2008

82
A N N U A L R E P O R T 2 0 0 7
Schedules forming part of the Consolidated Balance Sheet
Rs. in Million
As at As atMarch 31, 2008 March 31, 2007
Schedule ISHARE CAPITAL:
Authorised :
175,000,000 (previous year: 175,000,000) Equity Shares of Rs.10/-(previous year: Rs. 10/-) each 1,750 1,750
1,750 1,750
Issued subscribed and paid up:
121,362,869 (previous year: 121,216,701) Equity Shares of Rs. 10/- 1,214 1,212(previous year Rs.10/-) each fully paid-up
1,214 1,212
Notes:
1. Out of the above 9,931,638 (previous year: 9,931,638) Equity Shares of Rs. 10/- (previous year: Rs. 10/- paid-up) eachfully paid-up are held by Mahindra BT Investment Company (Mauritius) Limited, a subsidiary of Mahindra andMahindra Limited and 53,776,252 (previous year: 53,776,252) Equity Shares of Rs. 10/- each (previous year:Rs. 10/- each) are held by Mahindra & Mahindra Limited, the ultimate holding company.
2. The above includes 51,000,100 and 25,000,000 Equity Shares originally of Rs. 2/- each issued as fully paid-up bonusshares by capitalisation of balance of profit and loss account and general reserve, respectively.
3. The above includes 90,148,459 Equity Shares of Rs. 10/- each allotted as fully paid-up bonus shares by way ofcapitalisation of profit and loss account (Refer note 5 of schedule XIII).
4. The above includes 5 Equity Shares of Rs. 2/- each consolidated into 1 Equity Share of Rs. 10/- each (Refer note 5 ofschedule XIII)
5. Refer note 12 of schedule XIII for stock options.

83
Schedules forming part of the Consolidated Balance Sheet
Rs. in Million
As at As atMarch 31, 2008 March 31, 2007
Schedule II
RESERVES AND SURPLUS:
General Reserve:
As per last Balance Sheet 1,014 949
Add: Transfer from Profit and Loss Account 1,700 65
2,714 1,014
Securities Premium:
As per last Balance Sheet 2,293 283
Add: Received during the year 10 2,010
2,303 2,293
Currency Translation Reserve
As per last Balance Sheet 21 17
Addition during the year 7 4
28 21
Profit/(Loss) on cash flow Hedges(Refer note 1(l) (iii) of schedule XIII) 851 -Balance in Profit and Loss Account 5,462 5,546
Less: Capitalised on issue of Bonus shares(Refer note 5 of schedule XIII) - 902
5,462 4,644
11,358 7,972
Schedule III
LOAN FUNDS:
Secured Loan:
- Cash Credit from bank - 100 (Refer note 1 and 2 below)
- 100
Note:
1. Loan from bank is secured by way of hypothecationof current assets including book debts
2. Net of current account balance of Rs. Nil(previous year: Rs. 112 Million) as per sweep facilitywith the bank
Unsecured Loan:
Overdraft from bank 300 33
300 33

84
A N N U A L R E P O R T 2 0 0 7
Sch
edu
les
form
ing
par
t o
f th
e C
on
solid
ated
Bal
ance
Sh
eet
Sch
edu
le I
V
FIX
ED A
SSET
S:
Rs.
in
Mil
lio
n
GR
OSS
BLO
CK
DEP
REC
IAT
ION
NET
BLO
CK
Des
crip
tion
of
Ass
ets
Cost
as
atA
ddit
ions
Ded
ucti
ons
Cost
as
atU
pto
For
the
Ded
ucti
ons
Upt
oA
s at
As
atA
pril
01,
duri
ngdu
ring
Mar
ch 3
1,M
arch
31,
year
duri
ngM
arch
31,
Mar
ch 3
1,M
arch
31,
2007
the
yea
r t
he y
ear
200
820
07 t
he y
ear
2008
2008
2007
Go
od
will
on
co
nso
lidat
ion
1,00
921
-1
,03
0-
--
-1
,03
01,
009
Leas
ed A
sset
s:
Veh
icle
s67
-17
50
3813
1239
11
29
(Ref
er n
ote
10
of
sch
edu
le X
III)
Oth
er A
sset
s:
Free
ho
ld L
and
174
--
17
4-
--
-1
74
174
Leas
eho
ld L
and
221
210
-4
31
15
-6
42
522
0
Leas
eho
ld I
mp
rove
men
ts83
195
-2
78
654
-60
21
877
Off
ice
Bu
ildin
g/P
rem
ises
1,59
8-
-1
,59
857
810
7-
685
91
31,
020
Co
mp
ute
rs1,
414
500
801
,83
484
935
679
1,12
67
08
565
Plan
t an
d M
ach
iner
y87
926
22
1,1
39
461
141
260
05
39
418
Furn
itu
re a
nd
Fix
ture
s68
212
65
80
344
998
454
32
60
233
Veh
icle
s42
31
44
1811
128
16
24
Inta
ng
ible
Ass
ets:
Inte
llect
ual
pro
per
ty r
igh
ts76
--
76
311
-14
62
73
(Ref
er n
ote
19
of
sch
edu
le X
III)
Tota
l6
,24
51
,31
71
05
7,4
57
2,4
03
79
69
83
,10
14
,35
63,
842
Prev
iou
s ye
ar4,
580
1,68
722
6,24
51,
905
515
172,
403
Cap
ital
Wo
rk-i
n-P
rog
ress
(in
clu
de
cap
ital
ad
van
ces
Rs.
1,6
35
Mil
lio
n)#
(pre
vio
us
year
: Rs.
544
Mill
ion
)1,
640
579
Tota
l5
,99
64,
421
No
te:
1)Fi
xed
Ass
ets
incl
ud
e ce
rtai
n l
ease
d v
ehic
les
agg
reg
atin
g t
o R
s.1
4 M
illi
on
(p
revi
ou
s ye
ar: R
s.38
Mill
ion
) (a
t co
st)
on
wh
ich
ven
do
rs h
ave
a lie
n.
#2)
Incl
ud
es c
apit
al a
dva
nce
of
Rs.
25
4 M
illi
on
(p
revi
ou
s ye
ar: R
s. N
il) p
aid
to
war
ds
pu
rch
ase
of
leas
eho
ld la
nd
an
d b
uild
ing
co
nst
ruct
ed o
n it
an
din
clu
sive
of
pla
nt
and
mac
hin
ery
(pro
per
ty)
un
der
an
au
ctio
n t
hro
ug
h D
ebt
Rec
ove
ry T
rib
un
al (
DR
T),
New
Del
hi.
The
ow
ner
of
the
pro
per
ty h
asfil
ed a
n a
pp
eal b
efo
re T
he
Ho
n’b
le D
ebt
Rec
ove
ry A
pp
ealla
te T
rib
un
al (
DR
AT
) ag
ain
st t
he
auct
ion
. DR
AT v
ide
its
ord
er d
ated
Oct
ob
er 9
, 200
7, h
asd
irec
ted
th
at t
he
auct
ion
can
pro
ceed
bu
t th
e co
nfir
mat
ion
of
the
sale
sh
all
be
sub
ject
to
fu
rth
er o
rder
s b
y D
RAT
.
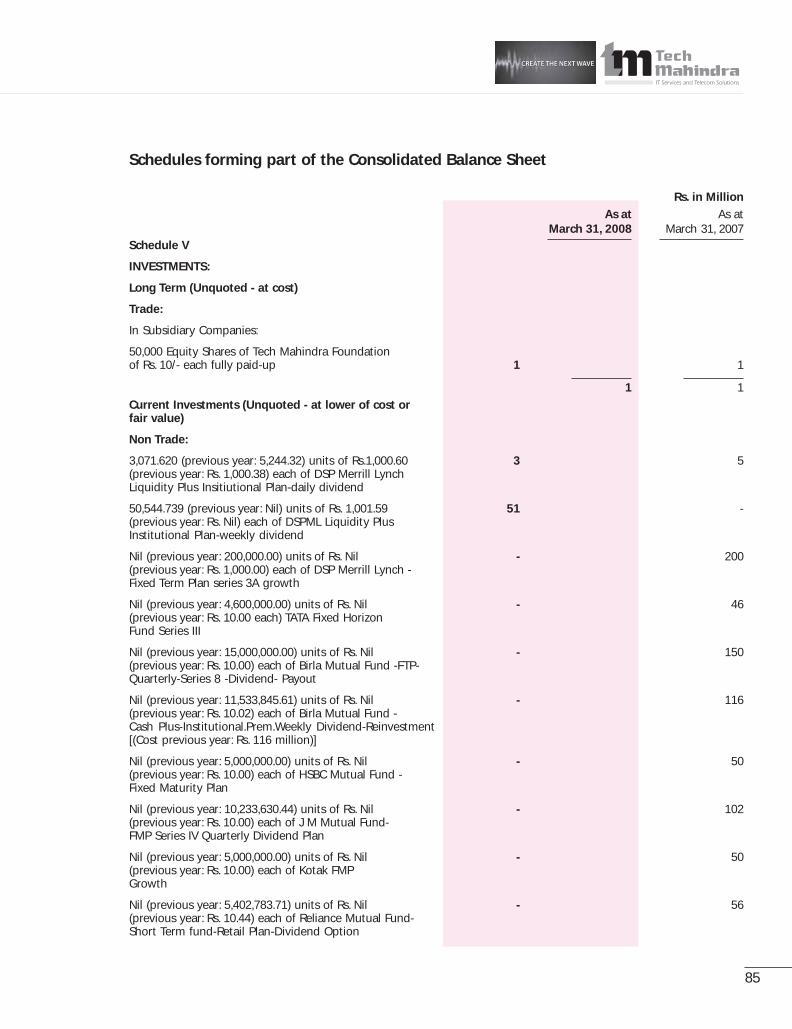
85
Schedules forming part of the Consolidated Balance Sheet
Rs. in Million
As at As atMarch 31, 2008 March 31, 2007
Schedule V
INVESTMENTS:
Long Term (Unquoted - at cost)
Trade:
In Subsidiary Companies:
50,000 Equity Shares of Tech Mahindra Foundationof Rs. 10/- each fully paid-up 1 1
1 1
Current Investments (Unquoted - at lower of cost orfair value)
Non Trade:
3,071.620 (previous year: 5,244.32) units of Rs.1,000.60 3 5(previous year: Rs. 1,000.38) each of DSP Merrill LynchLiquidity Plus Insitiutional Plan-daily dividend
50,544.739 (previous year: Nil) units of Rs. 1,001.59 51 -(previous year: Rs. Nil) each of DSPML Liquidity PlusInstitutional Plan-weekly dividend
Nil (previous year: 200,000.00) units of Rs. Nil - 200(previous year: Rs. 1,000.00) each of DSP Merrill Lynch -Fixed Term Plan series 3A growth
Nil (previous year: 4,600,000.00) units of Rs. Nil - 46(previous year: Rs. 10.00 each) TATA Fixed HorizonFund Series III
Nil (previous year: 15,000,000.00) units of Rs. Nil - 150(previous year: Rs. 10.00) each of Birla Mutual Fund -FTP-Quarterly-Series 8 -Dividend- Payout
Nil (previous year: 11,533,845.61) units of Rs. Nil - 116(previous year: Rs. 10.02) each of Birla Mutual Fund -Cash Plus-Institutional.Prem.Weekly Dividend-Reinvestment[(Cost previous year: Rs. 116 million)]
Nil (previous year: 5,000,000.00) units of Rs. Nil - 50(previous year: Rs. 10.00) each of HSBC Mutual Fund -Fixed Maturity Plan
Nil (previous year: 10,233,630.44) units of Rs. Nil - 102(previous year: Rs. 10.00) each of J M Mutual Fund-FMP Series IV Quarterly Dividend Plan
Nil (previous year: 5,000,000.00) units of Rs. Nil - 50(previous year: Rs. 10.00) each of Kotak FMPGrowth
Nil (previous year: 5,402,783.71) units of Rs. Nil - 56(previous year: Rs. 10.44) each of Reliance Mutual Fund-Short Term fund-Retail Plan-Dividend Option

86
A N N U A L R E P O R T 2 0 0 7
Nil (previous year: 5,000,000.00) units of Rs. Nil - 50(previous year: Rs. 9.99) each of Reliance Fixed TenorFund Growth Plan [(Cost Rs. Nil (previous year: Rs. 50 Million)]
Nil (previous year: 5,084,276.05) units of Rs. Nil - 51(previous year: Rs. 10.00) each of Chola FMP series-6Quarterly plan-3 -Dividend
Nil (previous year: 5,000,000.00) units of Rs. Nil - 50(previous year: Rs. 9.98) each of Grindlays -FMP-16 month Plan A-Growth[(Cost Rs. Nil (previous year: Rs. 50 Million)]
1,122,894.45 (previous year: Nil) units of 12 -Rs. 10.56 each of ICICI Prudential Flexible IncomePlan-dividend weekly
18,811,010 (previous year: Nil) units of Rs. 10.00 each of 188 -Birla Sun Life FTP - INSTL - Series AN Growth
1,179,151.034 (previous year: Nil) units of 12 -Rs. 10.03 each of HSBC Liquid Plus InstitutionalPlus-weekly dividend
15,647,449 (previous year: Nil) units of Rs. 10.00 each 157 -(previous year: Rs. Nil each) of Kotak Flexi Debt Scheme -Daily Dividend
15,500,000 (previous year: Nil) units of Rs. 10.00 each 155 -(previous year: Rs. Nil) of Standard Chartered FixedMaturity Plan
2,752,230 (previous year: Nil) units of Rs. 10.02 each 27 -(previous year: Rs. NIL) of Birla Sunlife Liquid Plus Fund
2,750,662 (previous year: Nil) units of Rs. 10.03 each 27 -(previous year: Rs. Nil) of Kotak Mutual Fund -Flexi debt scheme
Nil (previous year: 5,235,028.52) units of Rs. Nil - 52(previous year: Rs. 10.00) each of ABN AMRO Mutual Fund -FTP Series 4 Quarterly Plan Dividend on Maturity
632 978
633 979
Note:
1. The above “non trade” investments made during previous year are out of proceeds of public issue (Refer note 16 ofschedule XIII)
2. Refer note no 18 of schedule XIII for details of investment purchase and sold during the year
Schedules forming part of the Consolidated Balance Sheet
Rs. in Million
As at As atMarch 31, 2008 March 31, 2007
Schedule V (Contd.)

87
Schedules forming part of the Consolidated Balance Sheet
Rs in Million
As at As atMarch 31, 2008 March 31, 2007
Schedule VICURRENT ASSETS, LOANS AND ADVANCES:Current Assets:(a) Inventory
Finished Goods (Software product) 17 11(b) Sundry Debtors * :
(Unsecured)Debts outstanding for a period exceeding six months:
: considered good ** 1,153 502: considered doubtful 92 69
1,245 571Other debts, considered good *** 9,813 7,714
: considered doubtful 2 -
11,060 8,285Less: Provision 95 69
10,965 8,216 * Debtors include on account of unbilled revenue
aggregating to Rs. 3,189 Million (previous year:Rs. 1,898 Million)
** Net of advances aggregating to Rs. 98 Million(previous year: Rs. 179 Million) pendingadjustments with invoices
*** Net of advances aggregating to Rs. 169 Million(previous year: Rs. 1,609 Million) pendingadjustments with invoices
(c) Cash and Bank balances:Balance with scheduled banks(i) In Current Accounts 822 237(ii) In Fixed Deposit Accounts 37 343Balance with other banks:(i) In Current Accounts 117 51
976 631(d) Loans and Advances:
(Unsecured, considered good unless otherwise stated)Bills of Exchange (considered doubtful) - 5Less: Provision - 5
- -Advances recoverable in cash or in kind or forvalue to be received - considered good 2,121 1,158
- considered doubtful 10 6
2,131 1,164Less: Provision 10 6
2,121 1,158Fair value of foreign exchange forward andoption contracts 1,036 151(Refer note 1(l) (iii) of schedule XIII)Advance Taxes (net of provisions) 447 228
3,604 1,53715,562 10,395

88
A N N U A L R E P O R T 2 0 0 7
Schedules forming part of the Consolidated Balance Sheet
Rs. in Million
As at As atMarch 31, 2008 March 31, 2007
Schedule VII
CURRENT LIABILITIES:
(a) Sundry Creditors:
Total outstanding dues to Micro, Medium andSmall enterprises - -
Total outstanding dues of Creditors other than Micro,Medium and Small enterprises 5,119 4,135
(b) Other Liabilities: 1,385 763
(c) Unclaimed Dividend: 1 1
6,505 4,899
Schedule VIII
PROVISIONS:
Provision for taxation(net of advance taxes) 795 837
Provision for Fringe benefit tax(net of advance taxes) 6 10
Proposed Dividend 668 -
Provision for Dividend tax 113 -
Provision for Gratuity(Refer note 9 of schedule XIII) 491 288
Provision for Leave Encashment(Refer note 9 of schedule XIII) 690 401
2,763 1,536

89
Schedules forming part of the Consolidated Profit and Loss Account
Rs. in Million
Year ended Year endedMarch 31, March 31,
2008 2007
Schedule IX
OTHER INCOME:
Interest on:
Deposits with banks 43 49[Tax deducted at source Rs. 4 Million(previous year: Rs. 19 Million)]
Income tax refund (Refer note 14 (b) of schedule XIII) - 37
Others [Tax deducted at source Rs. 1 Million 3 2(previous year: Rs. Nil)]
46 88
Dividend received on current investments (non trade) 70 66
Profit on sale of current investments (non trade) (Net) 43 14
Exchange fluctuations (Net) 767 (114)
Sundry balances written back 89 -
Miscellaneous income 29 6
1,044 60
Schedule X
PERSONNEL:
Salaries, wages and bonus 13,672 9,924
Contribution to provident and other funds 1,100 696
Staff welfare 827 514
15,599 11,134

90
A N N U A L R E P O R T 2 0 0 7
Schedules forming part of the Consolidated Profit and Loss Account
Rs. in Million
Year Ended Year EndedMarch 31, March 31,
2008 2007
Schedule XI
OPERATING AND OTHER EXPENSES:
Power 330 208
Rent 790 417
Rates and taxes 40 24
Communication expenses 825 542
Travelling expenses 5,062 3,559
Recruitment expenses 84 121
Hire charges 191 181
Sub-contracting costs 3,899 2,793
Repairs and maintenance:
Buildings (including leased premises) 29 20
Machinery 63 46
Others 111 61
203 127
Insurance 126 98
Professional and legal fees 397 495
Software packages 751 1,388
Project transition cost 233 -
Training 168 126
Advertising, marketing and selling expenses 37 31
Commission on income from service 169 221
Loss on sale of fixed assets (net) 4 2
Provision for doubtful debts 26 39
Provision for doubtful advances 4 3
Advances/bad debts written off 26 9
Donations 76 59
Miscellaneous expenses 364 330
13,805 10,773
Schedule XII
INTEREST:
Interest on
Cash credit/Overdraft 62 61
62 61

91
Schedules forming part of the Consolidated Balance Sheet and Profit and Loss Account
Schedule XIII
SIGNIFICANT ACCOUNTING POLICIES AND NOTES ONACCOUNTS FORMING PART OF CONSOLIDATEDACCOUNTS FOR THE YEAR ENDED MARCH 31, 2008
1. Significant accounting policies:
(a) Basis for preparation of accounts:
The accompanying Consolidated FinancialStatements of Tech Mahindra Limited (TML) (“theholding company”) and its subsidiaries areprepared under the historical cost convention inaccordance with the generally acceptedaccounting principles applicable in India (IndianGAAP), the provisions of the Companies Act, 1956and the Accounting Standards to the extentpossible in the same format as that adopted bythe holding company for its separate financialstatements.
The financial statements of the subsidiaries usedin the consolidation are drawn up to the samereporting date as that of the holding companynamely March 31, 2008.
(b) Principles of consolidation:
The financial statements of the holding companyand its subsidiaries have been consolidatedon a line by line basis by adding togetherthe book value of like items of assets,liabilities, income, expenses, after eliminatingintra – group transactions and any unrealizedgain or losses on the balances remaining withinthe group in accordance with the AccountingStandard 21 on “Consolidated FinancialStatements” (AS-21).
The financial statements of the holdingcompany and its subsidiaries have beenconsolidated using uniform accounting policiesfor like transaction and other events in similarcircumstances.
The excess of cost of investments in thesubsidiary company/s over the share of the equityof the subsidiary company/s at the date on whichthe investment in the subsidiary company/s ismade is recognized as ‘Goodwill on Consolidation’and is grouped with fixed assets in theConsolidated Financial Statements.
Alternatively, where the share of equity in thesubsidiary company/s as on the date of
investment is in excess of cost of the investment,it is recognized as ‘Capital Reserve’ and groupedwith ‘Reserves and Surplus’, in the ConsolidatedFinancial Statements.
Minority interest in the net assets of theconsolidated subsidiaries consists of the amountof equity attributable to the minorityshareholders at the dates on which investmentsare made in the subsidiary company/s and furthermovements in their share in the equity,subsequent to the dates of investments. Minorityinterest also includes share application moneyreceived from minority shareholders. The lossesin subsidiary/s attributable to the minorityshareholder are recognized to the extent of theirinterest in the equity of the subsidiary/s.
(c) Use of Estimates:
The preparation of Consolidated FinancialStatements, in conformity with the generallyaccepted accounting principles, requiresestimates and assumptions to be made thataffect the reported amounts of assets andliabilities on the date of financial statements andthe reported amounts of revenues and expensesduring the reported year. Differences betweenthe actual results and estimates are recognisedin the year in which the results are known/materialised.
(d) Fixed Assets:
Fixed assets are stated at cost less depreciation.Costs comprise purchase price and attributablecosts, if any.
(e) Leases:
Assets taken on lease by TML are accounted foras fixed assets in accordance with AccountingStandard 19 on “Leases”, (AS-19).
(i) Finance Lease
Assets taken on finance lease are accountedfor as fixed assets at fair value. Leasepayments are apportioned betweenfinance charge and reduction of outstandingliability.
(ii) Operating Lease
Assets taken on lease under which all risksand rewards of ownership are effectively
92
retained by the lessor are classified asoperating lease. Lease payments underoperating leases are recognised as expenseson accrual basis in accordance with therespective lease agreements.
(f ) Depreciation/Amortisation of Fixed Assets:
(i) Depreciation for all fixed assets including forassets taken on lease is computed using thestraight-line method based on estimateduseful lives. Depreciation is charged on apro-rata basis for assets purchased or soldduring the year. Management’s estimate ofthe useful life of fixed assets is as follows:
Buildings 15 years
Computers 3-4 years
Plant and machinery 3-5 years
Furniture and fixtures 5 years
Vehicles 3-5 years
(ii) Leasehold land is amortised over the periodof lease.
(iii) Leasehold improvements are amortised overthe period of lease.
(iv) Intellectual property rights are amortisedover a period of seven years.
(g) Impairment of Assets:
At the end of the year, each company determineswhether a provision should be made forimpairment loss on fixed assets by consideringthe indications that an impairment loss may haveoccurred in accordance with AccountingStandard 28 on ‘‘Impairment of Assets’’. Where therecoverable amount of any fixed asset is lowerthan its carrying amount, a provision forimpairment loss on fixed assets is made for thedifference. Recoverable amount is the higher ofan asset’s net selling price and value in use. Inassessing value in use, the estimated future cashflows expected from the continuing use of theasset and from its disposal are discounted to theirpresent value using a pre-tax discount rate thatreflects the current market assessments of timevalue of money and the risks specific to the asset.
Reversal of impairment loss if any, is recognisedimmediately as income in the profit and lossaccount.
(h) Investments:
Current investments are carried at lower of costand fair value. Long term investments are carriedat cost. Provision is made to recognise a decline
other than temporary in the carrying amount oflong term investments.
(i) Inventories :
Valued at the lower of the cost and net realisablevalue. Cost is determined on First - In - First - Outbasis.
(j) Revenue recognition:
Revenue from software services and businessprocess outsourcing services include revenueearned from services performed on ‘time andmaterial’ basis, time bound fixed priceengagements and system integration projects.
The related revenue is recognized as and whenservices are performed. Income from servicesperformed by TML pending receipt of purchaseorders from customers, which are invoicedsubsequently on receipt thereof, are recognizedas unbilled revenue.
The Companies also perform time bound fixedprice engagements, under which revenue isrecognized using the proportionate completionmethod of accounting, unless work completedcannot be reasonably estimated. Provision forestimated losses, if any on uncompleted contractsare recorded in the year in which such lossesbecome probable based on the current contractestimates. In respect of iPolicy Networks Limitedrevenue of sale of software and hardwareproducts are recognised at the point of dispatchto the customer.
Unbilled revenue is recognised at month closingrate. On receipt of POs, the amounts are billed tothe customer & the revenue is booked at theprevailing rate.
Dividend income is recognized when theCompany’s right to receive dividend isestablished. Interest income is recognized on timeproportion basis.
(k) Expenditure:
The cost of software purchased for use insoftware development and services is chargedto cost of revenues in the year of acquisition.
(l) (i) Foreign currency transactions:
Transactions in foreign currencies arerecorded at the exchange rates prevailingon the date of transaction. Monetary itemsare translated at the year-end rates. Theexchange difference between the rateprevailing on the date of transaction and on

93
the date of settlement as also on translationof monetary items at the end of the year isrecognised as income or expense, as the casemay be.
Any premium or discount arising at theinception of the forward exchange contractis recognized as income or expense over thelife of the contract, except in the case wherethe contract is designated as a cash flowhedge.
(ii) Derivative instruments and hedgeaccounting:
The Company uses foreign currency forwardcontracts to hedge its risks associated withforeign currency fluctuations relating tocertain firm commitments and forecastedtransactions. The Company designates theseas cash flow hedges applying therecognition and measurements principlesset out in the Accounting Standard 30“Financial Instruments: Recognition andMeasurements” (AS-30).
The use of foreign currency forwardcontracts is governed by the Company’spolicies approved by the board of directors,which provide written principles on the useof such financial derivatives consistent withthe Company’s risk management strategy.The Company does not use derivativefinancial instruments for speculativepurposes.
Foreign currency forward contract derivativeinstruments are initially measured at fairvalue and are remeasured at subsequentreporting dates. Changes in the fair value ofthese derivatives that are designated andeffective as hedges of future cash flows arerecognized directly in reserves and theineffective portion is recognizedimmediately in profit and loss account.
Changes in the fair value of derivativefinancial instruments that do not qualify forhedge accounting are recognized in theprofit and loss account as they arise.
Hedge accounting is discontinued when thehedging instrument expires or is sold,terminated, or exercised, or no longer qualifiesfor hedge accounting. If a hedged transactionis no longer expected to occur, the netcumulative gain or loss recognized in reservesis transferred to profit and loss account.
(iii) Accounting for Exchange Gain/(Loss):
The Company enters into foreign exchangeforward contracts to off set the foreigncurrency risk arising from the amountsdenominated in currencies other than theIndian Rupee. The counter party to theCompany’s foreign currency forwardcontracts is generally a bank.
Pending the issue of an accounting standardunder Indian GAAP to cover forwardexchange contracts entered into to hedgeforeign currency risk of a firm commitmentor highly probable forecast transactions, theexchange differences arising on suchcontracts up to 31st March, 2007 wererecognized in the statement of profit or lossin the reporting year.
Effective 1st April, 2007, the Company hasdesignated the outstanding forward exchangecontracts as cash flow hedges. Changes in thefair value of effective forward exchangecontract are recognized directly in reserves andthe ineffective portion is recognizedimmediately in profit and loss account.
Consequent to this change in accounting forsuch contracts, the profit for the year endedMarch 31, 2008 is lower by Rs. 851 Millionand reserves and surplus are higher byRs. 851 Million.
(m) Translation and Accounting of FinancialStatement of Foreign subsidiaries:
The financial statements are translated to IndianRupees in accordance with the guidance issuedby the ICAI in the background material to AS 21as follows:
(a) All income and expenses are translated atthe moving average rate of exchangeprevailing during the year.
(b) Assets and liabilities are translated at theclosing rate on the balance sheet date.
(c) Share capital is translated at historical rate.
(d) The resulting exchange differences areaccumulated in currency translation reserve.
(n) Employee Retirement Benefits:
(a) Gratuity:
The Company provides for gratuity, a definedretirement benefit plan covering eligibleemployees. The gratuity plan provides for alump sum payment to employees atretirement, death, incapacitation ortermination of the employment based on
94
the respective employee’s salary and thetenure of the employment. Liabilities withregard to a gratuity plan are determinedbased on the actuarial valuation carried outby an independent actuary as of the balancesheet date for TML and its Indiansubsidiaries.
In respect of a subsidiary, viz., Tech Mahindra(R&D Services) Limited where the gratuityliability is funded, liability towards gratuityis provided for shortfall, if any, betweenaccrued liabilities as determined on actuarialvaluation and fund balance. (Refer note 9below).
(b) Provident fund:
The eligible employees of TML and its Indiansubsidiaries are entitled to receive thebenefits of provident fund, a definedcontribution plan, in which both employeesand the Company make monthlycontributions at a specified percentage ofthe covered employees’ salary (currently at12% of the basic salary). The contributionsas specified under the law are paid to theRegional Provident Fund Commissioner bythe Company.
(c) Compensated absences:
The Company provides for the encashmentof leave subject to certain rules. Theemployees are entitled to accumulate leavesubject to certain limits, for futureencashment or availment. The liability isprovided based on the number of days ofunavailed leave at balance sheet date on thebasis of an independent actuarial valuationfor TML and its Indian subsidiaries. Whereasprovision for encashment of unavailed leaveon retirement is made on actual basis forTech Mahindra (Americas) Inc.(TMA), TechMahindra GmbH( TMGMBH) and TechMahindra (Singapore) Pte. Ltd.(TMSL), TMLdoes not expect the difference on accountof varying methods to be material (Refernote 9 below).
Actuarial gains and losses are recognised infull in the profit and loss account for theyear in which they occur.
(o) Borrowing costs:
Borrowing costs that are attributable to theacquisition or construction of qualifying assets
are capitalized as part of the cost of such assets.A qualifying asset is one that necessarily takes asubstantial period of time to get ready for itsintended use or sale. All other borrowing costsare charged to revenue.
(p) Taxation:
Tax expense comprises of current tax, deferredtax and fringe benefit tax. Current tax is measuredat the amount expected to be paid to/recoveredfrom the tax authorities, based on estimated taxliability computed after taking credit forallowances and exemption in accordance withthe local tax laws existing in the respectivecountries.
Minimum alternative tax (MAT ) paid inaccordance to the tax laws, which gives rise tofuture economic benefits in the form ofadjustment of future income tax liability isconsidered as an asset if there is convincingevidence that the Company will pay normal taxafter the tax holiday year. Accordingly, it isrecognized as an asset in the balance sheet whenit is probable that the future economic benefitassociated with it will flow to the Company andthe asset can be measured reliably.
Deferred tax assets and liabilities are recognisedfor future tax consequences attributable totiming differences between taxable income andaccounting income that are capable of reversalin one or more subsequent years and aremeasured using relevant enacted tax rates. Thecarrying amount of deferred tax assets at eachbalance sheet date is reduced to the extent thatit is no longer reasonably certain that sufficientfuture taxable income will be available againstwhich the deferred tax asset can be realized.
Fringe benefit tax is recognized in accordancewith the relevant provisions of the Income-taxAct, 1961 and the Guidance Note on FringeBenefits Tax issued by the ICAI.
Tax on distributed profits payable in accordancewith the provisions of the Income-tax Act, 1961is disclosed in accordance with the GuidanceNote on Accounting for Corporate Dividend Taxissued by the ICAI.
(q) Contingent Liabilities:
These, if any, are disclosed in the notes onaccounts. Provision is made in the accounts if itbecomes probable that any outflow of resourcesembodying economic benefits will be requiredto settle the obligation arising out of past events.

95
Notes on Accounts:
2. (a) The consolidated financial statements present the consolidated accounts of TML, which consists of the accountsof the holding company and of the following subsidiaries:
Name of the Subsidiary Company Country of incorporation Extent of Holding (%) as on March 31, 2008
Tech Mahindra (Americas) Inc. United States of America 100 %
Tech Mahindra GmbH Germany 100 %
Tech Mahindra (Singapore) Pte. Ltd. Singapore 100 %
Tech Mahindra (Thailand) Limited Thailand 100%
Tech Mahindra (R & D Services) Limited (TMRDL) India 100%and its following subsidiary:a) Tech Mahindra (R & D Services) Inc. United States of America 100%
PT Tech Mahindra Indonesia Indonesia 100%
CanvasM Technologies Limited and its following India 80.10%subsidiary:a) CanvasM Technologies Inc. United States of America 80.10%
iPolicy Networks Limited India 100%
Tech Mahindra (Malaysia) SDN. BHD Malaysia 100%
Tech Mahindra (Beijing) IT Services Limited China 100%
(b) TML has an investment in a subsidiary companyviz. Tech Mahindra Foundation (TMF). TMF hasbeen incorporated primarily for charitablepurposes, where in, the profits will be applied forpromoting its objects. Accordingly, the accountsof TMF are not consolidated in these financialstatements, since TML will not derive anyeconomic benefits from its investments in TMF.
3. The estimated amount of contracts remaining to beexecuted on capital account, (net of capital advances)and not provided for as at March 31, 2008 for TMLRs. 1,378 Million (previous year: Rs. 1,291 Million).
4. Contingent liabilities:
(i) TML and its subsidiary TMRDL has receivednotices from Income Tax authorities resulting ina contingent liability of Rs.158 Million andRs. 1 Million (previous year: Rs. 100 Million andRs. 1 million respectively). TML demand is onaccount of disallowance of software maintenanceactivity and deduction under section 80HHEamounting to Rs. 37 Million and a further sumof Rs. 121 Million relating to section 10A. TMLhas appealed before Appellate authorities and ishopeful of succeeding in the same.
(ii) TML has received demand notice from Sales Taxauthority for Rs. 1 Million (previous year: Rs. Nil)towards purchases made from unregistereddealers for the financial year 2000-01. Thecompany has filed appeal against the same.
(iii) Bank Guarantees outstanding for TML and itssubsidiaries TMRDL and TMSL are Rs. 160 Million,Rs. 20 Million and Rs. 6 Million respectively(previous year: Rs. 224 Million, Rs. 20 Million andRs. Nil respectively).
(iv) Claims from statutory authorities for TMRDL isRs. 2 Million (Provident Fund) (previous year:Rs 2 Million) and Rs. 7 Million (Service Tax)(previous year: Rs. Nil).
5. During the previous year, pursuant to the resolutionpassed by the shareholders at the Extra OrdinaryGeneral Meeting held on June 01, 2006, TMLconsolidated its share capital from 112,685,573 equityshares of Rs. 2/- each into 22,537,114 equity shares ofRs. 10/- each.
Further, during the previous year TML has issued90,148,459 equity shares of Rs. 10/- each as bonusshares at the rate of 4 shares for each share held as atJune 01, 2006, aggregating to Rs. 902 Million by wayof capitalization from the balance of profit and lossaccount.
6. TML acquired Tech Mahindra (R&D services) Limitedon November 28, 2005. The terms of purchaseprovides for payment of contingent consideration toall the selling shareholders, payable over three yearsand calculated based on achievement of specifictargets. The contingent consideration is payable incash and cannot exceed Rs. 641 Million.

96
The consideration so payable would be accounted inthe books of account in the year of achieving themilestones under the agreement. AccordinglyRs. 16 Million (previous year: Rs. 101 Million) has beenaccounted for during the year as additional cost ofacquisition, in accordance with the terms ofagreement and Rs. 5 Million has been accounted asadditional consideration due to revision inmanagement estimates made in the previous year.The total earn out payment amounts toRs.154 Million.Further, the goodwill arising on additional 1,600 sharesof TMRDL acquired during the year aggregatingto Rs. 0.06 Million has also been added to the goodwill.
7. During the previous year, TML has acquired entireshareholding of iPolicy Networks Limited (iPolicy)(formerly known as iPolicy Networks Private Limited)vide Share Purchase Agreement dated January 18, 2007for a consideration of Rs. 29 Million. As a result iPolicyhas become wholly owned subsidiary of the holdingcompany with effect from the date of acquisition. Thecompany has made additional investment of Rs. 381Million (previous year: Rs 120 Million) after theacquisition.During the previous year, the excess of the above costto TML over its share of the equity in iPolicy at thedate on which investment was made aggregating toRs. 41 Million has been added to the goodwill onconsolidation under fixed assets.During the year the company has paid an additionalamount of Rs. 0.03 Million due to revision in theacquisition cost computation. The above additional costof Rs. 0.03 Million, being the excess of cost to TMLover its share of the equity in iPolicy has been addedto the goodwill on consolidation under fixed assets.
8. During the year, TML has entered in to an agreementwith a customer under which it will have exclusivityfor 90 days in negotiating an engagement.
As per the terms of the agreement TML has made an‘exclusivity’ payment of Rs. 4,401 Million to thecustomer which is unconditional, irrevocable and nonrefundable. Accordingly, this payment has been disclosedas an exceptional item in the profit and loss account.
The project will be executed with a consortiumpartner who will bear part of the ‘exclusivity payment’.The payment from consortium partner will beaccounted when it is contractually firmed up.
During the previous year, TML had entered into GlobalSourcing Agreement relating to the development ofa global sourcing model for strategic outsourcingservices, with a customer for a term of five years.
As per the terms of agreement, TML had made anupfront payment of Rs. 5,250 Million to the customer,which is unconditional, irrevocable and non-refundable. Accordingly, this payment had beendisclosed as an exceptional item in the previous yearprofit and loss account.
9. The revised Accounting Standard 15 on “EmployeeBenefits”, (AS-15) has been adopted by the companywith effect from April 1, 2006.
(i) The disclosure as required under AS 15 regardingthe employees retirement benefits plan forgratuity is as follows:
(a) TML, iPolicy and CanvasM:
Rs. in MillionParticulars March 31, 2008 March 31, 2007
Projected benefit obligation, beginning of the year 276 191
Service cost 155 103
Interest cost 28 16
Actuarial (Gain)/Loss 24 (21)
Benefits paid (15) (14)
Projected benefit obligation, end of the year 468 275
The gratuity plan is not funded and the liability is provided for in the books of account.Rs. in Million
Particulars March 31, 2008 March 31, 2007
Net periodic gratuity cost
Service cost 155 103
Interest cost 28 16
Amortisation of actuarial (Gain)/Loss 24 (21)
Net periodic gratuity cost 207 98

97
Assumptions:
Discount rate 7.75% 8.00%
Rate of increase in compensation levels of covered employees 8.00% 7.75%
(c) TMRDL:
Rs. in Million
Particulars March 31, 2008 March 31, 2007
Projected benefit obligation, beginning of the year 41 29
Service cost 7 6
Interest cost 4 3
Actuarial loss 6 5
Benefits paid (4) (2)
Projected benefit obligation, end of the year 54 41
Defined benefit obligation liability as at the balance sheet dateis wholly funded by the company
Change in plan assets
Fair Value of Assets beginning of the year 28 29
Contributions by employer 3 —
Expected return on assets 3 3
Actuarial Gain/(Loss) 1 (2)
Benefits paid (4) (2)
Projected fair value of assets, end of the year 31 28
Gratuity cost for the year
Service cost 7 6
Interest cost 4 3
Expected return on assets (3) (3)
Amortisation of Actuarial Gain /(Loss) 4 7
Net periodic gratuity cost 13 13
Assumptions:
Discount rate 7.75% 8.00%
Rate of increase in compensation levels of covered employees 7.75% 7.50%
(ii) The disclosure as required under AS 15 regarding the employees retirement benefits plan for leave encashmentis as follows:
(a) Disclosure:Rs. in Million
Particulars March 31, 2008 March 31, 2007
Projected benefit obligation, beginning of the year 313 232
Service cost 91 74
Interest cost 27 18
Actuarial loss 164 30
Past service cost (vested) 9 —
Benefits paid (65) (41)
Projected benefit obligation, end of the year 539 313

98
The leave encashment liability is not funded and is provided for in the books of account.
Rs. in Million
Particulars March 31, 2008 March 31, 2007
Net periodic leave encashment cost
Service cost 91 74
Interest cost 27 18
Amortisation of actuarial loss 164 30
Past service cost (vested) 9 —
Net periodic leave encashment cost 291 122
Assumptions:
Discount rate 7.75% 8.00%
Rate of increase in compensation levels of covered employees for TML 8.00% 7.75%
(b) The Company has in addition to above accounted for short term leave encashment and provident fundcontribution amounting to Rs. 77 Million (previous year: Rs. 89 Million).
10. Assets acquired/given on lease:
(i) Finance lease:
TML has acquired vehicles on lease, the fair value of which aggregates to Rs. 50 Million (previous year:Rs. 67 Million). As per Accounting Standard 19 (AS-19) on Leases, the Company has capitalized the said vehiclesat their fair value as the leases are in the nature of finance leases as defined in (AS-19). Lease payments areapportioned between finance charge and deduction of outstanding liabilities. The details of lease rentals payablein future are as follows:
Rs. in Million
Not later than Later than 1 year not1 year later than 5 years
Minimum lease rentals payable (previous year: 4 —Rs. 13 Million and Rs. 4 Million respectively)
Present value of lease rentals payable (previous year:Rs. 12 Million and Rs 4 Million respectively) 4 —
(ii) Operating lease:
(A) The assets taken on operating lease are as detailed below:
(i) TML has taken vehicles on operating lease for a period of three to four years. The lease rentals recognisedin the profit and loss account for the year is Rs. 8 Million (previous year: Rs. 1 Million).
The future lease payments of operating lease are as follows:
Rs. in Million
Not later than Later than 1 year not1 year later than 5 years
Minimum lease rentals payable (previous year:Rs. 1 Million and Rs. 3 Million respectively) 11 18
(ii) TMRDL has taken on lease various residential/commercial premises for cancelable period of 1 year to 3years. These agreements are normally renewed on expiry.
Lease rentals recognized in the statement of profit and loss account in respect of the above operatinglease is Rs. 11 Million (previous year: Rs. 12 Million).

99
(iii) Tech Mahindra (R&D) Inc. USA has taken office space and vehicles on operating lease. The lease rentalsrecognised in the profit and loss account for the year is Rs. 4 Million (previous year: Rs. 4 Million). The futurelease payments of operating lease are as follows
Rs. in Million
Not later than Later than 1 year not1 year later than 5 years
Office space Vehicles Office space Vehicles
Minimum lease rentals payable 8 — 11 —[8] [1] [20] [1]
Figures in bracket “[ ]” indicate previous year figures
(iv) TMA has taken office space on operating lease. The lease rentals recognized in the profit and loss accountfor the year is Rs. 5 Million (previous year: Rs. 3 Million). The future lease payments of operating lease are asfollows:
Rs. in Million
Not later than Later than 1 year not1 year later than 5 years
Minimum lease rentals payable (previous year: 1 —Rs. 4 Million and Rs. Nil respectively)
(v) TMTL has taken office premises on operating lease. The lease rentals recognized in the profit and lossaccount for the period is Rs. 1 Million (previous year: Rs. 1 Million). The future lease payments of operatinglease are as follows:
Rs. in Million
Not later than Later than 1 year not1 year later than 5 years
Minimum lease rentals payable (previous year: 1 —Rs. 1 Million and Rs. 3 Million)
(vi) TMGMBH has taken office space on operating lease. The future lease payments of operating lease are asfollows:
Rs. in Million
Not later than Later than 1 year not1 year later than 5 years
Minimum lease rentals payable (previous year: 3 —Rs. 1 Million and Rs. Nil respectively)
(vii) TMSL has taken office space on operating lease. The lease rentals recognized in the profit and loss accountfor the year is Rs. 8 Million (previous year: Rs. 7 Million). The future lease payments of operating lease are asfollows:
Rs. in Million
Not later than Later than 1 year not1 year later than 5 years
Minimum lease rentals payable (previous year: 7 2Rs. 7 Million and Rs. 6 Million respectively)
(viii) CanvasM Technologies Ltd is a lessee under various operating leases. Rental expense for operating leasesfor the year ended March 31, 2008 Rs. 3 Million (previous year: Rs. 1 Million). The company has not executedany non-cancelable operating leases.

100
(B) The assets given by the TMRDL on operating lease are as detailed below:Rs. in Million
Description of Asset Gross carrying Accumulated Depreciation amount depreciation for the year
March 31, 2008 April 1, 2007
Building – Block C in Hosur Road, 50 14 3Bangalore. [50] [11] [3]
Figures in bracket “[ ]” indicate previous year figures.
The above operating lease is for a cancelable period of 3 years which is renewal by mutual consent.
There is no contingent rent.
11. With the focus on customers in the Telecom Service Providers (TSP) and TEM segments of the telecom vertical, TMLhas reorganised its management structure to cater to its business segments. Consequently TML is of the view that asper the requirements of Accounting Standard 17 on “Segment Reporting” (AS-17), the primary segment of TML isbusiness segment by category of customers in the TSP, TEM, Business process outsourcing (BPO) and other sectorsand the secondary segment is the geographical segment by location of its customers.
The Accounting principles consistently used in the preparation of the financial statements are also applied to recordincome and expenditure in the individual segments. There are no inter-segment transactions during the year.
A. PRIMARY SEGMENTS
For the year ended March 31, 2008 Rs. in Million
Particulars TELECOM TELECOM BUSINESS OTHERS TOTALSERVICE EQUIPMENT PROCESS
PROVIDER MANUFACTURER OUTSOURCING
Revenues 33,612 1,937 1,296 816 37,661
Less : Direct expenses 20,792 1,655 807 600 23,854
Segmental Operating Results 12,820 282 489 216 13,807
Less : Unallocable expenses
Depreciation 796
Interest 62
Other unallocable expenses 5,550
Total unallocable expenses 6,408
Operating income 7,399
Add : Other income 1,044
Net Profit before tax and exceptional item 8,443
Less : Provision for taxation
Current tax (689)
Deferred tax 15
Fringe benefit tax (74)
Net Profit after tax & before Minority Interest and exceptional item 7,695
Exceptional item (4,401)
Minority Interest 5
Net Profit for the year 3,299
Segregation of assets, liabilities, depreciation and other non-cash expenses into various primary segments has not beendone as the assets are used interchangeably between segments and TML is of the view that it is not practical toreasonably allocate liabilities and other non-cash expenses to individual segments and an adhoc allocation will not bemeaningful.

101
B. SECONDARY SEGMENTS:Revenues from secondary segments are as under:
Rs. in Million
Sector
Europe 27,733USA 7,300Rest of World 2,268
Total 37,661
Segregation of assets into secondary segments has not been done as the assets are used interchangeably betweensegments. Consequently the carrying amounts of assets by location of assets are not given.
A. PRIMARY SEGMENTS :For the year ended March 31, 2007 Rs. in Million
Particulars TELECOM TELECOM BUSINESS OTHERS TOTALSERVICE EQUIPMENT PROCESS
PROVIDER MANUFACTURER OUTSOURCING
Revenues 26,664 1,832 141 653 29,290Less: Direct expenses 15,707 1,190 156 483 17,536
Segmental Operating Income 10,957 642 (15) 170 11,754
Less: Unallocable expensesDepreciation 515Interst 61Other unallocable expenses 4,371Total unallocable expenses 4,947
Operating Income 6,807Add: Other income 60
Net Profit before tax and exceptional item 6,867Less: Provision for taxationCurrent tax (648)Deferred tax (36)Fringe benefit tax (56)
Net Profit before Minority Interest and exceptional item 6,127Exceptional item (5,250)Minority interest 1
Net Profit for the year 876Excess provision for income-tax in respect of earlier yearswritten back (Refer note 14 (b) below) 339
Net profit 1,215
Segregation of assets, liabilities, depreciation and other non-cash expenses into various primary segments has notbeen done as the assets are used interchangeably between segments and TML is of the view that it is not practicalto reasonably allocate liabilities and other non-cash expenses to individual segments and an adhoc allocation willnot be meaningful.
B. SECONDARY SEGMENTS:Revenues from secondary segments are as under:
Rs. in Million
Sector
Europe 21,237USA 5,370Rest of World 2,683Total 29,290
Segregation of assets into secondary segments has not been done as the assets are used interchangeably betweensegments. Consequently the carrying amounts of assets by location of assets are not given.

102
12. (A) TML has instituted “ Employee Stock Option Plan 2000” (ESOP) for its employees and directors. For this purposeit had created a trust viz. MBT ESOP trust. In terms of the said Plan, the trust has Granted options to theemployees and directors in form of warrant which vest at the rate of 33.33% on each successive anniversary ofthe grant date. The options can be exercised over a period of 5 years from the date of grant. Each warrantcarries with it the right to purchase one equity share of the Company at the exercise price determined by thetrust on the basis of fair value of the equity shares at the time of grant.
The details of the options are as under:
Particulars March 31, 2008 March 31, 2007
Options outstanding at the beginning of the year 489,120 1,220,000
Options granted during the year - -
Options lapsed during the year 6,620 18,480
Options cancelled during the year 20,480 37,860
Options exercised during the year 111,930 674,540
Options outstanding at the end of the year 350,090 489,120
Out of the options outstanding at the end of year, 244,390 (previous year: 100,420) (Net of exercised & lapsed)options have vested, which have not been exercised.
(B) TML has instituted “ Employee Stock Option Plan 2004” (ESOP 2004) for its employees. In terms of the said Plan,the compensation committee has granted options to employees of the Company. The options are divided intoupfront options and performance options. The upfront options are divided into three sets which will entitleholders to subscribe to option shares at the end of first year, second year and third year. The vesting of theperformance options will be decided by the compensation committee based on the performance of employees.
Particulars March 31, 2008 March 31, 2007
Options outstanding at the beginning of the year 5,677,701 10,219,860
Options granted during the year - -
Options lapsed during the year - -
Options cancelled during the year - -
Options exercised during the year - 4,542,159
Options outstanding at the end of the year 5,677,701 5,677,701
Out of the options outstanding at the end of the year, there are 2,271,081 (previous year: Nil) (Net of exercised& lapsed) vested options which have not been exercised.
(C) TML has instituted “Employee Stock Option Plan 2006 “(ESOP 2006) for its employees and directors and itssubsidiary companies. In terms of the said plan, the compensation committee has granted options to theemployees of the Company. The vesting of the options is 10%, 15%, 20%, 25%, and 30% of total options grantedafter 12, 24, 36, 48 and 60 months, respectively from the date of grant. The maximum exercise period is 7 yearsfrom the date of grant.
The details of the options are as under:
Particulars March 31, 2008 March 31, 2007
Options outstanding at the beginning of the year 4,493,116 4,612,380
Options granted during the year 72,000 656,625
Options lapsed during the year - -
Options cancelled during the year 337,850 402,890
Options exercised during the year 34,238 372,999
Options outstanding at the end of the year 4,193,028 4,493,116
Weighted average share price of the above options on thedate of the exercise Rs. 83 Rs. 83
Out of the options outstanding at the end of the year, 680,543 (previous year: 56,456) (Net of exercised &lapsed) options have vested which have not been exercised.

103
(D) The Company uses the intrinsic value-based method of accounting for stock options granted after April 1, 2005.Had the compensation cost for the Company’s stock based compensation plan been determined in the mannerconsistent with the fair value approach, the Company’s net income would be lower by Rs. 32 Million (previousyear: Rs. 10 Million) and earnings per share as reported would be lower as indicated below:
Rs. in Million except earning per share
Particulars March 31, 2008 March 31, 2007
Net profit after tax and before exceptional item 7,695 6,127
Less : Exceptional item (4,401) (5,250)
Minority Interest 5 (1)
Net profit for the year 3,299 876
Add : Excess provision for income-tax in respect of earlier yearwritten back - 339
Net Profit 3,299 1,215
Less : Total stock-based employee compensation expensedetermined under fair value base method 32 10
Adjusted net profit 3,267 1,205
Basic earnings per share (in Rs.)
- As reported 27.20 10.56
- Adjusted 26.93 10.47
Diluted earnings per share (in Rs.)
- As reported 25.24 9.32
- Adjusted 24.99 9.23
The fair value of each warrant is estimated on the date of grantbased on the following assumptions:
Dividend yield (%) 6.60 6.89
Expected life 5 years 5 years
Risk free interest rate (%) 7.83 7.72
Volatility (%) 55.28 62.69
13. As required under Accounting Standard 18 “Related Party Disclosures” (AS-18), following are details of transactionsduring the year with the related parties of the Company as defined in AS 18:
(a) List of Related Parties and Relationships
Name of Related Party Relation
Mahindra & Mahindra Ltd. Holding CompanyBritish Telecommunications, plc. Promoter holding more than 20% stake
Tech Mahindra Foundation 100% Subsidiary company
Mahindra Engineering and Chemical Products Ltd. Fellow Subsidiary CompanyMahindra Engineering Design and Development Company Ltd. Fellow Subsidiary CompanyBristlecone India Ltd. Fellow Subsidiary CompanyMahindra World City (Jaipur) Ltd Fellow Subsidiary Company
Mr. Vineet Nayyar Key Management PersonnelVice Chairman, Managing Director and Chief Executive Officer

104
(b) Related Party Transactions for year ended March 31, 2008
Rs. in Million
Transactions Promoter Subsidiary Fellow Key Companies Company Subsidiary Management
Companies Personnel
Reimbursement of Expenses (92) - - -(Net)-Paid/(Receipt) [(348)] [-] [-] [-]
Income from Services & 24,060 - 3 -Management Fees [19,001] [-] [3] [-]
Paid for Services Received 71 - - -[(24)] [-] [-] [-]
Project Transition Cost 233 - - -[-] [-] [-] [-]
Sub-contracting cost - - 8 -[-] [-] [21] [-]
Dividend Paid - - - -[1,143] [-] [-] [1]
Salary and Perquisites - - - 24[-] [-] [-] [24]
Donation - 76 - -[-] [56] [-] [-]
Stock options - - - -*[-] [-] [-] [-]
Purchase of Fixed Asset 17 - - -[9] [-] [-] [-]
Advance Given - - 57 -[-] [-] [-] [-]
Exclusivity Payment/ 4,401 - - -[Upfront Payment] [5,250] [-] [-] [-]
Debit / (Credit) balances (Net) 6,904 - 57 -(inclusive of unbilled) outstanding [5,349] [-] [1] [-]as on March 31, 2008
Figures in brackets “[ ]”are for previous year.
*Options exercised during the year are for Nil (previous year: 1,514,053) equity shares and options granted andoutstanding as at year end are 1,892,567 (previous year: 1,892,567).

105
Out of the above items transactions with Promoter Companies, Subsidiary Company, Fellow Subsidiary Companies andKey Management Personnel in the excess of 10% of the total related party transactions are as under:
Rs. in Million
Transactions Year ended Year endedMarch31,2008 March31,2007
Reimbursement of Expenses (Net) - Paid/(Receipt)Promoter Companies
- British Telecommunications, Plc. (109) (359)
Income from ServicesPromoter Companies
- British Telecommunications, Plc. 24,024 18,982
Paid for Services ReceivedPromoter Companies
- Mahindra & Mahindra Ltd. 71 24
Project Transition CostPromoter Companies
- British Telecommunications, Plc. 233 -
Dividend PaidPromoter Companies
- Mahindra & Mahindra Ltd. - 634- British Telecommunications, Plc. - 474
DonationSubsidiary Company- Tech Mahindra Foundation. 76 56
Advance GivenFellow Subsidiary Company
- Mahindra World City (Jaipur) Ltd 57 -
Purchase of Fixed AssetsPromoter Companies
- Mahindra & Mahindra Ltd. - 9- British Telecommunications, Plc 16 -
Exclusivity Payment/ Upfront PaymentPromoter Companies
- British Telecommunications, plc. 4,401 5,250
Salary and PerquisitesKey Management Personnel
- Mr. Vineet Nayyar 24 24
Subcontracting CostFellow Subsidiary Company
- Bristlecone India Limited 8 -

106
There have been no transactions with the following companies during the year
• First Choice Wheels Ltd ( Earlier known as Automartindia Ltd.) Fellow Subsidiary
• Bristlecone Ltd. Fellow Subsidiary
• Bristlecone Inc. Fellow Subsidiary
• Mahindra Consulting Engineers Ltd. Fellow Subsidiary
• Mahindra-BT Investment Company (Mauritius) Ltd. Holding company
• Bristlecone GmbH Fellow Subsidiary
• Bristlecone Singapore Pte. Ltd. Fellow Subsidiary
• Mahindra (China) Tractor Company Ltd. Fellow Subsidiary
• Mahindra Europe s.r.l. Fellow Subsidiary
• Mahindra Gujarat Tractor Ltd. Fellow Subsidiary
• Mahindra Holdings & Finance Ltd. Fellow Subsidiary
• Mahindra Holidays & Resorts India Ltd. Fellow Subsidiary
• Mahindra Holidays & Resorts (USA) Inc. Fellow Subsidiary
• Mahindra Insurance Brokers Ltd. Fellow Subsidiary
• Mahindra Intertrade Ltd. Fellow Subsidiary
• Bristlecone UK Ltd. Fellow Subsidiary
• Mahindra International Ltd. Fellow Subsidiary
• Mahindra Logisoft Business Solutions Ltd. Fellow Subsidiary
• Mahindra Middleeast Electrical Steel Service Centre (FZE) Fellow Subsidiary
• Mahindra & Mahindra Financial Services Ltd. Fellow Subsidiary
• Mahindra & Mahindra South Africa (Pty) Ltd. Fellow Subsidiary
• Mahindra Overseas Investment Company (Mauritius) Ltd. Fellow Subsidiary
• Mahindra Renault Pvt. Ltd. Fellow Subsidiary
• Mahindra Steel Service Centre Ltd. Fellow Subsidiary
• Mahindra Shubhlabh Services Ltd. Fellow Subsidiary
• Mahindra SAR Transmission Pvt Ltd. Fellow Subsidiary
• Mahindra USA Inc. Fellow Subsidiary
• Mahindra Ugine Steel Company Ltd. Fellow Subsidiary
• NBS International Ltd. Fellow Subsidiary
• Stokes Group Ltd. Fellow Subsidiary
• Jensand Ltd. Fellow Subsidiary
• Stokes Forgings Dudley Ltd. Fellow Subsidiary
• Stokes Forgings Ltd. Fellow Subsidiary
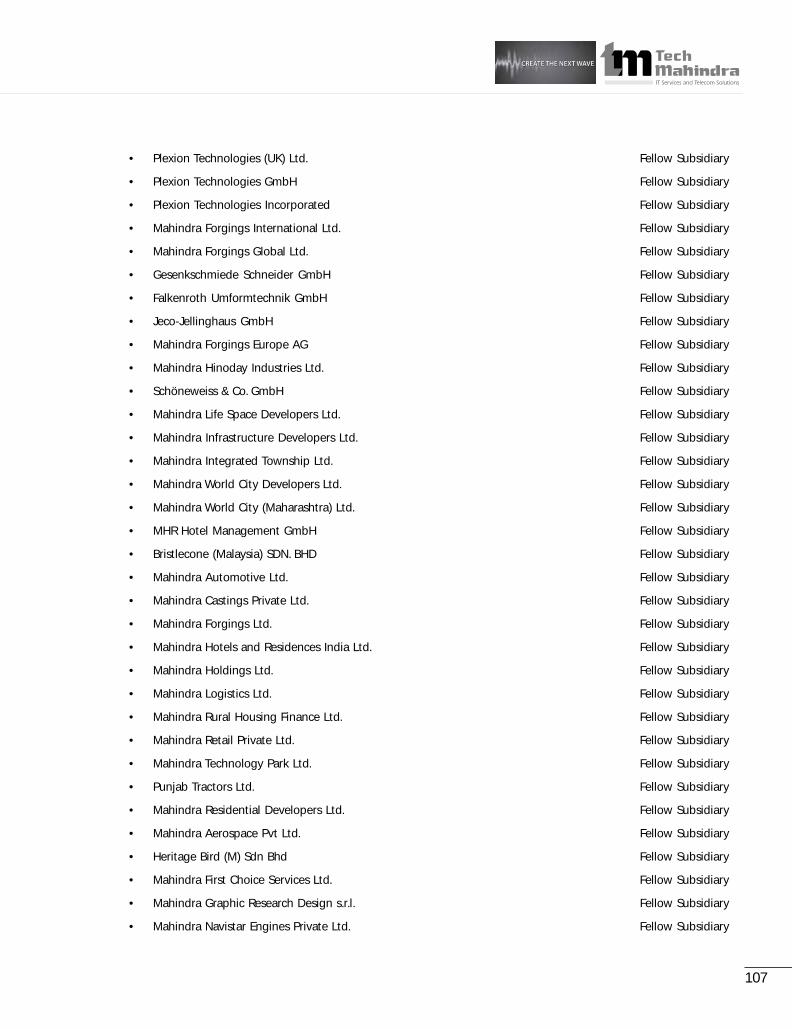
107
• Plexion Technologies (UK) Ltd. Fellow Subsidiary
• Plexion Technologies GmbH Fellow Subsidiary
• Plexion Technologies Incorporated Fellow Subsidiary
• Mahindra Forgings International Ltd. Fellow Subsidiary
• Mahindra Forgings Global Ltd. Fellow Subsidiary
• Gesenkschmiede Schneider GmbH Fellow Subsidiary
• Falkenroth Umformtechnik GmbH Fellow Subsidiary
• Jeco-Jellinghaus GmbH Fellow Subsidiary
• Mahindra Forgings Europe AG Fellow Subsidiary
• Mahindra Hinoday Industries Ltd. Fellow Subsidiary
• Schöneweiss & Co. GmbH Fellow Subsidiary
• Mahindra Life Space Developers Ltd. Fellow Subsidiary
• Mahindra Infrastructure Developers Ltd. Fellow Subsidiary
• Mahindra Integrated Township Ltd. Fellow Subsidiary
• Mahindra World City Developers Ltd. Fellow Subsidiary
• Mahindra World City (Maharashtra) Ltd. Fellow Subsidiary
• MHR Hotel Management GmbH Fellow Subsidiary
• Bristlecone (Malaysia) SDN. BHD Fellow Subsidiary
• Mahindra Automotive Ltd. Fellow Subsidiary
• Mahindra Castings Private Ltd. Fellow Subsidiary
• Mahindra Forgings Ltd. Fellow Subsidiary
• Mahindra Hotels and Residences India Ltd. Fellow Subsidiary
• Mahindra Holdings Ltd. Fellow Subsidiary
• Mahindra Logistics Ltd. Fellow Subsidiary
• Mahindra Rural Housing Finance Ltd. Fellow Subsidiary
• Mahindra Retail Private Ltd. Fellow Subsidiary
• Mahindra Technology Park Ltd. Fellow Subsidiary
• Punjab Tractors Ltd. Fellow Subsidiary
• Mahindra Residential Developers Ltd. Fellow Subsidiary
• Mahindra Aerospace Pvt Ltd. Fellow Subsidiary
• Heritage Bird (M) Sdn Bhd Fellow Subsidiary
• Mahindra First Choice Services Ltd. Fellow Subsidiary
• Mahindra Graphic Research Design s.r.l. Fellow Subsidiary
• Mahindra Navistar Engines Private Ltd. Fellow Subsidiary

108
14. (a) The tax effect of significant timing differences that has resulted in deferred tax assets and liabilities are givenbelow:
Rs. in Million
Particulars March 31, 2008 March 31, 2007
(a) Deferred tax liability:Depreciation (2) (1)
(b) Deferred tax asset:
Gratuity, Leave Encashment 24 10
Doubtful Debts/Others 6 4
Carry forward of Net operating losses of a subsidiary 32 61
Total Deferred Tax Asset (Net) 60 74
(b) Consequent to completion of Income-tax assessments by the tax authorities in the United Kingdom for thefinancial years 2001-02, 2002-03 and 2003-04 TML has received tax refunds aggregating to Rs. 321 Million(including interest aggregating to Rs. 37 Million) in the previous year. Accordingly, in previous year the excessprovision for Income-tax relating to the aforesaid years has been written back to the profit and loss account andthe interest received is disclosed under Other Income.
15. Exchange Gain/(Loss) (Net) accounted during the year:
(a) The Company enters into foreign Exchange Forward Contracts and Currency Option Contracts to offset theforeign currency risk arising from the amounts denominated in currencies other than the Indian rupee. Thecounter party to the Company’s foreign currency forward contracts and Currency Option Contracts is generallya bank. These contracts are entered into to hedge the foreign currency risks of firm commitments. ForwardExchange Contracts and Currency Option Contracts in GBP exposure are split into two legs, which are GBP toUSD and USD to INR.
(b) The following are the outstanding GBP : USD Currency Exchange Contracts entered into by the company whichhave been designated as Cash Flow Hedges as on March 31, 2008:
Type of cover Amount outstanding Fair Value Amount outstanding Exposure toat year end in Gain/(Loss) at year end Buy/ Sell
Foreign currency (Rs. in Million) (Rs. In Million)(in Million)
Forward GBP 36 26 2,865 Sell(previous year: Nil) (previous year: Nil) (previous year: Nil)
Option GBP 292 920 23,217 Sell(previous year: Nil) (previous year: Nil) (previous year: Nil)
(c) The following are the outstanding USD : INR Currency Exchange Contracts entered into by the company whichhave been designated as Cash Flow Hedges as on March 31, 2008:
Type of cover Amount outstanding Fair Value Amount outstanding Exposure toat year end in Gain/(Loss) at year end Buy/ Sell
Foreign currency (Rs. in Million) (Rs. In Million)(in Million)
Forward USD 318 (141) 12,738(previous year: Nil) (previous year: Nil) (previous year: Nil) Sell
Option USD 539 46 21,625(previous year: Nil) (previous year: Nil) (previous year: Nil) Sell

109
The movement in hedging reserve during the year ended March 31, 2008 for derivatives designated as CashFlow Hedges is as follows:
Particulars March 31, 2008 March 31, 2007
Balance at the beginning of the year - -
Gain/(Loss) transferred to income statement onoccurrence of forecasted hedge transaction - -
Changes in the fair value of effective portionof outstanding cash flow derivative 851 -
Net derivative Gain/(Loss) related to discounted cash flow hedge - -
Balance at the end of the year 851 -
(d) In addition to the above cash flow hedges, the Company has few outstanding foreign exchange forward contractsand currency options contracts aggregating to Rs. 10,662 Million (previous year: Rs. 21,149 Million) whose fairvalue showed a gain of Rs. 170 Million (previous year: Rs. 151 Million), which do not qualify for hedge accountingand accordingly these are accounted as derivative instruments at fair value with changes in fair value recordedin the profit and loss account.
(e) The year end foreign currency exposures that have not been specifically hedged by a derivative instrument orotherwise are given below:
Amounts receivable in foreign currency on account of the following
Particulars Rs. in Million Foreign currency in Million
Current year Previous year
Debtors 3,227 GBP 34 GBP -(previous year: 883) AUD 3 AUD -
CAD 2 CAD -EUR 3 EUR 1NZD 3 NZD 0USD - USD 18PHP 27 PHP -
Loans and advances 16 AUD 0 AUD 0(previous year: 12) USD 0 USD 0
CAD 0 CAD -EUR 0 EUR 0NZD 0 NZD -SGD 0 SGD -TWD 0 TWD 0CNY 0 CNY -
Cash/Bank balances (Net) 270 USD 4 USD 0(previous year: 99) AUD 1 AUD 0
NZD 1 NZD 0TWD 15 TWD 39PHP 13 PHP -CAD 0 CAD -EURO 0 EURO 0

110
Amounts payable in foreign currency on account of the following
Particulars Rs. in Million Foreign currency in Million
Current year Previous year
Creditors (Net) 351 EUR 0 EUR 0(previous year: 188) GBP 4 GBP 1
SGD 0 SGD -THB 0 THB -USD - USD 2MYR - MYR -PHP 0 PHP -CNY 0 CNY -AUD 0 AUD 0
Other current liabilities 733(Net) (previous year: 566 ) GBP 9 GBP 7
(f ) Exchange Gain/(Loss) (Net) accounted during the year:Rs. in Million
Particulars March 31, 2008 March 31, 2007
Others 767 (114)
16. During the previous year the public issue of TML’s Equity Shares consisting of a fresh issue of 3,186,480 Equity Sharesby TML and an offer for sale of 9,559,520 Equity Shares, by certain existing Shareholders of TML was made pursuantto a prospectus dated August 11, 2006. The Equity Shares were issued for cash at a price of Rs. 365 per Equity Share(including a securities premium of Rs. 355 per Equity Share).
The statement of proceeds from the public issue and utilisation thereof is as under:
Particulars No of shares Price Rs. in Million
Proceeds received after payment to selling shareholders 3,186,480 365 1,163
Less : Expenses (Net) relating to the issue after recoveryfrom the selling shareholders :
Professional fees 35Advertising expenses 8Rates and taxes 1Miscellaneous expenses 1Printing and stationery 4Traveling expenses 3
Net Proceeds 1,111
Deployment up to March 31, 2008
Used for the capitailsation work for Hinjewadi 1,111
Total 1,111

111
17. Earning Per Share is calculated as follows:
Rs. in Million except earning per share
Particulars Year ended Year endedMarch 31, 2008 March 31, 2007
Net Profit after tax and before exceptional item 7,695 6,127
Less: Exceptional Item (4,401) (5,250)
Profit after tax and exceptional item 3,294 877
Less: Minority Interest 5 1Add: Excess provision for tax in respect of earlier years written back - 339Net Profit attributable to Shareholders 3,299 1,215
Equity Shares outstanding as at the year end (in Nos.) 121,362,869 121,216,701
Weighted average Equity Shares outstanding as at the year end (in Nos.) 121,292,103 115,071,417
Weighted average number of Equity Shares used asdenominator for calculating Basic Earnings Per Share 121,292,103 115,071,417
Add: Diluted number of SharesESOP outstanding at the end of the year 9,427,640 15,381,480
Weighted average number of Equity Shares used asdenominator for calculating Diluted Earnings Per Share 130,719,743 130,452,897
Nominal Value per Equity Share (in Rs.) 10.00 10.00
Earning per share
Before exceptional item
Earnings Per Share (Basic) (in Rs.) 63.49 56.18
Earnings Per Share (Diluted) (in Rs.) 58.91 49.56
After exceptional item
Earnings Per Share (Basic) (in Rs.) 27.20 10.56
Earnings Per Share (Diluted) (in Rs.) 25.24 9.32

112
18. Details of Investments purchased and sold during the year by the TML & its subsidiaries
TYPE OF FUND March 31, 2008
Units CostRs in Million
ICICI PRUDENTIAL MUTUAL FUND:
28 ICICI Prudential’s Flexible Income Plan 14,229,879 150
ABN AMRO MUTUAL FUND:
ABN AMRO Flexible Short Term Plan Ser. B Qtly Div - Reinvested 5,235,029 52
ABN AMRO Money Plus Institutional Weekly Dividend 20,717,076 207
ABN Amro Flexi Debt Fund - Regular Weekly Dividend 15,078,001 151
BIRLA SUNLIFE MUTUAL FUND:
Birla Sun Life Liquid Plus - Institutional Daily Dividend – Reinvestment 39,972,818 400
Birla Sun Life Liquid Plus – Institutional - Weekly Dividend- Reinvested 4,712,065 47
Birla Sun Life Liquid Plus - Instl - Weekly Dividend - Reinvestment 20,782,981 208
DBS CHOLA MUTUAL FUND:
DBS Chola FMP - Series 7 (Quarterly Plan - 4) - Dividend 5,085,445 51
DSP MERRILL LYNCH MUTUAL FUND:
DSP Merrill Lynch Liquid Plus Institutional Plan - Daily Dividend 399,780 400
GRINDLAYS MUTUAL FUND:
Grindlays Cash Fund - Institutional Plan B - Daily Dividend 5,173,225 55
Grindlays Floating Rate Fund - LT Institutional Plan B - Weekly Dividend 5,476,371 55
HSBC MUTUAL FUND:
HSBC Liquid Plus - Institutional Plus - Weekly Dividend 5,406,969 54
JM MUTUAL FUND:
JM Fixed Maturity fund - Series V - Quarterly Plan 4 10,370,469 104- Institutional Dividend Plan
JM Fixed Maturity Fund - Series VI - Quarterly Plan 4 10,569,489 106- Institutional Dividend Plan
JM Money Manager Fund - Super Plus Plan - Weekly Dividend 10,682,893 107
KOTAK MUTUAL FUND:
Kotak Flexi Debt Scheme - Quarterly Dividend 5,354,364 55
Kotak Flexi Debt Scheme Daily Dividend 44,860,484 450
Kotak Liquid (Institutional Premium) - Daily Divided 4,470,643 55
RELIANCE MUTUAL FUND:
Reliance Liquid Plus Fund - Institutional Tenor Fund Plan A - Growth Plan 49,941 50

113
19. During the previous year one of the subsidiary viz., iPolicy, entered into an “Intellectual Property Asset PurchaseAgreement” (the agreement) with iPolicy Networks Inc., on January 23, 2007. Pursuant to the above agreement alongwith ancillary agreements, the said subsidiary has acquired certain Copyright, Patent, Inventions and Trademark etc.as specified in the agreements (collectively referred as Intellectual Property Rights) for Rs. 76 Million. The considerationpayable has been deposited in an Escrow Account with a bank pursuant to the Escrow Agreement dated January 22,2007 and the amount will be released to iPolicy Networks Inc., on satisfaction of certain conditions/ clarifications, asstipulated in the agreement.
20. Previous years figures have been regrouped wherever necessary, to conform to the current period’s classification.
Signatures to Schedules I to XIII
As per our attached report of even dateFor Deloitte Haskins & Sells For Tech Mahindra LimitedChartered Accountants
Anand G. Mahindra Vineet NayyarChairman Vice Chairman, Managing Director & CEOHon. Akash Paul Al-Noor Ramji Bharat DoshiDirector Director Director
Hemant M. Joshi Clive Goodwin Dr. Raj Reddy Ulhas N. YargopPartner Director Director Director
Vikrant GandheAsst. Company Secretary
Pune, Dated: 21st May, 2008 Boston, Dated: May 19, 2008

114
A N N U A L R E P O R T 2 0 0 7
Stat
emen
t p
urs
uan
t to
exe
mp
tio
n r
ecei
ved
un
der
Sec
tio
n 2
12
(8)
of
the
Co
mp
anie
s A
ct, 1
95
6 r
elat
ing
to
su
bsi
dia
ry c
om
pan
ies
Rs.
in M
illi
on
Sr.
Nam
e of
the
Coun
try
Rep
orti
ngEx
chan
geCa
pit
alR
eser
ves
Tota
lTo
tal
Inve
st-
Turn
over
Prof
itPr
ovis
ion
Prof
itPr
opos
edN
o.Su
bsi
diar
y Co
mp
any
Curr
ency
Rat
eA
sset
sLi
abili
ties
men
tb
efor
efo
r a
fter
Div
iden
dot
her
than
Taxa
tion
Taxa
tion
Taxa
tion
inve
st-
men
t in
Sub
sid
iary
1Te
ch M
ahin
dra
(Am
eric
as)
Inc.
USA
USD
40.1
215
.05
47.7
338
8.00
325.
23-
2,85
9.75
155.
7951
.52
104.
27-
2Te
ch M
ahin
dra
Gm
bHG
erm
any
EURO
63.1
236
.29
85.7
819
9.21
162.
91-
641.
3122
.13
-22
.13
-
3Te
ch M
ahin
dra
(Sin
gapo
re)
Pte.
Lim
ited
Sing
apor
eSG
D29
.06
1.45
50.2
579
.85
28.1
5-
299.
0016
.76
(2.3
9)19
.15
-
4Te
ch M
ahin
dra
(Tha
iland
) Li
mite
dTh
aila
ndTH
B1.
270.
643.
3218
.78
9.11
-10
1.32
5.35
-5.
35-
5Te
ch M
ahin
dra
(R&
D S
ervi
ces)
Lim
ited
Indi
aIN
R1.
0046
.03
975.
901,
226.
3720
4.43
77.6
287
5.56
(70.
50)
(10.
26)
(60.
24)
-
6Te
ch M
ahin
dra
(R&
D S
ervi
ces)
Inc.
USA
USD
40.1
20.
2053
.48
63.5
910
.74
-25
3.39
15.4
05.
509.
90-
7Te
ch M
ahin
dra
Foun
datio
nIn
dia
INR
1.00
0.50
303.
8530
4.35
0.02
-21
.47
(8.3
5)-
(8.3
5)-
8PT
Tec
h M
ahin
dra
Indo
nesi
aIn
done
sia
USD
40.1
220
.06
44.6
230
1.28
236.
60-
627.
2316
.92
6.20
10.7
2-
9Ca
nvas
M T
echn
olog
ies
Lim
ited
Indi
aIN
R1.
0057
6.73
-94
.33
40.0
6-
166.
45(2
1.20
)3.
14(2
4.34
)-
10Ca
nvas
M (
Am
eric
as)
Inc.
USA
USD
40.1
20.
001.
4512
1.93
120.
47-
321.
491.
820.
371.
45-
11iP
olic
y N
etw
orks
Lim
ited
*In
dia
INR
1.00
552.
180.
5095
.84
131.
8455
.17
167.
42(4
0.29
)0.
41(4
0.70
)-
12Te
ch M
ahin
dra
(Mal
aysi
a) S
DN
. BH
DM
alay
sia
RM12
.51
3.91
0.47
10.3
06.
12-
21.1
80.
47-
0.47
-
13Te
ch M
ahin
dra
(Bei
jing)
IT S
ervi
ces
Ltd.
Chin
aCN
Y5.
612.
632.
441.
731.
58-
0.00
2.44
-0.
00-
* Ca
pita
l inc
lude
s sh
are
appl
icat
ion
mon
ey

10
'Customer experience' is the vital differentiator that will help organizations succeed in
the coming years. As our customers strive to supply superior customer experience, our
teams across the world enable them to remain best in class. Through an integrated
approach towards solving business problems, our process, operations and technology
teams make it possible for our customers to meet and exceed market and customer
expectations.
Improved customer experience
C km y

116
NOTES

C M Y K
IndiaTech Mahindra LimitedSharada Centre, Off Karve Road,Erandwane, Pune - 411 004.Tel: +91 20 6601 8100Fax: +91 20 2542 4466
Tech Mahindra LimitedWing 1, Oberoi Estate Gardens,Chandivali, Andheri (E),Mumbai - 400 072.Tel: +91 22 6688 2000Fax: +91 22 2852 8959
Tech Mahindra Limited3rd & 4th Floor, C Bldg,Bengal Intelligent Park Ltd.Opp. Infinity Towers, Sector 5Salt Lake, Kolkata - 700 091
Tech Mahindra LimitedB-26, Sector - 57,Noida - 201 301Tel: +91 120 403 2700
Tech Mahindra Limited9 / 7 Hosur Road,Bangalore - 560 029Tel: +91 80 4024 3000Fax: +91 80 2553 9231
Tech Mahindra LimitedNo. 58, Sterling Regency,Sterling Road,Nungambakkam,Chennai - 600 034Tel: +91 44 2825 3323Fax: +91 44 2825 3352
Tech Mahindra LimitedWing No. 1 & 2,Block C, 4th Floor,Hitech City, Madhapur,Hyderabad - 500 081
Tech Mahindra LimitedA Block, 2nd Floor, DLF Building,Chandigarh Technology Park,Kishangarh, ChandigarhTel: +91 172 6604444
UKTech Mahindra Limited1st Floor, Charles Schwab Building,401, Grafton Gate (E),Milton Keynes MK9 1AQ.Tel: +44 1908 553400Fax: +44 1908 553499
Tech Mahindra Limited7th & 8th Floor, Reverside Tower,5 Lanyon Place, Belfast,County Andrin, BT1 3BT
GermanyTech Mahindra GmbHPrinzenallee 7, 40549, Düsseldorf,Germany.Tel: + 49 211 6001 2101Fax: + 49 211 6001 2111
USATech Mahindra (Americas) Inc.15 Corporate Place South,Suite 350, Piscataway, NJ 08854Tel: +1 732 981 1060Fax: +1 732 981 1066
Tech Mahindra (Americas) Inc.12600 Deerfield Parkway,Suite 100, Alpharetta, GA 30004Tel: + 1 678 575 7618Fax: + 1 678 296 0469
Tech Mahindra (Americas) Inc.2140 Lake Park Blvd.,Richardson, TX, 75080Tel: +1 972 991 2900
Tech Mahindra (Americas) Inc.1270, S. Winchester Blvd,Suite # 130,San Jose, CaliforniaTel: +1 408 960 5244
UAETech Mahindra LimitedPO Box 54275,Dubai,United Arab Emirates.Tel: +971 4 2996365Fax: +971 4 2996364
AustraliaTech Mahindra LimitedLevel 2, Suite 5,64 Talavera Road,North Ryde 2113,Australia.Tel: +61 2 9888 4755Fax: +61 2 9888 4766
New ZealandTech Mahindra Limited1J Hayr Road, Three KingsAuckland, New ZealandTel: +64 9 624 2468Fax: +64 9 624 2469
SingaporeTech Mahindra (Singapore) Pte. Limited150 Kampong Ampat #01-01 KA CentreSingapore 368 324Tel: +65 6303 8752Fax: +65 6282 7137
ThailandTech Mahindra (Thailand) Limited24th Floor,The Offices at Central World,Rama I Road, Phatumwan,Bangkok 10330, ThaliandTel: +66 2 264 5480/81,Fax: +66 2 264 5482
IndonesiaPT Tech Mahindra IndonesiaAriobimo Sentral, 4th Floor, Suite #403,Jl. H.R.Rasuna Said, Kav X-2 No. 5Jakarta 12950, IndonesiaTel: +62 81 186 0617
MalaysiaTech Mahindra (Malaysia) Sdn. Bhd.Suit 15.1, Level 15, Menara IMC.,No. 8 Jalan Sultan Ismail,50250, Qualalumpur,Tel: +603 2073 2613Fax: +603 2032 3945
PhilippinesTech Mahindra Limited4th Floor, New Guevent Bldg.,52 Libertad St., Mandal Uyong City 1551Tel: +63 2533 0696/533 7456Fax: +63 2531 0422
INFO
MED
IA I
ND
IA L
IMIT
ED

ANNUAL REPORT 2007 - 2008
ConnectNow
IT Services and Telecom Solutions
CREATE THE NEXT WAVECREATE THE NEXT WAVE
IT Services and Telecom Solutions
CREATE THE NEXT WAVECREATE THE NEXT WAVE