connection between nao, weather types and precipitation in
TRANSCRIPT
INTERNATIONAL JOURNAL OF CLIMATOLOGYInt. J. Climatol. 32: 2181–2196 (2012)Published online 18 October 2011 in Wiley Online Library(wileyonlinelibrary.com) DOI: 10.1002/joc.2431
Connection between NAO, weather types and precipitationin Leon, Spain (1948–2008)
S. Fernandez-Gonzalez,a S. del Rıo,b A. Castro,a A. Penas,b M. Fernandez-Raga,a A. I. Calvoa,c
and R. Frailea*a Departamento de Fısica. IMARENAB. Universidad de Leon. 24071 Leon, Spain
b Departamento de Biodiversidad y Gestion Ambiental (Area de Botanica). Universidad de Leon. 24071 Leon, Spainc Centre for Environmental and Marine Studies (CESAM), University of Aveiro, 3810-193 Aveiro, Portugal
ABSTRACT: The variability of winter precipitation in the west of the Iberian Peninsula is strongly affected by the NorthAtlantic Oscillation (NAO). This study focuses on identifying the relationship that exists between precipitation registeredin the city of Leon (in northwestern Spain), the NAO index and the associated weather type during the same period. Inorder to achieve this objective, the prevailing weather type has been calculated for each day in Leon from January 1948 toMarch 2009, using the objective Lamb Weather Types classification method. The most significant results appear in winter(from December to March). During these months an increase has been observed in the frequency of ‘anticyclonic’ weathertype (A) (very dry), and a decrease in the ‘cyclonic’ (C), ‘south-westerly’ (SW) and ‘westerly’ (W) types (the three rainiestweather types). The positive trend in the NAO index could be the main cause of the decrease in the frequency of the threerainiest weather types (C, SW and W) and therefore, responsible for the relevant decline in winter precipitation observedin the city of Leon. The high correlation coefficients between the NAO index, the frequency of the three rainiest weathertypes and winter precipitation suggests an interesting method to forecast rainfall. Using a binary logistic regression model,a downscaling model for daily precipitation has been obtained based on the weather types and the NAO index. The dailyresults obtained for the winter months are good (TSS = 0.64) bearing in mind that only sea level pressure data were usedin the logistic model. Copyright 2011 Royal Meteorological Society
KEY WORDS logistic regression; rainfall; weather types; Spain; North Atlantic Oscillation
Received 5 December 2010; Revised 1 August 2011; Accepted 18 September 2011
1. Introduction
The rainfall regime in the Iberian Peninsula is highlyirregular, on both the spatial and the temporal scale(Esteban-Parra et al., 1998). As a result of the orographyand the oceanic origin of precipitation, synoptic distur-bances contribute towards the spatial variability of theprecipitation (Trigo et al., 2004). The interannual vari-ability of precipitation that occurs during the winter, andto a lesser degree during the autumn, may be explainedby changes in large-scale atmospheric circulation modes,especially for the western sector of the Iberian Penin-sula (Rodrıguez-Puebla et al., 1998; Trigo and Palutikof,2001).
Many authors have identified a trend towards a drierclimate in Spanish Iberia over the last few decades(Esteban-Parra et al., 1998; Hulme and Sheard, 1999;Mossman, 2002; Paredes et al., 2006; IPCC, 2007). Thedecrease in winter precipitation in different areas of theIberian Peninsula has also been the subject of otherstudies (Lopez-Bustins et al., 2008; Rodrigo and Trigo,
* Correspondence to: R. Fraile, Departamento de Fısica, Facultad deCC Biologicas y Ambientales, 24071 Leon, Spain.E-mail: [email protected]
2007). Recently, del Rıo et al. (2011) carried out a studyon precipitation trends for the whole of Spain between1961 and 2006, and found negative trends in more than75% of the weather stations analysed. This decrease issignificant in 18% of mainland Spain.
The phenomenon of the North Atlantic Oscillation(NAO) is one of the most important factors in theclimate of the Northern Hemisphere, as it transports heatfrom one part of the world to the other (van Loon andRogers, 1978; Hurrell, 1996). Over the last few decades,especially since the 1980s (Hurrell and van Loon, 1997),a major increase in the annual NAO index has beenobserved, especially between the months of Decemberand March. The main consequences of this increase inthe NAO index are regional changes in the precipitationpatterns (Hurrell, 1995; Dai et al., 1997). Hurrell and vanLoon (1997) showed that a high NAO index during thewinter correspond to higher than normal precipitationin western Scandinavia, Denmark and northern partsof Ireland and Great Britain. In contrast, a high NAOindex leads to drier than normal conditions in the IberianPeninsula and the western Balkans. As a result of theincrease observed in the NAO index, there has beena drop in winter precipitation in southwestern Europe.This trend is not easy to see in the case of Spain
Copyright 2011 Royal Meteorological Society
brought to you by COREView metadata, citation and similar papers at core.ac.uk
provided by Agencia Estatal de Meteorología
2182 S. FERNANDEZ-GONZALEZ et al.
due to the complex spatial and temporal distribution ofthe precipitation, as the vast majority of the country isaffected by a Mediterranean climate.
The NAO index is the most important parameter usedto model the winter rainfall regime in the Iberian Penin-sula (Rodo et al., 1997; Trigo and Palutikof, 2001). Goodcorrelations were obtained between winter precipitationand the NAO index in different territories of Spain (Zoritaet al., 1992; Munoz-Dıaz and Rodrigo, 2004; Garcıaet al., 2005; Lorenzo and Taboada, 2005; Rodrigo andTrigo, 2007; Queralt et al., 2009), and an attempt hasbeen made to predict precipitation using the values ofthe NAO index (Castro et al., 2011). In the westernMediterranean area, the NAO may explain up to 50% ofthe variability of precipitation during the spring (Martınet al., 2004).
The modes of variability and weather types are twoapproaches for dealing with atmospheric circulation.Initially, weather types were classified according to thedominant synoptic situation on a given day. This involvedestablishing a series of specific isobaric configurations,and all the days when isobars had this configurationwere assigned to the same type. This meant that thecirculation was classified based on sea level pressure.This is actually a circulation-to-environment approach.Today, there is a tendency to use weather types classifiedaccording to objective criteria, such as those developedby Spellman (2000), which have the advantage of beingobserver-independent. The models used for the automaticclassification of the synoptic situation were initiallydeveloped for the British Isles (Jones et al., 1993). Huthet al. (2008) have offered an excellent review aboutcatalogues of circulation-types classifications.
In recent years, several authors have published differ-ent automatic classification models for the Iberian Penin-sula, most of which are connected to a specific climaticapplication. Goodess and Palutikof (1998) adapted one ofthese methods for the southeast of Spain. In a later study,Goodess and Jones (2002), identifying the relationshipsbetween large-scale atmospheric circulation and dailyprecipitation in different parts of the Iberian Peninsula,demonstrated the relationship between an increased fre-quency of the anticyclonic weather type and an increasein the NAO index. They also found positive correla-tions between the frequency of the cyclonic weather typeand precipitation in many parts of the Iberian Penin-sula. Corte-Real et al. (1999) established four daily atmo-spheric circulation patterns associated with precipitationin Portugal: ‘blocking-like’, ‘summer dry’, ‘winter dry’and ‘rainy’.
Classifications of this kind have also been used toobtain climate change scenarios (Goodess and Palutikof,1998), even associating the electrical activity of stormswith atmospheric circulation (Tomas et al., 2004). Someauthors have gone even further and proposed methodsfor predicting precipitation, based on the relationshipsbetween atmospheric circulation and precipitation (Heyenet al., 1996; Zorita and von Storch, 1997). Queralt et al.(2009) claim that the NAO index and weather types have
a significant influence on rainfall regimes, with the effectsvarying widely depending on the area of the IberianPeninsula selected.
Recently, these automatic classification methods havebeen used to study variability and changes in the charac-teristics of precipitation (Paredes et al., 2006). Lorenzoet al. (2008) modified the method developed by Trigoand DaCamara (2000) to adapt it to the Spanish regionof Galicia.
Several authors have focused their studies on the wintermonths (Rodrıguez-Puebla et al., 2001; Saenz et al.,2001). Zorita et al. (1992) confirmed the relationshipbetween NAO and winter precipitation in the IberianPeninsula. It also focused on the winter months, as thisis when the most significant results are obtained.
In this study, a logistic regression model has beenused to define a nowcast on whether precipitation willbe registered or not on a given day in our study area,based on the parameters used to obtain weather typesand the NAO index. This type of model has alreadybeen used to study the environment. For example, Jomeliet al. (2007) make use of a logistic regression model toanalyse the probability of avalanches occurring, basedon the precipitation registered on the day before theavalanche, the precipitation that has fallen on the dayof the avalanche and on the previous day, or only on theday of the avalanche.
Logistic regression models have also been used for theshort-term forecasting of storms and hailstorms (Marcos-Menendez, 2001). This study offers a forecast in binaryterms (yes/no) for storm phenomena. Angus et al. (1988)and Billet et al. (1997) both used this type of model forthe short-term forecasting of storm events. This modelhas also been used to study the probability of precipitation(Crosby et al., 1995), and, more recently, the visibilityfactor at airports (Hiliker and Fritsch, 1999).
The main aims of this article are to:
1. Obtain an objective classification of weather typesin Leon, Spain, from January 1948 to March 2009,identifying significant variations of their frequency ona monthly, seasonal and annual scale.
2. Analyse the trends observed from 1948 to 2009 inwinter precipitation in the city of Leon.
3. Compute the relative contribution of each weathertype and the NAO to precipitation in Leon, especiallyduring the winter months.
4. Derive a downscaling system for daily rainfall basedon a logistic regression model, using various parame-ters elaborated from sea level pressure data.
This article is organized as follows: Section 2 definesthe study area; Section 3 details the data and methodologyused; Section 4 details the different results obtained inthis article, together with the discussion. Finally, Section5 offers a summary of the conclusions, followed by theacknowledgements and bibliographic references.
Copyright 2011 Royal Meteorological Society Int. J. Climatol. 32: 2181–2196 (2012)
NAO, WEATHER TYPES AND PRECIPITATION IN LEON 2183
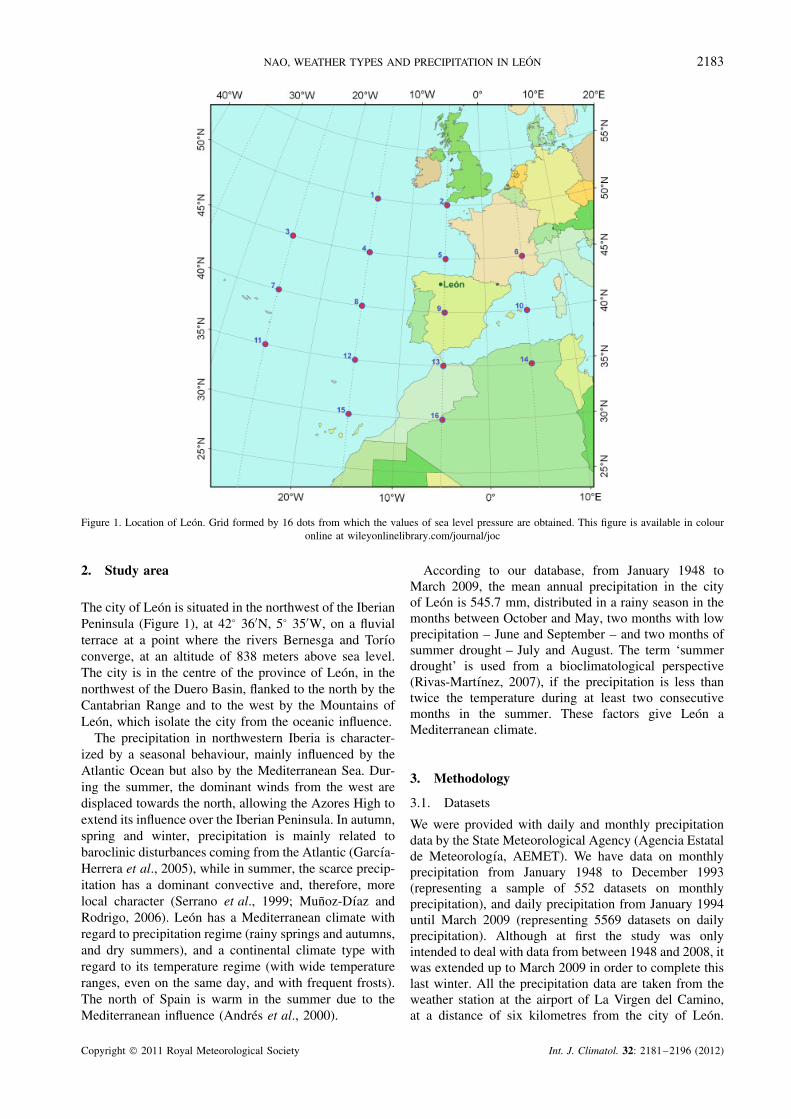
Figure 1. Location of Leon. Grid formed by 16 dots from which the values of sea level pressure are obtained. This figure is available in colouronline at wileyonlinelibrary.com/journal/joc
2. Study area
The city of Leon is situated in the northwest of the IberianPeninsula (Figure 1), at 42° 36′N, 5° 35′W, on a fluvialterrace at a point where the rivers Bernesga and Torıoconverge, at an altitude of 838 meters above sea level.The city is in the centre of the province of Leon, in thenorthwest of the Duero Basin, flanked to the north by theCantabrian Range and to the west by the Mountains ofLeon, which isolate the city from the oceanic influence.
The precipitation in northwestern Iberia is character-ized by a seasonal behaviour, mainly influenced by theAtlantic Ocean but also by the Mediterranean Sea. Dur-ing the summer, the dominant winds from the west aredisplaced towards the north, allowing the Azores High toextend its influence over the Iberian Peninsula. In autumn,spring and winter, precipitation is mainly related tobaroclinic disturbances coming from the Atlantic (Garcıa-Herrera et al., 2005), while in summer, the scarce precip-itation has a dominant convective and, therefore, morelocal character (Serrano et al., 1999; Munoz-Dıaz andRodrigo, 2006). Leon has a Mediterranean climate withregard to precipitation regime (rainy springs and autumns,and dry summers), and a continental climate type withregard to its temperature regime (with wide temperatureranges, even on the same day, and with frequent frosts).The north of Spain is warm in the summer due to theMediterranean influence (Andres et al., 2000).
According to our database, from January 1948 toMarch 2009, the mean annual precipitation in the cityof Leon is 545.7 mm, distributed in a rainy season in themonths between October and May, two months with lowprecipitation – June and September – and two months ofsummer drought – July and August. The term ‘summerdrought’ is used from a bioclimatological perspective(Rivas-Martınez, 2007), if the precipitation is less thantwice the temperature during at least two consecutivemonths in the summer. These factors give Leon aMediterranean climate.
3. Methodology
3.1. Datasets
We were provided with daily and monthly precipitationdata by the State Meteorological Agency (Agencia Estatalde Meteorologıa, AEMET). We have data on monthlyprecipitation from January 1948 to December 1993(representing a sample of 552 datasets on monthlyprecipitation), and daily precipitation from January 1994until March 2009 (representing 5569 datasets on dailyprecipitation). Although at first the study was onlyintended to deal with data from between 1948 and 2008, itwas extended up to March 2009 in order to complete thislast winter. All the precipitation data are taken from theweather station at the airport of La Virgen del Camino,at a distance of six kilometres from the city of Leon.
Copyright 2011 Royal Meteorological Society Int. J. Climatol. 32: 2181–2196 (2012)

2184 S. FERNANDEZ-GONZALEZ et al.
This station lies on flat, open terrain, and is not affectedby the recent urban expansion of the city. This is acomplete dataset, i.e. no intervention has been requiredto reconstruct or complete it.
With regard to the daily sea level pressure data,required to calculate the weather type, these wereobtained from the National Center for AtmosphericResearch (NCAR). Daily sea level pressure data are avail-able for 16 grid points, from January 1948 to March 2009(weather type data sample = 22 373 days). In order tocalculate the values of the NAO index, data were alsoobtained from the same source. A specific daily NAOindex was created, by subtracting the value of point 65°
North, 22.5° West (approximately 1° to the south and 1°
to the west of Reykjavik) from the pressure value forpoint 37.5° North, 5° West (approximately 1° to the northand 0.2° to the east of Gibraltar), as the index obtainedfrom these points is better adapted to our latitudes. It wasfound that on a monthly scale, the values of the NAOindex calculated this way coincide with those calculatedfrom the exact definition of the NAO index (Jones et al.,1997).
3.2. Weather types
In order to achieve our objective, we applied the proce-dure described by Lamb (1972), further developed at alater stage by Jenkinson and Collison (1977) and Joneset al. (1993), and used to objectively define weather typesin the British Isles, from indices based on the directionand vorticity of the geostrophic wind. This method wassubsequently adapted by Trigo and DaCamara (2000) tostudy the rainfall regime in Portugal.
The classification of weather types was carried outobjectively and grouped weather types according to 6variables, calculated from daily sea level pressure at 16points around the Iberian Peninsula (Figure 1). It wasactually the same grid used by Trigo and DaCamara(2000). The six parameters used are: southerly flow(SF ), westerly flow (WF ), total flow (F ), southerly shearvorticity (ZS ), westerly shear vorticity (ZW ) and totalshear vorticity (Z). For a detailed explanation on thecalculation of these parameters and on the definition ofthe different types of circulation, see Trigo and DaCamara(2000). Paredes et al. (2006) also offer a good synthesisof this weather type classification scheme.
These values were calculated on a daily basis fromJanuary 1948 to March 2009. The method classifies thesynoptic situation for each day into one of the 26 possibletypes of atmospheric circulation (Table I).
In our study, we have not regrouped the hybrid typeswithin the non-directional types, contrary to other authors(Trigo and DaCamara, 2000; Lorenzo et al., 2008), asthe results obtained for the probability of precipitationand average daily rainfall were very different in the non-directional and the hybrid types; they were not consideredcomparable and, therefore, the 26 original weather typeswere maintained.
Table I. Classification of the 26 existing weather types.
WEATHER TYPES (26)
Directional types Non-directional types Hybrid types
Northerly (N) Anticyclonic (A) AN CNSoutherly (S) Cyclonic (C) ANW CNWEasterly (E) AW CWWesterly (W) ASW CSWNorthwesterly (NW) AS CSSouthwesterly (SW) ASE CSESoutheasterly (SE) AE CENortheasterly (NE) ANE CNE
3.3. Trend analysis
Linear and non-parametric models can be applied to carryout the trend analysis, both for the frequency of theweather types, monthly, seasonal and annual precipitationand the NAO index. In this study, linear correlation andthe Mann-Kendall test have been used for analysing thetrends. These methods have been described by Sneyers(1990) and del Rıo et al. (2005).
On describing the Mann-Kendall test, Sneyers (1990)indicates that both this method and parametric tests,such as the normal linear regression, are highly efficienttests and have the same asymptotic efficacy. The maindifference is that the Mann-Kendall test also makes itpossible to calculate the start of the trend. Nevertheless, inthis study, the linear model has also been used to identifyand characterize the trends.
Positive (negative) values indicate an upward (down-ward) trend in the frequency of the weather types or inthe precipitation. Throughout the whole article, values ofthe trends for a confidence level of 95 % (α = 0.05) willbe considered significant. The existence of a statisticallysignificant trend will be evaluated using the value of thelinear correlation coefficient r and the value u(t) of theMann-Kendall test (the trend is statistically significant if|u(t)| > 1.96).
3.4. Logistic regression model
The objective of this model is to provide a nowcastin binary terms (yes/no) of the precipitation expectedon a given day in Leon. The analysis has been carriedout with daily pressure and precipitation data frombetween January 1994 and March 2009. The sampleperiod consists of a total of 5569 days. The logisticregression model attempts to relate a response variable(in our case if it rained or not) in the best possible waywith a series of explanatory variables, which in our caseare SF, WF, F , ZS, ZW and the NAO index (the 2F andZ parameters have been excluded because they do notoffer any additional information to F , ZS and ZW ). Theresponse variable is discrete in nature, as it can only haveone of two values (yes/no), i.e. it is binary or dichotomic.We will therefore codify our response variable with thetwo possible values: 1 and 0. We will use value 1 for the
Copyright 2011 Royal Meteorological Society Int. J. Climatol. 32: 2181–2196 (2012)
NAO, WEATHER TYPES AND PRECIPITATION IN LEON 2185
days on which precipitation was recorded, and use value0 for the rest.
We will now turn to the mathematical description ofthe model, based on Kleinbaum (1992).
Firstly, the function we will refer to as the logisticfunction is defined as follows:
f (z) = 1
1 + e−z(1)
The range values of the function are between 0 and 1,namely:
0 ≤ f (z) ≤ 1 (2)
The values of the explanatory variables (which aremeteorological magnitudes) from a given day have beenincluded in the YES group or in the NO group afterclassifying the risk situations. The explanatory variablesare combined forming the variable z. This variable isthe base to compute the function f (z), which may havevalues between 0 and 1, making it possible to interpret thevalues of the logistic function as a probability function.As a result, the value of f (z) may be interpreted as therisk of a certain event occurring, with this risk increasingthe closer the value of f (z) approaches to 1.
The value of z is a linear combination of the explana-tory variables, whereby
z = α + (β1X1 + β2X2 + . . . + βnXn) (3)
where Xi are each of the meteorological magnitudesused as explanatory variables, α is the independentterm that provides the resulting model, and βi thecoefficients of each explanatory variable, also obtained bythe model, according to the data introduced that consistsof the explanatory variables and the response variable,measured for the total number of days included in thesample. In this case, n = 7. Having estimated these 7coefficients and the independent term, we arrive at thefinal expression
P(x) = 1
1 + e−(α+β1X1+β2X2+...+βnXn)(4)
where P(x) is the probability of rain on a certain day.This model has been evaluated using contingency
tables (Table II), also assessing other parameters ofinterest, such as the False Alarm Ratio (FAR), whichrepresents the days on which precipitation was notregistered, despite the fact that it had been predicted bythe model, and the Frequency Of Misses (FOM), whichrepresents the days on which precipitation was registered,but the model had not predicted rain (Table II). Of course,the lower these two values, the more reliable the model.
However, in order to establish the goodness of adichotomous prediction, it is not enough to know thenumber of mistakes that can distort the result to someextent, as when the z and y of the matrix provide anincorrect perspective of the forecast. In other words,the FAR and FOM indices are not sufficient: it is also
Table II. Contingency table for the logistic regression model,and forecast goodness indices.
PREDICTED
F(z) > 0.5 F(z) < 0.5
YES NO
Observed YES x Y
NO z W
FAR = zx + z
FOM = yx + y
T SS = xw − yz(x + y)(z + w)
HSS = 2(xw − yz)(x + z)(z + w) + (x + y)(y + w)
KSS = xw − yz(x + z)(y + w)
.
necessary to jointly analyse the four variables shown inthe contingency table (Table II). The forecast goodnessindices, which are usual in predictive models (Doswellet al., 1990; Jacovides and Yonetani, 1990), are basedon the calculation of skill scores to validate the model.For example, Sanchez et al. (1998) used this type ofdiscriminatory analysis in order to find the relationshipbetween a categorical variable and a series of interrelatedvariables in their study on the probability of stormsin Leon. In this study, three scores for validating theprediction of thunderstorms were calculated (Table II):the True Skill Statistic (TSS), described by Wilks (1995),occasionally referred to as Q by Dobryshman (1972); theHeidke Skill Score (HSS), defined by Panofsky and Brier(1958), which is equivalent to the TSS when the valuesof Y and Z are the same, and Kuipers Skill Score (KSS),proposed by Wilks (1995), which obtains more realisticresults in the forecasting of unusual events, such asstorms. Manzato (2005) proposed a simple approximationfor some of these indices, such as HSS and KSS, knownas the odds ratio. The odds ratio is parameterized asa function of the Probability of Detection (POD), andleads to a parameterisation of all the theoretical RelativeOperating Characteristic (ROC) curves.
The details of the skill scores have been described byJolliffe and Stephenson (2003). Their main features are:the definition of the TSS is the probability of a predictedevent occurring, minus the probability of an event notoccurring in an unexpected way; the Heidke Skill Score(HSS) provides a guarantee to correct all the forecaststhat are not exclusively due to chance (Huntrieser et al.,1997); the KSS index is better adapted to rare events,such as storms or hailstorms.
Obviously, the higher these three values, the moreefficient the model obtained. This leads us to considerthat the probability of rain falling on a given day mayperhaps not be the best criterion; establishing 0.5 asthe probability threshold discriminating between rainfalland no rainfall may not lead to the best values of theskill scores. So, we did the opposite, identifying the best
Copyright 2011 Royal Meteorological Society Int. J. Climatol. 32: 2181–2196 (2012)
2186 S. FERNANDEZ-GONZALEZ et al.
threshold value of the probability, in order to maximizethe forecast goodness indices.
4. Results and discussion
4.1. Classification of weather types
As mentioned above, a classification of daily weathertypes was set up from January 1948 to March 2009, usingdaily sea level pressure data from the National Centerfor Atmospheric Research (NCAR). This classificationcan be of great use for describing the climate of Leon.Table III summarizes this classification showing eachweather type with its average annual frequency, trend,probability of rainfall (based on the percentage of dayswith rainfall observed with each weather type) and theprecipitation measured on days with rainfall.
The average yearly frequency and the trend werecalculated using daily pressure data from January 1948 toMarch 2009, while the probability of rainfall and averageprecipitation for days with rainfall have been calculatedusing data from January 1994 to March 2009.
The table shows that the anticyclonic weather type isclearly dominant in terms of frequency, with an averageof more than 81 days per year. This coincides withthe result obtained by Lorenzo et al. (2008), in theirstudy on the relationship between weather types andprecipitation in Galicia, Spain. It should also be noted thatthis frequency is increasing over the period considered,as revealed by the trend. Table III clearly and conciselyshows the relative importance of each weather type, asit not only depicts the average annual frequency of eachweather type, but also details the probability of rainfalland the expected precipitation.
Here, the positive trends of the weather types A, ASE,CSE, CN, SE, E and SW stand out. With the exceptionof CN and SW types, the rest are very dry weather types.However, we may see negative trends for the weathertypes ANE, AN, CW, NE and W. The negative trends ofthe weather types CW and W, together with the positivetrends of CSE, ASE, SE and E reflect a decrease in thefrequency of days with dominant winds from the west(during which there is a high probability of rainfall), andan increase in the days with predominant winds from theeast and southeast (very dry).
The highest daily precipitation was found in the CSWweather type, with average precipitation on days withrainfall of more than 9 mm. Rainfall averages of morethan 7 mm were also found for the weather types SW,CW and CNW, and more than 6 mm with C, CS, CEand W. In contrast, with the weather types A, ASE, AS,AE, ANE, AN and ANW the expected rainfall is virtuallyzero, as the probability of rainfall is less than 10%, orthe average precipitation on days with rainfall is less than2 mm.
4.2. Trends in weather type frequencies
The analysis included the trends for the main weathertypes from 1948 to 2008. We selected the ‘anticyclonic’
Table III. Objective classification of the frequency of differentweather types in Leon (January 1948–March 2009). The trendis shown by the correlation coefficient (significant values forα = 0.05 are marked with ∗ ). The data on the probability ofrainfall and daily average rainfall are based on readings made
between January 1994 and March 2009.
1948–2009 1994–2009
Weathertypes
Annual averagefrequency
(days)
Trend Probabilityof rainfall
(%)
DailyAveragerainfall(mm)
A 81.4 0.16 13.0 1.6AS 2.3 0.00 2.9 4.5ASE 2.6 0.17 2.3 0.3AE 5.7 0.01 4.7 0.8ANE 15.9 −0.24 4.1 1.7AN 15.8 −0.30∗ 15.1 1.7ANW 12.6 0.02 38.7 1.7AW 12.1 0.02 62.2 2.7ASW 6.5 0.09 43.0 2.5C 22.4 0.06 56.5 7.0CS 2.0 0.06 51.6 6.0CSE 2.3 0.13 26.9 1.2CE 3.6 −0.03 19.0 6.5CNE 5.4 −0.01 37.0 4.2CN 3.7 0.14 62.2 3.5CNW 2.2 0.06 89.3 7.1CW 2.7 −0.10 80.6 7.6CSW 2.8 0.08 89.1 9.0S 6.1 −0.09 34.1 2.2SE 7.3 0.11 6.7 3.0E 18.7 0.17 6.6 2.3NE 45.2 −0.20 11.0 3.4N 31.3 0.00 34.2 3.9NW 17.3 −0.09 57.7 2.8W 21.8 −0.13 81.7 6.0SW 15.8 0.11 70.5 7.4
(A), ‘cyclonic’ (C), ‘westerly’ (W) and ‘southwesterly’(SW) weather types, as they are considered the 4 mostimportant weather types when defining the climate ofLeon: The first of these weather types is the most frequentand, as will be seen in Section 4.3, the remaining threeare the main causes of the precipitation recorded in Leon.The aim of this analysis was to identify the causes of thetrends, and the possible consequences.
The ‘anticyclonic’ weather type (A) is very important,as it has a clearly prevailing influence on the climatein Leon. This synoptic situation appears in Leon whenthe Azores High is strengthened and shifted slightlyto the east of the Azores, with its front edge enteringthe Iberian Peninsula. In winter, it also appears whenthe Peninsula behaves as a source region of a verycold air mass, which acts as a barrier against oceanicfronts and low-pressure zones, leading to very stableweather. Another situation that may occur is when theEuropean anticyclone encompasses the Iberian Peninsula.This weather type is more frequent in the winter months
Copyright 2011 Royal Meteorological Society Int. J. Climatol. 32: 2181–2196 (2012)
NAO, WEATHER TYPES AND PRECIPITATION IN LEON 2187
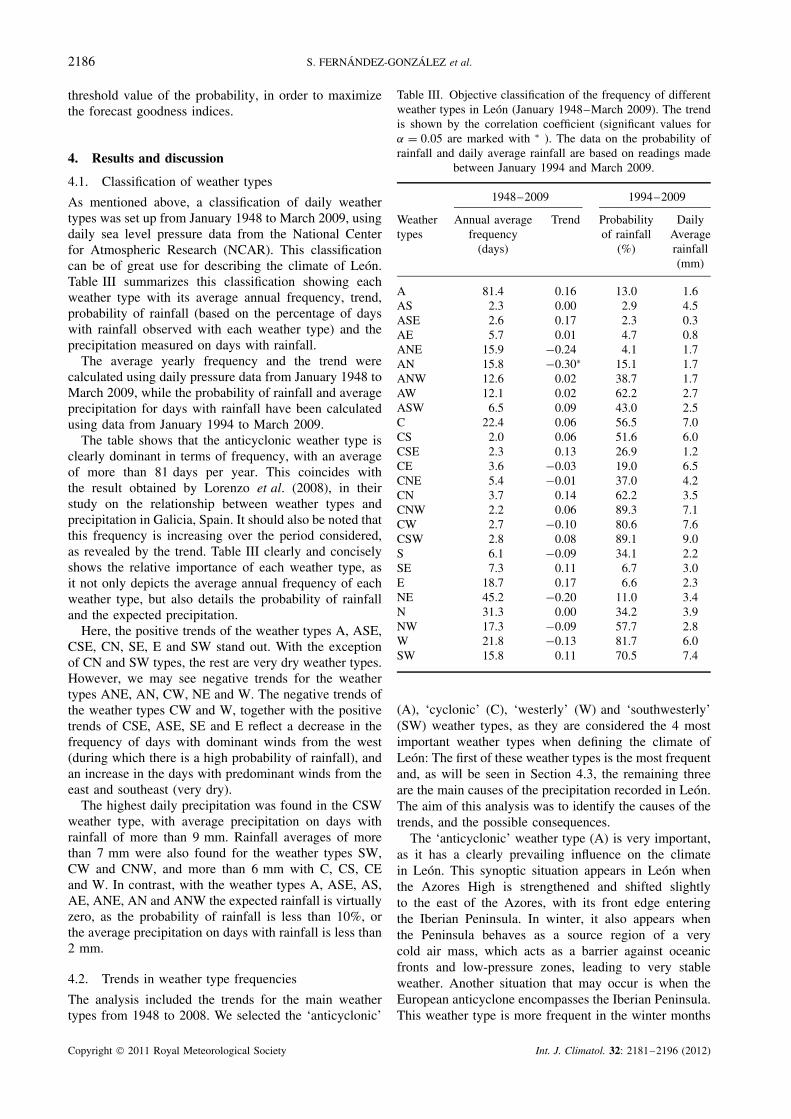
Figure 2. Frequency of selected weather types between the months of December and March (1948–2008). The thick lines represent the‘anticyclonic’ (A) weather type and its trend, and the fine lines represent the ‘cyclonic’ (C), ‘westerly’ (W) and ‘southwesterly’ (SW) weather
types and their trends. This figure is available in colour online at wileyonlinelibrary.com/journal/joc
(with a frequency of 35%), with a very low probability ofprecipitation during these days, of around 13%. It leadsto very stable weather conditions, causing radiation fogand severe frost in winter.
The frequency of this synoptic situation has increasedsignificantly over the last few decades, especially inwinter (Figure 2), and it is now one of the causesfor the decrease in precipitation during the monthsDecember to March. In all likelihood, the increase ofthe NAO index over the last few decades has led tothe increase in the frequency of the anticyclonic weathertype. This is in agreement with other studies, for example:Pozo-Vazquez et al. (2004) have detected an associationbetween NAO and solar radiation due to cloudless(anticyclonic) weather; del Rıo et al. (2005) found thata high NAO index causes frequent anticyclones and dryweather over wide areas of southern Europe; and Paredeset al. (2006) observed that low-pressure systems havebecome less frequent during the past four decades, whenpositive NAO phases have been detected.
In contrast, a significant decrease has been noted in thetotal frequencies of the three weather types responsiblefor most of the precipitation, as discussed in Section4.3. This decrease is most prominent in the wintermonths (Figure 2). The three synoptic situations are‘cyclonic’ (C), ‘westerly’ (W) and ‘southwesterly’ (SW)and occur when the Azores High is weakened, allowingthe Icelandic Low to shift to lower latitudes facilitatingor allowing the arrival of associated fronts to the IberianPeninsula.
If we compare both curves in Figure 2, we can seethat the years with a high ‘anticyclonic’ frequency havelow values for the frequency of the three rainiest weathertypes, and vice versa. On quantifying the relationshipbetween both frequencies, a significant correlation coef-ficient has been found. This leads us to believe that the
frequency of these weather types is controlled by anothervariable, probably the NAO index.
4.3. Weather types and precipitation
With the aim of studying the relationship betweenweather types and precipitation in Leon, these data wereanalysed on a daily basis in order to obtain a classifica-tion of the characteristics of the precipitation in the studyzone that could help us understand the local climatologyin greater detail. The amount of rainfall provided daily byeach weather type between 1994 and 2008 was calculatedto estimate the relative importance of each weather type.The result was that the ‘cyclonic’ (C), ‘westerly’ (W) and‘south-westerly’ (SW) types provide more precipitationthan the other 23 types taken together.
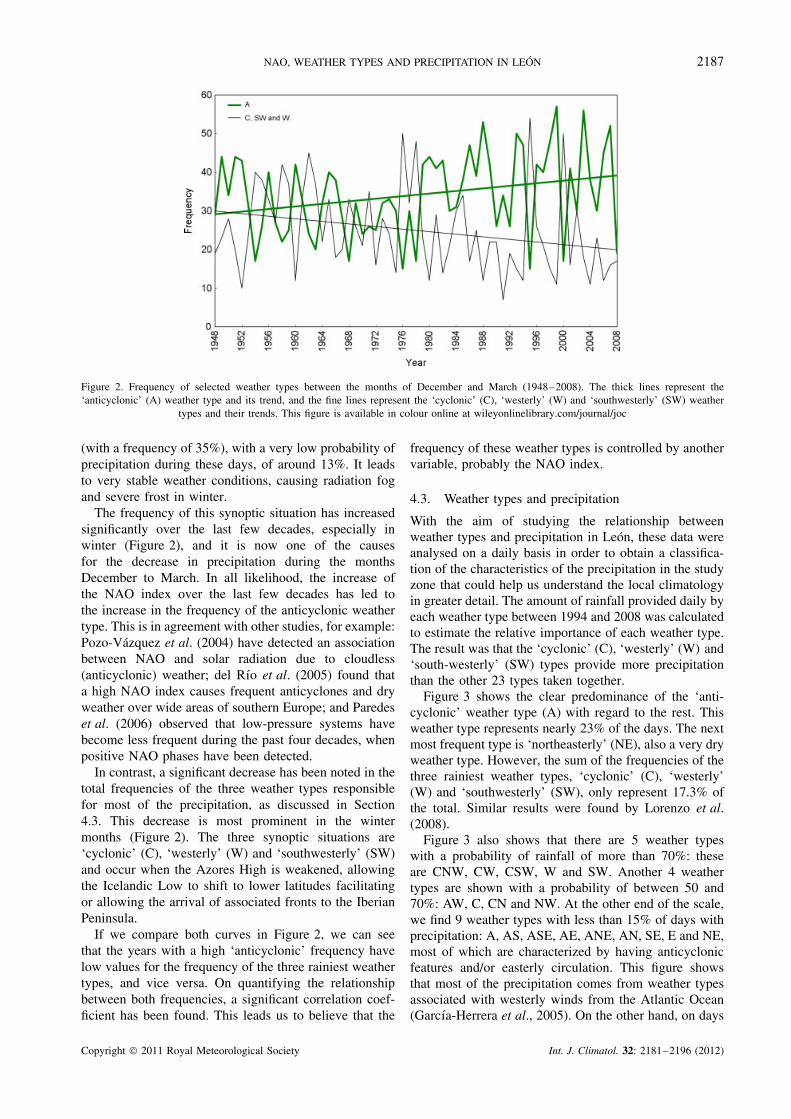
Figure 3 shows the clear predominance of the ‘anti-cyclonic’ weather type (A) with regard to the rest. Thisweather type represents nearly 23% of the days. The nextmost frequent type is ‘northeasterly’ (NE), also a very dryweather type. However, the sum of the frequencies of thethree rainiest weather types, ‘cyclonic’ (C), ‘westerly’(W) and ‘southwesterly’ (SW), only represent 17.3% ofthe total. Similar results were found by Lorenzo et al.(2008).
Figure 3 also shows that there are 5 weather typeswith a probability of rainfall of more than 70%: theseare CNW, CW, CSW, W and SW. Another 4 weathertypes are shown with a probability of between 50 and70%: AW, C, CN and NW. At the other end of the scale,we find 9 weather types with less than 15% of days withprecipitation: A, AS, ASE, AE, ANE, AN, SE, E and NE,most of which are characterized by having anticyclonicfeatures and/or easterly circulation. This figure showsthat most of the precipitation comes from weather typesassociated with westerly winds from the Atlantic Ocean(Garcıa-Herrera et al., 2005). On the other hand, on days
Copyright 2011 Royal Meteorological Society Int. J. Climatol. 32: 2181–2196 (2012)
2188 S. FERNANDEZ-GONZALEZ et al.
Figure 3. Frequency and percentage of days with rainfall for each weather type between 1994 and 2008. This figure is available in colour onlineat wileyonlinelibrary.com/journal/joc
with weather types accompanied by easterly winds (whenthe air reaching Leon is dry), practically no precipitationis recorded.
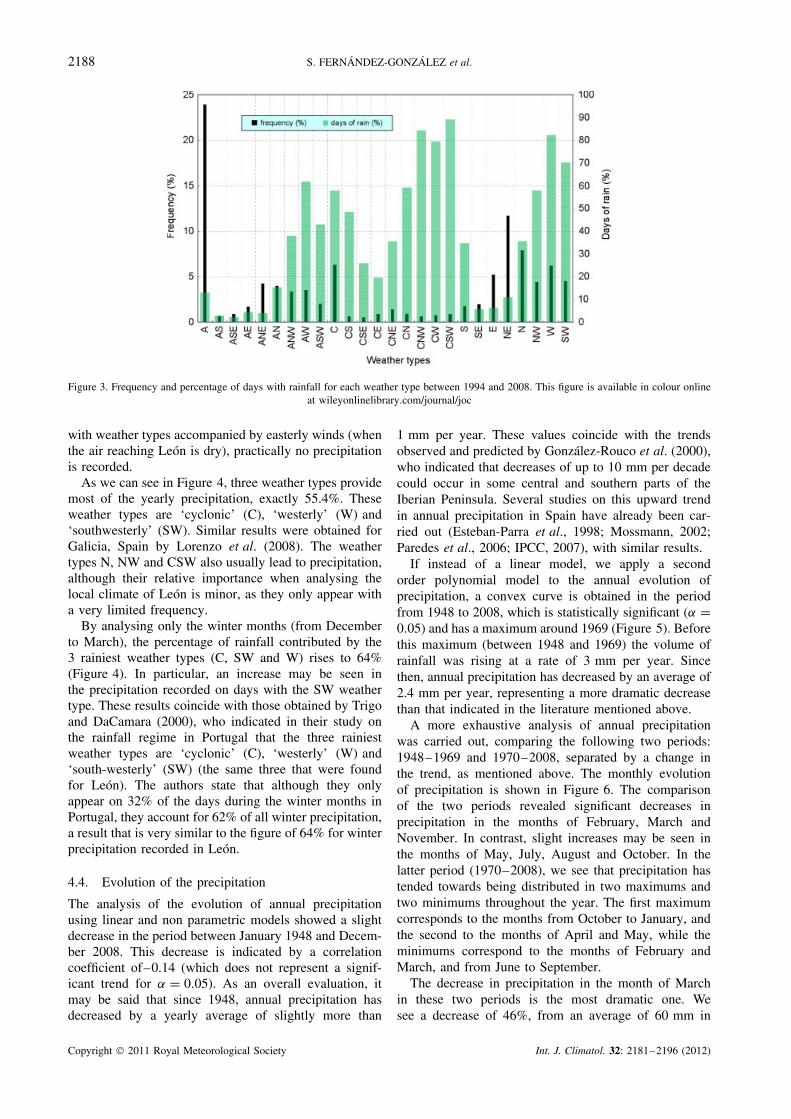
As we can see in Figure 4, three weather types providemost of the yearly precipitation, exactly 55.4%. Theseweather types are ‘cyclonic’ (C), ‘westerly’ (W) and‘southwesterly’ (SW). Similar results were obtained forGalicia, Spain by Lorenzo et al. (2008). The weathertypes N, NW and CSW also usually lead to precipitation,although their relative importance when analysing thelocal climate of Leon is minor, as they only appear witha very limited frequency.
By analysing only the winter months (from Decemberto March), the percentage of rainfall contributed by the3 rainiest weather types (C, SW and W) rises to 64%(Figure 4). In particular, an increase may be seen inthe precipitation recorded on days with the SW weathertype. These results coincide with those obtained by Trigoand DaCamara (2000), who indicated in their study onthe rainfall regime in Portugal that the three rainiestweather types are ‘cyclonic’ (C), ‘westerly’ (W) and‘south-westerly’ (SW) (the same three that were foundfor Leon). The authors state that although they onlyappear on 32% of the days during the winter months inPortugal, they account for 62% of all winter precipitation,a result that is very similar to the figure of 64% for winterprecipitation recorded in Leon.
4.4. Evolution of the precipitation
The analysis of the evolution of annual precipitationusing linear and non parametric models showed a slightdecrease in the period between January 1948 and Decem-ber 2008. This decrease is indicated by a correlationcoefficient of–0.14 (which does not represent a signif-icant trend for α = 0.05). As an overall evaluation, itmay be said that since 1948, annual precipitation hasdecreased by a yearly average of slightly more than
1 mm per year. These values coincide with the trendsobserved and predicted by Gonzalez-Rouco et al. (2000),who indicated that decreases of up to 10 mm per decadecould occur in some central and southern parts of theIberian Peninsula. Several studies on this upward trendin annual precipitation in Spain have already been car-ried out (Esteban-Parra et al., 1998; Mossmann, 2002;Paredes et al., 2006; IPCC, 2007), with similar results.
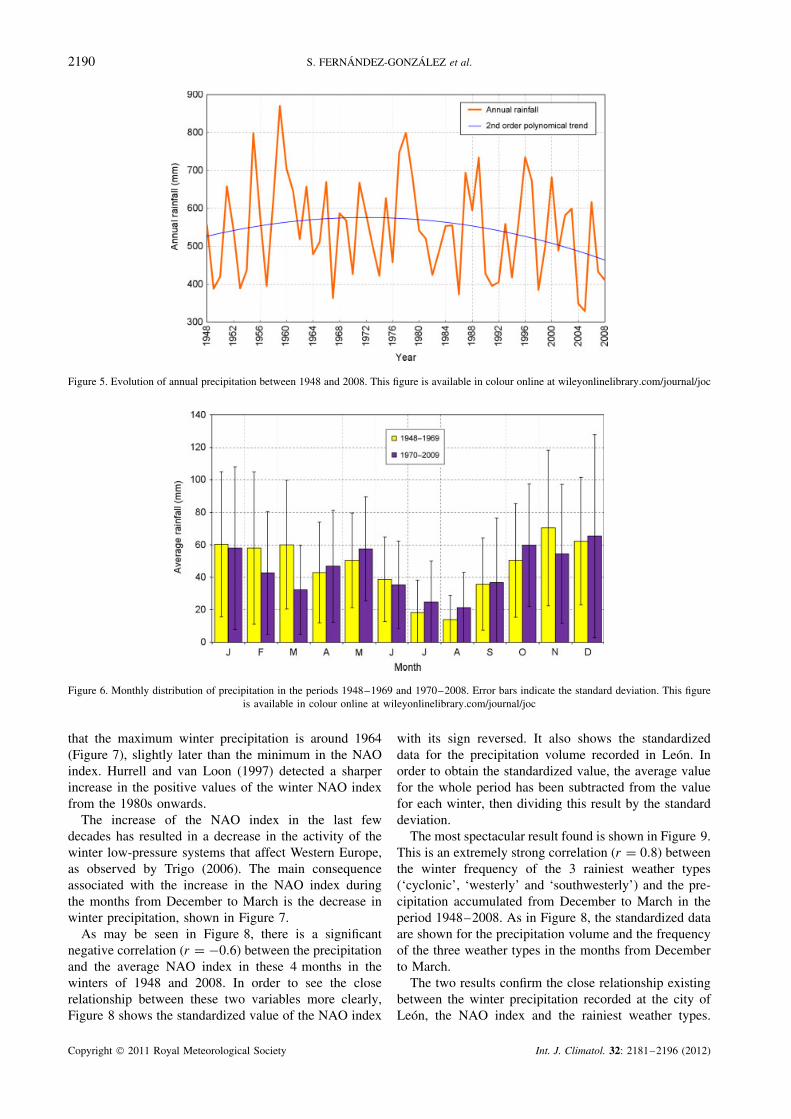
If instead of a linear model, we apply a secondorder polynomial model to the annual evolution ofprecipitation, a convex curve is obtained in the periodfrom 1948 to 2008, which is statistically significant (α =0.05) and has a maximum around 1969 (Figure 5). Beforethis maximum (between 1948 and 1969) the volume ofrainfall was rising at a rate of 3 mm per year. Sincethen, annual precipitation has decreased by an average of2.4 mm per year, representing a more dramatic decreasethan that indicated in the literature mentioned above.
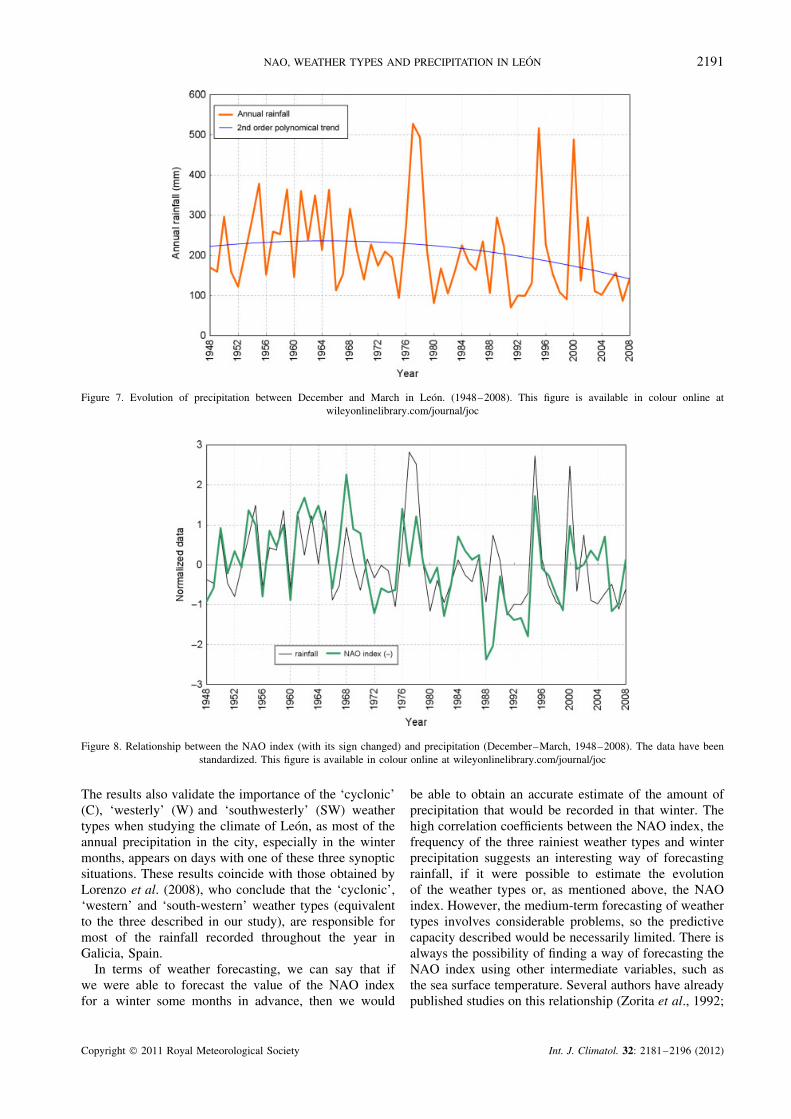
A more exhaustive analysis of annual precipitationwas carried out, comparing the following two periods:1948–1969 and 1970–2008, separated by a change inthe trend, as mentioned above. The monthly evolutionof precipitation is shown in Figure 6. The comparisonof the two periods revealed significant decreases inprecipitation in the months of February, March andNovember. In contrast, slight increases may be seen inthe months of May, July, August and October. In thelatter period (1970–2008), we see that precipitation hastended towards being distributed in two maximums andtwo minimums throughout the year. The first maximumcorresponds to the months from October to January, andthe second to the months of April and May, while theminimums correspond to the months of February andMarch, and from June to September.
The decrease in precipitation in the month of Marchin these two periods is the most dramatic one. Wesee a decrease of 46%, from an average of 60 mm in
Copyright 2011 Royal Meteorological Society Int. J. Climatol. 32: 2181–2196 (2012)
NAO, WEATHER TYPES AND PRECIPITATION IN LEON 2189
Figure 4. Percentage of annual and winter (December–March) precipitation for each weather type between 1994 and 2008. This figure is availablein colour online at wileyonlinelibrary.com/journal/joc
the months of March between 1948–1969, to 33 mmbetween 1970 and 2008. Also noteworthy is the decreasein precipitation in the month of November, from anaverage of more than 70 mm to barely 54 mm, a decreaseof 24%. Del Rıo et al. (2011) obtained similar results inmost of Spain.
Considering the overall period (1948–2008), the high-est monthly decrease in precipitation also occurs in themonth of March, with a statistically significant negativetrend (r = −0.27). The decrease seen in this month hasbeen confirmed by numerous studies (Trigo and DaCa-mara, 2000; Mossmann, 2002; del Rıo et al., 2005). Sta-tistically significant negative trends are found in centralparts of Spain (Mossmann et al., 2004). Paredes et al.(2006) relate this to the increase in the NAO index inthis month over the last 4 decades.
On a seasonal scale, negative trends were found inspring, summer and winter. Decreases in precipitation inspring have also been found by authors such as Trigo andDaCamara (2000), Hurrell et al. (1995) and Paredes et al.(2006). During the summer months, negative trends inprecipitation have already been described by Hurrell et al.(1995) and by the IPCC (2007). In contrast, a slightlypositive, but non-significant, trend appears in autumn.Positive trends in autumn precipitation in the Duero Basinhave been found by Ceballos et al. (2004).
The most prominent change in recent years is thedecrease in winter precipitation (December, January,February and March). The decrease observed in recentyears in the frequency of these three weather types as aresult of the increase of the NAO index during these fourmonths results in a sharp decrease in winter precipitation(Figure 7). This decline is significant, according to theMann-Kendall test, and reflects the fact that since 1948winter precipitation has decreased by an average of1.4 mm per year.
To study the changes in precipitation behaviour in thewhole period and compare it with the NAO index, a
nonlinear model was checked. An order-2 model offers abetter fit than a linear model, and provides a statisticallysignificant convex curve. This curve reaches its maximumin 1964. After that year it goes down steadily until 2008,at an average rate of 1.8 mm per year (Figure 7).
This decrease in precipitation during the winter monthshas been confirmed by Caramelo and Manso-Orgaz(2007) for the Duero Basin, del Rıo et al. (2005) forCastile and Leon, and by Lopez-Bustins et al. (2008)for central and western zones of the Iberian Penin-sula. Rodrigo and Trigo (2007) and Lopez-Bustins et al.(2008) confirm the link between the decrease in win-ter precipitation in the Iberian Peninsula and changes inatmospheric circulation.
4.5. Relationship between NAO, weather typesand winter precipitation
Prior to the selection of variables for the logistic regres-sion model, a comprehensive correlation study is con-ducted between the December and March NAO indexand rainiest weather types. The NAO index was cho-sen as it is the mode that best defines the variability ofatmospheric circulation in the Atlantic zone of the North-ern Hemisphere (Rodo et al., 1997; Trigo and Palutikof,2001).
In the period between December and March, a con-siderable increase may be seen in the trend of the NAOindex. The linear trend model shows that this increaseoccurs with a significant correlation coefficient for themonths between December and March from 1948 to2008. The Mann-Kendal test for this series illustrates thatthe trend began around 1978.
In contrast, a nonlinear model of the trend (in thiscase a third-order polynomial model) reveals that theNAO behaves in a peculiar way: it decreases from 1948until reaching a minimum around 1962; then it increasesand reaches the maximum around 1994, after which itonce again decreases (Figure 8). Here we should note
Copyright 2011 Royal Meteorological Society Int. J. Climatol. 32: 2181–2196 (2012)
2190 S. FERNANDEZ-GONZALEZ et al.
Figure 5. Evolution of annual precipitation between 1948 and 2008. This figure is available in colour online at wileyonlinelibrary.com/journal/joc
Figure 6. Monthly distribution of precipitation in the periods 1948–1969 and 1970–2008. Error bars indicate the standard deviation. This figureis available in colour online at wileyonlinelibrary.com/journal/joc
that the maximum winter precipitation is around 1964(Figure 7), slightly later than the minimum in the NAOindex. Hurrell and van Loon (1997) detected a sharperincrease in the positive values of the winter NAO indexfrom the 1980s onwards.
The increase of the NAO index in the last fewdecades has resulted in a decrease in the activity of thewinter low-pressure systems that affect Western Europe,as observed by Trigo (2006). The main consequenceassociated with the increase in the NAO index duringthe months from December to March is the decrease inwinter precipitation, shown in Figure 7.
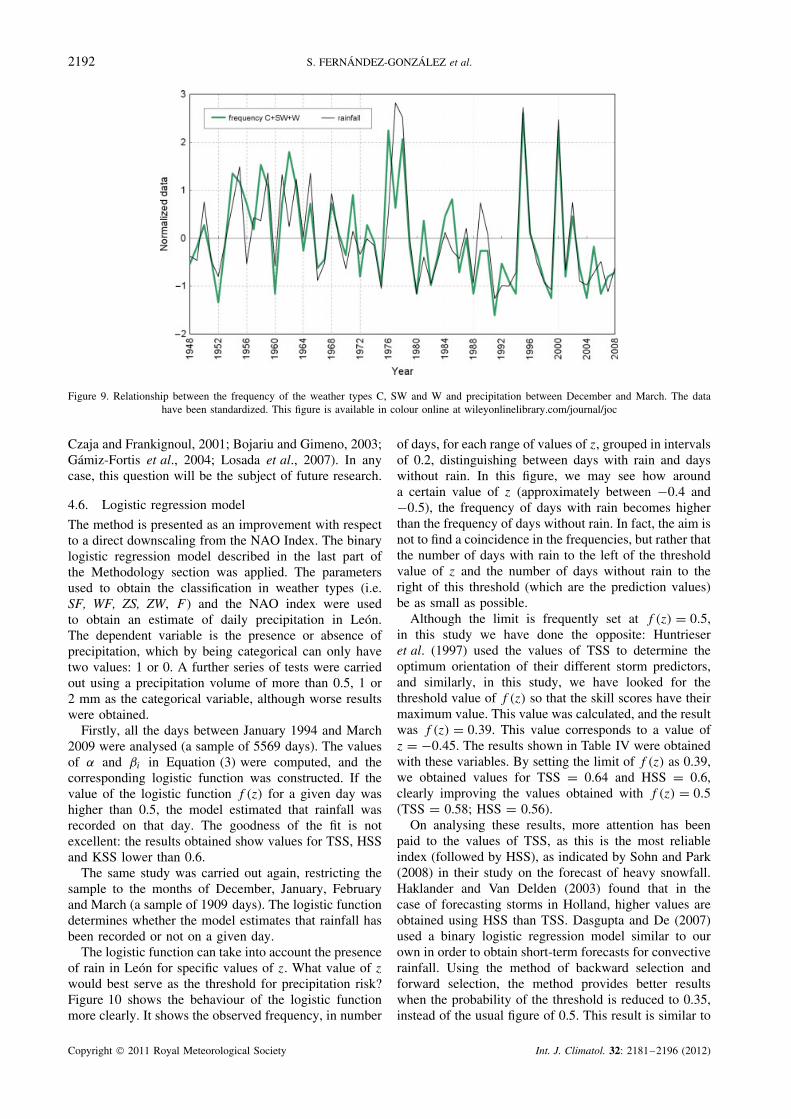
As may be seen in Figure 8, there is a significantnegative correlation (r = −0.6) between the precipitationand the average NAO index in these 4 months in thewinters of 1948 and 2008. In order to see the closerelationship between these two variables more clearly,Figure 8 shows the standardized value of the NAO index
with its sign reversed. It also shows the standardizeddata for the precipitation volume recorded in Leon. Inorder to obtain the standardized value, the average valuefor the whole period has been subtracted from the valuefor each winter, then dividing this result by the standarddeviation.
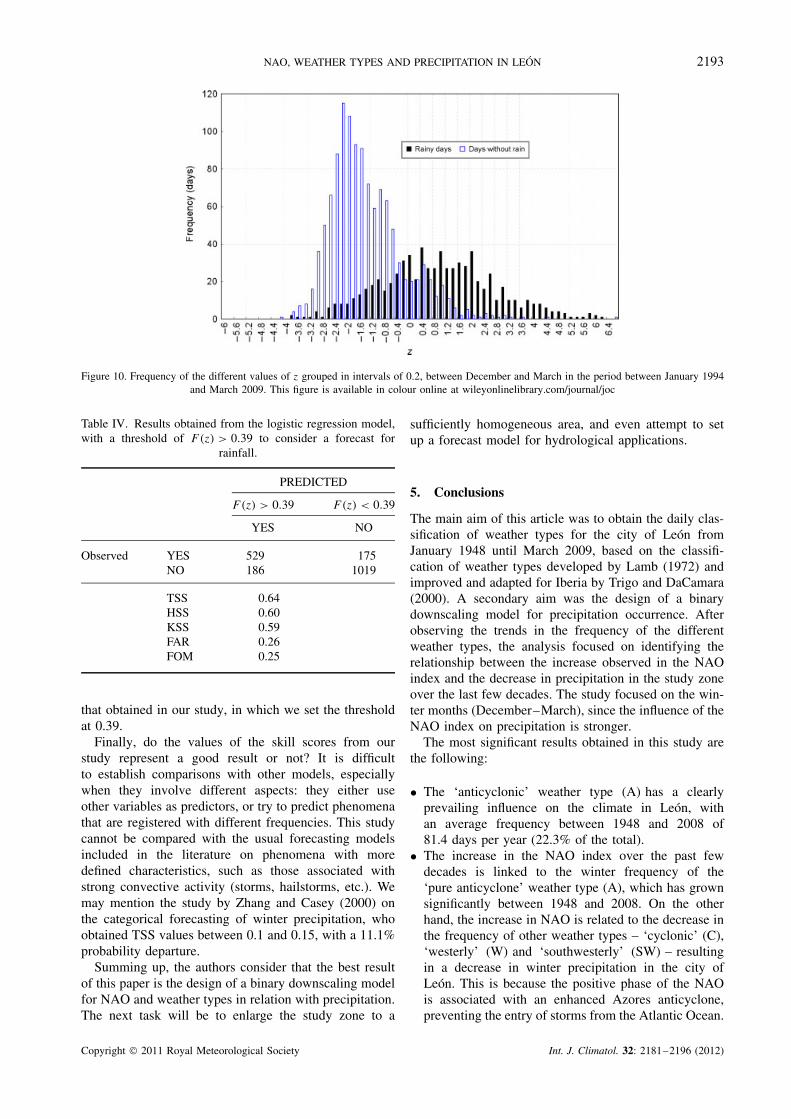
The most spectacular result found is shown in Figure 9.This is an extremely strong correlation (r = 0.8) betweenthe winter frequency of the 3 rainiest weather types(‘cyclonic’, ‘westerly’ and ‘southwesterly’) and the pre-cipitation accumulated from December to March in theperiod 1948–2008. As in Figure 8, the standardized dataare shown for the precipitation volume and the frequencyof the three weather types in the months from Decemberto March.
The two results confirm the close relationship existingbetween the winter precipitation recorded at the city ofLeon, the NAO index and the rainiest weather types.
Copyright 2011 Royal Meteorological Society Int. J. Climatol. 32: 2181–2196 (2012)
NAO, WEATHER TYPES AND PRECIPITATION IN LEON 2191
Figure 7. Evolution of precipitation between December and March in Leon. (1948–2008). This figure is available in colour online atwileyonlinelibrary.com/journal/joc
Figure 8. Relationship between the NAO index (with its sign changed) and precipitation (December–March, 1948–2008). The data have beenstandardized. This figure is available in colour online at wileyonlinelibrary.com/journal/joc
The results also validate the importance of the ‘cyclonic’(C), ‘westerly’ (W) and ‘southwesterly’ (SW) weathertypes when studying the climate of Leon, as most of theannual precipitation in the city, especially in the wintermonths, appears on days with one of these three synopticsituations. These results coincide with those obtained byLorenzo et al. (2008), who conclude that the ‘cyclonic’,‘western’ and ‘south-western’ weather types (equivalentto the three described in our study), are responsible formost of the rainfall recorded throughout the year inGalicia, Spain.
In terms of weather forecasting, we can say that ifwe were able to forecast the value of the NAO indexfor a winter some months in advance, then we would
be able to obtain an accurate estimate of the amount ofprecipitation that would be recorded in that winter. Thehigh correlation coefficients between the NAO index, thefrequency of the three rainiest weather types and winterprecipitation suggests an interesting way of forecastingrainfall, if it were possible to estimate the evolutionof the weather types or, as mentioned above, the NAOindex. However, the medium-term forecasting of weathertypes involves considerable problems, so the predictivecapacity described would be necessarily limited. There isalways the possibility of finding a way of forecasting theNAO index using other intermediate variables, such asthe sea surface temperature. Several authors have alreadypublished studies on this relationship (Zorita et al., 1992;
Copyright 2011 Royal Meteorological Society Int. J. Climatol. 32: 2181–2196 (2012)
2192 S. FERNANDEZ-GONZALEZ et al.
Figure 9. Relationship between the frequency of the weather types C, SW and W and precipitation between December and March. The datahave been standardized. This figure is available in colour online at wileyonlinelibrary.com/journal/joc
Czaja and Frankignoul, 2001; Bojariu and Gimeno, 2003;Gamiz-Fortis et al., 2004; Losada et al., 2007). In anycase, this question will be the subject of future research.
4.6. Logistic regression model
The method is presented as an improvement with respectto a direct downscaling from the NAO Index. The binarylogistic regression model described in the last part ofthe Methodology section was applied. The parametersused to obtain the classification in weather types (i.e.SF, WF, ZS, ZW, F ) and the NAO index were usedto obtain an estimate of daily precipitation in Leon.The dependent variable is the presence or absence ofprecipitation, which by being categorical can only havetwo values: 1 or 0. A further series of tests were carriedout using a precipitation volume of more than 0.5, 1 or2 mm as the categorical variable, although worse resultswere obtained.
Firstly, all the days between January 1994 and March2009 were analysed (a sample of 5569 days). The valuesof α and βi in Equation (3) were computed, and thecorresponding logistic function was constructed. If thevalue of the logistic function f (z) for a given day washigher than 0.5, the model estimated that rainfall wasrecorded on that day. The goodness of the fit is notexcellent: the results obtained show values for TSS, HSSand KSS lower than 0.6.
The same study was carried out again, restricting thesample to the months of December, January, Februaryand March (a sample of 1909 days). The logistic functiondetermines whether the model estimates that rainfall hasbeen recorded or not on a given day.
The logistic function can take into account the presenceof rain in Leon for specific values of z. What value of z
would best serve as the threshold for precipitation risk?Figure 10 shows the behaviour of the logistic functionmore clearly. It shows the observed frequency, in number
of days, for each range of values of z, grouped in intervalsof 0.2, distinguishing between days with rain and dayswithout rain. In this figure, we may see how arounda certain value of z (approximately between −0.4 and−0.5), the frequency of days with rain becomes higherthan the frequency of days without rain. In fact, the aim isnot to find a coincidence in the frequencies, but rather thatthe number of days with rain to the left of the thresholdvalue of z and the number of days without rain to theright of this threshold (which are the prediction values)be as small as possible.
Although the limit is frequently set at f (z) = 0.5,in this study we have done the opposite: Huntrieseret al. (1997) used the values of TSS to determine theoptimum orientation of their different storm predictors,and similarly, in this study, we have looked for thethreshold value of f (z) so that the skill scores have theirmaximum value. This value was calculated, and the resultwas f (z) = 0.39. This value corresponds to a value ofz = −0.45. The results shown in Table IV were obtainedwith these variables. By setting the limit of f (z) as 0.39,we obtained values for TSS = 0.64 and HSS = 0.6,clearly improving the values obtained with f (z) = 0.5(TSS = 0.58; HSS = 0.56).
On analysing these results, more attention has beenpaid to the values of TSS, as this is the most reliableindex (followed by HSS), as indicated by Sohn and Park(2008) in their study on the forecast of heavy snowfall.Haklander and Van Delden (2003) found that in thecase of forecasting storms in Holland, higher values areobtained using HSS than TSS. Dasgupta and De (2007)used a binary logistic regression model similar to ourown in order to obtain short-term forecasts for convectiverainfall. Using the method of backward selection andforward selection, the method provides better resultswhen the probability of the threshold is reduced to 0.35,instead of the usual figure of 0.5. This result is similar to
Copyright 2011 Royal Meteorological Society Int. J. Climatol. 32: 2181–2196 (2012)
NAO, WEATHER TYPES AND PRECIPITATION IN LEON 2193
Figure 10. Frequency of the different values of z grouped in intervals of 0.2, between December and March in the period between January 1994and March 2009. This figure is available in colour online at wileyonlinelibrary.com/journal/joc
Table IV. Results obtained from the logistic regression model,with a threshold of F(z) > 0.39 to consider a forecast for
rainfall.
PREDICTED
F(z) > 0.39 F(z) < 0.39
YES NO
Observed YES 529 175NO 186 1019
TSS 0.64HSS 0.60KSS 0.59FAR 0.26FOM 0.25
that obtained in our study, in which we set the thresholdat 0.39.
Finally, do the values of the skill scores from ourstudy represent a good result or not? It is difficultto establish comparisons with other models, especiallywhen they involve different aspects: they either useother variables as predictors, or try to predict phenomenathat are registered with different frequencies. This studycannot be compared with the usual forecasting modelsincluded in the literature on phenomena with moredefined characteristics, such as those associated withstrong convective activity (storms, hailstorms, etc.). Wemay mention the study by Zhang and Casey (2000) onthe categorical forecasting of winter precipitation, whoobtained TSS values between 0.1 and 0.15, with a 11.1%probability departure.
Summing up, the authors consider that the best resultof this paper is the design of a binary downscaling modelfor NAO and weather types in relation with precipitation.The next task will be to enlarge the study zone to a
sufficiently homogeneous area, and even attempt to setup a forecast model for hydrological applications.
5. Conclusions
The main aim of this article was to obtain the daily clas-sification of weather types for the city of Leon fromJanuary 1948 until March 2009, based on the classifi-cation of weather types developed by Lamb (1972) andimproved and adapted for Iberia by Trigo and DaCamara(2000). A secondary aim was the design of a binarydownscaling model for precipitation occurrence. Afterobserving the trends in the frequency of the differentweather types, the analysis focused on identifying therelationship between the increase observed in the NAOindex and the decrease in precipitation in the study zoneover the last few decades. The study focused on the win-ter months (December–March), since the influence of theNAO index on precipitation is stronger.
The most significant results obtained in this study arethe following:
• The ‘anticyclonic’ weather type (A) has a clearlyprevailing influence on the climate in Leon, withan average frequency between 1948 and 2008 of81.4 days per year (22.3% of the total).
• The increase in the NAO index over the past fewdecades is linked to the winter frequency of the‘pure anticyclone’ weather type (A), which has grownsignificantly between 1948 and 2008. On the otherhand, the increase in NAO is related to the decrease inthe frequency of other weather types – ‘cyclonic’ (C),‘westerly’ (W) and ‘southwesterly’ (SW) – resultingin a decrease in winter precipitation in the city ofLeon. This is because the positive phase of the NAOis associated with an enhanced Azores anticyclone,preventing the entry of storms from the Atlantic Ocean.
Copyright 2011 Royal Meteorological Society Int. J. Climatol. 32: 2181–2196 (2012)
2194 S. FERNANDEZ-GONZALEZ et al.
• On the basis of data from January 1994 to December2008, just three weather types (C, SW and W) accountfor 55.4% of the annual precipitation. In this sameperiod, there are five weather types with a percentageof days with rainfall higher than 70% (SW, W, CW,CSW and CNW).
• A linear analysis of the evolution of precipitation from1948 until 2008 shows a non-significant downwardtrend in annual precipitation, with an average decreaseof 1.1 mm/year if we consider the whole period. Anorder-2 model revealed that the annual precipitationreached its maximum in 1969, after which there isa continuous decrease by approximately 2.4 mm peryear.
• Comparing the periods 1948–1969 and 1970–2008,we see important decreases in precipitation in themonths of February, March and November. On theother hand, only slight increases have been found inthe months of May, July, August and October. Thedecrease in the month of March is the most dramaticone, plunging from an average of 60 mm in the period1948–1969, to just 33 mm between 1970 and 2008.
• Focusing on the winter months (from December toMarch), a statistically significant increase has beenfound in the NAO index (r = 0.3). Owing to thehigh negative correlation between the NAO index andprecipitation during the winter period (r = −0.6), thereis a major decrease in precipitation (r = −0.2).
• We found the most striking result on identifying therelationship between the frequency of the 3 rainiestweather types and the precipitation between Decemberand March (1948–2008). The resulting correlationcoefficient is 0.8.
• Using the logistic regression model for the dailyoccurrence of precipitation, acceptable results wereobtained (TSS = 0.64). These results are particularlynoteworthy, as only sea level pressure data were usedfor this model.
In the light of these results, we conclude that theincrease of the NAO index observed in the past fewdecades, which is more acute between December andMarch, causes a decrease in the frequency of the threeweather types responsible for most of the precipitation.As a result, there is a statistically significant decreasein winter precipitation. This proves that the NAO is thephenomenon that controls winter precipitation in the westof the Iberian Peninsula on a large scale, as suggested byHurrel and van Loon (1997).
The decrease of cyclonic activity over the past fewdecades in Western Europe (Trigo, 2006), and the increas-ing frequency of high pressures in atmospheric circulationpatterns (Stefanicki et al., 1998) may explain the decreasein winter precipitation in the Iberian Peninsula.
This paper has shown that by using exclusively pres-sure data to study precipitation, acceptable results areobtained for daily downscaling, although these modelsare more precise if they are based on a monthly basis.
Acknowledgements
This study was partially supported by the RegionalGovernment of Castile and Leon (Grants LE014A07 andLE039A10-2), and by the Spanish Ministry of Education(Grants TEC2007-63216 and TEC2010-19241-C02-01).
ReferencesAndres M, Tomas C, de Pablo F. 2000. Spatial patterns of the daily
non-convective rainfall in Castilla y Leon (Spain). InternationalJournal of Climatology 20: 1207–1224.
Angus PJ, Rasmussen S, Seiter K. 1988. Short-term prediction ofthunderstorm probability and intensity by screening observationaland derived predictors . 15th Conference on Severe Local Storms.AMS, Baltimore (1988). 368–371.
Billet J, Delisi M, Smith B, Gates C. 1997. Use of regressiontechniques to predict hail size and the probability of large hail.Weather and Forecasting 12: 154–164.
Bojariu R, Gimeno L. 2003. Predictability and numerical modelling ofthe North Atlantic Oscillation. Earth-Science Reviews 63: 145–168,DOI: 10.1016/s0012-8252(03)00036-9.
Caramelo L, Manso-Orgaz MD. 2007. A study of precipitationvariability in the Duero Basin (Iberian Peninsula). InternationalJournal of Climatology 27: 327–339, DOI: 10.1002/joc.1403.
Castro A, Vidal MI, Calvo AI, Fernandez-Raga M, Fraile R. 2011.May the NAO index be used to forecast rain in Spain? Atmosfera24: 251–265.
Ceballos A, Martınez-Fernandez J, Luengo-Ugidos MA. 2004. Anal-ysis of rainfall trends and dry periods on a pluviometric gra-dient representative of Mediterranean climate in the DueroBasin, Spain. Journal of Arid Environments 58: 215–233, DOI:10.1016/j.jaridenv.2003.07.002.
Corte-Real J, Qian B, Xu H. 1999. Circulation patterns, dailyprecipitation in Portugal and implications for climate changesimulated by the second Hadley Centre GCM. Climate Dynamics15: 921–935.
Crosby DS, Ferraro RR, Wu H. 1995. Estimating the probability ofrain in a SSM/I FOV using logistic regression. Journal of AppliedMeteorology 34: 2476–2480.
Czaja A, Frankignoul C. 2002. Observed Impact of Atlantic SSTAnomalies on the North Atlantic Oscillation. Journal of Climate 15:606–623.
Dai A, Fung IY, Del Genio AD. 1997. Surface observed global landprecipitation variations during 1900-88. Journal of Climate 10:2943–2962.
Dasgupta S, De UK. 2007. Binary Logistic Regression Models forshort term prediction of premonsoon convective developments overKolkata (India). International Journal of Climatology 27: 831–836,DOI: 10.1002/joc.1449.
del Rıo S, Herrero L, Fraile R, Penas A. 2011. Spatial distributionof rainfall trends in Spain (1961–2006). International Journal ofClimatology 31: 656–667, DOI: 10.1002/joc.2111.
del Rıo S, Penas A, Fraile R. 2005. Analysis of recent climaticvariations in Castile and Leon (Spain). Atmospheric Research 73:69–85, DOI: 10.1016/j.atmosres.2004.06.005.
Dobryshman EM. 1972. Review of Forecasting Verification Techniques.WMO: Geneva, Technical Note No. 120, 51.
Doswell CA, Davies-Jones R, Keller DL. 1990. On summary measuresof skill in rare event forecasting based on contingency tables.Weather Forecasting 5: 576–585.
Esteban-Parra MJ, Rodrigo FS, Castro-Diez Y. 1998. Spatial andtemporal patterns of precipitation in Spain for the period 1880–1992.International Journal of Climatology 18: 1557–1574.
Gamiz-Fortis SR, Pozo-Vazquez D, Esteban-Parra MJ, Castro-Dıez Y.2004. Influencia de la SST atlantica sobre las precipitaciones de laPenınsula Iberica. Fısica de la Tierra 16: 149–160.
Garcıa NO, Gimeno L, De La Torre L, Nieto R, Anel JA. 2005. NorthAtlantic Oscillation (NAO) and precipitation in Galicia (Spain).Atmosfera 18: 25–32.
Garcıa-Herrera R, Hernandez E, Paredes D, Barriopedro D, Corre-oso U, Prieto L. 2005. A MASCOTTE-based characterization ofMCSs over Spain, 2000–2002. Atmospheric Research 73: 261–282,DOI: 10.1016/j.atmosres.2004.11.003.
Gonzalez-Rouco JF, Heyen H, Zorita E, Valero F. 2000. Agreementbetween Observed Rainfall Trends and Climate Change Simulationsin the Southwest of Europe. Journal of Climate 13: 3057–3065.
Copyright 2011 Royal Meteorological Society Int. J. Climatol. 32: 2181–2196 (2012)
NAO, WEATHER TYPES AND PRECIPITATION IN LEON 2195
Goodess CM, Jones PD. 2002. Links between circulation and changesin the characteristics of Iberian rainfall. International Journal ofClimatology 22: 1593–1615, DOI: 10.1002/joc.810.
Goodess CM, Palutikof JP. 1998. Development of daily rainfallscenarios for southeast Spain using a circulation-type approachto downscalling. International Journal of Climatology 18:1051–1083.
Haklander AJ, Van Delden A. 2003. Thunderstorm predictors andtheir forecast skill for the Netherlands. Atmospheric Research 67:273–299, DOI: 10.1016/S0169-8095(03)00056-5.
Heyen H, Zorita E, von Storch H. 1996. Statistical downscaling ofmonthly mean North Atlantic air pressure to sea level anomaliesin the Baltic Sea. Tellus 48: 312–323.
Hiliker JL, Fritsch JM. 1999. An observations-based statistical systemfor warm-season hourly probabilistic forecast of low ceiling at theSan Francisco International Airport. Journal of Applied Meteorology38: 1692–1705.
Hulme M, Sheard N. 1999. Escenarios de cambio climatico para laPenınsula Iberica. Unidad de Investigacion Climatica, Reino Unido,6.
Huntrieser H, Schiesser HH, Schmid W, Waldvogel A. 1997. Compar-ison of traditional and newly developed thunderstorm indices forSwitzerland. Weather Forecast 12: 108–125.
Hurrell JW. 1995. Decadal trends in the North-Atlantic Oscil-lation – regional temperatures and precipitation. Science 269:676–679.
Hurrell JW. 1996. Influence of variations in extratropical winter-timeteleconnections on Northern Hemisfere temperatures. GeophysicalResearch Letters 23: 665–668.
Hurrell JW, van Loon H. 1997. Decadal variations in climateassociated with the North Atlantic Oscillation. Climatic Change 36:301–326.
Huth R, Beck C, Philipp A, Demuzere M, Ustrnul Z, Cahynova M,Kysely J, Tveito OE. 2008. Classifications of atmospheric circula-tion patterns. Recent Advances and Applications. In Trends anddirections in climate research. Annals of the New York Academyof Sciences, Gimeno L, GarciaHerrera R, Trigo RM (eds). 1146:105–152, DOI: 10.1196/annals.1446.019.
IPCC. 2007. Summary for Policymackers. In Climate Change 2007:The Physical Science Basis. Contribution of Working Group I to theFourth Assessment Report of the Intergovernmental Panel on ClimateChange, Solomon S, Qin D, Manning M, Chen Z, Marquis M,Averyt KB, Tignor M y Miller HL (eds), Cambridge UniversityPress: Cambridge, UK and New York, NY.
Jacovides CP, Yonetani T. 1990. An evaluation of stability indices forthunderstorm prediction in Greater Cyprus. Weather Forecasting 5:559–569.
Jenkinson AF, Collison FP. 1977. An initial climatology of gales overthe North sea. Synoptic Climatology Branch Memorandum No. 62.Meteorological Office: Bracknell, 18.
Jolliffe IT, Stephenson DB. 2003. Forecast verification: A practi-tioner’s guide in Atmospheric Sciences. John Wiley & Sons: WestSussex, 240.
Jomelli V, Delval C, Grancher D, Escande S, Brunstein D, Hetu B,Filion L, Pech P. 2007. Probabilistic analysis of recent snowavalanche activity and weather in the French Alps. Cold Regions Sci-ence and technology 47: 180–192, DOI: 10.1016/j.coldregions.2006.08.003.
Jones PD, Hulme M, Briffa KR. 1993. A comparison of Lamb circu-lation types with an objective classification scheme. InternationalJournal of Climatology 13: 655–663.
Jones PD, Jonsson T, Wheeler D. 1997. Extension to the NorthAtlantic Oscillation using early instrumental pressure observationsfrom Gibraltar and South-West Iceland. International Journal ofClimatology 17: 1433–1450.
Kleinbaum DG. 1992. Logistic regression. Springer-Verlag: New York.Lamb HH. 1972. British Isles weather types and register of daily
sequence of circulation patterns, 1861–1971. Geophysical Memoir116, HMSO: London, 85.
Lopez-Bustins JA, Martın-Vide J, Sanchez-Lorenzo A. 2008. Iberiawinter rainfall trends based upon changes in teleconnection andcirculation patterns. Global and Planetary Change 63: 171–176,DOI: 10.1016/j.gloplacha.2007.09.002.
Lorenzo MN, Taboada JJ. 2005. Influences of atmospheric variabilityon freshwater input in Galician Rias in winter. Journal of Atmosphereand Ocean Sciences 10: 377–387.
Lorenzo MN, Taboada JJ, Gimeno L. 2008. Links between circulationweather types and teleconnection patterns and their influence on
precipitation patterns in Galicia (NW Spain). International Journalof Climatology 28: 1493–1505, DOI: 10.1002/joc.1646.
Losada T, Rodrıguez-Fonseca B, Mechoso CR. 2007. Impacts of SSTanomalies on the North Atlantic atmospheric circulation: a case studyfor the northern winter 1995/1996. Climate Dynamics 29: 807–819,DOI: 10.1007/s00382-007-0261-x.
Manzato A. 2005. An Odds Ratio Parametrization for ROC Diagramand Skill Scores Indices. Weather and Forecasting 20: 918–930.
Marcos-Menendez JL. 2001. Aplicacion de modelos estadısticos dedecision dicotomica para la prediccion a corto plazo de tormentas ycaıda de granizo. PhD thesis, Universidad de Leon, 159.
Martın ML, Luna MY, Morata A, Valero F. 2004. North Atlantic Tele-connection patterns of low-frequency variability and their links withspringtime precipitation in the western Mediterranean. InternationalJournal of Climatology 24: 213–230, DOI: 10.1002/joc.993.
Mossmann V. 2002. Analise espacial e temporal das tendencias dasprecipitacoes na Espanha Peninsular. Doctoral thesis, 342.
Mossmann V, Castro A, Fraile R, Dessens J, Sanchez JL. 2004.Detection of statistically significant trends in the summerprecipitation of mainland Spain. Atmospheric Research 70: 43–53,DOI: 10.1016/j.atmosres.2003.11.002.
Munoz-Dıaz D, Rodrigo FS. 2004. Impacts of the North AtlanticOscillation on the probability of dry and wet winters in Spain.Climate Research 27: 33–43.
Munoz-Dıaz D, Rodrigo FS. 2006. Seasonal rainfall variations in Spain(1912–2000) and their links to atmospheric circulation. AtmosphericResearch 81: 94–110, DOI: 10.1016/j.atmosres.2005.11.005.
Panofsky HA, Brier GW. 1958. Some Applications of Statistics toMeteorology. Pennsylvania State University Press: University Park,224.
Paredes D, Trigo RM, Garcıa-Herrera R, Trigo IF. 2006. Understand-ing precipitation changes in Iberia in early spring: Weather typ-ing and storm-tracking approaches. Journal of Hydrometeorology 7:101–113.
Pozo-Vazquez D, Tovar-Pescador J, Gamiz-Fortis S, Esteban-Parra MJ,Castro-Dıez Y. 2004. Influencia de la NAO en la variabilidad de laradiacion solar en la region del Atlantico Norte. XXVIII Jornadas dela AME. 11–13 de Febrero. Universidad de Extremadura. Badajoz.
Queralt S, Hernandez E, Barriopedro D, Gallego D, Ribera P, CasanovaC. 2009. North Atlantic Oscillation influence and weather typesassociated with winter total and extreme precipitation events inSpain. Atmospheric Research 94: 675–683.
Rivas-Martınez S. 2007. Mapa de series, geoseries y geopermaseriesde vegetacion de Espana. Memoria del mapa de vegetacion potencialde Espana. Parte 1. Itinera Geobotanica 17: 1–222.
Rodo X, Baert E, Comin FA. 1997. Variations in seasonal rainfall inSouthern Europe during the present century: relationships with theNorth Atlantic Oscillation and the El Nino-Southern Oscillation.Climate Dynamics 13: 275–284.
Rodrigo FS, Trigo RM. 2007. Trends in daily rainfall in the IberianPeninsula from 1951 to 2002. International Journal of Climatology27: 513–529, DOI: 10.1002/joc.1409.
Rodrıguez-Puebla C, Encinas AH, Nieto S, Garmendia J. 1998. Spatialand Temporal patterns of annual precipitation variability overthe Iberian Peninsula. International Journal of Climatology 18:299–316.
Rodrıguez-Puebla C, Encinas AH, Saenz J. 2001. Winter precipitationover the Iberian Peninsula and its relationship to circulation indices.Hydrology and Earth System Sciences 5: 233–244.
Saenz J, Zubillaga J, Rodrıguez-Puebla C. 2001. Interannual variabil-ity of winter precipitation in northern Iberian Peninsula. InternationalJournal of Climatology 21: 1503–1513.
Sanchez JL, Fraile R, de la Fuente MT, Marcos JL. 1998. DiscriminantAnalysis Applied to the Forecasting of Thunderstorms. Meteorologyand Atmospheric Physics 68: 187–195.
Serrano A, Garcıa JA, Mateos VL, Cancillo ML, Garrido J. 1999.Monthly modes of variation of precipitation over the IberianPeninsula. Journal of Climate 12: 2894–2919.
Sneyers R. 1990. On the statistical analysis of series of observations.WMO (no. 415): Geneva, 192.
Sohn KT, Park SM. 2008. Guidance on the Choice of Threshold forBinary Forecast Modeling. Advances in Atmospheric Sciences 25:83–88, DOI: 10.1007/s00376-008-0083-8.
Spellman G. 2000. The application of an objective weather-typingsystem to the Iberian peninsula. Weather 55: 375–385.
Stefanicki G, Talkner P, Webwe RO. 1998. Frequency changes ofweather types in the Alpine region since 1945. Theorical and AppliedClimatology 60: 47–61.
Copyright 2011 Royal Meteorological Society Int. J. Climatol. 32: 2181–2196 (2012)

2196 S. FERNANDEZ-GONZALEZ et al.
Tomas C, Pablo F, Soriano LR. 2004. Circulation weather types andcloud-to-ground flash density over Iberian Peninsula. InternationalJournal of Climatology 24: 109–123, DOI: 10.1002/joc.917.
Trigo IF. 2006. Climatology and interannual variability of storm-tracksin the Euro-Atlantic sector: a comparison between ERA-40 andNCEP/NCAR reanalyses. Climate Dynamics 26: 127–143, DOI:10.1007/s00382-005-0065-9.
Trigo RM, DaCamara CC. 2000. Circulation weather types and theirinfluence on the precipitation regime in Portugal. InternationalJournal of Climatology 20: 1559–1581.
Trigo RM, Palutikof JP. 2001. Precipitation scenarios over Iberia: acomparison between direct GCM output and different downscallingtechniques. Journal of Climate 14: 4422–4446.
Trigo RM, Pozo-Vazquez D, Osborn TJ, Castro-Dıez I, Gamiz-Fortis S, Esteban-Parra MJ. 2004. North Atlantic Oscillationinfluence on precipitation, river flow and water resources in
the Iberian Peninsula. International Journal of Climatology 24:925–944, DOI: 10.1002/joc.1048.
Van Loon H, Rogers JC. 1978. The seesaw in winter temperaturesbetween Greenland and northern Europe: Part I. General description.Monthly Weather Review 106: 296–310.
Wilks DS. 1995. Statistical Methods in Atmospheric Siences. AcademicPress: San Diego, 467.
Zhang H, Casey T. 2000. Verification of Categorical ProbabilityForecast. Weather and Forecasting 15: 80–89.
Zorita E, Kharin V, von Storch H. 1992. The atmospheric circulationand sea-surface temperature in the north-atlantic area inwinter – Their interaction and relevance for Iberian precipitation.Journal of Climate 5: 1097–1108.
Zorita E, von Storch H. 1997. A survey of statistical downscallingtechniques. GKSS 97/E/20 42.
Copyright 2011 Royal Meteorological Society Int. J. Climatol. 32: 2181–2196 (2012)