connecting gap acceptance behavior with crash...
TRANSCRIPT

1
CONNECTING GAP ACCEPTANCE BEHAVIOR WITH CRASH
EXPERIENCE
Steven M. Tupper, Graduate Research Assistant, Department of Civil and Environmental
Engineering, University of Massachusetts Amherst,
Amherst, MA, USA, e-mail: [email protected]
Michael A. Knodler Jr., Associate Professor, Department of Civil and Environmental
Engineering, University of Massachusetts Amherst,
Amherst, MA, USA, e-mail: [email protected]
David S. Hurwitz, Assistant Professor, School of Civil and Construction Engineering,
Oregon State University,
Coravllis, OR, USA, e-mail: [email protected]
Submitted to the 3rd International Conference on Road Safety and Simulation,
September 14-16, 2011, Indianapolis, USA
ABSTRACT
While a basic understanding of drivers’ gap acceptance behavior may be understood,
many unanswered questions remain, particularly regarding the safety-related impacts
associated with this behavior. Previous work has attempted to address these questions,
yet limitations in scope have continually emerged as a result of challenges associated
with the collection of high fidelity gap acceptance data in the field. This research directly
addresses the safety-related implications of driver’s gap acceptance behavior with a
large-scale data collection effort of detailed gap acceptance data.
Using the data set collected in the large-scale field test using a newly developed software
package, factors that appeared to affect drivers' gap acceptance decision-making, and had
clear implications on safety, were identified. Different driver groups, specifically
different age and gender groups, displayed different gap acceptance behavior. The
factors that had the greatest affect on gap acceptance behavior were the presence of a
queue behind the driver, driver wait time, and number of gaps rejected. These factors,
relating to drivers feeling pressure or simply impatience, resulted in drivers accepting
shorter gaps and sacrificing a degree of safety to execute their turn.
Identifying and analyzing "gap acceptance related” crashes, connections were drawn with
the results of the gap acceptance analysis. Driver groups displaying more aggressive gap
acceptance behavior, male drivers and teen drivers, are overrepresented in gap acceptance
related crashes. Development of a better understanding of these connections has the
potential to translate into more targeted solutions to the gap acceptance related crash
problem.
Keywords: Gap acceptance, critical gap, driver behavior, human factors, safety

2
INTRODUCTION
In the field of transportation safety it is well understood that crashes can be attributed to
failures of the road, the vehicle, the user, or some combination thereof. One common
driving task that requires each of these elements exists when drivers are tasked with
making a gap acceptance decision either merging into or crossing a lane of traffic.
Given that “driver error” is cited as a contributing factor in 93 percent of all crashes,
understanding driver behavior is an essential element in mitigating the crash problem
(Transportation Research Board 2003). Among the more dangerous roadway elements
are unsignalized intersections where driver behavior is directly related to the operational
and safety performance (Transportation Research Board 2003). More specifically,
drivers’ gap acceptance decisions have serious consequences, and in many situations, the
result of a poor gap acceptance decision is a crash.
The process of a driver’s gap acceptance decision is driven by an individual’s goals and
attitudes and is affected by stimuli from their surroundings. It is widely accepted that the
best method of observing naturalistic driver behavior is through field investigation
(Daganzo 1981). The difficulty is that current data collection methods are limited in the
quality and quantity of data that can be reasonably gathered.
Problem Statement
A need exists to foster a greater understanding of drivers’ gap acceptance behavior based
upon real-world empirical data. Understanding this aspect of driver behavior is critical to
transportation professionals dealing with roadway design and safety.
The mostly commonly used metric of drivers' gap acceptance behavior is critical gap,
defined by the Transportation Research Board (2000) as, “the minimum time interval in
the major-street traffic stream that allows intersection entry for one minor-street vehicle."
In practice, transportation professionals utilize standard default values of critical gap, as
reported in the Highway Capacity Manual 2000, and apply a few basic corrections factors
to reflect the site specific conditions. The problem with this current method is two-fold.
First, the correction factors only account for a few basic factors that are likely to affect
gap acceptance behavior. Some of the arguably most influential factors, such as local
driver demographics, are not included. Many studies have found that factors such as
driver age and sex (Zhou, et al. 2010, Wu 2006, X. Yan, et al. 2003, Yan, Radwan and
Guo 2006, Leung and Starmer 2005) have a significant effect on drivers' gap acceptance
behavior. Second, the standard values of critical gap, as well as the correction factors,
are based on a relatively limited number of small-scale studies. In order to develop a
greater understanding of drivers’ gap acceptance behavior a large-scale field investigation
must be undertaken.
Inaccurate or incorrectly used information on how drivers utilize gaps in traffic can lead
to inappropriate design decisions. If overly passive gap acceptance behavior is assumed
3
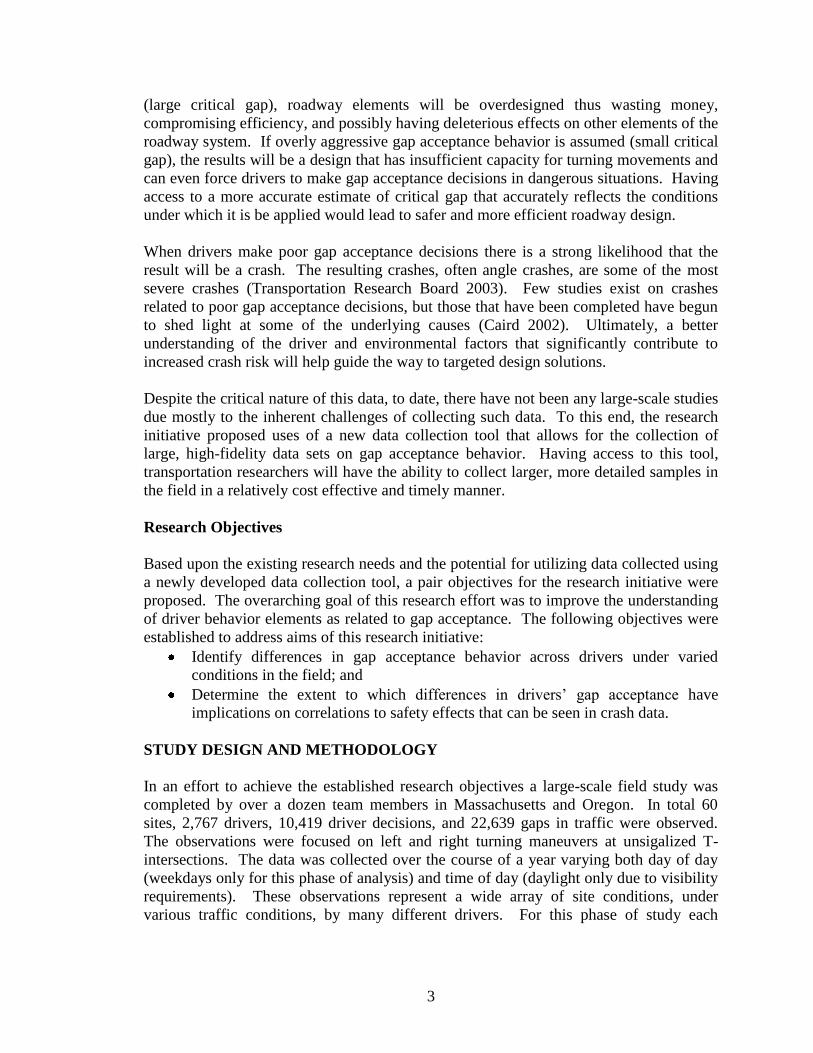
(large critical gap), roadway elements will be overdesigned thus wasting money,
compromising efficiency, and possibly having deleterious effects on other elements of the
roadway system. If overly aggressive gap acceptance behavior is assumed (small critical
gap), the results will be a design that has insufficient capacity for turning movements and
can even force drivers to make gap acceptance decisions in dangerous situations. Having
access to a more accurate estimate of critical gap that accurately reflects the conditions
under which it is be applied would lead to safer and more efficient roadway design.
When drivers make poor gap acceptance decisions there is a strong likelihood that the
result will be a crash. The resulting crashes, often angle crashes, are some of the most
severe crashes (Transportation Research Board 2003). Few studies exist on crashes
related to poor gap acceptance decisions, but those that have been completed have begun
to shed light at some of the underlying causes (Caird 2002). Ultimately, a better
understanding of the driver and environmental factors that significantly contribute to
increased crash risk will help guide the way to targeted design solutions.
Despite the critical nature of this data, to date, there have not been any large-scale studies
due mostly to the inherent challenges of collecting such data. To this end, the research
initiative proposed uses of a new data collection tool that allows for the collection of
large, high-fidelity data sets on gap acceptance behavior. Having access to this tool,
transportation researchers will have the ability to collect larger, more detailed samples in
the field in a relatively cost effective and timely manner.
Research Objectives
Based upon the existing research needs and the potential for utilizing data collected using
a newly developed data collection tool, a pair objectives for the research initiative were
proposed. The overarching goal of this research effort was to improve the understanding
of driver behavior elements as related to gap acceptance. The following objectives were
established to address aims of this research initiative:
Identify differences in gap acceptance behavior across drivers under varied
conditions in the field; and
Determine the extent to which differences in drivers’ gap acceptance have
implications on correlations to safety effects that can be seen in crash data.
STUDY DESIGN AND METHODOLOGY
In an effort to achieve the established research objectives a large-scale field study was
completed by over a dozen team members in Massachusetts and Oregon. In total 60
sites, 2,767 drivers, 10,419 driver decisions, and 22,639 gaps in traffic were observed.
The observations were focused on left and right turning maneuvers at unsigalized T-
intersections. The data was collected over the course of a year varying both day of day
(weekdays only for this phase of analysis) and time of day (daylight only due to visibility
requirements). These observations represent a wide array of site conditions, under
various traffic conditions, by many different drivers. For this phase of study each

4
intersection was sampled once. The next phase of the study will involve sampling the
same sites multiple times to test temporal variations.
The field study utilized a newly developed program that can be operated by one person
on a laptop computer in the field. A second observer is required if detailed vehicle and
driver characteristics are to be simultaneously collected, which was done during the field
study relating to this research initiative. To ensure that the results of the field study were
accurate, a prior video validation was performed (Tupper 2011).
Once gap acceptance data has been compiled there remain a myriad of methods by which
overall analyses of gap acceptance, and critical gap analyses in particular, can be
completed. For this research initiative three different methods, the Raff Method, the
Cumulative Acceptance Method, and the Fit Maximization Method, were used. One of
the most commonly used methods in practice, the Raff Method, identifies the critical gap
as the gap length where drivers are equally likely to accept or reject the gap. A method
described in some data collection manuals, the Cumulative Acceptance Method,
identifies the critical gap as the gap length that would be accepted by 85 percent of
drivers (Currin 2001). The Fit Maximization Method identifies the critical gap that
maximizes the number of rejected gaps smaller than the critical gap and maximizes the
number of accepted gaps larger than the critical gap. These methods are all based in
strong logic, relative ease of use, and provide an estimate of the critical gap, a key
parameter in the analysis of gap acceptance data, that are close to values listed in the
Highway Capacity Manual 2000 (Tupper 2011).
Analysis by Factor
There are a number of variables that influence a driver's gap acceptance behavior. Many
factors are associated with the specific site such as the number of lanes, speed limit,
functional classification, type of traffic control device, and traffic volume on the minor
and major streets. Other factors are associated with the driver such as the driver’s
gender, age, the type of vehicle they are driving, and whether or not they have passengers
in the vehicle. Additional factors believed to affect gap acceptance behavior relate to
other conditions present at the moment the decision is being made such as weather, time
of day, presence of vehicles queued behind the turning vehicle, and length of wait time.
As part of the analysis associated with this research objective, gap acceptance behavior,
and in particular critical gaps, were compared when considering a these various factors.
As noted previously, a combination of data collected in Massachusetts and Oregon was
used for the analysis. Please note that a majority of the data collection used in this
analysis was completed in Massachusetts and supplemented with additional data from
Oregon when it was collected in a similar format at comparable location types.
Connecting Driver Behavior to Crash Experience
With the understanding that differences in driving behavior between different driving
populations, the question that arises is whether or not these differences in behavior result
in different levels of driver risk on the roadway. For example, if driving group display

5
particularly aggressive or erratic gap acceptance behavior does this correspond to an
increased crash rate on the roadway?
To address the research questions related to this research objective "gap acceptance
related" crashes from were identified from crash data within the UMass Safety Data
Warehouse, housed at the University of Massachusetts Traffic Safety Research Program
(UMassSafe). The crashes considered included those with characteristics that match the
conditions under which the gap acceptance data was collected. Specifically crashes
occurring at an unsignalized T-intersection where a vehicle was making a left or right
hand turn were queried and initially considered. The crashes were further narrowed by
those where a driver was cited for an intersection right of way violation, an indication of
inappropriate gap acceptance behavior (Caird 2002). To ensure that the crashes were
related to gap acceptance issues, the crash narratives, as written on the crash reports, were
further examined.
A subsequent analysis was then performed to determine which driving groups were
overrepresented in gap acceptance related crashes. Connections were made between the
gap acceptance behavior of different driving groups and their relative representation in
gap acceptance related crashes.
RESULTS AND ANALYSIS
As noted, it is widely accepted that there are a number of variables that influence a
driver's gap acceptance behavior. These factors can be organized into driver/vehicle
characteristics, site characteristics, and additional factors related to conditions at the time
of the turn. Such factors thought to affect gap acceptance behaviors are presented in
Table 1. The highlighted factors in Table 1 will be discussed in detail within this section,
as they both demonstrated profound effects on gap acceptance behavior and have clear
safety implications. The remaining factors are being analyzed in other research
initiatives currently underway, but had a lesser impact in addressing the research question
associated with this research effort.
Table 1. Factors Thought to Affect Gap Acceptance Decisions Driver/Vehicle Characteristics Site Characteristics Additional Factors
Driver Gender Major and Minor Street Speed
Limit Time of Day
Driver Age Major and Minor Street Lane
Configuration Day of Week
Passenger Presence Major and Minor Street
Functional Class Queue Presence
Vehicle Type Major and Minor Street Traffic
Control Device Wait Time
Driver Decision Making Ability Major and Minor Street Traffic
Volumes Number of Rejected Gaps
Sightline Restrictions Weather
For analysis purposes, the turning maneuvers were considered at the aggregate level
including both left and right turning maneuvers as both maneuvers showed the same
6
trends. By including both maneuvers the comparisons could be completed in a more
concise and easy to interpret manner while simultaneously drawing upon the largest
possible sample size for comparison. Where possible, the effects of different
characteristics were compared using the Raff, Cumulative Acceptance, and Fit
Maximization Methods that where discussed previously. Chi Square tests were then used
to statistically compare the distributions for the percentage of gaps accepted across
variable levels to determine the extent to which differences were significant.
Driver Gender
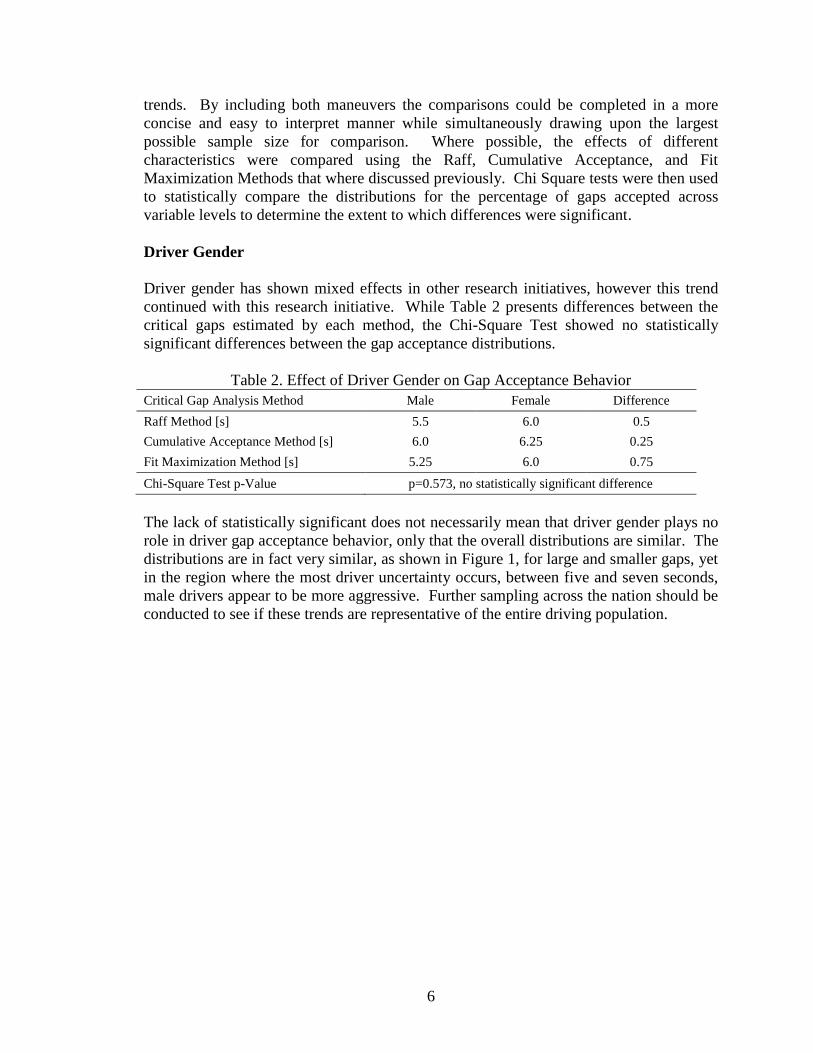
Driver gender has shown mixed effects in other research initiatives, however this trend
continued with this research initiative. While Table 2 presents differences between the
critical gaps estimated by each method, the Chi-Square Test showed no statistically
significant differences between the gap acceptance distributions.
Table 2. Effect of Driver Gender on Gap Acceptance Behavior
Critical Gap Analysis Method Male Female Difference
Raff Method [s] 5.5 6.0 0.5
Cumulative Acceptance Method [s] 6.0 6.25 0.25
Fit Maximization Method [s] 5.25 6.0 0.75
Chi-Square Test p-Value p=0.573, no statistically significant difference
The lack of statistically significant does not necessarily mean that driver gender plays no
role in driver gap acceptance behavior, only that the overall distributions are similar. The
distributions are in fact very similar, as shown in Figure 1, for large and smaller gaps, yet
in the region where the most driver uncertainty occurs, between five and seven seconds,
male drivers appear to be more aggressive. Further sampling across the nation should be
conducted to see if these trends are representative of the entire driving population.

7
Figure 1. Effect of Driver Gender on Gap Acceptance Behavior
Driver Age
This research initiative has shown significant differences in gap acceptance behavior
between different age groups. As presented in Table 3, both practical and statistically
significant differences exist in gap acceptance behavior between all age groups studied.
Table 3. Effect of Driver Age on Gap Acceptance Behavior *
Critical Gap Analysis Method Teen Adult Elderly
Raff Method [s] 5 6 5.5
Cumulative Acceptance Method [s] 3.75 5.25 6
Fit Maximization Method [s] 5 6.25 5.75
Chi-Square Test p-Value (Teen vs. Adult) p<<0.05, statistically significant difference
Chi-Square Test p-Value (Elderly vs. Adult) p=0.021, statistically significant difference
*included Oregon Data
The differences are most notable between the teen and adult driver. To a very high
degree of certainty, the gap acceptance distributions are significantly different between
these two age groups. The estimates of critical gap show similar differences between the
teen and adult groups. All indications are that teens display more aggressive gap
acceptance behavior than adults.
The differences are less notable between the adult and elderly driver groups.
Additionally, it is unclear exactly what overall difference may exist. Some analysis
methods suggest the adult driver is more aggressive while others suggest the elderly
8
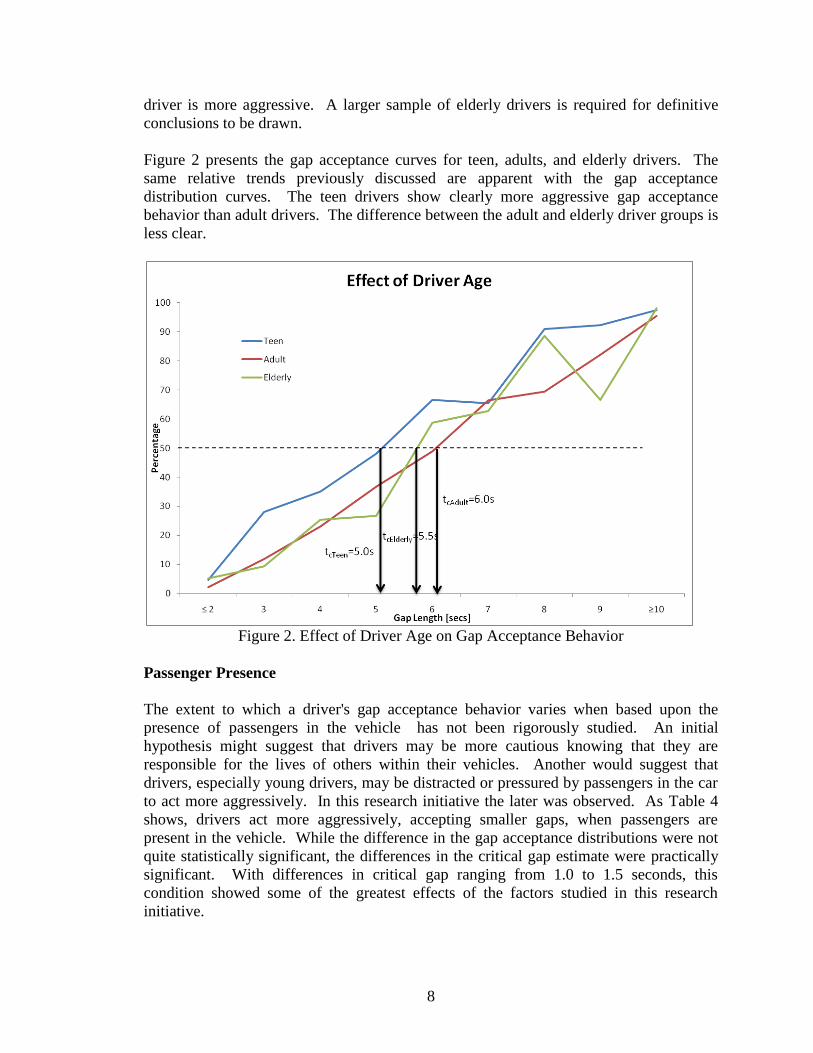
driver is more aggressive. A larger sample of elderly drivers is required for definitive
conclusions to be drawn.
Figure 2 presents the gap acceptance curves for teen, adults, and elderly drivers. The
same relative trends previously discussed are apparent with the gap acceptance
distribution curves. The teen drivers show clearly more aggressive gap acceptance
behavior than adult drivers. The difference between the adult and elderly driver groups is
less clear.
Figure 2. Effect of Driver Age on Gap Acceptance Behavior
Passenger Presence
The extent to which a driver's gap acceptance behavior varies when based upon the
presence of passengers in the vehicle has not been rigorously studied. An initial
hypothesis might suggest that drivers may be more cautious knowing that they are
responsible for the lives of others within their vehicles. Another would suggest that
drivers, especially young drivers, may be distracted or pressured by passengers in the car
to act more aggressively. In this research initiative the later was observed. As Table 4
shows, drivers act more aggressively, accepting smaller gaps, when passengers are
present in the vehicle. While the difference in the gap acceptance distributions were not
quite statistically significant, the differences in the critical gap estimate were practically
significant. With differences in critical gap ranging from 1.0 to 1.5 seconds, this
condition showed some of the greatest effects of the factors studied in this research
initiative.

9
Table 4. Effect of Passenger Presence on Gap Acceptance Behavior
Critical Gap Analysis Method Passengers No Passengers Difference
Raff Method [s] 5.0 6.0 1.0
Cumulative Acceptance Method [s] 5.25 6.5 1.25
Fit Maximization Method [s] 4.5 6.0 1.5
Chi-Square Test p-Value p-Value p=0.068, approaching statistical significance
The gap acceptance curves for drivers both with and without passengers in the vehicle,
presented in Figure 3, illustrate the identifiable difference in behavior between the two
conditions. The range from three to seven seconds, where almost all true gap acceptance
decisions take place, drivers with one or more passengers were more aggressive than
drivers without any passengers.
Figure 3. Effect of Passenger Presence on Gap Acceptance Behavior
Time of Day
There has long been a belief that drivers are more aggressive during the AM and PM
peak periods when they are commuting to and from work. As a result all actions
observed during the field study were time stamped so that they could easily be organized
by time period. The gap acceptance behavior was compared for the AM Peak, defined as
7-9 AM, the PM Peak, defined as 4-6 PM, and Midday, defined as 10 AM - 2 PM. The
results of this comparison are presented in
Table 5 and Figure 4.

10
Table 5. Effect of Time of Day on Gap Acceptance Behavior
Critical Gap Analysis Method AM Peak
(7-9 AM)
PM Peak
(4-6PM)
Midday
(10AM-2PM)
Raff Method [s] 6.5 6 5
Cumulative Acceptance Method [s] 4 4.25 6
Fit Maximization Method [s] 5 5.75 5.5
Chi-Square Test p-Value (Between All Sets) p<<0.05, statistically significant difference
As the estimates of critical value suggest, drivers are most aggressive during the AM and
PM Peaks than during the Midday time period. Figure 4 presents similar results,
although though there is a decrease in the AM Peak curve at six seconds that skews the
Raff Method critical gap estimate; this difference most likely a sample size issue.
Figure 4. Effect of Time of Day on Gap Acceptance Behavior
Queue Presence
One of the more interesting results from this research initiative related to a change in
driver behavior when there are vehicles queued up behind the driver. While the gap data
was being observed in the field, the second observer took note of how many vehicles
were queued up behind the vehicle exiting the minor street when the driver made the
turning maneuver. For analysis, the cases where a queue was present and where no
queue was present were compared. These results are presented in Table 6.

11
Table 6. Effect of Queue Presence on Gap Acceptance Behavior
Critical Gap Analysis Method No Queue Queue Present Difference
Raff Method [s] 6.0 4.5 1.5
Cumulative Acceptance Method [s] 6.5 5.25 1.25
Fit Maximization Method [s] 6.0 4.5 1.5
Chi-Square Test p-Value p<<0.05, statistically significant difference
By all three analysis methods utilized, the estimated critical gap when a queue is present
was much shorter than when no queue was present. The gap acceptance distributions of
these to conditions were shown to be different at a very high level of statistical
significance.
This trend is even more pronounced when examining the gap acceptance curves
presented in Figure 5. For all but the smallest and largest gaps, a greater percentage of
gaps were accepted when a queue was present.
Figure 5. Effect of Queue Presence on Gap Acceptance Behavior
These results provide evidence to suggest that drivers who have vehicles queued up
behind them will accept shorter gaps. The drivers likely feel pressured by the vehicles
behind them and therefore are willing to accept a gap smaller than they normally would.
This behavior has clear implications from a safety standpoint as well. The pressure
drivers feel when vehicles are queued up behind them may lead them to sacrifice some
measure of safety to complete their desired turning maneuver. The implication of this
result highlights a challenge and an opportunity for transportation professionals
responsible for intersection design. For example, an uncontrolled intersection identified

12
as having excessive queuing, may also have a resulting safety issue. Yet the extent to
which remedial measures can be identified and implemented may translate into improved
operational efficiency and safety.
Wait Time
As any driver is likely to attest, if one has beenwaiting a long to time to complete a turn
you may start thinking about accepting a gap smaller than you normally would.
According to the results of this study, drivers not only think about selecting a smaller
gap, but do in fact select a smaller gap after waiting for an extended period of time.
Using the time stamped action data from the field study, the amount of time each vehicle
waited before turning was calculated. For analysis purposes these wait time were
aggregated into four intervals: less than 10 seconds, 10 to 20 seconds, 20 to 30 seconds,
and greater than 30 seconds. The Cumulative Acceptance Method was then used to
estimate the critical gap for turning maneuvers that fell into each of these four categories.
The results of this analysis are presented in Figure 6.
Figure 6. Effect of Wait Time on Critical Gap
As presented in Figure 6, drivers were willing to accept smaller gaps as the amount of
time they had been waiting increased. This falls in line with initial hypotheses which
suggest that drivers are willing to sacrifice a bit of safety as they become impatient. As a
result, it is clear that conditions that result in drivers having to wait long periods of time
result in safety risks. Once again remediation measures that reduce wait times could
improve efficiency as well as safety.

13
Number of Rejected Gaps
Closely related to wait time is the number of gaps the drivers rejects. As the driver waits
from an acceptable gap they reject more and more gaps. As the number of gaps that they
have rejected increases they are likely to become more impatient and possibly accept a
smaller gap.
Aggregating the field data by the number of gaps the driver rejected, conclusions could
be drawn. As with wait time, the Cumulative Acceptance Method was used to estimate
the critical gap for turning maneuvers that feel into each category. Figure 7 presents the
results of this analysis.
Figure 7. Effect of Number of Rejected Gaps on Critical Gap
As presented in Figure 7, drivers were willing to accept smaller gaps as the number of
gaps they rejected increased. As with the wait time analysis, this falls in line with
expectations and suggests that drivers are willing to sacrifice a bit of safety as they
become impatient. Where drivers are subject to the frustration of having to reject gap
after gap, a safety risk clearly exists.
Connecting Driver Behavior to Crash Experience
As described in the methodology section, data from the UMass Safety Data Warehouse
was used in combination with the field data during this research initiative. The crash,
citation, and other relevant data were accessed from various agencies through the UMass
Safety Data Warehouse, which was developed as a tool for maximizing the use of
highway safety data. Data available from the Warehouse include traditional datasets,
such as crash and citation data, as well as less traditional highway safety information,
6.25
4.54 3.75
2.25
0
1
2
3
4
5
6
7
Accepted First Gap Rejected 1 Gap Rejected 2 Gaps Rejected 3 Gaps Rejected 4+ Gaps
Len
gth
of
Cri
tica
l Gap
(C
urr
in M
eth
od
) [s
ecs
]
Effect of Number of Rejected Gaps*
*includes Oregon data

14
such as health care data and commercial vehicle safety data. The use of assorted, diverse
data allows for truly comprehensive analyses of highway safety problem areas. The
accompanying schematic shows the variety of data that is available in the UMass Safety
Data Warehouse. For purposes of the current research initiative the data were analyzed to
understand the nature of the crash and relative differences between age and gender
groups.
In order to identify crashes within the Data Warehouse related to gap acceptance a
process was developed for this research initiative to identify "gap acceptance related
crashes." To maintain a manageable sample size crashes occurring in Massachusetts
between 2007 and 2009 were analyzed. The crashes considered were those with
characteristics that matched the conditions under which the gap acceptance data was
collected; occurring at an unsignalized T-intersection where a vehicle was making a left
or right hand turn. To ensure that the crashes were related to gap acceptance issues, the
crashes were further narrowed by those where a driver was cited for an intersection right
of way violation, an indication of inappropriate gap acceptance behavior (Caird 2002).
The gap acceptance related crash identification process narrowed the data set from a total
of 93,253 crashed to 156 crashes related to gap acceptance as shown in Figure 8.
Figure 8. Identifying Gap Acceptance Related Crashes (Massachusetts 2007-09)
To ensure that the 156 remaining crashes were indeed gap acceptance related crashes the
crash narratives, as recorded on the crash reports were reviewed. The crash narratives
were quite telling as to the circumstances of the crash. One crash narrative reads:
Vehicle 2 was traveling east on Main St. when vehicle 1 pulled out onto Main St.
from Harrington cutting in front of vehicle 2 causing a collision.
For whatever reason, the driver of vehicle 1 accepted too small of a gap when executing
their turn. Another crash narrative reads:

15
Vehicle 1 was traveling west on Rt. 44 when he stated that vehicle 2 pulled out
from Mill St. and cut in front of him. Vehicle 1 then swerved to the right to avoid
hitting oncoming traffic and vehicle 2. Vehicle 1 then ran into a ditch off of Rt. 44,
struck a Kahains furniture sign, telephone pole, and street sign. Vehicle 2
operator stated he observed vehicle 1 traveling west on Rt. 44 and estimated that
he had enough time to execute a left turn onto Rt. 44 heading east. Two
witnesses stated vehicle 2 cut off vehicle 1 and caused the accident. Vehicle 2
operator cited for failure to yield.
In this case, the operator of vehicle 2 explicitly states that they considered the gap
available to them, determined it was large enough, and accepted it. The operator of
vehicle 1 and onlookers clearly believed it was an insufficient gap. One other crash
narrative reads:
Vehicle 1 was travelling westbound on Washington St., vehicle 2 pulled out of
Walker St. without looking, causing vehicle 1 to drive directly into the driver side
of vehicle 2. The operator of vehicle 2 stated that he could see vehicle 1 in the
distance and believes that vehicle 1 speed caused the accident. Operator 2 was
cited for 89/8 fail to yield right of way/intersection.
This case has an added complication that speed may have been a factor, however,
regardless of the speed of vehicle 1, the operator of vehicle 2 made the determination that
the gap was sufficiently large, when in fact, it was not. These narratives serve as
validation that the crashes identified were in fact gap acceptance related and an
intersection right of way violation is an effective parameter to identify such crashes.
The analysis of the crash data was straightforward. The driver involvement and citation
rates in these gap acceptance crashes were normalized by the size of the respective
driving population. The driver populations that were over or under represented were
identified.
The final step in the analysis was to compare the gap acceptance behavior with the
relative representation in gap acceptance related crashes.
Comparing the results from the gap acceptance analysis and crash analysis the most
interesting findings where drivers were making left turns. This is also the maneuver that
presents the greatest challenge and danger.
A closer inspection of the data related to driver age was completed, and the resulting
percent of accepted and rejected gaps are plotted by gap length in Figure 9. This figure
shows that for any length gap the teen driver is more likely to accept it than the adult
driver. The critical gap, as depicted in the graph, represents the 50/50 decision point
where drivers are equally likely to reject or accept the gap. The critical gap is

16
significantly shorter for the teen drivers than the adult drivers. Suggesting that teen
drivers are more aggressive in the gap acceptance behavior than adult drivers.
Figure 9. Adult versus Teen Driver Left Turn Gap Acceptance Behavior
Looking specifically at the critical gap, as determined by the Raff Method, there are clear
differences in behavior of male and female drivers as well as teen and adult drivers.
Table 7 compares the critical gap as determined by the Raff Method by driver gender and
age for left turns. The data indicate that male drivers accept smaller gaps than female
drivers. This represents more aggressive gap acceptance behavior by the male drivers.
The results show that teen drivers are willing to accept smaller gaps than adult drivers, a
sign of aggressive gap acceptance behavior. Unfortunately, the relatively small sample of
elderly drivers yielded inconclusive results; however studies have shown that elderly
drivers tend to be more conservative in the gap acceptance behavior waiting for larger
gaps before turning (Zhou, et al. 2010).
Table 7. Left Turn Critical Gap and Relative Involvement in Gap Acceptance Related
Crashes by Gender and Age
Critical Gap Relative Involvement*
Male Drivers 5.5 s 1.1
Female Drivers 7.0 s 0.9
Teen (under 20) 5.5 s 3.4
Adults (age 20 - 64) 6.5 s 1.0
*% of drivers involvement in gap acceptance related crashes divided by % of driving population

17
With the apparent differences in gap acceptance behavior between driver groups, the
question is whether some of these aggressive behaviors translate into gap acceptance
related crashes. To answer that question, the gap acceptance related crashes were
analyzed by driver group. The percentage of each driver group’s involvement in the
crashes was compared to the group’s proportion of the driving population. The resulting
metric measures whether the group is over or under represented in gap acceptance
crashes relative to the number of licensed drivers in the group; numbers greater than 1
correspond to overrepresentation of a group and values less than 1correspond to
underrepresentation of the group. This metric is also presented in Table 7.
These results indicate that male drivers are overrepresented and female drivers are
underrepresented, suggesting that the male drivers aggressive gap acceptance behavior
may be resulting in gap acceptance related crashes. The comparison between teen and
adult drivers are even more striking with the adult drivers being appropriately represented
given the number of adult drivers and the teen drivers being overrepresented by more
than a factor of three. These results by age group would be even more striking if the
vehicle miles traveled were considered as teen drivers tend to drive less than adult driver
meaning they have less exposure but significantly more crashes.
CONCLUSIONS
This research initiative represents a promising step in enhancing the transportation
professions understanding of gap acceptance behavior.
Using the data set collected in the large-scale field test using the newly developed
software package, factors that appeared to affect drivers' gap acceptance decision, and
had clear implication on safety, were identified. Different driver groups, specifically
different age and gender groups, displayed different gap acceptance behavior. Passenger
presence and time of day also appeared to affect drivers' gap acceptance decisions. The
factors that had the greatest affect of gap acceptance behavior were the presence of a
queue behind the driver, wait time, and number of gaps rejected. These factors, relating
to drivers feeling pressure, impatience, and frustration, resulted in drivers accepting
shorter gaps and sacrificing a degree of safety to execute their turn.
Using the process described in this research initiative, "gap acceptance related” crashes
were be identified and analyzed. These results of the analysis of gap acceptance related
crashes showed strong connections to the results of the gap acceptance analysis. Driver
groups displaying more aggressive gap acceptance behavior, male drivers and teen
drivers, are overrepresented in gap acceptance related crashes. Understanding these
connections could lead to more targeted solution to the gap acceptance related crash
problem. The gap acceptance related crash problem is a complex one that requires
further investigation and a multi-faceted mitigation approach if significant improvements
in safety are to be made.

18
REFFERENCES
Ashworth, Robert. "The Analysis and Interpertation of Gap Acceptance Data."
Transportation Science (Department of Civil and Structural Engineering University of
Sheffield), 1970: Vol. 4, No. 3, pp. 270-280.
Caird, J.K. & Hancock, P.A. "Left-turn and gap acceptance crashes." Chap. Chapter 19
(pp. 613-652) in Human factors in traffic safety, by R.E. Dewar and P. Olson (Eds.).
Tucson, AZ: Lawyers & Judges Publishing, 2002.
Currin, Thomas R. entitled Introduction to Traffic Engineering: A Manual for Data
Collection and Analysis. Canada: Brooks/Cole, 2001.
Daganzo, C. "Estimation of Gap Acceptance Parameters Within and Across the
Population from Direct Roadside Observation." (Transportation Reasearch Part B,
Pergamon Press) Vol. 15B (pp. 1-15) (1981).
Leung, Stefanie, and Graham Starmer. "Gap acceptance and risk-taking by young and
mature drivers, both sober and alcohol-intoxicated, in a simulated driving task."
(Accident Analysis and Prevention 37 (2005) 1056–1065) 2005.
Transporation Research Board. Highway Capacity Manual 2000. Washington, D.C.,
2000.
Transportation Research Board. NCHRP Report 500. Volume 5. A Guide for Addressing
Unsignalized Intersection Collisions. Washington D.C.: National Cooperative Highway
Research Program, 2003.
Tupper, Steven. Safety and Operational Assesment of Gap Acceptance Through Large-
Scale Field Evaluation. Amherst, MA: Graduate School, University of Massachusetts
Amherst, 2011.
Wu, Ning. A New Model for Estimating Critical Gap and its Distribution at
Uunsignalized Iintersections Based on the Equilibrium of Probabilities. Germany:
Institute for Traffic Engineering, Ruhr University Bochum, 2006.
Yan, X., E. Radwan, D. Guo, and H. Klee. Analyses of Traffic Parameters Related To
Left Turn Gap Acceptance Using Ucf Driving Simulator. Dearborn, Michigan: DSC
North America 2003 Proceedings, 2003.
Yan, Xuedong, Essam Radwan, and Dahai Guo. "Effects of major-road vehicle speed and
driver age and gender on left-turn gap acceptance." (Accident Analysis and Prevention 39
(2007) 843–852) 2006.
Zhou, Hongmei, Nicholas E. Lownes, John N. Ivan, Per E. Garder, and Nalini
Ravishanker. Gap Acceptance of Elderly Drivers making Left Turns at Unsignalized
Intersections. Transportation Research Record. As presented in the TRB 2010 Annual
Meeting CD-ROM., 2010.