connecticut river basin - u.s. fish and wildlife service · work outside of the connecticut river...
TRANSCRIPT
CONNECTICUT RIVER BASIN
ANADROMOUS FISH RESTORATION: Coordination and Technical Assistance
F-100-R-34
Annual Progress Report October 1, 2016 - September 30, 2017
U.S. Fish and Wildlife Service Connecticut River Fish and Wildlife Conservation Office
Kenneth Sprankle, Project Leader 103 East Plumtree Road Sunderland, MA 01375-9138

Executive Summary
Federal Aid Project # F-100-R-34
States: Connecticut, Massachusetts, New Hampshire and Vermont
Project Title: Connecticut River Basin Anadromous Fish Restoration: Coordination and
Technical Assistance
Period Covered: October 1, 2016 - September 30, 2017
This annual report provides an opportunity to organize and document, to varying degrees,
all work activities conducted by the Connecticut River Fish and Wildlife Conservation
Office (CTRFWCO), formerly the Connecticut River Coordinator’s Office, which includes
work outside of the Connecticut River basin and activities not funded by this grant.
Objectives:
Coordinate the Connecticut River Anadromous Fish Restoration Program as a unified effort
of State and Federal fishery agencies
Provide technical assistance to the fishery agencies and other program cooperators
Identify fishery program priorities, design and implement projects to address issues and
opportunities, and develop plans
Administer several different federal grant programs to address fish habitat, passage,
management, and research projects
Accomplishments:
Program Coordination
Organized two Connecticut River Atlantic Salmon Commission (CRASC) and two CRASC
Technical Committee meetings
Organized the CRASC Technical Committee’s Research Forum (March)
Organized CRASC Shad Studies and River Herring subcommittee meetings, including
completion of updated American Management Shad Plan
Served as USFWS project officer for U. S. Geological Survey Conte Anadromous Fish
Research Laboratory (CAFRC) – Effects of temperature and energy use on fish passage and
spawning success of American Shad (2015-2017), USFWS Science Support Program
Provided annual upstream and downstream fishway operations letters to hydropower owners
and the Federal Energy Regulatory Commission (FERC)
Coordinated river herring population assessment and restoration activities in the Connecticut
River basin
Presented the Final Connecticut River American Shad Management Plan at June CRASC,

Page 3 of 37
plan accepted (web link to plan: https://www.fws.gov/r5crc/pdf/CRASC_Shad_Plan_6_13_17_FINAL.pdf)
Coordinated update of five year Memorandum of Understanding for the four basin states and
USFWS.
Technical Assistance
Completed downloading and servicing of all remote water temperature loggers
Participated in November (2016) ASMFC Shad and River Herring data meeting in
Providence Rhode Island for pending river herring stock assessment
Coordinated meetings on NOAA American Shad Model development among partners
Participated in ongoing hydropower federal relicensing meetings, numerous study reports
reviewed, and comment/response letter developed and input for additional comment letters,
for both FirstLight Power and Great River Hydro (formerly TransCanada) over the full report
year
Reviewed technical reports by Holyoke Gas and Electric on Upstream and Downstream
American Shad Passage Evaluation studies
Participated in confidential negotiation meetings with FirstLight Power and
agencies/conservation partners initiated in the late spring, ongoing
Completed the Annual Sport Fish Restoration Grant Report for FY16
Data summarization and analyses (ongoing) were completed on the river herring assessment
program data
Transported Shortnose Sturgeon from field
site to the USGS Conte Laboratory for
studies
Conducted river herring population
assessment surveys on 26 dates from
March 29, through June 8, 2017, at seven
standard sample location
Processed in the field a total of 2,650
Blueback Herring (BBH) and 200 Alewife
(ALW) captured for biological data, during
spring 2017 river herring population
surveys
Processed in the laboratory a total of 1,192
BBH and 190 ALW, subsampled from field (e.g., otolith extractions and scales)
Captured riverine fish species in April for USGS Conte Laboratory research projects
Cleaned and slide mounted scale samples from all 2017 lab processed river herring (N =
1,382)
Obtained 60 American Shad from Holyoke Fish Lift, extracted tissues for fish health testing
(USFWS Lamar Fish Health Unit), no detected pathogens
Extracted tissues for fish health testing of 60 Farmington River Blueback Herring (USFWS
FHU), no detected pathogens
All field and lab data sheets entered into Program Assessment database, summary and
descriptive statistics were developed
Served as a USFWS member to Northeast Regional Agency River Herring Team, provided
Boat electrofishing river herring
sampling
Page 4 of 37
updates on population assessment activities
Completed otolith age determinations and scale reading for spawning history assignments
from 2016 season sampled river herring in winter 2017
Served as USFWS member to the Atlantic States Marine Fisheries Commission’s Shad and
River Herring Technical Committee, participated in on-line meetings/activities, as a team
member reviewed State and Fishery Commission’s Sustainable Fisheries Management Plans
and the 2017 Updated River Herring Stock Assessment (web link to documents:
http://www.asmfc.org/species/shad-river-herring), approved in August
Provided program information and requested data (e.g., fish counts) to cooperators,
researchers, power companies, and the public
Provided field support to UMASS/USGS Conte Lab, PhD student conducting research on
larval development of river herring under different temperature and feeding regimes at
Cronin Aquatic Resource Center
Provided presentation on Office activities and fish status and trends to Westfield State
University (WSU) and represented the Service at WSU Environmental Career event
Produced the CT River Basin Fishway Counts report and distributed 2-3 times a week in
spring season electronically and posted updates on the Office web site (Appendix A)
Supervised a Holyoke Community College volunteer (April), six Student Conservation
Interns, that were supplied in rotation by the Conte Refuge to assist in Fisheries activities
(April-September), and two Westfield State University students who received school credit
(April-July)
Supervised a USFWS Biological Trainee Biologist/Student from UMass-Amherst
Captured by boat electrofishing several hundred Blueback Herring for USGS Conte
Laboratory fish passage studies
Transferred and released 608 American Shad, from the Holyoke Fish Lift, to the Farmington
River (CT), upstream of the Rainbow Dam in mid to late June
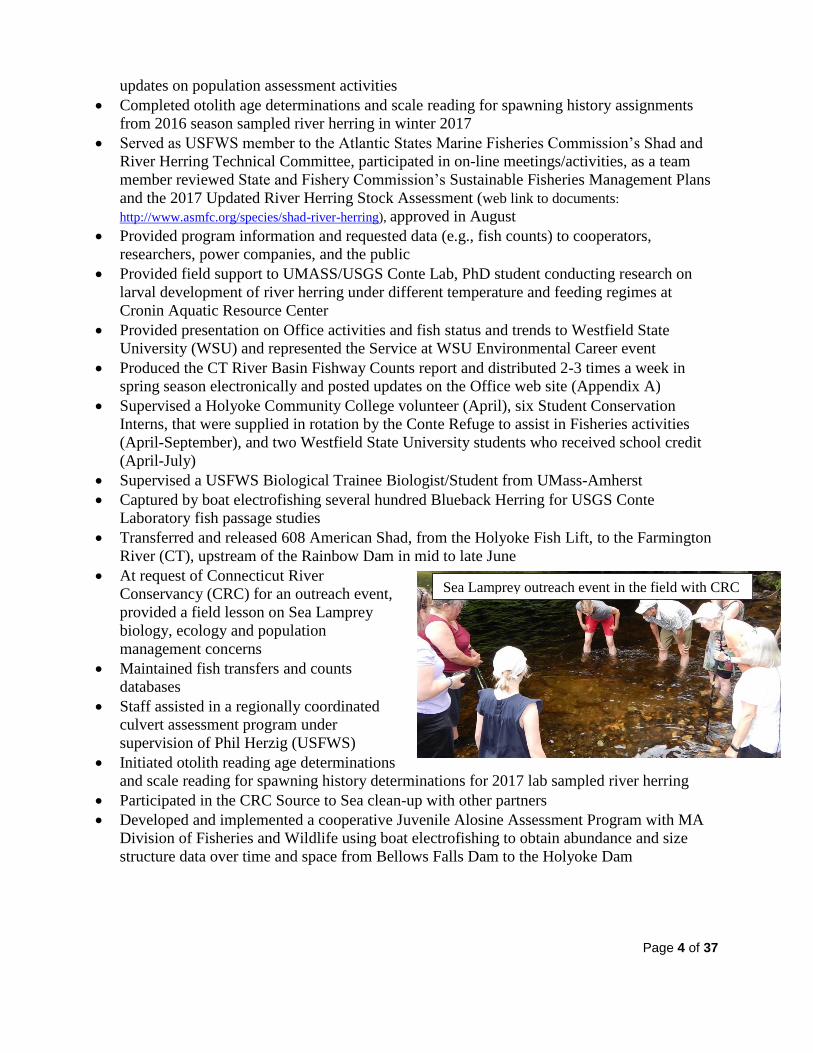
At request of Connecticut River
Conservancy (CRC) for an outreach event,
provided a field lesson on Sea Lamprey
biology, ecology and population
management concerns
Maintained fish transfers and counts
databases
Staff assisted in a regionally coordinated
culvert assessment program under
supervision of Phil Herzig (USFWS)
Initiated otolith reading age determinations
and scale reading for spawning history determinations for 2017 lab sampled river herring
Participated in the CRC Source to Sea clean-up with other partners
Developed and implemented a cooperative Juvenile Alosine Assessment Program with MA
Division of Fisheries and Wildlife using boat electrofishing to obtain abundance and size
structure data over time and space from Bellows Falls Dam to the Holyoke Dam
Sea Lamprey outreach event in the field with CRC

Page 5 of 37
Acknowledgements
There are many people that have contributed to the work accomplished by this office in the
report period. Darren Desmarais served as the sole permanent staff (Fish Biologist) for the
CTRFWCO and contributed greatly to the Office’s accomplishments, particularly on the river
herring project. Rebecca Gleason as the Administrative Assistant, shared among three field
office, was invaluable in her roles. Jadiziah Hannon-Moonstone started as a shared USFWS
Biological Trainee (with Cronin Aquatic Resource Center) while attending UMass/Amherst. We
said goodbye and thanks to Biological Trainee Drew Fournier as he graduated from
UMass/Amherst in May. The Student Conservation Interns provided by Conte Refuge in 2017
were rotated among several different projects and included; June Arriens, Ben Wetherbee, Sierra
Seydel, John Riordan, Brad Thorton, and Varsha Nallaparaju, all of whom made important
contributions in activities from April through the Fall. John McLaurin volunteered significant
hours in the month of April. Tyler Schofield and Justin Spitz, student interns from Westfield
State University provided several hundred volunteer hours for course credits. Other volunteers
provided valuable assistance for both field and lab activities over the year. Don Pugh has
continued to provide significant technical support for the resource agencies’ efforts on
hydropower relicensings and also fish passage activities at facilities like Holyoke Dam. Katie
Kennedy (The Nature Conservancy) has continued to make important technical contributions on
FERC activities and other aquatic conservation initiatives. The Connecticut River Conservancy
(formerly the Connecticut River Watershed Council), from the Director to its field staff, has
provided ongoing staff support for field activities and technical support over the course of the
year.
Other thanks for assisting in the accomplishments over this report period go to:
State fishery agencies -
Connecticut: Steve Gephard, Dave Ellis, Tim Wildman, Jacque Roberts, and staff
Massachusetts: Caleb Slater, Ben Gahagan, Scott Elzey, Steven Maddocks, and Brian
Keleher
New Hampshire: Matt Carpenter, Gregg Comstock
Vermont: Lael Will, Jeff Crocker, Eric Davis, Peter McHugh
Federal agencies –
USFWS: Melissa Grader, John Warner, Phil Herzig, Brett Towler, Julianne Rossett, Andy
French, and David Perkins
NOAA Fisheries: Bill McDavitt and Julie Crocker
USGS Conte Lab: Ted Castro-Santos, Alex Haro, Steve McCormick, Micah Kieffer

Page 6 of 37
The Anadromous Fish Program and
The Connecticut River Atlantic Salmon Commission
The administration of the interjurisdictional cooperative effort to restore diadromous fish species
to the Connecticut River basin is accomplished through the Connecticut River Atlantic Salmon
Commission (the Commission). During the period from 1967-1983 (prior to the Commission),
restoration of anadromous fish, primarily Atlantic Salmon and American Shad, on the
Connecticut River was guided by the Policy Committee and the Technical Committee for
Fisheries Management of the Connecticut River Basin. The importance of this formally-
structured, coordinating and regulatory body to the restoration program was recognized in 1983
when Congressional consent was given to the Connecticut River Basin Atlantic Salmon
Compact, Public Law 98-138. The enabling legislation was re-authorized for another 20 years in
2002. This law, originally passed by the legislative bodies in each of the four basin states,
created the Commission and conveys Congressional support to an interstate compact for the
restoration of anadromous fish to the Connecticut River Basin. The Commission is comprised of
ten Commissioners (Table 1) including a high-level government employee and a public sector
representative appointed by the governor of the appropriate state, and the Northeast Regional
Directors of both the U.S. Fish and Wildlife Service (USFWS) and the National Oceanic and
Atmospheric Administration (NOAA) National Marine Fisheries Service (NMFS) also referred
to as NOAA Fisheries.
The Commissioners act on policy matters and are advised on scientific and technical matters by a
Technical Committee. The Technical Committee is comprised of senior staff biologists from
each Commission member agency, the U.S. Forest Service (USFS), and the Massachusetts
Division of Marine Fisheries (Table 2). The Technical Committee has nine subcommittees, with
specific areas of responsibility (American Shad, River Herring, Atlantic Salmon, American Eel,
Sturgeon, Sea Lamprey, Fish Passage, Habitat, and Fish Culture). Other experts and cooperators
from the member agencies including the U.S. Geological Survey, Conte Anadromous Fish
Research Center (CAFRC), Trout Unlimited, The Nature Conservancy, Connecticut River
Conservancy, private industry, and others participate with the subcommittees and Technical
Committee as needed. The Connecticut River Coordinator (Coordinator), now identified also as
the Connecticut River Fish and Wildlife Conservation Office Project Leader, is an employee of
the USFWS, acts as the Executive Assistant to the Commission and the Secretary for the
Technical Committee and is the USFWS Technical Committee representative.
The Coordinator, as titled, is responsible for assisting on coordination of state and federal
activities, providing technical expertise, project development and implementation of fish
population assessments, restoration and management programs at the population and habitat
level, program evaluation, regulatory input through Federal Power Act with FERC, and
advocacy and outreach of the multi-agency cooperative diadromous fish restoration program in
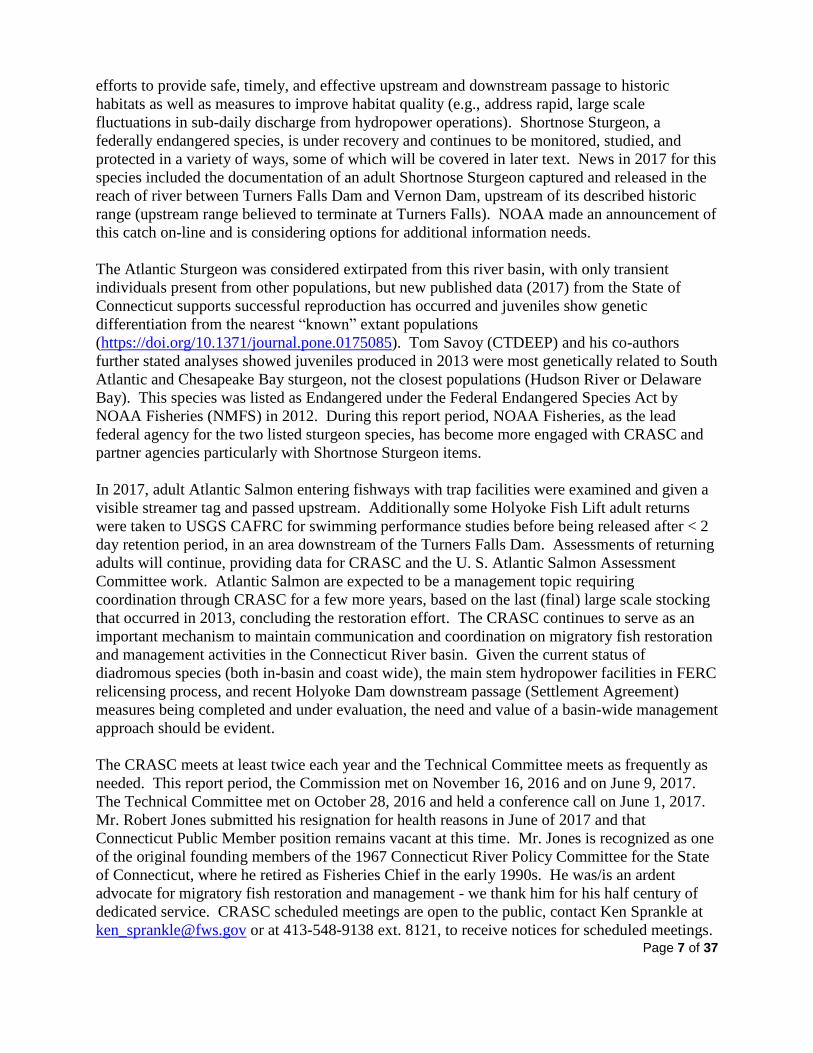
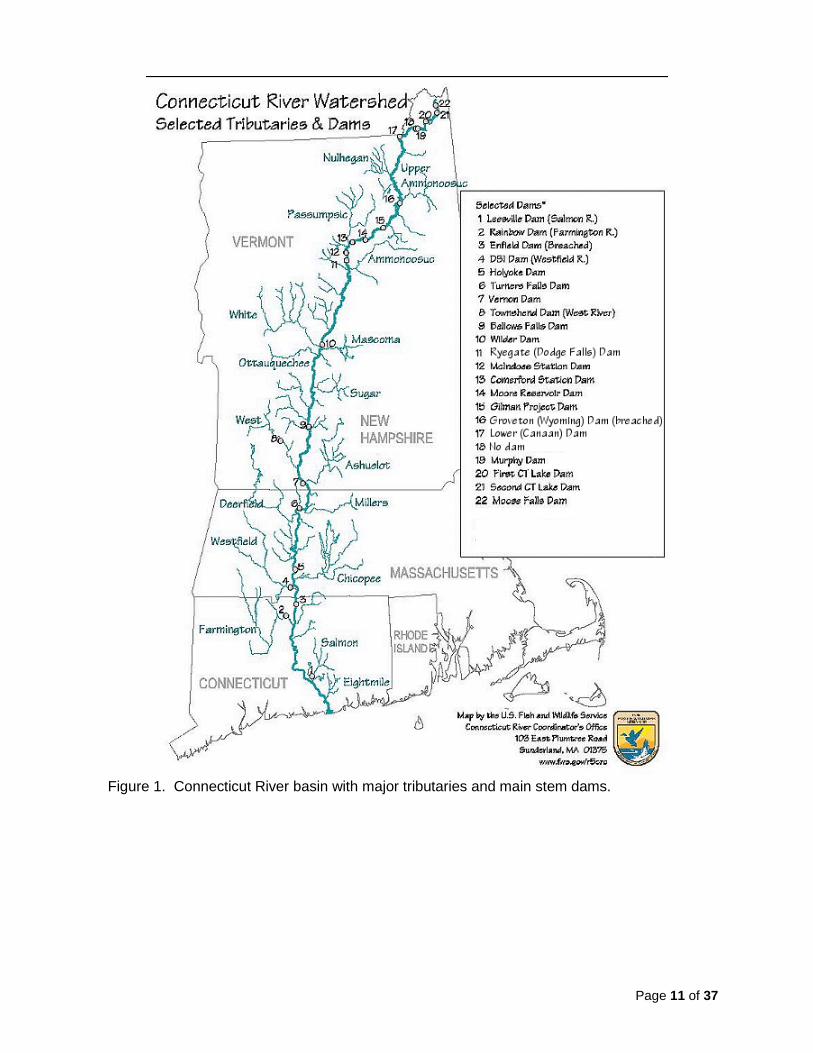
the Connecticut River watershed (Figure 1). The Coordinator also organizes meetings, identifies
priorities, develops initiatives and plans, implements them, and maintains and develops
partnerships to accomplish objectives.
Fish species under restoration and enhancement in the Connecticut River basin include American
Shad, Blueback Herring, Sea Lamprey, American Eel, and Alewife, primarily addressed by
Page 7 of 37
efforts to provide safe, timely, and effective upstream and downstream passage to historic
habitats as well as measures to improve habitat quality (e.g., address rapid, large scale
fluctuations in sub-daily discharge from hydropower operations). Shortnose Sturgeon, a
federally endangered species, is under recovery and continues to be monitored, studied, and
protected in a variety of ways, some of which will be covered in later text. News in 2017 for this
species included the documentation of an adult Shortnose Sturgeon captured and released in the
reach of river between Turners Falls Dam and Vernon Dam, upstream of its described historic
range (upstream range believed to terminate at Turners Falls). NOAA made an announcement of
this catch on-line and is considering options for additional information needs.
The Atlantic Sturgeon was considered extirpated from this river basin, with only transient
individuals present from other populations, but new published data (2017) from the State of
Connecticut supports successful reproduction has occurred and juveniles show genetic
differentiation from the nearest “known” extant populations
(https://doi.org/10.1371/journal.pone.0175085). Tom Savoy (CTDEEP) and his co-authors
further stated analyses showed juveniles produced in 2013 were most genetically related to South
Atlantic and Chesapeake Bay sturgeon, not the closest populations (Hudson River or Delaware
Bay). This species was listed as Endangered under the Federal Endangered Species Act by
NOAA Fisheries (NMFS) in 2012. During this report period, NOAA Fisheries, as the lead
federal agency for the two listed sturgeon species, has become more engaged with CRASC and
partner agencies particularly with Shortnose Sturgeon items.
In 2017, adult Atlantic Salmon entering fishways with trap facilities were examined and given a
visible streamer tag and passed upstream. Additionally some Holyoke Fish Lift adult returns
were taken to USGS CAFRC for swimming performance studies before being released after < 2
day retention period, in an area downstream of the Turners Falls Dam. Assessments of returning
adults will continue, providing data for CRASC and the U. S. Atlantic Salmon Assessment
Committee work. Atlantic Salmon are expected to be a management topic requiring
coordination through CRASC for a few more years, based on the last (final) large scale stocking
that occurred in 2013, concluding the restoration effort. The CRASC continues to serve as an
important mechanism to maintain communication and coordination on migratory fish restoration
and management activities in the Connecticut River basin. Given the current status of
diadromous species (both in-basin and coast wide), the main stem hydropower facilities in FERC
relicensing process, and recent Holyoke Dam downstream passage (Settlement Agreement)
measures being completed and under evaluation, the need and value of a basin-wide management
approach should be evident.
The CRASC meets at least twice each year and the Technical Committee meets as frequently as
needed. This report period, the Commission met on November 16, 2016 and on June 9, 2017.
The Technical Committee met on October 28, 2016 and held a conference call on June 1, 2017.
Mr. Robert Jones submitted his resignation for health reasons in June of 2017 and that
Connecticut Public Member position remains vacant at this time. Mr. Jones is recognized as one
of the original founding members of the 1967 Connecticut River Policy Committee for the State
of Connecticut, where he retired as Fisheries Chief in the early 1990s. He was/is an ardent
advocate for migratory fish restoration and management - we thank him for his half century of
dedicated service. CRASC scheduled meetings are open to the public, contact Ken Sprankle at
[email protected] or at 413-548-9138 ext. 8121, to receive notices for scheduled meetings.

Page 8 of 37
Interested citizens are given the opportunity to provide input and area news publishers are
notified of scheduled Commission meetings via email. Minutes of both Commission and
Technical Committee meetings, once approved are available and posted on the Connecticut
River FWCO website, https://www.fws.gov/r5crc/.

Page 9 of 37
Table 1. Connecticut River Atlantic Salmon Commission Membership (as of October 2017).
Connecticut River Atlantic Salmon Commission
Federal
U.S. Fish and Wildlife Service
Wendi Weber
Regional Director, Region 5
Sherry White, alternate
National Marine Fisheries Service John Bullard
Northeast Administrator
Daniel Morris (retired) Kimberly Damon-Randall, alternate
Connecticut
Connecticut Dept. of Energy and Environmental Protection
William Hyatt (Chair)
Chief, Bureau of Natural Resources
Stephen Gephard, alternate
Public Sector Representative Robert A. Jones (resigned this period) - vacant
Massachusetts
Massachusetts Division of Fisheries and Wildlife
Jack Buckley
Director
Mark Tisa, alternate
Public Sector Representative Andrew Fisk (Vice Chair)
New Hampshire
New Hampshire Fish and Game Department
Glenn Normandeau
Executive Director
Scott Decker, alternate
Public Sector Representative Duncan McInnes
Vermont
Vermont Department of Fish and Wildlife
Louis Porter
Commissioner
Eric Palmer, alternate
Public Sector Representative Peter H. Basta

Page 10 of 37
Table 2. Connecticut River Atlantic Salmon Commission Technical Committee Membership.
Connecticut River Atlantic Salmon Commission Technical Committee
Federal
U.S. Fish and Wildlife Service Kenneth Sprankle
National Marine Fisheries Service
William McDavitt
U.S. Forest Service Dan McKinley
Connecticut
Connecticut Dept. of Energy and Environmental
Protection Stephen R. Gephard
Massachusetts
Massachusetts Division of Fisheries and Wildlife
Caleb Slater
(Chair)
Massachusetts Division of Marine Fisheries Ben Gahagan
New Hampshire
New Hampshire Fish and Game Department
Matthew Carpenter
Vermont
Vermont Department of Fish and Wildlife
Lael Will
Page 11 of 37
Figure 1. Connecticut River basin with major tributaries and main stem dams.
KJJ

Page 12 of 37
Coordination and Technical Assistance Funding
The Connecticut River Fish and Wildlife Conservation Office (CTRFWCO), under the USFWS’
Wildlife and Sport Fish Restoration Program’s F-100-R-33, for this report period, received
$15,000 from three state fishery agencies through their annual Sport Fish Restoration Program
apportionment (F-100-R). The Massachusetts Division of Fisheries and Wildlife (MADFW) has
opted to reimburse the USFWS via the signed Memorandum Of Understanding, using agency
generated funds ($5,000). The grant project was assessed an USFWS administrative overhead
fee (18%) leaving $16,393 available. The Office utilized the Sport Fish Restoration funds,
MADFW funds, and USFWS Fisheries Program base funding for an operational budget totaling
$295,986 for fiscal year 2017. The Sport Fish Restoration and MADFW funds were fully drawn
down to pay expenses for the CTRFWCO building/grounds, office/operations (electricity,
phone/data), storage facility and vehicle maintenance expenses, allowing USFWS non-salary
funds to be applied in other operational areas.
Station total: $295,986 States (F-100-R): $16,270 FWS Federal: $279,186
Project Accomplishments
The Connecticut River Fish and Wildlife Conservation Office enhanced the Commission's and
States’ ability to manage, evaluate, and implement restoration programs through a variety of
activities and accomplishments, some of which are described in greater detail in the following
sections. Please note that data presented in this report has been reviewed to the extent possible,
but is subject to change and should be considered provisional. Use of any presented data
should be discussed with the Coordinator to avoid potential issues with use, analyses,
and/or interpretation.
Coordination activities, select details:
The Coordinator provided administrative support to the CRASC Commission and Technical
Committee as the Executive Assistant and Secretary respectively, making meeting arrangements,
establishing agendas, developing reports, distributing information, drafting correspondences,
tracking finances, and recording and distributing minutes of Commission and Technical
Committee meetings. The Coordinator participated on the CRASC Fish Passage, Shad and River
Herring, Sea Lamprey subcommittees during this report period. The Coordinator served as the
Chair for Shad and River Herring subcommittees and issued the Annual Fish Passage
Notification letters on behalf of CRASC to main stem hydropower operators.
The Coordinator served as the lead on the Plan Development Team for an updated American
Shad Management Plan. In the report period more work led to a final draft that was presented to
CRASC in June 2017, when they approved the new plan (web link to plan:
https://www.fws.gov/r5crc/pdf/CRASC_Shad_Plan_6_13_17_FINAL.pdf)
The Coordinator worked with Dr. Alex Haro and Dr. Adria Elskus of the USGS Conte
Laboratory to develop and run the CRASC Technical Committee’s Research Forum, held in
Page 13 of 37
March at the USFWS Northeast Regional Office. A special Sturgeon Session included six
presentations and a panel discussion that was followed by 7 additional presentations on a range of
topics for this one day conference attended by approximately 100 people.
Fisheries Management, Restoration, Assessment, and Technical Assistance: additional
select information
For the fifth consecutive year, a large scale population assessment program for river herring was
initiated by this office in late March, utilizing boat electrofishing as the primary sampling gear.
Study objectives include: 1) obtain a minimum whole fish sample of 80 Blueback and Alewife
for age structures, per target sample location/event; 2) obtain baseline demographic data on all
sampled river herring (species, length, weight, sex, spawning condition); 3) derive relative
abundance/catch measures using repeated standardized (time) sample runs; 4) conduct surveys
across a broad geographic range of spawning aggregations and over the duration of the runs
(April-June), representing spatial and temporal variations for both species; 5) determine fish ages
from otoliths and spawning history from scale examinations; and 6) utilize standard stock
assessment procedures and statistics to describe status and trends. This work was developed and
is being conducted to address identified priority data needs, specific to the Connecticut River and
coast-wide, as described in the Atlantic States Marine Fisheries Commission’s River Herring
Benchmark Stock Assessment Report released in May 2012 and the most recent August 2017
release of the River Herring Stock Assessment Update (http://www.asmfc.org/species/shad-river-
herring), that concludes “…river herring continue to be depleted on a coast wide basis and near
historic lows.” This assessment program is a long-term commitment by the CTRFWCO and will
continue in future years. The project is intended to provide the varied data requirements and
subsequent analyses required for science-based restoration and management of these species.
The assessment program targets five sample areas in the basin; lower
Mattabesset River (Middletown, CT), Wethersfield Cove (Wethersfield,
CT), lower Farmington River (Windsor, CT), lower Westfield River
(Agawam, MA), and lower Chicopee River (Chicopee, MA).
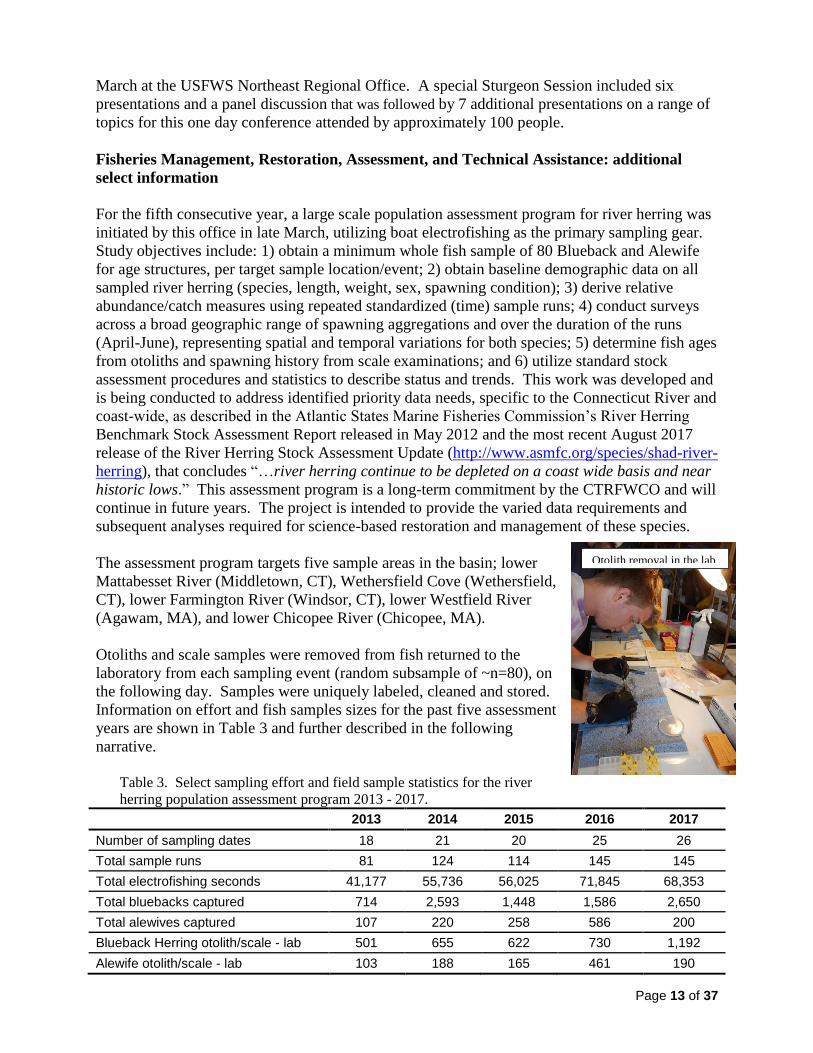
Otoliths and scale samples were removed from fish returned to the
laboratory from each sampling event (random subsample of ~n=80), on
the following day. Samples were uniquely labeled, cleaned and stored.
Information on effort and fish samples sizes for the past five assessment
years are shown in Table 3 and further described in the following
narrative.
Table 3. Select sampling effort and field sample statistics for the river
herring population assessment program 2013 - 2017.
2013 2014 2015 2016 2017
Number of sampling dates 18 21 20 25 26
Total sample runs 81 124 114 145 145
Total electrofishing seconds 41,177 55,736 56,025 71,845 68,353
Total bluebacks captured 714 2,593 1,448 1,586 2,650
Total alewives captured 107 220 258 586 200
Blueback Herring otolith/scale - lab 501 655 622 730 1,192
Alewife otolith/scale - lab 103 188 165 461 190
Otolith removal in the lab
Page 14 of 37
In 2017, sampling was initiated on March 29 in the Mattabesset River and Alewife were sampled
on that first outing in low numbers (n=6). There was a slight increase in the number of sample
days, 26 versus 25 in 2016, with an identical number of sample electrofising runs (or transects)
between the years. The decrease in total electrofishing seconds is explained by sampling
methodology. Due to increased catch rates in 2017 (solely BBH), the standardized 500 second
timed runs were in frequently suspended when over 60 fish had been placed in the live well for a
sample run. The shortest timed run in 2017 was only 58 seconds due to the highest observed
catch rate for the year (63 fish/min). The incidences of high catch rates occurred on more
sampling runs in 2017 contributing to the observed difference in “total time” shown in Table 3.
Sampling concluded on June 14, 2017 on the Farmington River, very few fish were sampled and
a large increase (proportion) in “spent” or “partially spent” fish assignments as opposed to
“gravid” or “ripe/running” were observed.
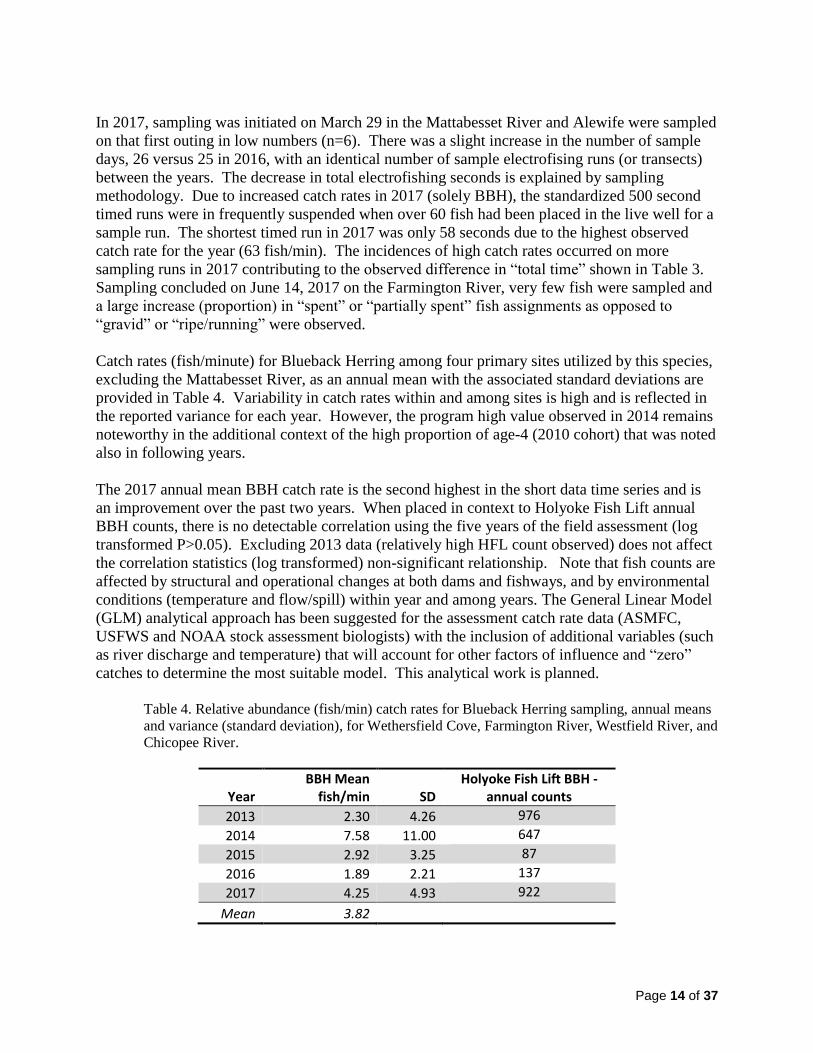
Catch rates (fish/minute) for Blueback Herring among four primary sites utilized by this species,
excluding the Mattabesset River, as an annual mean with the associated standard deviations are
provided in Table 4. Variability in catch rates within and among sites is high and is reflected in
the reported variance for each year. However, the program high value observed in 2014 remains
noteworthy in the additional context of the high proportion of age-4 (2010 cohort) that was noted
also in following years.
The 2017 annual mean BBH catch rate is the second highest in the short data time series and is
an improvement over the past two years. When placed in context to Holyoke Fish Lift annual
BBH counts, there is no detectable correlation using the five years of the field assessment (log
transformed P>0.05). Excluding 2013 data (relatively high HFL count observed) does not affect
the correlation statistics (log transformed) non-significant relationship. Note that fish counts are
affected by structural and operational changes at both dams and fishways, and by environmental
conditions (temperature and flow/spill) within year and among years. The General Linear Model
(GLM) analytical approach has been suggested for the assessment catch rate data (ASMFC,
USFWS and NOAA stock assessment biologists) with the inclusion of additional variables (such
as river discharge and temperature) that will account for other factors of influence and “zero”
catches to determine the most suitable model. This analytical work is planned.
Table 4. Relative abundance (fish/min) catch rates for Blueback Herring sampling, annual means
and variance (standard deviation), for Wethersfield Cove, Farmington River, Westfield River, and
Chicopee River.
Year BBH Mean
fish/min SD Holyoke Fish Lift BBH -
annual counts
2013 2.30 4.26 976
2014 7.58 11.00 647
2015 2.92 3.25 87
2016 1.89 2.21 137
2017 4.25 4.93 922
Mean 3.82

Page 15 of 37
Catch rates (fish/min) for Alewife at the primary sampling area for that species (Mattabesset
River alone) as an annual mean with the associated standard deviation, is provided in Table 5.
Alewife are believed to be best sampled/obtained in the wild in this downstream tributary, which
includes a fairly large marsh complex that transitions into a large flood plain forest complex
moving upstream. This low gradient area is more suitable Alewife spawning habitat based on
published research than the upstream sample sites, with the exception of Wethersfield Cove.
However, the Cove over the sample years, with same (paired) week sample timing as the
Mattabesset, provides consistently fewer samples/catches of this species. Since 2014,
Wethersfield Cove has provided an overall mean of only 21.0% (± 5.4 SD) of the Alewife, as a
combined annual sample size. Given the low gradient and large marsh/swap complex of the
lower Mattabesset, as river discharge increases water levels, fish have an exponential increase in
available flooded habitat, which reduces catch rates. The earlier noted GLM analytical approach
will provide a means to account for this affect. The lack of an actual gauge on the sample site
requires use of a proximal USGS gauge location. The difference between 2017 and 2016 is
largely attributed to the “drought” conditions in 2016 restricting fish to the river “channels”
rather than an apparent shift in abundance.
Table 5. Relative abundance (fish/min) catch rates for Alewife, annual means and variance, for
Mattabesset River with mean April river discharge from the USGS Thompsonville Gauge
(Enfield, CT).
Year ALW Mean
fish/min SD April Mean Discharge
USGS Thompsonville CT
2013 0.12 0.22 33,360
2014 0.16 0.31 54,670
2015 0.20 0.49 43,350
2016 0.46 0.94 23,290
2017 0.13 0.28 31,650
Mean 0.22
A summary of mean total lengths (mm) with standard deviations are shown in Table 6, by sex,
for each species, by year. A one-way ANOVA detected significant differences (P < 0.001)
among annual mean total lengths for both male and female Blueback Herring and Alewife. Post-
hoc pairwise comparisons (Holm-Sidak) detected significant differences at P < 0.05 as indicated
in Table 6, between years (within same species/sex).

Page 16 of 37
Table 6. A summary of annual mean total length (mm) with standard deviations (SD), for all processed
Blueback and Alewife, by sex, for the survey years of 2013 – 2017. ANOVA tests were followed by
pairwise comparisons by species and sex. Significantly different pairwise comparisons (P < 0.05) are
indicated by year letter assignment.
Blueback Alewife Male Female Male Female
Year Mean TL mm
(± SD) Signf. Diff.
Mean TL mm (± SD)
Signf. Diff.
Mean TL mm (± SD)
Signf. Diff.
Mean TL mm (± SD)
Signf. Diff.
2013A 253.8 (12.1) C, D, E 264.9 (12.6) C, D, E 261.6 (15.8) C, D 287.7 (16.2) B, D
2014B 253.8 (11.4) C, D, E 264.9 (13.2) C, D, E 266.2 (10.8) C, D 276.1 (15.5) A, C, D
2015C 263.0 (10.4) A, B, D, E 277.8 (11.7) A, B, D, E 273.1 (11.7) A, B, E 287.9 (12.4) B, D
2016D 265.2 (13.3) A, B, C, E 281.3 (13.0) A, B, C, E 270.7 (18.0) A, B, E 286.4 (19.0) B, D
2017E 257.5 (12.7) A, B, C, D 271.7 (14.9) A, B, C, D 265.0 (18.3) C, D 278.4 (21.4) A, C, D
All 2016 otolith samples for both Blueback (n=730) and Alewife (n=461) were read for age
determination by March 2017. A re-examination of the accuracy of the 2013 (first year) and
2014 of the study age assignments was completed along with a training set of otoliths to aid in
maintaining consistent interpretations. Consultation with Massachusetts Division of Marine
Fisheries for otoliths and the State of Connecticut for scale readings has been ongoing.
Length frequency plots describing size distributions by sex, over time, have been developed in
aggregate and at the site specific level. A positive shift in the size distribution is apparent for the
period 2013 -2016 for the Farmington River Blueback Herring example, with a noted shift to a
reduced size distribution in 2017 (Figure 2). Additional information is required for considering
the extent of influence by year class strength, which has demonstrated the 2010 year class’
disproportion presence as age-4, age-5 and age-6 that explains the increase in size frequency
through 2016. The 2017 age assignments are not complete but it is anticipated the 2010 year
class role was diminished as the age-7 cohort in 2017. Otolith based age assignments of
Blueback Herring samples from 2013 to 2016, by sex, as an aggregate, are provided in Table 7,
illustrating the overall age structure of this population over a four-year period. While scale
reading for spawning history has been completed and was based on following CTDEEP’s
interpretations of scale spawning marks, quality control measures remain to be completed
Scale reading for spawning history Otolith reading for age determination

Page 17 of 37
2013
0
10
20
30
40
Male
Female
Unknown
2014
0
50
100
150
200
Fre
quency
(#
of
fish
)
0
20
40
60
80
100
120
2016
0
20
40
60
80
100
120
140
160
Farmington River Blueback Herring
Total Length (mm)
200 220 240 260 280 300 320
0
50
100
150
200
2015
2017
Figure 2. Length frequency distribution of Blueback herring by sex, for the years
2013 - 2017.
Table 7. Blueback Herring age structure, by sex, for all otolith aged samples collected among all sites
for the years 2013 - 2016.
Age N
(Females) % of F % of
All N
(Males) % of M % of
All
Both Sexes
Total N % of
All
2 - - - 12 0.7 0.5 12 0.5
3 98 14.5 4.0 349 19.5 14.2 447 18.1
4 182 27.0 7.4 608 34.0 24.7 790 32.1
5 233 34.6 9.5 502 28.0 20.4 735 29.8
6 124 18.4 5.0 265 14.8 10.8 389 15.8
7 25 3.7 1.0 44 2.5 1.8 69 2.8
8 9 1.3 0.4 8 0.4 0.3 17 0.7
9 3 0.4 0.1 2 0.1 0.1 5 0.2
Sample size 674 1,790 2,464
% of total 27.4
72.6
Page 18 of 37
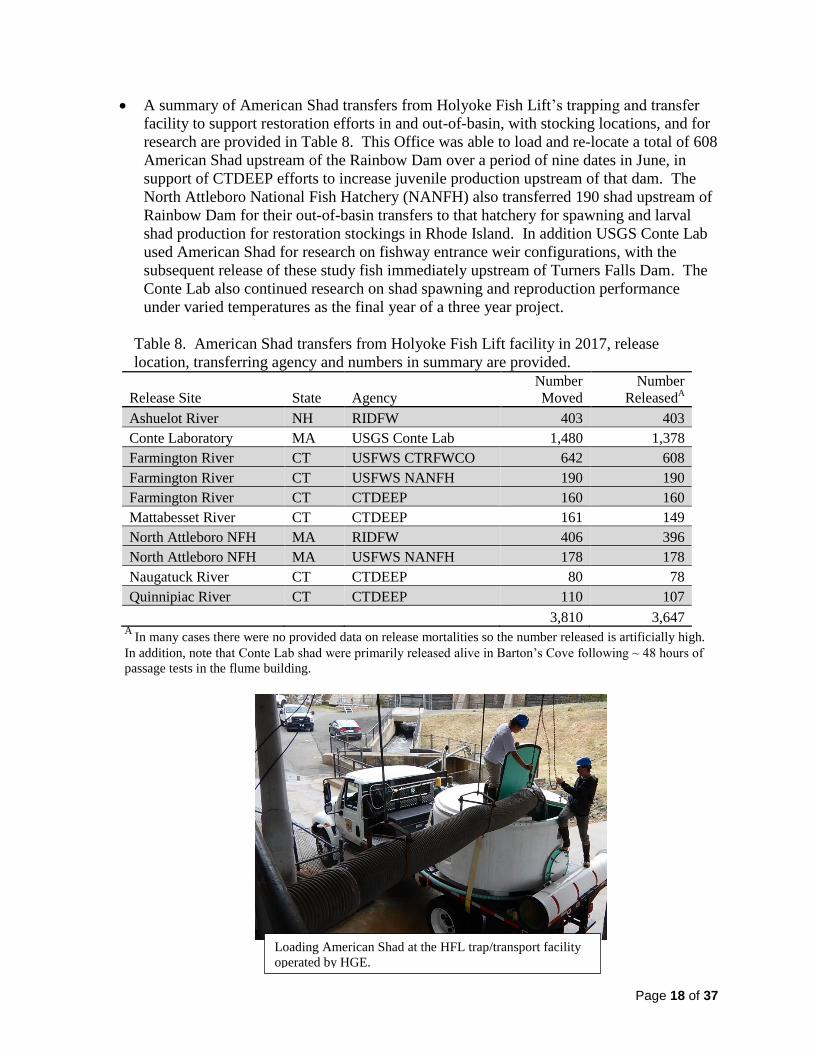
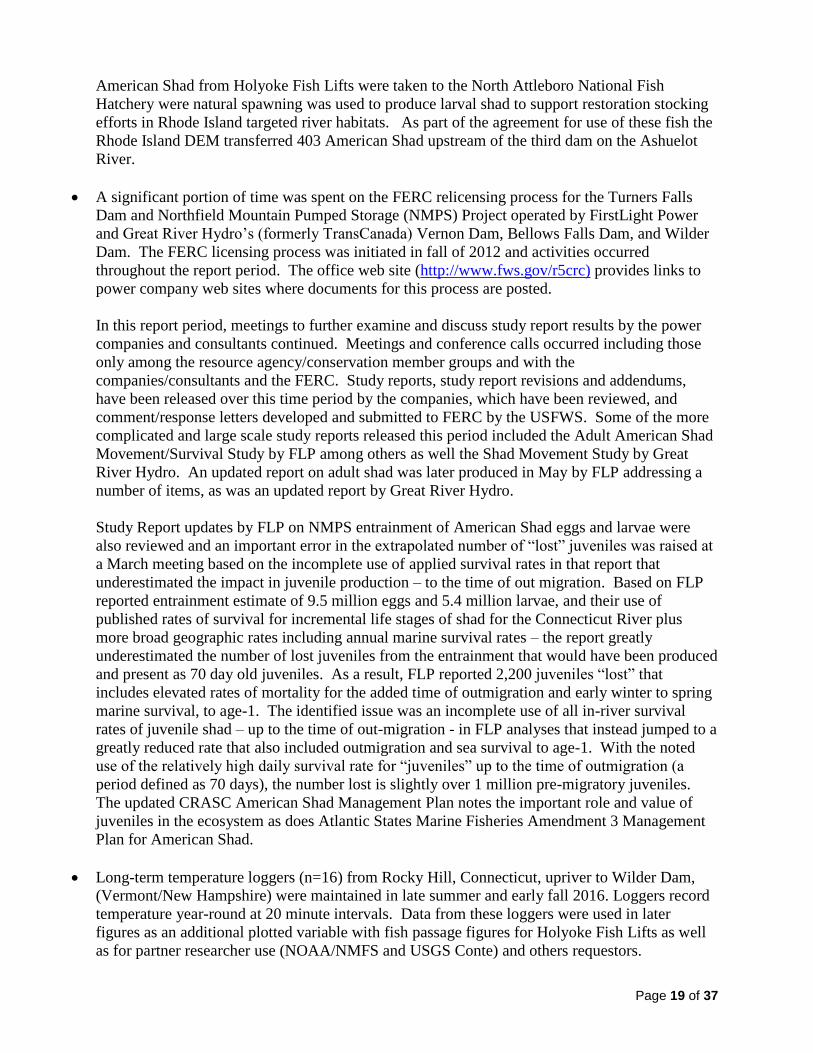
A summary of American Shad transfers from Holyoke Fish Lift’s trapping and transfer
facility to support restoration efforts in and out-of-basin, with stocking locations, and for
research are provided in Table 8. This Office was able to load and re-locate a total of 608
American Shad upstream of the Rainbow Dam over a period of nine dates in June, in
support of CTDEEP efforts to increase juvenile production upstream of that dam. The
North Attleboro National Fish Hatchery (NANFH) also transferred 190 shad upstream of
Rainbow Dam for their out-of-basin transfers to that hatchery for spawning and larval
shad production for restoration stockings in Rhode Island. In addition USGS Conte Lab
used American Shad for research on fishway entrance weir configurations, with the
subsequent release of these study fish immediately upstream of Turners Falls Dam. The
Conte Lab also continued research on shad spawning and reproduction performance
under varied temperatures as the final year of a three year project.
Table 8. American Shad transfers from Holyoke Fish Lift facility in 2017, release
location, transferring agency and numbers in summary are provided.
Release Site State Agency
Number
Moved
Number
ReleasedA
Ashuelot River NH RIDFW 403 403
Conte Laboratory MA USGS Conte Lab 1,480 1,378
Farmington River CT USFWS CTRFWCO 642 608
Farmington River CT USFWS NANFH 190 190
Farmington River CT CTDEEP 160 160
Mattabesset River CT CTDEEP 161 149
North Attleboro NFH MA RIDFW 406 396
North Attleboro NFH MA USFWS NANFH 178 178
Naugatuck River CT CTDEEP 80 78
Quinnipiac River CT CTDEEP 110 107
3,810 3,647 A
In many cases there were no provided data on release mortalities so the number released is artificially high.
In addition, note that Conte Lab shad were primarily released alive in Barton’s Cove following ~ 48 hours of
passage tests in the flume building.
Loading American Shad at the HFL trap/transport facility
operated by HGE.
Page 19 of 37
American Shad from Holyoke Fish Lifts were taken to the North Attleboro National Fish
Hatchery were natural spawning was used to produce larval shad to support restoration stocking
efforts in Rhode Island targeted river habitats. As part of the agreement for use of these fish the
Rhode Island DEM transferred 403 American Shad upstream of the third dam on the Ashuelot
River.
A significant portion of time was spent on the FERC relicensing process for the Turners Falls
Dam and Northfield Mountain Pumped Storage (NMPS) Project operated by FirstLight Power
and Great River Hydro’s (formerly TransCanada) Vernon Dam, Bellows Falls Dam, and Wilder
Dam. The FERC licensing process was initiated in fall of 2012 and activities occurred
throughout the report period. The office web site (http://www.fws.gov/r5crc) provides links to
power company web sites where documents for this process are posted.
In this report period, meetings to further examine and discuss study report results by the power
companies and consultants continued. Meetings and conference calls occurred including those
only among the resource agency/conservation member groups and with the
companies/consultants and the FERC. Study reports, study report revisions and addendums,
have been released over this time period by the companies, which have been reviewed, and
comment/response letters developed and submitted to FERC by the USFWS. Some of the more
complicated and large scale study reports released this period included the Adult American Shad
Movement/Survival Study by FLP among others as well the Shad Movement Study by Great
River Hydro. An updated report on adult shad was later produced in May by FLP addressing a
number of items, as was an updated report by Great River Hydro.
Study Report updates by FLP on NMPS entrainment of American Shad eggs and larvae were
also reviewed and an important error in the extrapolated number of “lost” juveniles was raised at
a March meeting based on the incomplete use of applied survival rates in that report that
underestimated the impact in juvenile production – to the time of out migration. Based on FLP
reported entrainment estimate of 9.5 million eggs and 5.4 million larvae, and their use of
published rates of survival for incremental life stages of shad for the Connecticut River plus
more broad geographic rates including annual marine survival rates – the report greatly
underestimated the number of lost juveniles from the entrainment that would have been produced
and present as 70 day old juveniles. As a result, FLP reported 2,200 juveniles “lost” that
includes elevated rates of mortality for the added time of outmigration and early winter to spring
marine survival, to age-1. The identified issue was an incomplete use of all in-river survival
rates of juvenile shad – up to the time of out-migration - in FLP analyses that instead jumped to a
greatly reduced rate that also included outmigration and sea survival to age-1. With the noted
use of the relatively high daily survival rate for “juveniles” up to the time of outmigration (a
period defined as 70 days), the number lost is slightly over 1 million pre-migratory juveniles.
The updated CRASC American Shad Management Plan notes the important role and value of
juveniles in the ecosystem as does Atlantic States Marine Fisheries Amendment 3 Management
Plan for American Shad.
Long-term temperature loggers (n=16) from Rocky Hill, Connecticut, upriver to Wilder Dam,
(Vermont/New Hampshire) were maintained in late summer and early fall 2016. Loggers record
temperature year-round at 20 minute intervals. Data from these loggers were used in later
figures as an additional plotted variable with fish passage figures for Holyoke Fish Lifts as well
as for partner researcher use (NOAA/NMFS and USGS Conte) and others requestors.

Page 20 of 37
The updated CRASC American Shad Management Plan, following on meetings and revisions
over the winter, was completed and approved at the June 2017 CRASC meeting. The plan
differs from the 1992 Plan in several areas including: 1) habitat basis for adult production that
provides minimum target numbers for adult run size (comprised of multiple age classes) for each
river segment as defined by hydropower dams and for targeted tributaries; 2) notes the need for
fish passage performance measures not yet available, to address impacts of delay on both
upstream and downstream fish passage that may contribute to decreased repeat spawners; 3) the
importance of juvenile life stages for ecological trophic contributions while in-river, on their
outmigration in the estuary, and in the marine environment before becoming adults; and 4) stock
structure targets (% repeat spawner).
The Coordinator updated the station website on the Internet (http://www.fws.gov/r5crc) with
current information and activities and replied to ongoing data requests on fishway counts, river
herring assessments, and temperature loggers.
The Office continued to maintain databases on migratory fish restoration activities. Daily fish
counts at different dams were entered into databases. Fish counts were updated in-season at
frequent interval during the spring, with email notifications to individuals and postings to the
office’s web site (Appendix A).
Page 21 of 37
Program Results
The Connecticut River Fish and Wildlife Conservation Office collected and reported information
relating to the activities and accomplishments occurring in the Connecticut River basin
diadromous fisheries restoration program. Note some of the data presented here are preliminary,
not all counts were final at the time of this report (Appendix A).
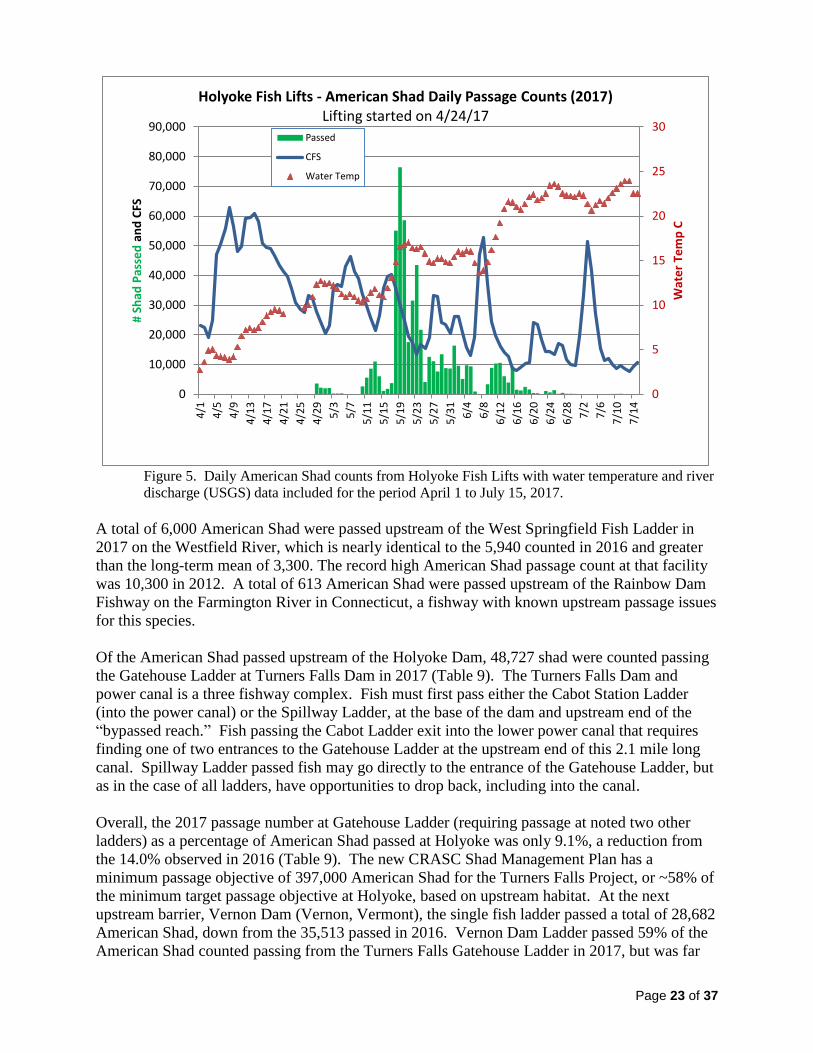
Migratory Fish Returns American Shad - A total of 543,290 adult American Shad were counted in 2017 at all first barrier
passage facilities in the basin. A total of 536,670 American Shad were passed upstream of the
Holyoke Dam, Massachusetts, in 2017 through its two fish lifts, the second highest value in the
time series (Figure 4). The mean passage count at Holyoke for the period 1976-2017 is 309,041
(±SD 131,363). The 25th
and 75th
percentile values for passage counts are 196,084 and 376,777
respectively. The American Shad passage count at Holyoke Fish Lift, as a population metric
with a number of caveats, has for the fifth year in a row exceeded the 75th
percentile (Figure 4).
The Holyoke Fish Lift had a late opening on 4/24/17 due to a combination of river discharge
(spill) and cool water temperatures. The first five days of operation had daily shad counts of less
than 100 and the sixth day counts increased to several thousand (Figure 5). A new record single
passage day for American Shad occurred on 5/19/17 with 76,441 shad counted, breaking the
previous high daily record set last year (54,004).
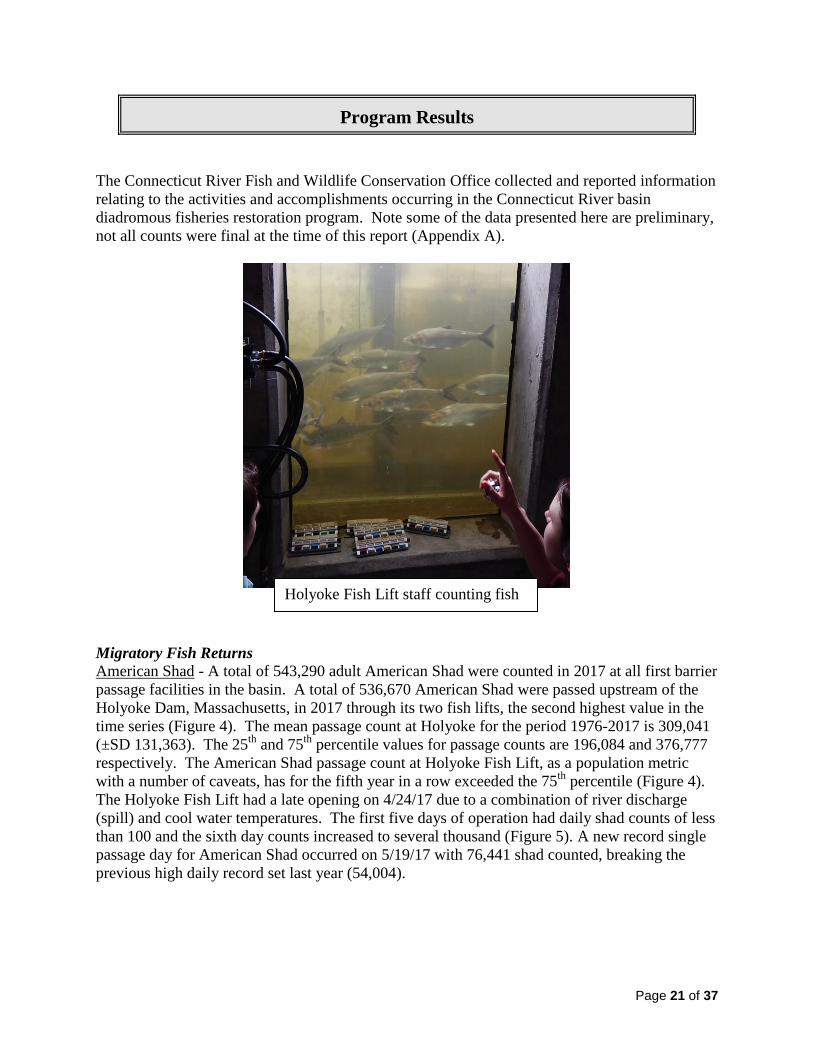
Holyoke Fish Lift staff counting fish

Page 22 of 37
Select Fish Passsage Count Annual Summaries 1976-2017
100x103
200x103
300x103
400x103
500x103
600x103
700x103
800x103
Count
100x103
200x103
300x103
400x103
500x103
600x103
700x103
Year
20x103
40x103
60x103
80x103
100x103
120x103
Holyoke Fish Lifts American Shad
Holyoke Fish Lifts Blueback Herring
Total Atlantic Salmon (all trap facilities)
Holyoke Fish Lifts Sea Lamprey
1977
1980
1983
1986
1989
1992
1995
1998
2001
2004
2007
2010
2013
2016
0
100
200
300
400
500
600
Total Atlantic Salmon Returned to River Basin
Figure 4. Select count summary of Holyoke Fish Lifts passage counts for American Shad,
Blueback Herring and Sea Lamprey (1967-2017) and total Atlantic Salmon returns to the basin.
Fish counts are affected by structural and operational changes at both dams and fishways and by
environmental conditions (temperature and flow/spill) within year and among years.
Page 23 of 37
Figure 5. Daily American Shad counts from Holyoke Fish Lifts with water temperature and river
discharge (USGS) data included for the period April 1 to July 15, 2017.
A total of 6,000 American Shad were passed upstream of the West Springfield Fish Ladder in
2017 on the Westfield River, which is nearly identical to the 5,940 counted in 2016 and greater
than the long-term mean of 3,300. The record high American Shad passage count at that facility
was 10,300 in 2012. A total of 613 American Shad were passed upstream of the Rainbow Dam
Fishway on the Farmington River in Connecticut, a fishway with known upstream passage issues
for this species.
Of the American Shad passed upstream of the Holyoke Dam, 48,727 shad were counted passing
the Gatehouse Ladder at Turners Falls Dam in 2017 (Table 9). The Turners Falls Dam and
power canal is a three fishway complex. Fish must first pass either the Cabot Station Ladder
(into the power canal) or the Spillway Ladder, at the base of the dam and upstream end of the
“bypassed reach.” Fish passing the Cabot Ladder exit into the lower power canal that requires
finding one of two entrances to the Gatehouse Ladder at the upstream end of this 2.1 mile long
canal. Spillway Ladder passed fish may go directly to the entrance of the Gatehouse Ladder, but
as in the case of all ladders, have opportunities to drop back, including into the canal.
Overall, the 2017 passage number at Gatehouse Ladder (requiring passage at noted two other
ladders) as a percentage of American Shad passed at Holyoke was only 9.1%, a reduction from
the 14.0% observed in 2016 (Table 9). The new CRASC Shad Management Plan has a
minimum passage objective of 397,000 American Shad for the Turners Falls Project, or ~58% of
the minimum target passage objective at Holyoke, based on upstream habitat. At the next
upstream barrier, Vernon Dam (Vernon, Vermont), the single fish ladder passed a total of 28,682
American Shad, down from the 35,513 passed in 2016. Vernon Dam Ladder passed 59% of the
American Shad counted passing from the Turners Falls Gatehouse Ladder in 2017, but was far
0
5
10
15
20
25
30
0
10,000
20,000
30,000
40,000
50,000
60,000
70,000
80,000
90,000
4/1
4/5
4/9
4/1
3
4/1
7
4/2
1
4/2
5
4/2
9
5/3
5/7
5/1
1
5/1
5
5/1
9
5/2
3
5/2
7
5/3
1
6/4
6/8
6/1
2
6/1
6
6/2
0
6/2
4
6/2
8
7/2
7/6
7/1
0
7/1
4
Wat
er
Tem
p C
# Sh
ad P
asse
d a
nd
CFS
Holyoke Fish Lifts - American Shad Daily Passage Counts (2017) Lifting started on 4/24/17
Passed
CFS
Water Temp

Page 24 of 37
below the minimum passage target of 227,000 American Shad in the CRASC Plan (Table 9).
Table 9. American Shad fishway passage counts for the period of 1980 – 2017, for
Holyoke Dam, Turners Falls Dam (Gatehouse Ladder), and Vernon Dam.
Year HFL
Passed Gatehouse
Passed
% Gate vs. HFL
#
Vernon Passed
%Vern vs.
Gate #
1980 380,000 298 0.1
1981 380,000 200 0.1 97 48.5
1982 290,000 11 0.0 9 81.8
1983 530,000 12,705 2.4 2,597 20.4
1984 500,000 4,333 0.9 335 7.7
1985 480,000 3,855 0.8 833 21.6
1986 350,000 17,858 5.1 982 5.5
1987 270,000 18,959 7.0 3,459 18.2
1988 290,000 15,787 5.4 1,370 8.7
1989 350,000 9,511 2.7 2,953 31.0
1990 360,000 27,908 7.8 10,894 39.0
1991 520,000 54,656 10.5 37,197 68.1
1992 720,000 60,089 8.3 31,155 51.8
1993 340,000 10,221 3.0 3,652 35.7
1994 170,000 3,729 2.2 2,681 71.9
1995 190,000 18,369 9.7 15,771 85.9
1996 280,000 16,192 5.8 18,844 116.4
1997 300,000 9,216 3.1 7,384 80.1
1998 320,000 10,527 3.3 7,289 69.2
1999 190,000 6,751 3.6 5,097 75.5
2000 225,000 2,590 1.2 1,548 59.8
2001 270,000 1,540 0.6 1,744 113.2
2002 370,000 2,870 0.8 356 12.4
2003 280,000 Not available 268 2004 192,000 2,192 1.1 653 29.8
2005 116,511 1,581 1.4 167 10.6
2006 155,000 1,810 1.2 133 7.3
2007 158,807 2,248 1.4 65 2.9
2008 156,492 4,000 2.6 271 6.8
2009 160,649 3,813 2.4 16 0.4
2010 164,439 16,422 10.0 290 1.8
2011 244,177 16,798 6.9 46 0.3
2012 490,431 26,727 5.4 10,386* 38.9
2013 392,494 35,293 9.0 18,220 51.6
2014 370,506 39,914 10.8 27,706 69.4
2015 412,656 58,079 14.1 39,771 68.5
2016 385,930 54,069 14.0 35,513 65.7
2017 536,670 48,727 9.1 28,682 58.9 *an example of a fishway issue that was identified (telemetry study), resolved (USFWS Engineers and
TransC) that resulted in the observed increase in passage counts, effective in 2012.
Bellows Falls Fish Ladder was operated in 2017 but did not count any shad passing. This
project’s ladder was, by agreement, previously triggered on Atlantic Salmon upstream passage
needs, so its period of operation was often limited/restricted in the past. Beginning in 2013,

Page 25 of 37
TransCanada now Great River Hydro, agreed to open this ladder based on a trigger of 100 Sea
Lamprey passed at Vernon Dam following a request from CRASC, providing an opportunity for
upstream habitat access.
The performance of a fishway (both up and downstream) cannot only be measured in the
numbers of fish they pass but must consider the time taken to pass (rates), addressing the
important issue of delay. Delay may be caused by ineffective attraction to the entrance areas of
fishways, issues at the entrances and with entry, and internal ladder/fishway efficiency or other
project operational situations. The concern with delay is based on the fact that American Shad
are migrating on stored energy reserves, so the additive amount of delay (for both upstream and
downstream migrations) increases the likelihood of mortality before returning to salt water after
spawning. Through this mechanism, under a variety of upstream and downstream passage
situations, the possibility for a future opportunity to return as a repeat spawner may be reduced
or eliminated. The Connecticut River American Shad population is iteroparous (an individual
can spawn repeatedly, over years) that may serve to increase population resilience in the case of
poor reproduction (buffer), increase reproductive capacity (larger older fish have exponential
increases in fecundity) and increase overall annual run population size. In addition to the
importance of timely passage, passage must also be safe, on upstream and for downstream
migrating post spawn adults and juveniles. The challenge with a highly dammed river is the fact
that a portion of the fish passed upstream face potentially increased (additive) mortality rate
effects from hydroelectric projects encountered, potentially compounded by “cumulative effects”
(e.g., mortality, delay) with projects in succession. As an example, a group of fish with a 90%
survival rate at each encounter with 4 successive hydroelectric projects, results in the cumulative
effects loss of 34.4% of the starting number.
Study reports and results submitted to FERC for relicensing requirements on American Shad
movement, passage, and survival at dams, facilities, and fishways (both up and downstream
passage), have been revised and have demonstrated project attributed additive mortality, most
clearly defined by use of turbines as a downstream passage route by adult shad (approximately
42% in the case of the Turners Falls Power Canal). Similar to Turners Falls and the power canal,
a substantial percentage of adult shad used the turbines as a passage route at the Vernon Dam
(~42%), with increased (additive) mortality and agency concerns at the extent of spill observed
during the study and the number of fish with unknown routes of passage. Great River Hydro
understood the agency concerns and developed a plan to repeat the downstream portion of the
study in 2017 with some modification to better address confirmation of passage route use/choice
as well as more representative limited spill conditions. The study report has not yet been
provided. With both company’s reports, there is a lack of agreement on data interpretation and
results for impacts on downstream passing adults that are explained in the USFWS’ comment
letters to FERC reviewing these and other study reports and other sources of published data on
the range of survival rates based on species, fish size, turbine type and operation.
Connecticut DEEP continued its long-term juvenile Alosine Seine Survey, sampling seven
locations starting a few kilometers downstream of Holyoke Dam to Essex, CT from July through
October. The 2016 assessment yielded a record high geometric mean catch rate of 16.7 juvenile
American Shad for the survey time series (Appendix B). However, the 2016 juvenile Blueback
Herring catch rate, at 1.55, was the all-time lowest value in the time series. At the time of this
report, the 2017 CTDEEP survey results were not available but were described as similar to the
long term average for both species. The CTDEEP also examined scale samples from Holyoke
Fish Lift shad, collected over 53 days, comprised of n=829 fish in 2016. The CTDEEP

Page 26 of 37
determined the male age structure was dominated by age-5 (50.1%) followed by age-4 (27.5%)
fish. An estimated 10.8% of the males were age-6 with less than 1% being age-7. The
percentage of repeat spawners (males) was reported as 5.8%. Female shad age structure was
dominated by age-5 (47.2%) followed by age-6 (37.7%) and age-4 (11.3%). Age-7 females
comprised only 1.8% of the sample and the percent female repeat spawner was 11.3%. Overall
percent repeat spawner was 8.4% which remains below the CRASC management plan target, but
is a slight increase over recent years (2006-2015 mean 5%). The 2017 season’s run of shad
would have the first “repeat” cohorts that experienced the improvements to downstream passage
effective starting in 2016 at Holyoke Dam and the Hadley Falls Power Station. CTDEEP had
not completed the reading of shad scales from 2017 at the time of this report.
Shortnose Sturgeon – A total of 85 Shortnose Sturgeon (SNS) were trapped at Holyoke Fish Lift
in 2017, two of which were mortalities (8/1 fish #76 and 10/12 fish #85) that required a shut-
down of lift operations for investigation. The second (final) mortality fish #85, on 10/12,
resulted in closure of operation for the remainder of 2017. The 8/1 mortality had a facility and
operations investigation by NOAA and USFWS Fish Passage Engineers that led to some
modifications to address the suspected cause of that event with lifting operations starting back up
after two weeks of shut down. The sturgeon count is similar to 2016 when a total of 78 unique
sturgeon were documented, several that were trapped twice or up to three times with none of
them being released upstream as the required evaluation/monitoring plan was still in
development and review and not approved. Radio tagging was initiated in summer 2017, with a
total of 5 SNS released upstream with tags for monitoring.
Shortnose Sturgeon Collected at Holyoke Fish Lift in 2017
5/1
6/1
7/1
8/1
9/1
10/1
11/1
# o
f S
NS
Tra
pp
ed
at
HF
L
0
2
4
6
8
10
12
14
16
18
20
Da
ily M
ea
n C
FS
(U
SG
S I
-39
1)
0
10000
20000
30000
40000
50000
60000
70000
Figure 6. Daily Shortnose Sturgeon captures at the Holyoke Fish Lifts in 2017, in relation to
river discharge. Note that the Holyoke Fish Lift operations were suspended on August 1 due to a
sturgeon mortality that resumed again on August 15th. A second mortality on October 12th
resulted in lifting operations being ceased for the remainder of the season.
Page 27 of 37
Blueback Herring - A total of 875 Blueback Herring were counted at the Holyoke Fish Lift in
2017 that while substantially greater than the 137 passed in 2016, remains remarkably low and
supports the 2017 (ASMFC) coast wide river herring stock assessment’s conclusion that these
species remain at all-time low levels of abundance (Figure 4). River herring counts are not
believed to reliably serve as a population metric for the lower main stem river/basin, and larger
lower basin tributaries (downstream of first barrier/fishways), where substantial spawning habitat
occurs (refer to earlier report sections). The CRASC River Herring Management Plan identifies
an annual passage goal of 300,000-500,000 at the Holyoke Fish Lift. That goal had been attained
and exceeded up to the early 1990s, as population declines were also being observed along much
of the East Coast.
Sea Lamprey - A total of 24,378 Sea Lamprey were observed from first barrier fishways or
estimated by nest counts (CTDEEP nest counts) returning to the Connecticut River basin in
2017. This is a substantial decrease (~32%) from the total 2016 counts, driven primarily by the
Holyoke Fish Lift. Holyoke passed a total of 21,526 Sea Lamprey in 2017 compared to 35,249
passed in 2016 (Figure 4). The 2017 count at Holyoke is well below the long-term mean annual
count of 34,000 at that facility. A total of 9,257 Sea Lamprey subsequently passed upstream of
Turners Falls Dam (through Gatehouse Ladder), or 43% of the number passed at Holyoke
(identical to 2016). In 2016 a total of 15,128 Sea Lamprey passed the Gatehouse Ladder at
Turners Falls. A total of 2,612 passed upstream of Vernon Dam (or 28% of Gatehouse Ladder
total). A total of 1,261 lamprey passed upstream of Bellows Falls Dam compared to 1,619
(2016). In the lower river basin, 2,187 Sea Lamprey passed at Rainbow Dam, Farmington
River, an increase from the 491 passed in 2016. A total of 249 Sea Lamprey passed upstream of
the West Springfield fishway, compared to 449 in 2016 and 1,127 in 2014.
Striped Bass - A total of 451 Striped Bass were counted at the Holyoke Fish Lift in 2017. The
2017 count is a slight decrease from the 638 Striped Bass passed in 2016.
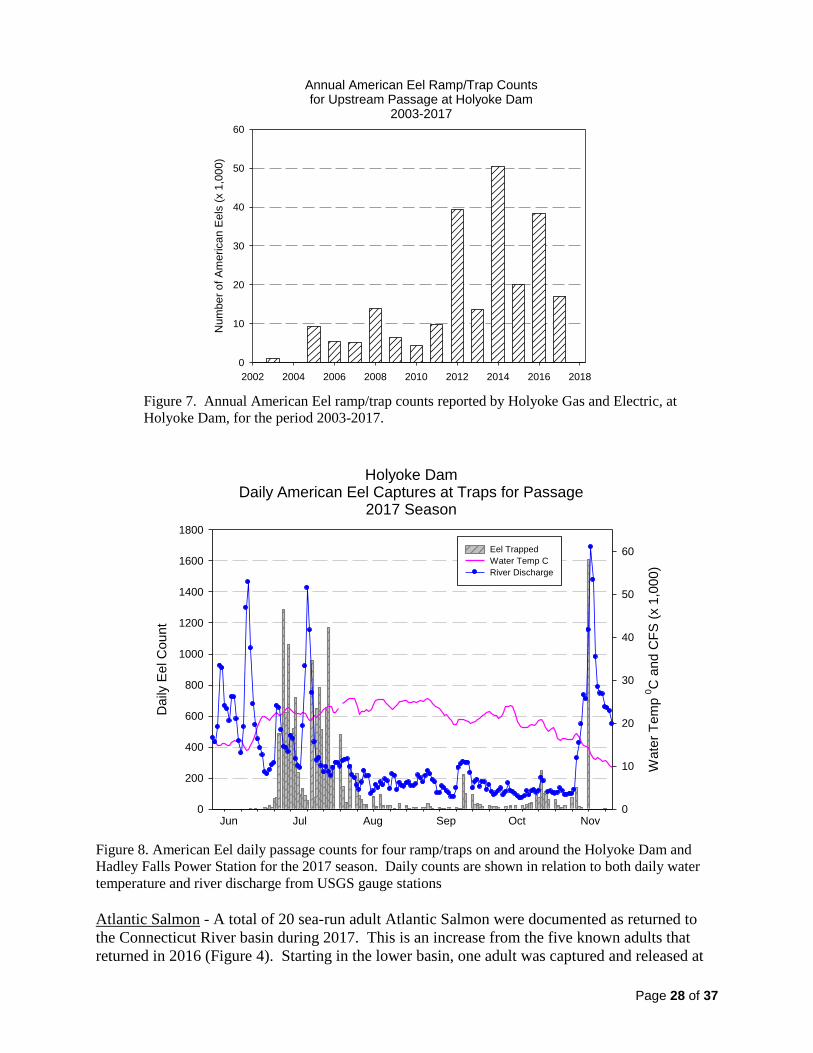
American Eel – The American Eel passage count at Holyoke Dam, which uses four specially
designed ramp/traps in different project locations, totaled 17,037 fish, for the period May 24
through November 9, 2017. This is a substantial reduction from the 38,000 observed in 2016
(Figure 7). The Holyoke Gas and Electric Report on American Eel passage will be available in
the winter of 2018 and will compare catch rates among the trap locations and provide details on
other statistics. American eels captured in these ramp/traps are relatively small in size primarily
ranging between 10-20 cm in total length. American Eel trap/passage count data from Holyoke
Dam for 2017 in relation to mean daily river discharge is shown in Figure 8.
Page 28 of 37
Annual American Eel Ramp/Trap Countsfor Upstream Passage at Holyoke Dam
2003-2017
2002 2004 2006 2008 2010 2012 2014 2016 2018
Nu
mb
er
of
Am
erica
n E
els
(x 1
,00
0)
0
10
20
30
40
50
60
Figure 7. Annual American Eel ramp/trap counts reported by Holyoke Gas and Electric, at
Holyoke Dam, for the period 2003-2017.
Holyoke DamDaily American Eel Captures at Traps for Passage
2017 Season
Jun Jul Aug Sep Oct Nov
Daily
Ee
l C
ou
nt
0
200
400
600
800
1000
1200
1400
1600
1800
Wa
ter
Te
mp
0C
an
d C
FS
(x 1
,00
0)
0
10
20
30
40
50
60Eel Trapped
Water Temp C
River Discharge
Figure 8. American Eel daily passage counts for four ramp/traps on and around the Holyoke Dam and
Hadley Falls Power Station for the 2017 season. Daily counts are shown in relation to both daily water
temperature and river discharge from USGS gauge stations
Atlantic Salmon - A total of 20 sea-run adult Atlantic Salmon were documented as returned to
the Connecticut River basin during 2017. This is an increase from the five known adults that
returned in 2016 (Figure 4). Starting in the lower basin, one adult was captured and released at

Page 29 of 37
the Leesville Dam, on the Salmon River (CT). Three adult salmon were trapped and released at
the Rainbow Fish Ladder on the Farmington River (CT). At the West Springfield Ladder on the
Westfield River (MA), five salmon were trapped and trucked upstream of dams without passage
into suitable spawning habitat. The remaining 11 adult salmon were captured at Holyoke Fish
Lift with six of those fish moved to USGS Conte Lab for swimming performance studies (<48
hours total), after which they were released immediately downstream of the laboratory near
Cabot Station. The other five salmon were processed for data, tagged with a FLOY tag and
released.
Juvenile Atlantic Salmon Releases - Connecticut DEEP
A total of 71,503 Atlantic Salmon fry were stocked in the Salmon River basin and 106,429 in the
Farmington River basin in 2017. This is an increase from 2016 stockings but still well below
target numbers for this CTDEEP program.
Gizzard Shad - A total of 740 Gizzard Shad were counted at the Holyoke Fish Lift in 2017, a
modest increase from 2016 but within the expected range observed since early 2000s.
Page 30 of 37
Fish Passage There has been a diversity of activities related to fish passage, some of which are highlighted in
this section. John Warner continued in his role as the USFWS Hydropower Coordinator in this
basin. Fishway inspections prior to the start of the 2017 season, or early in the season, were
completed by USFWS Fish Passage Engineers Brett Towler and Brian Waz (Vernon, Turners
Falls, Holyoke, and on Westfield River -West Springfield Dam). These annual inspections have
identified issues that were brought to the attention of the operators and have been resolved in a
timely manner.
At Holyoke Dam, Holyoke Gas and Electric (HGE) provided a study report on both upstream
and downstream adult American Shad passage evaluations. That study was conducted in 2016
with the report released in 2017. Upstream passage efficiency in the report was based on 53
radio tagged shad entering the project area and 23 (43%) successfully passing. Study fish were
captured at the HFL trap (when passing), tagged, then moved by truck for release downstream,
all of which attributes to related mortality and tagging effects. It is not known whether tagged
study fish were “fast movers/passers” when initially captured for study – or whether they may
have been weeks in the river. The USGS/USFWS shad tagging study in 2011 and 2012
demonstrated much higher “arrival” to “passage” rate numbers 73.8% (± 7.0) in 2011 and 75.8%
± 6.6) in 2012, which is attributed to tagging fish at the river mouth at entry and analyses to
account for the rate of tag loss. That being said, the Holyoke study did provide valuable
information including areas of concern for passage based on movement into and out of the
passage facility – prior to lifting areas as well as showing near equal use of the two lift entrances
(tailrace and spillway). The areas where shad moved in and out are being discussed for
additional examination. Downstream passage of adult shad evaluations was limited to the
modified project areas – changes at Bascule gate, hydraulic jump structure, plunge pool, and
submerged mid and deepwater bypass passage built into reduced (2 inch) bar spacing (full depth)
racks at turbine intakes. The study report stated of 66 shad approaching towards the project, 62
were at some time in the forebay (near turbine intakes) of those 59 were close to intake rack of
which 39 approached the submerged bypasses and 45 approached the Bascule (spill gate). Of the
original “66” a total of 26 entered and passed via the Canal and its existing passage system
(~30%). It was reported that the combined bypasses (submerged intakes on rack and Bascule
gate) had a total of 69% of the passage. Mortality rate determination was complicated by many
factors and interpretation of the data. The company report states ~80% downstream passage
survival, with some assumed mortality assignments for fish detected approaching the dam from
upstream. The report further noted ~20% known/detected mortality for fish known to have used
either the Bascule or the submerged bypasses. The analytical approaches examined probabilities
of movements based on the data and a range of operational conditions (units on etc.).
A juvenile American Shad study report was also provided by HGE for Holyoke to evaluate the
new downstream passage areas (Bascule/plunge pool/submerged bypass intakes). That report, as
with the adults, included calls and letters on the data, analyses, and interpretation. We have not
come to consensus on the assignments of fish and there is some agreement on the challenges of
these data given the size of these fish, tagging technique that was used (radio – not balloon tag
HiZ), and detection histories.
The Turners Falls Dam and Northfield Mountain Pump Storage, with their ongoing FERC
relicensing studies, had many study reports submitted to FERC in 2017. The agencies benefitted
Page 31 of 37
from a large inter-agency effort to review these reports and develop response/comment letters.
The agencies and a number of conservation partners agreed to a request to initiate confidential
negotiation discussions in the spring of 2017. As a result, details of those ongoing discussions
may not be reported, but work among all members and meetings have been occurring
continuously.
Vernon, Bellows Falls, and Wilder Dam projects, as part of their relicensings also had many
study reports submitted to FERC in 2017. These reports required a large inter-agency effort to
review and comment on relative to study goals and objectives and their data analyses and
interpretations. Study response letters identified any areas of concern with design, sample sizes,
analyses, results and interpretation that were also discussed at meetings. As noted earlier the
downstream passage study of adult shad was repeated in 2017 by Great River Hydro.
There was agreement to address several fish passage concerns identified at Vernon Fish Ladder
and its operation by Great River Hydro and the agencies with USFWS Fish Passage Engineers.
These modifications included a new tracking system for fishway entrance flow differentials (as
tailrace water level shifts), modifications to some lower ladder turn pool areas where a
percentage of radio tagged shad were shown to stall or drop back, and modifications near the
counting room to better direct (for viewing) American Eel for more accurate count data. The
Instream Flow Study and its extensive outputs relative to species/life stages and habitat effects
under seasonal flows and potential hydropower operations are an ongoing discussion at the
agency conservation partner level. A request for an additional model run with a baseline
condition of inflow=outflow at the projects remains with some reported constraints on this
scenario that need to be clarified by the company.

Page 32 of 37
Appendix A. Fishway count report produced by CTRFWCO for distribution and posted on
office web site.
This report is compiled by the U.S. Fish and Wildlife Service, using fishway count data provided by several agencies as well
power companies and is dependent in many cases on the review of video counts, that have an associated time lag for
updates. Please visit http://www.fws.gov/r5crc for other count data summaries, and related information.
Fishway, River -
State
Data as
of:
American
ShadAlewife
Blueback
Herring
Atlantic
Salmon
American
Eel
Sea
Lamprey
Striped
Bass
Gizzard
Shad
Shortnose
Sturgeon
Other/
comment
Mary Steube,
Mill-CT Final 8,522 FINAL
Moulson Pond,
Eightmile-CTFinal
1 6 22 21
Leesville,
Salmon-CTFinal
1 382S.L. from
nest counts
StanChem,
Mattabesset-CTFinal
5 78 5 19 16 1 103
Rainbow,
Farmington-CTFinal
613 16 3 2,187
W. Springfield,
Westfield-MAFinal
6,000 5 5 249closed on
7/7
Holyoke,
Connecticut-MA 10/31 536,670 875 11 17,037 21,526 451 740 85
Easthampton,
Manhan-MA5/10 thru
7/7 only 2 52partial
count
Turners Falls,
Connecticut-MA 7/7 48,727 3 9,257closed on
7/7
Vernon,
Connecticut-VT Final 28,682 2 581 2,612
Bellows Falls,
Connecticut-VT Final 1 -158 1,261
Wilder,
Connecticut-VT
not
opened
Total to basin,
only first barrier
counts* 543,289 8,606 923 20 24,381 452 843 85
Last year totals* 392,057 792 3,558 5 38,449A36,914 638 685 78
2017 Connecticut River Basin Fishway Passage CountsReport Date: 12/30/2017
B - total of 78 unique SNS captured at HFL in 2016
A - total collected from 4 eel ramp/traps at Holyoke in 2017
All returning adult sea-run salmon will be streamer tagged below its dorsal fin and released and if angled released without harm,
preferably without removing from the water. Please contact USFWS at 413-548-9138 x8121 to report any capture/releases.
The annual total of American Shad passed at Holyoke is the second highest ever, exceeded only by the record high of 721,764 in
1992. Modifications to improve upstream and downstream fish passage have been ongoing at Holyoke over this period, notably,
significant passage modifications were effective in 2016. Many details on fish passage and population(s) status, special studies etc.,
are discussed publically at spring and fall CRASC Technical and Commission meetings (approved minutes on USFWS noted above web
site). FERC relicensing efforts remain ongoing for Turners Falls Dam, Northfield Mountain Pump Storage, Vernon Dam, Bellows Falls
Dam and Wilder Dam.

Page 33 of 37
Appendix B. The Connecticut DEEP - Fisheries Division’s Juvenile Alosine Seine Survey
annual catch rates. Values are geometric mean catch rates from seine surveys conducted at seven
sites from July through October annually.
Year Juv
Shad Juv BBH
1978 5.89
1979 7.84 24.8
1980 9.21 26.75
1981 6.05 11.49
1982 1.81 6.09
1983 4.99 16.47
1984 3.37 11.57
1985 7.14 18.23
1986 6.29 13.61
1987 9.89 21.58
1988 5.68 17.04
1989 4.85 7.52
1990 10.39 14.41
1991 3.92 11.36
1992 7.21 9.87
1993 9.49 14.43
1994 12.22 13.92
1995 1.34 5.03
1996 6.5 5.91
1997 6.75 9.66
1998 3.65 4.39
1999 5.47 5.57
2000 4.42 4.17
2001 2.73 3.83
2002 5.55 3.95
2003 6.88 5.88
2004 5.62 2.36
2005 10.08 4.1
2006 1.82 3.5
2007 8.15 6.61
2008 5.06 2.2
2009 3.4 1.77
2010 10.23 12.82
2011 3.08 2.93
2012 3.03 2.22
2013 3.16 6.89
2014 8.09 3.69
2015 8.53 8.63
2016 16.7 1.55
2017

Page 34 of 37
Appendix C. History of the Anadromous Fish Program
Native diadromous fishes (diadromy includes anadromous and catadromous fishes, with
American Eel being the only catadromous species in this basin) were once abundant in the
Connecticut River basin excluded from habitat only by natural barriers and their physiological
limitations. Atlantic Salmon ascended the main stem Connecticut River to Beechers Falls, VT,
nearly 400 miles upriver from its outlet at Long Island Sound. American Eel have been
documented even farther upstream in the basin by early New Hampshire Fish Game studies. No
fishery management or scientific information exists that provides a technical description of the
pre-colonial diadromous fish populations. However, historical accounts of the region are filled
with references to large American Shad, river herring and Atlantic Salmon runs which were
known to have been an important food source in the spring for the native people and early
European settlers. As colonization by Europeans and the development of water power sites
expanded throughout the basin, anadromous fish populations notably declined. A major cause of
the declines or loss of runs was from the construction of dams that blocked fish migrations from
reaching their spawning habitat (Figure 1). Tributaries were more easily dammed and so
elimination of these species progressed rapidly in these areas first, with settlement and use of
early water power for mills. The first dam across the main stem Connecticut River was
constructed as early as 1798, for barge/boat movement, near the present site of Turners Falls,
MA. This dam blocked returning American Shad, river herring, Atlantic salmon and Sea
Lamprey from access to spawning habitat in the northern and central portion of the river basin.
As a result, those species simply disappeared from areas of the basin in both New Hampshire and
Vermont.
An interagency state/federal program to restore salmon to the Connecticut River based on the
stocking of fry hatched from eggs taken from Penobscot River Atlantic Salmon was initiated in
the 1860s, decades after the construction of the Holyoke Dam, MA. Although the effort resulted
in the return of hundreds of adult salmon for several years in the 1870s and 1880s, the program
eventually failed due to both uncontrolled harvest of fish in Connecticut waters and the failure to
construct effective fish passage at dams in Massachusetts. Concurrent with the salmon
restoration effort were the state’s American Shad culture and stocking efforts to enhance reduced
runs of this valued species. Work to restore and enhance these two species was conducted
through developing fish culture techniques that were gaining popularity as an approach to
achieve fishery management goals.
Although interest continued in restoring Atlantic Salmon to the basin, no action was taken for
many decades due to the lack of funds and the lack of effective fish passage technology (an early
design fish ladder had been installed at Holyoke Dam). The condition of the river environment
continued to deteriorate in response to widespread pollution and dam construction through the
early to mid-1900s. By the 1960s, some tributary dams were breached and pollution abatement
programs were initiated. Long term cooperative restoration programs became feasible with the
passage of the federal Anadromous Fish Conservation Act of 1965 (P.L. 89-304) which made
funds available for interstate fish restoration programs. The combined effects of these events set
the stage for anadromous species restoration. In 1967 the four basin states, USFWS, and NMFS
signed a statement of intent to restore anadromous fishes including American Shad, Atlantic
Salmon, and river herring to the Connecticut River. Atlantic Salmon were a focus due to its
appeal for recreational angling opportunities by the resource agencies. Early salmon stockings

Page 35 of 37
were initially comprised of two-year old smolts of Canadian origin reared in federal trout
hatcheries that had recently been converted to salmon production. The term smolt defines a
salmon life-stage when the transitional migration from freshwater to the marine environment
occurs, typically in the months of April and May. The first adult salmon return from these
hatchery smolt releases was documented in 1974.
Early in the Atlantic Salmon Program the management emphasis was placed on stocking smolts
with the USFWS building a salmon hatchery in Bethel, VT, and CTDEEP and MADFW
converting trout hatcheries for salmon production. Production of stream-reared smolts, from
juvenile stockings, was combined with smolts produced in hatcheries to increase smolt
emigration from the river. A major effort was begun in 1987 to stock fry into appropriate habitat
in the basin, based upon in-river research results.
Beginning in 1994, the Program utilized only “Connecticut River” fish, with no introductions of
genetic material from outside the basin. Genetic monitoring had demonstrated the development
of some unique genetic characteristics (alleles) that distinguish the Connecticut River population
from other populations at that scale. The use of conservation genetics enabled the Program to
maintain a genetically healthy population to maximize genetic diversity and reduce risks from
genetic issues.
Adult Salmon returns per 10,000 stocked fry declined dramatically from what had been
documented from 1979 through 1994, when this rate averaged 0.71 (high of 1.6). For the period
1995 through 2008, the mean adult/10,000 fry stocked was 0.11 (refer to U.S. Atlantic Salmon
Assessment Committee Report 27 – 2014 Activities (http://www.nefsc.noaa.gov/USASAC/Reports/). This
latter period is when the program shifted to fry stocking as the primary restoration strategy,
coinciding with this unexpected decline in fry return rates (due to marine survival rate
decreases). This situation translated to a sustained reduction on the order of 1/6 of what had
been observed for this rate (< 1994) even as issues of safe downstream passage of smolts at
hydropower facilities and ocean fishery closures were completed. Studies over time have shown
shifts in salmon marine prey species abundance and distributions, shifts in predator assemblages,
and shifts in marine habitat area use are likely contributing factors that can be related to climate
change.
The severe damage to the White River National Fish Hatchery (WRNFH) in fall of 2011, from a
flood event, severely impacted the Salmon Program as it maintained a high proportion of the
domestic broodstock and subsequently annual egg and fry production for all the states. WRNFH
had been producing approximately 65% of the fry for the Program in the preceding 10 years. The
loss of this facility, in conjunction with ongoing reviews of the best science and information
related to restoration efforts, and emerging USFWS Northeast Region fisheries issues and
priorities, led the USFWS to announce its decision to conclude fish culture activities for the
Connecticut River Atlantic Salmon Program. That announcement was made in public at the July
2012 Connecticut River Atlantic Salmon Commission meeting. Subsequently, in the fall of
2012, the Commonwealth of Massachusetts decided it would no longer culture salmon at its
Roger Reed State Hatchery. The last spawning of domestic salmon broodstock occurred at that
facility in 2012, with all fry and remaining Connecticut River salmon of various ages stocked out
in 2013. The State of New Hampshire had concluded the restoration effort with a last stocking
in 2012 while the final stocking in Vermont was in 2013.
The State of Connecticut currently operates a “Salmon Legacy Program,” which is not a

Page 36 of 37
restoration program but serves other defined purposes. The goal of Connecticut’s program is to
maintain Atlantic salmon in select watersheds, maintain existing genetics of the Connecticut
River salmon, provide fish for their state broodstock fishery program (outside of the Connecticut
River basin), and support educational programs such as the school egg/fry rearing program.
Action to provide upstream fish passage on the Connecticut River main stem in the mid-1900s
occurred in 1955, when a rudimentary fish lift was constructed at Holyoke Dam to pass
American Shad and river herring, that relied on humans pushing them in wheeled buckets. At
that time, and for approximately three decades after, the Enfield Dam remained a partial barrier,
even though laddered, eventually disintegrating completely in the 1980s. The Holyoke Dam
facility was expanded in 1976 when substantial upstream passage modifications occurred, with a
new second lift installed in the spillway (or at the base of the dam, as opposed to the existing
“tailrace” lift entrance). Although not studied, upstream passage efficiency appeared to improve
greatly with corresponding increases in annual fish counts for species like American Shad and
Blueback Herring (Figure 4). Other fishways built at dams on the main stem river and tributaries
allowed returning Atlantic Salmon, American Shad, river herring, American Eel, and Sea
Lamprey access into select portions of the basin (with varying degrees of fishway effectiveness)
targeted for restoration. Major issues with several different fishways have been apparent relative
to ineffectiveness at passing American Shad, river herring, American Eel (downstream) and
Shortnose Sturgeon. These issues have been dealt with on a case by case basis, with varied
degrees, of success. However, with the Federal Energy Regulatory Commission’s five main stem
project relicensing currently underway, opportunities for improvements for fish passage are
anticipated along with plans to address other problem passage sites in the near future (e.g.,
Rainbow Fishway on the Farmington River).
Upstream passage at Turners Falls Dam (Massachusetts) fishways (first operational in 1980)
have been studied and modified for decades and is one of the projects in the FERC relicensing
process at this time. Passage issues relative to American Shad are best explained by the fact that
no ladders of the size required on the main stem had been designed for that species as the
cooperative restoration effort took this management need on in the 1970s. The USFWS relied on
the best information (no specific studies available) at the time that suggested West Coast fish
ladders on the Columbia River were effective at passing introduced American Shad. This led to
the adoption of these designs, downsized considerably from the Columbia River, for use on the
main stem Connecticut River dams. The USFWS worked with the power companies in the
design and construction, to develop operating parameters for flow, velocities, and turbulence
measures. However, the down scaling created some unforeseen challenges in hydraulics for
these species that the agencies, researchers (USGS CAFRC), and power company consultants
have worked on resolving over the years with increasing knowledge.
Following on the Turners Falls ladders completions, the Vernon Dam (Vermont) fish ladder
became operational in 1981 with Bellows Falls and Wilder dam fish ladders in the subsequent
years. As the number of salmon fry stocked in the basin increased during the late 1980s, concern
grew for the potential negative effects of hydroelectric turbines or other passage routes on
outmigrating smolts, as well as juvenile and post spawn adult American Shad. Efforts to provide
safe and effective downstream fish passage on both main stem and tributary projects were
initiated in the 1980s. In 1990, a Memorandum Of Agreement (MOA) were signed with two
major utility companies that operated hydroelectric facilities at six main stem projects that
established time frames for downstream fish passage construction. The Holyoke Dam and
Hadley Falls Power Station is a good example of a very recent large scale fish passage

Page 37 of 37
improvement project, designed specifically to address; downstream passage and protection of
adult American Eel and Shortnose Sturgeon as well as upstream passage of Shortnose Sturgeon
and other anadromous species that became operational in 2016, using new engineering
approaches.
The state and federal agencies continue to work in close cooperation with many partners to
address fish management, protection, enhancement, and restoration topics for both populations
and habitats. This work is important for the ecological, recreational, and commercial benefits,
derived from healthy native fish populations and the aquatic habitats they require. Currently,
ongoing fisheries work includes continuing efforts to increase both diadromous species
abundance levels and distributions (particularly upper basin and in tributaries) as well as stock
structure characteristics (e.g., multiple age classes) to support population resilience and health
(as characterized by status). The current FERC relicensing process for the five main stem
facilities is important in this regard relative to the 50 year length of these federal licenses and the
opportunity to seek conditions and measures that protect the public’s fishery resources now and
for future generations. The CRASC and its predecessor, the Connecticut River Policy
Committee, have provided and continue to provide, a critical coordinated fishery leadership role
from policy setting to project implementation, resulting in many positive outcomes not observed
in other large East Coast river basins.