connect the cornerstone to improving life cycle costs. reducing your cost of ownership using smart...
TRANSCRIPT

Connect
The Cornerstone To Improving Life Cycle Costs.
Reducing Your Cost of Ownershipusing Smart Bus Technologies

Connect
Reducing TCO:Technological (The equipment factor)
• Select the right equipment/tools (Hybrid, CNG, Electric, etc.)• Automate tasks • Fine-tune shifting programs• Improve integration/reduce loses
Process Change (Institutional and human factors)• Improve driver efficiency• Improve maintenance practices (predictive, preventive vs reactive) • Reduce troubleshooting time• Improve decision making process (based on real-time and statistical actual information)• Train, coach, motivate staff• Incentive programs

Connect
Is your data an asset or a liability?

Connect
Is your data an asset or a liability?
Liabilities:- Cost
• Collect• Protect• Process• Back-up• Support• etc.
- Knowledge “You are liable for what you know”
Benefits:- Data is only as useful as the changes it produces- Information enables
• Better decision making process• Training and coaching opportunities• Avoiding mistakes (First time quality)• Planning• Going from reactive to proactive• etc.

Connect
Making data benefits outweigh liabilities?
- Identify your KPIs and make them part of your teams’ DNA.- Get the information to the right person at the right time.- Ensure people has access to the information and knows what it means and how to use it.- Automatic reports are easy to get but typically hard to use.- Train an couch your people on a regular basis. - Create sense of ownership for results (accountability).
- Reduce cost of infrastructure• Consider hosted services• Pay-as-you-go• Comprehensive support contracts
- Only collect data that you need and that you are ready to act upon.- Adjust your data collection strategies dynamically as your needs change.- Let your current “pains” dictate you data collection and not the other way around.

Connect
Time is finite. So, let’s narrow down our talk…
Bus Health
Operator Performance
Bus performance

Connect
Shall we or shall we not monitor our drivers?

Connect
You entrust your drivers with:
Delivering the service to the riders (on-time performance).
Representing the TA in front of the public (courtesy).
Safety of the passengers and the rest of the public, including his or her own.
The rider’s experience (smooth or rough rides).
Up to 25% of the total cost of ownership of the vehicles.
Etc.
Connect
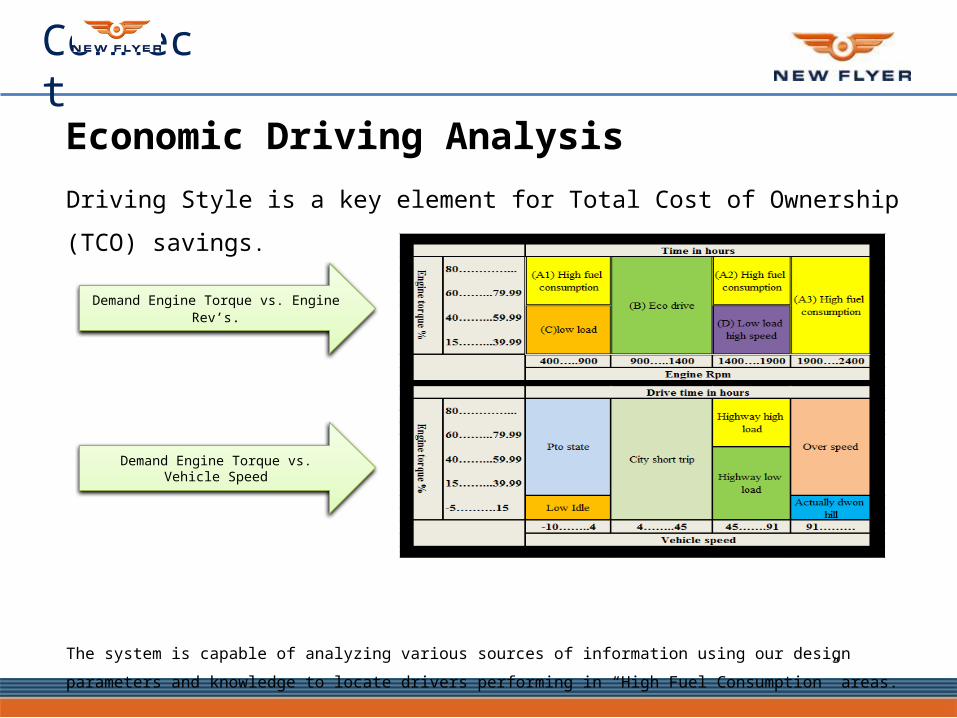
Economic Driving Analysis
Driving Style is a key element for Total Cost of Ownership (TCO) savings.
The system is capable of analyzing various sources of information using our design parameters and knowledge to
locate drivers performing in “High Fuel Consumption” areas.
Demand Engine Torque vs. Engine Rev’s.
Demand Engine Torque vs. Vehicle Speed

Connect
Driver Performance Monitoring
• Development opportunity for drivers• Improved communication between drivers, supervisors and planners• Back-up information in case of customer claims• Better understanding of routes and their impact on driving habits• Driver performance measurement enables driver incentive programs • Factual data about road events
Improved Driver Performance
• Reduced fuel usage: reduction of GHG emissions, dependency on non-renewable resources• Reduced wear and tear of vehicles: less maintenance required• Less likelihood of accidents and customer claims• Less stressful workday

Connect
Acceleration
Turn right
Turn left
Brakes
G-Sensor (accelerometer)
Severe Maneuver Detection

ConnectC
AN
BU
S
PA
RA
METER
SVEHICLE DATA BUS
ENGINE ECU
GEARBOX ECU
SHIFT SELECTOR
ABS/EBS RETARDER
RPM
Dri
ver
Dem
an
d T
orq
ue
Vehic
le S
peed
Drive Started WithHigh Acceleration
• RPM < 1000 • Vehicle Speed < 5• Torque Convertor Slip > 30%• Driver Demand Torque > 80%
Torq
ue C
on
vert
or
Slip
combine multiple conditions for each
event
MUX

Connect
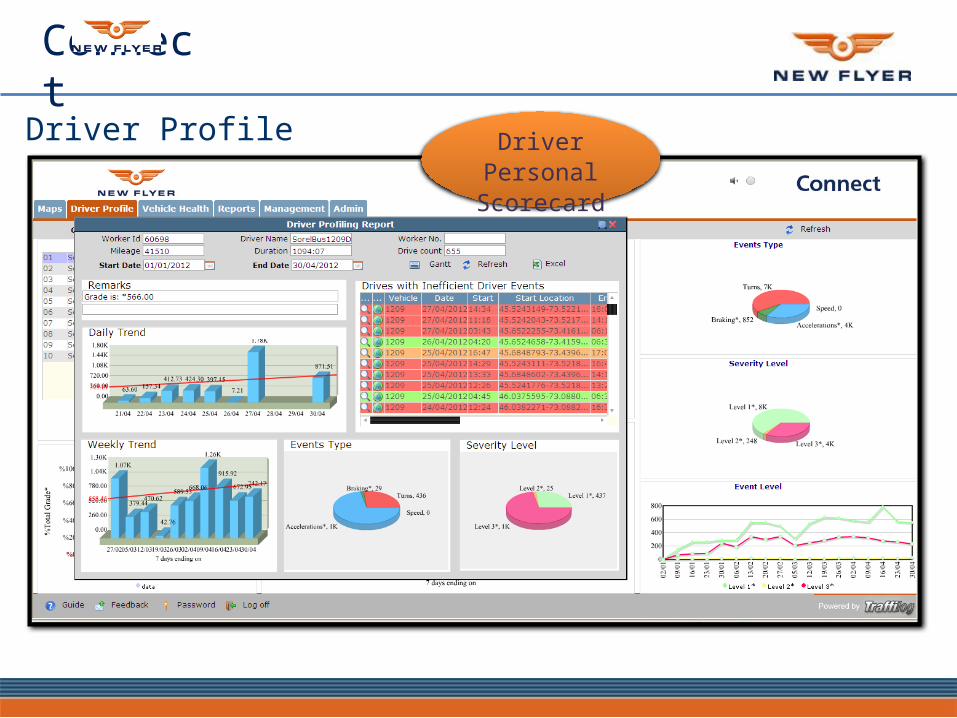
Driver ProfileDriver Monitoring
Connect
DriverPersonal Scorecard
Driver Profile

Connect
Event Location FromMetrics To Details

Connect
Drivers Report

Connect
Drivers Gantt

Connect
Driver ManeuverAwareness System
Real TimeDriver Training
Excessive aggression level
High aggression level
Medium aggression level
Calm driving
Activation button(for immediate feedback)

Connect
If we do it with drivers, why would we not do it with all the vehicles?

Connect
Bus Health And Performance:
Real-time (Reacting to the inevitable)
• Location awareness• Dial the bus • Access from a vehicle• Read diagnostic codes in real-time• Review recent history leading to event• Get real-time alerts for any event
Analysis and reports (Understanding and preventing the evitable)
• Understanding distribution of problems in the fleet.• Detecting vehicles getting out of the trend. • Reporting and compliance requirements• Tracking/Qualifying improvements and campaigns• Manage by objectives• Preventive vs Reactive Maintenance and Predictive vs Preventive Maintenance.

Connect
4 P’s - Maintenance
Predict Proactive
Prevent Prolong
Intervene Priorto Failure
Connect
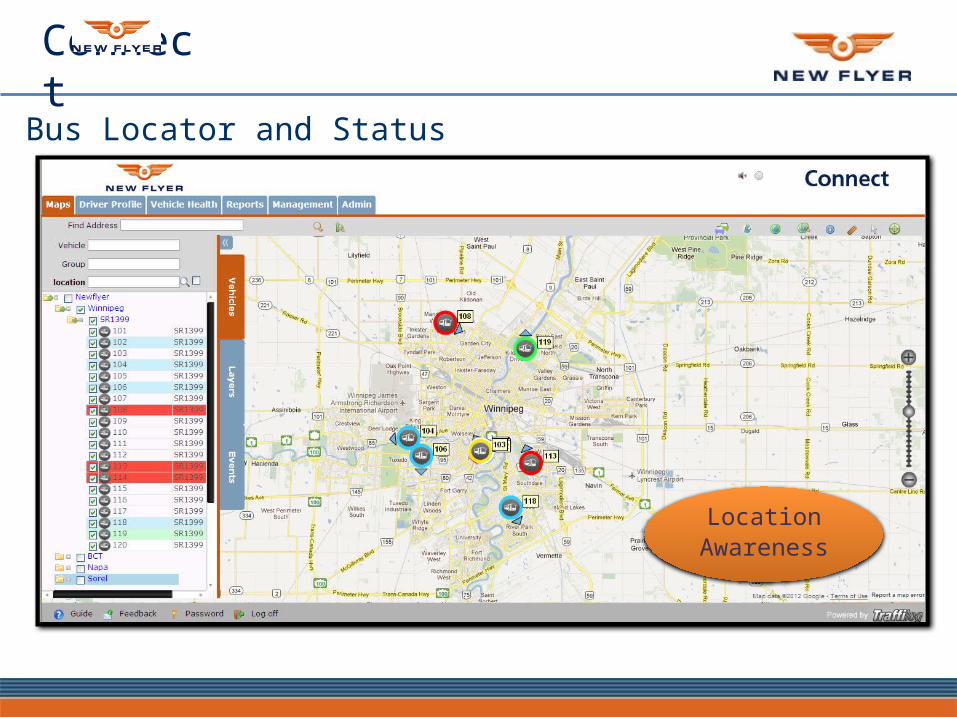
Bus Locator and Status
LocationAwareness

Connect
Events Management
Real Time Data

Connect
Road Call Assistance Dashboard
Critical Alarmsand Notifications

ConnectC
AN
BU
S
PA
RA
METER
SVEHICLE DATA BUS
ENGINE ECU
GEARBOX ECU
SHIFT SELECTOR
ABS/EBS RETARDER
RPM
Dri
ver
Dem
an
d T
orq
ue
Vehic
le S
peed
Drive Started WithHigh Acceleration
• RPM < 1000 • Vehicle Speed < 5• Torque Convertor Slip > 30%• Driver Demand Torque > 80%
Torq
ue C
on
vert
or
Slip
combine multiple conditions for each
event
MUX

Connect
Bus Performance – Interactive Dashboards
ProactiveMaintenance

Connect
HVAC Dashboard

Connect
Driving-Idling Analysis

Connect
Currently in Development
Battery Voltage Monitoring
Doors Open/Close Times
Air Compressor Wear/Failure and System Leakage

Connect
Trip reports, Fuel graphs,
Exception reports, Driver and
bus Gantt Charts (colored trips),
Fault codes, MTBF & MDBF and
much more...
Reports can be interactive or sent by email
automatically. They can also be exported to
Excel.
Trip Summary
Fuel Savings
Connect
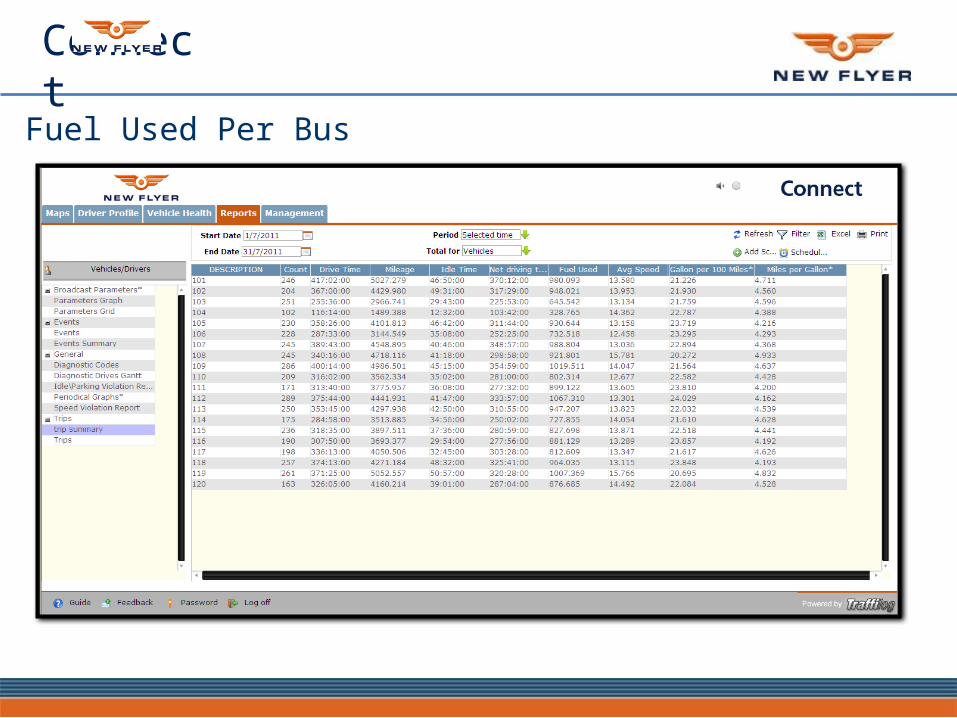
Fuel Used Per Bus

Connect
MTBF and MTBD
Connect
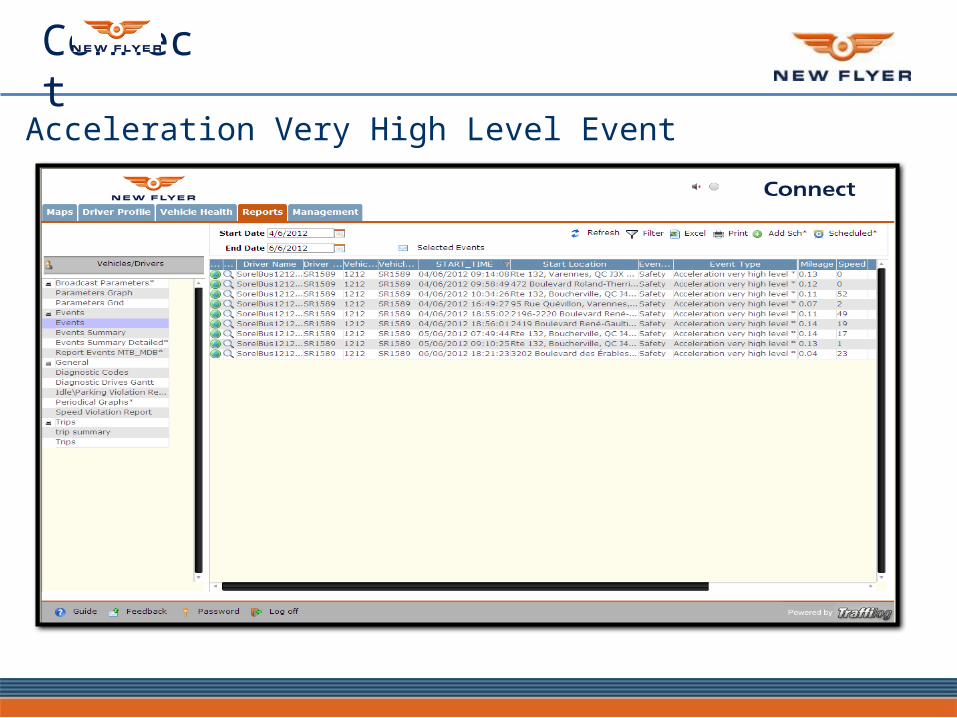
Acceleration Very High Level Event

Connect
New Flyer Connect is not a technology product; it’s a service, a means for us to stay close to you and help you out. I commit myself and my Department to making our service a key tool for your job; A tool to help you save time and become more effective and efficient. Stay in touch.
s

Connect
The Cornerstone To Improving Life Cycle Costs.Thank you.