conjunctive use of water in the central valley: past
TRANSCRIPT
Conjunctive Use of Water in the Central Valley:
Past, Present, and Future
Claudia FauntApril 19, 2016
http://ca.water.usgs.gov/projects/central-valley/

► 52,000 square kilometers► Using about 1% of U.S.
farmland, California’s Central Valley -Produces more than 250 different crops -Supplies 7% of the U.S. agricultural output (by value) — 1/4 of the Nation’s food, including about half of the Nation’s fruits, nuts, and vegetables
► Approximately 20% of the Nation’s groundwater is pumped from the Central Valley aquifer system – currently about 15%
Central Valley Facts:
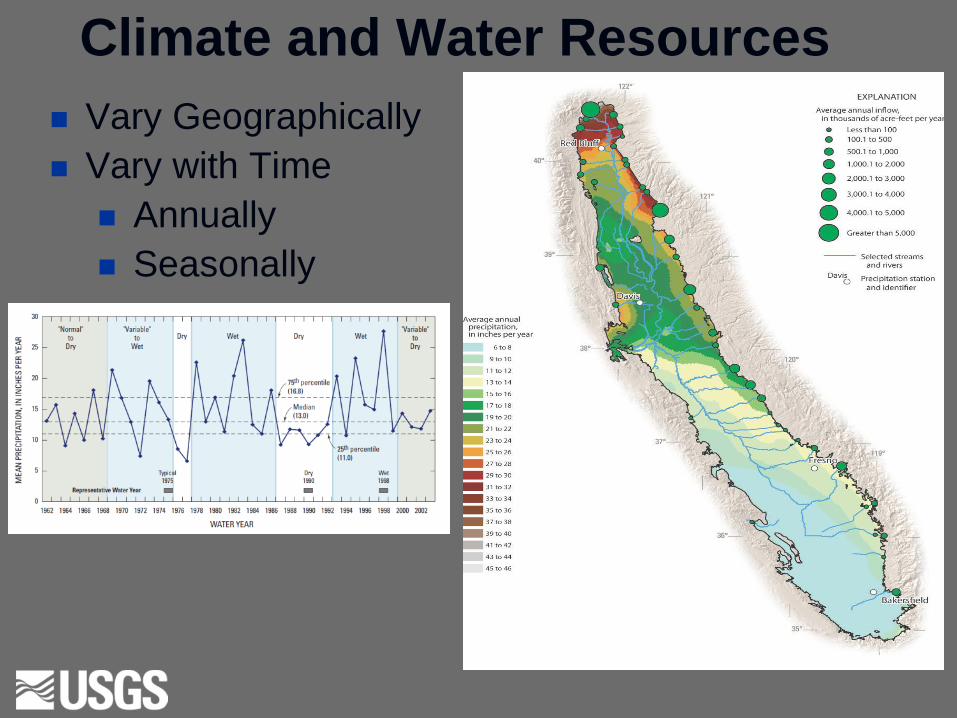
Climate and Water Resources Vary Geographically Vary with Time
Annually Seasonally

DroughtMany ways to look at
Amount of water stored California ReservoirsSnow Water Equivalent and Temperatures
(from CNAP)
The Annual California Runoff graphfrom Water Watch shows that the last four water years (2012-2015) have been the lowest on record statewide- Varies north to south

Central Valley Water UsePre-development Natural system
Extensive wetlands
Development began in 1800s 1914 water act addressed
surface water Until this year, groundwater not
regulated (local responsibility):“legally landowner can pump
ground water as long as it is put to a reasonable and beneficial use”
(except adjudicated basins)
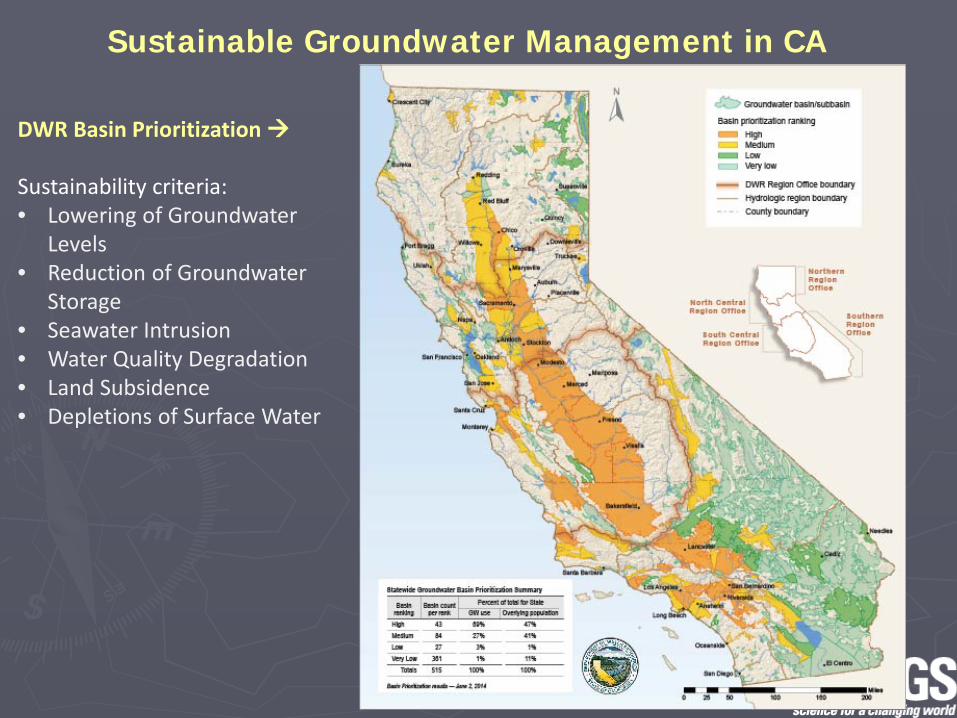
Sustainable Groundwater Management in CA
DWR Basin Prioritization
Sustainability criteria:• Lowering of Groundwater
Levels• Reduction of Groundwater
Storage• Seawater Intrusion• Water Quality Degradation• Land Subsidence• Depletions of Surface Water

System Conceptualization: DEVELOPMENT AND IRRIGATED AGRICUTURE
Major effects on volume and distribution of groundwater recharge and discharge
PRE-DEVELOPMENT Natural system
DEVELOPMENT Began in about 1850 Most hydrologic data aftermajor hydrologic changes
POST-DEVELOPMENT Engineered system –
Canal network Reservoirs control inflows
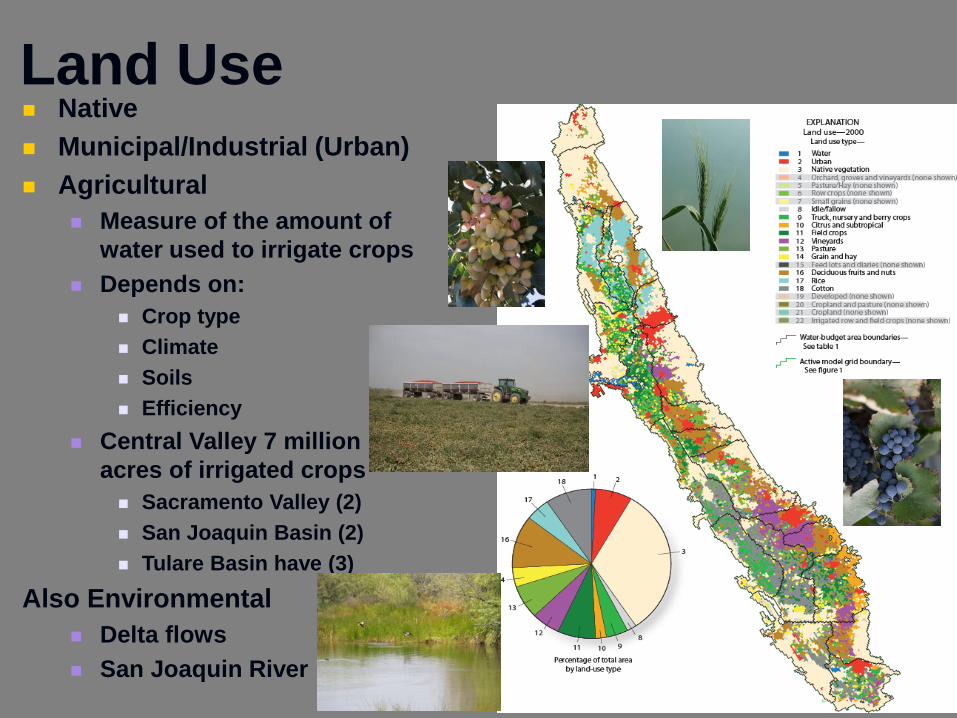
Land Use Native Municipal/Industrial (Urban) Agricultural
Measure of the amount of water used to irrigate crops
Depends on: Crop type Climate Soils Efficiency
Central Valley 7 million acres of irrigated crops Sacramento Valley (2) San Joaquin Basin (2) Tulare Basin have (3)
Also Environmental Delta flows San Joaquin River

Landuse changes 19201945
1960
Area of Native Vegetation in Central Valley 1930 - deep well turbine pump
1930s/40s - mechanical harvestingand refrigerated railroad transportation
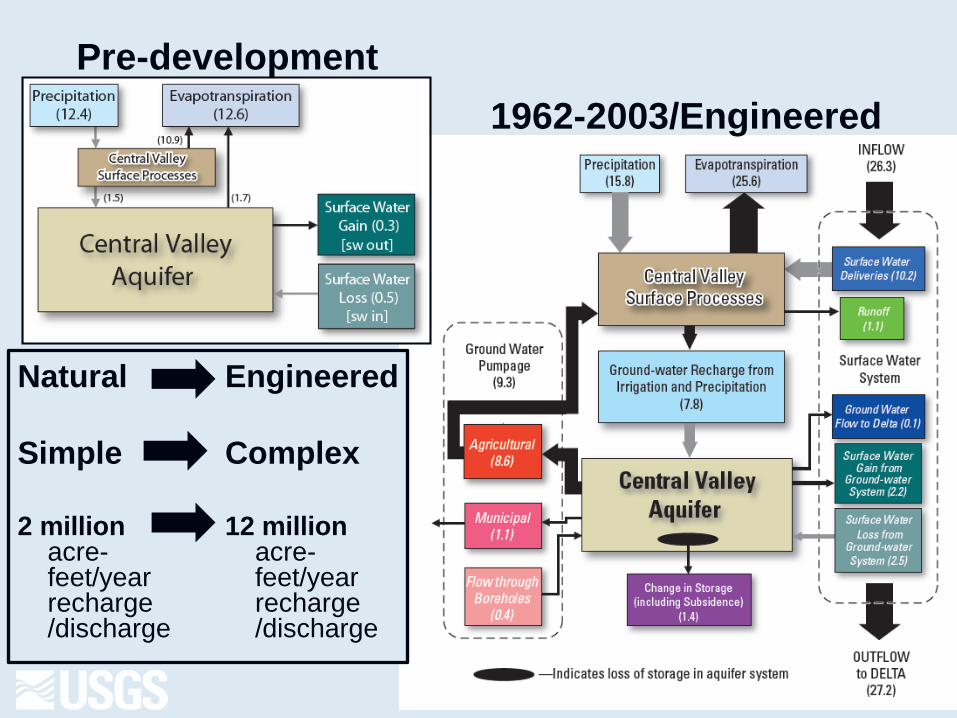
1962-2003/Engineered
Engineered
Complex
12 millionacre-feet/year recharge /discharge
Pre-development
Natural
Simple
2 million acre-feet/year recharge /discharge
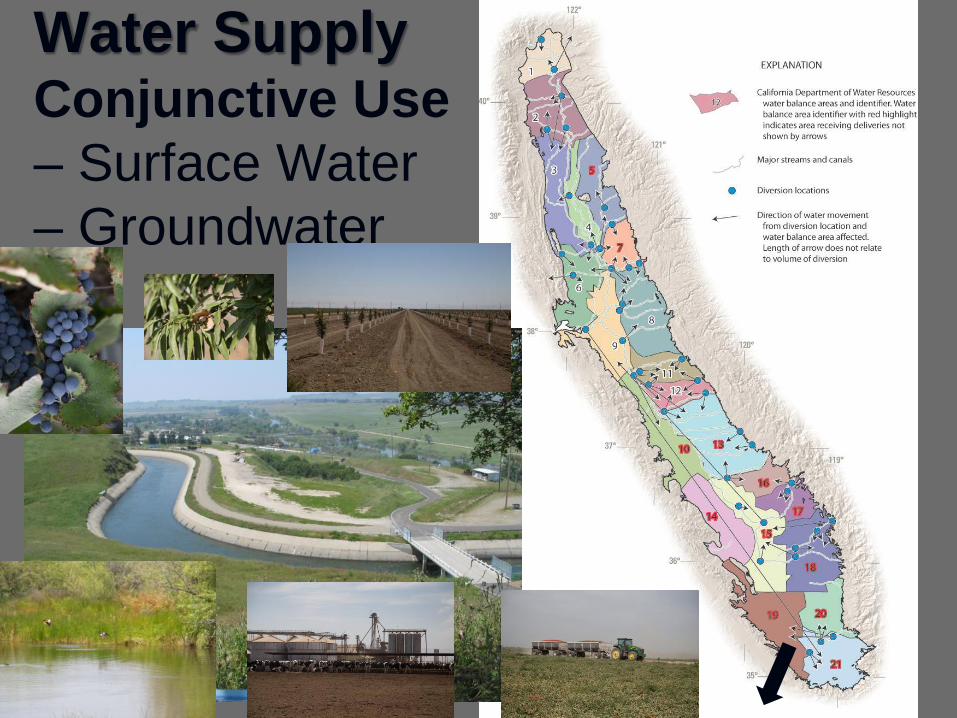
Water SupplyConjunctive Use – Surface Water– Groundwater
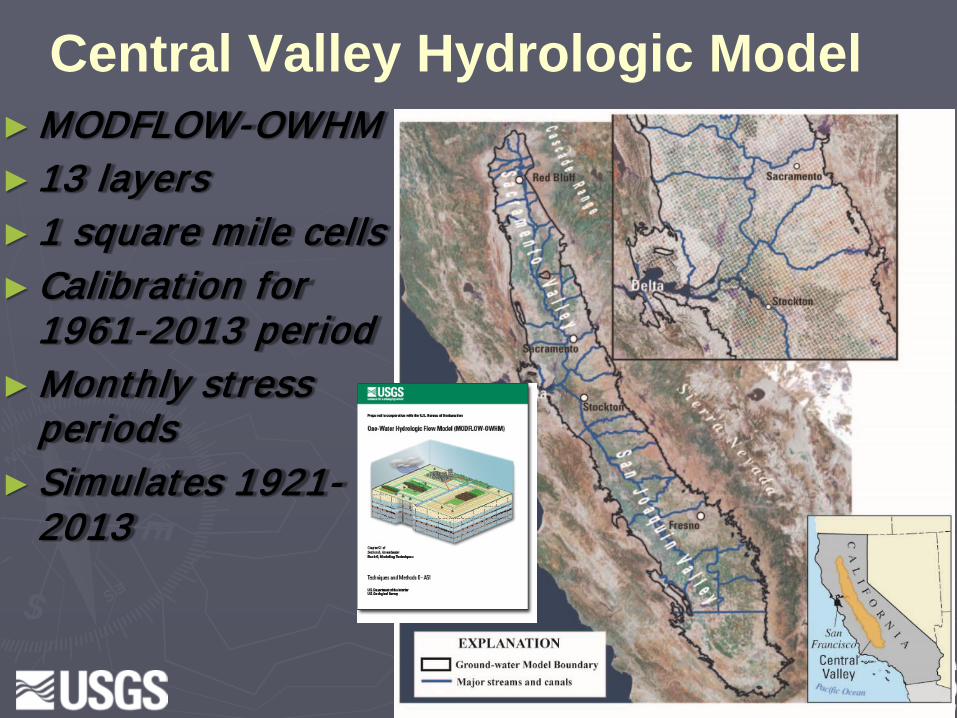
►MODFLOW-OWHM► 13 layers► 1 square mile cells►Calibration for
1961-2013 period►Monthly stress
periods► Simulates 1921-
2013
Central Valley Hydrologic Model

Climate Change/Variability•Early in growing season, dominantly surface water deliveries•Later in growing season, surface-water shortfall made up by groundwater pumpage•Drought ’77 (high pumping all growing season)•Wet Period ‘83 (lower delivery, mostly surface water)
proportions of surface water and groundwater used for irrigation vary yearly and seasonally in response to climate
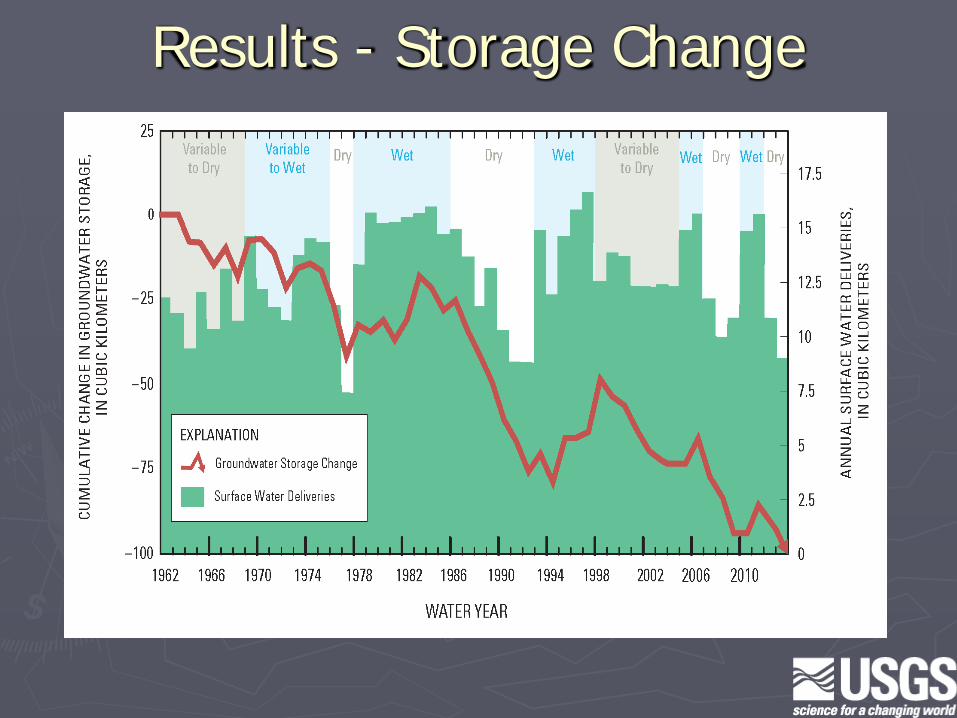
Results - Storage Change

The recent drought, land-use changes, and restrictions on surface-water flows have resulted in extensive pumping, large groundwater-level declines, widespread land subsidence, and salinity issues
Effects on Central Valley:
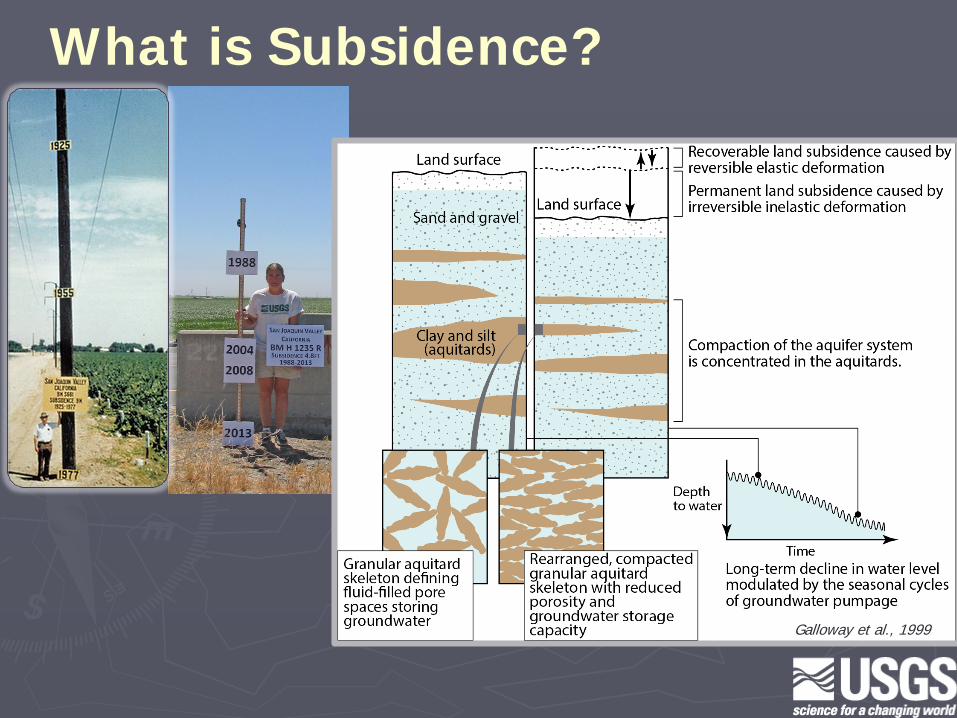
What is Subsidence?
Galloway et al., 1999

Subsidence effects

Campaign GPS
Bench Mark Surveys
Spirit Leveling
Airborne LiDAR
Tripod LiDAR
Continuous GPS
InSAR/PSInSAR
Extensometer
How is subsidence measured?

GPS Surveys Continuous GPS
►27 sites on valley floor
InSAR
Recent Subsidence

Recent SubsidenceHistorical Subsidence
Preliminary and subject to revision

Texture Analysis:3D model► Based on 10,079
drillers logs► Interpolated to one-
mile spatial grid at 50 foot depth intervals
► Defines sediment characteristics of the aquifer

Subsidence and Geology

Most Compaction Occurred Below the Corcoran Clay
Water level in shallow well CGPS P303
Los Banos
Mendota

►Renewed subsidence concern during 2007-09 drought, and the recent drought Reduced surface water importation More reliance on the groundwater resources
CGPS data from UNAVCO; water level data from DWR, USGS, and Luhdorff and Scalmanini Consulting Engineers
Previous lowest level (September, 1992)
Subsidence (CGPS P304)Drought Drought
Groundwater Level
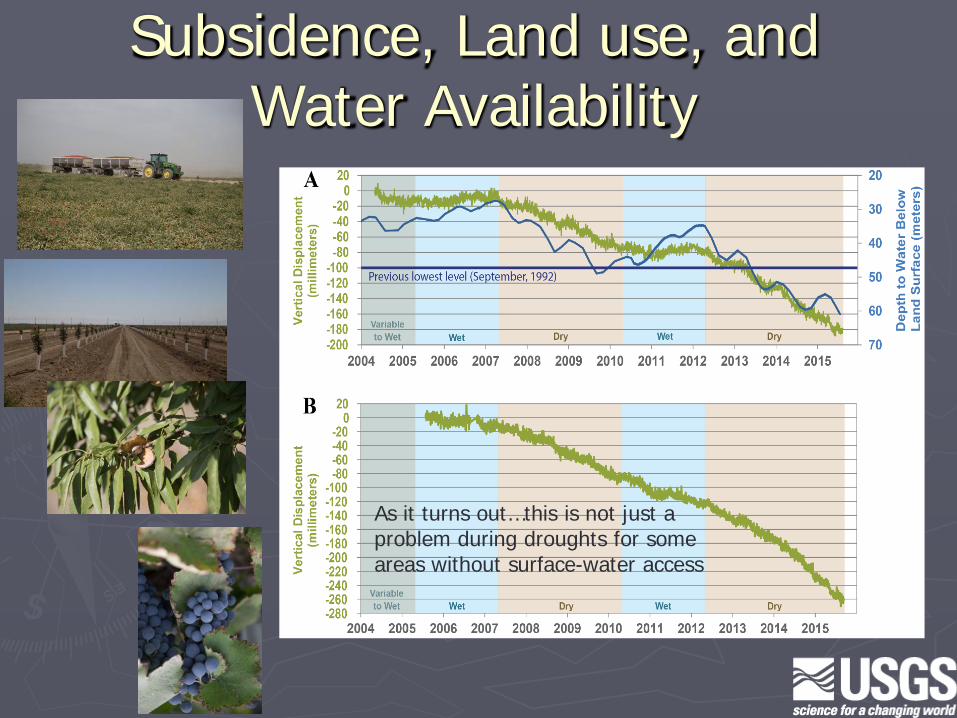
Subsidence, Land use, and Water Availability
Subsidence, Land use, and Water Availability
As it turns out…this is not just a problem during droughts for some areas without surface-water access

What Can Be Done About It?►Develop tools and analyses such
as these to point out challenges Integrated Hydrologic models (CVHM)
► Focus on maintaining groundwater levels above the critical threshold Reduction of groundwater withdrawal
►Decreasing groundwater demand►Limiting/redistributing groundwater use►Increasing supplemental water supply
Enhanced groundwater recharge►Artificial recharge: direct well injection or
surface infiltration►Natural recharge: source protection

Managed Aquifer Recharge:

PAST/PRESENT/FUTURE:Conjunctive Use: Joint use and management of surface-water and groundwater resources to maximize reliable supply and minimize damage to the quantity or quality of the resource.Sustainability: Development and use of water in a manner that can be maintained for an indefinite time without causing unacceptable environmental, economic, or social consequences.Adaptation: Depends on changes in supply and/or demand, alignment with climate variability/change, and changes in water governance/policies
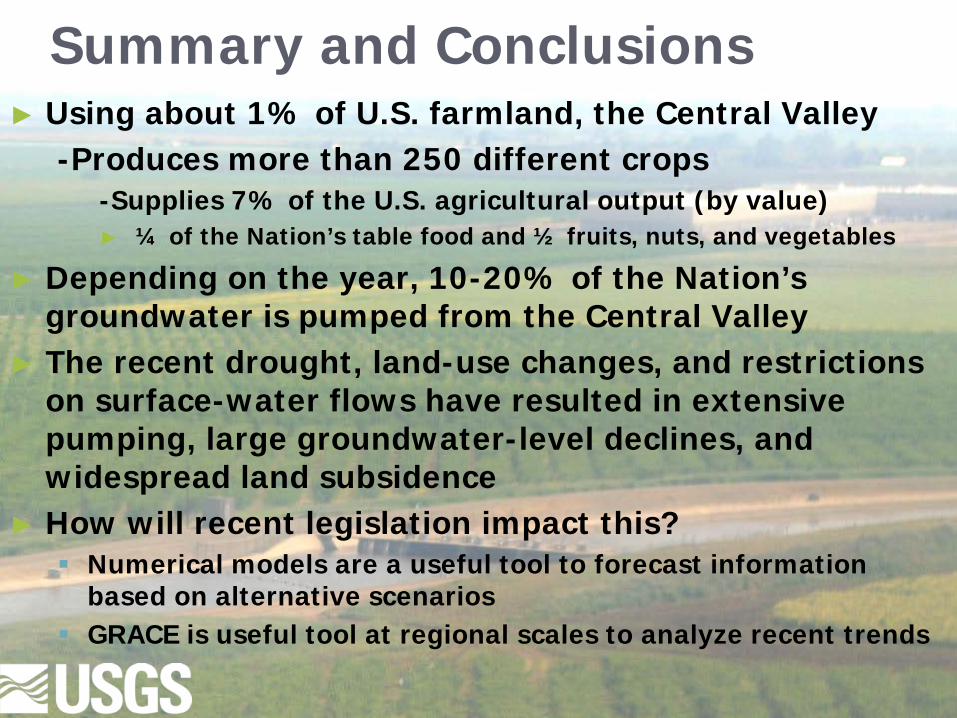
► Using about 1% of U.S. farmland, the Central Valley -Produces more than 250 different crops
-Supplies 7% of the U.S. agricultural output (by value) ► ¼ of the Nation’s table food and ½ fruits, nuts, and vegetables
► Depending on the year, 10-20% of the Nation’s groundwater is pumped from the Central Valley
► The recent drought, land-use changes, and restrictions on surface-water flows have resulted in extensive pumping, large groundwater-level declines, and widespread land subsidence
► How will recent legislation impact this? Numerical models are a useful tool to forecast information
based on alternative scenarios GRACE is useful tool at regional scales to analyze recent trends
Summary and Conclusions

Thanks!
http://ca.water.usgs.gov/projects/central-valley/