congressional agenda control and the decline of...
TRANSCRIPT

Congressional Agenda Control and the Decline of
Bipartisan Cooperation
Laurel Harbridge
Northwestern University
College Fellow, Department of Political Science
College Fellow, Institute for Policy Research
Evidence shows that polarization in Congress has increased substantially since the 1970s
while polarization in the public has increased much less, if at all. These two patterns of
polarization suggest that responsiveness by members to their constituents has declined.
By breaking apart congressional behavior, however, this paper suggests that this
presumption is misleading. Looking at roll call votes and bill cosponsorship coalitions,
this paper suggests that although partisan behavior has increased substantially in roll call
votes, the same is not true for bill cosponsorship coalitions. In turn, this suggests that
while responsiveness has declined when considering roll call voting, responsiveness has
increased when considering cosponsorship coalitions. These divergent patterns can be
reconciled by taking into consideration congressional agenda control.

1
[The] resulting polarization is worrisome. By reducing the space for bipartisanship, it
can condemn Congress to gridlock. By driving elected officials to the fringe while
citizens inhabit the center, it can alienate citizens from their government (Washington
Post "A Polarized Nation?" 2004).
From Congress to the airwaves to the bestseller lists, American politics appears to be
hardening into uncompromising camps, increasingly identified with the two parties… As
it becomes more difficult to reach across the party line, campaigns are devoting more
energy to firing up their hard-core supporters. For voters in the middle, this election may
aggregate their feeling that politics no longer speaks to them, that it has become a
dialogue of the deaf, a rant of uncompromising extremes (Van Drehle 2004).
There is a presumption in the literature – both by journalists and academics – that party
polarization has contributed to declining responsiveness by members of Congress to the public.
Evidence shows that polarization in Congress has increased substantially since the 1970s while
polarization in the public has increased much less, if at all. It seems that the logical next step is
the assumption that responsiveness has declined. By breaking apart congressional behavior,
however, this paper suggests that this presumption is misleading. Looking at roll call votes as
well as bill cosponsorship coalitions, this paper suggests that although partisan behavior has
increased substantially in roll call votes, the same is not true for bill cosponsorship coalitions. In
turn, this suggests that while responsiveness has declined when considering roll call voting,
responsiveness has increased when considering cosponsorship coalitions. These divergent
patterns can be reconciled by taking into consideration congressional agenda control.
Although bipartisan cooperation in voting has significantly declined, a pattern that will be
documented in the following section, bipartisan cooperation in bill cosponsorship coalitions has
not seen a similar sized decline. Thus, there appears to be an equilibrium level of bipartisan
cooperation in Congress. However, the form that bipartisan cooperation has taken has changed
over time as a result of changes in congressional agenda control. When bipartisan legislation
became decreasingly likely to face roll call votes in the 1980s and 1990s, bipartisan cooperation

2
on bill cosponsorship coalitions increased. I argue that this pattern reflects pressures on
members from more competitive districts to show they are moderate and willing to work across
the aisle, and may suggest that members from opposing parties have more common ground than
is often acknowledged.
By bringing an explicit focus to the congressional roll call agenda, this paper examines
how party control over the congressional agenda, and specifically the temporal changes in the
selection of bills to receive roll call votes, affects the degree of bipartisan cooperation in
Congress. Where we look for bipartisanship, and how we measure legislative behavior and
preferences determines whether or not we see Congress as becoming increasingly polarized and
partisan, and ultimately, whether we see members as out of step with their constituents.
These results have a number of implications for understanding polarization in American
politics, agenda control in congressional policy-making, and highlight the importance of
carefully considering the potential biases in roll call data. An exclusive focus on roll call votes
to measure bipartisanship or party polarization may misleading and can either under or over-
estimate partisanship, depending on how the congressional agenda is structured. Thus, these
results suggest that claims of party polarization (at least in terms of the underlying ideologies of
members) are over-stated. While it is clear that voting patterns have changed since the 1970s,
consideration of the agenda and the selection of bills to face roll call votes must be taken into
account before attributing changes to the underlying ideologies of members. Certainly the
ideologies of members matter – both in cosponsorship and voting – but attention must also be
given to how the parties structure the agenda. Literature on political parties has often debated
when and how parties are influential, particularly in weak party systems such as the United
States (Cox and McCubbins 2005; Krehbiel 1993, 2006). The findings in this paper are similar

3
to the findings by Cox and McCubbins, suggesting that party influence occurs through
congressional agenda control. Rather than focusing on the ultimate degree of party unity on
votes, however, this paper focuses on the changing likelihood over time that bipartisan bills
receive roll call votes. From this perspective, much of the party polarization observed on roll
call votes is an artifact of congressional agenda control and may not necessarily reflect the
underlying preferences or ideologies of individual members. Similar to Fiorina‘s (2004) finding
of similarities in public opinion and values between citizens in red and blue states, my findings
suggest that this common ground may extend to members of Congress to a greater degree than is
generally recognized. When we assess legislative behavior absent agenda control, members of
Congress continue to engage in bipartisanship. Members of Congress have become increasingly
representative of their districts when using bill cosponsorship coalitions, despite the fact that
representation has declined when using roll call votes.
Methodologically, this work highlights some of the problems in the standard results of
roll call data to assess the preferences of individual members as well as trends in party
polarization. By focusing exclusively on this stage of the legislative process, one that is strongly
determined by the choice of which bills face roll call votes, these measures may overstate the
differences of rank-and-file party members.
This paper proceeds as follows. Section 2 sets out the groundwork for the argument that
party polarization has increased, bipartisan cooperation has declined, and thus, that electoral
responsiveness has declined. Section 3 breaks apart legislative behavior from the typical reliance
on voting patterns, considering members‘ bill cosponsorship coalitions. Section 4 reconciles the
divergent patterns of bipartisan cooperation in voting and bill cosponsorship by considering the
strategic use of agenda control. Section 5 concludes.

4
2. Party Polarization and the Decline of Electoral Responsiveness
Half a century ago, political scientists yearned for distinctive parties (APSA 1950) but the
resurgence of polarized parties since the 1970s has left few satisfied. Though there are some that
continue to defend partisanship and polarization (e.g., Muirhead 2006; Rosenblum 2008), the
more common refrain is that party polarization has come at the expense of an idealized era of
bipartisanship (e.g. Eilperin 2006). Combined with evidence that the public has not polarized
(Fiorina et al. 2004; DiMaggio et al. 1996), this body of research suggests that there is a
disconnect between the mass public and the government (Fiorina and Levendusky 2006).
Ultimately, this suggests that collective or aggregate electoral responsiveness has declined. This
section summarizes the prevailing argument, drawing on the voting patterns of members. 1
Section 2.1 Increasing Polarization and Declining Bipartisanship
The standard measures of polarization as well as legislative behavior come from the
analysis of roll call votes in Congress. This section considers various measures of polarization
and bipartisan cooperation, all of which rely on roll call votes themselves or the subsequent
ideology estimates derived from votes.
Let us begin with trends in party polarization. Regardless of the measure that is used,
party polarization has significantly increased since the 1970s. Consider one common measure,
the difference in party means, using either the first dimension of DW-NOMINATE or the
Americans for Democratic Action (ADA) scores of roll call votes. While the former uses all
non-unanimous votes and the latter uses only a small sample of key votes, the overtime patterns
1 The analysis focuses on the period from 1973 to 2004. This choice was driven by the visibility of voting decisions
after the House reforms of the 1970s (Rohde 1991) and subsequent tracking of member‘s voting patterns by interest
groups, and the use of cosponsorship in the House being restricted prior to the late-1960s. The House of
Representatives was chosen because it is where party influence is often thought to be the greatest and where
bipartisan cooperation is thought to be lowest (in comparison with the Senate, where bipartisanship is often thought
to occur to a greater degree).

5
are the same. Polarization has increased nearly monotonically since the 1970s. Figure 1 presents
the trend in polarization since 1973 using ADA scores for the House of Representatives.
A second measure of partisanship considers the incidence of party unity votes in
Congress. Congressional Quarterly (CQ) defines party unity votes as roll call ―votes that split the
parties, a majority of voting Democrats opposing a majority of voting Republicans‖ ("CQ Fact
Sheet Bipartisan Voting" 1970, 1139). Since the discussion of cosponsorship coalitions will
focus on the frequency of bipartisan behavior, it is useful to consider the flip side of party unity
votes, or what CQ classifies as bipartisan votes. Bipartisan votes are ―roll-call votes on which a
majority of voting Democrats and a majority of voting Republicans agreed‖ ("CQ Fact Sheet
Bipartisan Voting" 1963, 735). Since bills on which either party divides evenly are excluded, the
percentage of bills that are bipartisan by CQ‘s measure is the complement of Party Unity roll
calls (100 - % of Party Unity Votes). Since the CQ measure classifies all votes (except those that
are omitted that exactly split a party) as either party unity or bipartisan votes, partisan and
bipartisan are, by assumption, definitionally opposite. The CQ Bipartisan Measure (see Figure 2)
for the House of Representatives shows a fairly steady decline in bipartisanship from the 1973 to
1995 with some recovery of bipartisanship beginning in the 105th
Congress (post-1996).2
[Figure 2 about here]
Since the Congressional Quarterly measure of bipartisanship looks at what majorities of
2 A similar pattern is found when looking just at final passage votes and omitting procedural issues. A number of
scholars have noted that procedural votes have become increasingly partisan, either due to party pressure or good
‗teamsmanship‘ among members (Theriault 2006; Lee 2009). To check whether the relationship between
polarization and bipartisanship holds when procedural votes are excluded, I draw on data compiled by David Rohde
(2004) for House roll call voting. Looking only at final passage votes and only those on House bills (rather than
resolutions or amendments), I find that the percentage of roll call votes that are bipartisan (using the CQ definition)
declined from approximately 80 percent in 1973 to 40 percent by 1994. Although there was an increase in
bipartisanship under the Republicans, the overall trend of the series has been a strong decline in bipartisanship
consistent with the aggregate roll call results. Plots of the trends using final passage votes are available in the
appendix.
6
the two parties are doing, it may miss additional and important variation. In particular, the CQ
measure misses the extent of skew within voting (i.e., is it 90% of one party against 90% of
another party or 52% of one party against 48% of another party). To parse out this element in the
analysis of bipartisanship, I calculate a ‗Difference in Party Support Score‘ for each vote,
focusing on the Yea votes.3 For each vote, I calculate the percent of voting Democrats voting
Yea and subtract the percent of voting Republicans voting Yea. The resulting score ranges from
-100 to 100, where -100 indicates a vote on which no Democrats voted Yea and all of the
Republicans voted Yea. The midpoint of 0 indicates bills where the same percentage of
Democrats and Republicans voted Yea. Thus, the ends of scale reflect the greatest partisanship
and the middle represents the greatest bipartisanship.
Omitting unanimous and near unanimous (90% or more in favor) votes, I first plot the
density of the scale by Congress for Yea votes when all House roll calls are included (Figure 3).4
The trend over time has been an increase in density at the two poles of the distribution at the
expense of the middle, or of the most bipartisan bills. Restricting the analysis to final passage
votes on House bills also shows a decline in bipartisanship (see Appendix Figure 2). In contrast
to the analysis of all votes, however, the final passage votes on the Yea side are skewed toward
the majority party (the Democrats prior to the 104th
Congress and the Republicans from the 104th
forward). This skew is evidence of agenda control; the majority party is able to control the issues
that came to votes in a way that allowed them to be the dominant group of proponents. In sum,
bipartisan cooperation on roll call voting shows significant declines across the last three decades,
3 The analysis focuses on Yea votes since they are most similar to cosponsorship coalitions in indicating support for
a piece of legislation. 4 When unanimous and near unanimous votes are included, the vast majority of legislation is bipartisan. This further
suggests that roll call vote analyses, which tend to omit unanimous and near unanimous votes because they do not
provide additional information for distinguishing between the preferences of various members, are biased against
finding bipartisan cooperation.

7
particularly from the 1970s through the mid-1990s. This decline in bipartisanship is consistent
with the rise in elite polarization.
[Figure 2 about here]
Section 2.2 Polarization in the American Public?
Despite the abundance of evidence that Congress has become more polarized and
partisan, there is significantly more skepticism that the public has grown as polarized. For
instance, DiMaggio et al. (1996) found little evidence that the American publics‘ social attitudes
have become more polarized over the previous two decades, with the exception being attitudes
on abortion. Similarly, Fiorina (2004) found little evidence of growing disparities between the
opinions of red and blue state voters. While political elites – including party activists – have
polarized, the general electorate has not shifted its positions. The electorate only appears
polarized because it is choosing between the alternatives set by the (polarized) political elite
(Fiorina et al. 2004).
Section 2.3 Polarization and Declining Responsiveness
Although political scientists often argue that concerns about reelection drive members to
be representative of and responsive to their constituents, the dual patterns of increased elite
polarization and little mass public polarization suggest that members are achieving reelection
without being representative of their constituents. This breakdown in representation can be seen
both in the relationship between legislators‘ voting scores and summary measures of district
preferences, as well as from survey responses regarding cooperation and bipartisanship.
Scholars have long argued that reelection is a driving, if not the driving, force behind the
behavior of members of Congress (Mayhew 1974; Fenno 1978). Normatively, the ‗electoral
connection‘ suggests that both sides win; members of Congress get what they want (to stay in

8
office), and the public gets what they want (representative and responsive members). Taken to
the extreme, Anthony Downs (1957) argued that in a two-party system, the candidates should
converge completely to the median voter in the district. The Downsian framework also predicts
centrism and responsiveness in members‘ responses to the preferences of voters (Achen 1978).
A large body of work has grown around the question of representation and whether
members converge to the position of the district median – what would be perfect representation
(e.g., Ansolabehere et al. 2001; Burden 2004). Despite findings that show that candidates rarely
fully converge in their positions, scholars have maintained that the median voter is important and
that members can be electorally punished if they stray too far from the districts‘ preferences
(Canes-Wrone et al. 2002). Recent work has focused more specifically on the electoral impact of
party cohesion, finding that members are punished electorally for being too partisan for the
district and having high party unity support scores (Carson et al. 2010).
Additional evidence that the public wants members who are less polarized, and are more
bipartisan, comes from a recent Pew survey. A May, 2010 poll found that ―a substantial
minority (42%) say they would be more likely to vote from a candidate who will make
compromises with people they disagree with; only about half as many (22%) say they would be
less likely to back a candidate willing to compromise‖ (Pew 2010).
Logically, it appears that a polarized Congress without equivalent polarization in the
public damages representation. What does the data suggest? To begin, let‘s select a measure of
district preferences, with which to judge legislative behavior in relation to. This paper draws on
the Normal Presidential Vote in the district, measured as the mean two party presidential vote in

9
the previous two elections by the party of the Representative (Canes-Wrone et al. 2002).5 For
instance, if the member is a Republican I use the mean Republican presidential vote in the last
two presidential elections and if the member is a Democrat I use the mean Democratic
presidential vote in the last two presidential elections.6 The presidential vote has been found to
be an excellent proxy of district-level partisanship, particularly since the 1990s (Levendusky et
al. 2008).
There are a number of ways to look at legislative behavior for evidence of electoral
responsiveness. In this section I draw on party unity scores. The Party Unity Support Score
calculates the percent of times that a member votes with his or her party on party unity votes
(defined when a majority of Democrats vote against a majority of Republicans). As mentioned in
previous sections, CQ classifies votes as either party unity or bipartisan. Thus, the logic of this
measure, applied to the argument that members are electorally responsive, is that members in
competitive districts should have lower party unity support scores than members in safe
districts.7 The drawback of this score is that it does not capture the relative frequency of party
unity votes in general.
5 I use the normal presidential vote rather than the member‘s own past vote share because of concerns with foresight
on the part of the legislator as well as incumbency advantage. If a member foresees the importance of appearing as
bipartisan or partisan, his vote share is likely to reflect that. In effect, assuming any foresight by members means
that their vote share, even at time t-1, is endogenous to their behavior. An additional problem is the personal vote for
incumbents. That is, a large margin of victory may imply a partisan district or it may imply that a member has
created a strong personal brand, potentially because of their responsiveness to the district. 6 In all analyses in this paper, all districts (where data is available) are included. This includes districts that were
redistricted. Ideally, instances where a district boundary was redrawn would be omitted, and the normal presidential
vote in subsequent years would be omitted to drop the presidential year in the first year after redistricting. However,
the author‘s current data on redistricting only includes an indicator for whether a district is in a state that was
redistricted, meaning that removing these cases leaves minimal observations in the 93rd
(1972), 98th
(1982), 103rd
(1992), and 108th
(2002) Congresses. As a result, redistricted cases are included and are a source of measurement
error. 7 A comparison has also been made using DW-NOMINATE scores, which include all non-unanimous (or highly
lopsided) votes in the calculation of idea points. With these scores, the expectation is that members in competitive
districts should have more moderate ideal points. The correlation between the normal presidential vote in a
member‘s district and his/her NOMINATE score increases from 0.37 in the 93rd
House to 0.58 in the 103rd
House,
but has declined in magnitude since the 104th
Congress.

10
Looking at the correlation between the normal presidential vote in the district and the
party unity support score yields suggestive evidence of changes in representativeness over time
(see Table 1). Although initially showing a relatively strong correlation with the normal vote,
party unity support scores show a weakening relationship from the 97th
to 102nd
Congresses.
[Table 1 about here]
A second approach further parses out these patterns. I use a quasi-binomial model of
legislative behavior, which accounts for the likelihood that a member engages in partisan (or
bipartisan) behavior relative to the number of times they do not. ‗Successes‘ in the model are
votes with the party. The primary independent variable is the Normal Presidential Vote in the
district. I allow this effect, as well as the intercept, to vary by Congress. Finally, I include a
number of individual level covariates – member of the Majority Party, Female, Age, Tenure, and
an indicator for whether the member holds a Leadership post (Speaker, Majority or Minority
Leader, or Whip). For each of these control variables, the effects are constrained to be constant
across time. A quasi-binomial, rather than a binomial model, is used in order to allow for over-
dispersion. The model is specified as follows:
To assess the degree of responsiveness to the normal presidential vote over time I
examine the predicted probability of partisan support over the range of the normal presidential
vote for each Congress. The calculation of the predicted probability holds all variables in the
model except the Normal Presidential Vote at either their mean or median. Figure 4 presents the
predicted probability of a member voting with his party on party unity votes for selected

11
Congresses.8 The 95% confidence intervals are included in the dashed lines. Over time, we see
both an intercept shift toward greater party support as well as a decrease in the slope, with a low
in the 101st Congress.
[Figure 4 about here]
It is important to note that neither of these approaches provides a definitive benchmark of
ideal representation. Rather, both of these approaches rely on comparisons over time within the
measure, looking at either changes in the correlation or changes in the intercept and slope of the
estimated relationship. In making the argument that these changes reflect declining
representation, I am making the assumption that a higher correlation between the measures or a
lower intercept and steeper slope reflect higher levels of representation. With these caveats in
mind, both of these roll call patterns are suggestive that electoral responsive has declined.
3. Breaking Apart Legislative Behavior - Bill Cosponsorship Coalitions
Although roll call votes are the standard measure of legislative behavior, and often for
good reason, it is important to remember that roll call votes are not a random sample of
legislation. Therefore, this paper considers a second measure of legislative behavior – bill
cosponsorship coalitions – to understand patterns of partisan and bipartisan cooperation in
Congress. Of course these are not the only two forms of bipartisan cooperation that can occur in
Congress. Bipartisanship may also be observed in the processes used in Congress (i.e., the use of
closed versus open rules or the composition of conference committees), or even in the rhetoric of
members‘ speeches. Nonetheless, roll call votes and bill cosponsorship coalitions are two areas
that provide a unique opportunity to both systematically examine decisions by all members of
Congress and to examine the influence of congressional agenda control.
8 The pattern over time is consistent in the Congresses not presented here and graphs of all Congresses are available
upon request.

12
Despite the prevalence of roll call votes in Congressional literature, the bills that reach
roll call votes are not a random sample of the bills or issues that have been brought up in
Congress. Many scholars have argued that party leaders strategically put up issues for roll call
votes that divide the parties from one another but do not show divisions within their own party
(Snyder 1992; Poole 2004; Loewenberg 2008; Heller and Mershon 2008; Carrubba et al. 2008).
If roll call votes are more likely on legislation that pit the parties against one another, this has the
potential to bias analyses of roll call votes from finding high levels of bipartisanship. This is
particularly true if legislation with bipartisan support passes via voice votes rather than roll call
votes.
Second, the likelihood that legislation, and particularly bipartisan legislation, faces a roll
call vote may not be constant across time. For instance, Lynch and Madonna (2008), find that the
prevalence of voice votes relative to roll call votes on significant legislation varies both across
time and across issues. If the underlying data generation process for roll call votes is biased
against bipartisan legislation, or if the data generation process varies over time in a way that is
related to whether legislation has bipartisan support, then both the level of bipartisanship and the
relationship between polarization and bipartisanship may be misleading. For instance, if the use
of agenda control has changed over time, with bipartisan legislation being less likely to face a
roll call vote, the analysis of roll call voting may be biased toward a reduction in bipartisanship
over the same period.
Because of these concerns, I explore bill cosponsorship coalitions as a second measure of
bipartisanship in Congress. As noted by Krehbiel (1995) and Kessler and Krehbiel (1996),
cosponsorship is less likely to be subject to agenda control. Like roll call votes, however, bill
cosponsorship coalitions allow all members the opportunity to take a position and side with a

13
coalition of other members. By looking at bill cosponsorship coalitions, I am able to assess
bipartisanship absent the strategic considerations of which bills face roll call votes.
Section 3.1 Bipartisanship in Cosponsorship Coalitions
Bill sponsorship has long been understood as an effective and relatively easy way for
members of Congress to become involved in the policy process. Similarly, cosponsoring
legislation carries a number of possible benefits, both within Congress and among constituents.
As such, cosponsorship has become a frequent activity in both the House and Senate in recent
decades.
In 1967 the House passed a resolution allowing up to 25 cosponsors on a bill
(Congressional Record 1967, 10708-12). Since it was first allowed in the House, cosponsorship
has largely replaced the use of duplicate bills (Thomas and Grofman 1993), suggesting that
members view cosponsorship in much the same way as they do sponsorship because they can
make the same claims back in their constituencies. In the 95th
Congress, the House passed H.
Resolution 86, which allowed unlimited numbers of cosponsors and allowed cosponsorship even
after the bill was in committee (Thomas and Grofman 1993). Since the 1970s, members in both
chambers have utilized cosponsorship frequently.
There are a number of reasons to believe that cosponsorship coalitions are a useful stage
in the legislative process to assess bipartisanship. First, ―cosponsorship provides House leaders
with low-cost information about the political benefits of a bill‖ (Koger 2003, 227). Second, what
a member cosponsors, and with whom they cosponsor, allows members to send messages to their
constituents. ―Even if a bill doesn't move, cosponsoring helps clarify your message. That way
people know where you are... and that trickles down to constituents‖ (quoted in Koger 2003,
232).

14
Though there have been debates about why members cosponsor, the assumption in this
paper is that members cosponsor legislation that they genuinely favor (similar to a preference or
matching argument). However, since members only cosponsor a fraction of the entire number of
bills that they might favor, the selection of which bills to cosponsor (among those bills that they
like) is assumed to reflect concerns for signaling (either to constituents or internally to Congress)
or reciprocity among members.
To measure bipartisan cosponsorship, I utilize cosponsor data collected by James Fowler
(Fowler 2006a, 2006b) that provides a matrix of all bills and cosponsors in a given Congress. I
use this raw data to create bill level measures of bipartisanship for all House bills.9 Before
focusing on bipartisan cosponsorship, it is important to understand the trends in more general
cosponsorship patterns. On the whole, the use of cosponsorship has increased in the House since
the 93rd
Congress (see Table 2). Whereas only one-quarter of House bills were cosponsored in
the 93rd
Congress, since the 99th
Congress, more than half of all bills have been cosponsored. In
the 108th
Congress, over seventy percent of bills were cosponsored. The median number of
cosponsors on a House bill (including those that are not cosponsored) has also risen over time.
Among bills that are cosponsored, the median number of cosponsors has nearly doubled in the
period of analysis, from six in the 93rd
Congress to eleven in the 105th
through 108th
Congresses.
However, members are selective in their cosponsorship. No more than six percent of all
cosponsored bills have more than a hundred cosponsors.
[Table 2 about here]
Since cosponsorship has not been analyzed as extensively as roll call votes, there are no
9 I use only House bills throughout the analysis, omitting resolutions and amendments. Although all House bills are
included in the analysis, omitting commemorative legislation, which coding is available for through 2002, does not
change the results. The measures of bipartisanship with and without commemorative legislation are correlated at
0.98.
15
standard measures of partisan or bipartisan cosponsorship. Therefore, this paper considers a
number of possible specifications. I begin by creating a dichotomous measure of bipartisanship
where bills are bipartisan if they are above the lower bound of bipartisanship on the scale and are
partisan otherwise. Taking the simplest definition of bipartisanship – all cosponsored bills that
are not unipartisan (where unipartisan refers to bills where all of the cosponsors are from the
same party as the sponsor) – suggests that bills have been and continue to be overwhelmingly
bipartisan. When all cosponsored bills are considered, bipartisanship occurs on more than two-
thirds of cosponsored legislation. Looking at only bills with the median or more cosponsors, I
find that an even higher proportion of these bills are bipartisan, and that although there is some
decline over time, it is a decline from 0.94 to 0.82, a low that was reached in both the 94th
and
108th
Congresses under relatively low and relatively high levels of polarization, respectively.
To prevent attributing bipartisanship to bills that merely have a single rogue member
cosponsoring with members of the opposite party, I restrict my definition of bipartisanship to
those bills that have at least twenty percent of the cosponsors from the party other than the
original sponsor (see Figure 5).10
When all House bills are considered, the proportion of bills that
10
Additional definitions of bipartisanship, including a raw number of cosponsors from the opposing party (5, 10,
and 20) as well as different percentages of cosponsors from the opposing party (20%, 30%, and 40%) have also been
used for comparison. In all cases the pattern over time is similar with the primary difference being a shift in the
intercept. A potential concern about the analysis presented above is that those bills classified as bipartisan may not
be that different from those bills that are classified as partisan, particularly since the inferences are often made from
a small number of cosponsors. To verify that those bills classified as bipartisan are distinct from those bills classified
as partisan in the analysis, I focus just on those bills that receive a roll call vote and examine the probability that
each type of bill – partisan and bipartisan by cosponsorship - receives an bipartisan roll call vote. That is, of all
bipartisan (or partisan) cosponsored bills that face a roll call vote, what proportion end up having a bipartisan roll
call vote (as defined by the CQ measure)? Using data from the Policy Agendas Project, Rohde‘s dataset of House
roll call votes, and my bipartisan bill cosponsorship measures indicates that between one-quarter and one-half of
bills with bipartisan cosponsors that reach roll call votes result in a bipartisan vote. The average for 1973 through
2000 (the last year in which all three data sources are available) is just about one-third. In contrast, between one-
twentieth and one-fifth (with an average of three-twentieths) of bills with partisan cosponsors that reach roll call
votes result in a bipartisan vote. Although it is not impossible for partisan cosponsored bills to result in a bipartisan
roll call vote, it is rare. In all years, bills with bipartisan cosponsorship coalitions are more likely to result in a
bipartisan roll call vote than bills with partisan cosponsorship coalitions. This suggests that the cosponsorship

16
are bipartisan increases over time, largely due to the overall increase in cosponsorship.
Nonetheless, this is suggestive that bipartisanship has become an increasingly important tool for
members despite the parallel rise in polarization. Between twenty and forty percent of all House
bills are bipartisan. When the analysis is restricted to only cosponsored bills, I find that although
there has been some movement and a slightly downward trend in bipartisanship over time, the
magnitude of the change is surprisingly small. Over the entire period of the 93rd
to 108th
Congresses, the range of bipartisan cosponsorship is between 47% and 61%. The low point of
47% occurs in 1975, 1993, and 2004, under disparate polarization levels by standard roll call
accounts.
[Figure 5 about here]
As done in the analysis of voting, I also create a difference in party support score for each
bill. Since cosponsorship occurs only on the positive side, this is similar to looking at the Yea
votes. For each cosponsored bill, I subtract the percent of Republican cosponsors from the
percent of Democratic cosponsors. Like the roll call-based measure, the resulting the scale
ranges from -100 to 100, where the endpoints reflect bills with all Republican cosponsors and all
Democratic cosponsors, respectively.
Looking at the density of the difference in party support scale, which ranges from -100
(purely partisan Republican bill) to +100 (purely partisan Democratic bill), for each House of
Representatives from the 93rd
to the 108th
Congress indicates that bipartisanship persists. As seen
in Figure 6, although the distribution of cosponsor coalitions is bimodal in the sense that there
are a large number of both Democratic and Republican partisan bills, the middle (i.e., the most
bipartisan bills) has not vanished over time. The primary change in the distribution of bills is that
measures are capturing important variation, and that the importance of this variation extends to voting patterns of the
chamber as a whole.

17
it has become less lopsided toward the Democratic side, particularly once the Republicans gained
majority status. Whereas partisan bills used to be predominantly Democratic, there is a relative
parity of Democratic and Republican partisan bills in more recent Congresses and a growth in
moderately bipartisan bills on the Republican side. More on point for this analysis, however, is
the finding that the center of distribution persists across time. If there is a decline in
bipartisanship, we should have seen the density of both tails grow at the expense of the center,
creating a greater U-shaped pattern over time.
[Figure 6 about here]
Using a continuous measure of the percent of cosponsors from the party opposite the
party of the sponsor, reiterates the persistence of bipartisanship across time. This measure is
similar to the party bipartisanship scale except that it directly accounts for the party of the bill‘s
sponsor. Across the period of analysis, the mean percentage of bipartisan cosponsors fluctuates
around 30%, indicating that, on average, one third of a bill‘s cosponsors are from the party
opposite the party of the original bill sponsor.
Regressing these various measures of bipartisanship on time reiterates the decline of
bipartisanship on roll call votes but a greater persistence of bipartisanship on bill cosponsorship.
Furthermore, since the correlation between time and polarization (using the difference in party
means of Americans for Democratic Actions (ADA) scores) is 0.93, this approach sheds light on
the extent to which (both voting and cosponsorship-based) bipartisanship has declined as voting-
based polarization has risen. Beginning with the CQ measure of all roll call votes, the estimated
beta on time is -0.45 (p < 0.05). The magnitude of the effect increases when only final passage
votes are included, to -0.85 (p < 0.001). In contrast, for the 20% definition of bipartisan bill
cosponsorship, the estimated beta on time is -0.25 (p < 0.01). Similar patterns are found when

18
bipartisanship is measured using the difference in party support scales. In this case, we expect
the direction of the coefficient to be positive since lower absolute values of the scale reflect
greater bipartisanship. Defining bipartisanship as the mean of the absolute value of the party
scale, we get an estimated coefficient on time of 1.16 (p < 0.001) when looking at yea roll call
votes (coefficient of 1.11, p < 0.001 for final passage votes), but a coefficient of -0.02 (p = 0.72)
when looking at bill cosponsorship coalitions. Thus, regardless of the technique for estimating
bipartisanship, bipartisan cooperation shows a greater decline over time in roll call votes than in
bill cosponsorship coalitions.
Section 3.2 Cosponsorship Coalitions and Electoral Responsiveness
At the outset of this paper, I argued standard accounts of party polarization often imply a
decline in electoral responsiveness. In the preceding section, I empirically demonstrated this
declining, drawing on the roll call voting of members. In this section, I return to the assessment
of responsiveness, following the same approaches but using bill cosponsorship coalitions rather
than party unity support scores on votes. As in the previous section, district preferences are
measured using the Normal Presidential Vote in the district. Focusing on bill cosponsorship
patterns for the dependent variable, I define a member‘s propensity for Bipartisan
Cosponsorship as the percentage of bills they cosponsored that are bipartisan. Bipartisan is
defined using the definition where at least twenty percent of the cosponsors are from the party
opposite the party of the sponsor.
Looking at the correlation between the normal presidential vote in the district and bill
cosponsorship behavior offers a stark difference from the patterns of roll call voting. As seen in
Table 1, the normal presidential vote and members‘ party unity votes showed a weakening
relationship over time. In contrast, bipartisan cosponsorship measures show little to no

19
relationship for the first part of the series, but a growing correlation since the 102nd
Congress.
Since the 103rd
Congress, the correlation between the normal vote and members‘ bill
cosponsorship coalitions has generally been larger in magnitude than the correlation between the
normal vote and members‘ party unity support scores.
A second approach further parses out these patterns, again using a quasi-binomial model.
In this model, ‗successes‘ are bipartisan cosponsorship coalitions. The primary independent
variable and control variables are the same as in the analysis of roll call votes. Figure 7 presents
the predicted probability of cosponsoring a bipartisan bill for a selected set of Congresses. As
expected, the slope of the line is in the opposite direction than in the previous table since we
have changed to looking at bipartisanship (rather than partisanship). More important, however, is
the different pattern that we observe over time. Here, we see little movement in the intercept over
time and an increase in the steepness of the slope. Both of these patterns suggest an increase in
responsiveness to district preferences when looking at bill cosponsorship coalitions.
[Figure 7 about here]
Whereas members‘ responsiveness to their districts declined in the roll call-based
measure, it increased over time when using the bill cosponsorship measure. This result has
significant implications both for the empirical study of Congress and representation as well as
the normative interests in these questions. It is also worth noting that the increase in
responsiveness of the cosponsorship measure corresponds time-wise to the low point of the roll
call measure. Members of Congress may have realized that their roll call behavior placed them as
out of step with their districts (potentially because of the types of bills that were selected to face
roll call votes) and thus turned to other forms of legislative behavior to show responsiveness. In
sum, this section demonstrates that members‘ legislative behavior remains a function of their

20
district preferences but that where responsiveness occurs in the legislative process has changed
over time.
4. Agenda Control and the Decline of Bipartisanship
Thus far, the data have provided the following empirical patterns – partisanship has
increased in voting while bipartisan cooperation has declined, bipartisanship has changed
relatively little on bill cosponsorship coalitions, and electoral responsiveness has declined when
measured with roll call votes but increased when measured with bill cosponsorship coalitions.
How can we reconcile these divergent patterns? One explanation is that changes in
congressional agenda control over have led to the creation of an increasingly partisan roll call
agenda. This change in agenda content may reflect decreases in overlap between the parties,
combined with the benefits that come from creating distinctive party brands. This section
presents an overview of this argument and some empirical evidence that supports this claim.
Cox and McCubbins (2005, 5) suggest that the primary tool of the majority party is
picking which bills will be voted on at all, and only secondary do they focus on garnering
enough votes to get a victory. The party leadership is wary to put up issues for votes that create
divisions within their own party. In contrast, the leadership often has incentives to place issues
up for votes that are expected to divide the parties, with their party coming out on the winning
side. A Congressional Quarterly staff writer notes that, ―The 2004 party unity scores reflect a
continuing effort by party leaders to sharpen their distinctions and to rally their troops to vote in
ways that highlight those distinctions‖ (Poole 2004, 2906). He goes on to say that:
Republican leaders followed a model they adopted in 2000, in which they carefully
orchestrated what came to a vote and managed intraparty conflict to minimize dissent on
the floor. In both the House and the Senate, there were fewer total roll call votes than in
2000, but the percentage of total votes that were party unity votes were somewhat higher
in 2004 than in 2000. That is a reflection of the Republican leaders‘ choreography (Poole
2004).

21
Political scientist Sarah Binder suggests that ―The rules of the game are easy enough to
manipulate by a majority party to foreclose opportunities to vote on alternatives that would
attract bipartisanship‖ (quoted in Poole 2004). Electoral strategies geared at motivating the base
to turnout can further heighten the disincentive for bipartisan agenda. Adam Nagourney, a
reporter for the New York Times noted that when both sides are concerned with motivating their
base, the agenda difference between the two is much more dramatic (Nagourney 2003).
Likewise, Grynaviski (2010) argues that political parties perform the role of a surety to voters in
elections, and are better able to perform this function when party unity is high. Although there is
variation in whether members have electoral incentives to vote contrary to the party, he suggests
that the use of agenda control limits the number of votes taken where there is an incentive to
deviate from the party (Grynaviski 2010).
Overtime, the sorting out of the political parties, resulting in reduced overlap between the
ideologies of the members, has combined with agenda control to contribute to an increasingly
partisan roll call agenda. This sorting is particularly apparent in the South, where Republicans
replaced conservative Democrats. Sorting of the two parties, even without having the Democrats
move left or the Republicans move right, creates opportunities for partisan legislation. As
overlap declines, there is an increase in the number of status quo points for which an alternative
exists that receives the support of the majority party median and the floor median, but does not
receive the support from the minority party median. That is, there is an increase in the number of
issues that meet Cox and McCubbins‘ (1993, 2005) criteria for being placed on the agenda
(support of the majority of the majority party) but that will result in party unity rather than a
bipartisan vote.
Thus, when the congressional parties were ‗unsorted‘, as was the case during the heyday

22
of the Conservative Coalition between Republicans and Southern Democrats, votes often had a
bipartisan makeup (Manley 1973). But since the 1970s, as conservative Southern Democrats
were replaced by Republicans (Han and Brady 2007), overlap decreased, allowing partisan
legislation to find room on the congressional agenda. As a result, legislation with bipartisan
support became increasingly less likely to face a roll call vote.
A second factor that may have made the roll call agenda increasingly partisan is the
increased tracking of members‘ voting records by interest groups, again beginning in the 1970s.
When special interest groups are watching members‘ behavior, the parties have greater
incentives to select votes that pit the parties against each other, especially on those issues that the
party relies on support or funding from an interest group. The fact that votes on those bills
selected as most important by these interest groups tend to closely follow party lines attests to
this dynamic (Snyder 1992).
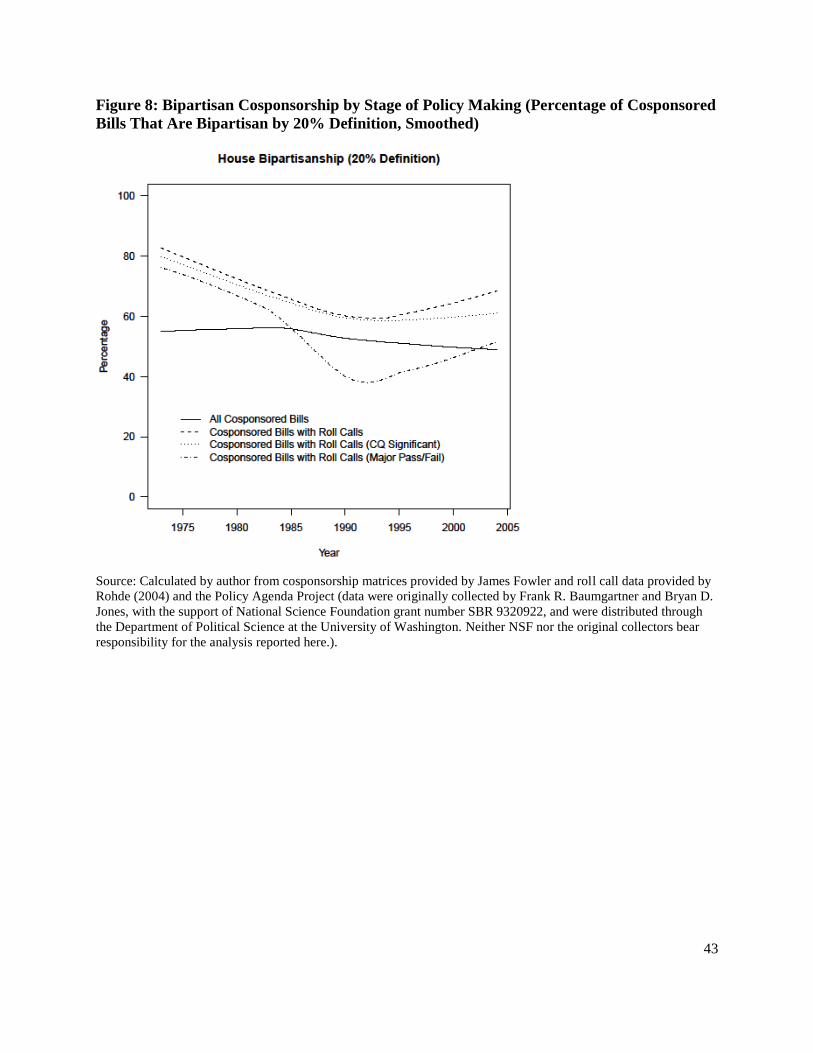
In order to explore how the incidence of bipartisanship changes when considering the
cosponsorship stage versus the roll call vote stage of the legislative process, Figure 8 looks at the
percentage of cosponsored bills that are bipartisan under the 20 percent definition for all House
bills, for bills that reach roll call votes, and for bills that reach roll call votes and are classified as
important. Two definitions of important legislation are used. The first uses Congressional
Quarterly Almanac (CQ) and the second is original data that was collected matching up
Mayhew‘s important legislation and George Edward‘s list of important failures with the
appropriate bill numbers.11
In each case, the graph plots the percent of bills in each category that
are bipartisan in their cosponsorship coalitions. The lines are smoothed using a loess procedure
11
An updated list of Mayhew‘s important legislative enactments and George Edward‘s major legislative failures was
graciously provided y Sean Theriault. The bill numbers of the specific piece of legislation, as well as duplicate bills
and other similar proposals, was coded using CQ Almanac, the Thomas search engine from the Library of Congress,
and relevant newspaper articles on the legislation if necessary.

23
that utilizes locally weighted polynomial regression. Here, higher percentages reflect greater
bipartisanship. Comparing all cosponsored bills with bills that reach roll call votes, there is a
greater decline in bipartisanship in those bills that face roll call votes than there is in overall
bipartisan cosponsorship of legislation. Beginning in the mid-1990s, however, there is a
resurgence in bipartisanship in bills that reach roll calls. The same pattern is seen when looking
only at important bills (CQ) and even more apparent when considering major passages and
failures. Combined, these findings suggest that the decline in bipartisanship evident in roll call
voting is largely driven by the choice of which bills receive roll call votes.
[Figure 8 about here]
A second approach to distinguishing how agenda control may influence the measurement
of bipartisanship is to look at the conditional probability of reaching a specific stage in the policy
making process given that a bill is either partisan or bipartisan in its cosponsorship coalition.
Using the 20% definition of bipartisan legislation, I analyze both the conditional probability of
reaching a roll call vote as well as the conditional probability of becoming a public law given
that a bill is bipartisan (or partisan) (Table 3). In both cases, bipartisan bills have a greater
probability of reaching the legislative stage than partisan bills. However, I find different patterns
over time in the conditional probability of reaching a roll call vote versus becoming a public law
for bipartisan bills. Whereas the conditional probability of a partisan bill reaching a roll call vote
slightly increases over time, the conditional probability of a bipartisan bill reaching a roll call
vote generally declines from the 93rd
(early 1970s) to the 103rd
Congresses. The conditional
probability that a bipartisan bill reaches a roll call vote increases only after the Republican
takeover in the 104th
Congress. In contrast, the probability of becoming public law given that a
bill is bipartisan has nearly tripled between the 93rd
and 108th
Congresses. This suggests that

24
legislation with bipartisan support early in the legislative process (as evidenced by its
cosponsorship coalition) was increasingly prevented from reaching a roll call vote from the early
1970s through the mid-1990s but that it was increasingly likely to become law (although this
may have occurred through a voice vote).
[Table 3 about here]
As mentioned above, one factor that may explain changes in the composition of the roll
call agenda is the sorting out of congressional parties, particularly in the South. Defining
unsorted districts as those in which the normal presidential vote is less than 50% for the party of
the House member in the district, let us consider the percent of unsorted districts as a predictor of
whether partisan or bipartisan legislation reaches a roll call vote. Since the baseline probability
of a bill reaching a roll call vote is very small, we will restrict the analysis to those bills that were
classified as important by Congressional Quarterly Almanac (CQ). The analysis is run at the
bill-level where the dependent variable is whether a bill received a roll call vote (as determined
by merging data from the Policy Agendas Project with the original data in this paper). The
independent variables are bipartisan cosponsorship, defined as 1 for bills where at least 20% of
the cosponsors are from the party opposite the party of the sponsor, and the percent of unsorted
districts, measured as the percent of districts in each Congress where the normal presidential vote
is less than 50%. Table 4 presents the results and Figure 9 presents the predicted probabilities
from the model. Whereas the probability of receiving a roll call vote increases for bipartisan
legislation as the percent of unsorted districts increases, the probability decreases for partisan
legislation.
[Table 4 about here]
[Figure 9 about here]

25
In sum, bipartisanship persists in bill cosponsorship coalitions and the decline of
bipartisanship in voting appears to be related to the choice of bills that receive roll call votes. For
all cosponsored bills, the proportion that is bipartisan is strikingly constant across time. While
bipartisan bills may not outnumber partisan bills, bipartisanship in cosponsorship coalitions is
nearly as common today as it was in the early 1970s. Only when looking at House bills that
reach roll call votes do we see a sizeable decline in bipartisanship. This suggests that using roll
call votes may artificially increase the appearance of polarization and artificially decrease the
appearance of bipartisanship.
5. Conclusions
This research finds that although bipartisan cooperation and electoral responsiveness
have declined in patterns of roll call votes, the same is not true for members‘ use of bill
cosponsorship coalitions. Rather, bipartisanship persists in bill cosponsorship coalitions, the
stage where legislators are the most independent. This divergence between roll call voting and
bill cosponsorship coalitions can be explained, in part, by changes in the selection of bills to face
roll call votes.
Although bipartisanship on roll call votes has declined, bipartisanship on bill
cosponsorship coalitions largely has not. In terms of the legislation that actually becomes law,
bipartisanship was and is the norm. Although partisan behavior has always been a feature of
Congress, the main finding of this work is that the relative frequency of partisan relative to
bipartisan behavior has not dramatically changed in bill cosponsorship. While the decline of
bipartisanship, and of weakened representation, in roll call voting is certainly important both for
its normative implications and for the understanding of legislative behavior, including bill
cosponsorship coalitions cautions us against an all-or-nothing account of bipartisan cooperation.
26
When considering bill cosponsorship patterns, Congress has remained representative of, and
relatively responsive to, the more moderate public despite being characterized as increasingly
partisan.
These findings add to the growing literature that cautions against using aggregate roll call
data as the basis of all legislative behavior measures (Roberts 2007; Clinton 2007; Carrubba et
al. 2008; Loewenberg 2008). With respect to academic work on preferences, polarization, and
party power, this research points out the importance of looking beyond roll call votes to explore
these relationships. Beyond the discussion of legislative organization and legislative behavior,
my findings add to the growing literature on polarization and party strength. While scholars have
noted the differences between elite and mass polarization, and have focused on similarities
between citizens of red states and blue states (Fiorina et al. 2004), my findings suggest this may
occur at the congressional level as well. Using patterns of bill cosponsorship, I find that more
common ground exists between members of opposing parties than is generally acknowledged.
The appearance of growing partisan cohesion and polarization reflects how political parties
utilize the congressional agenda. Like Cox and McCubbins (2005), I find that the party‘s ability
to select issues for roll call votes has important consequences. In this case, the probability that
legislation with bipartisan support faces a roll call vote has varied over time. In effect, the
political parties are selecting the level of party polarization that is observed by the public by
selecting which bills face roll call votes.

27
References
Achen, Christopher H. 1978. "Measuring Representation." American Journal of Political Science
22 (3):475-510.
Ansolabehere, Stephen, James M. Snyder, and Charles III Stewart. 2001. "Candidate Positioning
in U.S. House Elections." American Journal of Political Science 45 (1):136-59.
APSA. 1950. "Towards a More Responsible Two-Party System: A Report of the Committee on
Political Parties." American Political Science Review 44 (3).
Burden, Barry C. 2004. "Candidate Positioning in US Congressional Elections." British Journal
of Political Science 34:211-27.
Canes-Wrone, Brandice, David W. Brady, and John F. Cogan. 2002. "Out of Step, Out of Office:
Electoral Accountability and House Members' Voting." American Political Science
Review 96 (1):127-40.
Carrubba, Clifford, Matthew Gabel, and Simon Hug. 2008. "Legislative Voting Behavior, Seen
and Unseen: A Theory of Roll Call Vote Selection." Legislative Studies Quarterly XXXII
(4):543-72.
Carson, Jamie L., Gregory Koger, Matthew J. Lebo, and Everett Young. 2010. "The Electoral
Costs of Party Loyalty in Congress." American Journal of Political Science 54 (3):598-
616.
Clinton, Joshua D. 2007. "Lawmaking and Roll Calls." Journal of Politics 69 (2):355-467.
Congressional Record. 1967.
Cox, Gary, and Mathew D. McCubbins. 1993. Legislative Leviathan. Berkeley: University of
California Press.
———. 2005. Setting the Agenda: Responsible Party Government in the U.S. House of
Representatives. New York: Cambridge University Press.
28
"CQ Fact Sheet Bipartisan Voting." 1963. In CQ Almanac. Washington D.C.: Congressional
Quarterly Inc.
"CQ Fact Sheet Bipartisan Voting." 1970. In CQ Almanac. Washington D.C.: Congressional
Quarterly Inc.
DiMaggio, Paul, John Evans, and Bethany Bryson. 1996. "Have American's Social Attitudes
Become More Polarized?" American Journal of Sociology 102 (3):690-75.
Downs, Anthony. 1957. An Economic Theory of Democracy. Boston: Addison-Wesley.
Eilperin, Juliet. 2006. Fight Club Politics: How Partisanship is Poisoning the House of
Representatives. Edited by P. Berkowitz and T. Lindberg. Lanham: Rowman and
Littlefield.
Fenno, Richard F. Jr. 1978. Home Style: Home Members in Their Districts. Boston: Little,
Brown.
Fiorina, Morris P., Samuel Abrams, and Jeremy Pope. 2004. Culture War? The Myth of a
Polarized America. New York: Pearson Longman.
Fiorina, Morris P., and Matthew S. Levendusky. 2006. "Disconnected: The Political Class versus
the People." In Red and Blue Nation? Characteristics and Causes of America's Polarized
Politics, ed. P. S. Nivola and D. W. Brady. Washington D.C.: Brookings Institution
Press.
Fowler, James. 2006a. "Connecting the Congress: A Study of Cosponsorship Networks."
Political Analysis 14:456-87.
———. 2006b. "Legislative Cosponsorship Networks in the U.S. House and Senate." Social
Networks 28:454-65.
Grynaviski, Jeffrey D. 2010. Partisan Bonds. New Yotk: Cambridge Univeristy Press.

29
Han, Hahrie, and David W. Brady. 2007. "A Delayed Return to Historical Norms: Congressional
Party Polarization after the Second World War." British Journal of Political Science 37
(3):505-31.
Heller, William B., and Carol Mershon. 2008. "Dealing in Discipline: Party Switching and
Legislative Voting in the Italian Chamber of Deputies, 1988-2000." American Journal of
Political Science 52 (4):910-25.
Kessler, Daniel, and Keith Krehbiel. 1996. "Dynamics of Cosponsorship." American Political
Science Review 90 (3):555-66.
Koger, Gregory. 2003. "Position Taking and Cosponsorship in the U.S. House." Legislative
Studies Quarterly 28 (2):225-46.
Krehbiel, Keith. 1993. "Where's the Party?" British Journal of Political Science 23:235-66.
———. 1995. "Cosponsors and Wafflers from A to Z." American Journal of Political Science
39 (4):906-23.
———. 2006. "Partisan Roll Rates in a Nonpartisan Legislature." Journal of Law, Economics,
and Organization 23 (1):1-23.
Lee, Frances E. 2009. Beyond Ideology: Politics, Principles, and Partisanship in the U.S. Senate.
Chicago: University of Chicago Press.
Levendusky, Matthew S., Jeremy C. Pope, and Simon D. Jackman. 2008. "Measuring District-
Level Partisanship with Implications for the Analysis of U.S. Elections." The Journal of
Politics 70 (3):736-53.
Loewenberg, Gerhard. 2008. "The Contribution of Comparative Research to Measuring the
Policy Preferences of Legislators." Legislative Studies Quarterly XXXIII (4):501-10.

30
Lynch, Michael S., and Anthony J. Madonna. 2008. Viva Voce: Implications from the
Disappearing Voice Vote, 1807-1990. Paper read at Annual Meetings of the Midwest
Political Science Association, at Chicago, IL.
Manley, John. 1973. "The Conservative Coalition in Congress." American Behavioral Scientist
17 (2):223-47.
Mayhew, David R. 1974. Congress: The Electoral Connection. New Haven: Yale University
Press.
Muirhead, Russell. 2006. "A Defense of Party Spirit." Perspectives on Politics 4 (4):713-27.
Nagourney, Adam. 2003. "Political Parties Shift Mehpasis to Core Voters." The New York Times,
September 1, 2003, 1.
Pew. 2010. Willingness to Compromise a Plus in Midterms. The Pew Research Center for People
and the Press 2010 [cited May 24 2010]. Available from http://people-
press.org/report/617/.
"A Polarized Nation?". 2004. The Washington Post, November 14, 2004.
Poole, Isaiah J. 2004. "Party Unity Vote Study: Votes Echo Electoral Themes." In CQ Weekly
Online.
Roberts, Jason M. 2007. "The Statistical Analysis of Roll-Call Data: A Cautionary Tale."
Legislative Studies Quarterly XXXII (3):341-60.
Rohde, David W. 1991. Parties and Leaders in the Post-Reform House. Chicago: University of
Chicago Press.
———. 2004. "Roll Call Data for the United States House of Representatives, 1953-2004." East
Lansing, MI: Compiled by the Political Institutions and Public Choice Program,
Michigan State University.

31
Rosenblum, Nancy L. 2008. On the Side of the Angels. Princeton: Princeton University Press.
Snyder, James M. 1992. "Artificial Extremism in Interest Group Ratings." Legislative Studies
Quarterly 36:319-45.
Theriault, Sean M. 2006. Procedural Polarization in the U.S. Congress. Paper read at Midwest
Political Science Association Meeting, at Chicago, IL.
Thomas, Scott , and Bernard Grofman. 1993. "The Effects of Congressional Rules About Bill
Cosponsorship on Duplicate Bills: Changing Incentives for Credit Claiming." Public
Choice 75:93-8.
Van Drehle, David. 2004. "Political Split is Pervasive: Clash of Cultures Is Driven by Targeted
Appeaks and Reinforced by Geography." The Washington Post, April 25, 2004, A01.

32
Table 1: Correlation of Legislative Behavior with Normal Presidential Vote
Congress Bipartisan
Cosponsorship
Party Unity
Support Score
93 0.03 0.43
94 0.13 0.41
95 0.04 0.43
96 -0.12 0.38
97 -0.22 0.27
98 -0.02 0.13
99 0.03 0.13
100 0.07 0.11
101 -0.16 0.16
102 -0.16 0.29
103 -0.55 0.45
104 -0.46 0.46
105 -0.55 0.36
106 -0.65 0.39
107 -0.63 0.36
108 -0.56 0.38 Source: Calculated by author from cosponsorship matrices provided by James Fowler and roll call data from Rohde
(2004). Normal presidential vote was ccalculated by the author, using data from David Brady.

33
Table 2: Cosponsorship Summary Statistics
Congress Number of
House
Bills
Proportion
of Bills
Cosponsored
Median #
Cosponsors
(all bills)
Median #
Cosponsors
(> 0
cosponsors)
Proportion
of bills
with 0-10
Cosponsors
Proportion
of bills
with >100
Cosponsors
93 17,690 0.28 0.00 6.00 0.60 0.00
94 15,863 0.36 0.00 6.00 0.61 0.00
95 14,414 0.40 0.00 6.00 0.59 0.00
96 8,455 0.37 0.00 6.00 0.57 0.02
97 7,457 0.42 0.00 7.00 0.59 0.03
98 6,442 0.49 0.00 7.00 0.56 0.04
99 5,753 0.56 1.00 9.00 0.51 0.04
100 5,585 0.60 1.00 9.00 0.47 0.05
101 5,977 0.62 2.00 9.00 0.48 0.05
102 6,212 0.60 2.00 10.00 0.49 0.05
103 5,310 0.62 2.00 10.00 0.50 0.04
104 4,344 0.63 2.00 10.00 0.51 0.05
105 4,874 0.67 3.00 11.00 0.47 0.05
106 5,681 0.67 3.00 11.00 0.48 0.06
107 5,767 0.68 3.00 11.00 0.47 0.05
108 5,431 0.72 4.00 11.00 0.49 0.06 Source: Calculated by author from cosponsorship matrices provided by James Fowler.

34
Table 3: Conditional Probability of Reaching a Roll Call or Public Law Given Being a
Partisan/Bipartisan (20% Definition) Bill
Congress Roll Call |
Partisan
Roll Call |
Bipartisan
Public Law |
Partisan
Public Law |
Bipartisan
93 0.01 0.06 0.01 0.05
94 0.02 0.07 0.01 0.05
95 0.02 0.06 0.02 0.05
96 0.04 0.07 0.04 0.08
97 0.02 0.05 0.02 0.06
98 0.05 0.06 0.03 0.08
99 0.03 0.04 0.03 0.07
100 0.03 0.05 0.04 0.09
101 0.03 0.03 0.03 0.07
102 0.03 0.03 0.03 0.06
103 0.03 0.03 0.03 0.06
104 0.04 0.05 0.02 0.08
105 0.04 0.06 0.02 0.07
106 0.03 0.08 0.02 0.11
107 0.03 0.07 0.02 0.08
108 0.03 0.07 0.02 0.12 Source: Calculated by author from cosponsorship matrices provided by James Fowler and roll call data provided by
Rohde (2004) and the Policy Agenda Project (data were originally collected by Frank R. Baumgartner and Bryan D.
Jones, with the support of National Science Foundation grant number SBR 9320922, and were distributed through
the Department of Political Science at the University of Washington. Neither NSF nor the original collectors bear
responsibility for the analysis reported here.).

35
Table 4: Probability of a Roll Call Votes (CQ Significant Legislation, 1973-2004)
Model 1
Intercept -0.00452
(0.229)
Bipartisan Cosponsorship -0.85**
(0.291)
Percent Unsorted Districts -0.00449
(0.00631)
Bipartisan x Percent Unsorted 0.0225**
(0.00791)
N 3313
Log Likelihood -2274
Standard errors in parentheses. ^p < 0.1,
*p < 0.05,
**p < 0.01,
***p < 0.001.
Source: Calculated by author from cosponsorship matrices provided by James Fowler and roll call data provided by
Rohde (2004) and the Policy Agenda Project (data were originally collected by Frank R. Baumgartner and Bryan D.
Jones, with the support of National Science Foundation grant number SBR 9320922, and were distributed through
the Department of Political Science at the University of Washington. Neither NSF nor the original collectors bear
responsibility for the analysis reported here.).

36
Figure 1: Party Polarization in Congress (ADA Scores, 1973-2006)
Source: Calculated by author from Americans for Democratic Action scores.

37
Figure 2: CQ Roll Call Bipartisanship Measures (House of Representatives, 1973-2004)
Source: Congressional Quarterly Almanac. Regressing the percent of bipartisan roll call votes on time produces a
coefficient of -0.45 (p < 0.05). When only final passage roll call votes are included this increases to -0.85 (p <
0.001).

38
Figure 3: Difference in Percent of Party Voting Yea (% of Democrats - % of Republicans)
(All House Votes)
Source: Calculated by the author from Rohde (2004) data. Regressing the mean of the absolute value of the party
difference score on time produces a coefficient of 1.16 (p < 0.01). When only final passage roll call votes are
included this coefficient is 1.11 (p < 0.001).

39
Figure 4: Predicted Probabilities from Quasi-Binomial (Party Unity Support Score,
Selected Congresses)
Source: Calculated by author. Full regression model available in online appendix. Normal presidential vote was
ccalculated by the author, using data from David Brady.

40
Figure 5: Bipartisan Cosponsorship (At least 20% of Cosponsors from Party Opposite the
Party of Sponsor, House of Representatives, 1973-2004)
Source: Calculated by author from cosponsorship matrices provided by James Fowler. Regressing the percent of
cosponsored bills that are bipartisan on time produces a coefficient of -0.25 (p < 0.01). As a comparison, if the
measure of bipartisanship is the mean of the percent of cosponsors opposite the party of the bill sponsor, the
coefficient on time is -0.17 (p < 0.001).

41
Figure 6: Difference in Party Support in Cosponsorship Coalitions (% Democratic
Cosponsors - % Republican Cosponsors)
Source: Calculated by author from cosponsorship matrices provided by James Fowler. Regressing the mean of the
absolute value of the party scale on time produces a coefficient of -0.02 (p – 0.72).

42
Figure 7: Predicted Probabilities from Quasi-Binomial (Bipartisan Cosponsorship, Selected
Congresses)
Source: Calculated by author. Full regression model available in online appendix.
43
Figure 8: Bipartisan Cosponsorship by Stage of Policy Making (Percentage of Cosponsored
Bills That Are Bipartisan by 20% Definition, Smoothed)
Source: Calculated by author from cosponsorship matrices provided by James Fowler and roll call data provided by
Rohde (2004) and the Policy Agenda Project (data were originally collected by Frank R. Baumgartner and Bryan D.
Jones, with the support of National Science Foundation grant number SBR 9320922, and were distributed through
the Department of Political Science at the University of Washington. Neither NSF nor the original collectors bear
responsibility for the analysis reported here.).

44
Figure 9: Predicted Probabilities from Table 4
Source: Calculated by author from cosponsorship matrices provided by James Fowler and roll call data provided by
Rohde (2004) and the Policy Agenda Project (data were originally collected by Frank R. Baumgartner and Bryan D.
Jones, with the support of National Science Foundation grant number SBR 9320922, and were distributed through
the Department of Political Science at the University of Washington. Neither NSF nor the original collectors bear
responsibility for the analysis reported here.).

45
Appendix
Appendix Table 1: Full Model Specification of Bipartisanship by Members of Congress
Cosponsorship Party Unity
Intercept 1.44***
-2.05***
(0.144) (0.209)
Majority Party Member -0.476***
0.764***
(0.013) (0.0249)
Normal Presidential Vote in District -0.0127***
0.0551***
(0.0025) (0.00379)
Female -0.217***
-0.0146
(0.0186) (0.0411)
Age 0.00127* -0.00421
***
(0.000634) (0.00108)
Number of Congresses Served -0.00338^ -0.0149
***
(0.00192) (0.00318)
House Leadership -0.386***
0.9***
(0.0725) (0.143)
94th Congress -1.1***
0.056
(0.184) (0.252)
95th Congress -0.32^ -0.513
^
(0.191) (0.264)
96th Congress 0.329^ -0.341
(0.196) (0.275)
97th Congress 0.954***
0.81*
(0.212) (0.375)
98th Congress -0.343^ 1.59
***
(0.185) (0.312)
99th Congress -0.172 1.75***
(0.174) (0.274)
100th Congress -0.273 1.97***
(0.17) (0.278)
101st Congress 0.188 1.69***
(0.168) (0.277)
102nd Congress 0.0661 1.38***
(0.168) (0.271)
103rd Congress 0.839***
0.44
(0.201) (0.331)
104th Congress 0.401^ -0.00238
(0.215) (0.318)
105th Congress 0.938***
0.645^
(0.184) (0.329)
106th Congress 1.35***
0.13
(0.177) (0.357)
107th Congress 1.03***
0.951*
(0.175) (0.404)

46
108th Congress 0.539**
1.58***
(0.172) (0.348)
109th Congress 0.248 1.27***
(0.178) (0.346)
94th Congress x Normal Vote 0.00855* 0.00238
(0.00335) (0.00489)
95th Congress x Normal Vote 0.00457 0.0111*
(0.00347) (0.00509)
96th Congress x Normal Vote -0.00247 0.0112*
(0.00354) (0.00531)
97th Congress x Normal Vote -0.00556 -0.0122^
(0.00374) (0.00697)
98th Congress x Normal Vote 0.00462 -0.024***
(0.00329) (0.00582)
99th Congress x Normal Vote 0.00163 -0.0238***
(0.00309) (0.0051)
100th Congress x Normal Vote 0.00462 -0.0253***
(0.00303) (0.00518)
101st Congress x Normal Vote -0.00249 -0.0225***
(0.00298) (0.00517)
102nd Congress x Normal Vote -0.00433 -0.0135**
(0.00298) (0.00512)
103rd Congress x Normal Vote -0.0202***
0.00928
(0.00354) (0.00625)
104th Congress x Normal Vote -0.0117**
0.0167**
(0.00377) (0.00596)
105th Congress x Normal Vote -0.0209***
0.00265
(0.00317) (0.00604)
106th Congress x Normal Vote -0.0252***
0.0127^
(0.00307) (0.00656)
107th Congress x Normal Vote -0.0214***
0.00324
(0.003) (0.00738)
108th Congress x Normal Vote -0.0159***
-0.00358
(0.00296) (0.00644)
109th Congress x Normal Vote -0.013***
-0.000174
(0.00306) (0.00634)
N 7385 7412
Log Likelihood — —
Standard errors in parentheses. ^p < 0.1,
*p < 0.05,
**p < 0.01,
***p < 0.001.

47
Appendix Figure 1: CQ Roll Call Bipartisanship Measures (House of Representatives,
Final Passage Votes, 1973-2004)

48
Figure 3: Difference in Percent of Party Voting Yea (% of Democrats - % of Republicans)
(Final Passage House Votes)