confronting the global financial crisis: bank efficiency ... · bank efficiency, profitability and...
TRANSCRIPT
Confronting the Global Financial Crisis: Bank Efficiency, Profitability and Banking System in Africa
Hiroyuki KIYOTA1
Institute for International Cooperation Studies, Takushoku University, Tokyo, Japan
October, 2009
A paper prepared for the African Economic Conference on “Fostering Development in an Era of Financial and Economic Crises”,
Addis Ababa, November 11-13 2009
1 The author is a doctoral candidate in the graduate school of international cooperation studies at Takushoku University. The findings, views, and conclusions expressed in this paper are solely those of the author. Email:[email protected]
2
Abstract The paper analyzes the efficiency and profitability of commercial banks in 29 Sub-Saharan African countries during 2000-2007. Although Africa was not initially hit by the global financial crisis, particularly it examines as to whether the African banking sector may be exposed to contagion effects of the financial crisis while investigating not only banks’ efficiency but also banking system in Africa. It employs parametric methods, stochastic frontier approach to measure banks’ cost and profit efficiency. Moreover, the paper analyzes the efficiency and profitability of commercial banks by each group such as emerging market (South Africa), frontier markets, or financially developing markets, as well as by each case of domestic bank, Sub-Saharan African (SSA) foreign bank, or non-SSA foreign bank. Furthermore, using regression analysis, the paper discusses the correlation of technical efficiency scores with the financial indicators such as asset quality, capital ratios, operational and liquidity ratios, as well as z scores, a proxy measure of banking stability. The paper concludes with a brief assessment of pre-effects of the crisis, by pointing out the issues on Africa's banking system and by suggesting policy implications. Key words: Bank efficiency, Banking sector, Global financial crisis, Profitability, Stochastic frontier analysis, Sub-Saharan Africa

3
1. Introduction .............................................................................................................................4 2. Global Financial Crisis .............................................................................................................5
2.1 Brief Survey of Impact of the Crisis on the Africa’s Banking System .......................................5 3. Banking Sector in Sub-Saharan Africa......................................................................................6
3.1 Comparative Analysis of Banks’ Performance and Structure ...................................................6 3.2 Profitability Analysis ..............................................................................................................8
4. Empirical Model and Data......................................................................................................14 4.1 Methods to Estimate Cost Inefficiency and Profit Efficiency ..................................................14
4.1.1 Parametric versus Non-Parametric....................................................................................14 4.1.2 Concept of Profit Efficiency and Cost Inefficiency ...............................................................15
4.2 Stochastic Frontier Analysis ..................................................................................................15 4.2.1 Estimating Cost Inefficiency ..............................................................................................15 4.2.2 Estimating Profit Efficiency...............................................................................................16
4.3 Explanatory Variables and the Second Stage Regression........................................................17 4.4 Data Descriptions .................................................................................................................18
5. Empirical Results.......................................................................................................................19 5.1 Result Interpretations...........................................................................................................19
5.1.1 Efficiency by Comparator Group, Bank Ownership, and Country..........................................19 5.2 Correlation of Efficiency Scores with Environmental Variables (Financial, bank-level, and economic indicators) ..................................................................................................................23
5. Conclusions and Policy Implications .......................................................................................24

4
1. Introduction
The current global financial crisis that originated in the collapse in the market for sub-prime mortgages in the United States in 2007 initially did not hit Africa directly. The crisis also had little impact on the Sub-Saharan African financial systems because the financial sector in Africa remains shallow, uncompetitive and weakly integrated into the global markets. Despite the fact that money, currencies, and capital markets had the significant pressures by the crisis, they have continued to function normally, and financial institutions in most countries have been stable without emergency support from monetary authorities. Nevertheless, due to pressures intensified by the crisis, Sub-Saharan African countries are being hit hard as the global crisis has continued to deepen. The spiraling effects of a depressed world economy and the increased risk aversion of investors pose growing risks for Sub-Saharan African financial systems. As a matter of fact, frontier and emerging market countries such as South Africa, Nigeria, Ghana, and Kenya were hit first, suffering falling equity markets, capital flow reversals, and pressures on exchange rates. Most African economies have a high degree of foreign bank penetration. The large share of foreign-owned banks across Africa has brought stability over the past years but also exposes the region to additional contagion risk. Also, the boosting of domestic banks’ efficiency is mainly attributable to raising the number of foreign banks. Central bankers in the Southern African Development Community (SADC) recognize that efficiency in the banking sector is a key contributor to macroeconomic stability (Ngalande, 2003). It is also a precondition for economic growth and important for the effectiveness of monetary policy (Hartmann, 2004). In the late 1980s and early 1990s, a number of African countries began to restructure their financial sectors in order to boost banking efficiency (Brownbridge and Harvey, 1998). Thus, it is crucial to conduct research on bank efficiency in Africa. Some researchers have already studied about the efficiency of African banks. At the same time, it is also important to assess pre-effects of the ongoing financial crisis on the banking efficiency as well as banking system in Africa. At present, it is likely to be difficult to entirely analyze the impact of the current crisis on the African banking sector because of the limited availability of 2008 bank-level data. Thus, the paper mainly tries to answer the following questions.
a) How were the pre-crisis performance and profitability of commercial banks in Sub-Saharan Africa?
b) During the pre-crisis period, how was the relationship between bank efficiency and financial indicators?
c) Whether the African banking sector may be exposed to contagion effects of the current financial crisis.
5
The rest of this paper is structured as follows. Section 2 reviews the current financial crisis and gives a brief survey of impact of the crisis on the Africa’s banking system. Section 3 discusses banking sector in Sub-Saharan Africa through comparative analysis of bank performance and profitability. This is followed by a description of methodology and data used in the study. The cost and alternative profit functions are used to measure domestic and foreign banks’ cost and profit efficiency by using a stochastic frontier approach. Then, the paper assesses the links between bank efficiency and financial indicators such as operation, capital, liquidity, and asset quality ratios though the instrumental variable estimation in the form of two-stage least squares technique. The paper concludes with a brief assessment of the pre-effects of the crisis by pointing out the issues on Africa's banking system and by suggesting policy implications.
2. Global Financial Crisis The financial disruptions triggered by the US sub-prime mortgage market precipitated a global financial crisis, which has simultaneously affected all the major economies including the United States of America, the European Union, Japan and China. This global crisis made all these economies go into a recession by the end of 2008. IMF (2009) mentions that many countries in Sub-Saharan Africa enjoyed robust economic growth in recent years that strengthened their balance sheets. Sound economic policies were an important factor, as was the favorable external environment and increased external support in the form of debt relief and higher capital inflows. In addition, African markets have so far been remarkably resilient to the current Global Financial Crisis, primarily due to the fact that their financial systems do not hold any of the toxic securities and debts that have precipitated and spread the crisis in the international financial system. Sub-Saharan African countries greatly vary by country in financial market development; linkages to global financial markets and institutions; the initial soundness of their financial systems; and their capacity to respond to the shocks flexibly and comprehensively. Therefore, their exposure to the crisis also differs. The better countries with a sound financial system, substantial reserves, and fiscal surpluses are integrated with global markets, the faster they are feeling contagion effects. But those countries with stronger financial systems and with flexible policy frameworks could absorb shocks better and mitigate the effects more effectively. 2.1 Brief Survey of Impact of the Crisis on the Africa’s Banking System Since most African banks do not have any significant exposure to the sub-prime mortgage market and asset-backed securities, bank failures have been rare in Africa. They are, however, vulnerable to contagion effects arising from the high rate of foreign ownership of banks in several countries in the region. To the extent that foreign-owned banks reduce their support of local banks or sell their assets, it will have serious negative consequences for the financial sector in Africa. The countries like Botswana, Côte d’Ivoire, Malawi, Mozambique, Swaziland and Zambia are highly susceptible to contagion from this source because of the quite high presence of foreign-owned banks in these

6
countries. Although banking sectors in South Africa, Nigeria and Kenya remain stable, the IMF (2009) reports that portfolio and external borrowing have largely dried up and trade financing has become more costly and scarce in these countries including Ghana. While nonperforming loans are still manageable, they are expected to rise with a slowing in economic activity. Credit conditions have tightened, in particular credit to small- and medium-sized enterprises. Nigeria’s financial markets are currently experiencing enormous strains due to both global and local market liquidity issues and high dependence on oil. In 2008, Nigeria’s financial sector had two problems. On the one side, a boom in Nigeria’s capital markets which was encouraged by the banking sector reforms in turn has exposed the banks to risk from the global economic downturn. On the other, the price of oil has more than halved since its high of USD147 in July, 2008. Despite these problems, the Nigerian banking system is further protected from the crisis as a result of the dramatic improvement in risk management practices, which help banks to avoid lending to individuals and organizations that are likely to default. Murinde (2009) points out that African banking assets represent only 0.87% of global banking assets, compared to 58.15% for the 15 countries of the Euro zone and 15.09% for the United States. Few banks in Africa are exposed to off-balance transactions such as securitisation and use of the derivative market and they are mainly involved in financial intermediation. Also, for some African countries, borrowing from foreign banks is regulated in the context of exchange control regulations such that, in a flow of funds sense, domestic companies can only borrow from the rest of the world by using central bank or government guarantees. 3. Banking Sector in Sub-Saharan Africa 3.1 Comparative Analysis of Banks’ Performance and Structure Table 1 shows indicators of banks performance by comparator group2 in 2007. The Sub-Saharan
Africa commercial banks which had the highest return on average equity (ROAE) and average assets
(ROAA) operate in the frontier market countries. The banks in the financially developing countries
had the highest net interest income to assets. The emerging market country (South Africa) has
relatively low level in ratios such as net interest income to assets, ROAA and the cost-to-income.
Although South Africa has a well-developed financial system, its banks’ performance is lower than the
other two markets except the rest of the groups. Its picture may be reflected by the fact that a full
continuum of market segments in South Africa are interconnected and integrated with global markets.
2 Emerging Market Country is South Africa. Other country groupings refer to the Table A1 in Appendix.

7
Table 1: Indicators of Banks Performance by Comparator Group (in percent), 2007
Comparator Group
Net interest
income to
assets
ROAA ROAE Cost to
income ratio
Emerging Market Country 5.9 2.1 18.6 59.6
Frontier Market Countries 6.1 2.4 23.8 59.5
Financially Developing Countries 8.2 2.0 15.1 66.2
The rest of three comparator groups 3.2 1.7 -10.2 64.3
Average 5.8 2.0 11.8 62.4 Source: Bankscope database (2009)
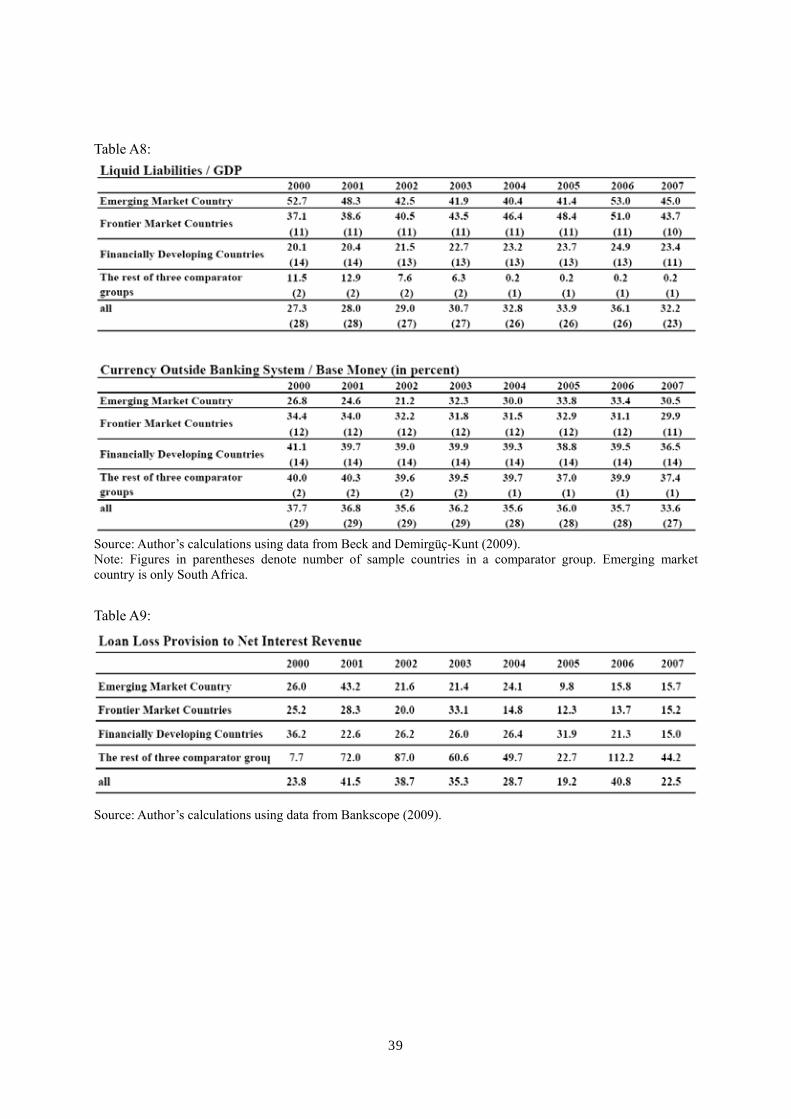
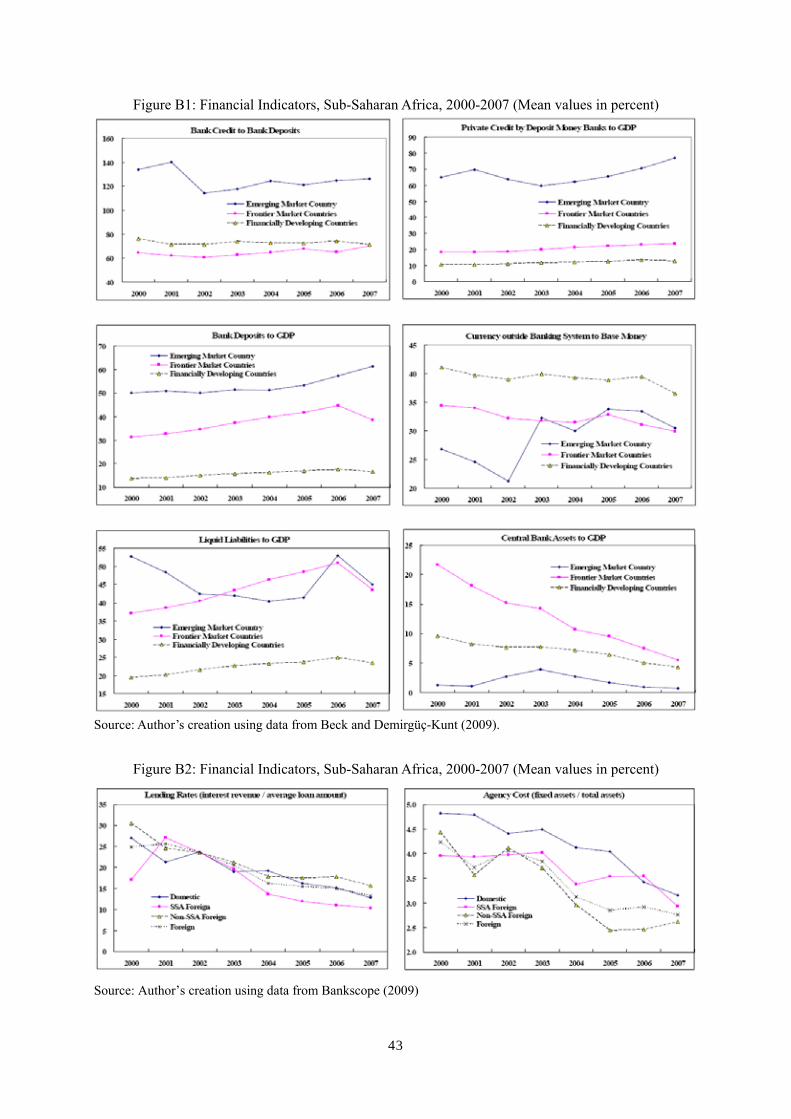
Note: ROAA is return on average assets. ROAE is return on average equity. With regard to the indicators of financial depth as shown in Figure B1 in Appendix, the liquid liabilities to GDP ratio presents that the frontier market countries had an upward trend during the 2000-2006 but it shows a big drop in 2007. The emerging market country also has a trend that its ratio has largely decreased during the 2000-2004 and this has jumped from 41.4 in 2005 to the 2000 level (almost 53.0 percent) in 2006. However, it has the similar trend to that of frontier market countries by representing a big drop of the ratio in 2007. In comparison with those ratios of the two groups, the financially developing countries had a considerably low ratio of liquid liabilities to GDP over time by showing around 20 percent. Both indicators of bank credit to bank deposits and private credit by deposit money banks to GDP show almost a similar trend over time. The emerging market country had very high ratios in both in comparison with those of other two groups, frontier market countries and financially developing countries during the sample period. These two ratios have slightly increased in the emerging and frontier markets for the 2006-2007. The ratio of bank deposit to GDP has a relatively increasing trend in the frontier market countries and financially developing countries during the 2000-2006. Nevertheless, those ratios have decreased in both groups in 2007. On the contrary, the ratio in the emerging market country shows the highest with a range of 50 to 60 percent and mostly stayed flat for the first five years. But it has moderately increased since 2004. In addition, this bank deposit to GDP ratio in the financially developing countries indicates considerably low values (from 13 to 17 percent) during the sample period. Currency outside banking system to base money used as an indicator of monetization of the economy, has been the highest in the financially developing countries, showing the figures within a range of 36 to 41 percent during the 2000-2007. Although the emerging market country had the very low ratio indicating 21 to 27 percent for the 2000-2002, the ratio has increased to the level of 32 to 35 percent since 2003. It is also the similar trend and level to that of the frontier market countries. In general,
8
low-income countries have the highest ratio of currency outside banking system to base money, while upper-middle income countries have the lowest ratio. In the case of Africa, since many informal sectors exist in low income countries, it contributes to the highest ratio of the indicator, in particular in financially developing countries. Moreover, all three groups had the similar trend of downward shift in the ratio in 2007 (Figure B1 in Appendix). The ratio of Loan loss provisions to net interest revenue is the highest in SSA foreign banks (Figures B3 to B4 in Appendix) in 2007. It implies that SSA foreign banks in the sample may have a more serious problem with underperforming loans in their balance sheets compared to domestic and Non-SSA foreign banks. In addition, lending rate3 features one of the African banking sector’s issues, representing high ratios within a range of 17 to 31 percent, on average in the 29 sample countries in 2000 (See Figure B2 in Appendix). This lending rate has largely decreased to a range of 10 to 18 percent in 2007, showing the decreasing trend over time. 3.2 Profitability Analysis This section first presents the data on the level of profitability of commercial banks by comparator group as well as by each case of bank ownership. As seen in Tables 2 to 3 and (Figure B3 in Appendix), each ratio of return on average assets (ROAA) and return on average equity (ROAE) varies by a comparator group. The two ratios are the highest in the financially developing countries over the period 2000-2003, while indicating the lowest ratios in the emerging market country except the year of 2000. However, that trend has changed since 2004. Especially, the ratios have decreased in the financially developing countries by representing the lowest among the three groups over the period 2005-2007. Yet, only the ratios of emerging market country have decreased during 2006-2007. Looking at the ratios of ROAA and ROAE by bank ownership, they have been moving erratically as shown in Figure B3. These ratios have on the whole the same trend in both domestic and Sub-Saharan African (SSA) foreign banks except that ROAE of domestic banks has decreased during the 2006-2007. Also, both ratios of Non-SSA foreign banks have the same trend by showing the upward shift and the highest figures among the three types of banks over the 2004-2007.
3 This is the commercial bank prime lending rate. Low interest rates contribute to lower cost of doing business and lower prices.

9
Table 2: Return on Average Assets (in percent), 2000-2007
2000 2001 2002 2003 2004 2005 2006 2007
Emerging Market Country 2.25 0.77 0.70 1.04 0.78 2.26 2.27 2.05
Frontier Market Countries 1.93 2.42 1.91 1.66 2.49 2.01 2.00 2.38
Financially Developing Countries 2.81 2.89 2.84 2.90 2.47 1.16 1.69 2.03
The rest of three comparator groups 1.42 1.37 1.24 1.80 1.61 1.67 1.69 1.67
2000 2001 2002 2003 2004 2005 2006 2007
Domestic 2.43 2.20 2.13 2.40 3.14 1.74 2.34 2.52
SSA Foreign 2.30 1.88 2.15 1.05 1.61 1.19 0.53 1.27
Non-SSA Foreign 1.89 3.06 1.96 2.07 1.69 2.03 2.44 2.62
Foreign 2.03 2.59 2.04 1.66 1.66 1.70 1.59 1.98
Source: Bankscope (2009) and author’s calculations.
Table 3: Return on Average Equity (in percent), 2000-2007
2000 2001 2002 2003 2004 2005 2006 2007
Emerging Market Country 13.40 -2.73 14.91 5.89 6.39 17.55 19.41 18.58
Frontier Market Countries 19.96 18.86 16.65 16.94 22.00 15.99 19.49 23.82
Financially Developing Countries 20.48 32.37 27.68 27.68 20.10 14.00 11.04 15.11
The rest of three comparator groups 16.55 14.75 12.98 14.00 17.12 16.86 5.81 -10.22
2000 2001 2002 2003 2004 2005 2006 2007
Domestic 22.54 21.24 16.04 19.91 21.13 16.55 18.52 17.28
SSA Foreign 13.63 12.35 27.20 13.60 18.37 7.07 4.91 16.35
Non-SSA Foreign 17.15 26.56 21.33 22.75 19.57 19.69 21.79 23.19
Foreign 15.92 20.95 23.67 19.07 19.10 14.62 14.23 19.96
Source: Bankscope (2009) and author’s calculations.
As shown in Table 4 and (Figures B3 to B4 in Appendix), net interest margin (NIM) which is a proxy
measure of banking efficiency, is relatively high in both financially developing and frontier market
countries during the 2000-2002. Particularly, the NIM ratio has shown the highest level while moving
erratically among the three groups over the period 2003-2007. The NIM ratio has slightly decreased in
the emerging and frontier market countries in 2007 from the previous year, however, it has increased
only in the financially developing countries in 2007 from the previous year. Then, looking at the NIM
ratio by bank ownership, the NIM has shown a similar trend in both SSA foreign and Non-SSA
foreign banks while having a decreasing trend over the period 2003-2005 and an increasing trend after
2005. But the NIM ratio has shown a different picture with a decreasing trend since 2004 (representing
the highest figure) in domestic banks and the lowest level among the three types of banks in 2007. In

10
general, higher levels of net interest margins indicate lower levels of bank efficiency, as there is a
higher wedge between lending and deposit interest rates. Poorer countries have typically higher net
interest margins (Beck and Demirgüç-Kunt, 2009). Thus, the findings of this study suggest that SSA
foreign and Non-SSA foreign banks have been less efficient since 2005. On the contrary, the domestic
banks have been more efficient since 2004.
Table 4: Net Interest Margin (in percent), 2000-2007
2000 2001 2002 2003 2004 2005 2006 2007
Emerging Market Country 6.56 6.62 6.65 5.90 6.00 6.87 7.82 7.57
Frontier Market Countries 8.80 9.20 8.99 8.20 8.11 7.60 7.58 7.39
Financially Developing Countries 9.09 9.02 9.32 12.17 12.38 9.22 9.06 10.67
The rest of three comparator groups 11.96 9.11 5.87 5.21 4.91 7.73 8.20 4.72
2000 2001 2002 2003 2004 2005 2006 2007
Domestic 9.35 9.68 9.36 9.39 10.38 8.53 8.33 7.22
SSA Foreign 7.92 8.09 8.22 9.17 7.73 7.20 7.75 9.24
Non-SSA Foreign 8.13 8.26 8.16 8.90 8.91 8.27 8.23 9.14
Foreign 8.05 8.19 8.18 9.01 8.46 7.85 8.02 9.19
Source: Bankscope (2009) and author’s calculations.
In addition to the NIM ratio, the bank overhead costs to GDP ratio is also a proxy measure of banking
efficiency. This ratio has shown with an erratic movement in the emerging market country during the
2000-2007 while remaining the lowest level except for that of 2000 (Figure B3 in Appendix). In the
frontier market countries, this ratio has shown a decreasing trend since 2001 and it has also shown a
similar trend in the financially developing countries since 2004. Nevertheless, the bank overhead costs
to GDP ratio of financially developing countries has remained the highest over the period 2004-2007.
It implies that commercial banks still show lower level of efficiency in the financially developing
countries despite its decreasing trend.
11
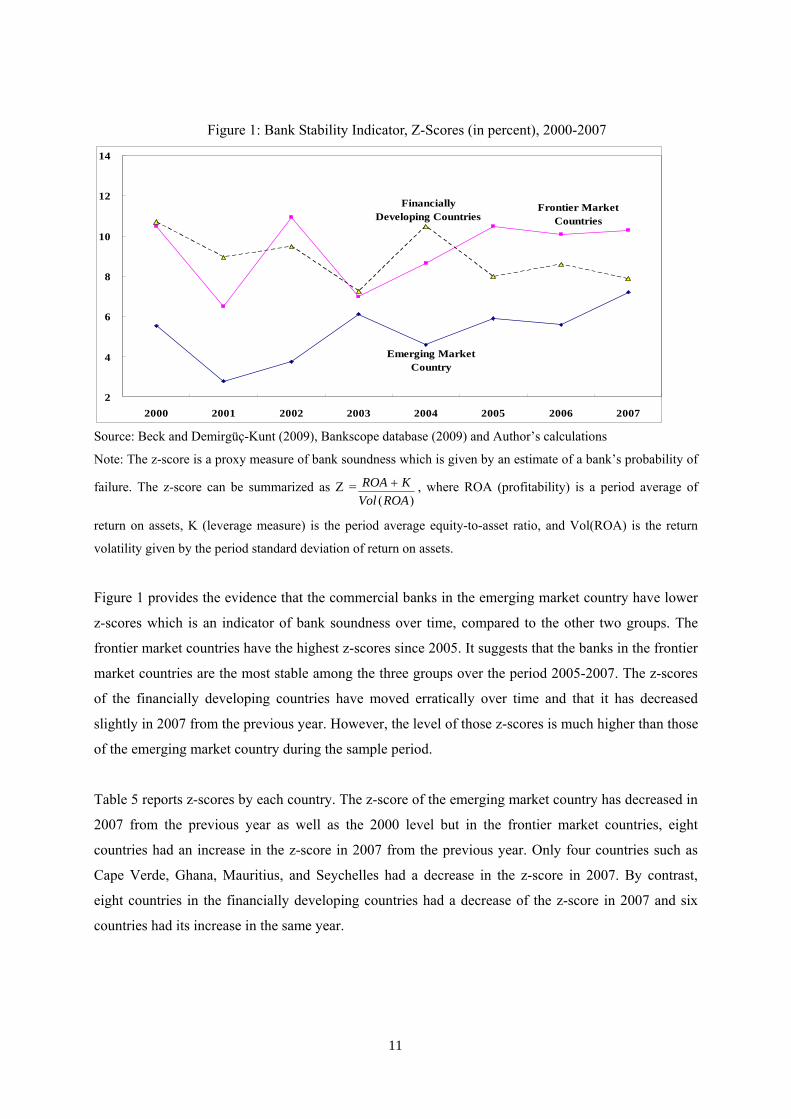
Figure 1: Bank Stability Indicator, Z-Scores (in percent), 2000-2007
Emerging MarketCountry
Frontier MarketCountries
FinanciallyDeveloping Countries
2
4
6
8
10
12
14
2000 2001 2002 2003 2004 2005 2006 2007 Source: Beck and Demirgüç-Kunt (2009), Bankscope database (2009) and Author’s calculations
Note: The z-score is a proxy measure of bank soundness which is given by an estimate of a bank’s probability of
failure. The z-score can be summarized as Z =)(ROAVol
KROA + , where ROA (profitability) is a period average of
return on assets, K (leverage measure) is the period average equity-to-asset ratio, and Vol(ROA) is the return
volatility given by the period standard deviation of return on assets.
Figure 1 provides the evidence that the commercial banks in the emerging market country have lower
z-scores which is an indicator of bank soundness over time, compared to the other two groups. The
frontier market countries have the highest z-scores since 2005. It suggests that the banks in the frontier
market countries are the most stable among the three groups over the period 2005-2007. The z-scores
of the financially developing countries have moved erratically over time and that it has decreased
slightly in 2007 from the previous year. However, the level of those z-scores is much higher than those
of the emerging market country during the sample period.
Table 5 reports z-scores by each country. The z-score of the emerging market country has decreased in
2007 from the previous year as well as the 2000 level but in the frontier market countries, eight
countries had an increase in the z-score in 2007 from the previous year. Only four countries such as
Cape Verde, Ghana, Mauritius, and Seychelles had a decrease in the z-score in 2007. By contrast,
eight countries in the financially developing countries had a decrease of the z-score in 2007 and six
countries had its increase in the same year.

12
Table 5: Z score, 2000-2007
Source: Beck and Demirgüç-Kunt (2009), Bankscope database (2009) and Author’s calculations.
Note: ¹This column denotes the increasing or decreasing trend of z-score in 2007 in comparison with that of 2006.
Blank is Not Available.
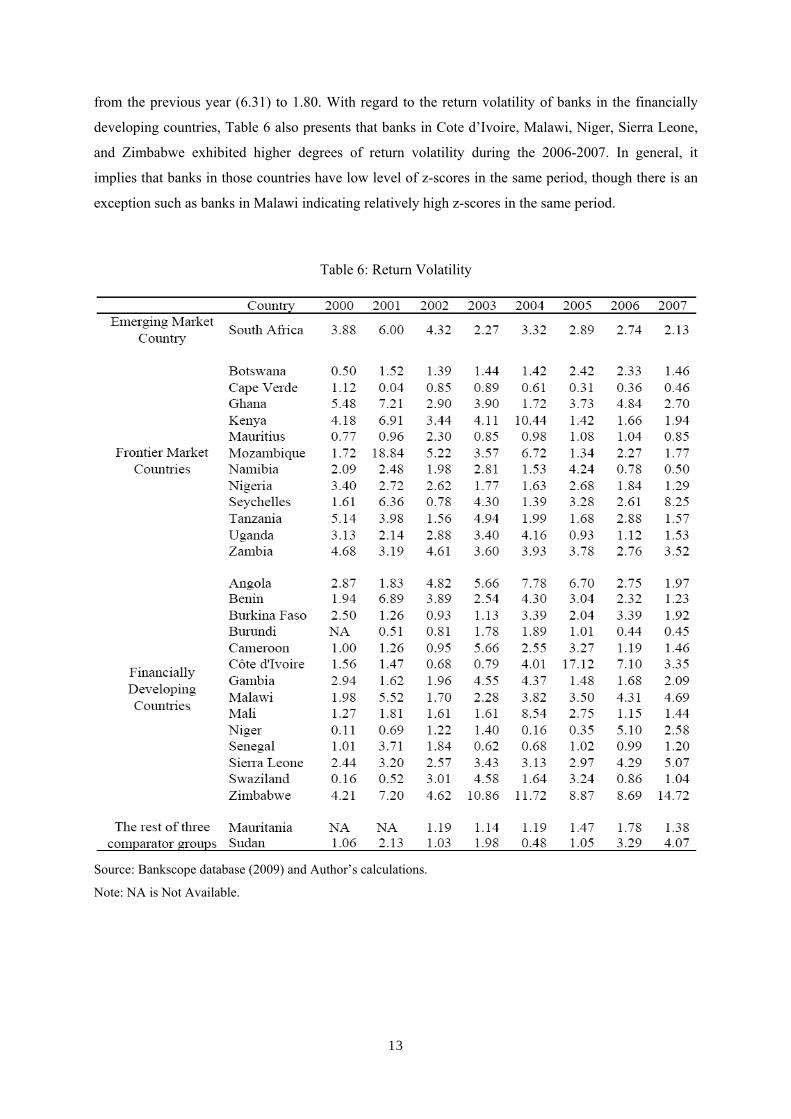
In terms of the return volatility4 shown in Table 6, banks in Seychelles and Zambia have shown
relatively high return volatility representing 8.25 and 3.52 in 2007, respectively. Zambian banks show
higher return volatility in some previous years than that of 2007. It implies that banks in Zambia
exhibited higher degrees of risk taking. Also, banks in Seychelles exhibited a considerably high degree
of return volatility in 2007. Thereby, it contributed to a large drop of bank soundness (z-score) in 2007
4 The Z-index increases with profitability and equity capital as percent of assets, and decreases with return volatility. Thus, a larger value of the Z-index indicates a lower risk profile for a bank (De Nicolo et al., 2003).
13
from the previous year (6.31) to 1.80. With regard to the return volatility of banks in the financially
developing countries, Table 6 also presents that banks in Cote d’Ivoire, Malawi, Niger, Sierra Leone,
and Zimbabwe exhibited higher degrees of return volatility during the 2006-2007. In general, it
implies that banks in those countries have low level of z-scores in the same period, though there is an
exception such as banks in Malawi indicating relatively high z-scores in the same period.
Table 6: Return Volatility
Source: Bankscope database (2009) and Author’s calculations.
Note: NA is Not Available.

14
4. Empirical Model and Data 4.1 Methods to Estimate Cost Inefficiency and Profit Efficiency
4.1.1 Parametric versus Non-Parametric In the literature dealing with the efficiency study, two major concepts are frequently used for
measuring this frontier function: non parametric and parametric approaches. The non parametric
approach known under the name of DEA method (Data Envelopment Analysis)5 consists in estimating
the frontier by using non-parametric mathematical linear programming. The method offers the
advantage of simple application and restrictive assumptions are not required in advance with regard to
the functional form. Its main disadvantage lies in the fact that this technique is unable to decompose
the deviations of certain banks from the efficient production frontier into components: inefficiency and
random error parts. The deviation as a whole is considered as inefficiency, irrespective of whether it
derives from inefficient operation or exogenous effects independent of management. An additional
problem is that the method disregards prices. The procedure rather focuses on measuring technological
efficiency, based on technological and not economic optimization.
The parametric methods are considered to be more sophisticated compared to non-parametric
techniques, whereby the estimation of efficiency is based on economic optimization, given the
underlying assumption of a stochastic optimal frontier. The parametric techniques mostly frequently
used include the Stochastic Frontier Approach (SFA)6 and the Distribution Free Approach (DFA)7.
Parametric methods allow for incorporating both input allocative and technical efficiencies. The SFA
decomposes random error terms and the production unit inefficiency and takes into account the
existence of exogenous shocks.
Given that in transition economies the quality of banking data is not perfect and measurement errors
5 DEA is a non-parametric method for calculating relative efficiency scores in a multi input-output production environment. It measures the performance of all decision-making units compared to the generated efficient frontier. Best-practice banks, which constructs the DEA frontier, produce given output combinations with the lowest level of inputs or achieve the highest level of output with a given level of inputs, i.e. operates with an optimal input-output combination. Firms, which do not operate on the optimal frontier, suffer a certain level of efficiency loss. 6 The SFA was independently developed by Aigner et al. (1977) and Meeusen and van den Broeck (1977). 7 Another parametric but more rarely used technique is the so called thick frontier approach (TFA). This approach divided banks into four quartiles regarding their average cost or profit. Then the cost or profit curve is estimated separately for all groups of the banks. The estimated cost/profit function for banks in the smallest/largest average cost/profit quartile is interpreted as the cost/profit efficient frontier. A disadvantage of the TFA is that the result is very sensitive to the selection on the number of quantiles. In addition econometric problems may arise since the banks are pre-sorted using average cost or profit, which are essentially dependent variables.

15
are quite widespread, Fries and Taci (2005) argue that parametric methods, which are more robust to
data problems, would constitute more suitable empirical tools for analyzing banking efficiency8. This
study employs the stochastic frontiers based on a composed error model, which are considered
superior to non-parametric frontiers in measuring efficiency and that enable us to distinguish between
inefficiency and other exogenous shocks.
4.1.2 Concept of Profit Efficiency and Cost Inefficiency
Profit efficiency is the ratio of predicted actual profit to predicted maximum profit, which could be
earned if a bank was as efficient as the best practice bank after adjusting for random error. Profit
efficiency is ability to achieve maximum profits for a given set of output and the estimated values in
logarithm are bounded between 0 and 1. The higher the profit efficiency score is, the more profit
efficient the bank will be. If the score is 1, it means the most profit efficient bank.
Cost inefficiency measures the change in a bank’s variable cost adjusted for random error, relative to
the estimated cost needed to produce an output bundle as efficiently as the best-practice bank in a
sample facing the same exogenous variables, which include variable input prices, variable output
quantities and fixed netputs (inputs and outputs). It arises due to technical inefficiency, which results in
the use of an excess or sub-optimal mix of inputs given input prices and output quantities. The value of
cost inefficiency can be equal to or greater than one. It is equal to one for the best-practice commercial
bank within the given sample. If it is greater than one, then the bank is thought of wasting a certain
proportion of its resources relative to a best practice bank facing the same condition. Thus, the higher
value of cost inefficiency is, the greater the inefficiency is. For example, a value of 1.17 implies that a
bank has costs that are 17 percent above minimum defined by the frontier. It also means that 17
percent of its costs are wasted relative to the “best-practice” commercial bank producing the same
output and facing the same conditions.
4.2 Stochastic Frontier Analysis
4.2.1 Estimating Cost Inefficiency
To estimate the cost and alternative profit frontier functions, a transcendental logarithmic functional
form is selected. This functional form is widely used because it is a flexible functional form. The study
uses the translog stochastic frontier functions by Battese and Coelli (1995) and the software, Front 4.1,
which was produced by Coelli (1995). According to this approach, the estimation of banks’ relative
efficiency using panel data is obtained by estimating a cost function of the general form:
8 Nevertheless, there is no consensus among the researchers on the efficiency concept, functional form, and estimation technique that yield the most accurate efficiency measure.

16
istY =β istX + istV + istU (1)
where istY is total cost in logarithm form of bank i in country s in period t; istX is a matrix of
outputs, inputs, netputs and the set of relevant independent variables in logarithm form; β is an
vector of unknown parameters; istV is a random error term assumed to follow a symmetric normal
distribution ( iV ~idd 2,0( εσN ) ) and istU is the value of inefficiency to extract and is determined by
a set of environmental variables Z.
This paper employs the full-form of cost function which is expressed as follows:
itTCln = 0α +∑i
iα itWln +∑i
iβ itQln +21 ∑∑
i jijα jtitWWln +
21 ∑∑
i jijβ jtit QQ lnln +∑∑
i jijγ jtit QW lnln +∑
iiδ itZln +
21 ∑∑
i jijδ jtit ZZ lnln
+∑∑i j
ijη jtit QZ lnln +∑i
ijφ itZln jtWln + itit UV + (2)
where iTC 9is defined as the total cost; iW is a vector of input prices; iQ is a vector of variable
outputs; and iZ is a vector of fixed netputs. These two models of (1) and (2) are simultaneously
estimated by using maximum likelihood estimation; the methodology was advanced by Battese and
Coelli (1995). The unknown parameters such as α , β , γ , δ , η , and φ are estimated.
4.2.2 Estimating Profit Efficiency
To estimate profit efficiency of banks, the study uses the translog stochastic frontier profit function by
Battese and Coelli (1995) and the software, Front 4.1, which was produced by Coelli (1995).
According to this approach, the estimation of banks’ relative efficiency using panel data is obtained by
estimating a profit function of the general form:
istY =β istX + istV - istU (3)
where istY is total profit in logarithm form of bank i in country s in period t; istX is a matrix of
outputs, inputs, netputs and the set of relevant independent variables in logarithm form; β is an
vector of unknown parameters; istV is a random error term assumed to follow a symmetric normal
9 Total cost consists of loan loss provisions, interest expense, and overheads comprising personnel expenses and other operating expenses. However, in some banks the total cost is interest expense and overheads.
17
distribution ( iV ~idd 2,0( εσN ) ) and istU is the value of inefficiency to extract and is determined by
a set of environmental variables Z.
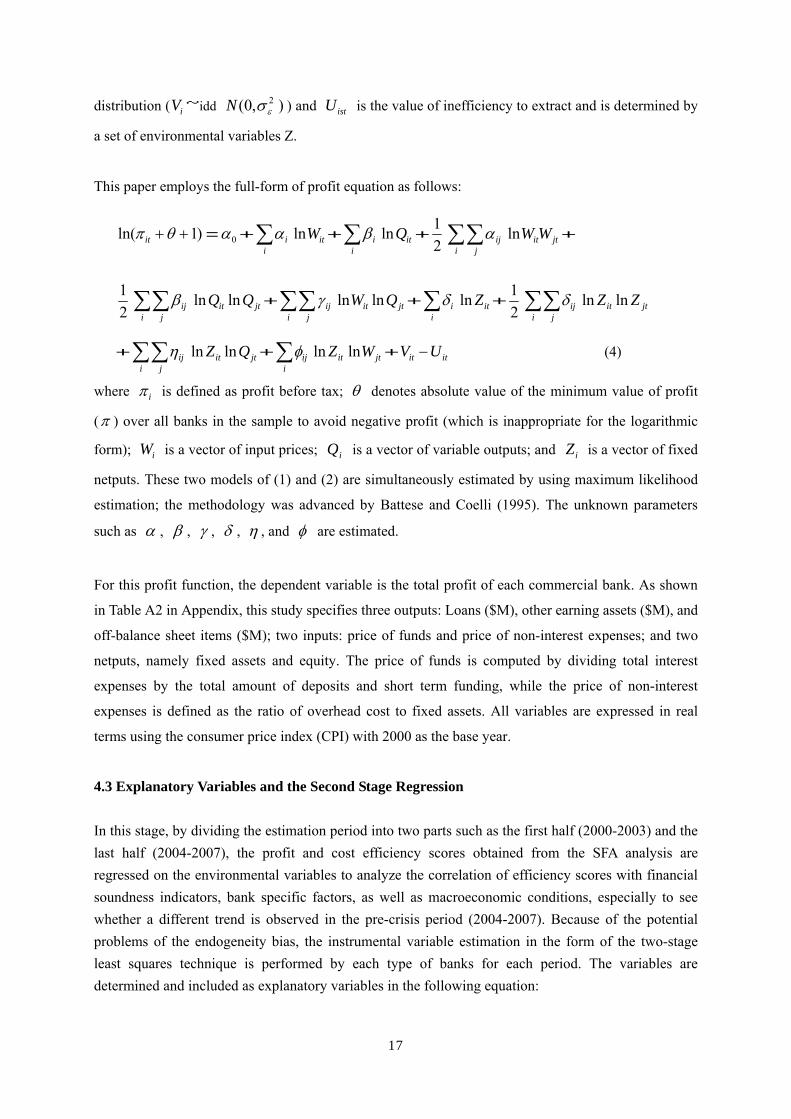
This paper employs the full-form of profit equation as follows:
)1ln( ++θπ it = 0α +∑i
iα itWln +∑i
iβ itQln +21 ∑∑
i jijα jtitWWln +
21 ∑∑
i jijβ jtit QQ lnln +∑∑
i jijγ jtit QW lnln +∑
iiδ itZln +
21 ∑∑
i jijδ jtit ZZ lnln
+∑∑i j
ijη jtit QZ lnln +∑i
ijφ itZln jtWln + itit UV − (4)
where iπ is defined as profit before tax; θ denotes absolute value of the minimum value of profit
(π ) over all banks in the sample to avoid negative profit (which is inappropriate for the logarithmic
form); iW is a vector of input prices; iQ is a vector of variable outputs; and iZ is a vector of fixed
netputs. These two models of (1) and (2) are simultaneously estimated by using maximum likelihood
estimation; the methodology was advanced by Battese and Coelli (1995). The unknown parameters
such as α , β , γ , δ , η , and φ are estimated.
For this profit function, the dependent variable is the total profit of each commercial bank. As shown
in Table A2 in Appendix, this study specifies three outputs: Loans ($M), other earning assets ($M), and
off-balance sheet items ($M); two inputs: price of funds and price of non-interest expenses; and two
netputs, namely fixed assets and equity. The price of funds is computed by dividing total interest
expenses by the total amount of deposits and short term funding, while the price of non-interest
expenses is defined as the ratio of overhead cost to fixed assets. All variables are expressed in real
terms using the consumer price index (CPI) with 2000 as the base year.
4.3 Explanatory Variables and the Second Stage Regression In this stage, by dividing the estimation period into two parts such as the first half (2000-2003) and the last half (2004-2007), the profit and cost efficiency scores obtained from the SFA analysis are regressed on the environmental variables to analyze the correlation of efficiency scores with financial soundness indicators, bank specific factors, as well as macroeconomic conditions, especially to see whether a different trend is observed in the pre-crisis period (2004-2007). Because of the potential problems of the endogeneity bias, the instrumental variable estimation in the form of the two-stage least squares technique is performed by each type of banks for each period. The variables are determined and included as explanatory variables in the following equation:

18
EFF ti, = 0η +η 1 B ti, +η 2 M ti, +ε ti,
where EFF ti, is the bank level cost and profit efficiency score from the SFA analysis for bank i at
time t; B ti, includes factors that are more specific to individual banks and financial indicators; M ti, is
a vector of time-varying macroeconomic variables; and ε ti, is the residual. Dependent variables are
cost efficiency and profit efficiency. Independent variables are 13 in total and the number of bank variables including financial accounting ratios is 10, namely ROAA is return on average assets; ROAE is return on average equity; CTIR is cost to income ratio; EQTA is equity to total assets; EQNL is equity to net loans; NLTA is net loans to total assets; LLPNIR is Loan Loss Provision to Net Interest Revenue; and OUTBASE is currency outside of banking system to base money. IRS10 is interest rate spreads (lending minus deposit spreads); and ZS is z-score, a banking soundness indicator. The variables as economic conditions and financial depth are the following; PG is real GDP per capita growth rate in period t; INFL is inflation rate in period t; and CRPRIV is domestic credit to private sector (% of GDP). 4.4 Data Descriptions An unbalanced and comprehensive bank-level panel dataset was used with covering 29 sub-Saharan
African countries during 2000-2007 by obtaining from the Bankscope database. Macro data come
from the International Financial Statistics and World Development Indicators. The bank level data
used are mostly consolidated data from commercial banks. However, unconsolidated data are
employed depending on the availability of either consolidated data or unconsolidated ones. The
number of observations and banks are 1200 and 231, respectively. A foreign bank is defined to have at
least 50% foreign ownership11. Outliers in data such as extremely huge figures (e.g. Zimbabwe’s 2007
bank level data, which affected due to a hyperinflation rate and inflationary distortions), unclassified
banks’ data (due to the limitation of ownership information available) and negative equity values were
excluded.
Using the Bankscope database has two major advantages. First, the coverage is fairly comprehensive,
with sampled banks accounting for about 90 percent of total assets in each country, according to the
source. Second, the accounting information at the bank level is presented in standardized form, after
10 IRS is measured as the difference between the average interest rate earned on loans and the average interest rate paid on deposits for individual commercial banks obtained from Bankscope, the so-called, an ex ante approach, as Sologoub (2006) mentions that it is ideal. On the other hand, Demirguc-Kunt and Huizinga (1998) chose to use an ex post proxy for which individual bank data are widely available, that is, the net interest margin (NIM). 11 However, the ownership information provided by Bankscope has been shown to be inaccurate in many cases (Beck and Demirgüç-Kunt, 2009).

19
making adjustments for differences in accounting and reporting standards across countries. On the
other hand, the data has some limitations. First, there is a sample-selection bias in favor of large banks
which weakens somewhat its usefulness, as small banks may tend to be more financially constrained
than large banks. Second, the data do not provide a breakdown of loan portfolios by sectors or by
borrower types, precluding the use of controls for bank-specific changes in loan demand. Third, the
data do not provide information on the currency composition of loans and deposits, which could be a
potentially useful source of cross-sectional variation in the open economy context (Arena, Reinhart,
and Vázquez, 2006).
5. Empirical Results 5.1 Result Interpretations
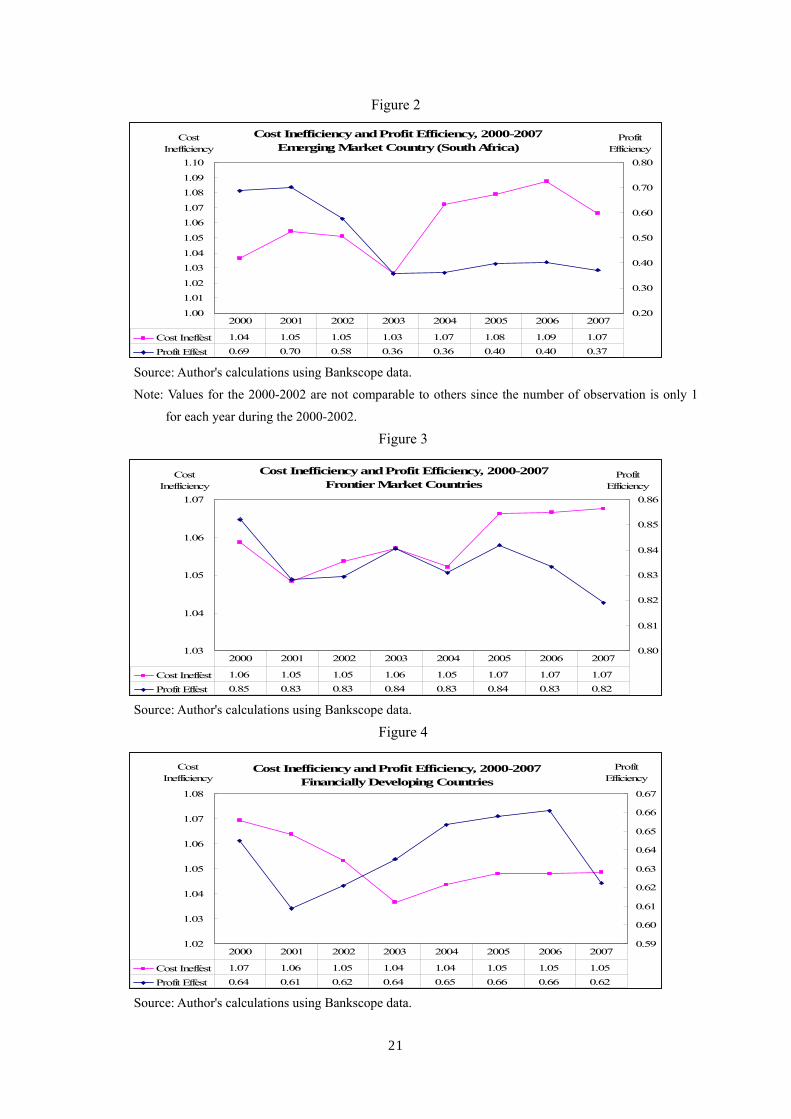
5.1.1 Efficiency by Comparator Group, Bank Ownership, and Country Table 7 regarding the average profit efficiency during 2000-2007 reveals that banks in the frontier market countries are the most profit efficient representing 0.83 among the comparator groups except the rest of the three comparator groups. The banks in the financially developing countries are more profit efficient (representing 0.64) than those (0.48) of the emerging market country. It suggests that most of the banks are the least profit efficient in the emerging market country, namely South Africa despite the fact that most of the large banks whose total assets are more than 1 billion in USD operate in that country. On the whole, the banks in all three groups tend to be less profit efficient during the 2006-2007. As seen in Table 7 and Figures 3 to 5, the banks of three comparator groups have almost the same average cost inefficiency during the sample period, representing 1.05 to 1.06. The cost inefficiency of banks in the emerging market country had a decreasing trend for the 2001-2003 but it has been moving upward until 2006. Then, it has dropped from 1.09 to 1.07 for the 2006-2007, implying that the banks have become more cost efficient in 2007. The average cost inefficiency of banks in the frontier market countries has shown an erratic movement over time. The banks’ average cost inefficiency of the financially developing countries shows a decreasing trend for the 2000-2003 and it depicts a moderate upward shit after 2003. The common trend of the banks’ cost inefficiency in both frontier market and financially developing countries was the same, while staying flat for the 2005-2007.

20
Table 7: Mean cost inefficiency and profit efficiency by comparator group and ownership, 2000-2007
Source: Author's calculation using data from Bankscope (2008 and 2009)
Note: Total number of banks is 231.
21
Figure 2
Source: Author's calculations using Bankscope data.
Note: Values for the 2000-2002 are not comparable to others since the number of observation is only 1
for each year during the 2000-2002. Figure 3
Source: Author's calculations using Bankscope data.
Figure 4
Source: Author's calculations using Bankscope data.
1.00
1.01
1.02
1.03
1.04
1.05
1.06
1.07
1.08
1.09
1.10
0.20
0.30
0.40
0.50
0.60
0.70
0.80
Cost Ineffest 1.04 1.05 1.05 1.03 1.07 1.08 1.09 1.07
Profit Effest 0.69 0.70 0.58 0.36 0.36 0.40 0.40 0.37
2000 2001 2002 2003 2004 2005 2006 2007
Cost Inefficiency and Profit Efficiency, 2000-2007Emerging Market Country (South Africa)
CostInefficiency
ProfitEfficiency
1.03
1.04
1.05
1.06
1.07
0.80
0.81
0.82
0.83
0.84
0.85
0.86
Cost Ineffest 1.06 1.05 1.05 1.06 1.05 1.07 1.07 1.07
Profit Effest 0.85 0.83 0.83 0.84 0.83 0.84 0.83 0.82
2000 2001 2002 2003 2004 2005 2006 2007
Cost Inefficiency and Profit Efficiency, 2000-2007Frontier Market Countries
ProfitEfficiency
CostInefficiency
1.02
1.03
1.04
1.05
1.06
1.07
1.08
0.59
0.60
0.61
0.62
0.63
0.64
0.65
0.66
0.67
Cost Ineffest 1.07 1.06 1.05 1.04 1.04 1.05 1.05 1.05
Profit Effest 0.64 0.61 0.62 0.64 0.65 0.66 0.66 0.62
2000 2001 2002 2003 2004 2005 2006 2007
Cost Inefficiency and Profit Efficiency, 2000-2007Financially Developing Countries
ProfitEfficiency
CostInefficiency
22
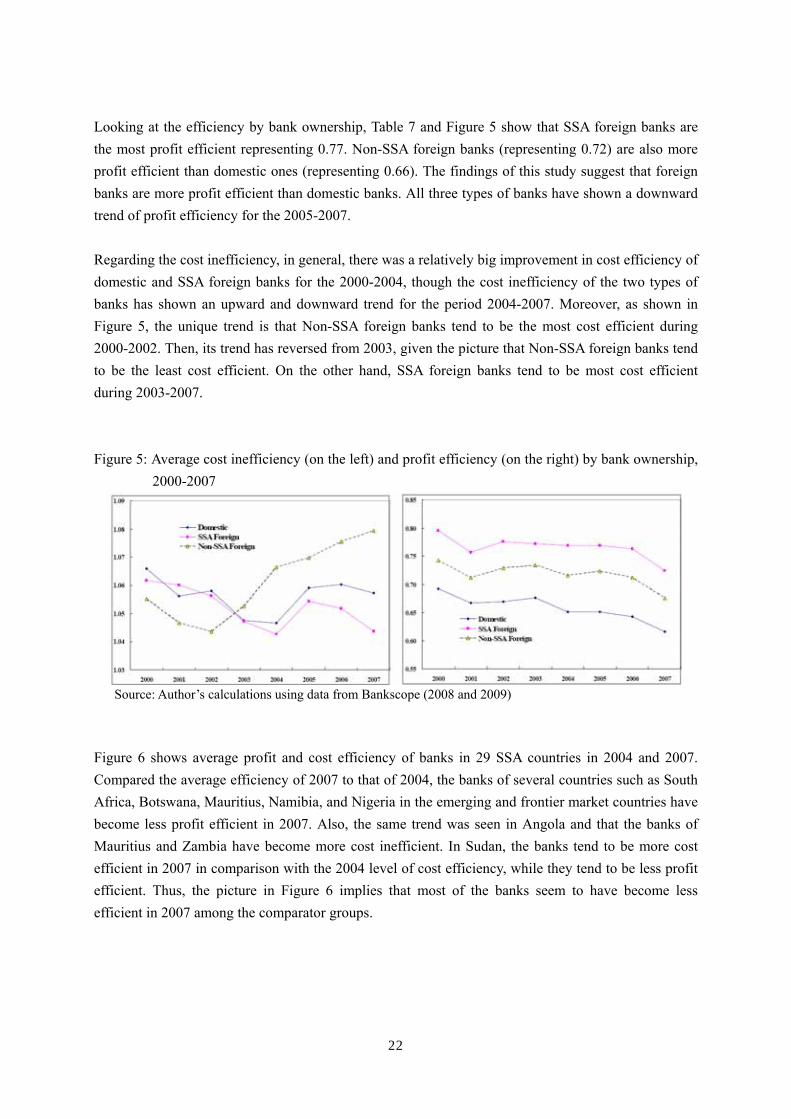
Looking at the efficiency by bank ownership, Table 7 and Figure 5 show that SSA foreign banks are the most profit efficient representing 0.77. Non-SSA foreign banks (representing 0.72) are also more profit efficient than domestic ones (representing 0.66). The findings of this study suggest that foreign banks are more profit efficient than domestic banks. All three types of banks have shown a downward trend of profit efficiency for the 2005-2007. Regarding the cost inefficiency, in general, there was a relatively big improvement in cost efficiency of domestic and SSA foreign banks for the 2000-2004, though the cost inefficiency of the two types of banks has shown an upward and downward trend for the period 2004-2007. Moreover, as shown in Figure 5, the unique trend is that Non-SSA foreign banks tend to be the most cost efficient during 2000-2002. Then, its trend has reversed from 2003, given the picture that Non-SSA foreign banks tend to be the least cost efficient. On the other hand, SSA foreign banks tend to be most cost efficient during 2003-2007. Figure 5: Average cost inefficiency (on the left) and profit efficiency (on the right) by bank ownership,
2000-2007
Source: Author’s calculations using data from Bankscope (2008 and 2009)
Figure 6 shows average profit and cost efficiency of banks in 29 SSA countries in 2004 and 2007. Compared the average efficiency of 2007 to that of 2004, the banks of several countries such as South Africa, Botswana, Mauritius, Namibia, and Nigeria in the emerging and frontier market countries have become less profit efficient in 2007. Also, the same trend was seen in Angola and that the banks of Mauritius and Zambia have become more cost inefficient. In Sudan, the banks tend to be more cost efficient in 2007 in comparison with the 2004 level of cost efficiency, while they tend to be less profit efficient. Thus, the picture in Figure 6 implies that most of the banks seem to have become less efficient in 2007 among the comparator groups.

23
Figure 6: Average profit and cost efficiency of banks in 29 SSA countries, 2004 and 2007
AGO
BEN
BWA
BFABDI
CMRCPV
CIV
GMB
GHAKEN
MWI
MLI
MUS
MOZ
NAM
NER
NGA
SEN
SYC
SLE
ZAF
SDN
SWZ
TZAUGA
ZMB
ZWE
AGOBEN
BWA
BFABDI
CMRCPV
CIV
GMB
GHA
KEN
MWI
MLIMRT
MUS MOZ
NAM
NER
NGA
SEN
SYCSLE
ZAF
SDN SWZ
TZA
UGA
ZMB
.4
.5
.6
.7
.8
.9A
vera
ge P
rofit
Effi
cien
cy
.7 .8 .9 1Average Cost Efficiency
2004 2007
Source: Author’s calculations using data from Bankscope (2009)
5.2 Correlation of Efficiency Scores with Environmental Variables (Financial, bank-level, and
economic indicators) The regression results in Table B1 in Appendix show that the capital ratios such as equity to total
assets (EQTA) and equity to net loans (EQNL) have a negative and statistically significant
relationships with the profit efficiency of domestic banks in the pre-crisis period (2003-2007) but do
not show a statistical significance in the first-half period (2000-2003). The liquidity ratio, the net loans
to total assets (NLTA) have a positive and statistically significant relationship with profit efficiency of
domestic banks only in the period 2000-2003. Interest rate spreads (IRS) has a negative and
statistically significant link with profit efficiency of domestic banks only in the pre-crisis period
(2004-2007). It implies that the lower the IRS of domestic banks is, the domestic banks will be more
efficient.
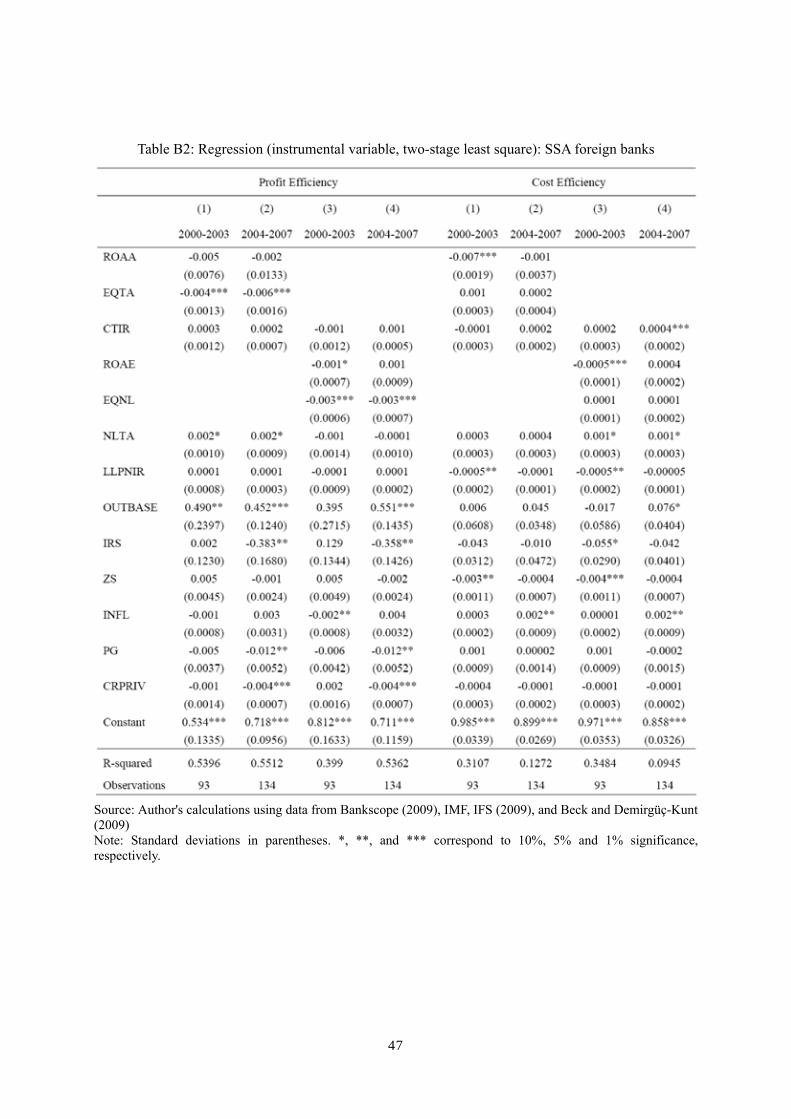
With regard to the SSA foreign banks, there appears to be a negative and statistically significant link
between the capital ratios (EQTA and EQNL) and profit efficiency over the whole period. Also, the
profit efficiency of SSA foreign banks has a negative and statistically significant relationship with the
real GDP per capita growth rate (PG) and domestic credit to private sector, % of GDP (CRPRIV) over
the 2004-2007 period, suggesting that the improving profit efficiency of SSA foreign banks does not
contribute to the increase of PG and CRPRIV during the pre-crisis period. Especially, regarding
CRPRIV the same trend was observed for other two types of banks in the same period, implying that
24
the improving profit efficiency does not lead to the increase of domestic credit to private sector in the
pre-crisis period.
In the case of Non-SSA foreign banks shown in Table B3 in Appendix, the regression results show a
different trend on linkage between profit efficiency and some financial indicators over the two periods.
That is, it was observed that the profit efficiency has a positive and statistically significant link with
three variables such as the return on the average equity (ROAE), equity to net loans (EQNL) and net
loans to total assets (NLTA) during the 2000-2003, whereas the opposite trend of these relationships
was observed in the pre-crisis period indicating that the profit efficiency has a negative and statistically
significant link with ROAE, EQNL and NLTA. It implies that in the pre-crisis period, the improving
profit efficiency leads to the decrease of ROAE, EQNL and NLTA. Yet, the profit efficiency has a
negative and statistically significant relationship with the interest rate spreads (IRS) for the 2000-2003.
On the contrary, it has shown a positive and statistical significance in regard to the link with IRS in the
pre-crisis period (2004-2007). Thus, it is also likely to imply that these findings could be some
unfavorable factors posing risks that the African banking sector may be exposed to contagion effects
from the global crisis, in particular for the foreign banks in Africa which own foreign subsidiaries from
parent banks in Europe and the US.
Turning to the cost efficiency, the remarkable trend regarding the results was not shown but cost
efficiency of domestic banks has a positive and statistically significant relationship with the cost to
income ratio (CTIR), used as a proxy of bank performance over the whole period (2000-2007). It
implies that the higher the CTIR is, the domestic banks will be more cost efficient. However, normally,
a higher CTIR ratio is expected to impact performance negatively because efficient banks are expected
to operate at lower costs.
In the case of SSA foreign banks, there is a positive and statistically significant link between cost
efficiency and net loans to total assets (NLTA) over the whole period, implying that improving cost
efficiency contributes to the increase of net loans to total assets even in the crisis period. Non-SSA
foreign banks have shown a positive and statistically significant association between cost efficiency
and interest rate spreads (IRS) over the whole period and that the cost efficiency appears to have a
consistently positive and significant linkage with the return on the average equity (ROAE), cost to
income ratio (CTIR) and NLTA.
5. Conclusions and Policy Implications This paper has tried to analyze the efficiency and profitability of commercial banks in 29 Sub-Saharan
African countries during 2000-2007. It especially examined as to whether the African banking sector
may be exposed to contagion effects of the financial crisis while investigating not only banks’
25
efficiency but also banking system in Africa.
In terms of the assessment of bank performance and profitability as well as the African banking system,
commercial banks in SSA so far remain largely sound and do not pose the risks that may be exposed to
contagion effects of the current financial crisis. But there appears to be a few things which may be
necessary to be careful, as the findings (in Figure B4) suggest that regarding the capital ratios such as
EQTA and EQNL, Non-SSA foreign banks have an increasing trend for the 2006-2007, implying that
the higher EQTA and EQNL are, the Non-SSA foreign banks will tend to be less profit efficient. In
addition, SSA foreign and Non-SSA foreign banks tend to have an increasing trend of net interest
margin ratio which will make banks less profit efficient.
Moreover, the regression results report that the profit efficiency of Non-SSA foreign banks has a
negative and statistically significant relationship with three variables such as the return on the average
equity (ROAE), equity to net loans (EQNL) and net loans to total assets (NLTA) during the pre-crisis
period (2004-2007). Also, the positive and statistically significant relationship with interest rate
spreads (IRS) was observed in the same period, whereas the signs of both relationships were opposite
for the 2000-2003 with statistical significance. These different results obtained over the two periods,
may be unfavorable factors implying that the African banking sector may be exposed to contagion
risks. For example, banking systems may be increasingly exposed to market volatility in countries
where high equity returns had led to borrowing for investment in the stock market (e.g., Kenya,
Nigeria, and Uganda). In fact, these countries reveal low return volatility and high z-scores (Tables 5
to 6). However, the return on average equity ratio in these frontier market countries indicates the
highest for the 2006-2007, representing an increasing trend from 2005 (Figure B3 in Appendix). The
ROAE ratio of Non-SSA foreign banks is the highest as well (Figure B4 in Appendix).
Furthermore, there may be contagion risks from distressed foreign parent banks to local subsidiaries
within Sub-Saharan Africa because parent banks could withdraw capital from African subsidiaries;
call in loans to their African subsidiaries; no longer invest local profits in local subsidiaries; or do a
combination of these. Also, there exists a risk that governments engage in troubled banks that are
non-systemic or that supervisory authorities loosen prudential regulations in response to the crisis.
Thus, the financial sector, particularly banks need to be monitored vigilantly in order to minimize
vulnerabilities and mitigate risks.

26
References
1. Abiodun O. Folawewo and David Tennant (2008), “Determinants of Interest Rate Spreads in
Sub-Saharan African Countries: A Dynamic Panel Analysis”, A paper prepared for the 13th Annual African Econometrics Society Conference, 9 – 11 July, 2008, Pretoria, Republic of South Africa.
2. Aigner, D., Lovell, C.A. K., and Schmidt, P. (1977), “Formulation and Estimation of Stochastic
Frontier Production Function Models”, Journal of Econometrics 6, 21-37. 3. Allen N. Berger and Loretta J. Mester (1997), “Inside the Black Box: What Explains Differences
in the Efficiencies of Financial Institutions?”, the Working Paper Series, Wharton School Center for Financial Institutions, University of Pennsylvania.
4. Barth, J, G Caprio and R Levine (2001), “Bank regulation and supervision: what works best?”
World Bank Policy Research Working Paper No 2775, August. 5. Barth, J, G Caprio and R Levine (2008), “Bank Regulations Are Changing: For Better or Worse?”,
World Bank Policy Research Working Paper 4646. 6. Battese, G. and Coelli, T. (1995). “A model for technical inefficiency effects in a stochastic
frontier production function for panel data”, Empirical Economics, 20, 325-332. 7. Beck , T. and Demirgüç-Kunt, A (2009), “Financial Institutions and Markets across Countries and
over Time - Data and Analysis”, Washington, DC: World Bank. 8. Beck, T., M. Fuchs, and M. Uy (2009), “Finance in Africa: Achievements and Challenges.”,
World Bank Policy Research Working Paper 5020. 9. Bos, J.W.B., and C.J.M. Kool (2004), “Bank Efficiency the Role of Bank Strategy and Local
Market Conditions”, DNB Working Papers 002, Netherlands Central Bank, Research Department. 10. Bos, J.W.B. and Schmiedel. H (2003), “Comparing Efficiency in European Banking: A Meta
Frontier Approach”, Research Series Supervision no. 57, De Nederlandsche Bank. 11. Brownbridge, M. and Harvey, C.(1998), "Financial Liberalization in Difficult Circumstances", in
Brownbridge, M. and Harvey, C. (eds.) Banking in Africa. Oxford: Africa World Press, Inc, 1998. 12. BUREU VAN DIJK (2008, 2009), Bankscope Database. 13. Claessens, Stijn, Asli Demirgüç-Kunt, and Harry Huizinga (2000), “The Role of Foreign Banks in
Domestic Banking Systems.” In Stijn Claessens and Marion Jansen, Eds., The

27
Internationalization of Financial Services: Issues and Lessons for Developing Countries. Boston, Mass.: Kluwer Academic Press.
14. Claessens, Stijn, A Demirgüc-Kunt and H Huizinga (2001), “How does foreign entry affect
domestic banking markets?”, Journal of Banking and Finance 25, pp 891-911. 15. Claessens, Stijn, and Jong-Kun Lee. 2002. " Foreign Banks in Low-Income Countries: Recent
Developments and Impacts”, World Bank. 16. Coelli, T. (1996). A computer program for stochastic frontier production and cost function
estimation, Working Paper 96/07, Centre for Efficiency and Productivity Analysis (CEPA). 17. Coelli, T, D.S. Prasada Rao, Christopher J. O’Donnell and George E. Battese (2005), “An
Introduction to Efficiency and Productivity Analysis”, Springer; 2nd edition. 18. Dániel Holló and Márton Nagy (2006), “Bank Efficiency in the Enlarged European Union”,
Magyar Nemzeti Bank, MNB Working Papers 2006/3. 19. David Hauner and Shanaka J. Peiris (2005), “Bank Efficiency and Competition in Low-Income
Countries: The Case of Uganda”, IMF, Working Paper, WP/05/240, Washington D.C.: International Monetary Fund.
20. De Nicolo, G., P. Bartholomew, J. Zaman, and M. Zephirin, 2003, “Bank Consolidation,
Internationalization, and Conglomeration: Trends and Implications for Financial Risk,” IMF Working Paper WP/03/158, Washington D.C.: International Monetary Fund.
21. De Nicoló, Gianni and Loukoianova, Elena (2007), “Bank Ownership, Market Structure and
Risk”, IMF Working Paper, WP/07/215 22. Demirgüç-Kunt, A. and R. Levine (2000) ‘Bank Concentration: Cross-Country Evidence’. World
Bank Global Policy Forum Working Paper. 23. Demirgüç-Kunt, Ross Levine, and Hong G. Min (1998), “Opening to Foreign Banks: Issues of
Efficiency, Stability, and Growth”, (with) in The Implications of Globalization of World Financial Markets, ed. Seongtae Lee, Seoul, Korea: The Bank of Korea, 1998.
24. Demirguc-Kunt, A. and Huizinga, H. (1998) Determinants of Commercial Bank Interest Margins
and Profitability: Some International Evidence, World Bank Policy Research Working Papers, WPS1900.
25. Donald S. Allen and Leonce Ndikumana (1998), “Financial Intermediation and Economic Growth
in Southern Africa”, Federal Reserve Bank of St. Louis, Research Division, Working Paper
28
1998-004B. 26. Drake, L. M., M. J. B. Hall and R. Simper (2003), "The Impact of Macroeconomic and
Regulatory Factors on Bank Efficiency: A Non-Parametric Analysis of Hong Kong’s Financial Services Sector", Nottingham University Working Paper.
27. Figueira, Catarina Nellis, Joseph, and Parker, David (2006), “Does Ownership affect the
Efficiency of African Banks?”, Journal of Developing Areas, Fall 2006. 28. Francois Leroux (2004), "From Banking Stability to Banking Performance : An Analysis of the
Banking Sector in sub-Saharan Africa", 29. Fries, S. and A. Taci (2005), “Cost Efficiency of Banks in Transition: Evidence from 289 Banks in
15 Post-Communist Countries”, Journal of Banking and Finance 29. 55–81. 30. IMF (2009), Regional Economic Outlook, Sub-Saharan Africa, April, 2009. 31. Jakob Christensen, Anne-Marie Gulde, and Catherine Pattillo (2006), “Bankable Assets: Africa
faces many obstacles in developing financial systems”, Private Sector Development, World Bank. 32. Jehovaness Aikaeli (2008), “Commercial Banks Efficiency in Tanzania”, Bank of Tanzania
Monetary and Financial Affairs Department, A Paper Presented in a CSAE Conference on “Economic Development in Africa”, Held at St. Catherine’s College, Oxford, 16th – 18th March 2008.
33. Joseph P. Hughes and Loretta J. Mester (2008), “Efficiency in Banking: Theory, Practice, and
Evidence”, Prepared for the Oxford Handbook of Banking. 34. Kirkpatrick, C.H., Murinde, V. and Tefula, M. (2007), “The Measurement and Determinants of
X-inefficiency in Commercial Banks in Africa”, European Journal of Finance. 35. Kiyota, Hiroyuki (2009), “Efficiency of Commercial Banks in Sub-Saharan Africa: A
Comparative Analysis of Domestic and Foreign Banks”, A paper prepared for the CSAE conference 2009 on “Economic Development in Africa” held at the University of Oxford from 22nd to 24th March 2009.
36. Kyriaki Kosmidou, Sailesh Tanna, Fotios, and Pasiouras (2006), “Determinants of profitability of
domestic UK commercial banks: panel evidence from the period 1995-2002”, Applied Research Working Paper Series, Coventry University Business School.
37. Leonardo Martinez-Diaz (2007), “Banking Sector Opening Policy Questions and Lessons for
Developing Countries”, the Brookings Institution, Washington, DC
29
38. Loretta J. Mester (2003), “Applying Efficiency Measurement Techniques to Central Banks”,
Federal Reserve Bank of Philadelphia and Finance Department, the Wharton School, University of Pennsylvania.
39. Luccheti, R., Papi, L., & Zazzaro, A. (2000), “Banks’ efficiency and economic growth: a
micro-macro approach”, Universita di Ancona, Italy. 40. Marco Arena, Carment Reinhart, and Francisco Vázquez (2006), “The Lending Channel in
Emerging Economies: Are Foreign Banks Different?”, NBER Working Paper, No.12340. 41. Ma. Chelo V. Manlagñit and Mario B. Lamberte (2003), “Integrating Gender Perspectives in
Evaluating the Efficiency of Community Oriented Financial Intermediaries (COFI): The Case of Credit Cooperatives in the Philippines”, Philippine Institute for Development Studies, Discussion Paper Series No. 2003-06.
42. Meeusen, W. and J. van den Broeck (1977), “Efficiency estimation from Cobb-Douglas
production functions with composed error”, International Economic Review 18, 435-444. 43. Murinde, V (2009), “Global Financial Crisis: Implications for Africa’s Financial System”,
Birmingham Business School, University of Birmingham. 44. Murinde Victor and Tefula Moses (2002), “A foreign affair? How far does Africa need foreign
banks?”, March 2002 Insights Issue #40, id 21 insight, communicating development research. 45. Ngalande, E.E (2003), “The importance of financial system modernisation in Africa”, Keynote
Address at the Perago User Group Conference. BIS Review 27 South Africa. 46. Reinhart Carmen M and Tokatlidis Ioannis (2001), “Financial Liberalization: The African
Experience”, prepared for African Economic Research Consortium workshop on December 2-7, 2000.
47. Sandrine Kablan (2007), “Measuring Bank Efficiency in Developing Countries: The Case of
WAEMU (West African Economic Monetary Union)”, African Economic Research Consortium, May 2007.
48. Senbet, L.W and Otchere, I (2005), “Financial Sector Reforms in Africa Perspectives on Issues
and Policies”, Prepared for the Annual World Bank Conference on Development Economics (ABCDE), Dakar, Senegal, January 2005.
49. Sologoub, D. (2006), “The determinants of Bank Interest Margins and Profitability: Case of
Ukraine”, available at www.bof.fi/bofit/seminar/bofcef06/sologub.pdf

30
50. Sufian, Fadzlan and Abdul Majid, Muhamed Zulkhibri (2007), “Bank Ownership, Characteristics
and Performance: A Comparative Analysis of Domestic and Foreign Islamic Banks in Malaysia”, Munich Personal RePEc Archive, MPRA Paper No. 12131.
51. Trevor Fitzpatrick and Kieran McQuinn (2005), “Measuring Bank Profit Efficiency”, Research
Technical Paper, Economic Analysis and Research Department Central Bank and Financial Services Authority of Ireland.

31
Appendix Table A1: Country Groupings
Source: Adopted from IMF, Regional Economic Outlook April 2009.
Note: Blank is Not Available.

32
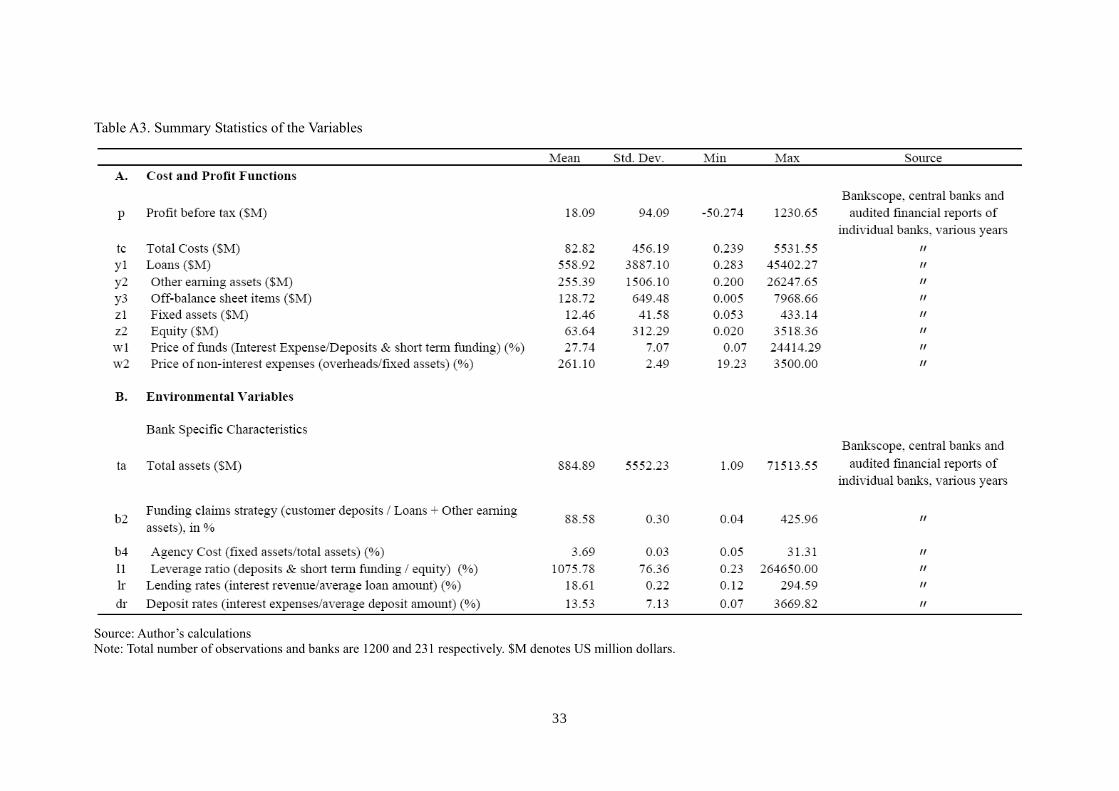
Table A2: Variables Employed in Cost and Alternative Profit Functions Amounts are in million US dollars at constant prices (base year = 2000)
Symbol Definition Dependent Variables
TC Total Cost ($M) = Loan Loss Provisions + Interest Expense + Overheads (personnel expenses + other operating expenses)
p Net profit before tax ($M) Outputs
y1 Loans ($M) y2 Other earning assets ($M) (Total Assets – loans – fixed assets) y3 Off-balance sheet items ($M) Inputs
w1 Price of funds (Interest Expense/Deposits & short term funding), in % w2 Price of non-interest expenses (overheads/fixed assets), in % Netputs
z1 Fixed assets ($M) z2 Equity ($M) Correlates Bank specific characteristics
B2 Funding claims strategy (customer deposits / loans + other earning assets), in % B4 Fixed assets / total assets (in %) L1 Leverage ratio (deposits & short term funding / equity), in % LR Lending rates (interest revenue/average loan amount), in % DR Deposit rates (interest expenses/average deposit amount), in %
Source: Author’s creation.
Note: See Table A6-1 for the trend of B2, B4, and L1 over time (2000-2007).
33
Table A3. Summary Statistics of the Variables
Source: Author’s calculations Note: Total number of observations and banks are 1200 and 231 respectively. $M denotes US million dollars.

34
Table A4. Estimated Cost and Profit Functions
Regressors Profit Cost Betas Variable Name coefficient t-ratio coefficient t-ratio
β₀ Constant 2.11 10.43* 0.14 7.61* β₁ ln (Q1) -0.20 -0.92 0.11 4.82* β₂ ln (Q2) -0.43 -2.68* 0.21 10.93* β₃ ln (Q3) -0.23 -1.93*** 0.01 0.97 β₄ lnW (w1/w2) 0.35 2.23** 0.05 3.19* β₅ lnZ (z1/z2) 1.12 6.20* 0.92 53.40* β₆ 0.5*lnQ1*lnQ1 -0.09 -0.49 0.24 11.72* β₇ 0.5*lnQ2*lnQ2 0.27 2.06** 0.18 13.69* β₈ 0.5*lnQ3*lnQ3 -0.17 -2.93* 0.01 0.84 β₉ 0.5*lnW*lnW 0.00 -0.01 -0.06 -9.99* β₁₀ 0.5*lnZ*lnZ 0.50 3.80* 0.18 10.30* β₁₁ lnQ1*lnQ2 0.24 1.75*** -0.03 -1.77*** β₁₂ lnQ1*lnQ3 0.22 2.50* -0.01 -1.02 β₁₃ lnQ1*lnW 0.04 0.37 0.06 4.38* β₁₄ lnQ1*lnZ 0.06 0.57 -0.13 -8.51* β₁₅ lnQ2*lnQ3 -0.13 -1.74*** -0.01 -1.70*** β₁₆ lnQ2*lnW -0.04 -0.49 0.13 15.12* β₁₇ lnQ2*lnZ -0.15 -1.40 -0.16 -14.43* β₁₈ lnQ3*lnW 0.01 0.08 0.00 0.29 β₁₉ lnQ3*lnZ -0.02 -0.21 0.01 0.59 β₂₀ lnW*lnZ 0.03 0.29 -0.04 -4.58*
sigma squares 0.23 10.23 0.01 10.34
gamma 0.56 7.47 0.87 60.58 mu 0.00 0.00 eta 0.00 0.00 log likelihood function -609.35 1983.66 LR test of one-sided error 349.62 761.00
*, **, and *** correspond to 1%, 5% and 10% significance, respectively.
Source: Author’s calculations using data from Bankscope (2009).
Note: Q1: y1/z2; Q2: y2/z2; Q3: y3/z2; W1: Price of Deposits (Interest Expense/Deposits & short term funding);
W2: Price of non-interest expenses (overheads/fixed assets); Z1: Fixed Assets (US$M); and Z2: Equity (US$M)
where y1 is Loans; y2 is Other Earning Assets; and y3 is Off-Balance sheet items.

35
Table A5: Variables Used in the Second Stage Regression ROAA Return on Average Assets (ROAA) is a measure of
profits relative to size that is most commonly used in
analyzing banks and finance companies.
ROAE Return on Average Equity
CTIR Cost to Income Ratio
Performance Ratio
(Operational)
EQTA Equity to Total Assets
EQNL Equity to Net Loans Capital Ratio
NLTA Net Loans to Total Assets Liquidity Ratio
LLPNIR Loan Loss Provision to Net Interest Revenue Asset Quality Ratio
OUTBASE Currency Outside of Banking System to Base Money Indicator of Monetization
of the Economy
IRS Interest Rate Spreads (lending minus deposit spreads) Bank Efficiency Indicator
ZS Z-score, a banking soundness indicator Banking Soundness Indicator
PG Real GDP per Capita Growth Rate
INFL Inflation Rate (Consumer Prices, in annual percentage)
CRPRIV Domestic Credit to the Private Sector (% of GDP)
Source: Bankscope (2009), IMF, IFS (2009), and Beck and Demirgüç-Kunt (2009).

36
Table A6-1: Summary Statistics of Variables Used in both SFA and Regression Analyses.
Source: Author’s calculations using data from Bankscope (2008 and 2009) and Beck and Demirgüç-Kunt (2009). Note: Cost efficiency was computed by taking the inversed values of inefficiency scores obtained from the stochastic cost frontier analysis.

37
Table A6-2: Summary Statistics of Variables Used in the Regression Analysis and Others.
Source: Author’s calculations using data from Bankscope (2008 and 2009), IMF, IFS (2009), and Beck and
Demirgüç-Kunt (2009). Note: G is Real GDP growth rate (%) and FINDEP is Money and quasi money (M2) as % of GDP.

38
Table A7: Correlation between Variables Used in the Second Stage Regressions
Source: Author’s calculations using data from Bankscope (2008 and 2009), IMF, IFS (2009), and Beck and Demirgüç-Kunt (2009).
39
Table A8:
Source: Author’s calculations using data from Beck and Demirgüç-Kunt (2009). Note: Figures in parentheses denote number of sample countries in a comparator group. Emerging market country is only South Africa. Table A9:
Source: Author’s calculations using data from Bankscope (2009).

40
Table A10:
Source: Author’s calculations using data from Beck and Demirgüç-Kunt (2009). Note: Figures in parentheses denote number of sample countries in a comparator group. Emerging market country is only South Africa.

41
Table A11:
Source: Author’s calculations using data from Beck and Demirgüç-Kunt (2009). Note: Figures in parentheses denote number of sample countries in a comparator group. Emerging market country is only South Africa.

42
Table A12:
Source: Author’s calculations using data from Beck and Demirgüç-Kunt (2009). Note: Figures in parentheses denote number of sample countries in a comparator group. Emerging market country is only South Africa.
43
Figure B1: Financial Indicators, Sub-Saharan Africa, 2000-2007 (Mean values in percent)
Source: Author’s creation using data from Beck and Demirgüç-Kunt (2009).
Figure B2: Financial Indicators, Sub-Saharan Africa, 2000-2007 (Mean values in percent)
Source: Author’s creation using data from Bankscope (2009)

44
Figure B3: Performance and structure of commercial banks by comparator group in SSA, 2000-2007 (Mean values in percent)
Source: Author’s creation using data from Bankscope (2009)

45
Figure B4: Performance and structure of commercial banks by ownership in SSA, 2000-2007 (Mean values in percent)
Source: Author’s creation using data from Bankscope (2009)

46
Table B1: Regression (instrumental variable, two-stage least square): Domestic banks
Source: Author's calculations using data from Bankscope (2009), IMF, IFS (2009), and Beck and Demirgüç-Kunt (2009) Note: Standard deviations in parentheses. *, **, and *** correspond to 10%, 5% and 1% significance, respectively.
47
Table B2: Regression (instrumental variable, two-stage least square): SSA foreign banks
Source: Author's calculations using data from Bankscope (2009), IMF, IFS (2009), and Beck and Demirgüç-Kunt (2009) Note: Standard deviations in parentheses. *, **, and *** correspond to 10%, 5% and 1% significance, respectively.

48
Table B3: Regression (instrumental variable, two-stage least square): Non-SSA foreign banks
Source: Author's calculations using data from Bankscope (2009), IMF, IFS (2009), and Beck and Demirgüç-Kunt (2009) Note: Standard deviations in parentheses. *, **, and *** correspond to 10%, 5% and 1% significance, respectively. Blank means that no value was obtained.