conflict and poverty
TRANSCRIPT

Policy Research Working Paper 9455
Poverty and Equity Global PracticeOctober 2020
Conflict and PovertyHannes Mueller
Chanon Techasunthornwat
Poverty and Shard Prosperity 2020
Background Paper
Pub
lic D
iscl
osur
e A
utho
rized
Pub
lic D
iscl
osur
e A
utho
rized
Pub
lic D
iscl
osur
e A
utho
rized
Pub
lic D
iscl
osur
e A
utho
rized

Produced by the Research Support Team
Abstract
The Policy Research Working Paper Series disseminates the findings of work in progress to encourage the exchange of ideas about development issues. An objective of the series is to get the findings out quickly, even if the presentations are less than fully polished. The papers carry the names of the authors and should be cited accordingly. The findings, interpretations, and conclusions expressed in this paper are entirely those of the authors. They do not necessarily represent the views of the International Bank for Reconstruction and Development/World Bank and its affiliated organizations, or those of the Executive Directors of the World Bank or the governments they represent.
Policy Research Working Paper 9455
This paper analyzes the relationship between poverty and conflict in the macro and regional data, including a detailed case study of Uganda. The paper relies on a large and grow-ing literature that provides evidence on the devastating impact that conflict has on health and expectations. Based on this evidence, it develops a statistical framework to track the cumulative long-term impact that armed conflict has on poverty, which the paper calls conflict debt. The data confirm that contemporaneous conflict leads to a conflict debt which is only recovered slowly. The empirical model is
not only a good description of the cross-country aggregate poverty time-series data, but also regional cross-sectional data. A new aspect in the model is that armed conflict can prevent poverty reduction and, once it is over, allow for strong catch‐up effects as they exist in the data. But in the most conflict-ridden countries, repeated cycles of violence prevent poverty from recovering. According to the most conservative estimates, these countries and regions would have 5–10 percentage points lower poverty rates without their conflict debt.
This paper is a product of the Poverty and Equity Global Practice. It is part of a larger effort by the World Bank to provide open access to its research and make a contribution to development policy discussions around the world. Policy Research Working Papers are also posted on the Web at http://www.worldbank.org/prwp. The authors may be contacted at [email protected].

Conflict and Poverty
Hannes Mueller1 and Chanon Techasunthornwat2
JEL codes: D74 I32
Keywords: Conflict; Poverty
We are grateful to Samuel Freije-Rodriguez, Michael Woolcock, Alexandru Cojocaru, Minh Cong Nguyen, Patrick Barron, and participants of Poverty, Fragility and Conflict Webinar for the support, insightful comments and suggestions. 1 Institut d’Analisi Economica (CSIC), Barcelona GSE, CEPR and MOVE. Email: [email protected] 2 Universitat Autònoma de Barcelona and Faculty of Economics, Thammasat University. Email: [email protected]
The Poverty and Equity Global Practice| The project is the Poverty and Shard Prosperity Report, code is P172449 | Co-TTL s are Samuel Freije-Rodriguez and Michael Woolcock.

1
Introduction The goal of this background paper is to provide a detailed analysis of the link between poverty and armed conflict using the newest available conflict and poverty data both at the country level and at the regional level. We will first review the literature on the complex relationship between poverty, conflict, crime and other co-determinants. We then develop a measure based on the literature on the role of conflict risk and human capital accumulation and use this measure to investigate the relationship between conflict and poverty.
Before we go on to discuss the role of armed conflict in poverty, it is important to understand the limitations of the present background study. We will approach the role of conflict in poverty through two commonly used data sets, the Uppsala Conflict Data Programme (UCDP) and the Armed Conflict Location & Event Data Project (ACLED), both of which track violent conflict around the world. The UCDP uses the most stringent definition of conflict by focusing on events that result in battle-related deaths. According to the definition used, battle-related deaths result from the use of armed force between warring parties in a conflict, be it state-based or non-state. This implies a focus on specific, organized, extreme levels of violence, i.e. it does not include riots for example. ACLED is more lenient in its definition of a conflict event, but also gives its coders specific guidelines targeted at capturing political violence.
We relate these conflict data to poverty through an analysis at the country and region level, i.e. we do not analyze the experience of households or neighborhoods in a city and we do not study crime. This produces an important omission as interpersonal violence, like homicides, constitutes the vast majority of violent deaths. Hoeffler and Fearon (2015) stress, for example, that for every civil war battlefield death, roughly nine people are killed in interpersonal disputes. The relevance of interpersonal violence and crime for economic activity is beyond doubt. However, as we will explain in the following section, these effects are not showing up in economic changes at the macro level but in ways which are best studied at the micro level, i.e. by collecting data on the directly affected individuals and firms. We will review this literature but, in our analysis, focus on the relationship between political violence and poverty.
This report is structured as follows. We will first give a detailed overview over the existing literature on the economic costs of violence and explain the focus on armed conflict. We then discuss the cross-country evidence followed by regional evidence and a detailed case study of Uganda.
Complex Relationship between Conflict and Poverty Violence and Poverty: An Overview There is a clear pattern in the cross-country data - the poorest countries are also the countries which suffer most from armed conflict. This broad cross-sectional correlation could be driven by a lot of different factors including geography and colonial origins which affect both the tendency for conflict and poverty.
A first strategy to shed light on the causal link between conflict and poverty is to simply control for other factors at the macro level or to look at changes across time. The macroeconomic impact of civil wars has been studied extensively in this way for more than two decades and several studies have shown that countries which suffer from an armed conflict also suffer economic collapse. In one of the first studies, Collier (1999) analyzes armed conflict and GDP growth using cross-county data on internal wars which occurred between 1960 and 1992. He finds that civil conflict is correlated with a contemporaneous reduction of GDP per capita growth of 2.2 percent. On a regional level, Abadie and

2
Gardeazabal (2003) investigate the economic effect of the Basque terror campaign and estimate a reduction of the GDP per capita of approximately 10 percent. Some studies suggest even larger effects. Mueller and Tobias (2016) analyze economic growth around the onset of armed conflict and show that over a four-year period in conflict, GDP per capita contracts by about 18% on average, relative to a counterfactual without conflict. This relative loss is not recovered once the conflict is over and more intense violence leads to larger economic declines. A detailed case study of the conflict in the Syrian Arab Republic by the World Bank conducted in 2017 finds that from 2011 until the end of 2016, the cumulative losses in gross domestic product (GDP) were USD 226 billion, about four times the Syrian GDP in 2010 (World Bank 2017).
Economic recovery and poverty reductions might occur in the post-war period, but in many countries, peace does not last long enough. According to the definition of armed conflict we use in this report, there was at least some internal conflict in 27% of all country/years. But this violence has been particularly concentrated in a small set of countries. Within the last three decades, 12 countries have suffered more than three outbreaks of very intense armed conflict and another set of 8 countries suffered lasting, intense armed conflict in more than one-third of the entire period. This means that many of the poorest countries never experienced long periods of stable peace. Observers have therefore talked of a conflict or violence trap which countries fail to escape.
Civil wars affect economic conditions in two stages: during conflict and during the post-war period. During conflict there is a direct cost caused by the destruction of resources that would otherwise have been employed in production. This directly impacts contemporaneous economic performance in the affected territory. In addition, the economic activity of countries that suffer from civil conflict is damaged indirectly by an increase in production costs and insecurity in transport. Risk perceptions play a key role here as they spread the costs of armed conflict beyond the directly affected territory. In addition, armed conflict will affect economic development and poverty also in its aftermath through the humanitarian crisis trigged by wars and the contraction of investments due to instability. A complete review of all of the possible channels is beyond the focus of this study but four issues are particularly relevant and will therefore be addressed in detail in this report:
- Armed conflict affects the productivity of the workforce in the long run through lack of education, stunting, injuries and mental disorders. It is as if conflict imposes a kind of debt burden that builds up during conflict and needs to be repaid once violent conflict has ended.
- Expectations, both temporal and spatial, play a crucial role. Fear of future outbreaks of violence will inhibit capital inflows and further reduce productivity. The fear of the spread of violence amplifies its effect beyond the directly affected individuals, firms and regions. Both of these factors increase the conflict debt.
- Crime affects economic outcomes. However, both in terms of human capital accumulation and the impact on expectations, political violence has far larger effects. This explains the much stronger link between poverty and political violence in the macro data.
- Weak state capacity will provide an additional link between a weak economy and internal conflict. Conflict is both a symptom of weak state capacity and a cause and so is a weak economy. This has repercussions for poverty alleviation strategies.
Evidence on the Human Capital Channel Surprisingly, perhaps, there is quite a lot of controversy in the academic literature regarding the long-term effects of violence on economic activity. There are both theoretical and empirical reasons for this controversy. Theoretically, classic growth models like the Solow model assume that countries

3
converge to their own steady state and that countries face decreasing returns to human and physical capital. An exogenous destruction of production factors through war will therefore result in a more rapid accumulation of physical or human capital after armed conflict. In its plainest form, this model predicts that countries will grow much quicker after a negative exogenous shock. The long-term economic costs of conflict are therefore less severe.
Empirically there is some support for this hypothesis from external wars. In an early contribution, Organski and Kugler (1977) show that output of winners and, more surprisingly, also losers of the World Wars caught up with non-affected countries after 15 to 20 years. This is supported by additional evidence from the micro level. Davis and Weinstein (2002) show that Japanese cities that were bombed had completely recovered their relative size 20 years after the US bombing in World War II. In a similar vein, Brakman et al. (2004) find that the bombing of Germany had a significant but temporary impact on post-war city growth in West Germany but a sustained impact in East Germany. Miguel and Roland (2011) study a whole battery of indicators from poverty rates, population densities to schooling in Vietnam 25 years after the US bombing campaign and find that the local economy had recovered.
Of course, the time dimension involved in these findings is in itself not a reason for general optimism in a post-conflict situation. The macro evidence on quicker gains is more mixed - mostly because there is no agreed methodology for how to study recoveries. Cerra and Saxena (2008) use a method to study crisis episodes more generally to study civil wars. In this method the start of an episode is coded as 1 and the impact over time is studied using forwards and lags. They find that, while output falls steeply immediately after conflict (6 percent on average), the economy recovers relatively soon afterwards. Mueller (2012) shows that this, fairly optimistic, view is due to a coding error. Economies contract by more than 18 percent in a civil war and this is not recovered within a decade. Mueller et al. (2017) confirm that there does not seem to be a distinct recovery growth period in the economic growth data. Countries appear to return to their average growth level in the absence of conflict. While this is good news in the sense that there is positive growth on average, it is also bad news in the sense that there seems to be, on average, no adjustment back to steady state once conflict is over. This is in contradiction with findings on the quick rebuilding of capital stock found in the literature. A possible theoretical explanation for this disparity between the micro and macro evidence comes from Barro and Sala-i-Martin (2003) who predict that the speed of recovery depends on the type of capital that is destroyed, with a slower recovery if human capital is destroyed, because it has a higher adjustment cost.
This is particularly relevant as there is evidence in the literature that exposure to conflict during early childhood or adolescence has a huge and persistent direct effect on health, education and productivity of children. Leon (2012) shows that the average person exposed to political violence in Peru before school-age accumulated 0.31 fewer years of schooling upon reaching adulthood. This suggests that children who were affected by violence during early childhood suffer irreversible effects. Duflo (2001) finds that the effect of a huge school construction program in Indonesia on school attainment in the long-run is of a slightly smaller magnitude. Each school constructed per 1,000 children led to an increase of 0.12 to 0.19 year of education. This means that if one wanted to mitigate the long-run effect of conflict in Peru on schooling by opening more schools, one would need to build more than 8,000 new schools. This is a big adjustment cost which supports the claims in Barro and Sala-i-Martin (2003). Akresh et al. (2012) also identify the long-term impact of exposure to conflict during the Nigerian civil war in the late 1960s on health. They find that individuals who were exposed to this conflict in their childhood or adolescence have a reduced stature. Adult stature is a latent stock measure of health and variation in height induced by childhood or adolescence environment has been

4
documented in the literature as a good predictor of longevity, education and earnings (Behrman and Rosenzweig 2004; Case and Paxton 2008; Strauss and Thomas 1998). The impact of pre-adulthood exposure to conflict on height identified in Akresh et al. (2012) can therefore be viewed as a permanent labor productivity loss for the exposed individuals.
The long-term effect working through human capital formation plays a key role for our study as it is consistent with the relationships between conflict and poverty in the country and regional data. This suggests that the latter are indeed driven by a causal relationship running from conflict to reduced economic capacity that is only slowly recovering. In this interpretation we can rely on a diverse body of evidence which finds large negative effects of armed conflict on education. Ichino and Winter-Ebmer (2004) for instance estimate the long-run educational cost of World War II. They find that individuals who were 10 years old during the conflict in the most affected countries received less education than individuals with comparable characteristics in less affected countries. Affected individuals also experienced a sizable earnings loss, some 40 years later. Blattman and Annan (2010) use the exogeneity in child military conscriptions into rebel groups in Uganda to provide evidence for the widespread and persistent economic and educational impact of conflicts. They find that schooling falls by nearly a year, that skilled employment halves, and that earnings drop by a third among child soldiers as compared to the control group. Akbulut-Yuksel (2014) exploits the plausibly exogenous region-by-cohort variation in the intensity of World War Two (WWII) destruction as a quasi-experiment and finds that exposure to destruction had long-lasting detrimental effects on the human capital formation, health, and labor market outcomes of Germans who were at school-age during WWII. An important channel for the effect of destruction on educational attainment is the destruction of schools whereas malnutrition is partly behind the estimated impact on health. Minoiua and Shemyakina (2014) use survey data and information on the dates and locations of conflict events to examine the causal impact of the 2002–2007 Ivorian conflict on child health. They find that children from conflict-affected regions suffered significant health setbacks and that victimization in the form of economic losses is the main conflict–impact mechanism.
Conflicts affect aggregate productivity directly through physical health but also indirectly through mental health. Being exposed to violence leads to post-traumatic stress disorder (PTSD) which affects both adults and children. These mental illnesses are characterized by hyper-vigilance, flashbacks and nightmares. Individuals who are exposed to a traumatic event have an increased likelihood of poor self-reported health, morbidity (as indicated by physical exam or laboratory tests), utilization of medical services, and mortality. Li et al. (2011) show that people who experience PTSD are at much higher risk of developing other health problems, including diabetes, heart ailments, depression and addiction. Sibai et al. (1989) study civilians exposed to the civil war in Lebanon and find that patients with severe coronary artery disease had more war-related stress than did either patients with normal arteriographic findings or hospital visitors. Using female Vietnam veterans, Wolfe et al. (1994) show that warzone exposure and PTSD are associated with self-reports of poor health and numerous physical problems. PTSD in early childhood also makes people more vulnerable in later life (The Economist 2015). Rosen and Fields (1988) were among the first to attempt to explain how PTSD could adversely affect physical health. The potential channels can be divided in 3 groups: biological, psychological and behavioral channels (Friedman and Schnurr 1995). From a biological point of view, PTSD can modify cardiovascular reactivity, disturb sleep physiology, enhance thyroid function, etc. Singhal (2019) studies the long-term effects the U.S. war in Vietnam on mental health. He finds that early-life exposure to war negatively affects mental health in adulthood and proposes malnutrition during the war as a significant mechanism.

5
We will see that poverty increases during conflict but that countries seem to catch up after conflict ends, i.e. that poverty rates converge towards a global average after civil wars. This rebound takes years or even decades, which is consistent with the idea that health and human capital are factors leading to poverty. In this view, conflict leads to a loss in health and education in a generation of individuals and only once these individuals have partially recovered and re-built their human capital will they be able to escape poverty. The exposure of children to conflict is then what imposes the heaviest conflict debt we find in the data.
Role of Expectations and Conflict Risk The outbreak of violence in a country will have a damning effect on expectations regarding renewed outbreaks of violence. The reason is that political conflict is, by and large, a re-occurring and spreading phenomenon. Violence spreads and always breaks out again in the same place. This effect is so powerful that research in conflict forecasting is struggling to develop variables that go beyond spatial and temporal dynamics when developing risk evaluations (Hegre et al. 2019; Bazzi et al. 2019; Mueller and Rauh 2019). This is particularly relevant as the local population and outside economic actors also know this and when a new conflict breaks out it changes expectations dramatically.
Political violence is often unpredictable and in this way its impact on expectations is amplified. This is most clear for terrorism which actively tries to maximize its impact on expectations. Domestic violence and gang warfare might kill more people but unless extreme levels are reached the impact on expectations remains relatively low. Brazil and Mexico, for example, are regarded as great destinations for tourists despite extreme levels of violence which would put these countries firmly on the map of countries at civil war if the violence were politically motivated. Homicides are spatially contained, and the government, typically, has some control over their spread. Only when this is in doubt, i.e. when the violent actors turn against unpredictable targets or even the state, will economic actors react.
One indicator of how important fear is as a factor is that the number of people running away from armed conflict is far larger than the number of fatalities. Mueller et al. (2017) show that in the average civil war year over 600,000 individuals have fled the country. Many more are displaced within the country. Fear will therefore break local supply chains. Amodio et al. (2020) show, for example, that conflict during the Second Intifada in the West Bank and Gaza led to distortions in the functioning and accessibility of markets for production inputs, inducing firms to substitute domestically produced materials for imported ones. These distortions explain over 70 percent of the drop in the output value of firms in high-conflict districts. Based on these observations, Tapsoba (2018) proposes a metric that captures perceived violence risk on the ground and uses this metric to evaluate the impact of violence risk on child health. His proposed measure of violence risk is based on an estimation of the underlying distribution of the violence process in space and time. The empirical results show that cohorts of children exposed to high risk of violence suffer major health setbacks even if they were not directly exposed to violence. In particular, risk increases infant mortality by more than 50% in both Côte d’Ivoire and Uganda. This means that the effects of armed violence are amplified far beyond what can be measured in the regions which are immediately affected by violence.
An important mechanism for the spread of fear and amplification of the effect of violence is news coverage. Besley et al. (2020) show for the example of tourists traveling to destination countries suffering from violence that a large part of the effect of violence is coming from news reporting on this violence in the home countries of tourists. Tourists from countries that report a lot on violence are much more likely to stay away. If this mechanism generalizes then reporting on countries in armed conflict will generate a lot of bad press and this will lower business trips and cut countries or regions off from trade and investment, i.e. slow economic integration in the long run.

6
But there is also a temporal aspect to fear. Asset prices can be used to show how expectations change with political violence. Zussman and Zussman (2006) and Willard et al. (1996) show, for example, that asset prices during conflict react to important conflict events like battles or cease fire agreements. Besley and Mueller (2012) show that house prices seem to react to changes in expectations rather than violence itself. This implies that even once violence is over it can be that asset prices stay suppressed. Parts of the economy will then only recover when peace is regarded as stable. This generates huge problems in fragile states which, as the word suggests, are not regarded as stable. Poverty reduction in these countries might rely as much on changing perceptions of political stability as on economic help.
This fear effect also has a strong impact of how the effect of local violence should be captured at the macro level. If the effect of violence is only contemporaneous then we do not expect conflict to affect poverty beyond the conflict period. However, if expectations are important, we expect economic effects to persist as with a debt that needs to be repaid after conflict has ended. Expectations will then also lead to the sort of patterns we find in the poverty data.
Poverty and the Cost of Crime There is no robust empirical relationship between homicide rates on growth rates at the macro level, neither for regions within counties nor across countries. This is puzzling given the extreme levels of violence associated with crime in some regions. A possible reason for this lack of a relationship is that crime does not affect expectations in the same way as political violence. Also, crime rates move much more slowly and are therefore not causing the same dramatic disruptions or refugee waves as political violence.
This does not mean that violent crimes might not have a profound impact on the economy. There is a large related literature that calculates the cost of crime (See Soares (2009) for a review). The standard accounting approach is to estimate this cost simply by adding the costs and losses due to crime. For example, van Ours and Vollaard (2016) use estimates from an accounting approach to study the welfare gains from installing electronic engine immobilizers in the Netherlands. Their benchmark measures of the cost come from the UK Home Office. The methodology is based on Brand and Price (2000) which is a very detailed accounting exercise in which security expenditures, insurance costs, and damages are added up to derive a per case cost. Other approaches include individual valuations of counterfactuals, contingent-valuation, and changes in market prices to estimate the welfare costs. For example, Cook and MacDonald (2011) use both contingent-valuation surveys and jury awards to victims of violent crimes to calculate the welfare gains from crime reductions. And property prices are used to assess the cost of crime in London by Gibbons (2004).
Recent research on the economic effects of crime have shown that many of these studies will still constitute a lower bound of the cost of crime. Besley and Mueller (2018) show, for example, that two-thirds of the economic impact of crime on firms comes through defensive measures taken by firms which might or might not be directly affected by crime. In other words, if one would focus on crime statistics to understand the impact of crime one would only capture one-third of its actual costs. Crime might disappear where firms are successful defending against it. But the effort exerted in defending against crime forms part of the cost.
There is therefore little doubt that crime will affect poverty rates through its impact on the allocation of jobs across firms and the arising disincentives for investment that arise from the lack of secure property rights. But this effect will only be visible in individual- and firm-level surveys or by calculating costs of criminal acts directly.

7
Fragility, State Capacity and Poverty Reduction Fragility will affect expectations and suppress investment incentives and, in this way, poverty. But the mechanism running between conflict and poverty is much more complex. This becomes clear when one looks at the six symptoms proposed by the International Growth Centre (IGC) in a recent study on fragility (The LSE-Oxford Commission on State Fragility, Growth and Development 2018):
1. Weak state capacity: a failure to invest in fiscal, legal, regulatory and spending capabilities of government;
2. A weak private sector: economies are characterized by a large informal sector with few large firms and poor legal structures in place, which hampers taxation;
3. Lack of security: the state is not able to provide security from disruptive actors (such as organized criminals or militias) throughout its territory;
4. Weak resilience: the economy often relies on few sectors and is subject to external shocks which threaten political stability;
5. Low levels of state legitimacy: society suffers from low levels of trust and reciprocal compliance; and
6. Polarized societies: prevalence of oppositional identities whether ideological, ethnic, linguistic, or religious. Different polities display these symptoms to differing degrees. Moreover, countries that have functioned effectively for long periods of time may occasionally display some of these symptoms.
From this it is clear that fragility and poverty are also linked through weak state capacity. The inability of the government to provide public services will, for example, directly affect its ability to combat poverty. This implies that the causal chain might run from conflict to human capital formation as proposed above but it might also run from low state capacity to conflict and low human capital formation. Empirically, it is therefore difficult to pin down a specific channel. We therefore rely on the micro literature discussed above to establish the causal link.
But this view on fragility should be taken into account when designing policy for poverty alleviation. Clearly, poverty reduction must partly come from reducing fragility and regaining state capacity. Besley and Mueller (2020) argue that crafting a program for building fiscal capacity to suit the context of state fragility means tailoring the narrative of reform to the social and cultural context. For example, poverty alleviation in fragile states must recognize the lack of legitimacy stemming from poor accountability in the use of public resources and corruption by elites. This needs to become a standard part of understanding the context for building state capacity for sustained poverty reductions. A country with low trust in government, weak national identity, and low confidence in the state may need a different approach from that taken where these factors are not present.
An important case study in this context comes from Sanchez de la Sierra (2020). He shows that stationary armed non-state actors in the Democratic Republic of Congo seem to improve economic welfare for local villages whereas the Congolese army only increases security. The reason is that other public services by the central state are not provided in remote areas. In such a context one would expect poverty measures to remain high with the presence of the army. This, in turn, will weaken support for the state and state revenues because the formation of norms of reciprocity rely on citizens seeing that the state is using revenues for common purposes. The presence of strong, local ethnic or regional identities can make this even more important.
An approach to poverty alleviation in fragile states that recognizes the need to strengthen the social contract therefore reinforces the need for organizations such as the UN, World Bank and IMF to coordinate when strengthening state capacity. Programs may work better if there is scope to

8
coordinate efforts to improve security (which means coordinating with security operations) with projects to improve service delivery.3
Data Summary statistics for our data sources are provided in Appendix Table A1.
Poverty Data Throughout this report, we employ three poverty data sets to explore the relationship between poverty and conflict. The first data set is an unbalanced panel of the poverty headcount ratio at $1.90 a day (2011 PPP) at the country level (PovcalNet) from the World Bank. The second data set is the Global Subnational Atlas of Poverty (GSAP). It provides a cross-section of international poverty measures circa 2013 at the subnational level. The third data set we rely on is a short panel from Uganda in 2012 and 2016. This panel consists of around 1,500 sub-counties in the country.
Conflict Data Two conflict databases are used in the study. The Georeferenced Event Dataset (GED) Global version 19.1 from the Uppsala Conflict Data Programme (UCDP), henceforth called UCDP, and the Armed Conflict Location & Event Data Project (ACLED) are databases of geolocated conflict events around the world with a number of fatalities. The two data sets are different in terms of coverage and data collecting process. The UCDP has larger coverage with more countries so it delivers a broader illustration of the global situation between 1989-2018 when we implement the cross-country study. But UCDP’s different inclusion criteria, such that a conflict dyad is only coded once it crosses the 25 battle-related deaths threshold in a given year, makes it understate fatalities from conflict in many areas (see Raleigh and Kishi 2019 comparing the two data sets in detail). When we analyze the within-country relationship between poverty and conflict, ACLED provides a very rich set of data and we therefore show results for our within-country case study and the African continent using the ACLED data.
Empirical Relationship between Conflict and Poverty In what follows we will take an agnostic view regarding the channel through which the correlation of violence on poverty rates arises. Instead, we will rely on the related literature for identification and simply try to understand the involved magnitudes in macro relationship at the country and regional level. If conflict prevents children from building their human capital or hinders investments in the recovery period, then past conflict should be related to poverty rates today. The channels of human capital accumulation and expectations will then lead to a correlation between poverty rates and past conflict. Theoretically, we expect reverse causality from poverty to conflict to generate a contemporaneous relationship. If poverty triggers conflict, then increases in poverty should increase contemporaneous conflict risk.
We will assume that the relationship between violence and poverty works through the local level and re-code conflict counts into per capita counts, i.e. divide fatalities by the overall population of the country or region. This assumes that the effect of violence on the poverty rate is more severe if a conflict is affecting a larger share of the population. In a country like India a fatality count will mean that a much smaller share of the population is affected than in a small country like Burkina Faso.
3 The case of the Arab Republic of Egypt shows how difficult this is in practice. Fiscal reforms were accompanied by a World Bank project for social security. However, a government change from Morsi damaged the project because the new government tried to establish control and, according to the national data, poverty has increased. Ironically, sharing fiscal resources with the population is also a way of building fiscal control.

9
Fatality counts have to be seen in the context of the total population. This also true for regions. Violence in a region with a large population will have smaller effects on the economy per capita. An important feature of this way of coding violence intensity is that we can compare this intensity across units of very different sizes.
The per capita measure is, in essence, a theoretical statement on the likely link between conflict and poverty. It is, for example, consistent with the literature discussed in the previous sections which shows that conflict inhibits human capital formation locally. The higher the share of children affected by conflict, the lower will productivity be in future.
Conflict Debt Measure Figure 1 shows simple correlations between per capita fatalities and the poverty rate using the cross-country and sub-national samples in Figure 1A and 1B, respectively. In the figures we distinguish between contemporaneous conflict which is the (log of the) fatality count in the same year as the poverty measure and the cumulative count which is the (log of the) total fatality count between 1989 and the year of the poverty measurement. The idea behind producing the total past count is that past conflict could affect poverty today through the channel of human capital accumulation, for example. If violence a decade ago harmed children growing up at the time, then this could have an impact on the ability of those individuals to make a living 10 years later.
Clearly, we see that there is a positive relationship between both contemporaneous and past conflict and contemporaneous poverty rate in both panels of Figure 1. More intense conflict, present and past, is strongly associated with higher poverty rates at present. However, we also see that the link between contemporaneous conflict and poverty is a little weaker.
Figure 1: Relationship between contemporaneous and past cumulative conflict and poverty
Source: PovcalNet and GSAP by World Bank, and UCDP
In what follows we adopt the definition of conflict year as having fatalities per 1,000 population more than 0.08 to define a country as being in conflict or not. Mueller (2016) proposes this threshold for conflict intensity as this is about as common as civil war defined as a year with more than 1,000 fatalities (the definition typically used in the conflict literature). We experimented with the threshold and with absolute counts and the latter is indeed only weakly related to the poverty rate. Cumulative conflict years as defined here are strongly related to poverty. This is in line with the idea that conflict prevents countries from eradicating poverty as public resources are scarce, capital takes flight and as the population suffers human capital losses. These losses scar the economy of the country and past conflict therefore affects poverty today.

10
However, there is a dynamic aspect to poverty reduction which a simple cumulative measure does not capture. Note that a cumulative conflict measure implies that a year of conflict ten years ago will have the same impact on the economy as a year of conflict five years ago. If the impact weakens over time, for example because individuals recover from conflict, then this way of capturing conflict history will be an empirical misspecification. We turn towards this in Figure 2.
Figure 2: Poverty rates across time
Source: PovcalNet by World Bank, and UCDP. Note: A conflict year is defined by a year with over 0.08 fatalities per 1,000 population. We use average population to avoid time variation in the denominator of the indicator. Average population is computed from available years in the World Bank data. The conflict year share is a share of conflict years in the period 1990-2019.
Figure 2 shows the average poverty rate in all countries with poverty data for the period 1995 to 2016 but divides countries into three groups according to their conflict history.4 The first group of countries (green line) is not affected by conflict at all. This group includes most developed countries. The second group experienced conflict but in less than 30% of all years (blue line) and the third group of countries experienced conflict in more than 30% of all years (red line). This last group contains countries like Afghanistan and Somalia which are heavily affected by repeated cycles of armed conflict.
If we focus on the most affected countries and compare to the countries which are not affected, we see a clear drifting apart until around 2005 and then a slight catching up. Poverty rates in the countries most affected by conflict remain extremely high with the overall average still close to 40 percent in 2016. This implies that the countries which were most heavily affected by conflict did not manage to combat poverty effectively. Clearly, what we can see here is the “Two-Speed World” invoked by Corral et al. (2020) where some conflict countries are actually converging with the rest of the world in terms of poverty numbers and the most affected countries are left behind. If we contrast countries which had some conflict (blue line) and no-conflict countries (green line), it is, however, not clear whether some conflict inhibits poverty reduction. In fact, from this comparison it seems as if the conflict
4 The poverty data are interpolated to generate data that are as consistent as possible across time. We rely on our definition as a conflict year as being a year having more than 0.08 fatalities per 1,000 population and the sample is 187 countries in the period 1989 to 2018 to define groups.

11
countries might be catching up with the non-conflict countries. This is not surprising as the conflict countries include countries like Colombia, Uganda and Angola which all are increasingly peaceful.
This observation has an extremely important implication: conditional on the absence of contemporaneous or recent conflict there seems to be some convergence in poverty rates. This finding is also confirmed by Corral et al. (2020) who show dramatic poverty reduction in “escaped FCS”. We therefore need to use a more nuanced framework to understand the dynamic effects of conflict on poverty reduction. A simple cumulative conflict history without discounting will not be a good representation of the fact that countries seem to be able to escape high poverty rates once conflict ends.
To capture this empirically we build an empirical model of the conflict debt and its impact on poverty rates consisting of the following two equations:
𝑃𝑃𝑃𝑃𝑃𝑃𝑃𝑃𝑃𝑃𝑃𝑃𝑃𝑃𝑃𝑃𝑃𝑃𝑃𝑃𝑃𝑃𝑖𝑖𝑖𝑖 = 𝛽𝛽 𝐶𝐶𝑃𝑃𝐶𝐶𝐶𝐶𝐶𝐶𝐶𝐶𝐶𝐶𝑃𝑃𝐶𝐶𝑃𝑃𝑏𝑏𝑃𝑃𝑖𝑖𝑖𝑖 + 𝜇𝜇𝑖𝑖 + 𝜇𝜇𝑖𝑖 + 𝜀𝜀𝑖𝑖𝑖𝑖 (1)
where 𝜇𝜇𝑖𝑖, 𝜇𝜇𝑖𝑖 are country and time fixed effects and
𝐶𝐶𝑃𝑃𝐶𝐶𝐶𝐶𝐶𝐶𝐶𝐶𝐶𝐶𝑃𝑃𝐶𝐶𝑃𝑃𝑏𝑏𝑃𝑃𝑖𝑖𝑖𝑖 = 𝛿𝛿 𝐶𝐶𝑃𝑃𝐶𝐶𝐶𝐶𝐶𝐶𝐶𝐶𝐶𝐶𝑃𝑃𝐶𝐶𝑃𝑃𝑏𝑏𝑃𝑃𝑖𝑖𝑖𝑖−1 + 𝐶𝐶𝑃𝑃𝐶𝐶𝐶𝐶𝐶𝐶𝐶𝐶𝐶𝐶𝑃𝑃𝐶𝐶𝑃𝑃𝑃𝑃𝑃𝑃𝑖𝑖𝑖𝑖 (2)
where 𝐶𝐶𝑃𝑃𝐶𝐶𝐶𝐶𝐶𝐶𝐶𝐶𝐶𝐶𝑃𝑃𝐶𝐶𝑃𝑃𝑃𝑃𝑃𝑃𝑖𝑖𝑖𝑖is a dummy that is equal to 1 in years in which there are more than 0.08 fatalities per 1,000 population.
Equation (2) captures the build-up of a stock of conflict debt with ongoing conflict. 𝐶𝐶𝑃𝑃𝐶𝐶𝐶𝐶𝐶𝐶𝐶𝐶𝐶𝐶𝑃𝑃𝐶𝐶𝑃𝑃𝑏𝑏𝑃𝑃𝑖𝑖𝑖𝑖 increases by 1 in a conflict year and increases by δ with past conflict debt. The parameter δ is a decay parameter which will be smaller than 1 if conflict in the past affects current poverty less and less over time, i.e. if countries are able to catch up and “repay their debt” after conflict is over. In the context of the literature discussion the parameter δ is best thought of as the (mental) health and skills of the affected population recovering in the years following conflict or as investors regarding a region or country as increasingly stable with lasting peace.
We follow a two-stage procedure. We first calculate the value of 𝐶𝐶𝑃𝑃𝐶𝐶𝐶𝐶𝐶𝐶𝐶𝐶𝐶𝐶𝑃𝑃𝐶𝐶𝑃𝑃𝑏𝑏𝑃𝑃𝑖𝑖𝑖𝑖 for every country year under different assumptions on 𝛿𝛿. We then estimate 𝛿𝛿 by running the regression in (1) repeatedly with different values of 𝛿𝛿 and taking the regression that maximizes the fit of the model. As a result, an estimated 𝛿𝛿 equal to 0.88 is used throughout the study. This implies that, with stable peace, a conflict debt shrinks to 52% or its original size after 5 years and to 28% of its original size in 10 years. This is in itself interesting as it suggests a relatively quick recovery of poverty rates after conflict ends.
In Table A1 we show the evaluation of the conflict data using the conflict debt model. In the cross-country data we show that the mean debt value is 0.177 but debt concentrates in few countries. Conflict debt takes a maximum value of almost 5 as the debt accumulates without peace.
Cross-Country Results The results provided by our conflict debt model are shown in Table 1. There is a robust relationship between conflict debt and the poverty rate where an increase by 1 in the debt is associated with an increase in the poverty rate of 1.767 percentage points in our preferred specification in column (3) which features country and year fixed effects. What is important to note here is how the country fixed effects reduce the size of the coefficient. This indicates that level differences in conflict and poverty between countries are a key driver of the relationship we see in Figure 1A. Once this is partialed out, the relationship becomes much weaker.

12
The statistical robustness to controlling for country fixed effects is an important reassurance that the relationship between conflict history and poverty is not solely due to a host of omitted variables at the country level. Controlling for continent/time fixed effects does not alter the size of the coefficient substantially. This implies that poverty in some countries deviates from the regional average in line with conflict debt. Still, we will need to interpret the coefficient carefully, keeping in mind that the link between conflict and poverty could be driven by other factors which affect both.
Table 1: Poverty Rate and Conflict History (1) (2) (3) (4) Poverty rate Poverty rate Poverty rate Poverty rate Conflict debt 8.372*** 7.971*** 1.767** 1.455* (0.970) (0.943) (0.877) (0.856) Country fixed effects No No Yes Yes Time fixed effects No Yes Yes No Continent-time fixed effects No No No Yes Adjusted R-squared 0.0502 0.0800 0.277 0.421 Observations 3238 3238 3238 3238
Notes: Robust standard errors clustered at the country level in parentheses. * p<0.1, ** p<0.05, *** p<0.01. The dependent variable is poverty rate (in percent), interpolated linearly to replace missing values between two data points. Conflict debt is the discounted history of conflict years where a conflict year is defined as by more than 0.08 fatalities per 1,000 population. We use average population to avoid time variation in the denominator of the indicator. Average population is computed from available years in the World Bank data. Continent-time fixed effects are a dummy for every year on every continent. Continent here are 7 world regions. Regressions are on unbalanced cross-country sample during 1989-2018.
An additional, immediate concern in Table 1 is reverse causality where poverty leads to conflict and not the other way around. And indeed, the robust relationship between conflict debt and poverty rates shown in Table 1 is still present if we use a simple dummy for contemporaneous conflict – as shown in Table 2. However, in Appendix Table A2 we show that the association between conflict debt and the poverty rate is robust to controlling for contemporaneous conflict whereas the reverse is not true. Countries with large conflict debts suffer from poverty but, controlling for this debt, there is no association between poverty and armed conflict. Also, in column (4) of Table 2, we see that contemporaneous conflict loses its size and significance when controlling for continent time fixed effects. This means that poverty rates are stronger related to past conflict than to present conflict which implies that reverse causality cannot be the main driver of the correlations shown in Table 1.
Table 2: Poverty Rate and Conflict (1) (2) (3) (4) Poverty rate Poverty rate Poverty rate Poverty rate Conflict year 17.16*** 15.44*** 2.350** 0.606 (3.347) (3.216) (1.058) (1.008) Country fixed effects No No Yes Yes Time fixed effects No Yes Yes No Continent-time fixed effects No No No Yes Adjusted R-squared 0.0145 0.0463 0.271 0.417 Observations 3238 3238 3238 3238
Notes: Robust standard errors clustered at the country level in parentheses. * p<0.1, ** p<0.05, *** p<0.01. The dependent variable is poverty rate (in percent), interpolated linearly to replace missing values between two data points. A conflict year is defined by a year with 0.08 fatalities per 1,000 population. We use average population to avoid time variation in the denominator of the indicator. Average population is computed from available years in the World Bank data. Continent-time fixed effects are a dummy for every year on every continent. Regressions are on unbalanced cross-country sample during 1989-2018.
There is an important intensive margin in the relationship between conflict debt and poverty. A heavier debt burden is associated with higher poverty rates even when we only differentiate between country/years with a conflict debt. The heavier the debt weighs, the higher is poverty (Appendix Table

13
A3). This also suggests strong catch-up effects as the debt depreciates which we will turn towards in what follows.
The second aspect is that the link we find is not specific to the poverty measure we use. In the appendix we use the multi-dimensional poverty index developed in Alkire and Jahan (2018) to show that the strong link between debt burden and poverty also holds in that data (Appendix Table A4). We find extremely similar magnitudes to the results shown in Table 1. The multidimensional aspect of the data also allows to investigate the channels through which conflict debt might affect conflict. We find very little on the health dimension (nutrition and child mortality) but strong links to the education dimension and even stronger links to all standard of living categories. This is reasonable as it is less likely that, years after conflict ended, conflict history still affects harvests. But if it disrupts the economy and affects human capital accumulation then this will affect years of schooling and assets in the mid-term. We find that deprivation from public services like sanitation, electricity and drinking water increases with conflict burden which suggests that the state capacity link as a confounder could be relevant.
When interpreting Tables 1 and 2 it has to be kept in mind that the goal of our empirical exercise is not to show the dynamic response of poverty to innovations in conflict. Instead, we are interested to quantify broad trends at the country level as they are shown in Figures 1 and 2. What our empirical results show is that poverty trends change in line with a model in which conflict leaves a debt. We will bring this model to the cross-sectional data below and this is also where we see the strength of our statistical model – it provides a useful hypothesis for all levels of and for panel and cross-sectional data.
If we were to interpret the coefficient in Column (3) of Table 1 as causal – how economically significant is the relationship? The standard deviation of the debt variable is 0.6 which would imply that an increase of one standard deviation in conflict debt is associated with an increase of 1 percentage point (0.6*1.767). But the standard deviation is a bad measure of the burden on some countries with the maximum being at 5 which would imply an increase of almost 9 percentage points of the poverty rate.
One simple way to understand the dynamic relationship found in the regression is to simulate conflict debt for a conflict and plot the implied divergence in the poverty rate over time. In Figure 3 we show the implied increase of the poverty rate with a conflict of five years duration - symbolized by a series of five 1s on the X-axis. With the start of the conflict the poverty rate increases dramatically and to over 7 percentage points at the end of the five years of the conflict duration. It then falls gradually as the conflict debt falls but is still about 1 percentage points higher ten years after the end of the conflict. This kind of relationship leads to an image of catching up seen in Figure 2 but is also consistent with persistent divergence if a country enters the so-called violence trap, i.e. a repeated cycle of peace and violence. This is shown in a Figure 4. Divergence here is much more persistent. Poverty rates in countries like Afghanistan, the Democratic Republic of Congo or Somalia could therefore be explained by such a pattern.

14
Figure 3: Simulation of Dynamics in Poverty with a Single Conflict Episode
Notes: Calculations are based on equations (1) and (2) in the text. As parameter estimates we use 𝛿𝛿 equal to 0.88 and the estimate 𝛽𝛽 from column (3) of Table 1.
In other words, violent armed conflict could play a very important part in keeping countries from fighting poverty effectively. However, when interpreting these relationships, it should be kept in mind that it is likely that armed conflict is only part of a larger relationship between weak institutions, a weak economy and a weak state with causal links between all four.
Figure 4: Simulation of Dynamics in Poverty in a Conflict Trap
Notes: Calculations are based on equations (1) and (2) in the text. As parameter estimates we use 𝛿𝛿 equal to 0.88 and the estimate 𝛽𝛽 from column (3) of Table 1.
What our empirical analysis has demonstrated is that poverty reduction often failed in areas which were plagued by conflict. It is less clear whether reducing armed conflict will automatically lead to a reduction in poverty, i.e. it is not certain whether peace is a sufficient condition for poverty reduction. But it has to be kept in mind that the much better identified micro literature finds dramatic effects of

15
conflict exposure on physical and mental health, education levels and asset evaluations. If the size of the effect found in these case studies is any guide then it is entirely realistic that intense conflict as we study it here is responsible for a population suffering from reduced human capital and low investments for years after the violence has stopped. So, whereas the macro results by themselves do not constitute conclusive evidence they strongly suggest a causal relationship in the context of the micro literature on the effect of violence on human capital.
Regional Results We now turn towards the regional data which allows us to explore the empirical relationship between conflict history and poverty at the subnational level. In Figure 5 we show both the average poverty level and the average conflict debt in the same year for all admin 1 regions available in the data. Importantly, we have matched the conflict history to the region and year of availability of the poverty data.
Figure 5: Poverty and Conflict History at Admin1 Level
Source: PovcalNet by World Bank, and UCDP. Notes: Conflict debt is the discounted history of conflict years where a conflict year is defined as by more than 0.08 fatalities per 1,000 population.
The main insight from these data is that poverty is indeed often concentrated in regions which also have a high conflict debt. In Table 3 we confirm this with regressions similar to the country level but now weighted by population.5 Strikingly, the coefficients we find in columns (1) and (2) of Table 3 are very similar in magnitude as the cross-country finding in column (1) of Table 1. An important question is, however, whether this is driven by the within-country or between country levels of poverty and violence. In column (3) we show that the coefficient is extremely similar to the coefficients found in
5 The main idea of weighting by population is that we want to reduce the level of noise coming from regions with only few survey respondents. The coefficients we find without population weighting are similar but precision falls dramatically.

16
column (3) despite the fact that the variation is now within country across regions instead of within country across time. But we also find that the country-level conflict debt is strongly associated with regional poverty in columns (4) and (5). When we run a horserace between both in columns (6) and (7) we get stronger results from the country-level debt, but it is hard to rule out local effects.6
This suggests both regional and country conflict debt play a role for poverty but that there are important regional spill-overs at work which affect the regional result. One obvious channel through which this will be the case is internal displacement which is affecting a large number of people.7 Displacement will lead the regional conflict debt and poverty measures to diverge if the channel is the loss of individual human capital which is displaced at the same time at which it is harmed. Another possible channel is that risk perceptions change for an entire country if a region experiences violence. Outside investors will then not invest in any region of a country. This might also explain why subnational studies sometimes find less strong effects of violence on the economy when compared to macro studies.
Table 3: Poverty and Conflict Debt: Sub-country Level (Weighted Regressions)
(1) (2) (3) (4) (5) (6) (7) Poverty
rate Poverty
rate Poverty
rate Poverty
rate Poverty
rate Poverty
rate Poverty
rate Conflict debt 11.27*** 4.672** 2.279 7.005** 2.581 (3.252) (1.880) (1.484) (3.557) (2.121) Country conflict debt 16.01*** 7.785*** 12.03*** 6.374** (3.225) (2.240) (3.469) (2.519) Country fixed effects No No Yes No No No No Continent fixed effects No Yes No No Yes No Yes Adjusted R-squared 0.0279 0.527 0.737 0.0352 0.530 0.0435 0.531 Observations 1885 1885 1885 1885 1885 1885 1885 Notes: Robust standard errors in parentheses. * p<0.1, ** p<0.05, *** p<0.01. The dependent variable is poverty rate (in percent). Conflict debt is the discounted history of conflict years where a conflict year is defined as by more than 0.08 fatalities per 1,000 population. Country conflict debt is computed in the same manner at the country level. The regressions weighted by population are on the cross-sectional data of sub-country regions between 1992-2018 whenever sub-regional poverty rates are available. In Table 4 we use both the UCDP and the ACLED data to look into the relationship between conflict history and the poverty rate at the regional level but within the continent of Africa. As before we use population weights to reduce measurement error. Columns (1) and (2) show results for UCDP and columns (3) and (4) show results for ACLED. All results are for the African continent only and are remarkably robust between the two conflict data sets. Most importantly, the results are now robust to country fixed effects in columns (2) and (4), i.e. they are significant within countries. This provides some evidence for a local mechanism being at play. It is again remarkable how the coefficient on conflict debt is robust across tables with magnitudes being very similar in Tables 1, 3 and 4.
6 In Appendix Table A5 we show that this is also robust to dropping countries for which we have only aggregate country observations. 7 According to the UNHCR, some 41.3 million people were internally displaced due to armed conflict at the end of 2018.

17
Table 4: Poverty and Conflict Debt at Sub-national Regions in Africa: UCDP and ACLED data. (1) (2) (3) (4) Poverty rate Poverty rate Poverty rate Poverty rate Conflict debt 14.13*** 5.705* 9.974*** 5.295** (3.670) (3.055) (3.182) (2.140) Violence data UCDP UCDP ACLED ACLED Country fixed effects No Yes No Yes Population weight Yes Yes Yes Yes Adjusted R-squared 0.0425 0.602 0.0322 0.604 Observations 618 618 618 618
Notes: Robust standard errors in parentheses. * p<0.1, ** p<0.05, *** p<0.01. The dependent variable is poverty rate (in percent). Conflict debt is the discounted history of conflict years where a conflict year is defined as by more than 0.08 fatalities per 1,000 population. The regressions are on the cross-sectional data of sub-country regions in Africa between 2005-2018 whenever sub-regional poverty rates are available.
Evidence from within Uganda In order to drill into the dynamics at the regional level, we look at conflict history and poverty rates in a case study with comparable regional poverty data and more than one time-dimension: Uganda. We have access to poverty data for 2012 and 2016. This is a period a few years after the most intense fighting took place in Uganda and, in fact, we need to use the more detailed ACLED data so capture any armed violence in this period. However, what we will be able to study in Uganda are regional recovery trends. If our framework above is correct we should see a reversion to the mean in the regions that were most violent before and which are now catching up in terms of poverty numbers with the rest of the country. And this is exactly what we see in the data.
Table 5: Poverty and Conflict History in Uganda 2012 and 2016 (1) (2) (3) (4) Poverty rate Poverty rate Poverty rate Poverty rate Conflict debt 10.26*** 1.928 (1.606) (1.515) County conflict debt 13.02*** 7.556*** (0.975) (1.103) District conflict debt 11.11*** 5.345*** (0.730) (0.592) Sub-county fixed effects Yes Yes Yes Yes Year fixed effects Yes Yes Yes Yes Adjusted R-squared 0.121 0.206 0.200 0.215 Observations 3026 3026 3026 3026
Notes: The dependent variable is poverty rate (in percent). Conflict debt is the discounted history of conflict years where a conflict year is defined as by more than 0.08 fatalities per 1000 population. We use average population to avoid time variation in the denominator of the indicator. County and district conflict debts are computed in the same manner at higher administrative units, respectively. Regressions are on the balanced panel dataset in 2012 and 2016. Robust standard errors in parentheses. * p<0.1, ** p<0.05, *** p<0.01
Figure 6 shows a strong correlation between conflict debt and poverty within Uganda. In particularly, the formerly violent North is also poorer. Second, as conflict debt is reduced over time, so is poverty. This raises the question of whether regions that were most heavily affected by poverty are catching up with the rest of the country. We test this more specifically in Table 5. Here we first look at the conflict debt at the sub-county level. We control for regional fixed effects and a time dummy for 2016 to capture general trends in poverty. There is a statistically and economically significant relationship between conflict history and the poverty rate at the regional level. Importantly, this relationship holds controlling for sub-county fixed effect which rules out long-term fixed characteristics driving the

18
relationship. This relationship between conflict debt and poverty also holds if we aggregate the violence data up to the county and even the district level. This is in line with the findings in Table 3 which suggest spill-overs. In column (4) we conduct a horse-race and find that there is relevant catch up at the county level even when controlling for the district level history. However, we also find that debt at the sub-county is not significant, i.e. the much smaller areas for which we have data, are probably not the right level of aggregation to understand the impact of conflict on poverty.
Figure 6: Relative Poverty Reduction in Uganda’s Formerly Violent North, 2012 and 2016
Source: PovcalNet by World Bank, and ACLED. Notes: Conflict debt is the discounted history of conflict years where a conflict year is defined as by more than 0.08 fatalities per 1,000 population.
19
Discussion and Take-away In this short note, we derived a measure that is motivated by the micro literature, theoretical considerations and makes sense of the dynamic relationship between poverty and armed conflict. We call the derived measure conflict debt as it behaves like debt which accumulates during conflict and only fades in its impact over time. Conflict debt is strongly associated with poverty rates at the country level and the subnational level.
What is, perhaps, a new aspect in our model is that armed conflict can both prevent poverty reduction and, once it is over, allows for strong catch-up effects. This is an important finding as it suggests a bridge to the subnational findings such as those on Vietnam by Miguel and Roland (2004) who find no relationship between past violence (bombings) and a host of poverty related variables. Our findings suggest that there is catch-up after armed conflict so that after a decade of peace one can expect to find only a mild relationship between past conflict intensity and poverty.
Whereas each single result in this note should not be interpreted as causal evidence, the consistent association between conflict debt and poverty across different data sets and levels of aggregation strongly suggests that we are picking up a causal link from conflict to poverty. However, it is important here to stress the micro literature which is better identified and proposes a channel running through human capital accumulation and low expectations. In line with this we find that the deprivations in education and living standards are strongly associated with conflict debt at the macro level.
If we are conservative and take the result in column (3) of Table 1 as a guide, the most conflict-ridden countries and regions would have 5-10 percentage points lower poverty rates without their conflict debt. However, if one takes the simple cross-country and regional correlations as a guide, the implied poverty reduction from eradicating conflict debt could be more than twice as high.
Our findings provide some additional evidence for the importance of preventing and de-escalating conflict. Approaches here differ but the most recent evidence suggests that power sharing and building institutional legitimacy provide a useful approach. In many contexts this will not be possible at a national level, but there is even evidence that local power sharing can help reduce violence locally (Fetzer and Kyburz 2018; Mueller and Rohner 2018; Bormann et al. 2019).
Data concerns remain. It is clear from the discussion in Corral et al. (2020) that it is exactly the years and areas with violence where measuring poverty is hardest. Uganda could be an example where poverty measurements were taken once the most intense violence was over. This also highlights an urgent need for data from countries which very recently emerged from conflict to assess the impact that armed conflict has on livelihoods.

20
Bibliography Abadie, Alberto, and Javier Gardeazabal. 2003. “The Economic Costs of Conflict: A Case Study of the
Basque Country.” American Economic Review (93) 1: 113-132.
Akbulut-Yuksel, Mevlude. 2014. “Children of War: the Long-Run Effects of Large-Scale Physical Destruction and Warfare on Children.” Journal of Human resources 49 (3): 634-662.
Akresh, Richard, Sonia Bhalotra, Marinella Leone, and Una Okonkwo Osili. 2012. “War and stature: Growing up during the Nigerian civil war.” American Economic Review 102 (3): 273-77.
Alkire, Sabina, and Selim Jahan. 2018. The New Global MPI 2018: Aligning with the Sustainable Development Goals. UNDP.
Amodio, Francesco, Leonardo Baccini, and Michele Di Maio. 2020. “Security, Trade, and Political Violence.” Journal of the European Economic Association. doi:10.1093/jeea/jvz060.
Barro, Robert J., and Xavier I. Sala-i-Martin. 2003. Economic Growth, Second Edition. The MIT Press.
Bazzi, Samuel, Robert A. Blair, Christopher Blattman, Oeindrila Dube, Matthew Gudgeon, and Richard Merton Peck. 2019. The Promise and Pitfalls of Conflict Prediction: Evidence from Colombia and Indonesia. National Bureau of Economic Research.
Behrman, Jere R., and Mark R. Rosenzweig. 2004. “Returns to Birthweigh.” Review of Economics and Statistics 86 (2): 586-601.
Besley, Tim, Thiemo Fetzer, and Hannes Mueller. 2020. “Terror and Tourism: The Economic Consequences of Media Coverage.” Barcelona GSE Working Paper 1141.
Besley, Timothy, and Hannes Mueller. 2012. “Estimating the Peace Dividend: The Impact of Violence on House Prices in Northern Ireland.” American Economic Review 102 (2): 810-33.
Besley, Timothy, and Hannes Mueller. 2018. “Predation, Protection, and Productivity: A Firm-Level Perspective.” American Economic Journal: Macroeconomics 10 (2): 184-221.
Besley, Timothy, and Hannes Mueller. 2020. “Revenue Mobilization and State Fragility.” In Macroeconomic Policy in Fragile States, edited by Ralph Chami, Raphael Espinoza and Peter J. Montiel. Oxford University Press.
Blattman, Christopher, and Jeannie Annan. 2010. “The Consequences of Child Soldiering.” The Review of Economics and Statistics 92 (4): 882--898.
Bormann, Nils-Christian, Lars-Erik Cederman, Scott Gates, Benjamin A. T. Graham, Simon Hug, Kaare W. Strøm, and Julian Wucherpfennig. 2019. “Power Sharing: Institutions, Behavior, and Peace.” American Journal of Political Science 63 (1): 84-100. doi:10.1111/ajps.12407.
Brakman, Steven, Harry Garretsen, and Marc Schramm. 2004. “The Strategic Bombing of German Cities during World War II and its Impact on City Growth.” Journal of Economic Geography (Oxford University Press) 4 (2): 201-218.
Brand, Sam, and Richard Price. 2000. The Economic and Social Costs of Crime. Home Office Research Study 217, London: Home Office.
Case, Anne, and Christina Paxson. 2008. “Stature and Status: Height, Ability, and Labor Market Outcomes.” Journal of political Economy 116 (3): 499-532.

21
Cerra, Valerie, and Sweta Chaman Saxena. 2008. “Growth Dynamics: The Myth of Economic Recovery.” American Economic Review 98 (1): 439-57.
Collier, Paul. 1999. “On the Economic Consequences of Civil War.” Oxford Economic Papers (Oxford University Press) 51 (1): 168-183.
Cook, Philip J., and John MacDonald. 2011. “Public Safety through Private Action: An Economic Assessment of BIDS.” Economic Journal 121 (552): 445-62.
Corral, Paul, Alexander Irwin, Nandini Krishnan, and Daniel Gerszon Mahler. 2020. Fragility and Conflict: On the Front Lines of the Fight against Poverty. Washington, DC: World Bank. https://openknowledge.worldbank.org/handle/10986/33324.
Davis, Donald R., and David E. Weinstein. 2002. “Bones, Bombs, and Break Points: The Geography of Economic Activity.” American Economic Review 92 (5): 1269-89.
Duflo, Esther. 2001. “Schooling and Labor Market Consequences of School Construction in Indonesia: Evidence from an Unusual Policy Experiment.” American Economic Review 91 (4): 795-813.
Fetzer, Thiemo, and Stephan Kyburz. 2018. Cohesive Institutions and Political Violence. CAGE Online Working Paper Series 377, Competitive Advantage in the Global Economy (CAGE).
Friedman, Matthew J., and Paula P. Schnurr. 1995. “The Relationship between Trauma, Post-Traumatic Stress Disorder, and Physical Health.” In Neurobiological and Clinical Consequences of Stress: From Normal Adaptation to Post-Traumatic Stress Disorder, edited by Matthew J. Friedman, Dennis S. Charney and Ariel Y. Deutch, 507-524. Philadelphia: Lippincott Williams & Wilkins Publishers.
Gibbons, Steve. 2004. “The Costs of Urban Property Crime.” Economic Journal 114 (499): F441-63.
Hegre, Håvard, Marie Allansson, Matthias Basedau, Michael Colaresi, Mihai Croicu, Hanne Fjelde, Frederick Hoyles, et al. 2019. “ViEWS: A Political Violence Early-Warning System.” Journal of Peace Research (Sage Publications) 56 (2): 155-174.
Hoeffler, Anke, and James Fearon. 2015. Post-2015 Consensus: Conflict and Violence Assessment. Copenhagen: Copenhagen Consensus Center.
Ichino, Andrea, and Rudolf Winter-Ebmer. 2004. “The Long-Run Educational Cost of World War II.” Journal of Labor Economics (University of Chicago Press) 22 (1): 57-86.
León, Gianmarco. 2012. “Civil Conflict and Human Capital Accumulation the Long-Term Effects of Political Violence in Peru.” Journal of Human Resources 47 (4): 991-1022.
Li, Bo, Clare M. Mahan, Han K. Kang, Seth A. Eisen, and Charles C. Engel. 2011. “Longitudinal Health Study of US 1991 Gulf War Veterans: Changes in Health Status at 10-Year Follow-up.” American Journal of Epidemiology 174 (7): 761-768.
Miguel, Edward, and Gerard Roland. 2011. “The Long-Run Impact of Bombing Vietnam.” Journal of Development Economics 96 (1): 1-15.
Minoiu, Camelia, and Olga N Shemyakina. 2014. “Armed Conflict, Household Victimization, and Child Health in Côte d'Ivoire.” Journal of Development Economics 108: 237-255.
Mueller, Hannes. 2016. “Growth and Violence: Argument for a Per Capita Measure of Civil War.” Economica 83 (331): 473-497.

22
Mueller, Hannes. 2012. “Growth Dynamics: The Myth of Economic Recovery: Comment.” American Economic Review 102 (7): 3774-77.
Mueller, Hannes, and Christopher Rauh. 2019. The Hard Problem of Prediction for Conflict Prevention. CEPR Discussion Papers 13748.
Mueller, Hannes, and Dominic Rohner. 2018. “Can Power-Sharing Foster Peace? Evidence from Northern Ireland.” Economic Policy 33 (95): 447-484.
Mueller, Hannes, and Julia Tobias. 2016. The Cost of Violence: Estimating the Economic Impact of Conflict. International Growth Centre (IGC).
Mueller, Hannes, Lavinia Piemontese, and Augustin Tapsoba. 2017. Recovery from Conflict : Lessons of Success. Washington: World Bank. https://openknowledge.worldbank.org/handle/10986/26137.
Organski, Abramo F. K., and Jacek Kugler. 1977. “The Costs of Major Wars: The Phoenix Factor.” American Political Science Review 71 (4): 1347-1366.
Raleigh, Clionadh, and Roudabeh Kishi. 2019. Comparing Conflict Data: Similarities and Differences across Conflict Datasets. The Armed Conflict Location & Event Data Project (ACLED).
Rosen, Jules, and Robert Fields. 1988. “The LongTerm Effects of Extraordinary Trauma: A Look Beyond PTSD.” Journal of Anxiety Disorders 2 (2): 179-191.
Sanchez de la Sierra, Raul. 2020. “On the Origins of the State: Stationary Bandits and Taxation in Eastern Congo.” Journal of Political Economy 32-74.
Sibai, Abla M, Haroutune K. Armenian, and Samer Alam. 1989. “Wartime Determinants of Arteriographically Confirmed Coronary Artery Disease in Beirut.” American Journal of Epidemiology (Oxford University Press) 130 (4): 623-631.
Singhal, Saurabh. 2019. “Early Life Shocks and Mental Health: The Long-Term Effect of War in Vietnam.” Journal of Development Economics 141: 102244.
Soares, Rodrigo. 2009. “Welfare Costs of Crime and Common Violence: A Critical Review.” In The Costs of Violence, edited by Stergios Skaperdas, Rodrigo Soares, Alys Willman and Stephen C. Miller, 27-47. Washington, DC: World Bank. http://documents.worldbank.org/curated/en/521481468333266536/The-costs-of-violence.
Strauss, John, and Duncan Thomas. 1998. “Health, Nutrition, and Economic Development.” Journal of Economic Literature (American Economic Association) 36 (2): 766-817.
Tapsoba, Augustin. 2018. The Cost of Fear: Impact of Violence Risk on Child Health During Conflict. HiCN Working Papers No 279, Households in Conflict Network.
The Economist. 2015. “Fear itself.” The Economist. 24 October. Accessed May 15, 2020. https://www.economist.com/international/2015/10/24/fear-itself.
The LSE-Oxford Commission on State Fragility, Growth and Development. 2018. Escaping the Fragility Trap. London: International Growth Centre (IGC).
van Ours, Jan C., and Ben Vollaard. 2016. “The Engine Immobiliser: A Non-starter for Car Thieves.” Economic Journal 126 (593): 1264-91.

23
Willard, Kristen L., Timothy W. Guinnane, and Harvey S. Rosen. 1996. “Turning Points in the Civil War: Views from the Greenback Market.” American Economic Review (American Economic Association) 86 (4): 1001-18.
Wolfe, Jessica, Paula P. Schnurr, Pamela J. Brown, and Joan Furey. 1994. “Posttraumatic Stress Disorder and War-Zone Exposure as Correlates of Perceived Health in Female Vietnam War Veterans.” Journal of Consulting and Clinical Psychology 62 (6): 1235-40. doi:10.1037/0022-006X.62.6.1235.
World Bank. 2017. The Toll of War : The Economic and Social Consequences of the Conflict in Syria. Washington, DC.: World Bank. https://openknowledge.worldbank.org/handle/10986/27541.
Zussman, Asaf, and Noam Zussman. 2006. “Assassinations: Evaluating the Effectiveness of an Israeli Counterterrorism Policy Using Stock Market Data.” Journal of Economic Perspectives (American Economic Association) 20 (2): 193-206.

24
Appendix Figure A1 shows the relationship between child mortality and conflict history. We find a somewhat different pattern if we look at child mortality instead of poverty rates (shown in the main text). Here the catch-up dynamics in countries affected by conflict are overwhelming. These results are in line with the findings on the nutrition dimension in Table A4. Child mortality catches up very quickly after conflict ends and there is therefore no significant relationship between mortality and conflict debt in the long run.
Figure A1: Child Mortality and Conflict History
Source: World Bank, and UCDP. Notes: A conflict year is defined by a year with 0.08 fatalities per 1,000 population. We use average population to avoid time variation in the denominator of the indicator. Average population is computed from available years in the World Bank data. Conflict year share is a share of conflict year during 1990-2019

25
Figure A2: Poverty and Conflict History at Admin1 Level in Africa using ACLED data
Source: PovcalNet by World Bank, and ACLED. Notes: Conflict debt is the discounted history of conflict years where a conflict year is defined as by more than 0.08 fatalities per 1,000 population.
Table A1: Summary Statistics: Conflict Debt and Poverty Rate N Mean SD. Min. Max. Countries Poverty rate (%) 3,238 17.263 22.802 0.000 94.100 Conflict debt 3,238 0.177 0.612 0.000 4.970 Subregions Poverty rate (%) 1,885 15.975 24.494 0.000 97.546 Conflict debt 1,885 0.088 0.364 0.000 3.983 Subregions in Africa Poverty rate (%) 618 40.204 27.256 0.000 97.546 Conflict debt 618 0.139 0.431 0.000 3.114 Conflict debt (ACLED) 618 0.175 0.540 0.000 3.570 Sub-counties in Uganda Poverty rate (%) 3,026 22.645 16.254 0.610 94.160 Conflict debt 3,026 0.069 0.249 0.000 3.089
Notes: All violence data are from UCDP, except subregions in Africa when the data from ACLED are used for comparison. The poverty rate is the poverty headcount ratio at $1.90 a day (2011 PPP). Countries group is a cross-country panel during 1989-2018. The poverty data of this group are interpolated linearly to replace missing values between two data points. The group of Subregions is cross-sectional from the Global Poverty Geodatabase 1992-2018. Subregions in Africa are from the previous data 2008-2018. The sample of Sub-counties in Uganda is from 2012 and 2016.

26
Table A2: Poverty Rate and Conflict: Cross-country Level (1) (2) (3) (4) Poverty rate Poverty rate Poverty rate Poverty rate Conflict debt 9.961*** 9.831*** 1.780* 1.864* (1.295) (1.271) (1.060) (1.062) Conflict year -8.752* -10.18** -0.0595 -1.843 (4.803) (4.698) (1.254) (1.417) Country fixed effects No No Yes Yes Time fixed effects No Yes Yes No Continent-time fixed effects No No No Yes Adjusted R-squared 0.0520 0.0824 0.276 0.422 Observations 3238 3238 3238 3238
Notes: The dependent variable is poverty rate (in percent), interpolated linearly to replace missing values between two data points. A conflict year is defined by a year with 0.08 fatalities per 1,000 population. We use average population to avoid time variation in the denominator of the indicator. Average population is computed from available years in the World Bank data. Conflict debt is the discounted history of conflict years. Continent-time fixed effects are a dummy for every year on every continent. Regressions are on unbalanced cross-country sample during 1989-2018. Robust standard errors clustered at the country level in parentheses. * p<0.1, ** p<0.05, *** p<0.01
Table A3: Poverty Rate and Debt Cut-off, Cross-country Level (1) (2) Poverty rate Poverty rate Minor debt burden -1.941 1.624 (1.287) (1.276) Some debt burden 13.75*** 14.47*** (1.694) (1.757) Heavy debt burden 21.13*** 20.43*** (1.886) (1.872) Country fixed effects No No Time fixed effects No Yes Adjusted R-squared 0.0774 0.108 Observations 3238 3238
Notes: The dependent variable is poverty rate (in percent), interpolated linearly to replace missing values between two data points. Discounted cumulative violent years is computed from dummy of violent year + 0.88*Lagged 1 of discounted cumulative year. The minor debt is 0 up to .19, some is up to .68 and heavy is over 0.68 Regressions are on unbalanced cross-country sample during 1990-2017. Robust standard errors clustered at the country level in parentheses. * p<0.1, ** p<0.05, *** p<0.01

27
Table A4: Multidimensional Poverty and Conflict Debt, Cross-country Level
MPI headcount ratio (%)
MPI headcount ratio (%)
Deprived in nutrition (%)
Deprived in child mortality (%)
Deprived in years of schooling (%)
Deprived in school attendance (%)
Conflict debt 9.342*** 4.146*** 1.514 1.088 2.372** 3.210*** (2.189) (1.133) (0.919) (0.791) (0.919) (1.033) Time fixed effects No Yes Yes Yes Yes Yes Adjusted R-squared 0.0703 0.682 0.496 0.551 0.475 0.470 Observations 293 293 267 272 293 272
Deprived in cooking fuel (%)
Deprived in sanitation (%)
Deprived in drinking water (%)
Deprived in electricity (%)
Deprived in housing (%)
Deprived in assets (%)
Conflict debt 3.700*** 3.328*** 4.563*** 3.699*** 4.287** 4.376*** (1.234) (1.096) (0.908) (1.165) (1.732) (1.360) Time fixed effects Yes Yes Yes Yes Yes Yes Adjusted R-squared 0.675 0.670 0.644 0.696 0.531 0.558 Observations 284 293 293 288 284 292
Notes: The dependent variable is poverty rate (in percent). Conflict debt is the discounted history of conflict years where a conflict year is defined as by more than 0.08 fatalities per 1,000 population. Country conflict debt is computed in the same manner at the country level. The regressions weighted by population are on the cross-sectional data of sub-country regions between 1992-2018 whenever sub-regional poverty rates are available. Robust standard errors clustered at the country level in parentheses. * p<0.1, ** p<0.05, *** p<0.01
Table A5: Poverty and Conflict Debt: Sub-country Level without Country Observations (Weighted Regressions)
(1) (2) (3) (4) (5) (6) (7) Poverty rate Poverty rate Poverty rate Poverty rate Poverty rate Poverty rate Poverty rate Conflict debt 10.98*** 4.522** 2.279 6.844* 2.519 (3.243) (1.899) (1.475) (3.547) (2.130) Country conflict debt 15.59*** 7.549*** 11.71*** 6.178** (3.222) (2.262) (3.468) (2.532) Country fixed effects No No Yes No No No No Continent fixed effects No Yes No No Yes No Yes Adjusted R-squared 0.0268 0.522 0.736 0.0338 0.525 0.0418 0.525 Observations 1862 1862 1862 1862 1862 1862 1862
Notes: The dependent variable is poverty rate (in percent). Conflict debt is the discounted history of conflict years where a conflict year is defined as by more than 0.08 fatalities per 1,000 population. Country conflict debt is computed in the same manner at the country level. The regressions weighted by population are on the cross-sectional data of sub-country regions between 1992-2018 whenever sub-regional poverty rates are available. Robust standard errors in parentheses. * p<0.1, ** p<0.05, *** p<0.01
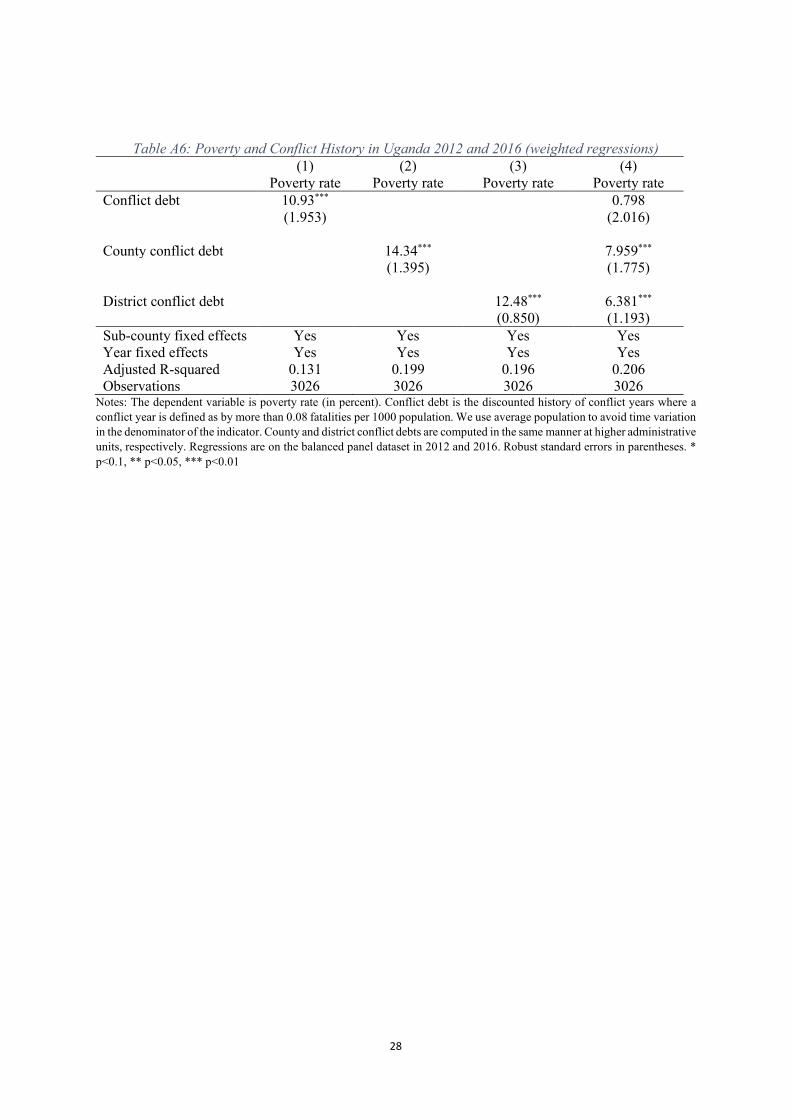
28
Table A6: Poverty and Conflict History in Uganda 2012 and 2016 (weighted regressions) (1) (2) (3) (4) Poverty rate Poverty rate Poverty rate Poverty rate Conflict debt 10.93*** 0.798 (1.953) (2.016) County conflict debt 14.34*** 7.959*** (1.395) (1.775) District conflict debt 12.48*** 6.381*** (0.850) (1.193) Sub-county fixed effects Yes Yes Yes Yes Year fixed effects Yes Yes Yes Yes Adjusted R-squared 0.131 0.199 0.196 0.206 Observations 3026 3026 3026 3026
Notes: The dependent variable is poverty rate (in percent). Conflict debt is the discounted history of conflict years where a conflict year is defined as by more than 0.08 fatalities per 1000 population. We use average population to avoid time variation in the denominator of the indicator. County and district conflict debts are computed in the same manner at higher administrative units, respectively. Regressions are on the balanced panel dataset in 2012 and 2016. Robust standard errors in parentheses. * p<0.1, ** p<0.05, *** p<0.01