confined masonry for seismically resilient low-cost housing in india
TRANSCRIPT
Confined Masonry for Seismically Resilient Low-Cost Housing in India:
A Design and Analysis Method
by
Christopher F. Porst
B.S. Civil and Environmental Engineering
University of Illinois at Urbana-Champaign, 2012
ARCHIVESMASSACHUSETTS INSTITUTE
OF r TECHNOLOLGY
JUL 02 2015
LIBRARIES
Submitted to the Department of Civil and Environmental Engineering
in Partial Fulfillment of the Requirements for the Degree of
Master of Science in Civil and Environmental Engineering
at the
Massachusetts Institute of Technology
June 2015
2015 Christopher F. Porst. All rights reserved.
The author hereby grants to MIT permission to reproduce and to
distribute publicly paper and electronic copies of this thesis document
in whole or in part in any medium now known or hereafter created.
Signature of Author: Signature redactedDepartment of Civil and Envir nA
015
Certified by: Signature redactedJohn Ochsendorf
Professor of Architecture and Civil and Environmental Engineering
j ) It Thesis Supervisor
Accepted by: Signature redactedIF eidiNepf
Donald and Martha Harleman Professor of Civil and Environmental E4gineering
Chair, Departmental Committee for Graduate Committee

Confined Masonry for Seismically Resilient Low-Cost Housing in India:A Design and Analysis Method
by
Christopher F. Porst
Submitted to the Department of Civil and Environmental Engineeringon May 8, 2015 in Partial Fulfillment of the Requirements for the
Degree of Master of Science in Civil and Environmental Engineering
Abstract
Confined masonry (CM) is a viable housing typology that is resilient and economical for developingcountries in seismic regions. Given its suitability for low-tech environments, multiple authors havepublished instructions on CM construction that do not require engineering knowledge. As a result theseguidelines impose constrictive design requirements. Analysis methods exist for calculating the stressdemand on shear walls of a CM building under earthquake loads which may be applied to any design, butthey require technical expertise to perform. A procedure for designing confined masonry buildings ispresented that employs a combination of seismic analysis techniques to take into account torsional effectsand allow for complex designs while requiring low computational effort. Parametric studies are performedon this procedure which show reliable, conservative structural design outputs.
Confined masonry is a structural wall system, therefore its seismic resilience depends on the wall shearstrength, which is related to the compressive strength of the masonry. In India bricks used to build homesare often of poor compressive strength, even lower than the minimum allowed by the Indian masonry code,which is lower than that prescribed in other international standards. Experimentation was conducted on thestrength of masonry in Gujarat, India to investigate the effect of varying mortar qualities when low strengthbricks are used. With average brick strengths below 2.5 MPa a mud mortar with no cement and a 1:8cement:sand ratio mortar resulted in approximately 41% and 21% higher prism strengths, respectively, thana 1:6 cement:sand ratio mortar. This shows that a mortar with less cement would save cost and result in amore resilient structure when building with bricks of this strength. Observations and hypotheses arepresented for this behavior, but larger scale testing is recommended to better understand this outcome andinform better building practices that can save lives and money.
Thesis Supervisor: John Ochsendorf
Title: Professor of Architecture and Civil and Environmental Engineering


Acknowledgements
This project would not have been possible without the generous financial and administrativesupport of the Sir Darabji Tata Trust and the Tata Center for Technology and Design at MIT andits members.
I could not have done this research without the help and support of my advisor and friend ProfessorJohn Ochsendorf. His guidance and unwavering confidence in me were encouraging in times ofuncertainty and they provided solid ground on which I could always stand. His influence meansgreat deal to me and I will forever be grateful to him.
Throughout my research Dr. Svetlana Brzev, faculty member at the British Columbia Institute ofTechnology, has provided invaluable guidance. From problem identification onward she hasprovided support in the most selfless way I have ever seen. None of this research would be possiblewithout her and I am forever thankful for her contributions.
Vivek Rawal of People in Centre and all of the firm's members were valuable partners in thisresearch. They provided enthusiastic support for my work, especially in the design and executionof my experiments. On my trips to India they were a familiar group that made me feel welcome inan unfamiliar country. These projects would not have been completed without them and their helpand friendship is greatly appreciated.
P.B. Prajapati of the Government Polytechnic for Girls in Ahmedabad was extremely generous toallow the researchers to use his department's facilities for the experimental work on masonryprisms. Mr. Prajapati provided assistance during experimentation and welcoming and enthusiastichospitality. The researchers are grateful to Mr. Prajapati and the school.
Vineet Kothari and Shija Sam, students at the LD College of Engineering, helped with prismtesting and tested a number of prisms after I had left the country. Their assistance and hard workis greatly appreciated.
I would like to thank the KBM Engineering Research Laboratory for their excellent work in testingmaterials for this research. Their diligence and competence were beyond what I could have hopedfor, and I am thankful to them.
Dr. Thomas Poinot provided excellent guidance as my post-doc supervisor in the Tata Center. Heprovided practical advice that was always relevant, useful, and reasonable amidst expectations thatsometimes felt unreasonable. He was also a good friend and I thank him.
I would like to thank Mike Laracy. As my officemate at MIT he kept life from getting too stressful,as my teammate he was a trustworthy and fun comrade, as my roommate he put up with myannoying lifestyle, and as my friend he continues to provide good memories that will last forever.I would also like to wish him and his new fiance Maggie a long and happy marriage.
Lastly, I would like to thank my family. The love and support of my mom, dad, brother, and sistercontinue to positively influence my life in ways that cannot be measured, and in return I give themmy love and endless gratitude.


Table of ContentsS Introduction .................................................................................................................................... - I I
1.1 Context and Problem Statement............................................................................................. - 11
1.2 Introduction to Confined M asonry......................................................................................... - 13
1.3 CM Construction and Analysis Guidelines............................................................................ - 13
1.4 M aterial Properties and Experim ental Research .................................................................... - 14
1.5 Thesis Outline ........................................................................................................................ - 16
2 Confined M asonry ......................................................................................................................... - 17
2.1 Perform ance in Past Earthquakes........................................................................................... - 17
2.2 Seism ic Behavior of CM W alls ............................................................................................. - 18
2.3 Suitability for India: Advantages and Draw backs ................................................................. - 20
3 Current Seism ic Analysis Approaches for CM Buildings ............................................................. - 23
3.1 Introduction............................................................................................................................ - 23
3.2 Equivalent Fram e and Finite Elem ent M odels....................................................................... - 23
3.3 Simplified Method for Seismic Analysis of Masonry Buildings ....................... - 24
3.4 Seism ic Analysis of Irregular M asonry Buildings ................................................................. - 26
4 Seism ic Design Procedure for Confined M asonry Buildings ........................................................ - 27
4.1 Introduction............................................................................................................................ 27
4.2 SM SA Design Procedure ....................................................................................................... .- 28
4.3 Sim plified M ethod for Irregular Buildings ............................................................................ - 31
4.3.1 Introduction - Original M ethod by Escobar .................................................................. - 31
4.3.2 Procedure ....................................................................................................................... - 31
4.3.3 Simplifications ............................................................................................................... - 35
4.4 Param etric Study.................................................................................................................... - 37
4.5 Design Exam ple - Rural Building in G ujarat, India.............................................................. - 40
4.5.1 Introduction.................................................................................................................... - 40
4.5.2 Exam ple ......................................................................................................................... - 40
4.6 Sum m ary ................................................................................................................................ - 45
5 M aterial Properties and Experim entation....................................................................................... - 47
6 Sum m ary and Conclusions............................................................................................................. .51
6.1 Future Research N eeds........................................................................................................... - 52
6.1.1 Continuing Partner Collaboration .................................................................................. - 52
6.1.2 Confined M asonry Formw ork........................................................................................ - 52
6.1.3 Continued Experim entation ........................................................................................... - 53

Appendix A - References ...................................................................................................................... 55 -
Appendix B - Supplem entary M aterial for Design M ethod .................................................................. - 59 -
B. I M ethod Flow Chart ................................................................................................................ 59 -
B.2 Design M ethod Spreadsheet .................................................................................................... 60 -
B.3 Finding the Center of Rigidity (CR) ................................................ 62-
B.4 Comparison of M odels of M asonry Shear Strength................................................................ 63 -
Appendix C - Experim ental Study on M asonry Compressive Strength................................................ - 65 -
C.l Introduction............................................................................................................................ -65 -
C.2 Current Hypothesis ............................................................................................................ 67 -
C.3 Results Sum mary ............................................................................................................... 68 -
C.4 M aterials ................................................................................................................................ 68 -
C.4.1 Bricks ............................................................................................................................. - 68-
C.4.2 Cem ent........................................................................................................................... 69 -
C.4.3 Sand................................................................................................................................ 69 -
C.4.4 M ud................................................................................................................................ - 69 -
C.4.5 W ater.............................................................................................................................. 70 -
C.5 Construction ........................................................................................................................... 70 -
C.5. M ortar M ixing................................................................................................................ 70-
C.5.2 Prism s............................................................................................................................. 71 -
C.5.3 M ortar Cubes ................................................................................................................. 72 -
C.6 Test Setup............................................................................................................................... 72 -
C.6.1 Test Specim ens and Standards........................................................................................ 72 -
C.6.2 Testing M achine............................................................................................................. 73 -
C.7 Test Results............................................................................................................................- 74 -
C.7. Brick W ater Absorption Ratio ........................................................................................ 74 -
C.7.2 Brick Strengths............................................................................................................... 75 -
C.7.3 M ortar Com pressive Strength ......................................................................................... 76 -
C.7.4 Prism Com pressive Strength ...................................................................................... 77-
C.8 Discussion and Conclusions................................................................................................... - 79 -
Appendix D - A Study on Brick Strengths in the State of Gujarat, India ........................ - 85 -
D.l Introduction............................................................................................................................ 85 -
D.2 Testing Procedures................................................................................................................. 86 -
D .3 Results and D iscussion .......................................................................................................... - 86 -
Appendix - N otation List ................................................................................................................... 91 -
Appendix F - Supplementary Materials from the Indian Masonry Code ..........................................- 93 -


-10-

Chapter 1 - Introduction
i Introduction
1.1 Context and Problem Statement
Much of India is prone to substantial earthquakes (Fig.
1.1) and housing for families in the economically
weaker sector (EWS) and lower income group (LIG)
is highly vulnerable to such events. This fact was
exposed in the 2001 Bhuj earthquake that killed over
13,800 people and destroyed or damaged more than
one million structures (Fig. 1.2), with buildingS=High Seismicity
damage as the primary cause of human casualties E= Low Seismicity
(Jain et al. 2002; Saito et al. 2004; Murty et al. 2005).
In poorer sectors the materials and workmanship for Fig. 1.1. Map of India designating zones of highseismicity (Zones III-IV) and low seismicity
housing are often of low quality, and builders are (Zones I-1I), derived from IS 1893.
unfamiliar with modem structural techniques (Murty
et al. 2006). There is also a lack of motivation to invest in safe homes because many Indians have not been
exposed to a devastating earthquake and their financial priorities lie in daily life functions (Arya et al. 2005).
To make things worse, the Ministry of Housing and Urban Poverty Alleviation estimates the rural and urban
housing shortages in India at 40 and 19 million homes, respectively, and these numbers continue to grow
due to the increasing population and rapid urbanization (Kurup 2014; Jain 2015). There is a substantial
need for housing solutions that cater to the needs and resources of the lower economic classes. The current
research focuses on this issue within the context of India, however it applies to all earthquake prone
developing countries.
- 11 -
Christopher F. Porst
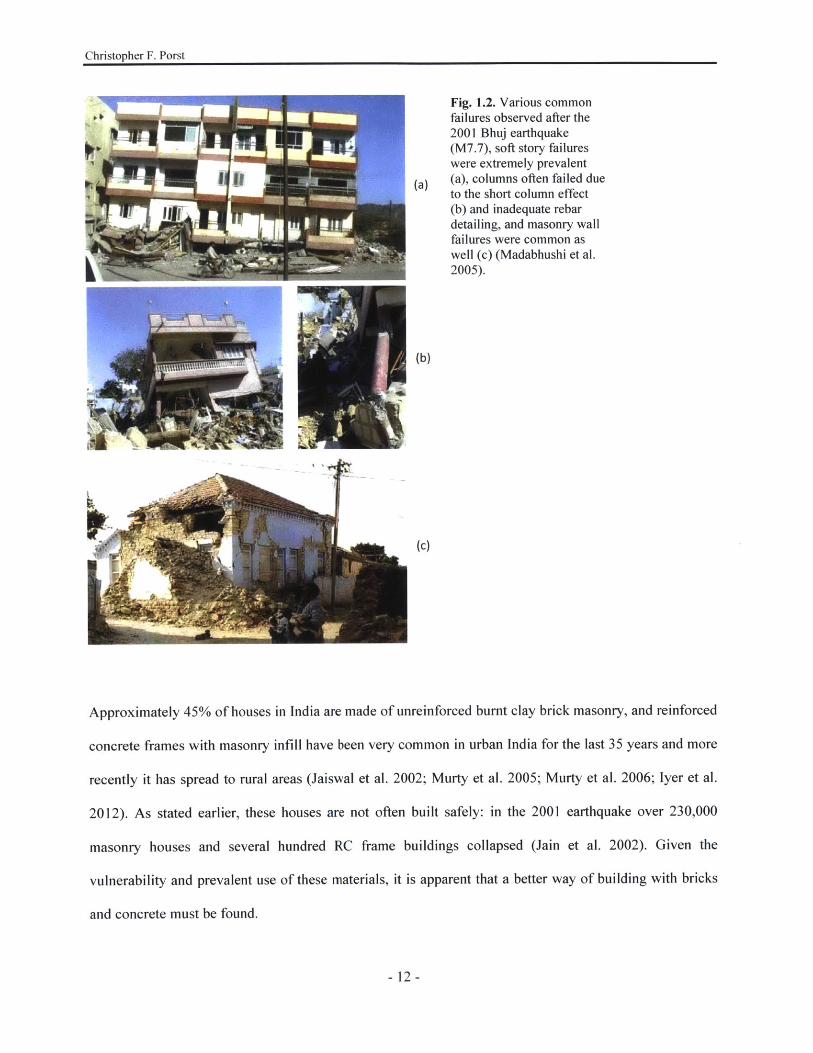
Fig. 1.2. Various commonfailures observed after the2001 Bhuj earthquake(M7.7), soft story failureswere extremely prevalent
(a) (a), columns often failed dueto the short column effect(b) and inadequate rebardetailing, and masonry wallfailures were common aswell (c) (Madabhushi et al.2005).
(b)
(c)
Approximately 45% of houses in India are made of unreinforced burnt clay brick masonry, and reinforced
concrete frames with masonry infill have been very common in urban India for the last 35 years and more
recently it has spread to rural areas (Jaiswal et al. 2002; Murty et al. 2005; Murty et al. 2006; Iyer et al.
2012). As stated earlier, these houses are not often built safely: in the 2001 earthquake over 230,000
masonry houses and several hundred RC frame buildings collapsed (Jain et al. 2002). Given the
vulnerability and prevalent use of these materials, it is apparent that a better way of building with bricks
and concrete must be found.
- 12 -

Chapter 1 - Introduction
1.2 Introduction to Confined Masonry
Fig. 1.3. Sketch of atwo-story confinedmasonry buildingfrom Brzev (2007).
Confined masonry is a proposed solution to the need for seismically resilient housing in India. CM is a
structural wall system comprised of load bearing masonry walls with surrounding reinforced cement
concrete (RCC) elements, see Fig. 1.3. CM is attractive for its desirability, efficient use of materials, and
satisfactory seismic performance. It is used in many countries, however there are challenges to its
widespread use in India and other developing countries: there is no confined masonry code in India, the
construction of CM is less mechanized than RCC frame, and although proper CM has performed
sufficiently in earthquakes, premature failures have been reported as well due to insufficient design and
construction (Basu et al. 2014, Jain 2015). These challenges will be elaborated on later. One way proponents
of CM address concerns with under-designing and construction deficiencies is by publishing guidelines to
help ensure its proper use in seismic zones.
1.3 CM Construction and Analysis Guidelines
Construction guidelines for confined masonry are powerful tools for architects and builders without an
engineering background to build with proper construction detailing. Multiple guidelines exist for different
countries, many of which are derived from Blondet et al. (2005), originally made for Peru. For engineers
- 13 -

Christopher F. Porst
with technical expertise, multiple methods for analysis and design of CM structures also exist which will
be discussed, such as those from Meli et al. (2011) and by the Earthquake Engineering Research Institute
(EERI). Many building codes also have requirements pertaining to confined masonry including the
Eurocode 6 (EN 1996), the Mexican building code (NTC-M 2004), Chilean (2003) and Peruvian (2006)
codes (Meli et al. 2011).
Existing guidelines are limited in that they either do not perform any seismic analysis and heavily constrict
the design, or they require technical expertise to perform. Herein lies an opportunity for an architectural
guideline for confined masonry which employs seismic analyses while still being accessible to architects
and builders without an engineering background. A design procedure is presented for confined masonry
homes that is intended to empower architects with fair architectural freedom while guiding them to a
structurally resilient solution. Two existing methods for the design and analysis of CM are described in
detail and are combined with a few simplifying adjustments to create the current method.
1.4 Material Properties and Experimental Research
Experimental results are also presented which investigate the effect of varying mortar qualities on masonry
compressive strength when low strength bricks are used. Material properties are a crucial consideration in
any structural design, especially with in low-tech environments where the quality of the materials is highly
variable. In rural areas of India and other developing countries it is common to use bricks with strength as
low as 2 MPa (Sarangapani et al. 2002; Sarangapani et al. 2005; GSDMA 2005; Gumaste et al. 2007; San
Bartolome and Quiun 2008), and compressive strength of masonry is one of the main parameters
influencing the vertical and lateral load capacity of a confined masonry wall. Despite the widespread use
of low quality bricks in these areas, limited research exists that investigate their effect on masonry strength.
This presents an enormous research opportunity that can lead to better informed construction in low-tech
seismically active countries.
- 14 -

Chapter 1 - Introduction
30
E -AIEz
S20-
(cement: lime sand)
E0
5 20 40 60 80 100 120
Compressive strength of brick (N/mm2 )
Fig. 1.4. Plot of masonry versus brick compressive strength for four mortar mixes (derived from Hendry 1990).
Masonry and mortar strengths are assumed to have a positive relationship in building codes (IS 1905, EN
1996, IBC 2012), but studies have found that this relationship is less pronounced with lower strength bricks.
In Fig. 1.4 one may see that as brick compressive strength decreases, the difference in masonry strength
observed between mortar mixes (represented by the vertical distance between the plot lines) becomes less
pronounced, and for bricks weaker than 5 MPa the difference shrinks to zero (Hendry 1990; Drysdale et al.
1994). For example, with 20 MPa strength bricks, the difference in masonry strength achieved with the
strongest (1: 1: 3) and weakest (1: 2: 9) mortars is approximately 4 MPa, whereas with 5 MPa bricks the4
difference drops to approximately 2 MPa. Some researchers have concluded that with low quality bricks in
certain circumstances the opposite trend is true, that is, stronger mortar leads to weaker masonry
(Samarasinghe and Lawrence 1992; Sarangapani et al. 2005; Gumaste et al. 2007). Although some studies
exist that address these issues, the research is very limited. The current experiments investigate whether
material cost can be saved, and masonry strength gained, by using a mortar mix with a small cement
proportion when low strength bricks are used.
- 15-
Christopher F. Porst
1.5 Thesis Outline
In Chapter 2 of this thesis confined masonry as a structural system is introduced and it is assessed whether
CM is suitable for seismically active, low-tech construction environments such as India. In Chapter 3
existing approaches to the seismic design and analysis of masonry and confined masonry are discussed and
research gaps are identified. Chapter 4 presents an innovative method for the design and analysis of
confined masonry structures that combines and simplifies two unrelated CM procedures. The author seeks
to create a method that is usable by architects and builders without engineering expertise that still allows
fair architectural freedom. Chapter 5 contains a brief discussion on the material properties of masonry as
they apply to the proposed design method and on masonry materials in India. This chapter also summarizes
experimentation that was conducted in India on local masonry properties and discusses the effect of cement
quantity of mortars when low-strength bricks are used. Finally, Chapter 6 summarizes the main conclusions
of this thesis and presents opportunities for future research.
Appendices A - F are also included which contain references, supplementary materials for the proposed
design method, detailed experimentation reports, and a full list of notations used in this thesis.
- 16 -

Chapter 2 - Confined Masonry
2 Confined Masonry
2.1 Performance in Past Earthquakes
Confined masonry is a proposed solution for India based on its satisfactory earthquake performance in Latin
America. Peru, for example, is a country with economic standing comparable to that of India where
confined masonry has contributed significantly to mitigation of earthquake losses, as was confirmed by the
2007 Pisco earthquake. Confined masonry has been the most common housing construction practice in Peru
for over 40 years (Loaiza and Blondet 2002). Prior to that, adobe construction was predominant for single
family houses, and these were the most damaged buildings in the 1970 Chimbote and 2007 Pisco, Peru
earthquakes (Cluff 1971; San Bartolom6 and Quiun 2008). According to Cluff (1971) and Blondet (2007),
most adobe buildings in affected cities for both earthquakes were destroyed or seriously damaged. These
events present a revealing case of two earthquakes with similar magnitudes (7.9 and 8.0, respectively) in
the same country, separated by 37 years and very contrasting outcomes. The death toll of the 1970
earthquake was approximately 70,000; for the 2007 Pisco earthquake it was 519 (Cluff 1971; San
Bartolom6 and Quiun 2008; Romero 2010). The difference between the two events is due to the shift in
construction practice from adobe towards confined masonry after the 1970 earthquake and its satisfactory
performance in the 2007 earthquake, see Fig. 2.1. Some CM structures did suffer severe damage or collapse
in the 2007 earthquake, but these were due to construction and design deficiencies attributed mainly to
informal construction, an issue that is also very common in India. Otherwise proper CM construction
suffered little to no damage in 2007 (Blondet 2007; Brzev 2007; San Bartolom and Quiun 2008; Meli et
al. 2011). It should be noted that a large portion of deaths in the 1970 earthquake were due to landslides
that destroyed the villages of Yungay and Ranrahirca, the likes of which did not occur in the more recent
event, however the effects discussed here pertain to those cities not affected by the landslides (Cluff 1971).
- 17-
Christopher F. Porst
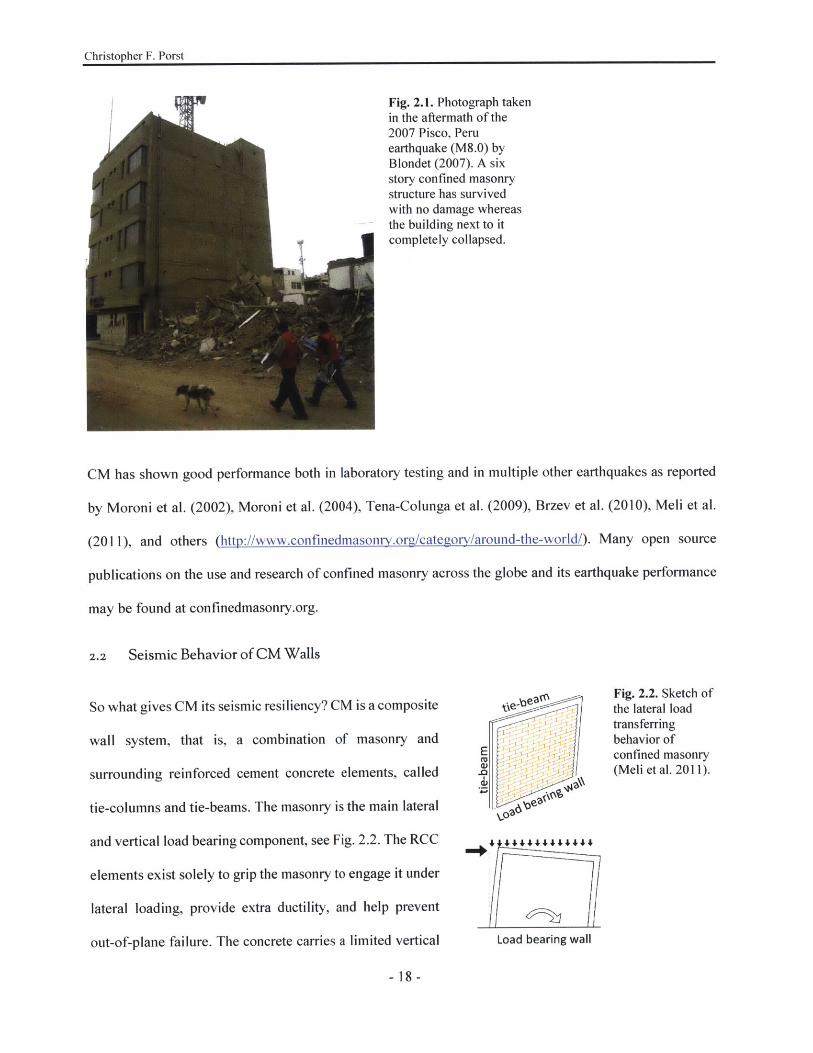
Fig. 2.1. Photograph takenin the aftermath of the2007 Pisco, Peruearthquake (M8.0) byBlondet (2007). A sixstory confined masonrystructure has survivedwith no damage whereasthe building next to itcompletely collapsed.
CM has shown good performance both in laboratory testing and in multiple other earthquakes as reported
by Moroni et al. (2002), Moroni et al. (2004), Tena-Colunga et al. (2009), Brzev et al. (2010), Meli et al.
(2011), and others (http://www.confinednasonry.org/category/around-the-world/). Many open source
publications on the use and research of confined masonry across the globe and its earthquake performance
may be found at confinedmasonry.org.
2.2 Seismic Behavior of CM Walls
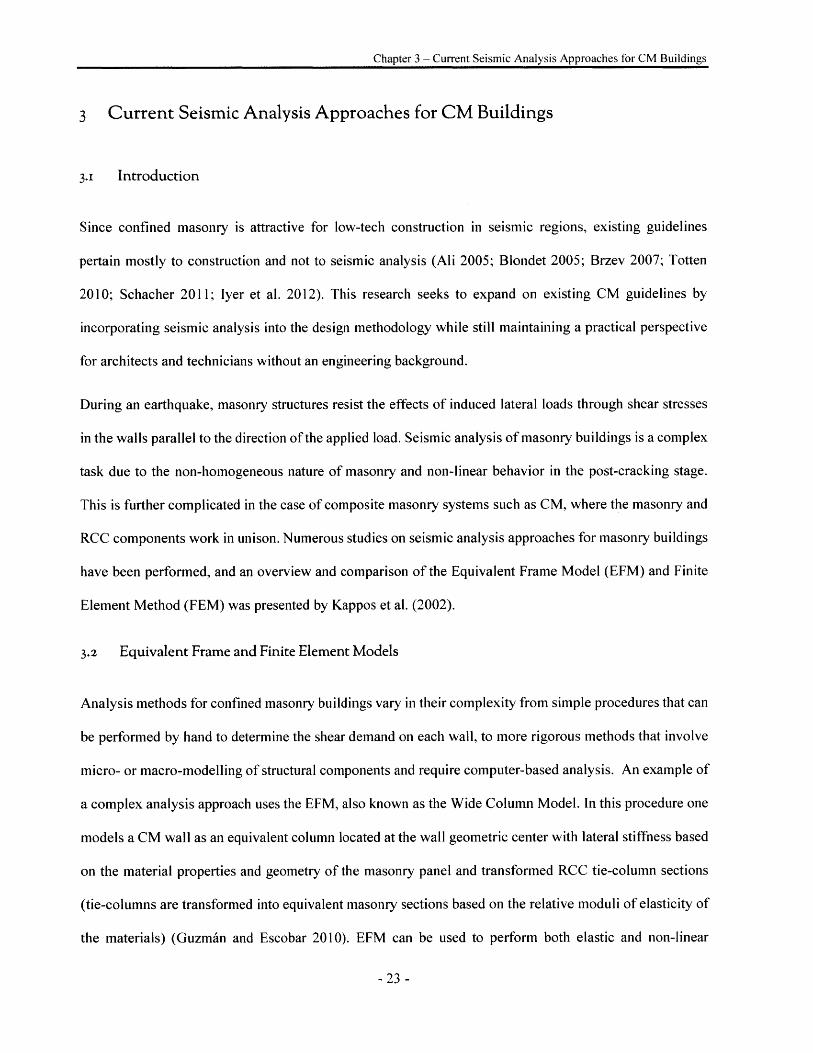
So what gives CM its seismic resiliency? CM is a composite
wall system, that is, a combination of masonry and
surrounding reinforced cement concrete elements, called
tie-columns and tie-beams. The masonry is the main lateral
and vertical load bearing component, see Fig. 2.2. The RCC
elements exist solely to grip the masonry to engage it under
lateral loading, provide extra ductility, and help prevent
out-of-plane failure. The concrete carries a limited vertical
- 18-
E
Load bearing wall
Fig. 2.2. Sketch ofthe lateral loadtransferringbehavior ofconfined masonry(Meli et al. 2011).

Chapter 2 - Confined Masonry
load, hence the RCC tie elements are smaller in cross section than a load bearing concrete frame (Brzev
2007; Meli et al. 2011). Because steel and cement are the most expensive building materials in India, this
factor makes CM less expensive than RCC frame construction. Each component of the walls plays an
important structural role. The masonry panel develops a diagonal compression strut when resisting lateral
loads, initially not relying at all on the RCC columns (Brzev 2007). Once the masonry has cracked, tie-
columns play an important role in providing ductility prior to collapse. Experimental research by Tomazevic
and Klemenc (1997) shows the large increase in ductility of confined versus unconfined masonry, see Fig.
2.3. Added ductility prior to failure saves lives during an earthquake by giving building occupants extra
time to evacuate.
-10 0d [mm]
5d [mm]
10
10 20
1,5
0,5
0
-0,5
-1
-1,5
-/
'7(b)
-3 -2 -1 0d [mm]
Fig. 2.3. Lateral load, H, versusdeflection, d, hysteresis loops fora confined masonry wall (a) and aplain (unreinforced) masonry wall(b), note the deflection of theconfined wall reaches nearly tentimes that of the plain wall. Loaddeflection curve for a plainmasonry wall, BR, and a confinedmasonry wall, AH (c).(Tomazevic and Klemenc 1997).
1 2 3
15
- 19-
(a)
2
0
-1
-2-2
2,5
2
,1,5
0,5
0
0
0
BH AH
(C)
---I-

Christopher F. Porst
Wall density, d, or the ratio in plan of the structural wall area in the direction of applied seismic force to
the total plan (footprint) area of the floor, as illustrated in Fig. 2.4, is a key factor affecting the overall
seismic performance of CM. Reports of building performance after the 2007 Pisco, Peru and 1985 Llolleo,
Chile earthquakes showed that many of the collapsed and severely damaged buildings had inadequate wall
densities (San Bartolom6 and Quiun 2008). A relationship between the level of damage in a building and
the wall density per unit floor based on a survey of buildings following the 1985 Llolleo earthquake is
shown in Table 1, adapted from Moroni et al. (2000). Wall density directly relates to the shear force capacity
of a floor, and the Simplified Method for Seismic Analysis (SMSA), described later, uses this as the main
design and analysis criteria for a CM building. Furthermore, confined masonry with adequate wall density
is forgiving of minor construction defects (Brzev 2007).
Wall DensityRatio, d
d =E2
Level of Damage Wall Densityd/N (%)
light 1.15
moderate 0.85-1.15
severe 0.5-0.85
heavy < 0.5
Seismic Load Table 1. Relationship between wallU density and damage sustained in CM
Fig. 2.4. Wall density illustrated in the floor plan view above buildings after 1985 Llolleo, Chile
(derived from Meli et al. 2011). earthquake (Moroni et al. 2000).
2.3 Suitability for India: Advantages and Drawbacks
CM is attractive because it is less expensive than an RCC frame but holds the same aesthetic, which has
strong aspirational qualities (Murty et al. 2005; Murty et al. 2006; Iyer et al. 2012). Furthermore, as
discussed, its seismic performance has been proven in past earthquakes and verified by laboratory
experiments. However there are challenges to its use in India and other developing nations. Without
confined masonry codes engineers in India are reluctant to approve of such small concrete elements, and
there is no code approved system for designing it (Basu et al. 2014). Secondly, the construction of CM is
- 20 -

Chapter 2 - Confined Masonry
less mechanized than RCC frame, therefore the labor cost can be greater and it is more prone to construction
flaws, especially initially when the process is unfamiliar (Jain 2015). The materials cost savings are
expected to far outweigh the increase in labor cost in developing countries such as India where labor is
inexpensive (Meli et al. 2011). Although proper confined masonry has performed well in earthquakes,
premature failures and collapses have been reported as well, which occurred when the design or
construction was inadequate (Brzev 2007; San Bartolom6 and Quiun 2008; Brzev et al. 2010; Meli et al.
2011). CM researchers have published guidelines to address concerns with under-designing and
construction deficiencies in developing countries (Meli et al. 2011).
The proposed method combines the methods of Guzman and Escobar (2010), Tena-Colunga and Cano-
Licona (2010), and Brzev et al. (2015) to create an integrated analysis and design tool that is useful for
architects without the means to perform analysis themselves. This thesis aims to bridge the gap between
rigorous structural analyses that involve complex computation and low-tech construction guidelines for CM
that don't perform any seismic analysis and are restrictive on the architectural design. An integrated design
and analysis approach that is simple enough to be conducted by a builder without engineering knowledge
yet thorough enough to perform seismic analysis given a wide range of architectural forms is the ultimate
objective.
-21 -

Christopher F. Porst
-22-
Chapter 3 - Current Seismic Analysis Approaches for CM Buildings
3 Current Seismic Analysis Approaches for CM Buildings
3.1 Introduction
Since confined masonry is attractive for low-tech construction in seismic regions, existing guidelines
pertain mostly to construction and not to seismic analysis (Ali 2005; Blondet 2005; Brzev 2007; Totten
2010; Schacher 2011; Iyer et al. 2012). This research seeks to expand on existing CM guidelines by
incorporating seismic analysis into the design methodology while still maintaining a practical perspective
for architects and technicians without an engineering background.
During an earthquake, masonry structures resist the effects of induced lateral loads through shear stresses
in the walls parallel to the direction of the applied load. Seismic analysis of masonry buildings is a complex
task due to the non-homogeneous nature of masonry and non-linear behavior in the post-cracking stage.
This is further complicated in the case of composite masonry systems such as CM, where the masonry and
RCC components work in unison. Numerous studies on seismic analysis approaches for masonry buildings
have been performed, and an overview and comparison of the Equivalent Frame Model (EFM) and Finite
Element Method (FEM) was presented by Kappos et al. (2002).
3.2 Equivalent Frame and Finite Element Models
Analysis methods for confined masonry buildings vary in their complexity from simple procedures that can
be performed by hand to determine the shear demand on each wall, to more rigorous methods that involve
micro- or macro-modelling of structural components and require computer-based analysis. An example of
a complex analysis approach uses the EFM, also known as the Wide Column Model. In this procedure one
models a CM wall as an equivalent column located at the wall geometric center with lateral stiffness based
on the material properties and geometry of the masonry panel and transformed RCC tie-column sections
(tie-columns are transformed into equivalent masonry sections based on the relative moduli of elasticity of
the materials) (Guzmin and Escobar 2010). EFM can be used to perform both elastic and non-linear
- 23 -

Christopher F. Porst
analyses of confined masonry buildings (Terin-Gilmore et al. 2009). EFM can take into account flexural
effects and is suitable for analysis of medium-rise buildings, but it requires advanced analysis skills,
especially related to modelling of walls with openings. Micro-modelling approaches such as FEM have also
been used for seismic analysis of confined masonry buildings. FEM uses computer software to analyse a
structure and is computationally expensive and also requires technical knowledge to accurately model
structures and their loading, hence for masonry it is mainly only used in research or for high profile projects
where the extra cost is acceptable (Kappos et al. 2002).
3.3 Simplified Method for Seismic Analysis of Masonry Buildings
A less complex method, known as the Simplified Method for Seismic Analysis (SMSA), has been used for
seismic design of confined masonry buildings since the 1970s and was allowed by the Mexican masonry
code (NTC-M 2004). This procedure is based on Mexican practice by Meli (1994) and Meli et al. (2011).
It was expanded upon for application in India by Brzev et al. (2015) and is employed in this thesis.
The SMSA determines the required wall density for a building; it assumes rigid floor diaphragms (e.g. RC
floor slabs) and ignores torsional effects (see Fig. 3.1), therefore it applies only to buildings with regular
plan shapes. It also assumes that shear stresses govern, and flexural effects are disregarded in the wall
design. Due to its simplicity and modest computational requirements, the SMSA is suitable for seismic
design of low-rise regular buildings only, such as single-family housing. It should be noted that NTC-M
(2004) restricts the SMSA applicability to buildings with height less than 13 meters, while Meli et al.
(2011) recommend a 6 meter height limit. An advantage of the SMSA over alternative analysis methods
such as EFM and FEM is that it is an integrated analysis and design approach, which is one reason it is used
in the current method. However, the current research seeks to expand on this method to make it applicable
to more complex, irregular buildings.
-24 -

Chapter 3 - Current Seismic Analysis Approaches for CM Buildings
Fig. 3.1. Visualization of theconcept behind the SMSA. Wallsoriented in the direction of theapplied seismic load resist theload in proportion with theirrelative stiffness to one another.
(a) Plan of an Actual Confined
A,
Vi
A2f
V2 112
bx
A 3
T113
Masonry Building
A 4
fl V4
N = 4
F1
A
JVb
(b) Shear Walls Resisting Seismic Load in y-direction
Rigid Diaphragm
(c) Idealized Seismic Analysis Model
- 25 -
V1+2
k1 + k 2
V3
k3
V4
k4
t V
V3

Christopher F. Porst
3.4 Seismic Analysis of Irregular Masonry Buildings
Walls in buildings with irregular plan shapes, or buildings where the plan is regular but the wall layout is
irregular, experience an increase in internal lateral forces and deformations due to torsional effects caused
by building eccentricity. Eccentricity is the distance between a structure's Center of Mass (Cm), where the
seismic load is applied, and Center of Rigidity (CR), where lateral loads are resisted, see Fig. 3.2. A higher
level of irregularity usually leads to larger eccentricity and hence an amplified torsional effect. The seismic
design of irregular buildings is covered in several references, such as Naeim (2000). The goal is to calculate
the increase in internal forces in the structural members such as walls due to torsional effects. This analysis
is usually complex and requires advanced technical skills and computational tools. However, it is
recognized that most buildings are irregular to an extent and torsional effects must be considered. A
procedure for seismic analysis of irregular buildings developed by Escobar et al. (2004), Escobar et al.
(2008) and presented by Guzmin and Escobar (2010) is considered in this study because it gives a simple
factor for each wall which captures the increase in the shear demand due to torsion. This method alone
performs analysis but not design from a base structural requirement standpoint. It is therefore proposed to
use this method in conjunction with the SMSA, which will provide the base structural design, and allow for
a wide range of architectural forms.
1
+CR
esy
_ _+ --kVb CM
y
x
Fig. 3.2. Illustration of eccentricity as the distance between the CM and the CR. Note the base shear is applied in
line with the Cm and the CR is located closer to the structural walls resisting the base shear in the x-direction.
- 26 -

Chapter 4 - Seismic Design Procedure for Confined Masonry Buildings
4 Seismic Design Procedure for Confined Masonry Buildings
4.1 Introduction
The proposed method can be used to check whether the wall layout and dimensions (length, thickness) are
adequate for a given confined masonry building with a regular or irregular plan shape. First, the SMSA is
used to determine a preliminary value for the required wall density. This assumes a square plan with the
footprint area, masonry strength, number of stories, and seismic zone as inputs. Next, this procedure adjusts
for the aspect ratio of the actual design building plan (still using the SMSA). The aspect ratio is taken as
the ratio of the shorter building dimension, W, to the longer building dimension in the orthogonal direction,
L (W: L, where W L). A parametric study was conducted using the SMSA and it was determined that if
the aspect ratio is less than 1:1 but greater than 2:3, the wall density for the shorter dimension can be
conservatively increased by 2% (that is, multiplied by 1.02), and if it is less than 2:3 but greater than or
equal to 1:3 can be increased by 8% (multiplied by 1.08), see Equation (1). If the building is regular
(rectangular) in plan, the wall density determined from the SM and multiplied by the appropriate aspect
ratio factor (for the shorter dimension only) is the final design requirement.
1.0 if W: L = 11.02 if 1 > W: L 2/3
(1) fAR = 21.08 if - > W: L : 1/3
3
Where fAR is the amplification factor for the building plan aspect ratio.
For buildings with irregular plan shapes the procedure then involves a torsional analysis given the actual
building geometry, assuming only perimeter walls. The method by Guzmin and Escobar (2010) is used to
determine a torsional amplification factor (FAT factor) for each wall. The maximum FAT factor in each
direction is applied as a governing factor to determine the design wall density for the direction of the seismic
force applied. A flow chart of the full method is found in section B. I of Appendix B.
-27-
Christopher F. Porst
For this method to apply, the following assumptions must be followed:
* The procedure applies only to buildings up to and including three stories tall.
* It is assumed that the aspect ratio is greater than or equal to 1:3 (W: L > 1: 3).
* It is assumed that the structural walls are continuous throughout the building height.
* It is assumed that there are at least 2 lines of structural walls in each direction.
* Floors and roofs are assumed to act as rigid diaphragms (there is uniform inter-story displacement).
4.2 SMSA Design Procedure
'-4 n = 3
--- 2
0
Vb
(a)
/
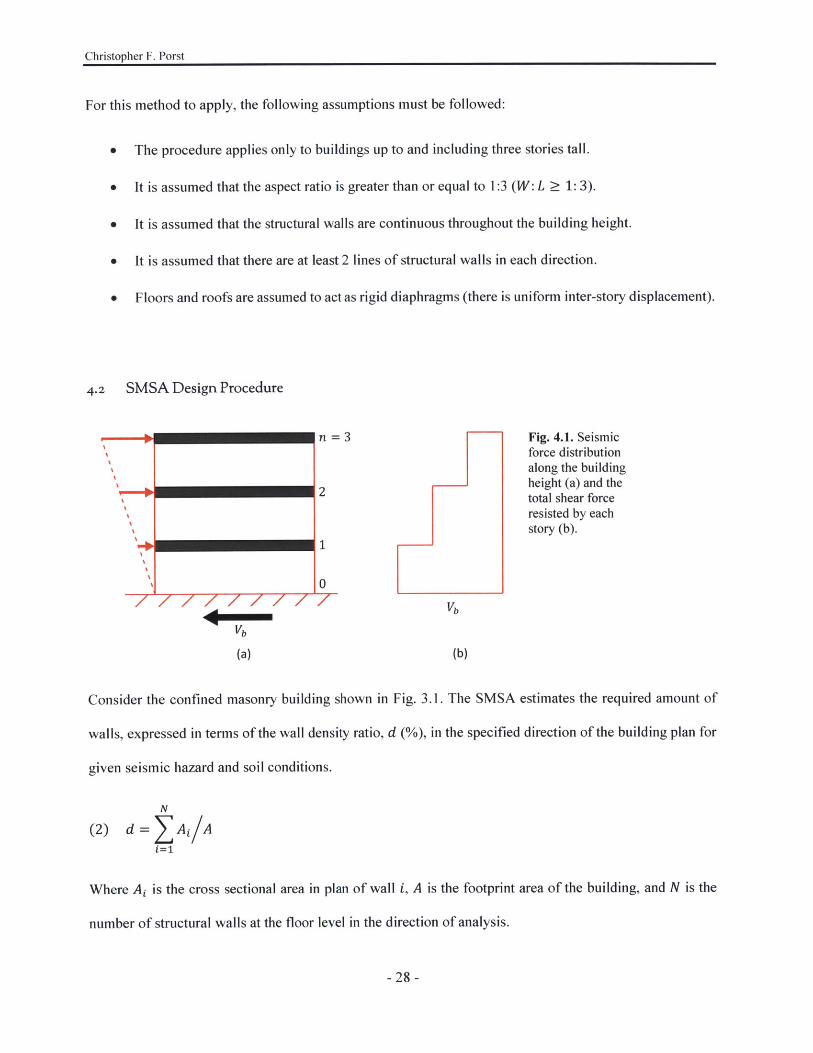
Fig. 4.1. Seismicforce distributionalong the buildingheight (a) and thetotal shear forceresisted by eachstory (b).
Vb
(b)
Consider the confined masonry building shown in Fig. 3.1. The SMSA estimates the required amount of
walls, expressed in terms of the wall density ratio, d (%), in the specified direction of the building plan for
given seismic hazard and soil conditions.
N
(2) d = Ai Ai=1
Where Ai is the cross sectional area in plan of wall i, A is the footprint area of the building, and N is the
number of structural walls at the floor level in the direction of analysis.
-28-

Chapter 4 - Seismic Design Procedure for Confined Masonry Buildings
This is accomplished by comparing seismic demand, Vb, that is, shear force acting at a story level and the
corresponding shear capacity of the story (VR), as shown in Equation (3).
(3) LF x Vb 5 VR
Since the seismic demand in wall buildings increases from the top towards the base, the analysis is usually
performed at the base level of the building where seismic demand is equal to the seismic base shear force
(Vb), see Fig. 4.1. It should be noted that SMSA can be used according to both the Allowable Stress Design
(ASD) method and the Load and Resistance Factor Design (LRFD) method; the latter will be followed in
this study. As a result, a load factor (LF) is applied to Vb, and a material resistance factor (4,) is applied to
masonry shear resistance in the VR equation.
In the current method the simplified method for seismic analysis, as described by Brzev et al. (2015), is
used to determine a preliminary value for the required wall density in each direction by assuming a square
plan shape. The design wall density is the final output of this tool. If the required length of confined masonry
walls is the desired output, then one must also input wall thickness into this calculation, see Equation (10).
Consider a confined masonry building with a regular plan shape and wall layout. The seismic base shear
force (Vb) can be expressed as a product of the seismic coefficient (Af) and the seismic weight (W):
(4) Vb=AftXW
Where Ah depends on the seismic hazard, the type of soil, the building importance, fundamental period,
etc. The seismic weight (W) can be expressed as a product of the average weight per unit floor area w, the
actual floor area A, and the number of stories n.
(5) W=nx(wxA)
In a building with rigid diaphragms the shear force Vi resisted by wall i at a specific floor level is
proportional to its stiffness ki, see Fig. 3.1 (c). However, since the SMSA assumes that the wall behavior
- 29 -

Christopher F. Porst
is shear-dominant, the stiffness k is proportional to the wall area A1 based on the fundamental principles of
mechanics of solids, that is,
G x F, x Ai(6) k= H=
Hi
Where G = 0.4Em, the shape factor F = 1.2 for rectangular sections, and H = wall height.
The shear capacity of a regular building at a particular floor level (VR) (see Equation (3)) can be determined
based on the sum of shear resistances for individual walls at that level. It is assumed that shear resistance
of a wall is equal to the product of masonry shear resistance (vi) and the wall cross-sectional area Ai (note
that material resistance factor (P is applied to vin). However, the sum of the cross-sectional areas can be
expressed in terms of the wall density d, as follows:
N
(7) VR =X(Vm j) xqmX xdxAi=1
It should be noted that the SMSA assumes that all walls have equal shear strength v, for the shear capacity
calculation. In this study masonry shear strength, vm, is determined as function of the compressive strength
f,' without considering other factors such as the effects of axial precompression or the shear span ratio (see
Chapter 5 for more details):
(8) vO = 0.18 X 7
The required wall density index, d, can be determined from Equation (3) as follows:
LF x Ah x w x n(9) d =
4P X Vm
The above equation can be further simplified when the wall thickness, t, is constant, thus the total required
wall length, 1r, for a specific floor level and direction can be found:
-30-

Chapter 4 - Seismic Design Procedure for Confined Masonry Buildings
A x d(10) 1r t
Where Ir > I = Z li (see Fig. 3.1 (b))
For regular buildings the wall density determined in Equation (9), multiplied by the appropriate aspect ratio
factor (fAR) for the shorter dimension is sufficient and conservative for design. However for buildings with
more complex plan shapes, torsional effects must be taken into account.
4.3 Simplified Method for Irregular Buildings
4.3.1 Introduction - Original Method by Escobar
The method proposed by Escobar et al. (2004, 2008) is used to account for torsional effects in irregular
buildings. Some simplifying techniques are applied to reduce the calculation effort and make the design
method applicable to a wider range of designs. The method uses an Amplification Factor for Torsion (FAT)
to account for an increase in the shear demand in each wall due to torsional effects. The FAT accounts for
the building eccentricity associated with irregularity in plan shape, or the effect of a non-symmetric wall
layout with respect to the geometric center of the floor plan, or both. The design method presented in this
study seeks to find a critical FAT value for each orthogonal direction of the building in order to determine
the required wall density for that direction. The underlying concepts of the method are explained in the
following section.
4.3.2 Procedure
Consider a building with an irregular wall layout of masonry shear walls shown Fig. 4.2 (a). In an irregular
building with torsional effects the total shear force in each wall, Vt,0t, is equal to the sum of the direct shear
force, Vd, (without considering torsional effects), and torsional shear force, Vt,:
(11) Vtotj = Vai + Vtj
-31 -

Christopher F. Porst
It is assumed that the building has rigid diaphragms, thus a direct seismic force, Vd 1, in wall i is distributed
in proportion to its stiffness relative to the sum of stiffnesses of all walls aligned in that direction. The
seismic story force is equal to Vb since the analysis is performed at the base of the building where the
seismic forces are largest.
Rigid Wall
1*1 ~ .iCR I MCRj
+ I + c
V CM C9 Flexible Wall
(a) (b)
Fig. 4.2. Wall direct shear forces, Vd, (a) and torsional shear forces, Vt, (b) and the corresponding characteristic
story displacements.
(12) Vd, = ) x VbE ki
Where Vb is the design base shear determined from the SMSA and ki is the shear stiffness of wall i, see
Equation (6).
If torsional effects are ignored, the inter-story displacement, A, due to force Vb at the base level of the
building can be determined from the seismic shear force and the total story stiffness (equal to the sum of
the individual wall stiffnesses):
(13) A =E k i
The torsional component of the shear force, Vt, is induced by the torsional moment TM, which is equal to
the product of the applied seismic force Vb and static eccentricity, e5, see Fig. 4.2 (b). The eccentricity
occurs when the center of mass (Cm) does not coincide with the center of rigidity (CR) at a specific level in
-32-

Chapter 4 - Seismic Design Procedure for Confined Masonry Buildings
a building, and likewise is the distance between these two locations. Fig. 4.2 (a) shows static eccentricity
for direction y, esy, in the building. See section B.3 of Appendix B for instructions on how to calculate the
center of rigidity.
It should be noted that seismic codes in most countries consider the design eccentricity, ed, as the sum of
the static eccentricity, es, and the accidental eccentricity which is expressed as a fraction of b, therefore
ed = aes + flb(14) or
ed = Se, - fib
Where a = multiplier for static eccentricity usually taken as 1.5 (and a > 1.0) when accidental eccentricity
is positive, and 6 = multiplier for static eccentricity when the accidental eccentricity is negative, usually
equal to 1.0.
The FAT factor represents the ratio of the total seismic shear force to the direct shear force, that is:
(15) FAT, = Vtoti
Vd i
According to this method, a wall is considered asflexible (/) if it is located on the same side as the center
of mass (Cm) with respect to the center of rigidity (CR), and as rigid (R) otherwise, see Fig. 4.3. For elements
classified as flexible, Equation (16) is used, and for rigid elements Equation (17) is used to determine the
FAT value.
- 33 -

Christopher F. Porst
(16) FATf= 1 + (t+ ae)p
FATri= 1 + (-e)(17) -p2
FATri= 1
Where e is the normalized
perpendicular to the direction of the
6e <
Se >
eccentricity
applied load:R + CM
CR
(18) e = b
Where e, is the static eccentricity perpendicular to
the direction of the applied load.
Fig. 4.3. Walls are consideredThe (' factor depends on the position of wall i the same side of the building r
mass, Cm, from the reference I
relative to the center of rigidity and building plan rigidity, CR, and as rigid, R, oabove.
dimension b perpendicular to the direction of
applied seismic force, see Fig. 4.2 (a). and p is the normalized radius of gyration:
f
L+ CM
-4----CR
R
flexible, f if they are onplan as the center ofine through the center ofherwise, as shown
(19) i = Cilb
Where ci is the distance of wall i to the center of rigidity, (CR), see Fig. 4.2 (b).
The factor ft accounts for accidental eccentricity, which is typically expressed as a fraction of b. In most
countries the seismic code prescribes a ft value in the range of 0.05 to 0.1.
Given the rigid diaphragm assumption made in the SMSA which constitutes that the direct shear force and
deflection withstood by each wall is directly proportional to its stiffness, the equation for the normalized
radius of gyration can be presented as:
(20) p =
-34-
Chapter 4 - Seismic Design Procedure for Confined Masonry Buildings
Where ko is the torsional stiffness:
(21) ke = Yk x ci
Under circumstances similar to those of the current study where a shear-dominant behavior is assumed, that
is, the stiffness is directly proportional to the wall cross sectional area, this can be written as:
1 Aci -C(22) p = -
b N Ax i
Where AxL and Ay1 = cross sectional areas of walls in the x- and y-directions
Furthermore, if the thickness of all walls is constant, this can be further simplified to:
1 )21i -c7(23) p = -
bE 1xi
(24) Ai =1i - tj
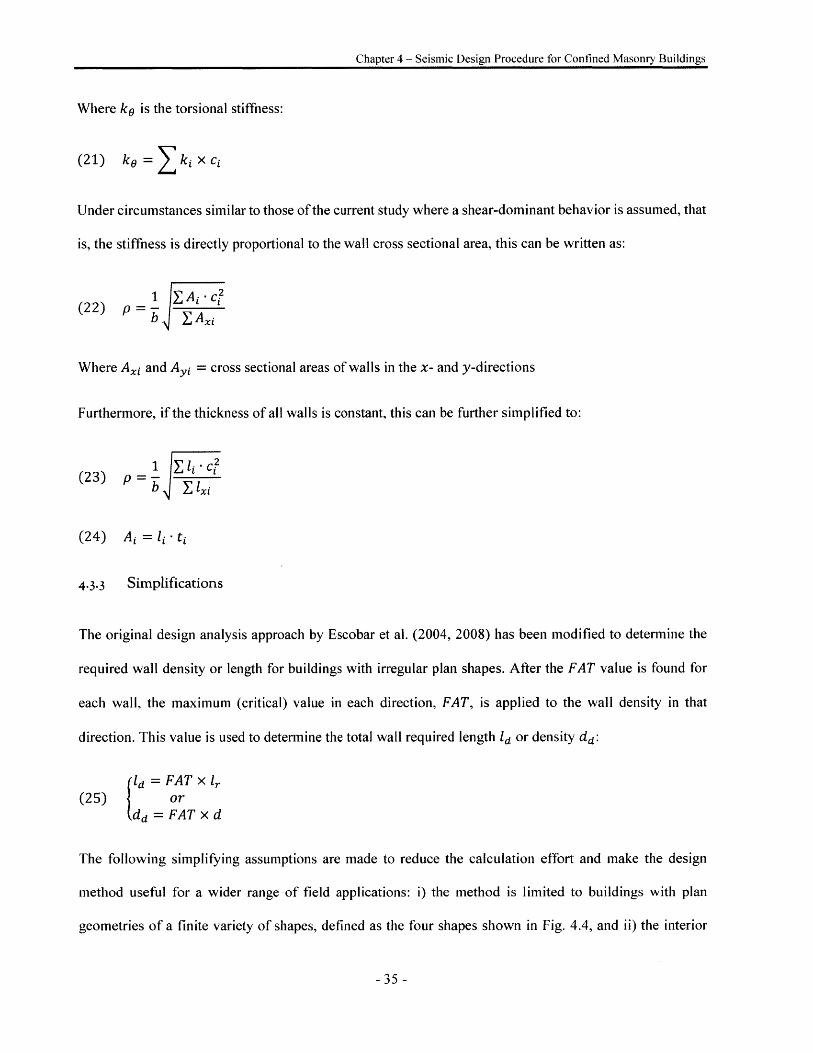
4.3.3 Simplifications
The original design analysis approach by Escobar et al. (2004, 2008) has been modified to detennine the
required wall density or length for buildings with irregular plan shapes. After the FAT value is found for
each wall, the maximum (critical) value in each direction, FAT, is applied to the wall density in that
direction. This value is used to determine the total wall required length ld or density dd:
l = FAT x ir(25) or
(dd = FAT x d
The following simplifying assumptions are made to reduce the calculation effort and make the design
method useful for a wider range of field applications: i) the method is limited to buildings with plan
geometries of a finite variety of shapes, defined as the four shapes shown in Fig. 4.4, and ii) the interior
- 35 -

Christopher F. Porst
layout of the building is unknown, therefore the eccentricity calculations are performed assuming all of the
walls are aligned along the perimeter of the building and the entire perimeter consists of structural walls,
see Fig. 4.4. It is expected that the latter assumption will end up being false, that is, in the actual design
there will be interior walls and the full perimeter of the building will not consist entirely of structural walls
(due to openings). However, since the perimeter walls are the most critical in a building for torsional
considerations this assumption is considered conservative.
w w w-- w
B--B
A -D-
L L L B LI a C
A AAU-0~~ -. I-cI6
x x x x
Fig. 4.4. The four basic plan geometries that the proposed design method is tailored to. It is possible to find the
eccentricity and FAT values for any combination of the dimensions shown.
The design procedure can be summarized as follows:
1) A unique FAT factor is calculated for each of the perimeter walls. Since the goal is to come up with one
factor for the entire building in each direction and it is uncertain where the architect will place additional
walls, the critical factors are chosen to be applied to the entire building. That is, the largest FAT factor in
each direction is chosen. Although the FAT factor represents an increase in the shear demand, the SMSA
directly relates shear demand to the required wall density, therefore the FAT can be directly applied directly
to that value (d).
-36-

Chapter 4 - Seismic Design Procedure for Confined Masonry Buildings
2) Once the architect has estimated the preliminary design requirement (wall length or wall density) from
Equation (9), they will then input the actual design dimensions corresponding to those in Fig. 4.4 into a
spreadsheet. The FAT factors for each direction are calculated in an Excel spreadsheet which is described
in section B.2 of Appendix B. Separate spreadsheets that find the torsional factors are given for "L" shaped,
"C" shaped, and "T" shaped plans. A guideline in the form of a physical booklet is also in development
which will contain a finite number of predetermined FAT values for designs considered to encompass a
sufficiently representative range of dwelling layouts commonly found in India. With this guideline the
architect must match their actual design with the given one that is most similar. If they are unsure as to
which one most closely matches their design, they are advised to select the more conservative one.
3) The architect applies the critical FAT value to the required wall density or length, see Equations (25).
4.4 Parametric Study
A parametric study was performed for 45 arbitrary building plan geometries (15 each of "L", "C", and "T"
shaped geometries) and the results are presented in Fig. 4.5. The values for fl, a, and 6 were taken as
prescribed in IS 1893 (/ = 0.05, a = 1.5, and 8 = 1.0). The main output is the FAT factor tested against
two parameters: the normalized eccentricity, e/b, and the normalized radius of gyration squared, p2 , to
investigate their relationships and verify the design method.
The first parametric study of the FAT against the normalized eccentricity, the results of which are shown
in Fig. 4.5 (a), reveals a strong positive relationship between the parameter and the output. This chart of
maximum FAT value versus e/b can be used to predict the increase in shear stresses in a building due to
torsion if the normalized eccentricity is known. Furthermore, the even distribution of results on the FAT
versus e/b graphs shows that the output relationship to eccentricity is not erratic in spite of the assumptions
being made (e.g. perimeter walls only) and there are no strong outliers, therefore the design method provides
reliable results for a wide range of eccentricities.
-37-
Christopher F. Porst
The second parametric study investigates the maximum FAT value versus the normalized radius of gyration
squared, p 2 , as shown Fig. 4.5 (b). The clear display of an inverse quadratic relationship again verifies the
function of the design method. Another observation is that as the squared normalized radius of gyration
increases past a certain value, the FAT factor plateaus at 1.1. The value for p 2 at which this happens is
different for each of the three plan geometries. For "L" shaped building plans, the change in FAT occurs
mostly between values of 0.2 and 0.4 for p 2 , above which it plateaus. For "T" shaped buildings the FAT
plateaus after p 2 values of approximately 0.5 and 0.3 for the x and y-directions, respectively. This occurs
for "C" shaped plans at p 2 of approximately 0.35 and 0.6 for the x and y-directions, respectively. The value
of 1.1 is therefore a viable FAT estimate for values of the squared normalized radius of gyration above
those just stated and for the respective geometries and axis directions. Note that these values pertain
specifically to the plan shapes and orientations shown on the graphs of Fig. 4.5 (b).
-38-

Chapter 4 - Seismic Design Procedure for Confined Masonry Buildings
0 FATy
X FATx
x
x
x
x
x
x
1.8
1.7
1.6
1.5
1.4
1.3
1.2
1.1
1.0
E-
0
<C
U-C0
.oE
0
0
1 i0.02 0.04
* FATyx FATx
g 0
0.06 0.08 0.10 0.1
S
0.02 0.04 0.06
x FATxS FATy
1.8
1.7
1.6
1.5
1.4
1.3
1.2
1.1
1.02
2.0
x 1.9x 1.8
X 1.7x
1.6
x x 1.5X ex1.4
x 1.3x
1.2
1.1
I I 1.0
0.08 0.10 0.12 0.14
x x
x
xx
x
G o.9*x
0.00 0.02 0.04 0.06 0.08
(a) Normalized Eccentricity,
1.8
1.7
* 1.6
1.5
1.4
1.3
1.2
1.1
I I 1.00.10 0.12
e/b (t
0.0
0.0
* FATyx FATx
* FATyx FATx
x
x
xx
x
Xx0
#00O 0
0.2 0.4 0.6
xxx
xxxxx
x
0 a xx
0.4 0.6
0.0 0.2 0.4 0.6 0.8 1.0 1.2
) Normalized Radius of Gyration Squared, p 2
Fig. 4.5. Results from parametric studies of the current designbuilding plans.
method for 15 arbitrary "L", "T", and "C" shaped
-39-
x
5,'
0
0.002.0
1.9
1.81.71.61.5
1.4
1.3
1.2
1.11 n
0.0c
1.8
1.7
1.6
1.5
1.4
1.3
1.2
1.1
1.0
x
xx X
xg 0
: :
I0.8
0.2
x FATx0 FATy
x
x
x
x
xx< %bexW
.
Christopher F. Porst
4.5 Design Example - Rural Building in Gujarat, India
4.5.1 Introduction
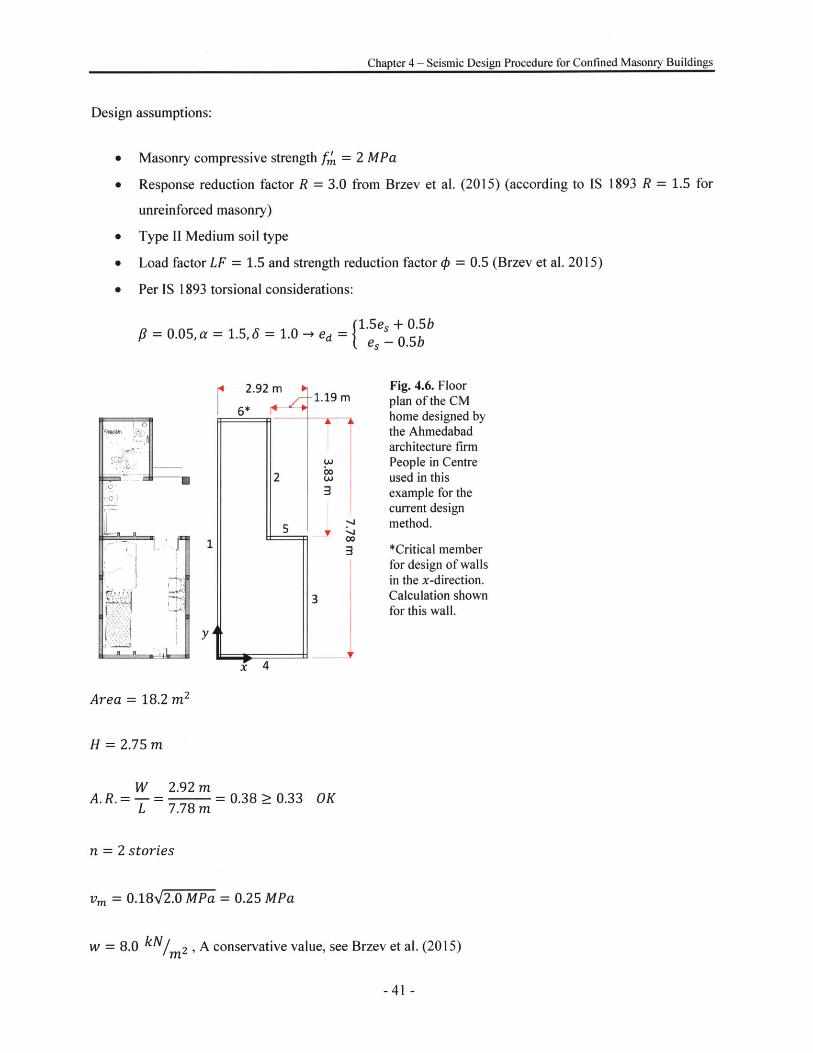
The following example is intended to illustrate the effectiveness of the proposed method. The design used
for this example is a confined masonry home for rural areas of Gujarat designed by the Ahmedabad based
architecture firm People in Centre (PiC), see Fig. 4.6, the same one as shown in Fig. 3.1 (PiC 2014,
http://www.peopleincentre.org). This home was designed for implementation in the Indira Awaas Yojana
(IAY) federal housing project. The IAY project will provide affordable houses, subsidized by the
government, to qualifying families across the country. PiC was tasked with designing homes to be built in
the State of Gujarat so they came up with multiple designs which may be selected by the beneficiaries. As
with any such program, cost is a key factor for the design and selection of homes, and the confined masonry
design shown here is estimated at nearly 20% less expensive than their next cheapest option.
This is a real world example designed by an Indian architecture firm for widespread implementation. An in
depth seismic analysis of the design was performed, with a few variables open to alteration to determine
the required masonry compressive strength. The increase in shear demand for the walls due to torsional
effects was determined using the conventional analysis method (Naeim 2000), and the thickness of the
structural walls was the main variable considered. The researcher recommended a specific design which
minimized the required masonry strength while maximizing the cost efficiency.
4.5.2 Example
The method proposed in the current study is used on the design (see Fig. 4.6) and the output requirement is
compared to the recommended design determined from the detailed torsional analysis (Naeim 2000). The
recommendation was based on the assumption that a second story would be added to the home in the future.
The seismic design parameters were obtained from the Indian seismic design code IS 1893. The assumed
site location is Bhuj, Gujarat (the area most affected by the 2001 Bhuj earthquake).
- 40 -
Chapter 4 - Seismic Design Procedure for Confined Masonry Buildings
Design assumptions:
" Masonry compressive strength fm = 2 MPa
" Response reduction factor R = 3.0 from Brzev et al. (2015) (according to IS 1893 R = 1.5 for
unreinforced masonry)
* Type II Medium soil type
* Load factor LF = 1.5 and strength reduction factor q5 = 0.5 (Brzev et al. 2015)
* Per IS 1893 torsional considerations:
# = 0.05, a
1
YA
= 1.5, = 1.0 -+ e= 1.5e, + 0.5be, - 0.5b
6*
2
5
-1.19 m
00
3
-.4
3
3
Fig. 4.6. Floorplan of the CMhome designed bythe Ahmedabadarchitecture firmPeople in Centreused in thisexample for thecurrent designmethod.
*Critical memberfor design of wallsin the x-direction.Calculation shownfor this wall.
Area = 18.2 m2
H = 2.75 m
W 2.92 mA. R.= -= = 0.38 > 0.33 OK
L 7.78 m
n = 2 stories
vm = 0.1812.0 MPa = 0.25 MPa
w = 8.0 kN/m 2 , A conservative value, see Brzev et al. (2015)
-41-
Hl
r 2.92 m 'p-1

Christopher F. Porst
The seismic coefficient Ah can be determined from the Indian building code IS 1893 as follows:
Z X I x g(26) A,, =
2xRxg
Where Z is the seismic zone factor, Z/2 represents the design basis earthquake, I is the importance factor,
R is the response reduction factor, and Sa/g is the average response acceleration coefficient:
Seismic Zone V -> Z = 0.36, IS 1893 Table 2
I = 1.0, IS 1893 Table 6
1.0 + 15T_J2.50
(27) SaIg = 136
T
if 0.0 T < 0.1if 0.1 T 0.55
if 0.55 < T 4.0
Equation (27) was taken from IS 1893 Cl 6.4.5, and T is the natural period of the structure:
0.09 x H x n(28) T =
Equation (28) was taken from IS 1893 Appendix, Amendment to section 7.6.2, H is the story height, and
D is the base dimension length along the direction of the applied force
Base dimension (square plan) D = /18.2 m 2 = 4.27 m
T 0.09(2.75 m)(2)T = = 0.24 s
V4.27 m
T = 0.24 s, 0.1 T 0.55 -, -a = 2.509
(0.36)(1.0)A (2)(3.0 (2.50) = 0.15
1.5(0.15)(8.0 kN M2)(2)
0.5 (0.2 5 N/mm2)(1000)2.9%
-42 -

Chapter 4 - Seismic Design Procedure for Confined Masonry Buildings
The following shows the calculation of the torsional amplification factor for the critical wall in the shorter
direction (Wall 6).
14.67 ml _
6 (7.=7 m) 0.60, see Fig. 4.7.
-0.49 me = m 0.063, see Fig. 4.7.
(7.78 mn)
PX(7.78 m)
(66.81 M3 ) + (23.95 M 3)
(5.84 m)
E
It
K-
= 0.51
6*
CM --
CR
Fig. 4.7. Dist. ofWall 6 to thecenter of rigidity,c6 , and static
mt eccentricity in the11 y-direction, esy,
for use inEquations (19) and(18), respectively.
Wall 6 is on the same side as the center of mass with respect to the center of rigidity, therefore it isflexible
and Equation (16) will be used to determine the FAT value for torsion for Wall 6:
0.60FATf6 = 1 + (0.12 (0.05 + 1.5(0.063)) = 1.34
(0.51)2
1 < < -> fAR = 1.08 (8% increase applied to account for A. R. not applied to the longer direction):- L 3
FATXMAX = (1.08)(1.34) = 1.45
FATyMAX = 1.08 (calculation not shown here)
dx = (1.45)(2.9%) = 4.2%
dy = (1.08)(2.9%) = 3.1%
Table 2. Wall Density ComparisonConventional Analysis Architectural Design
SMSA Proposed Method (% Difference) (% Difference)
dx 2.9 4.2 3.1 (-26%) 4.0 (-5%)
d, 2.9 3.1 2.9(-6%) 8.7* (181%)
*The wall density of the actual design for the y-direction is overdesigned due to the long dimension of thebuilding, providing excess support.
- 43 -

Christopher F. Porst
It should be noted that the FAT values can be determined from the respective chart in Fig. 4.5 for "L"
shaped plans. The corresponding chart from Fig. 4.5 is shown in Fig. 4.8 with a trend line for the FAT
values; it can be seen that for an e/b value of 0.063, the FATx according to the trend line is near the 1.34
value found from the calculation.
1.8 ,
1.7 O FATy
1.6 X FATxxX
U-- 1.5
1.2 -00
CLx X
. 1.0
0 1.0 U I i' i0.00 0.02 0.04 0.06 0.08 0.10 0.12
Normalized Eccentricity, e/b
Fig. 4.8. FAT versus e/b chart for "L" shaped buildings, also shown in Fig. 4.5 (a).
The architectural design was based on the geometry of the home and a conventional torsional analysis
performed according to the method from Naeim (2000) provided the corresponding results. It can be seen
from Table 2 that the required wall density according to the proposed method for each direction is more
conservative than that determined from conventional analysis. The actual design wall density for the y-
direction was. naturally overdesigned because of the building geometry which allowed for a plethora of
confined masonry wall length in that direction. The wall density for the y-direction found using the
proposed method is closer to that for the conventional analysis than in the x-direction because the walls in
the y-direction are less affected by torsion. This case study shows that the proposed method provides
conservative design requirements compared to other, more rigorous analyses which is expected considering
that the proposed method is simplified.
-44 -
Chapter 4 - Seismic Design Procedure for Confined Masonry Buildings
4.6 Summary
The proposed design procedure developed for the seismic design of low-rise confined masonry buildings
was discussed in detail. The procedure first uses the SMSA to determine a preliminary required wall density.
Subsequently, a method originally developed by Escobar et al. (2004, 2008) is used with simplifying
assumptions to determine the torsional amplification factor (FAT) which is used as a multiplier for the wall
density in each orthogonal direction of the building plan. The proposed method was used to perform a
parametric study on a number of arbitrary designs. A well dispersed, positive relationship is seen between
the building plan eccentricity and the torsional amplification factors. It is also observed that as the
normalized radius of gyration, p 2 , increases, the FAT converges at 1.1. The method was also applied to
evaluate a design which was previously analyzed using a conventional torsional analysis. The design
requirements found from the proposed method are conservative, as expected.
The design and analysis approach developed in this research can be used to rapidly determine the structural
design requirements for a large variety of low-rise CM buildings. The two assumptions made are: i) the
variety of plan shape options are limited, and ii) the eccentricity calculation assumes perimeter walls only.
These assumptions allow for a simplified design and analysis method (SMSA) to be combined with a more
complex torsional analysis (Escobar 2004, 2008) in a streamlined, simplified method that is rapidly
repeatable. The power of this streamlined method is captured in an Excel spreadsheet (see Fig. B. 1 Fig. B.2)
which will be available for download on the National Information Centre for Earthquake Engineering
(NICEE) and Confined Masonry Network (CMN) websites and distributed by these organizations wherever
possible. For applications where Excel cannot be used, the method will be used to create design tables and
charts for a physical guideline for the design of CM buildings in low-tech construction environments. Both
of which are usable by builders without technical expertise.
-45-

Christopher F. Porst
-46 -

Chapter 5 - Material Properties and Experimentation
5 Material Properties and Experimentation
As with any structural analysis it is critical to assess the material strengths that apply, and in the context of
India and other developing countries material properties are even more important because they are highly
variable and often low quality. Many studies exist that investigate the behavior of bricks and mortar in
masonry under compression and relate the effects of their properties to one another and to the overall
behavior of the masonry. However, there is limited experimental data related to low strength bricks, despite
the fact that in some regions of India it is common to use clay bricks with compressive strength lower than
3 MPa. This is partially due to the fact that such data is difficult to obtain because there is a lack of
experimental equipment in places where low strength bricks are used. The experiments presented in this
thesis seek to partially fill this research gap to inform more context conscious building practices in
developing countries and promote future studies on this topic.
In India bricks are often hand molded and produced using traditional firing techniques in one of the
country's 100,000 kilns (Maithel et al. 2012). Poor quality clay and variability and lack of quality control
in the manufacturing process are the causes of low-strength bricks. Since masonry is the most common
material for housing construction in the country (Iyer et al. 2012), this is a very important topic and the
reason for this study.
(a) (b) (c)
Fig. 5.1. Local masons constructing prisms (a), curing masonry prism specimens (b), and a prism undercompression testing (c) more details and experimentation photos can be found in Appendix C.
-47 -

Christopher F. Porst
Masonry compressive strength is important for the current analysis because it is critical for determining
shear strength, which governs seismic resistance of low-rise masonry walls. In the proposed design method,
Equation (8) relating shear capacity to compressive strength was chosen based on a comparison of equations
used by different building codes to model this relationship, Fig. B.4 in Appendix B shows this comparison.
Equation (8) relies solely upon masonry compressive strength and does not take into account the effect of
compressive stress as some do. This is because the proposed method applies only to low-rise buildings
subjected to low compressive stress (Meli et al. 2011). The equation was also used by Brzev et al. (2015).
Experimentation was conducted to test the effects of varying mortar types on masonry compressive strength
when low strength bricks are used (see Fig. 5.1). The materials were locally acquired in Gujarat, India and
local masons were hired to construct the prism specimens. The bricks were common "high strength" and
"low strength" bricks as defined by the dealer, but in reality both were lower than 2.5 MPa strength on
average. The minimum brick compressive strength prescribed by the Indian masonry code IS 1905: Code
of Practice for Structural Use of Unreinforced Masonry is 3.5 MPa, which is lower than the minimum value
from other building codes, even in developing countries such as Peru (min. 6.9 MPa) and Indonesia (min.
4.6 MPa) (Meli et al. 2011). The following three mortar mixes were used: i) 1:6 cement:sand ratio mortar,
ii) 1:8 mortar, and iii) a mud mortar with no cement. These mortar mixes are commonly used in India, mud
mortar being more common in rural areas.
The results of the testing reveal an inverse relationship between the cement content in the mortar and the
compressive strength of the masonry, which is the opposite from the trend any building code defines. The
mud mortar resulted in the strongest average prism strength, 41% stronger than the 1:6 mortar and 17%
stronger than the 1:8 mortar prisms as shown in Fig. 5.2. Likewise the 1:8 mortar prisms were 21% stronger
on average than the mortar with the highest cement content (1:6). Building codes do not address masonry
with brick units of such low strength despite the fact that they are so commonly used in certain countries.
Research studies have shown that masonry material behavior with such bricks is different from the common
"stiff brick - soft mortar" assumption (Drysdale et al. 1994). Codes exclusively assume that the mortar is
-48-

Chapter 5 - Material Properties and Experimentation
less stiff than the bricks and therefore under compression the mortar is in tri-axial compression as it tries to
expand and the bricks are in bi-axial tension and axial compression (see Fig. C. 1 in Appendix C). However,
with low-strength bricks the mortar may have equal or greater stiffness than the bricks which leads to
different structural behavior of these constituent materials.
It was hypothesized in this study that the softer mortars with lower cement content were able to deform
more compatibly with the low strength bricks, whereas the stronger 1:6 mortar with higher stiffness caused
stress concentrations in the brick, leading to earlier failure. It is further hypothesized that the lower cement
quantity mortars were able to develop better bond with the bricks, increasing the compressive strength. This
hypothesis is in line with the findings of previous studies by Samarasinghe and Lawrence (1992),
Sarangapani (1992) and Gumaste et al. (2007). A detailed report of the experimentation, results, and
conclusions behind the observed behavior can be found in Appendix C.
It is recommended based on these observations
that with low quality bricks, a low cement mortar
that is more compatible with the bricks be used in
construction. This will lead to more resilient
housing in low-tech construction environments
that is less expensive and takes into account the
reality of building materials that are being used
instead of specifying mortar mix based on brick
strengths specified by the building codes.
CD
W)
1.2
1.00.80.60.40.2
-0.63-E0.76
0.89
u.U1:6 1:8 MUD
Mortar Type
Fig. 5.2. Prism strengths by mortar type. Completeresults can be found in Appendix C.
- 49 -
V)

Christopher F. Porst
-50-

Chapter 6 - Summary and Conclusions
6 Summary and Conclusions
A seismic design procedure was developed that can rapidly generate structural design requirements for a
large range of low-rise confined masonry buildings with regular and irregular plan configurations. This
method combines two approaches for the design and analysis of CM buildings as an integrated approach
and simplifies the calculation procedure to a minimum. Results from the proposed method show that it is
conservative and applicable to buildings with a wide range of irregularities, with no severe outliers.
The assumptions made allow for a simpler and more rapidly reproducible calculation, however it is possible
that the eccentricity calculated with the current method be less than that for the actual building design.
These assumptions are: i) the method application is limited to a finite variety of plan shapes, and ii) only
perimeter walls are considered for the eccentricity estimation. Since the method considers only perimeter
walls, it is unlikely that the addition of interior walls and the removal of exterior walls for openings would
result in a greater eccentricity, and if this did occur the difference would be minimal. Therefore conservative
factors implemented in the procedure make such an occurrence irrelevant.
Experimentation shows higher masonry strength associated with lower mortar strength when bricks of
lower strength than the 3.5 MPa minimum requirements of the Indian masonry code IS 1905 are used. A
41% higher average compressive strength was observed for prisms with mud mortar than prisms with a 1:6
cement:sand ratio mortar, and 21% higher strength was observed in prisms with 1:8 mortar than those with
the higher strength 1:6 mortar. It is hypothesized that the higher strength mortars, which were stronger than
the bricks, were also more stiff, leading to stress concentrations in the bricks which caused the earlier
failure, whereas the lower strength mortar, with more comparable mechanical properties to the bricks,
allowed for more deformation prior to failure. It is also hypothesized that the lower strength mortars
developed a better bond with the bricks, also contributing to better masonry strength.
These observations suggest that when low strength bricks that are common in developing nations are used,
mortars with low cement content are more appropriate and will result in masonry that is as strong, if not
-51 -

Christopher F. Porst
stronger, than a higher strength mortar would. Such a suggestion, if followed, would reduce the cost of
building construction and lead to more resilient communities. It is the opposite of what any building code
would recommend, however, the bricks being used do not follow the code and this is a reality that is not
going to change in the near future.
6.1 Future Research Needs
6.1.1 Continuing Partner Collaboration
The partnerships created during this research are valuable and can lead to opportunities for future research.
The author of this thesis is currently working with partners on a guideline for the design, analysis, and
construction of low-rise confined masonry homes for low-tech environments that will incorporate the
design method developed herein. This guideline will be published by the National Information Center of
Earthquake Engineering (NICEE) at IT Kanpur.
Future students at MIT can continue to collaborate with PiC to provide consultation on their confined
masonry home designs to help ensure their approval by the governing board of housing projects. Continued
collaboration with partners such as PiC, EERI and its Confined Masonry Network, IIT Kanpur, IIT
Gandhinagar, NICEE, and experts on confined masonry and Indian construction, can lead to guidelines that
better fit this context and to conduits for implementation of CM in India.
6.1.2 Confined Masonry Formwork
Construction challenges pose a hindrance for widespread implementation of CM in India. One piece of
technology that could help solve this issue is formwork engineered specifically for confined masonry. In
RCC frame construction, four pieces of wood are held together that support each other as the formwork for
a concrete column. In CM, where the masonry is laid first, the masonry provides two of the formwork
surfaces and the construction team must find a way to support the other two pieces as flush against the
masonry as possible so as to prevent leakage of the concrete without damaging or disturbing the masonry.
-52-

Chapter 6 - Summary and Conclusions
This has shown to be a challenge, and the confined masonry construction of the new IIT Gandhinagar
campus reveals this, where issues occurred with concrete seapage and inadequate distribution of the
concrete in some cases see Fig. 6.1 (Basu et al. 2014, Jain 2015). Developing formwork technology that is
self-supporting and can be rapidly removed and reused without damaging the masonry would be a valuable
contribution to efforts to promote confined masonry construction which could also be a marketable product.
(a) (b) (c)
Fig. 6.1. CM construction at the new IIT Gandhinagar campus: concrete seapage results in unsightly
conditions (a), contrastingly, inadequate filling of tie-columns results in less bonded area between concrete
and masonry (b), and separation of cement and aggregate weakens beam-column joints (c).
6.1.3 Continued Experimentation
The author of this study was unable to perform deformation analyses on the bricks or mortar, therefore no
data on the relative moduli of elasticity was collected. Furthermore, experimental data on masonry with
such low quality bricks is very limited. There is enormous potential for future research in this area. Testing
prisms on a larger scale with more precise technology and measuring capabilities would shed light on the
behavior of masonry with low strength bricks, and develop firmer conclusions as to the reasons behind this
behavior. Such research could help inform better construction practices in developing countries across the
globe that would save lives and money. These implications will be powerful because they take into account
the reality of informal building practices instead of hinging on the assumption of code adherence.
- 53 -

Christopher F. Porst
- 54 -
Appendix A - References
Appendix A - References
Ali, Qaisar. 2005. Confined Masonry Guideline for Pakistan.
Arya, Anand S. et al. 2005. Guidelines for Earthquake Resistant Non-Engineered Construction. NationalInformation Centre of Earthquake Engineering (NICEE), Indian Institute of Technology Kanpur.
ASTM C67. American Society for Testing and Materials. 2014. "ASTM C67-13a: Standard Test Methodsfor Sampling and Testing Brick and Structural Clay Tile." 13. doi:10.1520/C0067-13A.2.
ASTM C 109. American Society for Testing and Materials. 2012. "ASTM C 109: Test Method forCompressive Strength of Hydraulic Cement Mortars."
ASTM C 1314. American Society for Testing and Materials. 2012. "ASTM C 1314: Standard Test Methodfor Compressive Strength of Masonry Prisms." 10. doi: 10.1520/Cl 314-12.2.
ASTM C 1552. American Society for Testing and Materials. 2012. "ASTM C 1552. StandardSpecification for Capping Concrete Masonry Units, Related Units and Masonry Prisms forCompression Testing."
Basu, Dhiman et al. 2014. Personal correspondence with Dhiman Basu and IIT Gandhinagar constructionsuperintendants in January 2014 regarding construction and implementation challenges pertaining toconfined masonry.
Blondet, Marcial. 2007. "Behavior of Earthen Buildings During the Pisco Earthquake of August 15,2007."
Blondet, Marcial et al. 2005. Construction and Maintenance ofMasonry Housesfor Masons andCraftsmen. 2nd ed. Pontifica Universidad Catdlica del Peru.
Brzev, Svetlana. 2007. Earthquake-Resistant Confined Masonry Construction. National InformationCenter of Earthquake Engineering.
Brzev, Svetlana et al. 2010. "Performance of Confined Masonry in Chile." EERINewsletter 44 (10): 2-3.
Brzev, Svetlana et al. 2015. "Simplified Method for Seismic Design of Confined Masonry Buildings."Indian Institute of Technology Gandhinagar.
Chile (2003). 2003. "NCH 2123. Confined masonry - Requirements for structural design."
Cluff, Lloyd S. 1971. "Peru Earthquake of May 31, 1970; Engineering Geology Observations." Bulletinof the Seismological Society ofAmerica 61 (3): 5 11-53 3.
Drysdale, Robert G. et al. 1994. Masonry Structures: Behavior and Design. Prentice-Hall. Inc.
Escobar, J. Alberto et al. 2004. "Evaluaci6n de Criterios de Disefto Por Torsi6n Sismica Estitica ParaEdificos de Varios Pisos." Revista de Ingenieria Sismica 89 (71): 63-89.
- 55 -

Christopher F. Porst
Escobar, J. Alberto et al. 2008. "Effect of Earthquakes on Some Kind of Buildings." American Journal ofEnvironmental Sciences 4 (3): 175-183. doi: 10.3 844/ajessp.2008.189.197.
EN 1996. 2006. "Eurocode 6: Design of Masonry Buildings - Part 1-1: Common Rules for Reinforcedand Unreinforced Masonry Structures (EN 1996-1:2006)."
GSDMA 2005. "Guidelines for Structural Use of Reinforced Masonry." 2005. Indian Institute ofTechnology Kanpur and Gujarat State Disaster Management Authority.
Gumaste, K. S. et al. 2007. "Strength and Elasticity of Brick Masonry Prisms and Wallettes underCompression." Materials and Structures 40 (2): 241-253. doi: 10.1617/s11527-006-9141-9.
Guzmin, Pablo Ivin Angeles, and Escobar, J. Alberto. 2010. "Disefto Por Torsi6n Sismica Se Estructurasde Mamposteria." Universidad Nacional Aut6noma de M6xico.
Hendry, Arnold W. 1981. Structural Brickwork. Halsted Press.
Hendry, Arnold W. 1990. Structural Masonry. Macmillan Education LTD.
IBC 2012. 2012. 2012 International Building Code (IBC). International Code Council.
IS 1893. 2002. "Criteria for Earthquake Resistant Design of Structures - Part 1: General Provisions andBuildings." New Delhi, India: Bureau of Indian Standards.
IS 1905. 1987. "Code of Practice for Structural use of Unreinforced Masonry." New Delhi, India: Bureauof Indian Standards.
IS 3495. 1992. "Methods of tests of burnt clay building bricks." New Delhi, India: Bureau of IndianStandards.
Iyer, Karnu et al. 2012. Build a Safe House with Confined Masonry. Gujarat State Disaster ManagementAuthority.
Jain, Sudhir K. 2015. "Earthquake Safety in India: Acheivements, Challenges, and Opportunities." (inPress).
Jain, Sudhir K. et al. 2002. "Introduction." Earthquake Spectra 18 (S1): 1-4.doi:http://dx.doi.org/ 10.1193/1.2803902.
Jaiswal, Kishor et al. 2002. "Housing Report: Reinforced Concrete Frame Building with Masonry InfillWalls Designed for Gravity Loads." World Housing Encylopedia. Vol. 100052.
Kappos, Andreas J. et al. 2002. "Evaluation of Simplified Models for Lateral Load Analysis ofUnreinforced Masonry Buildings." Journal ofStructural Engineering 128 (7): 890-897.doi:10. 1061/(ASCE)0733-9445(2002)128:7(890).
Kaushik, H. et al. 2007. "Stress-Strain Characteristics of Clay Brick Masonry Under UniaxialCompression." Journal of Materials in Civil Engineering 19 (9): 728-739.
-56-
Appendix A - References
Kurup, E Jayashree. 2014. "Narendra Modi Government's Ambitious Housing Target: Home for EveryFamily by 2022." The Economic Times.
Loaiza F., Cesar, and Blondet, Marcial. 2002. "Housing Report: Confined Masonry Houses." WorldHousing Encylopedia. Vol. 100012.
Madabhushi, S. P. G. et al. 2005. The Bhuj, India Earthquake of 26th January 2001; A FIELD REPORTBYEEFIT. Vol. 44. London: Earthquake Engineering Field Investigation Team.
Maithel, Sameer et al. 2012. "Brick Kilns Performance Assessment A Roadmap for Cleaner BrickProduction in India." Shakti Sustainable Energy Foundation and Climate Works Foundation.
McNary, W. Scott, and Daniel P. Abrams. 1985. "Mechanics of Masonry in Compression." Journal ofStructural Engineering 111 (4): 857-870. doi:10.1061/(ASCE)0733-9445(1985)111:4(857).
Meli, Roberto. 1994. "Structural Design of Masonry Buildings: The Mexican Practice." AC[ SpecialPublication 147 Masonry in the Americas: 239-262. doi: 10.14359/4368.
Meli, Roberto et al. 2011. "Seismic Design Guide for Low-Rise Confined Masonry Buildings." WorldHousing. Earthquake Engineering Research Institute.
Moroni, Maria Ofelia et al. 2004. "Performance and Seismic Vulnerability of Masonry Housing TypesUsed in Chile." Journal ofPerformance of Constructed Facilities 18 (3): 173-179.doi: 10.1 061/(ASCE)0887-3828(2004)18:3(173).
Moroni, Maria Ofelia et al. 2000. "Wall Density and Seismic Performance of Confined MasonryBuildings." The Masonry Society Journal 18 (1): 79-86.
Moroni, Maria Ofelia et al. 2002. "Housing Report: Confined Block Masonry Building." World HousingEncylopedia.
Murty, C V R et al. 2006. At Risk: The Seismic Performance of Reinforced Concrete Frame Buildingswith Masonry Infill Walls. October. 2nd ed. Earthquake Engineering Research Institute.http://sheltercentre.org/library/risk-seismic-performance-reinforced-concrete-frame-buildings-masonry-infill-walls.
Murty, C.V.R. et al. 2005. Earthquake Rebuilding in Gujarat, India. Earthquake Engineering ResearchInstitute.
Naeim, Farzad. 2000. "Chapter 8 Seismic Design of Floor Diaphragms." In The Seismic DesignHandbook, Second, 373-408. Springer.
NTC- M 2004. 2004. Normas Ticnicas Complementarias para Diseho y Construcci6n de Estructuras deMamposteria (Complementary Technical Norms for the Design and Construction of MasonryStructures) (in Spanish and English). Official Gazette of the Federal District of Mexico.
Peru (2006). 2006. "National Building Code, Technical Standard E.070 Masonry."
- 57 -
Christopher F. Porst
PiC 2014. People in Centre. 2014. Drawings for the Indira Awaas Yojana (IAY) Federal HousingScheme.Personal correspondance with PiC architecture firm. Ahmedabad, Gujarat, India.
Romero, Frances. 2010. "Top 10 Deadliest Earthquakes: 1970: Chimbote, Peru." Time, January.http://content.time.com/time/specials/packages/article/0,28804,1953425_1953424_1953359,00.html
Saito, Keiko et al. 2004. "Using High-Resolution Satellite Images for Post-Earthquake Building DamageAssessment: A Study Following the 26 January 2001 Gujarat Earthquake." Earthquake Spectra 20(1): 145-169. doi:10.1193/1.1650865.
Samarasinghe, W, and S J Lawrence. 1992. "Effect of High Suction Rate in Low Strength Bricks onBrick Mortar Bond." In The 4th International Seminar on Structural Masonry for DevelopingCountries, 43-51. Madras, India: DBCE.
San Bartolome, A., and D. Quiun. 2008. "Seismic Behaviour of Masonry Constructions in 2007 Pisco,Peru Earthquake." In The 14th World Conference on Earthquake Engineering. Beijing, China.
Sarangapani, G. 1992. "Studies on the Strength of Brick Masonry Using Mud Mortar." In The 4thInternational Seminar on Structural Masonry for Developing Countries, 29-34. Madras, India:DBCE.
Sarangapani, G. et al. 2002. "Structural Characteristics of Bricks, Mortars and Masonry." Journal ofStructural Engineering (Madras) 29 (2): 101-107.
Sarangapani, G. et al. 2005. "Brick-Mortar Bond and Masonry Compressive Strength." Journal ofMaterials in Civil Engineering 17 (2): 229-237. doi: 10.1061 /(ASCE)0899-1 561(2005)17:2(229).
Schacher, Tom. 2011. Confined Masonry for One and Two Story Buildings in Low-Tech Environments.Vol. 3.1. National Information Centre of Earthquake Engineering (NICEE), Indian Institute ofTechnology Kanpur.
Tena-Colunga, Arturo, and Jesis Cano-Licona. 2010. "Simplified Method for the Seismic Analysis ofMasonry Shear-Wall Buildings." Journal of Structural Engineering 136 (5): 511-520.doi: 10.106 1/(ASCE)ST. 1943-541 X.0000 142.
Tena-Colunga, Arturo et al. 2009. "Cyclic Behavior of Combined and Confined Masonry Walls."Engineering Structures 31 (1): 240-259. doi: 10.101 6/j.engstruct.2008.08.0 15.http://dx.doi.org/1 0.101 6/j.engstruct.2008.08.015.
Terin-Gilmore, Amador et al. 2009. "Displacement-Based Seismic Assessment of Low-Height ConfinedMasonry Buildings." Earthquake Spectra 25 (2): 439-464. doi: 10.1193/1.3111149.
Tomazevic, Miha, and Iztok Klemenc. 1997. "Seismic Behaviour of Confined Masonry Walls."Earthquake Engineering & Structural Dynamics 26: 1059-1071. doi: 10.1 002/(SICI) 1096-9845(199710)26:10<1 059::AID-EQE694>3.3.CO;2-D.
Totten, Craig. 2010. Confined Masonry Workshop Handbook The Construction and Maintenance ofMasonry Buildings in Haiti. Appropriate Infrastructure Development Group (AIDG) and ArchitectsWithout Borders - Oregon (AWB).
-58-
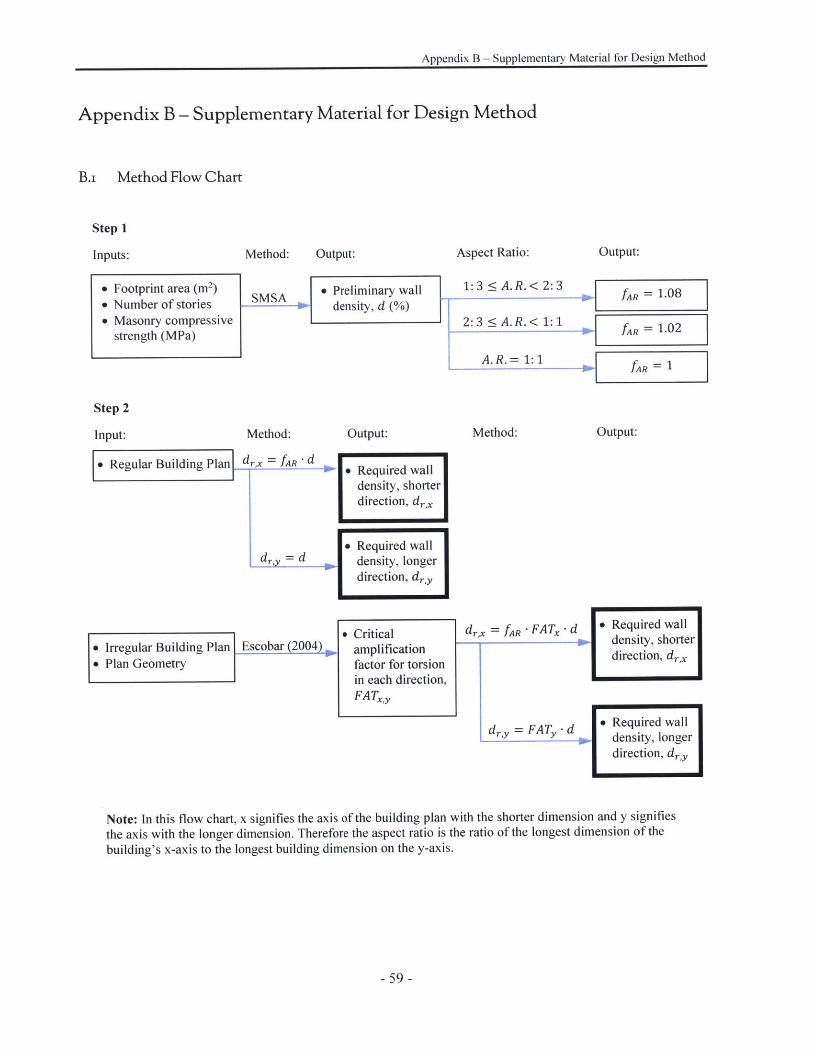
Appendix B - Supplementary Material for Design Method
Appendix B - Supplementary Material for Design Method
B.i Method Flow Chart
Step 1
Method: Output:
SMSA * Preliminary wall-~~ density, d()
Step 2
Input: Method: Output:
Regular Building Plan dr, Required wall
density, shorterdirection, drx
e Required walldrl d density, longer
direction, dr,y
Aspect Ratio:
1:3 <A.R.< 2:3 -4- fR=10
2: 3 :; A. R. < 1: 1 f = 1.02
A.R.= 1: 1 A
Method:
* Irregular Building Plan" Plan Geometry
* CriticalEscobar (2004) amplification
factor for torsionin each direction,FATx,y
drx = fAR -FAT - d o Required walldensity, shorterdirection,
dr, x
dry = FATS- d I Required wall_ dr- -=_-_d density, longer
direction, dr,y
Note: In this flow chart, x signifies the axis of the building plan with the shorter dimension and y signifies
the axis with the longer dimension. Therefore the aspect ratio is the ratio of the longest dimension of the
building's x-axis to the longest building dimension on the y-axis.
- 59 -
Inputs:
* Footprint area (M2)
" Number of stories" Masonry compressive
strength (MPa)
Output:
Output:
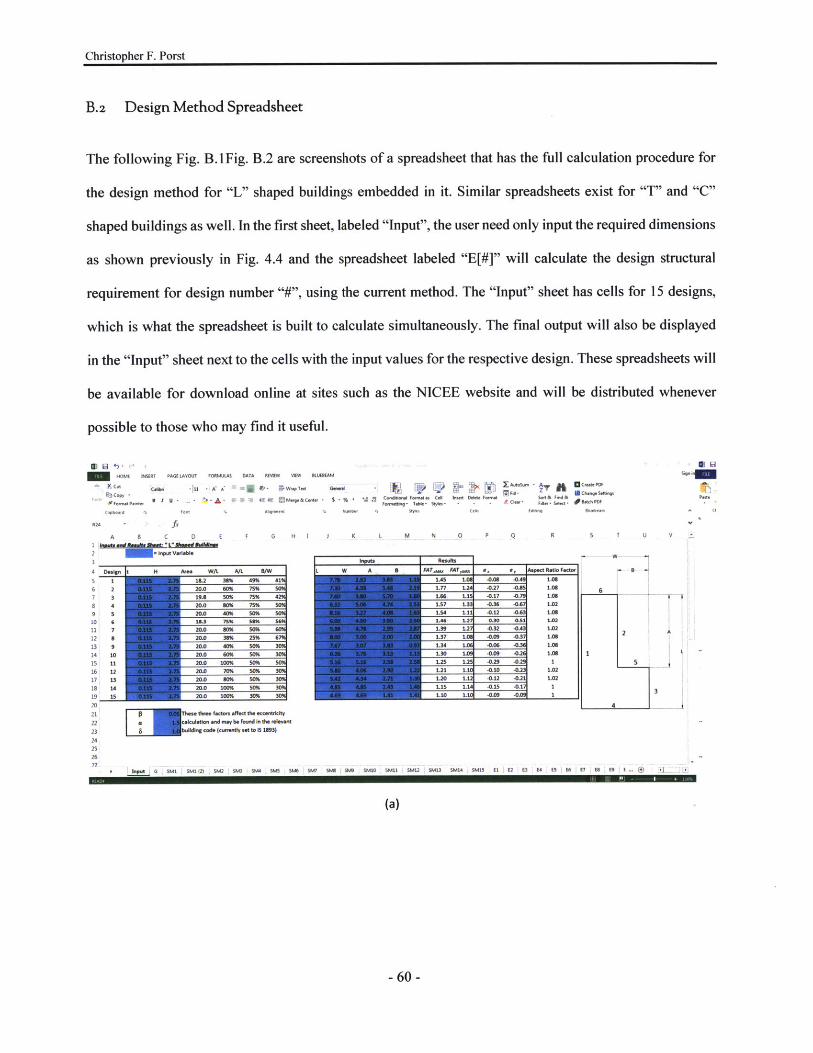
Christopher F. Porst
B.2 Design Method Spreadsheet
The following Fig. B. IFig. B.2 are screenshots of a spreadsheet that has the full calculation procedure for
the design method for "L" shaped buildings embedded in it. Similar spreadsheets exist for "T" and "C"
shaped buildings as well. In the first sheet, labeled "Input", the user need only input the required dimensions
as shown previously in Fig. 4.4 and the spreadsheet labeled "E[#]" will calculate the design structural
requirement for design number "#", using the current method. The "Input" sheet has cells for 15 designs,
which is what the spreadsheet is built to calculate simultaneously. The final output will also be displayed
in the "Input" sheet next to the cells with the input values for the respective design. These spreadsheets will
be available for download online at sites such as the NICEE website and will be distributed whenever
possible to those who may find it useful.
HOME [NERT PAGELAYOUT FORMULAS DATA REVIEW VIEW BLUEBEAM
Ct C~ -11 - A7 A- / iWr.P 7.9 c Genra Z C t
F I U. - &- - C. - ~ 4 M.Ege&C C . % . 2I CA T Mee& n C-N -% En DnEl. FormU S. C.ld - & PC.DF.
Chpboard IR F r. Al..t NTE E. .C. . . Ed. ng 61-n b- ^ C.
R24 - - xA 8 C D E F G H I K L M N 0 P Q R S 7 U V
3 &WSResults
4 Design H Area W/ AI/L /W L W A 8 MT~.. FAT~s 4 * , AspectRPAR OFactor5 1 182 38% 49% 41 141 1. 0 01 OM 0.49 1.06
6 2 20.0 60% 7S% 177 1 -0.27 .O 1.01 67 3 19.8 4% 71% 166 1 -0.17 -0 1.0
8 4 20,0 80% 71% 157 3-3 3 0.36 -0.6 1.02
9 5 20.0 40% 50% 501 .4 1.1 4.12 0.63 1.0810 6 15. 78%UK.46 L2 0.30 0.5 1.02
11 7 20.0 0% S0% 1.39 1.2 .0.32 1.02
12 200 38% 25% 6 1.37 1. -0.09 03 1.06 A
13 920.0 40% S0% L34 L 0.06 8LOS
14 10 20.0 60% S0% 1.30 -0.09 A0 1.08 115 11 20. 100% 50% .025.29 -0. 1 516 12 20.0 70% 50% 111 1.1 0.10 0. 10217 13 20.0 110% 509 -012 .21 1.2
18 14 20 1001% 50% 3 L.S 1.1 -0.15 -0.1 119 11 20.0 100% 30% 1.0 10 1 -0.09 1 3
20 4
21 fl Ihrs. three factors affect the eccentrie ty22 :alculation and mly be found In the relenant
23 building code (curenTwly set to ES 1893)2425
26
b41t G SM1 : SM1 (2) M2 18sM3 SMa s MS S 58 SM SPA 18.4 SM10 SM11 I SM12 SM23 SM14 SM15 E1 E2 63 E4 E5 E6 E7 El E9 E... ®)
(a)
- 60 -

Appendix B - Supplementary Material for Design Method
Inputs Results
IL W A B FA Twx FA T ywx
1.4 108
1.66 1.11.57 1.331.54 1.111~46
1.37 1.081.34 1.061.30 1.091.25 1.251.21 1.101.20 1.121.15 1.141.10 1.10
(b)
Fig. B.1. "Input" sheet of designmethod spreadsheet for "L" shapedbuildings (a), and a close up of theinputs and design outputs side byside in the "Inputs" sheet for 15separate designs (b). Shaded cellsindicate inputs. This is the onlypart of the spreadsheet where auser is required to input andinterpret values.
W * - - Guidline Eccentricity-L-dims - Excel
- HOME INSERT PAGE LAYOUT FORMULAS DATA REVIEW VIEW BLUEBEAM
Cut Calibri -I AA 9 Wrap Text General - [. 1) 3Past I copy
J;qEPaste m B I - A + ~i ~ - Merge&Center - $ - % *sa Conditional Format as Cell Insert Delete Format
.9 Format Painter 1.4 E egFormatting - Table - Styles -
Clipboard 1 Font r5 Alignment r. Number r Styles Cells
U fx
2 C.ealerofMasa
aVl Ditonw Lorn3o Vai* a VS 7 , 7.4 46 Oh 0
4. 2 ~ 3* 23 t.7 307 3 9 4.0 24 2.9 10
4 2 77 15 25Sa 12 7 2.3 30
B 1 . t7 30 0* 0st10 0.0
13 .iii Sb TMoknea Area Vasill av
17 7 0.10 0 45A34 172 so
to How* ... a .ts 12 3*6
21 Cwm rof. 114 49 122 V ,i
23 VAN L.egth F. K 124 1 7. 2.6 0 2
S 2 3 13 22 320 3 4. t3 3 427 52 6. 5
30 Va Ln0 FL o.3 4 2.9 to32~ 5 52 0.433 17 O.h 4A34 I tl .
36 r
37 Harra ., a30 L2 11
4142444S
- - ~emoj K L-M N 0 V 0 A nI fT U V W .
Plimuhirds
V 1
A 1*
T,0
-0221.
Hekde stinCkr. F ipift e I4 b. b. V. V. k. k, d. 4. V.,Y V.:'? - s o7, 24/ MA;
-I2 CA.a44 0.27 044 -o 2O3 - 2 14 1M V2A 2 ,0mU 0270. .' 5477 -0." . ow/7 t
1 -11 1 SO .'6057 730.3 01.4 0463 0'77.U - A 112 0. 4.44 0*3 0.11 3247 0.17110 - ' 2372 l1w$ 1M0.3 4.7 . 40444. 0.M3 0*0 24517 -'3043 1. 1? I
- ON ON MOor 60654 riex 7107 4604,1 472-01 O 137IT in kN kN Nil - Nlmm mm min kN-W kN-4*
Val ml L.ii L. $? 0. A.I 1 00
2 1 12i3 0 -
1 0.5a7 5*274 24.23
6 37746.30 2365
- 61 -
3 I
52024 4
4.0
408
. IV3.4 0
O 7*4
Input G SM1 SM1 (2) SM2 SM3 SM4 SMS SM6 SM7 SM8 SM9 SM10 SM11 SM12 SM13 SM14 SM15 El
Fig. B.2. Sheet "E[#]" (sheet shown is "El") that performs the design eccentricity and torsionalamplification factor calculation for design number "#". No inputs are required in this sheet.
i A
z AA AD AC
FAT...1111517 231115117 1114.11 2z,"
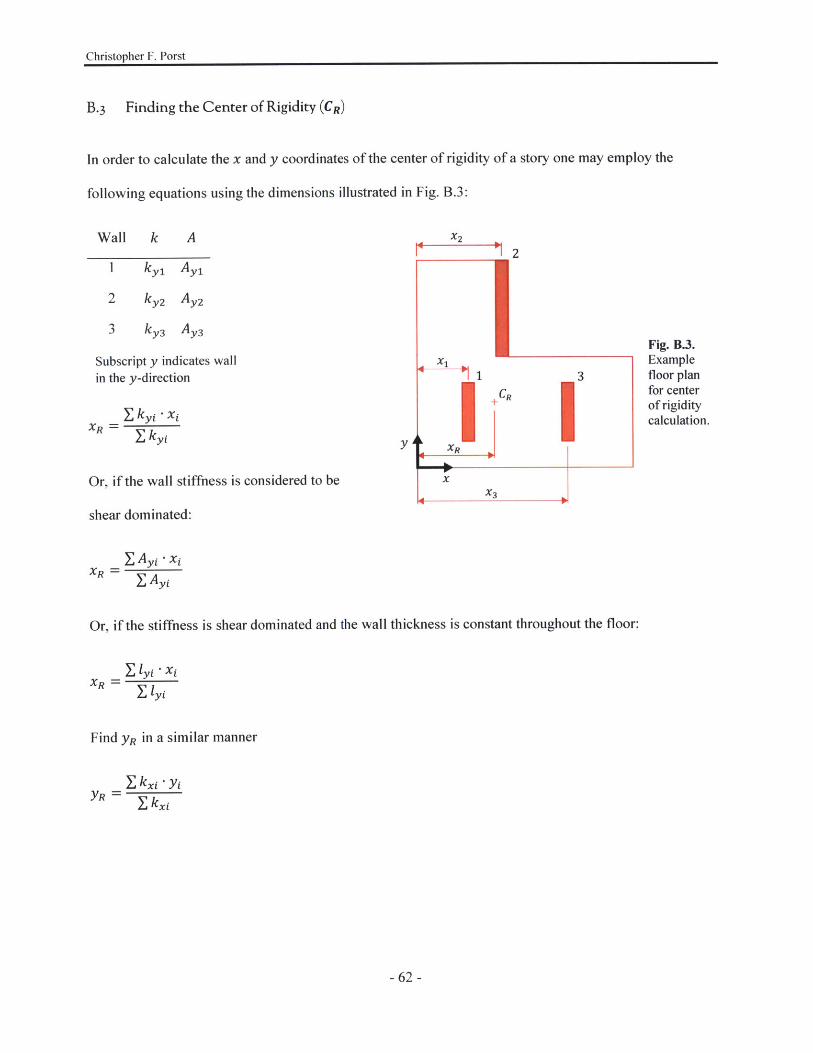
Christopher F. Porst
B. 3 Finding the Center of Rigidity (CR)
In order to calculate the x and y coordinates of the center of rigidity of a story one may employ the
following equations using the dimensions illustrated in Fig. B.3:
Wall k A
I ky 1 Ay 1
2 ky 2 Ay2
3 ky 3 Ay 3
Subscript y indicates wall
in the y-direction
X kyi -xiXR = Z yi
Or, if the wall stiffness is considered to be
shear dominated:
X2X2
x
x3X3
Fig. B.3.Examplefloor planfor centerof rigiditycalculation.
Z AYi - xiXR Z Ay1
Or, if the stiffness is shear dominated and the wall thickness is constant throughout the floor:
XR *
Find yR in a similar manner
Z kxi - yjYR
- 62 -
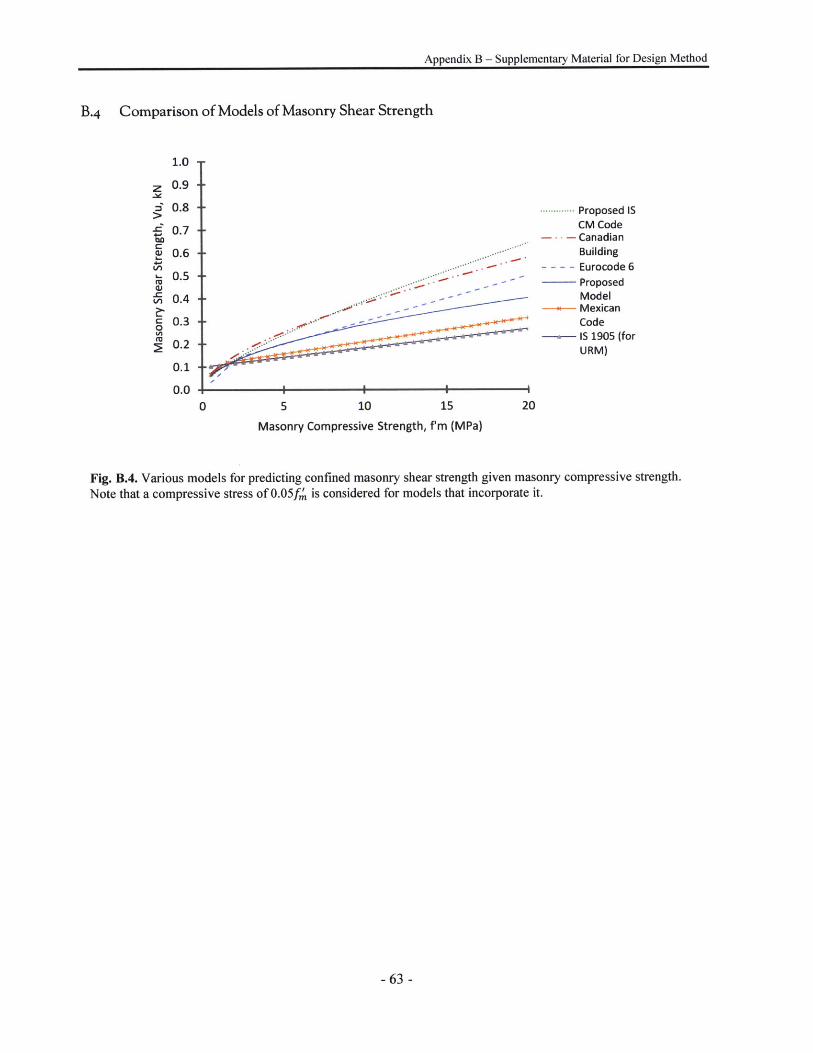
Appendix B - Supplementary Material for Design Method
B.4 Comparison of Models of Masonry Shear Strength
1.0 -
z
0U,
a)2,
0.9 -
0.8 -
0.7 -
0.6
0.5
0.4
0.3 -
0.2
0.1
0.00
............ Proposed ISCM Code
- CanadianBuilding
- - - - Eurocode 6ProposedModelMexicanCodeIS 1905 (forURM)
I I-I
5 10 15 20
Masonry Compressive Strength, f'm (MPa)
Fig. B.4. Various models for predicting confined masonry shear strength given masonry compressive strength.
Note that a compressive stress of 0.05f' is considered for models that incorporate it.
-63 -

Christopher F. Porst
- 64 -

Appendix C - Experimental Study on Masonry Compressive Strength
Appendix C - Experimental Study on Masonry Compressive Strength
C.i Introduction
Several studies have investigated the behavior of bricks and mortar in masonry under compression and the
effects of their properties to one another and to the overall behavior of the masonry. Most studies concluded
that as mortar strength increases, prism strength increases, and building codes follow this assumption
exclusively (IS 1905, EN 1996, IBC 2012). However, this trend has been found to be more pronounced
with high strength units (Hendry 1990; Drysdale et al. 1994), and multiple researchers have concluded that
in some cases the trend is not true at all (Sarangapani 1992; Gumaste et al. 2007). The findings of these
research studies also suggest that the bond between the mortar and brick units has a more significant effect
on masonry compressive strength than mortar strength (Sarangapani et al. 2005). A study by Samarasinghe
and Lawrence (1992) found that with dry laid bricks lean mortars achieved higher bond strength than richer
cement and lime mortars.
Table 3. Compressive Strength Ranges for Common Bricks
Location Compressive Strength (MPa) Compressive Strength (MPa)(Sarangapani et al. 2002) (GSDMA 2005)
Bangalore 3 - 12 -Mysore 4-6.5 -Kerala 7.6- 14.2 -Kanpur 14.6-23.7 -Uttar Pradesh 22.2 10-25Pondicherry 5 - 11 -Mumbai 4-7.5Chennai 2- 15 -Delhi and Punjab 7- 10 7- 15Gujarat 3- 10 3-10Madhya Pradesh 3.5- 10 3.5-5Maharashtra - 5Rajasthan - 3West Bengal - 10-25Andhra Pradesh - 3-7Assam - 3.5
- 65 -
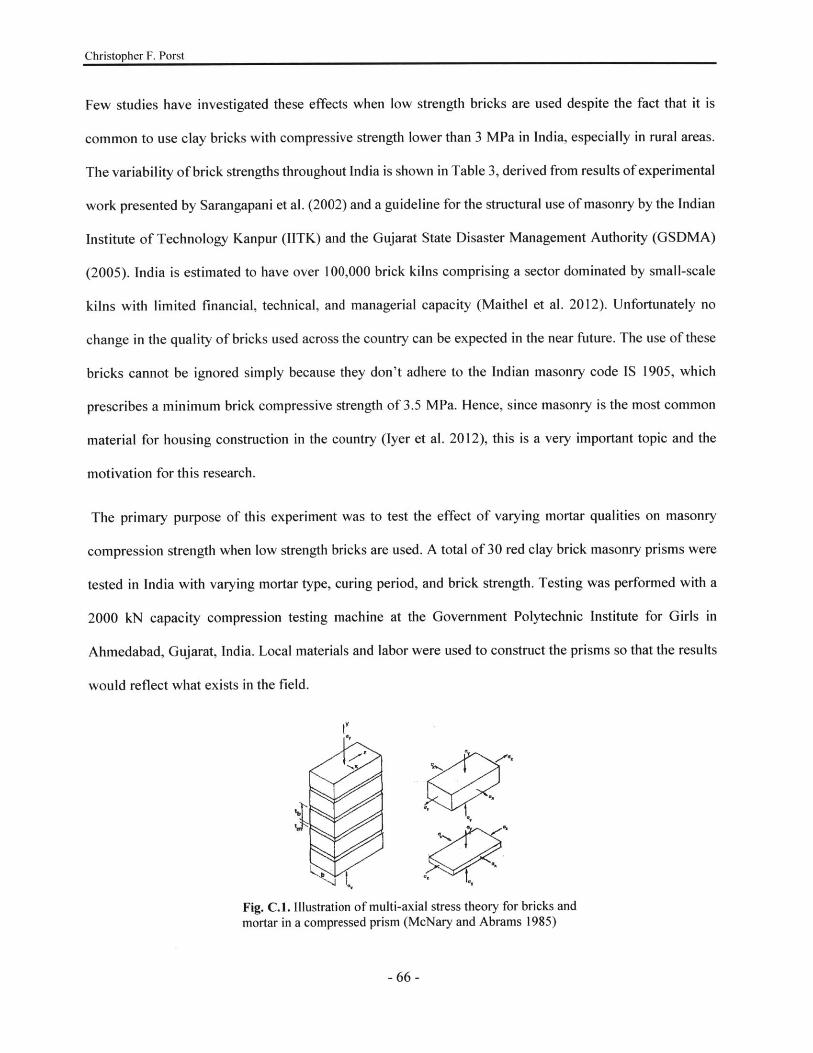
Christopher F. Porst
Few studies have investigated these effects when low strength bricks are used despite the fact that it is
common to use clay bricks with compressive strength lower than 3 MPa in India, especially in rural areas.
The variability of brick strengths throughout India is shown in Table 3, derived from results of experimental
work presented by Sarangapani et al. (2002) and a guideline for the structural use of masonry by the Indian
Institute of Technology Kanpur (IITK) and the Gujarat State Disaster Management Authority (GSDMA)
(2005). India is estimated to have over 100,000 brick kilns comprising a sector dominated by small-scale
kilns with limited financial, technical, and managerial capacity (Maithel et al. 2012). Unfortunately no
change in the quality of bricks used across the country can be expected in the near future. The use of these
bricks cannot be ignored simply because they don't adhere to the Indian masonry code IS 1905, which
prescribes a minimum brick compressive strength of 3.5 MPa. Hence, since masonry is the most common
material for housing construction in the country (Iyer et al. 2012), this is a very important topic and the
motivation for this research.
The primary purpose of this experiment was to test the effect of varying mortar qualities on masonry
compression strength when low strength bricks are used. A total of 30 red clay brick masonry prisms were
tested in India with varying mortar type, curing period, and brick strength. Testing was performed with a
2000 kN capacity compression testing machine at the Government Polytechnic Institute for Girls in
Ahmedabad, Gujarat, India. Local materials and labor were used to construct the prisms so that the results
would reflect what exists in the field.
y
Fig. C.1. Illustration of multi-axial stress theory for bricks andmortar in a compressed prism (McNary and Abrams 1985)
- 66 -

Appendix C - Experimental Study on Masonry Compressive Strength
C.2 Current Hypothesis
It is hypothesized that if low quality bricks are used, a weaker, less expensive mortar can provide the same
compressive strength in the masonry as a higher quality mortar. This is intended to inform more context
conscious designs that can save costs. Common failure theory for masonry in compression considers a
multi-axial stress state of bricks and mortar shown in Fig. C. 1, where the mortar is in tri-axial compression
and the bricks are in axial compression in the direction of the force vector and bi-axial tension in the two
orthogonal directions (McNary and Abrams 1985). This failure theory is only valid when the bricks are
stronger than the mortar (Hendry 1981). Masonry samples were tested in the current study in which the
mortar compressive strength was higher than that of the bricks. In that case the opposite behavior is
expected, that is, the bricks are in tri-axial compression and the mortar is in axial compression and bi-axial
tension. It is hypothesized that the onset of vertical tensile cracks in low strength bricks will not be delayed
by a high quality mortar because under this behavior higher strength mortar will not engage the full strength
of the bricks. It should be noted that these behavior theories assume a perfect bond between the bricks and
mortar which is not always the case, especially with low-tech construction. More failure theories that match
the hypothesis and the experimental results and don't assume a perfect bond are referenced in section C.8
of this report.
The hypothesis was tested in these experiments. More specifically it was examined whether typical low-
strength bricks used in Indian non-engineered masonry construction should be used with higher quality
mortars to increase wall capacity, or whether doing so would be a waste of funds and actually may even
reduce the masonry strength. The results of this study may be used to inform masonry design in a manner
that is conscious of both cost and safety. This project was also taken with an objective to provide technical
input for a rural housing project being facilitated by PiC for the Commissionerate of Rural Development
Gujarat State.
- 67 -
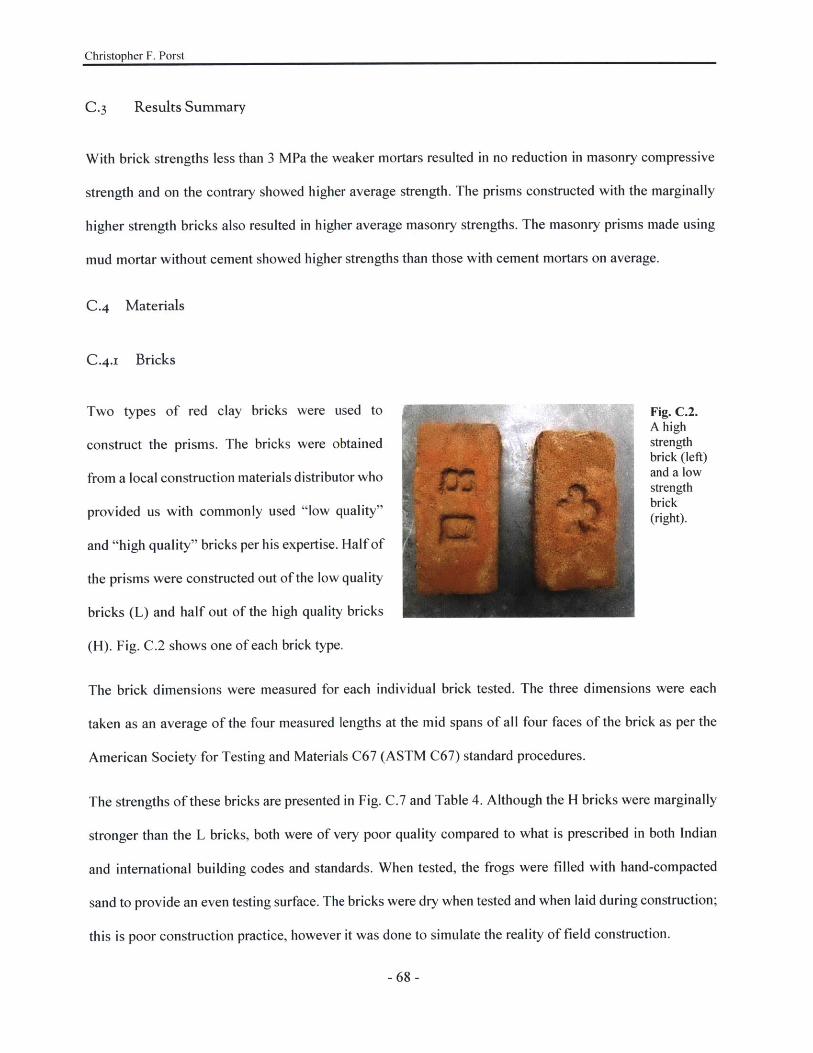
Christopher F. Porst
C.3 Results Summary
With brick strengths less than 3 MPa the weaker mortars resulted in no reduction in masonry compressive
strength and on the contrary showed higher average strength. The prisms constructed with the marginally
higher strength bricks also resulted in higher average masonry strengths. The masonry prisms made using
mud mortar without cement showed higher strengths than those with cement mortars on average.
C.4 Materials
C.4 .x Bricks
Two types of red clay bricks were used to Fig. C.2.A high
construct the prisms. The bricks were obtained strengthbrick (left)
from a local construction materials distributor who and a lowstrengthbrick
provided us with commonly used "low quality" (right).
and "high quality" bricks per his expertise. Half of
the prisms were constructed out of the low quality
bricks (L) and half out of the high quality bricks
(H). Fig. C.2 shows one of each brick type.
The brick dimensions were measured for each individual brick tested. The three dimensions were each
taken as an average of the four measured lengths at the mid spans of all four faces of the brick as per the
American Society for Testing and Materials C67 (ASTM C67) standard procedures.
The strengths of these bricks are presented in Fig. C.7 and Table 4. Although the H bricks were marginally
stronger than the L bricks, both were of very poor quality compared to what is prescribed in both Indian
and international building codes and standards. When tested, the frogs were filled with hand-compacted
sand to provide an even testing surface. The bricks were dry when tested and when laid during construction;
this is poor construction practice, however it was done to simulate the reality of field construction.
- 68 -

Appendix C - Experimental Study on Masonry Compressive Strength
C.4.2 Cement
A 50 kg bag of 53 Grade Ambuja Cement was purchased for making the cement-based mortars from the
same materials dealer who sold the bricks.
C.4 .3 Sand
Sand was purchased from the same distributor as the bricks and cement. The sand was stored outside at the
store and during testing, hence it was moist due to the monsoon season. Moisture testing of the sand was
not conducted due to limited time and resources. The water added to each mortar mix was not controlled
and was left to the mason as he deemed appropriate.
C.4 .4 Mud
Mud with an appropriate clay content and cohesiveness was
sourced from a nearby construction site and was selected by hand
and visual inspection by Vivek Rawal, head architect at People in
Centre (PiC), and P.B Prajapati, Engineering Department Head at
the institute where the testing was performed. The mud was
crushed and sieved and then mixed with water multiple times untilFig. C.3. Mud mortar thread retainedcohesiveness to approximately 3 mm it was deemed a proper consistency and then was left overnight indiameter.
an airtight container. The mud was able to be rolled to a 3 mm diameter thread without breaking, see Fig.
C.3. The mud mortar prisms were pointed with a 1:6 cement mortar.
The mud was analyzed by KBM Engineering Research Laboratory in Ahmedabad, Gujarat. It was
determined through the analysis that the mud was comprised of 7% Medium Sand (2 mm to 0.425 mm),
38% Fine Sand (0.425 mm to 0.075 mm), 40% Silt Sized Particles (0.075 mm to 0.002 mm), and 15% Clay
Sized Particles (<0.002 mm). The water content of the mud, after water had been added to it for workability
and consistency purposes, was 28.64%.
- 69 -

Christopher F. Porst
C.4 .5 Water
Water from the restroom tap at the Government Polytechnic for Girls Ahmedabad was used for mortar
mixing. It was left to the mason to decide how much water to add to each mix for proper workability.
C.5 Construction
C.5 .i Mortar Mixing
The cement mortar contained only cement, sand, and water; no lime was used. The cement-to-sand ratios
were chosen by People in Centre based on prevalent practice of common mixes in low-income, rural
housing construction. Cement and sand quantities were measured out for each cement mortar batch by the
author of this thesis, dry mixed by the masons, and water was added and wet mixed to proper workability
by masons. The cement-to-mortar ratios were measured by volume by the author using graduated cylinders
which were purchased at a local supply store. Each batch was mixed in a small bowl typically used by
Indian masons, see Fig. C.4, and provided enough mortar to build approximately I %/ prisms.
Fig. C.4. Masonmixing mud mortar.Cement mortarswere mixed in thesame manner.
For comparison with the Indian Standard, the 1:6 cement:sand mortar can be classified as type M2 mortar,
and the 1:8 mortar can be classified as type LI mortar as per IS 1905 Table 1. This table is shown in Fig.
- 70 -
Appendix C - Experimental Study on Masonry Compressive Strength
F. 1 of Appendix F. The mud mortar may be related to type L2 mortar, the weakest included in the code,
however IS 1905 Table 8, given in Fig. F.2 of Appendix F, shows the same prism basic compressive stresses
for both types LI and L2 with minimum strength bricks.
The mortar was mixed in the predefined ratios by volume as measured by the author. The moisture content
of the sand was unknown but was moist to the touch. The mason was allowed to add water as he saw fit
while he constructed the prisms. The mud mortar was prepared the day before it was used.
C.5 .2 Prisms
In total, 30 masonry prisms were constructed. Two local masons built the prisms from August 7 through
August 9, 2014 (see Fig. C.5). The first day twelve prisms were built with 1:6 cement:sand mortar, the
second day twelve were built using 1:8 mortar, and on the third construction day six prisms were made with
mud mortar. Some completed prisms are shown in the curing process in Fig. C.5 (b).
The masons were requested to build the prisms as level as possible to ensure a flat and level testing surface.
However, some of the prisms still weren't entirely level. The mortar joints were made 10 mm thick using
marked wooden trowels as measuring tools. The ASTM C 1552 standard prescribes that the specimens be
capped using plaster of Paris, however due to lack of time the prisms were instead capped with a layer of
mortar to provide a more uniform, smooth surface than the frogged brick face. Sheets of plywood were also
placed between the top and bottom surfaces of the specimens and the testing machine bearing faces as per
IS 1905 in order to more evenly distribute the load.
Prisms were built one at a time by the masons and the cement mortar specimens were wrapped, sealed, and
labeled immediately upon completion. Subsequently, they were sealed in moisture-tight plastic bags as per
ASTM C1314 and remained undisturbed until they were tested. However, the mud mortar prisms were only
sealed for three days before they were unwrapped. The mud prisms were pointed with a 1:6 cement:sand
mortar, hence they were sealed for three days to allow for the pointing to cure and then unwrapped to allow
-71 -

Christopher F. Porst
the mud mortar to dry. A small amount of water was sprinkled on the cement mortar pointing a few days
later to help the cement pointing continue to cure. The rest of the prisms were not wetted after being sealed.
(a) (b)
Fig. C.5. Masons constructing prisms (a) and completed prisms in the curing process (b).
C.5.3 Mortar Cubes
Five 70 mm mortar cubes were cast by the author in accordance with ASTM C109 procedures for each
mortar type to test the mortar strengths. The cubes were left submerged in a bucket of water to cure until
the day of testing. The excess moisture was removed with a rag just before testing.
C.6 Test Setup
C.6.i Test Specimens and Standards
The masonry prism testing procedures prescribed by the American Society for Testing and Materials
standards were followed to as great of an extent as feasible given the resources, labor, and time available
for testing of the prisms, bricks, and mortars (ASTM C 1314, C67, & C109). Where appropriate or necessary
the Indian Standard (IS) 1905 prism testing procedures were followed instead. In total, 30 prisms were
- 72 -

Appendix C - Experimental Study on Masonry Compressive Strength
tested, ten different sets of prisms were cast with three prisms per set. Parameters which were varied were
brick strength, mortar type, and curing period. Two brick strengths were used, three mortar types, and two
curing periods. The mud mortar prisms were only tested at one curing period.
Although both brick types had compressive strength less than 3 MPa strength on average, they are classified
by their relative strengths (H for high strength and L for low strength). The three mortar types used are
designated by their material composition, the first two with cement-to-sand ratios of 1:6 and 1:8, and the
third being a mud mortar with no cement, labeled MUD. The two curing periods used were 7 and 28 days.
The 7-day prisms were all tested after curing for 7 days, however the 28-day prisms were actually tested
after more than 28 days due to technical difficulties with the testing machine. For simplicity the latter prisms
will still be labeled as 28 day prisms, for it is assumed that most strength was developed by 28 days.
Each label indicates the parameters that define that specimen and is formatted as such: (Brick Strength)-
(Mortar Mix)-(Cure Period), for example H-]:6-7 labels specimens with high strength bricks, mortar mix
of 1:6 cement-to-sand ratio and curing period of 7 days. The numbers (1 to 3) were also added to the end
to designate the three prisms within each set, but do not differentiate any specimen properties.
C.6.2 Testing Machine
The prisms were constructed as close as possible to the testing machine and were carefully carried and
loaded into the machine by two researchers at a time and using a large container with handles to carry so
as to not disturb the specimens prior to testing.
The test machine was an Enkay 2000 kN capacity compression testing machine. The upper and lower
bearing surfaces were larger than the surfaces of any of the specimens tested. The lower surface was fixed
flat and moved up and down during the test. The upper bearing surface could be cranked down into place
before the test and cranked up to release the specimen after testing. The upper surface was on a spherical
bearing but had a very minimal angle of rotation, exact specifications were not obtained.
- 73 -

Christopher F. Porst
C. 7 Test Results
C.7 .i Brick Water Absorption Ratio
Three bricks of each type (H and L) were tested for water absorption. The bricks were dried in an oven at
I I0 C for 24 hours and then weighed to obtain their dry mass. The bricks were then left submerged in a
water bath for 24 hours, removed, wiped with a rag to remove excess moisture, and weighed three minutes
after removal from the bath to obtain their wet mass. The scale used provided mass to the nearest hundredth
of a kilogram.
The water absorption was determined as a percentage of the dry mass according to IS 3495 by dividing the
increase in mass between the dry and wet specimens by the dry mass. The H bricks all had higher water
absorption percentages than the L bricks. The average percentage for the H and L bricks were 13.6% and
8.3%, respectively. The results of the water absorption test can be found in Fig. C.6.
18% H
16% L
0 14%CL
o 12%
10%
3 8%
6%
4%1 2 3
Sample Brick Number
Fig. C.6. Results of brick water absorption test.
- 74 -
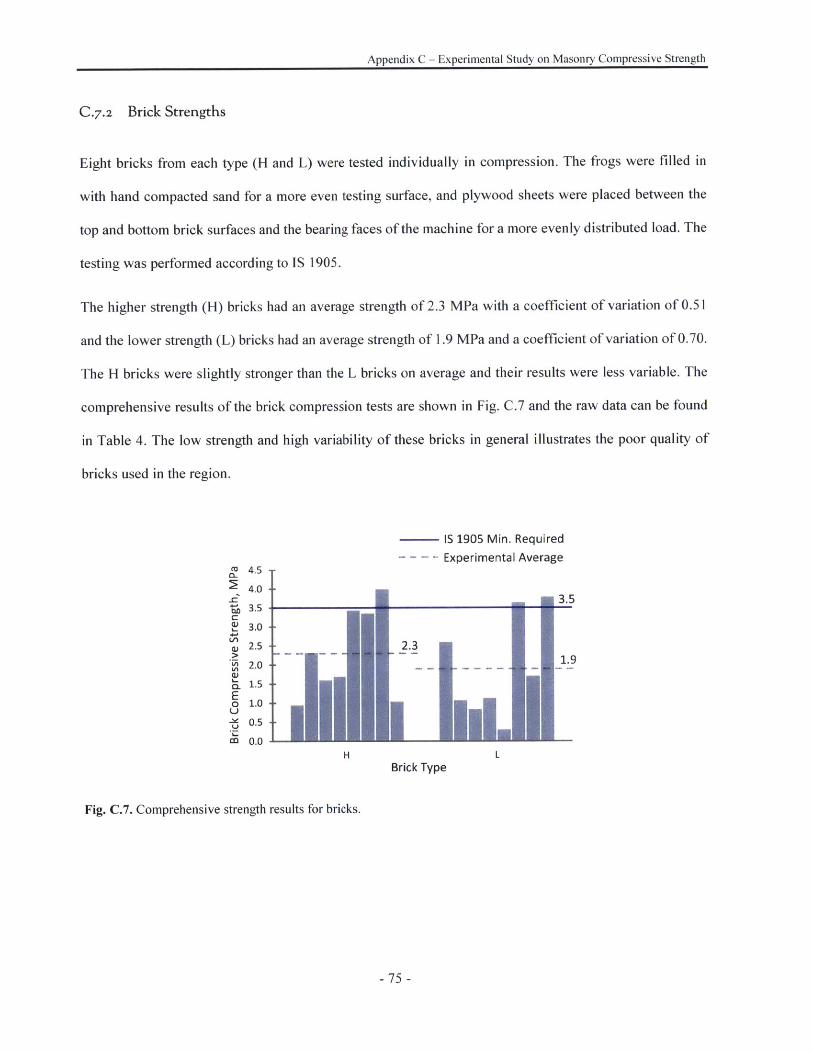
Appendix C - Experimental Study on Masonry Compressive Strength
C.7 .2 Brick Strengths
Eight bricks from each type (H and L) were tested individually in compression. The frogs were filled in
with hand compacted sand for a more even testing surface, and plywood sheets were placed between the
top and bottom brick surfaces and the bearing faces of the machine for a more evenly distributed load. The
testing was performed according to IS 1905.
The higher strength (H) bricks had an average strength of 2.3 MPa with a coefficient of variation of 0.51
and the lower strength (L) bricks had an average strength of 1.9 MPa and a coefficient of variation of 0.70.
The H bricks were slightly stronger than the L bricks on average and their results were less variable. The
comprehensive results of the brick compression tests are shown in Fig. C.7 and the raw data can be found
in Table 4. The low strength and high variability of these bricks in general illustrates the poor quality of
bricks used in the region.
IS 1905 Min. Required
- - -Experimental Average4.5
4.03.5
S3.0.4-6
2.5 2.3
2.0 1.9
In
H1.5Eo 1.0U-'e 0.5U
ca0.0H L
Brick Type
Fig. C.7. Comprehensive strength results for bricks.
- 75 -

Christopher F. Porst
C.7 .3 Mortar Compressive Strength
Five 70 mm mortar cubes of each mix were cast and tested in compression per ASTM C 109 procedures.
Since the surfaces up against the faces of the cube mold were the most flat and even, these faces were placed
in contact with the bearing platens of the testing machine. Results are shown in Fig. C.8 along with required
28 day strength for these mixes as defined by IS 1905; the full data collected on mortar strength can be
found in Table 5. The compressive strengths observed for the cement mortars were significantly higher than
the minimum prescribed by IS 1905. The 1:8 cement:sand mortar strength at 28 days was nearly 8 times
the minimum prescribed for that mix (L I), indicating that the code is underrating this mix strength. Mud
mortar cubes were cast but were too weak to test in the compression machine.
A large increase in mortar strength was observed between the cure periods of 7 and 28 days. However, the
difference in 28 day strength observed between the two cement mortar mixes was much less significant,
indicating that money could be saved by using a 1:8 cement:sand mortar mix rather than a 1:6 mix.
CL
0.
o
0
toV)
LI)
0
6.02
5.33
IS 1905 M2 3.0
0.97. -.0.47...
1:6 1:8
Mortar Mix (cement:sand)
0 7 Days
*28 Days
0.7 IS 1905 Li Mortar
Fig. C.8. Average compressive strengths of mortar cubes.
- 76 -
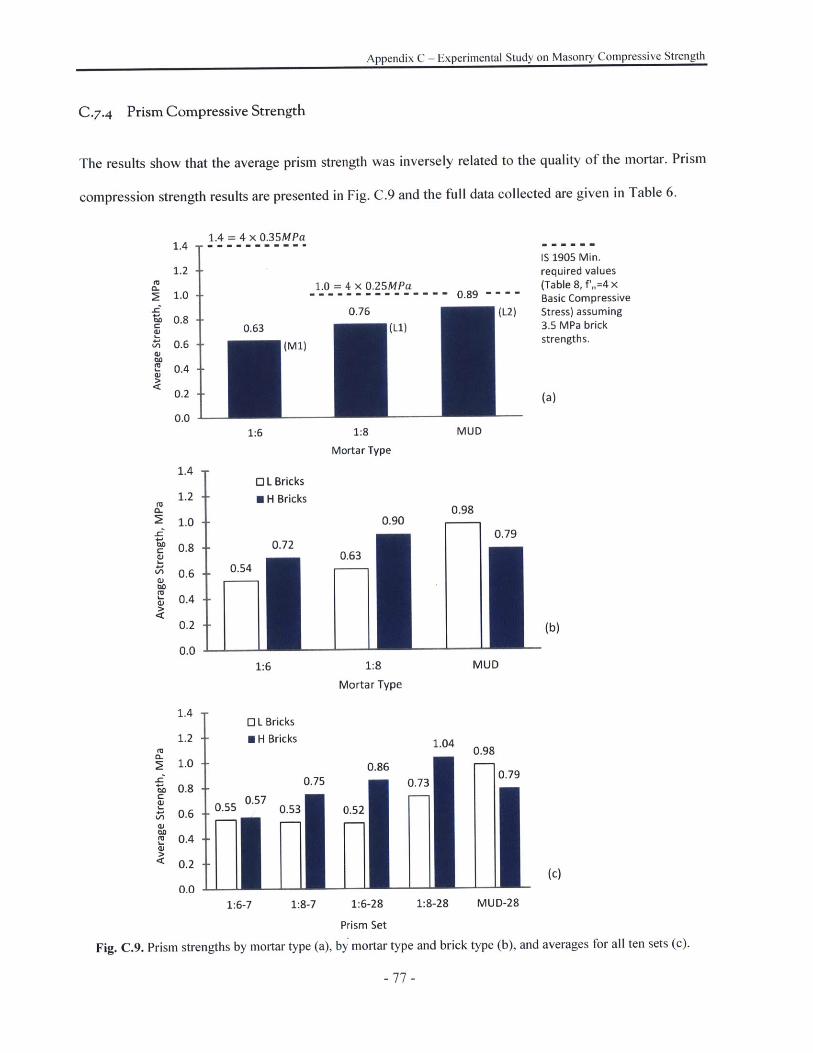
Appendix C - Experimental Study on Masonry Compressive Strength
C.7.4 Prism Compressive Strength
The results show that the average prism strength was inversely related to the quality of the mortar. Prism
compression strength results are presented in Fig. C.9 and the full data collected are given in Table 6.
1.0 =4 x 0.25MPa- - - 5 - - - - 0.89 - - - -
0.76 (L2)
L) -
1:8
Mortar Type
1.4
1.2
1.0
0.8
0.6
0.4
0.2
0.0
1.4
1.2
1.0
0.8
0.6
0.4
0.2
0.0
0.90
0.72
C
on
a)cu
W)
IS 1905 Min.required values(Table 8, f'm=4 xBasic CompressiveStress) assuming3.5 MPa brickstrengths.
(a)
MUD
0.98
0.79
M1
MUD
(b)
O L Bricks* H Bricks
0.75
1.55 70.53
1:6-7 1:8-7
Fig. C.9. Prism strengths by mortar type (a),
1.04 0.98
0.860.73 0.79
0.52
(c)
1:6-28 1:8-28 MUD-28
Prism Set
by mortar type and brick type (b), and averages for all ten sets (c).
- 77 -
1.4 = 4 x 0.35MPa- m - -- ---- "-.-
0.63(M1)
0.63
1:8
Mortar Type
Bricks
Bricks
1:6
0 L
- H
-0.54
-1:6
C
V1
anCD
1.4
1.2
1.0
0.8
0.6
0.4
0.2
0.0

Christopher F. Porst
During testing, cracking generally initiated in the bricks
and propagated vertically through the prism. Cracks
usually first appeared in one of the top three bricks of the
prism. The vertical cracks were the common failure pattern
(see Fig. C.IOFig. C.1 1). Prior to failure some spalling of
bricks on the edges occasionally occurred. The average
prism strengths by mortar type are shown in Fig. C.9 (a).
It may be observed from Fig. C.9 (a) that the experimental
results are less than the minimum IS 1905 strength values.
For example, prisms with 1:6 mortar had average strengths
of 0.63 MPa which is less than 50% of the minimum code Fig. C.10. The crack initiated at the bottom ofthe second brick from the top and propagated
requirement. This indicates that masonry compressive in both directions.
strength could be significantly overestimated if the
minimum IS 1905 brick strength is assumed in low-tech environments with uncertain brick properties. This
observation can be linked with the mortar compressive strength results shown in Fig. C.8. The experimental
mortar compressive strength (6.02 MPa) is twice the IS 1905 minimum compressive strength for that mix.
This proves the hypothesis that higher mortar strength does not contribute to higher masonry strength when
low-strength bricks are used.
Perhaps a more accurate representation of the behavior is revealed when the average strength results are
divided by brick type (H or L), as shown in Fig. C.9 (b). This graph clearly shows that for the low strength
bricks the prism strength increased as the cement content in the mortar decreased. Interestingly, the highest
average strength was reported for the mud mortar prisms. The prisms with high strength bricks showed an
increase in strength as the mortar cement-to-sand ratio changed from 1:6 to 1:8, however the average
strength then decreased between the 1:8 mortar and the mud mortar prisms. The mud mortar prisms with
high strength bricks still showed a higher average strength than prisms with 1:6 mortar.
- 78 -

Appendix C - Experimental Study on Masonry Compressive Strength
C.8 Discussion and Conclusions
The prisms with 1:8 cement:sand mortar and mud mortar showed greater compressive strength than those
with 1:6 cement:sand mortar for both brick types. For the low strength brick prisms the mud mortar
presented the greatest average strength. In general, the strengths of the prisms went up between the 7 day
curing period and 28 day curing period, which applies only to cement mortar prisms. Prisms made with the
higher strength bricks generally had a higher compressive strength as well. Therefore, it is clear that both
the mortar type and brick strength affect the prism strength even when low quality bricks are used. Gumaste
et al. (2007) observed similar relationships between mortar strength and prism strength and concluded it
was due to two main factors: i) large variation in the brick strengths, which caused initiation of crushing
failure in the weakest brick, thus superseding the effect of the mortar strength, and ii) variability in bond
strength. Other research has also suggested that flaws in the brick material makeup can initiate cracking at
stress levels well below theoretical strength values (Drysdale et al. 1994). Many failures in the study by
Gumaste et al. (2007) were due to loss of bond between bricks and mortar, hence the variability of the bond
strength proved to be more critical than mortar strength. In the current study failure was usually initiated
by vertical cracking in the bricks; this is similar to the failure mechanism observed by Gumaste et al. (2007)
in their prism testing.
In a study on compressive strength of masonry prisms with mud mortars by Sarangapani (1992), masonry
prisms with bricks of 3.87 MPa compressive strength and mud mortar showed higher strength than prisms
with the same bricks and a 1:6 cement:sand mortar. They concluded that mud mortar of 2:1 soil:sand
proportion and clay content of approximately 15% can be used as an alternative to conventional 1:6
cement:sand mortar.
The higher masonry compressive strength with leaner mortar may be due to an increase in bond strength.
Samarasinghe and Lawrence (1992) found that leaner mortars resulted in higher bond strength than richer
mortars and mortars with lime when low strength bricks were used. They concluded that this was due to
- 79 -

Christopher F. Porst
the fact that leaner mixes have higher water content than richer mortars with the same workability, thus
more excess water could be absorbed by the bricks while allowing for adequate mortar hydration, and
ultimately a better bond. Although mud mortar was not used in the study by Samarasinghe and Lawrence
(1992), a similar explanation could pertain to mud mortar, as unlike cement mortar mud mortar does not
achieve its strength through hydration, but rather it achieves strength by drying. This could also offer an
explanation for the higher strengths in the mud and 1:8 cement:sand mortar prisms than in the 1:6 prisms
obtained in the current study.
The author agrees with the conclusions of Gumaste et al. (2007) and Samarasinghe and Lawrence (1992).
It is believed that the high variability in the structural composition of the bricks used leads to failure in the
weakest brick, thereby superseding any potential benefit from using higher strength mortars. Moreover, the
use of the stiffer 1:6 mortar caused stress concentrations in the bricks which were not observed in prisms
with more compatible (leaner) mortars. The author hypothesizes that a better bond was achieved in the
prisms with the leaner cement:sand mixes and mud mortar, thereby contributing to increased compressive
strength.
In this study, 'high' (H) and 'low' (L) quality bricks from rural areas of Gujarat were used and their
strengths were typical for common low-cost bricks of that region. Had these bricks been used at a building
site, any resources put towards a higher quality cement mortar than LI (1:8 cement:sand) would be a waste
and in fact would have made the masonry weaker. It is concluded that for masonry where bricks have
compressive strength less than 4 MPa, either a mud mortar or a lean 1:8 cement:sand mortar would provide
equal or better strength masonry at a lower cost than a 1:6 cement:sand mortar.
-80-
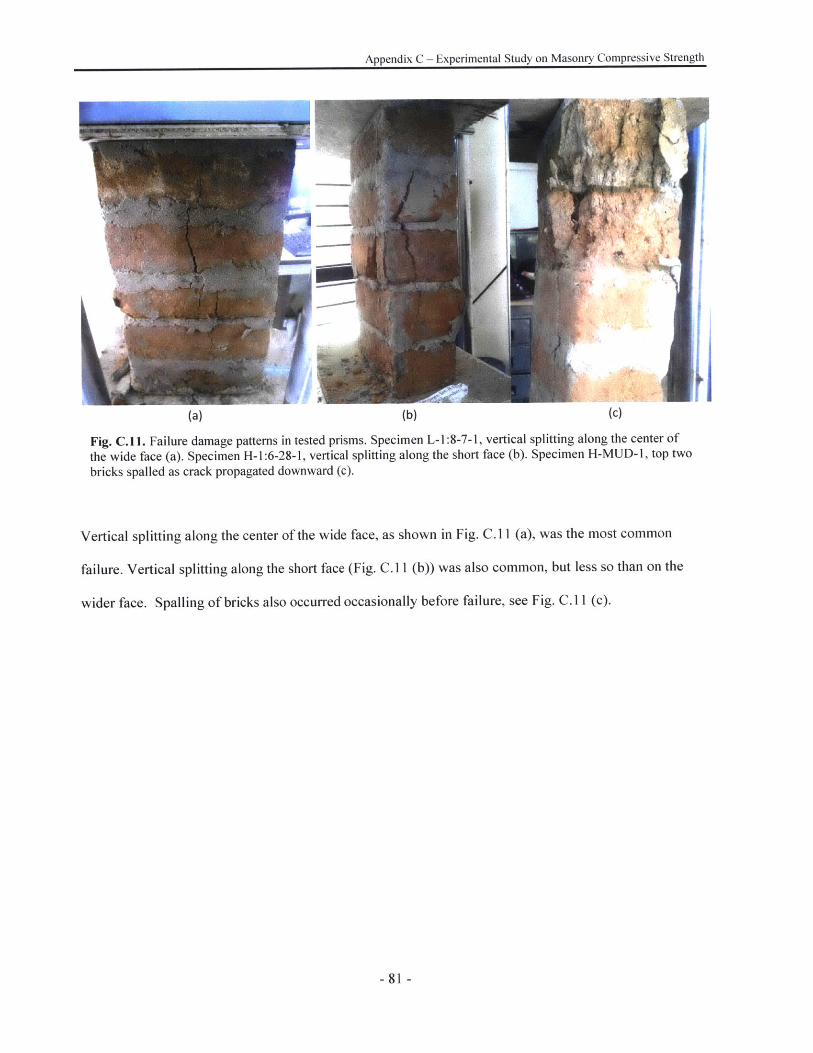
Appendix C - Experimental Study on Masonry Compressive Strength
(a) (b) (c)
Fig. C.11. Failure damage patterns in tested prisms. Specimen L- 1:8-7-1, vertical splitting along the center of
the wide face (a). Specimen H-1:6-28-1, vertical splitting along the short face (b). Specimen H-MUD-I, top two
bricks spalled as crack propagated downward (c).
Vertical splitting along the center of the wide face, as shown in Fig. C.1 1 (a), was the most common
failure. Vertical splitting along the short face (Fig. C. 11 (b)) was also common, but less so than on the
wider face. Spalling of bricks also occurred occasionally before failure, see Fig. C. 11 (c).
-81 -

Christopher F. Porst
Table 4. Full Brick Strength ResultsBrick Maximum Load, Cross Sectional Max Stress, Average Max Standard CoefficientType kN Area, mm 2 MPa Stress, MPa Deviation of Variation
H 25.2 26544 0.95
52.0 22557 2.31
36.2 22440 1.61
44.0 25942 1.70
89.1 25960 3.43 2.30 1.16 0.51
88.0 26307 3.35
93.9 23520 3.99
26.4 25466 1.04
L 60.0 23100 2.60
23.9 22351 1.07
18.7 22145 0.84
24.4 21614 1.13
6.8 22995 0.30 1.90 1.31 0.70
91.0 25032 3.64
41.0 24003 1.71
85.0 22451 3.79
Table 5. Full Mortar Strength ResultsMortar Mix Curing Period, Maximum Load, Cross Sectional Max Stress, Average Max
(cement:sand) days kN Area, mm 2 MPa Stress, MPa1:6 7 4.60 4899 0.94
4.90 4900 1.00 0.97
28 30.75 4900 6.28
27075 4900 5.66 6.02
30.01 4900 6.12
1:8 7 2.30 4970 0.46
2.40 4970 0.48 0.47
28 25.80 4900 5.27
24.00 4900 4.90 5.33
28.50 4900 5.82
MUD N/A
- 82 -

Appendix C - Experimental Study on Masonry Compressive Strength
Brick Type Cure Period,days
H 7
28
L 7
28
- 83 -
Average MaxStress, MPa
Table 6. Full Prism Strength ResultsMortar Mix, Maximum Cross Sectional
(cement:sand) Load, kN Area, mm 2
1:6 14.1 23175
15.7 23956
10.2 23278
1:8 17.4 22880
19.0 21900
14.1 22890
1:6 16.0 25850
25.0 21412
21.0 26544
1:8 25.0 23088
20.0 22000
25.0 22145
MUD 17.0 21930
20.0 23052
17.0 23296
1:6 15.0 21513
9.1 23436
1:8 7.7 22032
12.7 22236
15.1 22896
1:6 15.0 22880
10.0 21930
10.0 22464
1:8 10.0 25300
20.0 21917
20.0 22575
MUD 20.0 24200
24.0 22660
24.0 22575
Max Stress,MPa
0.61
0.66
0.44
0.76
0.87
0.62
0.62
1.17
0.79
1.08
0.91
1.13
0.78
0.87
0.73
0.7
0.39
0.35
0.57
0.66
0.66
0.46
0.45
0.4
0.91
0.89
0.83
1.06
1.06
0.57
0.75
0.86
1.04
0.79
0.55
0.53
0.52
0.73
0.98

Christopher F. Porst
- 84 -
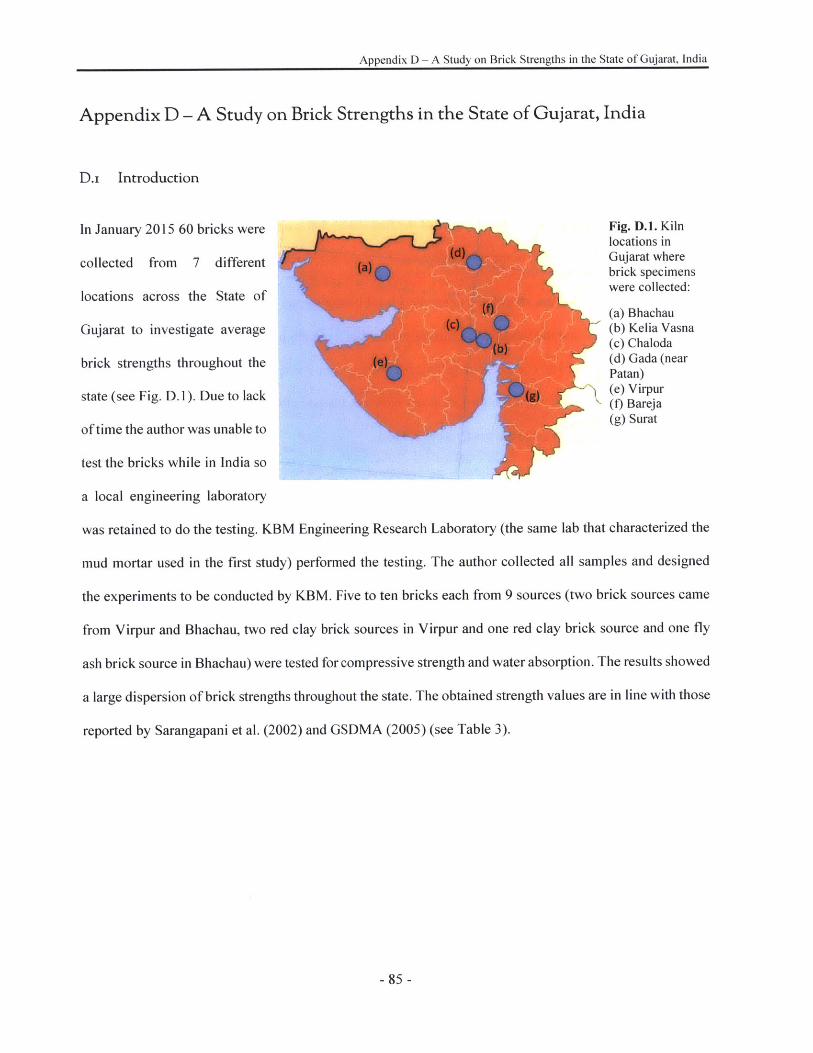
Appendix D - A Study on Brick Strengths in the State of Gujarat, India
Appendix D - A Study on Brick Strengths in the State of Gujarat, India
D.i Introduction
In January 2015 60 bricks were Fig. D.1. Kilnlocations in
collected from 7 different Gujarat wherebrick specimens
locations across the State of were collected:
(a) BhachauGujarat to investigate average (b) Kelia Vasna
(c) Chaloda
brick strengths throughout the (d) Gada (nearPatan)
state (see Fig. D. 1). Due to lack (e) Virpur(f) Bareja
of time the author was unable to (g) Surat
test the bricks while in India so
a local engineering laboratory
was retained to do the testing. KBM Engineering Research Laboratory (the same lab that characterized the
mud mortar used in the first study) performed the testing. The author collected all samples and designed
the experiments to be conducted by KBM. Five to ten bricks each from 9 sources (two brick sources came
from Virpur and Bhachau, two red clay brick sources in Virpur and one red clay brick source and one fly
ash brick source in Bhachau) were tested for compressive strength and water absorption. The results showed
a large dispersion of brick strengths throughout the state. The obtained strength values are in line with those
reported by Sarangapani et al. (2002) and GSDMA (2005) (see Table 3).
- 85 -

Christopher F. Porst
D.2 Testing Procedures
A combination of ASTM C67 and IS 3495 brick testing procedures were followed in this study. Since the
testing was performed by a professional lab, the author was able to specify testing procedures that followed
the codes more precisely than the procedures of the first study; this is a possible reason for the higher brick
strengths observed compared to the prior study.
The brick bed surfaces were all grinded to ensure a level testing surface per IS 3495. The frogs were filled
with cement mortar and the bricks were capped with a high strength plaster of Paris per the ASTM C67
standard requirements. The compression testing and water absorption testing were conducted on full brick
specimens per IS 3495; however, plywood sheets were not placed between the specimens and the testing
machine bearing surfaces since the bricks were capped.
D. 3 Results and Discussion
The results of this study are comparable to those presented in Table 3. The average brick strengths range
from 4.5 to 12.3 MPa, see Fig. D.2. The lowest brick strength tested was 3.0 MPa from the Surat kiln (Avg.
4.5 MPa) and the highest was 14.7 MPa from the Gada kiln (Avg. 9.0 MPa). The strengths and water
absorption ratios observed are widely variable across Gujarat. This finding highlights the importance of
realistic specification of material properties for a given construction project and confirms the fact that in
developing countries one cannot assume that brick strengths comply with the code. It should be noted that
bricks within each set, or from a specific kiln, showed relatively consistent water absorption properties. The
standard deviation for the average brick strengths and water absorption for each kiln are plotted on Fig. D.2
and Fig. D.3, respectively. Full brick compressive strength data collected are provided in Table 7.
- 86 -

Appendix D - A Study on Brick Strengths in the State of Gujarat, India
143.5 (IS 1905
> 12 min. value)
Q &- 10
E- 8
Kil Locati6
) 4
< 2
0
'10
4:-\
Kiln Location
Fig. D.2. Average brick strengths for Gujarat observed for each kiln including standard deviation.
Average water absorption ratios for each kiln are shown in Fig. D.3. Water absorption values ranged from
approximately 12 to 25% and were consistent within sets. Compressive strength of all the bricks tested is
plotted against water absorption in Fig. DA4, showing a negative relationship between brick strength and
water absorption. This is in line with the findings of other studies on Indian bricks (Kaushik et al. 2007).
30
ok 25e0Z 200
00
1500
bO \0 0 4 N ? 4N
Kiln Location
Fig. D.3. Average water absorption ratio for bricks from each kiln including standard deviation.
- 87 -
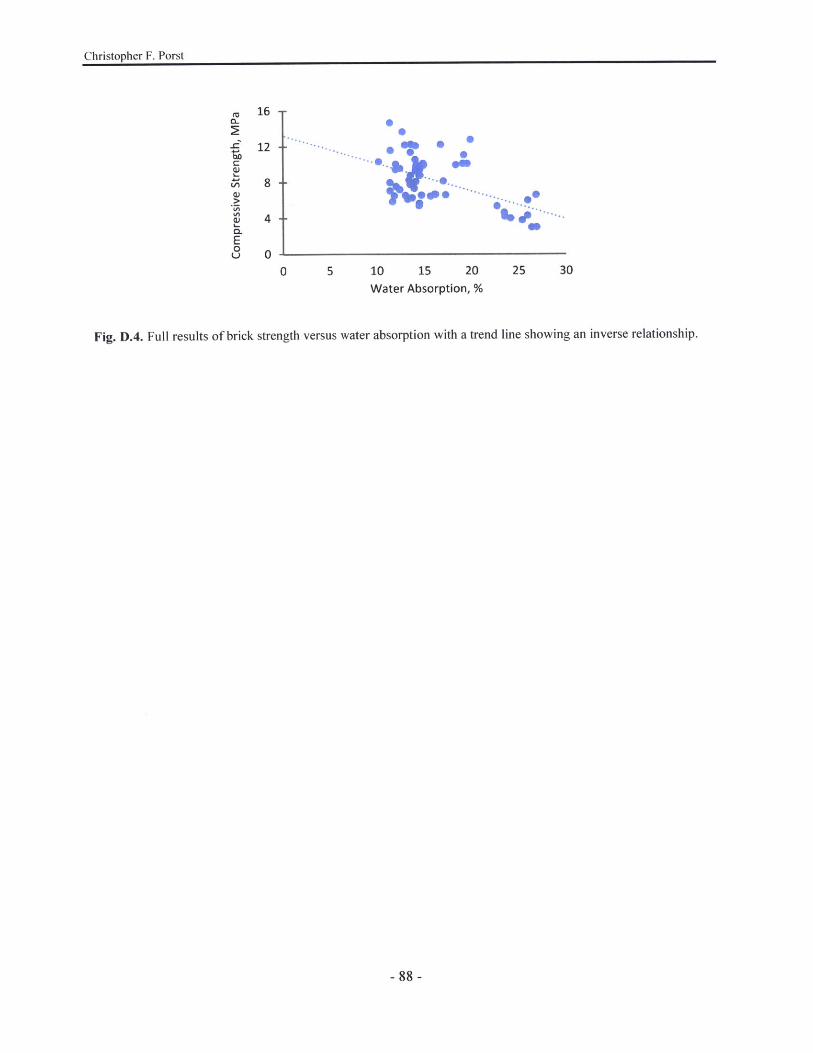
Christopher F. Porst
(U
C-
E0U-
16 -r
12
8 -
4
0*
0
0 000
* 0
I.
0 5 10 15 20 25 30
Water Absorption, %
Fig. D.4. Full results of brick strength versus water absorption with a trend line showing an inverse relationship.
- 88 -
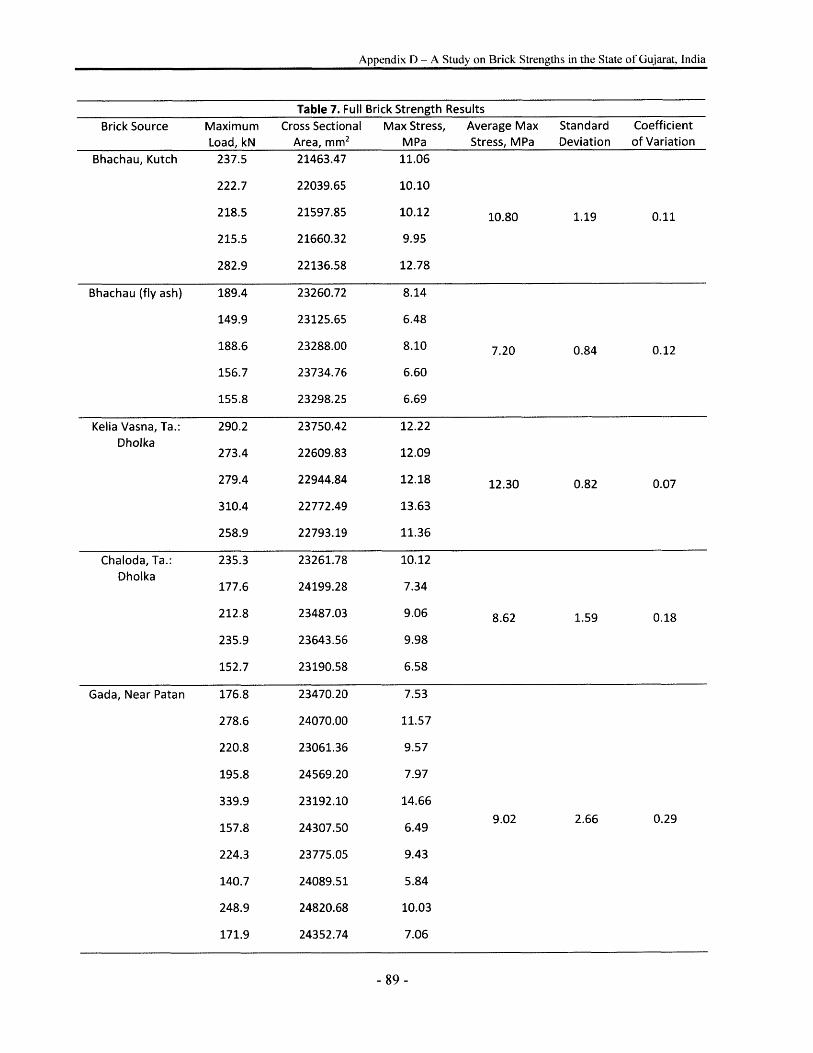
Appendix D - A Study on Brick Strengths in the State of Gujarat, India
Table 7. Full Brick Strength ResultsBrick Source Maximum Cross Sectional Max Stress, Average Max Standard Coefficient
Load, kN Area, mm2 MPa Stress, MPa Deviation of Variation
Bhachau, Kutch 237.5 21463.47 11.06
222.7 22039.65 10.10
218.5 21597.85 10.12 10.80 1.19 0.11
215.5 21660.32 9.95
282.9 22136.58 12.78
Bhachau (fly ash) 189.4 23260.72 8.14
149.9 23125.65 6.48
188.6 23288.00 8.10 7.20 0.84 0.12
156.7 23734.76 6.60
155.8 23298.25 6.69
Kelia Vasna, Ta.: 290.2 23750.42 12.22Dholka
273.4 22609.83 12.09
279.4 22944.84 12.18 12.30 0.82 0.07
310.4 22772.49 13.63
258.9 22793.19 11.36
Chaloda, Ta.: 235.3 23261.78 10.12Dholka
177.6 24199.28 7.34
212.8 23487.03 9.06 8.62 1.59 0.18
235.9 23643.56 9.98
152.7 23190.58 6.58
Gada, Near Patan 176.8 23470.20 7.53
278.6 24070.00 11.57
220.8 23061.36 9.57
195.8 24569.20 7.97
339.9 23192.10 14.66
157.8 24307.50 6.49 9.02 2.66 0.29
224.3 23775.05 9.43
140.7 24089.51 5.84
248.9 24820.68 10.03
171.9 24352.74 7.06
89 -
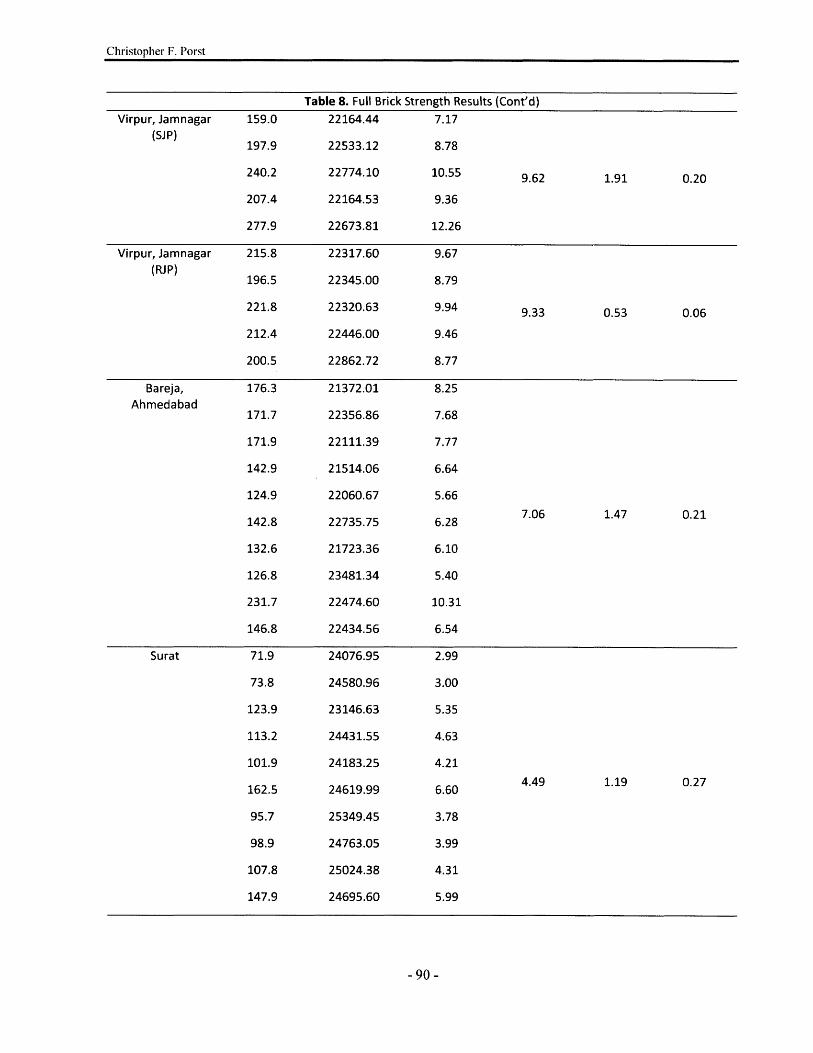
Christopher F. Porst
Table 8. Full Brick Strength Results (Cont'd)
Virpur, Jamnagar 159.0 22164.44 7.17(SiP)
197.9 22533.12 8.78
240.2 22774.10 10.55 9.62 1.91 0.20
207.4 22164.53 9.36
277.9 22673.81 12.26
Virpur, Jamnagar 215.8 22317.60 9.67(RJ P) 196.5 22345.00 8.79
221.8 22320.63 9.94 9.33 0.53 0.06
212.4 22446.00 9.46
200.5 22862.72 8.77
Bareja, 176.3 21372.01 8.25Ahmedabad
171.7 22356.86 7.68
171.9 22111.39 7.77
142.9 21514.06 6.64
124.9 22060.67 5.66
142.8 22735.75 6.28 7.06 1.47 0.21
132.6 21723.36 6.10
126.8 23481.34 5.40
231.7 22474.60 10.31
146.8 22434.56 6.54
Surat 71.9 24076.95 2.99
73.8 24580.96 3.00
123.9 23146.63 5.35
113.2 24431.55 4.63
101.9 24183.25 4.21
162.5 24619.99 6.60 4.49 1.19 0.27
95.7 25349.45 3.78
98.9 24763.05 3.99
107.8 25024.38 4.31
147.9 24695.60 5.99
- 90 -

Appendix E -Notation List
Appendix E - Notation List
A = Building footprint area;
Af = Seismic coefficient;
Ai = Cross sectional area in plan of wall i;
A. R. = Building plan aspect ratio;
Cm = Center of mass of the structure;
CR = Center of rigidity of the structure;
D = Base dimension length along direction of applied force;
Em = Masonry modulus of elasticity;
Fj = Shape factor for wall i;
FAT = Amplification factor for torsion;
G = Masonry shear modulus;
H = Story height;
Hi = Height of wall i;
I = Building importance factor;
L = Length of longer building dimension;
LF = Load Factor to be applied in accordance with the Ultimate Limit Sate Design Method;
N = Number of structural walls in the floor oriented in the direction of analysis;
R = Response reduction factor;
SaIg = Average response acceleration coefficient;
T = Natural period of the structure;
TM = Torsional moment;
VR = Shear capacity of building story;
Vb = Design base shear determined from the SMSA;
Vdi = Direct seismic shear force in wall i;
Vt. = Torsional shear force in wall i;
Vtt, = Total seismic shear force in wall i;
W = Seismic weight of the structure;
-91 -
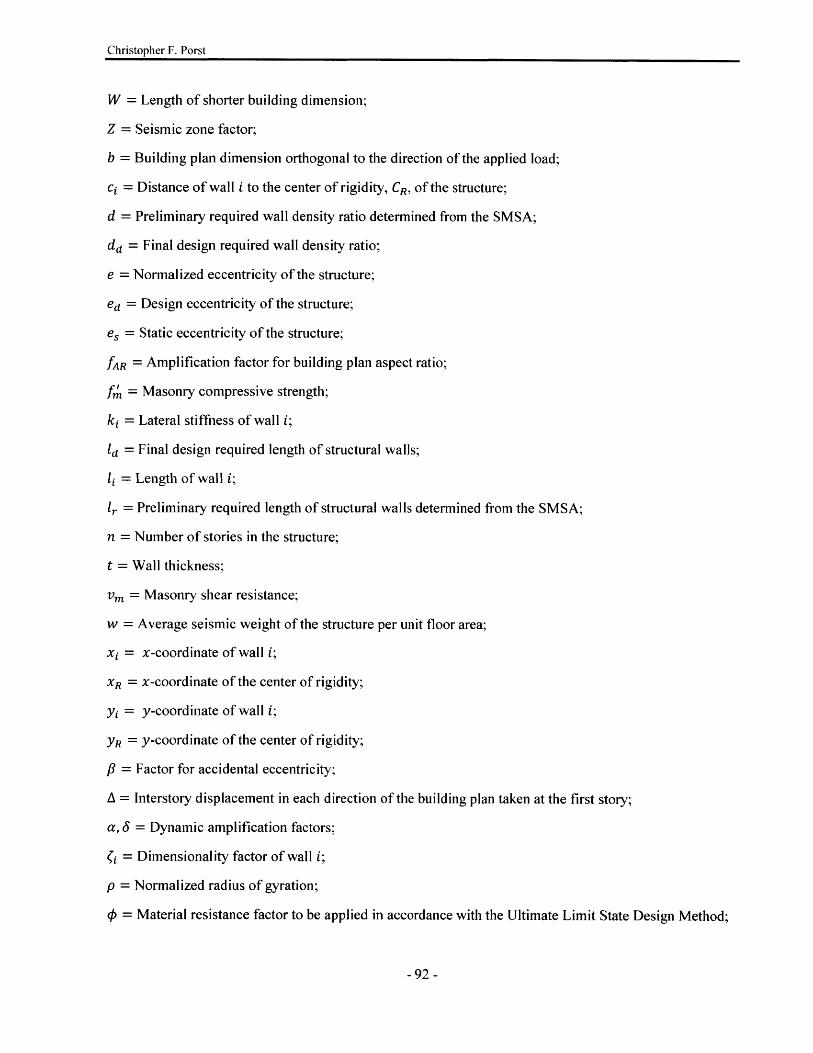
Christopher F. Porst
W = Length of shorter building dimension;
Z = Seismic zone factor;
b = Building plan dimension orthogonal to the direction of the applied load;
ci = Distance of wall i to the center of rigidity, CR, of the structure;
d = Preliminary required wall density ratio determined from the SMSA;
dd = Final design required wall density ratio;
e = Normalized eccentricity of the structure;
ed = Design eccentricity of the structure;
es = Static eccentricity of the structure;
fAR = Amplification factor for building plan aspect ratio;
f'= Masonry compressive strength;
ki = Lateral stiffness of wall i;
ld = Final design required length of structural walls;
i= Length of wall i;
,= Preliminary required length of structural walls detennined from the SMSA;
n = Number of stories in the structure;
t = Wall thickness;
vm = Masonry shear resistance;
w = Average seismic weight of the structure per unit floor area;
xi = x-coordinate of wall i;
XR = x-coordinate of the center of rigidity;
y= y-coordinate of wall i;
yR = y-coordinate of the center of rigidity;
f8 = Factor for accidental eccentricity;
A = Interstory displacement in each direction of the building plan taken at the first story;
a, 6 = Dynamic amplification factors;
j= Dimensionality factor of wall i;
p = Normalized radius of gyration;
5= Material resistance factor to be applied in accordance with the Ultimate Limit State Design Method;
- 92 -

Appendix F - Supplementary Materials from the Indian Masonry Code
Appendix F - Supplementary Materials from the Indian Masonry Code
IS : 1905 - 1987
TABLE I MIX PROPORTION AND STRENGTH OF MORTARS FOR MASONRY
( Clause 3.2.1 )
SL No. GRADE OFMORTAR
(1)
12(a)2(b)
3(a)3(b)3(c)
4(a)4(b)4(c)4(d)4(e)4(f)
5(a)5(b)5(c)5(d)5(e)5(f)
6(a),6(b)6(c)6(d)6(e)7(a)7(b)7(c)
(2)
HIH2
Ml
M2
M3
LI
L2
L-1I
10000
MIX PROPORTIONS ( By Looss VoLumE )
Cement
(3)
I
0
00
00 10
1.000o
Lime
(4)
I C or B* C or BJ C or B
I C or B0
02 BI AI BI C or B0
03 BI AI BI C or B0.,
01 BI C orB00
1 BI C or B0
LimePozzolanaMixture
(5)
000
001 (LP-40)
000001 (LP-40)
000001 (LP-40)
0001 (LP-40)1 (LP-20)
001 (LP-7)
NoTE 1 - Sand for making mortar should be well graded. In caseshall be reduced in order to achieve the minimum specified strength.
Pozzolana Sand
(6) (7)
0 30 40 4j
0 50 60 Ii
0 692
1 12 00 it0 70 120 32 13 00 2
0 81 22 10 2j0 oj0 31 20 11
sand is not well graded, its proportion
NoTE 2 - For mixes in SI No. I and 2, use of lime is not essenuial from consideration of strength as itdoes not result in increase in strength. However, its use is highly recommended since it improves workability.
NOTE 3 - For mixes In SI No. 3(a), 4(a), 5(a) and 6(a), either lime C or B to the extent of 1/4 part ofcement (by volume) or some plasticizer should be added for improving workability.
Nor 4 - For mixes in SI No. 4(b) and 5(b), lime and sand should first be ground in mortar mill and thencement added to coarse stuff.
NoT 5 - It is essential that mixes in SI No. 4(c), 4(d), 4(e), 5(d), 5(e), 6(b), 6(c), 7(a) and 7(b) are preparedby grinding in a mortar mill.
NoTE 6 - Mix in SI No. 2(b) has been classified to be of same grade as that of SI No. 2(a), mixes in SI No.3(b) and 3(c) same as that in SI No. 3(a) and mixes in SI No. 4(b)to 4(f) same as that in SI No. 4(a), even thoughtheir compressive strength is less. This is from consideration of strength of masonry using different mixproportions.
NOTE 7 - A, B and C denote eminently hydraulic lime, semi-hydraulic lime and fat lime respectively asspecified in relevant Indian Standards.
Fig. F.1. IS 1905 Table I containing mortar mixes and respective minimum mortar compressive strength.
- 93 -
MINIMUMCOMPREssIvS
STRENGTH AT28 DAYS IN
N/mm'
(8)
107.56.0
5-03.03.0
3-02-02-02-02-0
1.51.51.51.51.51.5
0-70-70-70'70'7
0-50'50-5
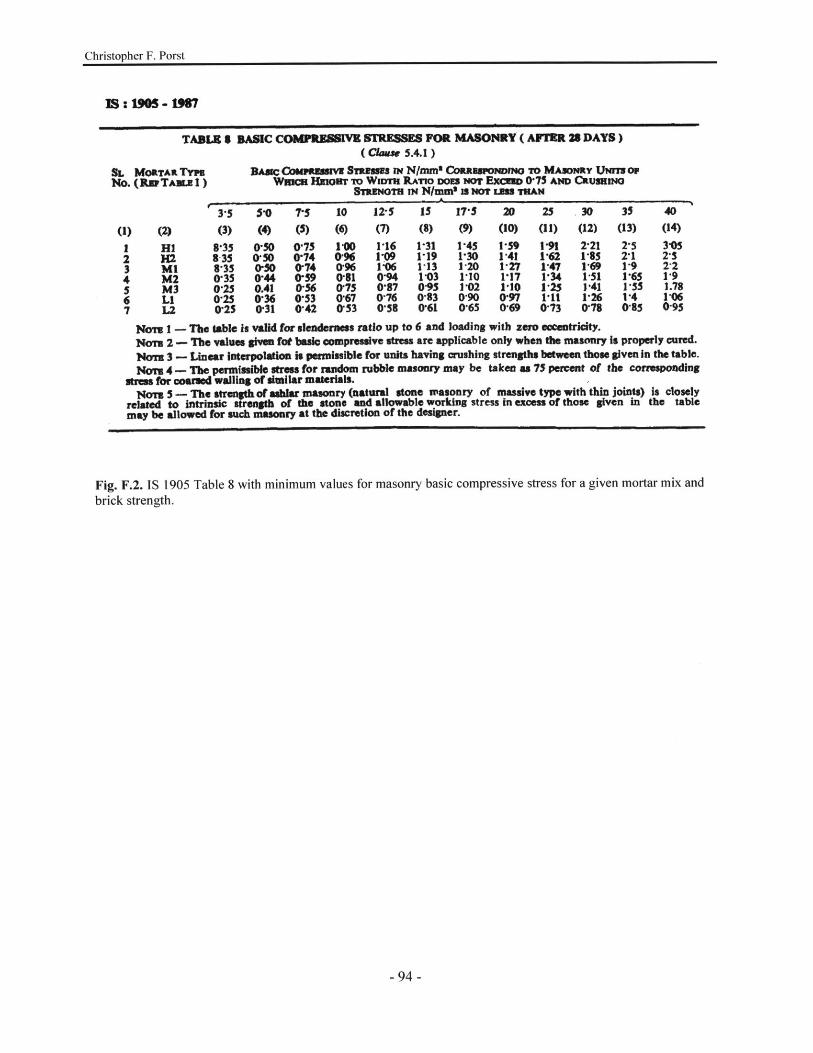
Christopher F. Porst
JS:19-1W67
TABI 6 BASIC COMPRIMVU STRUSME FOR MASONRY ( AITER 28 DAYS)( CA=W 5.4.1 )
SL MoRTAR TywNo. (REp TAX uI)
(1) (2)1234567
HII2M1M2M3LiL2
Dac Coeaass ST-mass m N/mm' CoRasroNDmo To MAsusay UmsopWW=c Ifuoar To Wm=n L-rro noss nor Excumo 0-75 AND CRuSHING
SikiwoTs n N/mm' S NO r LSS TAN
3-5 5'0 7 10 12-5 15 17-5 20 25 30 35 40
(3) (4) (5) (6) (7) (8) (9) (10) (11) (12) (13) (14)
8-358-358-350-350-250-250'25
0-500-500-500440.410'360-31
0*750-740740'590-560*530-42
1'000960'960'810750*67053
1-161109P060-940'870-760'58
1-311-191-131-030-950-830-61
1451'301-201-101-020,900'65
1-591'411-271-171'100-970-69
1-911'621-471-34
'25I'll0'73
2'211851-691-511-411*260'78
252'11-91-651-551'40*85
3-052-32-2119L.78100-95
Norm I - The table is valid for slenderness ratio up to 6 and loading with zero eccentricity.Nor 2 - lbo values given fWt basic compressive stress are applicable only when the masonry is properly cured.
Norm 3 - Linear Interpolation is permissible for units having crushing strengths between those given in the table.Nom 4 - The permlsuiblo stress for random rubble masonry may be taken as 75 percent of the corresponding
10 P a for coarsed walling of similar materials.Nor 5 - The strength of aublar masonry (natural stone masonry of massive type with thin joints) is closely
related to intrinsic strength of the stone and allowable working stress in excess of those given in the tablemay be allowed for such masonry at the discretion of the designer.
Fig. F.2. IS 1905 Table 8 with minimum values for masonry basic compressive stress for a given mortar mix and
brick strength.
- 94 -