conference proceedings smolenice 2012 english …...nan-yang lee taipei representative office,...
TRANSCRIPT

University of Economics in Bratislava
Faculty of International Relations
Publisher EKONÓM
2012
Conference proceedings 13th International Scientific Conference
International Relations 2012
CONTEMPORARY ISSUES OF WORLD ECONOMICS
AND POLITICS
Smolenice Castle December 5 – 7 2012

2
The organizer of the international conference: Faculty of International Relations, University of Economics in Bratislava Supported by: Taipei Representative Office, Bratislava Stredoslovenská energetika, a.s Editor: Dr.h.c. prof. Ing. Ľudmila Lipková, CSc. Reviewers: prof. Ing. Víťazoslav Balhar, CSc. prof. JUDr. Viera Strážnická, CSc. prof. Ing. Helena Strážovská, CSc. Managing editor: PhDr. Lucia Milošovičová
International Scientific Committee: Chairperson: Lipková Ľudmila, prof. University of Economics in Bratislava Members: Fábián Attila, Associate prof. University of West Hungary Fiala Bohumil, PhD. Silesian University in Opava Li, Hsi-mei, prof. Chinese Culture University, Taiwan Liďák Ján, Associate prof. University of Economics in Bratislava Márton Milan, Associate prof. University of Economics in Bratislava Mráz Stanislav, prof. University of Economics in Bratislava Nan-Yang Lee Taipei Representative Office, Bratislava Nesterenko N. Julija, Associate prof. Russian State University for the Humanities Osiński Joachim, prof. Warsaw School of Economics, Warsaw Pálinčák Mykola, Associate prof. Uzhhorod National University, Uzhhorod Rusiňák Peter, PhD. University of Economics in Bratislava Sidak Mykola, Associate prof. Uzhhorod National University, Uzhhorod Škvrnda František, Associate prof. University of Economics in Bratislava Veretennikova B. Oľga, prof. Ural State University of Economics, Ekaterinburg Zágoršeková Marta, Associate prof. University of Economics in Bratislava Organizing Committee: Chairperson: Kolesár Miroslav Deputy: Milošovičová Lucia Members: Bocora Ján Holas Lukáš Brocková Katarína, PhD. Lukáč Milan Buzinkai Matej Meričková Laura Černota Mikuláš Nemešová Marta Draková Silvia Polgár Michal Drutarovská Jana Kunychka Mykhaylo Držka Michal Satková Monika Fodorová Veronika Šabo Marián Gabrielová Petra Šálek Martin Grančay Martin, PhD. The content of papers is a sole responsibility of authors. Publisher: EKONÓM Publishing House, 2012 ISBN 978-80-225-3560-1

3
Content Daša Adašková _____________________________________________________________ 6 ARMED CONFLICT IN SYRIA AND ITS IMPLICATIONS FOR CHEMICAL AND BIOLOGICAL SECURITY Matej Buzinkai ____________________________________________________________ 12 CHARACTERISTICS OF THE CHINESE REFORM PROCESS Anna Cyran_______________________________________________________________ 18 LEGAL ASPECTS OF SENDING THE POLISH ARMY OUTSIDE THE COUNTRY SINCE 1989 Jiří Dušek, Lubomír Pána ___________________________________________________ 27 EFFECTIVENESS OF NEGATIVE ELECTION CAMPAIGN IN THE CONDITIONS OF THE CZECH REPUBLIC Jaroslava Ester Evangelu ___________________________________________________ 37 DIFFERENT APPROACHES AND SOLUTIONS OF CZECH AND GERMAN MANAGERS IN INTERCULTURAL STRESSFUL SITUATIONS Janusz Falecki ____________________________________________________________ 44 SELECTED ELEMENTS OF THE POLISH ARMED FORCES’ SUPPORT FOR CIVIL AUTHORITIES IN COMBATING AND ELIMINATING THE EFFECTS OF NON-MILITARY THREATS Rastislav Funta____________________________________________________________ 60 THE EU DECLINE? FUTURE PROSPECT THROUGH INVESTMENT STRATEGY Katarína Havierniková______________________________________________________ 65 CLUSTERS AND THEIR EFFICIENCY IN REGIONS OF THE SLOVAK REPUBLIC Taťána Karásková _________________________________________________________ 75 ALTERNATIVE SOURCES OF FOOD IN THE THIRD MILLENNIUM Marcel Kordoš ____________________________________________________________ 85 TRANSATLANTIC BUSINESS DIALOGUE AS A KEY ELEMENT OF US-EU ECONOMIC PARTNERSHIP Aisulu Kozhabayeva ________________________________________________________ 92 ENERGY POLICY IN KAZAKHSTAN: TENDENCIES AND RISKS Irah Kučerová_____________________________________________________________ 99 REGION OF CENTRAL EUROPE OR MIDDLE EUROPE? Dušan Leška _____________________________________________________________ 110 THE WAY OUT OF THE CRISIS OF THE EUROPEAN UNION MORE EUROPE OR LESS EUROPE? Lukáš Melecký ___________________________________________________________ 121 INTEGRATED APPROACH TO REGIONAL DISPARITIES EVALUATION IN VISEGRAD COUNTRIES Pavlína Pellešová _________________________________________________________ 135 INNOVATIONS IN TEACHING ECONOMIC POLICY Paula Puškárová__________________________________________________________ 140 R&D EFFECTIVENESS IN V4 COUNTRIES: NEW EVIDENCE ON LEADING AND LAGGING V4 REGIONS

4
Chalotorn Sinproh ________________________________________________________ 149 THE GLOBAL IMBALANCES FROM THE PERSPECTIVE OF THE OIL-EXPORTING COUNTRIES Michaela Staníčková ______________________________________________________ 160 OVERALL EVALUATION OF PERFORMANCE IN VISEGRAD COUNTRIES AND REGIONS IN COMPARISON WITH AUSTRIA AND GERMANY BY MULTIDIMENSIONAL DEA APPROACH Luboš Štancl _____________________________________________________________ 177 ECONOMIC COST AND ECONOMIC BENEFITS FOREIGN PEACEKEEPING MISSIONS CZECH ARMY Klára Vaclavinkova _______________________________________________________ 183 MAPPING THE STATE MARKET FOR ORGANIC FOOD IN THE CZECH REPUBLIC TO FOCUS ON ORGANIC AGRICULTURE Vanda Vašková___________________________________________________________ 191 POST-CRISIS FINANCIAL MARKET REGULATION AND SUPERVISION Tomáš Verner, Michal Tvrdoň ______________________________________________ 202 TESTING OF THE LONG-TERM RELATIONSHIP BETWEEN REGIONAL UNEMPLOYMENT

5
Preliminary Working Groups:
1. European Union 2. Contemporary issues of world economy 3. Contemporary issues of law in international relations 4. Contemporary issues of current international politics 5. Contemporary issues of intercultural relations 6. Contemporary issues of the development of Southeast Asia
Program
December 5, 2012 (Wednesday)
09:00-11:00 Registration and refreshments 11:30-12:30 Lunch 13:00-14:30 Official opening of the conference and plenary session 14:30-15:00 Coffee break 15:00-16:30 Discussion in sections 17:00-18:00 Dinner 18:30 Traveling to the Horné Orešany wine cellar 19:00-22.00 Archive wine tasting and refreshments
December 6, 2012 (Thursday)
8:00-9:00 Breakfast 9:15-10:45 Discussion in sections 10:45-11:15 Coffee break 11:15-12:30 Discussion in sections 13:00-14:30 Lunch 14:30-16.00 Discussion in sections 16:00-16:30 Coffee break 16:30-18:00 Discussion in sections 19.00 Reception 22.00 Raffle drawing
December 7, 2012 (Friday)
8:00-9:00 Breakfast 9:15-10:45 Panel discussions 10:45-11:00 Coffee break 11:00-12:00 Final conference evaluation 12:00-13:00 Lunch after 13:00 Conclusion of the conference, departure of the participants

6
Daša Adašková
FACULTY OF INTERNATIONAL RELATIONS UNIVERSITY OF ECONOMICS IN BRATISLAVA
ARMED CONFLICT IN SYRIA AND ITS IMPLICATIONS FOR
CHEMICAL AND BIOLOGICAL SECURITY
Abstract Syria is considered as one of the key actors in the proliferation of weapons of mass destruction (WMD) in the Middle East region. According to analysts, Syria currently disposes of sophisticated programme for the development and production of chemical weapons, facilities for the production of biological weapons and one of the largest missile arsenals in the region. Regarding the ongoing internal armed conflict in Syria that began in 2011 a security threat of potential deployment of its WMD arsenals has emerged. The aim of the paper is to analyze the potential impact of political instability in the country on the security of Syrian WMD arsenals and to analyze the risk of its potential misuse. Key words: Syria, internal conflict, weapons of mass destruction, security.
Introduction Syria has long exerted to gain weapons of mass destruction (WMD) and ballistic missile delivery systems. The main motivation for the developing of WMD arsenals stems primarily from regional security concerns and especially Syria‘s adversarial relationship with its neighbour and primary enemy, Israel. Syria is currently estimated to dispose of one of the most advanced chemical and missile programme in the Middle East region and allegedly of a biological programme. These arsenals serve as a deterrent against Israeli threats and are being described as a destabilizing factor in the region although Syria has neither threatened its neighbours to use its WMD arsenals nor has deployed them in an armed conflict. However Syria has been still considered as one of the leading proliferators of chemical and biological weapons in the Middle East region. The ongoing internal armed conflict in Syria, which has evolved from the political crisis in 2011, has renewed concerns over the proliferation of chemical and biological weapons and their impact on the international security. There are several security threats regarding the Syrian WMD capacities. They can be potentially deployed in the armed conflict against insurgent rebel groups or against foreign forces by the Syrian army. On the other hand there is more serious security risk that armed non-state actors operating within the territory could take control over the WMD stockpiles. All scenarios would have a significant impact on the security of the Middle East region. The main aim of the article is to assess the possible scenarios of the potential deployment of Syrian WMD arsenals during the internal armed conflict and to analyse their potential impacts. In order to achieve this goal the article deals primarily with the analysis of Syrian WMD programmes and motivations for their development in order to identify the real threats emerging from the Syrian WMD capacities. Subsequently the article deals with possible scenario of potential use of Syrian WMD during the ongoing internal armed conflict.

7
Syrian Weapons of Mass Destruction Programmes Syria’s Motivations for Weapons of Mass Destruction Development The Syria’s motivation for the development and building of WMD programmes can be seen in a complex regional security environment. Regional security concerns and Syria’s adversarial relationship with Israel represent the main motivation for Syrian WMD programmes development thus the long effort to gain WMD is a consequence of threat perception1. Firs impetus for Syria to pursue WMD programmes were military defeats by Israel during Arab-Israeli wars in 1948, 1967, 1973 and during the Israeli invasion of Lebanon in 19822. Second impetus came after weakening of the Arab unity against Israel that was followed by the 1979 Egyptian-Israeli peace treaty. Third impetus comes from the Israeli alleged nuclear programme. According to these motivations, the decision to develop WMD, especially chemical weapons, and their position within the state’s military doctrine is based on the deterrence concept against Israel that has been a long-time enemy for Syria and with whom Syria has territorial dispute over the Golan Heights. The main aim of the deterrence concept of Syrian WMD is to deter and prevent any military action by Israel against Syria that is based on the threat perception of potential destructive and psychological effects caused by Syrian WMD, mainly chemical weapons, against Israeli population.3 In addition to that the strategic position of Syrian WMD capacities is aimed to pose a counterbalance to Israeli alleged sophisticated nuclear arsenal. However as there is no articulated doctrine4 for the deployment of Syrian WMD it can be assumed that they are intended as a deterrent against an overwhelming Israeli conventional attack as well as a nuclear attack threat. Although Syria officially supports ban on WMD proliferation in the Middle East region, it declines to renounce it WMD capacities for as long as Israel poses threat to Syrian security. Weapons of Mass Destruction Programmes
The Syrian military chemical programme has been developing in confidence since the end of the 1970s with the cooperation and assistance of Egypt, China, India and North Korea. These states donated mainly chemical precursors and double-use materials to Syria, as it has always been depending on foreign resources.5 Recently, the chemical arsenal has been developed with the support of Iran and several European states. They served as donors of sophisticated technology, chemical precursors and double-use materials for the civilian chemical programme.6
Currently it is assumed that Syria disposes of advanced programme for the development and production of chemical weapons. According to experts the programme is even considered as the most sophisticated in the Middle East region. The chemical weapons production and storage infrastructure is concentrated allegedly at facilities in and around southeast of Aleppo in Al Safira, Damascus, Hamah, Latakia and Homs. However stockpiles of chemical weapons may be stored also in other military locations around the country.7
Moreover, it has been estimated that Syrian stockpiles of chemical weapons are the largest in the region. According to experts, Syria possesses hundreds of thousands nerve and
1 Syria was working toward developing WMD already by the 1980s. 2 Syria is the last Arab state that confronted Israel militarily. 3 JOUEJATI, M. (2006): Syrian WMD Programs in Context, p. 65 - 66. 4 Ibid. 5 HASHIM, A. S. (2006): Syrian Weapons of Mass Destruction, p. 74 - 76. 6 James Martin Center for Nonproliferation Studies (2012): Country Profiles: Syria [online], Available on internet: <http://www.nti.org/country-profiles/syria/ >. 7 SHARP, J. M. - BLANCHARD, C. M. (2012): Armed Conflict in Syria: U.S. and International Response, s.2.

8
blister toxic chemical agents as sarin, VX, mustard gas etc., that were transformed into weapons in the form of artillery shells, mines, bombs, warheads and air-dropped munitions.8
Syria has neither signed nor acceded to the Chemical Weapons Convention (CWC), however it ratified the Geneva Protocol of 1925. As a consequence, Syria’s development of chemical weapons is not in violation of any international law. However, Syria would breach the international law only in case of the deployment of chemical weapons in an armed conflict.
In the context of biological weapons proliferation, there is limited information about Syrian biological weapons programme. Syria is estimated to possess national pharmaceutical and biotechnological capacities able to develop biological weapons. According to experts, Syria currently disposes of Bacillus Anthracis, botulinum toxin and ricin. However they were not probably weaponized.9 As a result, they can be used in the form of rough biological weapons. Syria signed the Biological Weapons Convention (BWC) in the past, but refused to ratify it. However, according to the Geneva Protocol of 1925 the same rules can be applied for a potential deployment of any biological weapon in an armed conflict as in the case of chemical weapons.
Syria has neither had serious interests in developing nuclear weapons, nor large and advanced civilian nuclear energy programme. After the ratification of the Nuclear Non-Proliferation Treaty (NPT) in 1969, Syria began to develop civil nuclear programme in the cooperation with Argentina, China and Russia.10 Later Syria provided the territory for the placement of a secret reactor for the production of plutonium in the cooperation with Iran and North Korea11. Nevertheless, in 2007 Israel bombed and destroyed the Al-Kibar or Dair Alzour site in an airstrike operation. Subsequently after three years of investigation, the International Atomic Energy Agency (IAEA) concluded that the nuclear reactor was in noncompliance with Syrian obligations under the Safeguards Agreement and should have been declared to the IAEA12. Currently Syria disposes only of a small research reactor constructed with the assistance of China.13
In addition to WMD arsenals, Syria currently possesses one of the largest missile arsenals in the Middle East region and is engaged in active missile proliferation. The ballistic missile delivery systems programme has been developed along with the chemical weapons programme. However, Syria always depended on foreign suppliers for advanced components and technologies. The current arsenal is limited to a surface-to-surface missile force consisting of Soviet short-range ballistic missiles Scud-B, Scud-C and Scud-D14 from the 1970s and 1980s. In 1990s Syria purchased Korean missiles Scud-C and missile technology from China and Russia.15 The ballistic missiles are able to carry chemical warheads for the range of hundreds of kilometres. Syria is not a member to Missile Technology Control Regime (MTCR).
8 James Martin Center for Nonproliferation Studies (2012): Country Profiles: Syria [online], Available on internet: <http://www.nti.org/country-profiles/syria/ >. 9 Ibid. 10 Terem, P. (2008): Jadrové zbrane - ich význam a vplyv na svetovú politiku, p. 221. 11 Iran provided financial resources for the building of the reactor and North Korea provided the technological information. KORT, M. (2010): Global Issues: Weapons of Mass Destruction, p. 83. 12 James Martin Center for Nonproliferation Studies (2012): Country Profiles: Syria [online], Available on internet: <http://www.nti.org/country-profiles/syria/ >. 13 KORT, M. (2010): Global Issues: Weapons of Mass Destruction, p. 83. 14 Scud-D missiles with an advanced guidance system are the most advanced Syrian missiles with the range of 700 km. James Martin Center for Nonproliferation Studies (2012): Country Profiles: Syria [online], Available on internet: <http://www.nti.org/country-profiles/syria/ >. 15 Ibid.

9
Internal Armed Conflict and the WMD Threats Current security situation in Syria is determined by the ongoing internal armed conflict, which has evolved from the political crisis and peaceful uprising in 2011. The conflict that has escalated into an armed civil conflict is raising concerns about the possible deployment of Syrian arsenals of chemical weapons and potential rough biological weapons during the conflict. In this regard, there are several scenarios that pose a security risk. Firstly, there is a security risk of a potential use of Syrian chemical weapons and rough biological weapons by Syrian army. In the past Syria neither used WMD capacities against external nor against internal enemy. The existence of Syrian chemical and biological programme was not officially confirmed until July 2012, when the Ministry of Foreign Affairs Spokesman Jihad Makdissi officially announced that Syria would never use chemical or biological weapons against the inhabitants during the internal armed conflict. At the same time he admitted the deployment of WMD only against foreign intervention.16 The statement de facto confirms that Syrian WMD serve as a deterrent against any foreign intervention. However, at the same time the threat of a foreign intervention serves as a deterrent of the deployment of WMD against inhabitants by the army. In case of the deployment of chemical or biological weapons, Syria would violate the international law norms as Syria is the signatory to the Geneva Protocol of 1925. According to the Geneva Protocol, the signatories are prohibited from the deployment of chemical and biological weapons in an armed conflict. If Syrian army used chemical or biological weapons, it would probably lead to adequate reaction and action of United Nations Security Council. From this perspective it is less probable, that Syria would deploy chemical or biological weapons to resolve the conflict. The security risk can be assessed as less probable. Secondly, there is a security risk that non-state actors could potentially acquire and subsequently use the Syrian WMD. There are two main types of possible non-state actors - internal and external actors. This scenario is possible only in the case of ongoing unstable security situation and in case of the failure to secure and control WMD arsenals.17 According to previous analyses it can be assumed that the WMD arsenals will be strictly secured by the Syrian army during the internal armed conflict as the arsenals are the ultimate guarantee of the Bashar Al-Assad regime security. The potential acquirement of the Syrian WMD by non-state actors is possible only in case of the defeat of the regime. On the one hand, the Syrian opposition revolutionary forces pose a security risk in this context. However they have never demonstrated the ambition to gain Syrian chemical or biological weapons during the conflict.18 It can be assumed that if the opposition revolutionary forces gained the WMD capacities during the internal armed conflict they would not probably deploy the weapons against Syrian army as they would immediately loose international support. On the other hand, it is probable that after the collapse of Al-Assad regime a new government would refuse to abandon the WMD capacities and arsenals as they are an important deterrent against the Israeli military power. Thirdly, more compelling is the potential scenario that the WMD would acquire external non-state actors operating in Syria during the armed conflict. The most dangerous are terrorist groups who showed their interest in acquiring of non-conventional weapons in the past. Syria has never officially declared the intention or willingness to provide any terrorist
16 IISS (2012): Strategic Comments: Unease grows over Syria's chemical weapons [online], Available on internet: <http://www.iiss.org/publications/strategic-comments/past-issues/volume-18-2012/august/unease-grows-over-syrias-chemical-weapons/?locale=en>. 17 SHARP, J. M. - BLANCHARD, C. M. (2012): Armed Conflict in Syria: U.S. and International Response, s.2. 18 IISS (2012): Strategic Comments: Unease grows over Syria's chemical weapons [online], Available on internet: <http://www.iiss.org/publications/strategic-comments/past-issues/volume-18-2012/august/unease-grows-over-syrias-chemical-weapons/?locale=en>.

10
group with its WMD stockpiles, although the regime supports Shiite political and military organisation Hezbollah and Palestinian militant organisations.19 If the Syrian regime provided any terrorist organization with WMD capacities it would probably face a massive retaliation dominantly by Israel. More probable scenario is acquiring of WMD by terrorist organizations in case of a potential defeat of Al-Assad regime and in case of the failure of security and control arsenals measures. Serious concerns raises organization Al-Qaeda which factions has been operating on Syrian territory during the ongoing internal armed conflict.20 The organization confirmed its interest in acquiring non-conventional weapons to achieve its goals already in the past. Moreover, particular terrorist attacks perpetrated by the organization in the past confirmed the fact that Al-Qaeda has motivation to use disproportionate violence that causes wide psychological impact. Following the Al-Qaeda’s motivations it can be assumed that if Al-Qaeda members acquired Syrian WMD, the organization would not hesitate and delay the deployment of the weapons to achieve their goals. From this perspective, the organization Al-Qaeda and its factions is the most dangerous terrorist organization in connection with the internal armed conflict in Syria and its WMD capacities.21
Conclusion
Chemical and biological weapons and their destructive effects have been underestimated in the comparison to far more destructive nuclear weapons although their proliferation poses currently more significant security threat. The main security challenges connected with chemical and biological weapons proliferation is their potential deployment in the ongoing Syrian internal armed conflict. There is a real security threat of their potential use during the unstable security situation.
According to the analysis, the Syrian chemical weapons and rough biological weapons could be potentially used in three main cases. The first scenario is the potential use of the chemical and biological weapons by the Syrian army against insurgent rebel groups or against foreign intervention. However this scenario is less probable as when deployed the result would be adequate countermeasures of the international community. On the other hand, there is a scenario of a potential acquirement of Syrian WMD capacities by non-state actors in case of the failure to secure the control of WMD capacities. In this case if the WMD capacities would be acquired by insurgent rebel groups it is probable that they would not use them against the Syrian army and population as they would immediately loose the international support. However the most compelling scenario is the potential acquirement of Syrian WMD capacities by terrorist groups operating on Syrian territory during the internal armed conflict. The most dangerous is still the terrorist organization Al-Qaeda and its factions operating in Syria. Regarding Al-Qaeda’s motivations and past efforts and real attempts to acquire WMD it is probable that if its members acquired Syrian chemical and biological weapons, they would probably use them in order to achieve Al-Qaeda’s goals. In this case the potential consequences of this scenario would be mass casualties, contamination of the environment. Moreover it would mean the need to reassess security threats connected to chemical and biological weapons proliferation on international level and especially to re-evaluate the international measures to prevent the chemical and biological proliferation.
19 SHARP, J. M. - BLANCHARD, C. M. (2012): Armed Conflict in Syria: U.S. and International Response, s.2. 20 IISS (2012): Strategic Comments: Unease grows over Syria's chemical weapons [online], Available on internet:<http://www.iiss.org/publications/strategic-comments/past-issues/volume-18-2012/august/unease-grows-over-syrias-chemical-weapons/?locale=en>. 21 KAZANSKÝ, R. – VAŠČÍK, A. (2011): Nástroje preventívnej diplomacie a ich využitie pri riešení súčasnej bezpečnostnej situácie v Sýrii, p. 125.

11
Literature: 1. HASHIM, A. S. (2006): Syrian Weapons of Mass Destruction. In: In: RUSSELL,
J. (Ed.) Proliferation of Weapons of Mass Destruction in the Middle East: Directions and Policy Options in the New Century. New York: Palgrave MacMillan, 2006. p. 73 - 92. ISBN 1-4039-7025-4.
2. James Martin Center for Nonproliferation Studies (2012): Country Profiles: Syria [online]. In: Nuclear Threat Initiative, 2012. [cit. 18. 12. 2012], Available on internet: <http://www.nti.org/country-profiles/syria/ >
3. JOUEJATI, M. (2006): Syrian WMD Programs in Context. In: RUSSELL, J. (Ed.) Proliferation of Weapons of Mass Destruction in the Middle East: Directions and Policy Options in the New Century. New York: Palgrave MacMillan, 2006. p. 63 - 72. ISBN 1-4039-7025-4.
4. KAZANSKÝ, R. – VAŠČÍK, A. (2011): Nástroje preventívnej diplomacie a ich využitie pri riešení súčasnej bezpečnostnej situácii v Sýrii. In PAJTINKA, Erik et. al. Diplomacia v ére globalizácie: Zborník z konferencie k 50. výročiu prijatia Viedenského dohovoru o diplomatických stykoch. Banská Bystrica: FPVaMV UMB, 2011. p. 116-127. ISBN 978-80-557-0320-6.
5. KORT, M. (2010): Global Issues: Weapons of Mass Destruction. New York: Maple Press, 2010. 351 p. ISBN 978-0-8160-7827-1.
6. IISS (2012): Strategic Comments: Unease grows over Syria's chemical weapons [online]. In: The International Institute for Strategic Studies, 2012 [cit. 18. 12. 2012], Available on internet: <http://www.iiss.org/publications/strategic-comments/past-issues/volume-18-2012/august/unease-grows-over-syrias-chemical-weapons/?locale=en>
7. SHARP, J. M. - BLANCHARD, C. M. (2012): Armed Conflict in Syria: U.S. and International Response. Washington D.C.: Congressional Research Service, p. 3.
RL33487. 8. TEREM, P. (2008): Jadrové zbrane - ich význam a vplyv na svetovú politiku.
Banská Bystrica: UMB, 2008. 290 p. ISBN 978-80-8083-531-6.
Contact
Mgr. Daša Adašková, PhD. Department of International Political Relations Faculty of International Relations University of Economics in Bratislava Dolnozemská cesta 1/b 852 35 Bratislava Slovakia E-mail: [email protected]

12
Matej Buzinkai
FACULTY OF INTERNATIONAL RELATIONS UNIVERSITY OF ECONOMICS IN BRATISLAVA
CHARACTERISTICS OF THE CHINESE REFORM PROCESS
Abstract In the presented paper we would like to describe the most important characteristics of the Chinese reform model. The first chapter describes the differences between the Washington Consensus and the so-called Beijing Consensus. We find that the defining principles of the Chinese approach to reform are gradualism, cautiousness and the goal to improve the living standards of people while keeping political stability. The second chapter deals with a feature of the Chinese reform we found to be the most interesting – the bottom-up process. We identify two reforms that began from the bottom – the introduction of the household responsibility system and the reform of the household registration system. Key words: Chinese economic reform, Beijing Consensus, gradualism, bottom-up process, agriculture, labor mobility. Gradualism of the Beijing Consensus
The government of China did not have a clear roadmap of reforms; instead individual measures were implemented gradually targeting the economic problems considered the most pressing at the moment. Country`s leadership rejected the method of the so-called shock therapy – an instant implementation of market principles in all economic areas which is linked to the Washington Consensus. The Consensus was suggested later in 1990s as a recommendation to countries undergoing a transition from a centrally planned economy to market economy. Besides shock therapy, the other characteristics of the process are large scale privatization, complete liberalization of prices and the minimizing of the role of government in economic life – all influenced by strong faith in the “invisible hand” of the market. In our opinion, other characteristics that are connected to the Washington consensus are principles of democracy and liberalism and also that it began as a top-down process – the set of rules was accepted as a recommendation and made into laws by the governments of the transforming countries.
On the other hand, the Chinese approach is characteristic by heavy involvement of the government in economic system and by very gradual implementation of the market principles. The mechanism of reform implementation is flexible and is being adapted to given circumstances; it is open to experiments with different reform methods. It is an inevitable product of the fast-changing Chinese society that needs a constantly innovating approach to transformation. The American foreign-policy expert Joshua C. Ramo in 2004 was the first to suggest the name The Beijing Consensus to put together the whole set of qualities attributed to the Chinese development model since 1978. Thus it is important to realize that the term was invented as an alternative to the Washington Consensus outside of China.1 The leadership of PRC does not present its approach to reforms as a development model recommended to developing countries.
1 Ramo, J. C.: The Beijing Consensus. [cit. 26.11.2012]. Dostupné na internete: <http://fpc.org.uk/fsblob/244.pdf>

13
Deng Xiaoping famously characterized the gradualness and cautiousness of the Chinese attitude towards reforms using the old Chinese saying “crossing the river by feeling
for the stones” (in Chinese - 摸着石头过河, in pinyin - mō zhe shí tóu DZuò hé). What he meant was an approach when some measure is first experimented with on a small economic sample – in one sector and in only one province, before the government starts to implement the new reform in other parts of the country and other sectors. The intensity of using the market mechanism grew slowly also because of the need for protection of those groups of people that benefited from the central planning system. The motive was to minimize the social and political instability. Many reforms did not have a beforehand determined date of completion and the methods of their implementation changed with time and place. Cai acknowledges the mutual conditioning of the fundamental elements of the Chinese development model: “reform aims to promote development but shall subordinate itself to stability; development results are used to examine the correctness of the reform approach; stability creates conditions for further reforms.”2 Another characteristic that is being ascribed to the Chinese reforms is that they are Pareto optimal – the government of PRC is said to struggle not to worsen the socioeconomic situation of any economic subject and at the same time to improve it for at least one.3 The market mechanism was not the target of the reform; instead it was used as a means to secure higher living standard for large groups of population and to improve the strength of the country.4 In our opinion it must be added that the success in achieving both long-term goals at the same time raised the legitimacy of the rule of one party – the Communist Party of China, maintaining the political stability.
The first step of the reform process was the institutional reform of micromanagement, the gist of which laid in gradual transfer of responsibility for the economic results to individual productive units, ne it in agriculture or industry. The officials leading these units were given the opportunity to share the profits, which motivated them to increase their performance and led to economic growth.5 Another important aspect of the reform was the dual economic system – the coexistence of centrally planned economy and elements of market economy. The role of the institutions of central planning in allocation of factors of production was gradually substituted for the market mechanism.6 An example is the introduction of the dual price system, firstly in rural agriculture and later also in the State-owned enterprises. The principle of the dual price system is the existence of two types of prices:
• state determined prices used for the mandatory purchase of production • market prices, which were regulated at the beginning, but with the accelerating
pace of reform the regulation was relaxed by the government
Each production unit was given a centrally decided production plan, which determined the amount of production that will be mandatorily purchased for the determined prices. After the State-owned enterprise, or rural household, fulfils the plan, it can sell the remaining production on the market for market prices. Market principles were gradually brought into the Chinese centrally planned economy. At the same time, individual economic subjects were motivated to increase their productivity to be able to realize more production for market prices, which were higher than prices paid by the state. It allowed the Chinese government to
2 Cai, F. et al.: Transforming the Chinese Economy. 2010. p. 17. 3 Lau, L. J. – Qian, Y. – Roland, G.: Reform without Losers: An Interpretation of China’s Dual-Track Approach to Transition. 2000. In Journal of Political Economy. p. 126. 4 Cai, F. et al.: Transforming the Chinese Economy. 2010. p. 17. 5 Lin, J. Y. – Cai, F. – Li, Z.: The China Miracle: Development Strategy and Economic Reform. 2003. pp. 177-178. 6 Portjakov, V. J.: Ekonomičeskaja reforma v Kitaje (1979-1999). 2002. s. 6.

14
avoid the political and social instability stemming from the harm large-scale privatization or the liberalization of prices could cause to a part of the population.7
The gradualism of Chinese development model was mirrored in the continual change of official government rhetoric analysing which we can identify the periods when the reform entered a qualitatively new stage. In 1982, an official document from the 12th congress of Communist Party of China is the first to mention the elements of market in Chinese economy. Its role was to be a supplement to the centrally planned system. In the period from 1984 till 1991 the official target of the reforms was the model of socialist planned commodity economic system. In 1985 the continuation of the reforms was stated as the most important job of the seventh five-year plan of the PRC. Its target was to correct the flaws of the previous economic system and to create a new system of economic management with Chinese specifics. After the Tiananmen incident the pace of the reforms decelerated for a time but thanks to the Teng Xiaoping`s efforts it was the reformist group that in the end gained back the leading position if the communist party. The biggest breakthrough from an ideological viewpoint came in 1992 when an official government statement confirmed that the Chinese development leads to an establishment of “socialist market economy”.8 This economic system also got the name socialism with Chinese specifics. Bottom-up process in Chinese reform
An important characteristic of the Chinese reform was that some of its steps began as the so-called “bottom-up processes”. This fact is interesting from the viewpoint of Chinese political environment – the authoritarian regime with one-party rule. In practice, the “bottom-up process” meant that part of the Chinese population began to behave in a way that is inconsistent with government regulation. Often it is the poorest segments of the society – the rural farmers or the migrant workers. When it turns out that this kind of behaviour is beneficial for the whole economic system, the process is given an official framework and becomes a part of the government`s reforms. Some of the most important Chinese reforms began this way, e. g. the implementation of the household responsibility system or the reform of the household registration system. The agricultural reform Agriculture was the most important part of Chinese civilization for millennia and by the end of 1970s there were still 82 % of people living in the rural areas and the share of agricultural employment was almost 70 %. The Communist party wanting to improve the legitimacy of its rule knew it has to start the reform process in agriculture. The agricultural reform in PRC since 1978 had three main elements – the reform of prices, which meant the gradual giving up of the “price scissors” policy; dismantling of the people`s communes and introduction of the household responsibility system; and the relaxing of central planning in agriculture. Decollectivization was the most important feature of the Chinese agricultural reforms. Maoist agriculture was collective, individual households were organized in the people`s communes and through them the government controlled the fulfilling of the quotas. The agricultural land was in state ownership and could anytime be redistributed differently among the households – when the number of the members of the household has changed or by other criteria. Individual household were not motivated to increase production because exceeding the quota did not bring substantial economic rewards. Furthermore, any possible losses were
7 Brandt, L. – Rawski, T. G.: China`s great economic transformation. 2008. p. 10. 8 Portjakov, V.: The Economic Reform Conception in China: Formation and Evolution. 2004. In China Report. p. 361-364.

15
covered by the state on egalitarian principle. One of the problems was that it was difficult to evaluate the performance of individual households due to collective responsibility. There was also low incentive to invest in the land as the households were not sure whether they will make their living on the same plot of land in the future. The institutional reform began with changes in the policy of quotas – they were no tied to the whole commune and were instead purchased from individual households. At first, the Chinese leadership strongly opposed the idea of leasing the plots of land to individual households. Despite the government opposition, one commune in 1978 in the village of Xiaogang in Anhui province secretly decided to lease the land plots to individual households. It took quite some courage as the farmers, with experience from the Cultural Revolution, probably awaited a death sentence if the government found out about their actions.9 However, the performance of the Xiaogang commune improved considerably which was recognized by the government and the commune was given official approval. It was legalized to use the new system only in the poorest provinces to improve their performance. However, gradually the number of communes leasing their land to households grew in number and the system was adopted also in wealthier provinces, ignoring the officially approved criteria. This new system was given the name “household responsibility system” and it was officially approved for the whole country in 1981. By that time, 45 % of people`s communes were already dismantled. Until 1983, thanks to good results the household responsibility system was adopted by 98 % of agricultural production teams in PRC.10 Lin considers the implementation of the new system to be most important element of the agricultural reform which brought a 42 % increase in production in the period from 1978 to 1984. He calculated the share of the introduction of the household responsibility system to be almost 50 %.11 The government increased the farmers` feeling of security by recommending the leasing contracts to be signed at first for 15 years and later extending them for another 30 years.12 The agricultural reform in China was very successful and the productivity of rural agriculture increased rapidly. Fewer farmers were able to produce more which led to the releasing of a large amount of workforce from the countryside. These workers migrated to cities and gradually became the engine of Chinese economic growth. The basic principles of the household responsibility system which was started by a few farmers were later implemented to other sectors as well. The reform of labor mobility The surplus labor released from agriculture by raising its effectiveness was needed in the emerging export-oriented sector which was being developed in the coastal cities. However, territorial migration of population was restricted in China by the household registration system, called the hukou system. Each citizen of PRC holds a hukou registration which ties him/her to a particular city or rural area and allows him to work either in agricultural or non-agricultural job. The policy was initiated under Mao`s regime, which prioritized the development of heavy industry in cities, to prevent mass migration from rural areas. It is particularly difficult to change your registration from rural agricultural hukou to an urban non-agricultural one. In China, many social services, e. g. schooling and healthcare, are tied to the place of a person`s hukou registration. Until the reform of early 1990s people in
9 The Economist: China`s reform: The second long march. 2008. [cit. 10.1.2013]. Accessible on the internet: < http://www.economist.com/node/12758848> 10 Lin, J. Y.: Rural Reforms and Agricultural Growth in China. 1992. In American Economic Review. p. 37, 46. 11 Lin, J. Y.: Rural Reforms and Agricultural Growth in China. 1992. In American Economic Review. p. 37, 46. 12 Cai, F. et al.: Transforming the Chinese Economy. 2010. p. 6.

16
cities were able to buy grain only by using special grain coupons, which were also tied to an urban hukou, which made migrating from villages to cities very difficult.13 The reform of labor mobility shows many of the characteristics of the overall reform - in addition to being a bottom-up process, it was also very gradual. Despite the regulation, idle villagers started to migrate looking for opportunities to improve their living standards. In the early reform period, it was usually just a structural movement of labor force from agriculture to rural industry. With more and more rural labor released from the primary sector, they gradually started to migrate to cities. Firstly, it was the local urban centers, then provincial capitals and when the export-oriented industry started to develop rapidly on the coast, workers found their way to the booming cities of Eastern China. Chinese leadership recognized the advantages of migration for the whole economy – labor force was moving from less effective sectors towards modern productive ones; the emerging export-oriented industry needed labor force; and it was an opportunity for the migrants to improve their living conditions. An interesting feature of the process is that the migrating workers seemed to be always one step ahead of the government. The barriers for labor mobility were gradually relaxed in areas where former agricultural workers already migrated despite the regulation. The government initially allowed them to work in village industries. Later, working and opening businesses in local cities was allowed for people without the proper hukou under the condition that they were self-sufficient. In the early 1990s the urban food rationing system and the grain coupons were abolished. The year 1998 saw the abolition of the heredity of hukou from mother and children were able to inherit their father’s registration. The government relaxed the restrictions to allow the partners and dependants to acquire urban hukou along with the rural-urban migrant worker they are depending on.14 The reform continues until today and even if it is not nearly finished, in many cities it is becoming easier to obtain the local urban hukou. The “floating population”, which is the name for holders of rural hukou migrating to work in cities, became the backbone of Chinese economy. Many of the defining features of Chinese development model – the Lewisian dual economy, high savings, low consumption, orientation on export markets – are the result of the migration that started gradually by bypassing the government rules. The official number of migrant workers in People’s Republic of China reached 145 million in 2009.15 Cai estimates that the movement of labor into sectors with higher productivity accounted for 21 % of the GDP growth of People’s republic of China in the period 1978 – 1998.16 Literature:
1. Brandt, Loren – Rawski, Thomas G. 2008. China`s great economic transformation. Cambridge: Cambridge University Press, 2008. 886 p. ISBN:9780521712903.
2. Cai, Fang – Du, Yang. 2011. Wage increases, wage convergence, and the Lewis turning point in China. In China economic review. ISSN 1043-951X, 2011, vol. 22, no. 4, pp. 601-610.
13 Wu, X. – Treiman, Donald J.: The household registration system and social stratification in China: 1955–1996. 2004. In Demography. p. 368. 14 Cai, F.: Hukou System Reform and Unification of Rural-urban Social Welfare. In China & World economy. 2011. p. 33-47. 15 Cai, F. – Du, Y: Wage increases, wage convergence, and the Lewis turning point in China. 2011. In China economic review. pp. 602-603. 16 Cai, F.: Hukou System Reform and Unification of Rural-urban Social Welfare. In China & World economy. 2011. p. 35.

17
3. Cai, Fang. 2010. Transforming the Chinese Economy. 1. vydanie. Leiden: BRILL, 2010. 366 p. ISBN 978-90-04-18421-3.
4. Cai, Fang. 2011a. Hukou System Reform and Unification of Rural-urban Social Welfare. In China & World economy. ISSN: 1749-124X, 2011, vol. 19., no. 3, pp. 33-47.
5. Lau, Lawrence J. – Qian, Yingyi – Roland, Gérard. 2000. Reform without Losers: An Interpretation of China’s Dual-Track Approach to Transition. In Journal of Political Economy. ISSN: 00223808, 2000, vol. 108, no. 1. p. 120-143.
6. Lin, Justin Yifu – Cai, Fang – Li, Zhou. 2003. The China Miracle: Development Strategy and Economic Reform. Revised Edition. Hongkong: Chinese University Press, 2003. 387 p. ISBN 987-962-201-985-0.
7. Lin, Justin Yifu. 1992. Rural Reforms and Agricultural Growth in China. In American Economic Review. ISSN: 0002-8282, 1992, vol. 82, no. 1. pp. 34-51.
8. Portjakov, Vladimir Jakovlevič. 2002. Ekonomičeskaja reforma v Kitaje (1979-1999). Moskva: Institut Daľnevo Vostoka RAN, 2002. 178 s. ISBN 5-8381-0042-7.
9. Portjakov, Vladimir Jakovlevič. 2004. The Economic Reform Conception in China: Formation and Evolution. In China Report. ISSN 0973-063X, 2004, vol. 40, no. 4, p. 357-377.
10. Ramo, Joshua Cooper. 2004. The Beijing Consensus. In: Foreign Policy Centre. [online]. 11.5.2004. [cit. 26.11.2012]. Accessible on the internet: <http://fpc.org.uk/fsblob/244.pdf>
11. The Economist. 2008. China`s reform: The second long march. In: The Economist. [online]. 2008. [cit. 10.1.2013]. Accessible on the internet: < http://www.economist.com/node/12758848>
12. Wu, Xiaogang – Treiman, Donald J. 2004. The household registration system and social stratification in China: 1955–1996. In Demography, ISSN: 0070-3370, 2004, vol. 42, no. 2, p. 363-384.
Contact
Ing. Matej Buzinkai Department of International Economic Relations and Economic Diplomacy Faculty of International Relations University of Economics in Bratislava Dolnozemská cesta 1/b 852 35 Bratislava Slovakia E-mail: [email protected]

18
Anna Cyran
THE JAN KOCHANOWSKI UNIVERSITY IN KIELCE, POLAND LEGAL ASPECTS OF SENDING THE POLISH ARMY OUTSIDE TH E
COUNTRY SINCE 1989
Abstract The main task of the Polish armed forces is to defend the national territory against all types of threats (in case of peace and war) and ensure the safety of the citizens of the state. To achieve this goal the Polish army not only guards the borders of the Republic, but also regularly takes part in foreign missions of varied character. Key words: national law, international law, mission, army, Polish Army Types of foreign missions
After the end of the Cold War the character of foreign missions, which have been carried out since 1948, changed. The end of the global bipolarity meant that the parties of the conflicts, as well as foreign contingents taking part in them, are no longer controlled politically to the same extent as they used to be (ideological control of the army no longer exists). Other features specific to modern conflicts that involve the participation of the military in foreign missions are: ruthlessness of the actions of all the parties involved in war or crisis, lack of respect for the military act, human rights violations, activity of non-governmental organizations in the field of humanitarian aid on the vulnerable areas1. After 1989, sending the national contingents to the countries ruled by political chaos and instability, where danger of the outbreak of civil war (or conflict of a different nature) exists, seems to be the necessity. Like many other countries in the world, also Poland has been participating in missions, the aim of which is to promote international peace, as it is endangered wherever human rights are violated, democratic system does not exist or danger of affecting the territory by unauthorized people exists2. Peace operations can be divided into: missions with the use of preventive diplomacy, peacemaking, peacekeeping and peacebuilding missions. Furthermore, in the nomenclature associated with international security there is also a term of peace support operations and crisis response operations. The aim of both of these interventions is mainly to conduct peace operations, prevent conflicts and crises, as well as to bring humanitarian aid3. Peace missions can be considered in two ways: their aim is either to head off a crisis (preventive intervention), or to peacefully stabilize the areas that already have been covered by the conflict. Colin Gleenie, UN Resident Coordinator in Poland, at the conference “Polityka ONZ dotycząca misji pokojowych” ( “UN policy on peacekeeping missions”) in
1 Cz. Marcinkowski, Istota i ewolucja misji pokojowych ONZ, ”Przegląd Historyczny-Wojskowy”, 2011, No. 5 (238), page 8. cf. M. Narojek, Udział Rzeczypospolitej Polskiej w operacjach pokojowych (do 2001 roku), [http://sbn.republika.pl/misje.htm – access: 18.IX.2012]. 2 T. Hoffmann, M. ŚnieŜyński, Udział Polski w operacjach wojskowych i cywilnych Unii Europejskiej, [in:] Bezpieczeństwo i zarządzanie kryzysowe – aktualne wyzwania. Współczesne aspekty bezpieczeństwa i zarządzania kryzysowego, Łódź 2009, page 143-144; Polacy w słuŜbie pokoju (by Z. Bednarski), Ed. Gamb, Warsaw 2006, pages 7, 9-10. 3 G. Lisowski, Rola i zadania Sił Zbrojnych RP w systemie zarządzania kryzysowego państwa, [in:] Bezpieczeństwo i zarządzanie kryzysowe – aktualne wyzwania. Współczesne aspekty bezpieczeństwa i zarządzania kryzysowego, Łódź 2009, pages 72-74; M. Narojek, op. cit.

19
2004 said that “the UN Charter provided that in order to maintain peace and security in the world, all the members of the UN should grant to the Security Council the necessary forces and infrastructure.”4 As the diplomat noted, during the Cold War the military forces participating in peacekeeping operations were typically responsible for stationing on the endangered areas as a “buffer force”. After the collapse of the Soviet Union in 1991, the nature of peace operations under the aegis of the UN has changed. C. Gleenie explained that “in the new spirit of cooperation more modern and more numerous missions, implementing complex peace agreements between former participants of the civil war, had been created”5. Among others, the task of the army participating in peace missions is to support the local population, ensure respect for human rights in the vulnerable areas, support the affected country’s aspirations to democratize the political life, which in the future should lead to the holding of free election, as well as all the activities related to the preparation of the cadre – military training, integration of the veterans and reorganization of the police forces6. Due to the nature and type of the forces and means used, peace missions can be divided into two basic types: observation missions and missions involving military contingents7. The first type of missions is not participated in by regular army units, but only by unarmed military. Their function is mainly controlling the areas endangered with war, ensuring the compliance with certain conditions of a cease-fire or peace and also border patrolling and monitoring of the zones that were considered as demilitarized. This type of intervention was taken by the Polish side (the Polish People’s Army back then) in 1953 during the Korean conflict (NNSC). As a member of the International Commission for Supervision and Control (ICSC) Poland was obliged to watch the compliance of the provisions of the cease-fire by both sides. The Poles were also given the role of the observer during the conflicts in Laos and Cambodia (ICSC; 1954-1973), Nigeria (OTN; 1968-1970) and South Vietnam (ICCS, 1973-1975)8. The second type of peace missions – missions involving regular army in the form of national military contingents have very similar objectives (control of the war-threatened areas, monitoring and observance of the conditions of cease-fire) with one exception – the units sent to the areas covered by the mission are often the direct buffer between the two sides of the conflict. The Polish People’s Army was used for the first time for this type of intervention in 1973, in a peace operation UNEF II in Egypt, and a year later the Polish contingents were sent to Syria (UNDOF) in a similar role. Another example of the Polish Army’s participation in a peace mission is the NATO’s operation in Kosovo (KFOR) in 19999. Another type of foreign missions are humanitarian operations. Their aim is a widely understood help to residents of the conflict-affected or directly threatened areas. So far Poland has participated in several missions of this type, including in Ethiopia in the years 1985-1987 (operation TESFA) and in Saudi Arabia in 1991 (within the operation Desert Storm, during the First Persian Gulf War).
4 C. Gleenie, 50 lat udziału Polski w operacjach pokojowych i humanitarnych, 16.I.2004, [http://www.unic.un.org.pl/aktualnosci.php?news=444&wid=26&druk=1 – access: 15.IX.2012]. 5 Ibid. 6 Udział wojska w misjach stabilizacyjnych i pokojowych, Ministerstwo Spraw Zagranicznych, [http://www.msz.gov.pl/Udzial,wojska,w,misjach,stabilizacyjnych,i,pokojowych,9162.html – access: 17.IX.2012]. cf. M. Narojek, op. cit. 7 Cz. Marcinkowski, op. cit. pages 11-12. 8 B. Bieszyński, Zagraniczne misje Wojska Polskiego, ”Infos”, Biuro Analiz Sejmowych, 2008, No. 17 (41), page 1; More in: K. Gaj, J. Zuziak, Wojsko Polskie w międzynarodowych misjach pokojowych (1953-2011), ”Przegląd Historyczny-Wojskowy”, 2011, No. 5 (238), pages 22-43. 9 K. Gaj, J. Zuziak, op. cit. , pages 44-47, 66-67; B. Bieszyński, op. cit. , pages 2-3.

20
The Polish Army is also involved in policing missions. The objective of this type of operations is peace implementation through temporary, partial takeover of governance over the endangered areas in order to ensure their safety. Among others, an example of such mission with participation of the Polish Army is operation “Active Endeavour”, which has been conducted since 2005 in the Mediterranean Sea, consisting in the protection of this important traffic route (the Strait of Gibraltar region) against acts of terrorism and maritime robbery10. An important element of foreign missions are military operations. However, these are not always military interventions; they are often limited to stabilization only. Military missions are one of the elements of the European Security and Defence Policy (ESDP). Jan śmuda explained that “they showed an increasing military power of the EU and the ability to cooperate militarily and politically on a high-level. However, they are not combat missions. Union troops are most frequently used to maintain or enforce peace through their presence”11. Occasionally, military missions are called “peace-war” operations or “military-stabilization” operations. One of such operations is the intervention with the participation of the Polish military contingent in Afghanistan (within the ISAF forces) in 2004, as well as the participation of the Polish Army in operation “Iraqi Freedom” (known as the Second Persian Gulf War) in 2003, the aim of which was to topple the Saddam Hussein’s regime12. The participation of the Polish troops in foreign missions is connected with expenses, which must be borne by the state budget. These are significant expenses. It is estimated that in the years 2003-2008 the mission in Iraq has cost Poland about 1.1 billion PLN. Only in 2008 the funds allocated by the Polish government in connection with foreign operations in Afghanistan, Chad and Iraq amounted to 540 million PLN13. The Ministry of Foreign Affairs reports that by 2007 over 64 thousand soldiers and people working in the military had taken part in various foreign missions. The Poles participated in 66 operations, which were carried out in 39 countries14. More recent estimates report on 85 thousand of Polish people - soldiers, police officers and civilian personnel, who had been involved in foreign missions by 201115. Foreign missions and international law The maintenance of international peace and security is one of the statutory provisions of the UN Charter, which makes international missions gain legal force. The institution which defines the nature and tasks of each peace intervention is the UN Security Council16. C. Gleenie said that “after granting of the mandate by the Security Council, further guidance on the management over a peace mission is taken over by the UN Secretary-General, who also reports to the Council on the mission. Most of large missions are led by the Special Representative appointed by the Secretary-General. They are also supported by the Department of Peacekeeping Operations (DPKO), which was established in 1992.”17 In case of EU and NATO foreign operations, the decision is made by the Member States in the forum of the North Atlantic Council (for NATO) or the Council of the European Union (for EU).
10 J. śmuda, Rodzaje misji zagranicznych UE, [http://eup.wse.krakow.pl/?page_id=208 – access: 16.IX.2012]. 11 Ibid. 12 K. Gaj, J. Zuziak, op. cit., pages 68-74. 13 B. Bieszyński, op. cit. , page 2. 14 Udział wojska w misjach stabilizacyjnych i pokojowych… 15 Cz. Marcinkowski, op. cit., page 18. 16 Ibid, pages 8-9; Polacy w słuŜbie pokoju…, pages 9-10. 17 C. Gleenie, op. cit.

21
The legal basis for foreign missions carried out by the Polish Army within the UE is the so-called St. Petersburg Declaration signed on 19 June 1992 in Bonn by the members of the Western European Union. This document gave the WEU states the possibility of participation in international civil-military operations:
- humanitarian missions - stabilization missions - crisis missions18.
J. śmuda said that “the St. Petersburg Declaration was the result of political integration within the WEU, the aim of which was the expansion of stabilization and security in various regions of the world”. The EU foreign missions under the ESDP do not require a UN mandate, although in some cases, connected with the need of using military force, the participation in the mission has to be approved by the UN Security Council. J. śmuda explained, that “w rule was approved, according to which the EU missions will be carried out after the approval of the concerned states, except for a situation when a state is in chaos and does not have competent executive. The EU foreign missions under the ESDP are also conducted with the participation of countries which do not belong to the EU. In order to participate they have to make their own military and financial contribution”19. Even though the participation of the Polish Army in various foreign missions is mostly due to international connections and the Polish involvement in the structures such as NATO or the EU, each time the decision on sending (and withdrawing) of the Polish Army outside the country is made by the Polish government (the Prime Minister puts forward appropriate proposal to the President), which also sets the number of the forces to be sent and has final influence on their organization. After signing the decision on a foreign mission the head of the state is obliged to immediately inform the marshals of the Seym and the Senate about the fact.
The decision–making process related to the participation of military units in foreign missions is associated with the agreements concluded by international organizations, the highest authorities of the state administration and the management of the Ministry of National Defence, as well as the command of the armed forces20.
in order to use the army in foreign operations, four types of criteria should be met: legal, political, military and financial21. Participation of the Polish Army in foreign missions and the Polish Law
The Constitution of the Republic of Poland of 1997 states that “the rules of the use of the Armed Forces outside the Republic of Poland are specified by a ratified international agreement or law”22.
The document which regulates in detail the participation of the Polish Army in foreign missions in legal terms is the Act dated 17 December 1998 on the principles of using or staying of the Armed Forces of the Republic of Poland outside the country23.
The document indicates that staying of the Polish Army abroad can be related to:
18 M. Narojek, op. cit.; T. Hoffmann, M. ŚnieŜyński, op. cit., pages 144-145. 19 J. śmuda, Prawne podstawy misji międzynarodowych UE w ramach EPBiO, [http://eup.wse.krakow.pl/?page_id=207 – access: 15.IX.2012]. 20 W. Horyń, Współczesne zagroŜenia międzynarodowego bezpieczeństwa. Udział wojska polskiego w misjach poza granicami kraju, MON, Warsaw 2008, pages 7-8. 21 Ibid. 22 Konstytucja RP z 1997 r., ch. IV, Art.. 117, [http://www.sejm.gov.pl/prawo/konst/polski/kon1.htm – access: 16.IX.2012]. 23 Ustawa o zasadach uŜycia lub pobytu Sił Zbrojnych Rzeczypospolitej Polskiej poza granicami państwa z dnia 17 grudnia 1998 r., [http://www.abc.com.pl/du-akt/-/akt/dz-u-98-162-1117 – access: 14.IX.2012].

22
- its use due to war or in order to strengthen the forces of Poland or allied countries (intent to protect own interests or necessity to fulfil the alliance obligations); participation of the Army in a peace mission or an operation aimed at fighting terrorism24 and related risks.
- temporary stay of the armed forces on the territory of a foreign country due to trainings, military manoeuvres, rescue actions (except for maritime operations), exploration and humanitarian operations taking place there, as well as for the fulfilment of representative obligations.
The decision on the use of the Polish Army abroad is associated with the need to determine: the number of soldiers, the military equipment and weapons used, the names of the military units to which they belong, as well as the duration of service. Clarifying their objectives, the range of activities and the area of operation is also a necessity when deciding about sending the Army to a mission. In case of transit, the route and the time of the troops movement should also be specified.
The act also mentions the need for determining of controlling and commanding system of the units sent on a mission, or contingent submission to international organizations for the duration of the operation. For proper coordination between the military and civilians, administrative organs should cooperate with the authorities of competent international organization.
In foreign missions, involved are the soldiers who serve on active military service and the military personnel. Non-professional soldiers who want to go on a mission should, in certain cases, provide a written statement to the competent authority. It is not required in case of announcing general mobilization and during a war. Detailed rules of the employment of workers in military units sent to foreign missions are determined by the regulation of the Council of Ministers. It is also its responsibility to define the obligations and indicate the rights of non-professional soldiers, which is associated with legal regulations concerning the general defence obligation. In addition, the Council of Ministers has a decisive impact on financing of the Polish military contingent’s preparations for the mission – if it has not been included in the budget of the Ministry of National Defence. It also determines the amount of the soldier’s pay, as well as other financial and health benefits payable to soldiers. The document states that in the cases not regulated by the mentioned legal act, the Act on military service for professional soldiers dated 30 June 197025 maintains its legal force. The participation in foreign missions depends on their written consent, unless they are part of military units separated from the Armed Forces with the task of participation in a war; an allied intervention, a peace operation, an anti-terrorist operation, military manoeuvres, trainings, humanitarian, rescue and exploration operations or for representation purposes.
24 Z aktów prawnych regulujących udział Polaków stacjonujących na misjach zagranicznych w operacjach antyterrorystycznych moŜna wymienić m.in. postanowienie Prezydenta RP z 22 listopada 2001 r. o uŜyciu Polskiego Kontyngentu Wojskowego w składzie sił sojuszniczych w islamskim państwie Afganistanu, Emiracie Bahrajnu, Republice Kirgiskiej, Państwie Kuwejtu, Republice TadŜykistanu i Republice Uzbekistanu oraz na Morzu Arabskim i Oceanie Indyjskim. ref. T. Hoffmann, Udział Polski w walce z terroryzmem, Bezpieczeństwo i zarządzanie kryzysowe – aktualne wyzwania. Współczesne aspekty bezpieczeństwa i zarządzania kryzysowego, Łódź 2009, page 191. More in: Działania podejmowane w ramach współpracy międzynarodowej na rzecz przeciwdziałania terroryzmowi, [in:] K. Liedel, Zwalczanie terroryzmu międzynarodowego w polskiej polityce bezpieczeństwa, Ed. Difin, Warsaw 2010, pages 156-198. 25 Ustawa z 30 czerwca 1970 r. o słuŜbie wojskowej Ŝołnierzy zawodowych, [http://msp.money.pl/akty_prawne/dzienniki_ustaw/ustawa;z;dnia;30;czerwca,dziennik,ustaw,1970,016,134.html – access: 18.IX.2012].

23
The Act of 1998 specifies the principles on which the soldiers taking part in foreign missions serve in the Army. Any use of measures of compulsion must be made taking into account the guidelines included in the contracts concluded by Poland with the allies, as well as the observance of international law. With the start of the foreign mission the soldiers are subject to both Polish and international jurisdiction. They are also obliged to comply with the legal principles applicable in the country where they are stationed. These rules are valid in penal, order and disciplinary scope. The Act clarifies the situations in which a foreign contingent’s soldier, during a mission, can use means of coercion. In case of the threat of life and health or when self-defence is necessary, they are entitled to use firearms. It is also justified in case of willingness to prevent the planned acts (attacks), the purpose of which is to take someone’s life or health. These regulations should be applied both to protect their own contingent, the allied units and the civilians. Weapons can also be used against people who also hold arms and act passively on request for giving up. It is a threat to public order and security. It is restricted to attempt to collect weapons by force from people who have been given weapons legally (e.g. soldiers). In the face of such acts all the necessary coercive measures should be taken. They can also be taken when there is a risk of damaging or destroying of military equipment or other installations or facilities essential to the success of the mission, and, in some specific cases, because of the threat to civilian property. The soldier, while pursuing a criminal or the enemy, and also a suspect who is hiding, has the right to use the weapon, especially when the pursued person is suspected to be a threat to life and health of soldiers or members of the public (for example, the person has a weapon, dangerous equipment or explosives). The Act states that weapon must not be used against pregnant women, juveniles (under the age of 13), the elderly, the sick and disabled, unless the situation requires its use. Self-defence issues allow the soldiers to use coercive measures preventively. In the regular military operations or actions taken by the units and sub-units of the Army, the use of weapons is possible only after the order of the commanding officer. In all the described cases the use of weapons should be accompanied by the observance any and all precautions, and the shoot should be regarded, after using all means of warning, as the last step to achieve the goal of ensuring protection, safety of life, health and property. The document reads that “the use of weapons and other armament should take place in proportional intensity to the threat, with the smallest possible harm, and should not expose other people, especially civilians, to the danger of loss of life or health. If the situation allows and if it does not result directly from the aim of the task, the use of weapons or other armament against a person should not be aimed at taking the person’s life”26. The decision on which rules pertaining to coercive measures are in use by the soldiers stationing on the mission and which are necessary to achieve its objectives is made by the Minister of National Defence. The head of this department also determines the method of keeping the records related to the use of the aforementioned measures by the Polish soldiers. A lot of controversy has risen about the right to use coercive measures by the soldiers stationing abroad, as the understanding of the term “necessary defence” is a matter of judgement and depend on the point of view. Many moral problems are also associated with the pursuance of service duties (orders of the superiors) at all costs, even at the cost of victims. In 2007, the Polish soldiers shelled an Afghan village of Nangar Khel with machine guns and mortar grenades, which action became a cause celebre. As a result of this operation six people were killed (including women and children), and other three were injured. After returning to Poland the soldiers were accused of violating the law of war and participation in war crime (charge of civilian murder). The defenders of the soldiers argued that the shelling
26 Ibid.

24
of village was the result of bad recognition or faulty equipment, and the soldiers who took part in the action were only obeying orders. In 2012, three of the accused seven people were acquitted, and the case of the others will be re-examined by the Supreme Court27. The definition of professional soldier28 is included in the Act dated 11 September 2003 on military service for professional soldiers. According to the document “a professional soldier is a holder of a Polish citizenship, of good reputation, whose faithfulness to the Republic of Poland raises no doubt. This person has to have appropriate qualifications, as well as physical and mental predispositions for professional physical service. It was also explained that professional soldiers can serve permanent or contractual active military service”29. If necessary and if required by the interests of the Polish Army, professional soldier in active service can be transferred to the reserve in order to enable him to work in foreign organizations and international military structures. The conditions of the participation of the Polish soldiers in foreign missions are regulated by article 24 of the foregoing Act. It reads that the decision to send the Army abroad is made by the Minister of National Defence (appointments from the rank of colonel and above), or the Director of the Department of Defence. After nomination to serve on foreign mission, the authority responsible for directing the troops to the mission is the head of the General Staff of the Polish Armed Forces. In organizational terms, the soldiers serving the country on a foreign mission are subordinate to the authorities which have designated them to this mission (or the authority can be specified by the head of the Department of Defence). These authorities may be:
- the leader of the mission of an international organization or multinational forces; - the leader of a foreign institution; - the Polish representative of the military (at foreign organization or foreign military
contingent); - the foreign representative (recommended by the authorities of the foreign
organization or the foreign military contingent).
The soldiers who are staying outside the country on a mission have the following rights: the possibility to stay in a place of stationing together with the family members (spouse, children) and live with them in a residential unit rented at the expense of the Army (or receive equivalent amount of money). The children of the soldier staying on a foreign mission have the right for free education at all levels (up to high school), and the cost of their treatment, as well as treatment of other family members, is covered in full by the state, in which the military contingent is stationing. The soldiers are also provided with free travels to the places where they are on duty (and back), as well as with accident insurance. The entirety of responsibilities and rights attributable to the soldiers during foreign operations, as well as the procedures of directing and designating them for service outside Poland is governed by the regulations issued by the Council of Ministers. The participation in foreign missions is connected with the risk of losing of health or even life. All the compensations for losses suffered during the military service abroad are governed by the Act on veterans taking part in foreign missions dated 19 August 2011. The document states that “accident on a foreign mission should be understood as sudden
27Sprawa Nangar Khel: trzej Ŝołnierze niewinni, „Wprost”, [http://www.wprost.pl/ar/310848/Sprawa-Nangar-Khel-trzej-zolnierze-niewinni-czterej-beda-znow-sadzeni/ - access: 18. IX. 2012] 28 Ustawa z 11 września 2003 r. o słuŜbie wojskowej Ŝołnierzy zawodowych, [http://www.promotion.org.pl/oazwroclaw/prawo.htm – access: 19.IX.2012]. 29 Ibid.

25
occurrence, induced by an external factor, causing a health detriment”30. “Sudden occurrence” means: attacking the enemy (if the situation requires it or if the attack results from the superior’s orders) or defence against a hostile attack, assault (e.g. detonation of explosives), as well as other activities, the performance of which creates a risk of a health detriment. Taking into account the increased occupational risk taken by the soldiers on foreign missions, the Polish state also tries to meet their financial expectations. B. Bieszczyński wrote that “the soldiers serving abroad, especially in the areas covered by military operations, receive additional pay, which is often the equivalent of their salary”31. He added that average earnings of a soldier on the mission in Afghanistan amount to approx. 7 thousand PLN. Despite the risk to human life, which is connected with the participation of the Polish soldiers in foreign missions, many experts see it as an opportunity to retrofit and receive supplementary training of the Polish army. “It is expected that foreign military operations, considering the growing number of local conflicts, will gain on significance. The role of individual states in international politics will continue to depend on their activity in this field. You cannot participate in international military operations without a modern army”, notes B. Bieszczyński. As he explains, years of experience in sending the soldiers on foreign missions is an advantage of Poland. He also predicts that “the way in which this experience will be used is of fundamental significance. If it succeeds in modernizing our armed forces in a large scale, they will have a great chance to develop”32. Bibliography: Other legal acts regarding the use of the Polish Army on foreign missions:
- Regulation of the Council of Ministers of 27 July 1999 on detailed rules and procedures for financing, preparing and functioning of military units outside the country (Journal of Laws of 1999 No. 64, item 732);
- Regulation of the Council of Ministers of 1 October 1999 on detailed rules for the employment of workers in military units provided for use or stay outside the country (Journal of Laws of 1999 No. 80, item 906;
- Regulation of the Council of Ministers of 21 December 1999 on financial liabilities and benefits received by the soldiers assigned to serve outside the country and the military employees working in military units, performing tasks abroad (Journal of Laws of 1999 No. 110, item 1257);
- Regulation of the Council of Ministers of 12 February 2002 on detailed entitlements and obligations of non-professional soldiers serving outside the country (Journal of Laws of 1993 No. 16, item 150);
- Regulation of the Council of Ministers of 25 May 2004 on professional service outside the country (Journal of Laws of 2004 No. 140, item 1479);
- Regulation of the Minister of National Defence of 16 June 2004 on financial liabilities for professional soldiers on service outside the country (Journal of Laws of 2004 No. 162, item1698);
- Decision No. 169/MON of the Minister of National Defence of 2 June 2005 on the division of responsibilities in the scope of preparation, management and withdrawal of the Polish military contingents/ Polish military units in peace missions and multinational forces, as well as sending of the professional soldiers to
30 Ustawa z 19 sierpnia 2011 r. o weteranach działań poza granicami kraju, [http://prawo.legeo.pl/prawo/ustawa-z-dnia-19-sierpnia-2011-r-o-weteranach-dzialan-poza-granicami-panstwa/ - access: 19.IX.2012]. 31 B. Bieszyński, op. cit., page 2. 32 Ibid

26
serve duty outside the country in headquarters, commands of peace missions and multinational forces, and also as military observers and persons with the status of military observers on peace missions (Official Journal of the MoD of 2005 No. 21, item 270).
Contact
Dr. Anna Cyran The Jan Kochanowski University in Kielce ul. śeromskiego 5 25-369 Kielce Poland E-mail: [email protected]

27
Jiří Dušek Lubomír Pána
VYSOKÁ ŠKOLA EVROPSKÝCH A REGIONÁLNÍCH STUDIÍ, O.P.S.
EFFECTIVENESS OF NEGATIVE ELECTION CAMPAIGN IN THE
CONDITIONS OF THE CZECH REPUBLIC Abstract
This contribution aims to analyse the history, success rate and effectiveness of the negative election campaign as a tool of political marketing, including its impact on the political culture in the Czech Republic. In the Czech Republic, the use of negative political campaign is a relatively new and still exceptional way of conducting election campaigns, including the hiring of specialists from abroad. If this concept of "blackening" your opponent proves to be effective, it will be copied and used by other political parties as a part of their election campaigns. The impact on the political culture and trust of people in politics will be immense and it could reflect not only in lower election turnouts, but also in election results on both the national and local levels. Key words: Negative election campaign, Political culture, Political marketing, Political strategy, Voters.
Introduction
Negative advertisement belongs among popular forms of campaigning not only for political parties, but also for companies which try to differentiate themselves from their competition. They try to point out their competitive advantages and disadvantages of their opponents, whom they try to harm in this way. The importance of negative marketing campaigns has been rising since 2006 and it can be increasingly often observed in election campaigns for various elections (European elections, parliament elections, regional elections, municipal elections). Negative campaign is thus becoming a special characteristics of Czech political marketing which many political parties are counting on.
Frequent tools of negative campaigning are fabricated scandals, half-truths or compromising information about the counter-candidate. In this regard, media are playing a crucial role in the use of this method of political rivalry. The media communicate these scandalous, often fabricated half-truths to the public. According to many media analysts, the advantage of using a negative campaign is its obvious effectiveness – in other words, it works. On the other hand, there is the possible risk of damaging more yourself than your counter-candidate. It often happens that when a counter-candidate is accused of a sexual scandal, for example, he/she starts to appeal to the public for leniency and can be forgiven by the public, whereas the person who published the information may be accused of incorrect and unfair behaviour. The media are crucial in the use of negative campaign, above all tabloids. The reason is that scandals and personal problems are the main source of information for these media [SCHULZ, 2004].
Although some features of negative campaign already appeared in campaigns of political candidates in the 19th century, they cannot be considered a systematic, strategically planned and institutionalized use of negative campaigning. They were more crude attacking manoeuvres of politicians. Nevertheless, even in those times, attacking rhetoric aimed at a political rivals was relatively uncompromising and sharp. A certain level of negativism has been a part of politics since time immemorial, but institutionalization of negativism as a

28
political tool comes much later and is related to the spread of multimedia [BRADOVÁ, 2008].
Table 1 – An overview of mass media and approximate time of their origin
Mass media Approximate year of origin
Mass media Approximate year of origin
press 1500 TV 1950 records 1900 mobile phone 1973 cinema 1910 Internet 1990 radio 1920
[PAVLÍK, 2010]
The expansion of political marketing in other countries sometimes starts to be labelled as Americanization of election campaigns. According to the English researcher M. SCAMMELL [1995], it is possible to presume that movers and shakers of political campaigns all over the world will learn from experiences learned in the USA, the global leader in the field. However, the methods of adopting the American models will vary depending on the type of national political and media systems, culture, customs and tolerance of voters, parties and politicians.
Generally speaking, political advertisement has three main effects [KAID, 2004]: � informative effects, thanks to which voters receive information about a party or a
candidate, � emotional effects which focus on perception of candidates, � behavioural effects which affect electoral preferences.
Regarding possible harmful effects originating from using a negative campaign, political scientists mostly mention three possibilities [BRADOVÁ, 2008]:
� The Boomerang effect/Backlash effect – negative campaign produces more negative feelings towards the originator of the campaign than towards the counter-candidate who is supposed to be the target of the campaign. A campaign used against a political rival thus can turn as a boomerang towards the originator.
� The Victim Syndrome – The campaign invokes in voters a feeling of foul play and raises in them more positive than negative feelings towards the attacked candidate. In the eyes of the voters, the attacked candidate will give the impression of a victim of an attack, i.e. the campaign has contra-productive effect on the originator of the campaign.
� The Double Impairment Effect – negative campaign raises negative feelings both towards the counter-candidate and the originator/sponsor of the campaign.
A useful tool of permanent campaigns thus are communication skills, especially public relations (PR). Simple political advertisement is not enough for political parties. In order for their product to be successful, they have to use all multimedia possibilities available to them. Public relations departments of political parties focus on the internal party public and the external public, i.e. potential voters, as well as on the public as a whole, with the objective of gaining understanding and trust. In a developed democratic political system, political parties use these tools and forms of PR to achieve success in the creation of public opinion [BRADOVÁ, ŠARADÍN, 2007]. History of negative campaigning in the Czech Republic
In former Czechoslovakia, the strategy of political marketing was first used by Americans who were helping with the campaign for Civic Forum (Občanské fórum, OF). At

29
that time, consultants from both the Republican and the Democratic party flew to the Czech Republic. However, in the euphoria after the Velvet revolution in November 1989, no one was able to work as the Americans wanted. A commentator of the Czech magazine Reflex, Bohumil Pečinka, commented in his book Cesta na hrad (Journey to the Castle) with these words: “They flew back to the USA even before the start of the campaign, with the feeling that no one wanted to listen to them and learn anything from them.” Since then, attempts at targeted marketing have appeared more and more frequently. The Civic Democrats used it in elections of 1992, but the pioneers were the Social Democrats. In elections of 1996 and 1998, they had a Czech election manager and a hired strategist. However, data from opinion surveys were analyzed by employees of an American agency. In regard to the massive use of marketing, parliamentary elections in 1996 stand out as a good example. Among other things, also because the media and the public started to perceive that there is such a thing as political marketing [FOJTŮ, 2009].
In Czech election campaigns, negative campaign did not start to appear on a bigger scale until 2006, when the Social Democrats changed from the Czech consultancy agency Crane Consulting to the American consultancy company Penn, Schoen & Berland (PSB), which professionalized the election campaign and helped the Social Democrats to win the second place in the elections. The PSB agency had helped in the re-election of Bill Clinton into the presidential office; among its other successes are multiple election wins of Hillary Clinton for the post of New York senator, or the historic success of Tony Blair, whom PSB helped to get third prime minister mandate in 2005.
It seems that since 2006, negative campaigning has established itself to such a degree that the public perceive it as a natural part of a campaign. There were plenty of attacks even in previous elections but they were not as systematic in their nature as the parliament elections in 2006 were. During the 1990s, we could see a certain form of negative campaign from the side of Czech media, where right-leaning parties were purposefully (for historic reasons) preferred to left-leaning parties which were very often portrayed in a negative light. During the campaign before regional and senate elections in 2000, we could see first signs of a more systematic negative campaign in a coalition of 4 parties, consisting of KDU-ČSL (Christian and Democratic Union – the Czechoslovak People’s Party), US (Freedom Union), DEU (Democratic Union) and ODA (Civic Democratic Coalition), which systematically attacked the opposition agreement between the Social Democrats and the Civic Democrats. After its break-up, the rhetoric was taken over by another coalition in a lead-up to parliament elections in 2002 [ŠARADÍN, 2008]. The most notable slogan of this election campaign was a billboard with the text “Vote for ODS (the Civic Democrats) or the ČSSD (the Social Democrats), we [ODS/ČSSD] will somehow make a deal...”.
In 2006, negative campaign was used to a much higher extent (thanks to the use of hired foreign advisors), mainly by the two biggest parties – the right-leaning ODS and the left-leaning ČSSD. ODS prepared for its campaign negative funny video clips with Indiana Jones wearing the slogan “ODS plus” and successfully walking through a socialist cave, as well as a Black book of sins committed by ČSSD. ČSSD followed with a negative campaign called “ODS minus”. It mainly consisted of a series of billboards and posters drawing attention to consequences of suggestions made by ODS and also containing positive solutions suggested by ČSSD. Importantly, focus was placed on the fact that ODS wants to favour rich business people and disadvantage common people. This campaign was called “ODS minus”. The outcome of 2006 Czech parliament elections showed disproportionate features brought into the election legislative by opposition-contract reforms and ended up in a deadlock – the right-leaning block and the left-leaning-block both got 100 MPs. An unprecedented period of government crisis and negotiations leading nowhere followed and lasted until January 2007.

30
Figure 1 – Example of a standard and a negative 2006 election campaign
Negative campaign was also used in elections into regional councils in 2008. Whereas
most parties focused on local and regional topics, the Social Democrats (ČSSD) used national topics, thanks to which they became the election winners in all 13 regions. The other parties were running a positive campaign (the used slogans such as “A vote for the quality of life” (the Green Party), “Calm power” (the Christian Democrats), “We have a solution” (the Communists), “With reason and heart” or “We proved that we can manage” (the Civic Democrats) etc.). Again, ČSSD bet on a negative campaign, where it mainly confronted itself with ODS. Its main slogan was “Sentenced to a reform”, which was a follow-up to the previous negative campaign “ODS minus” [BORGIS, 2008].

31
Figure 2 – Example of a negative 2008 election campaign
Negative campaign was also used in 2009, when it was first started by ODS in the
lead-up to European Parliament elections. ODS launched a web-site called “ČSSD against you” referring to the web page of ČSSD and showing a number of mocking remarks and materials aimed at important members of ČSSD on web pages of ODS. ČSSD reacted with a counter-attack, when it commissioned billboards attacking members of ODS.
In autumn of 2009, premature parliament elections were about to be held in the Czech Republic, which would shorten the fifth election period of the Czech parliament. The shortening of the election period should have been enabled by means of passing a one-off constitutional law No. 195/2009 Code on Shortening of Fifth Election Period for Czech Chamber of Deputies. However, this constitutional law was cancelled by the Constitutional Court on 10th September 2009 and the date of Parliament elections was moved from the year 2009 to 2010. The cancellation of 2009 elections effectively led to an exhausting election campaign which was running from the middle of 2009 until elections on 28th -29th May 2010. The fact that this was indeed a difficult and exhausting campaign can also be seen on the fact that even ODS hired a foreign election advisor for the first time, namely Arthur Finkelstein, a political consultant and an advocate of hard negative political campaigning. Among others, Arthur Finkelstein helped in election campaigns of American presidents Nixon and Reagan; lately he has lead election campaigns for conservative parties in Bulgaria, Romania, Austria or Serbia.
Table 2 – Official and unofficial expenditure on 2010 parliament elections Political party
Official expenditure on 2010 parliament elections (mil. CZK)
Unofficial expenditure on 2010 parliament elections (mil. CZK)
ČSSD 308 500 ODS 168 290 TOP09 30 66 KSČM 36 9 VV 10 87
[MACHOVÁ, 2010, own research]
A new phenomenon of these elections was the first-time massive use of social networks. As a specific example of a negative election campaign can be seen the election campaign of ČSSD against ODS and TOP 09, when ČSSD commissioned billboards comparing ČSSD with ODS and TOP 09, where the two right-leaning parties were displayed in dark colours with the title “The past – Advantages for the privileged only” [11].

32
Figure 3 – Example of a negative 2009 election campaign
As a result of disgust of voters with the aggressive and permanent election campaign,
political scandals, corrupt behaviour and clientelism, several non-party initiatives came into existence before the 2010 elections which, thanks to their well thought-out marketing and media attention managed the impossible – to exchange 114 out of 200 members of parliament. The two biggest traditional Czech parties ODS and ČSSD suffered major losses, when voters markedly often did not vote for politicians connected with obscure corrupt environment in the Czech Republic, even though they were nominated as top candidates by their parties. Disappointed voters refused the behaviour and politics not only of specific political parties but also of specific politicians. Who profited from this were new political parties TOP 09 and Věci veřejné (the Public Affairs Party).
Figure 4 – Example of a negative 2010 election campaign
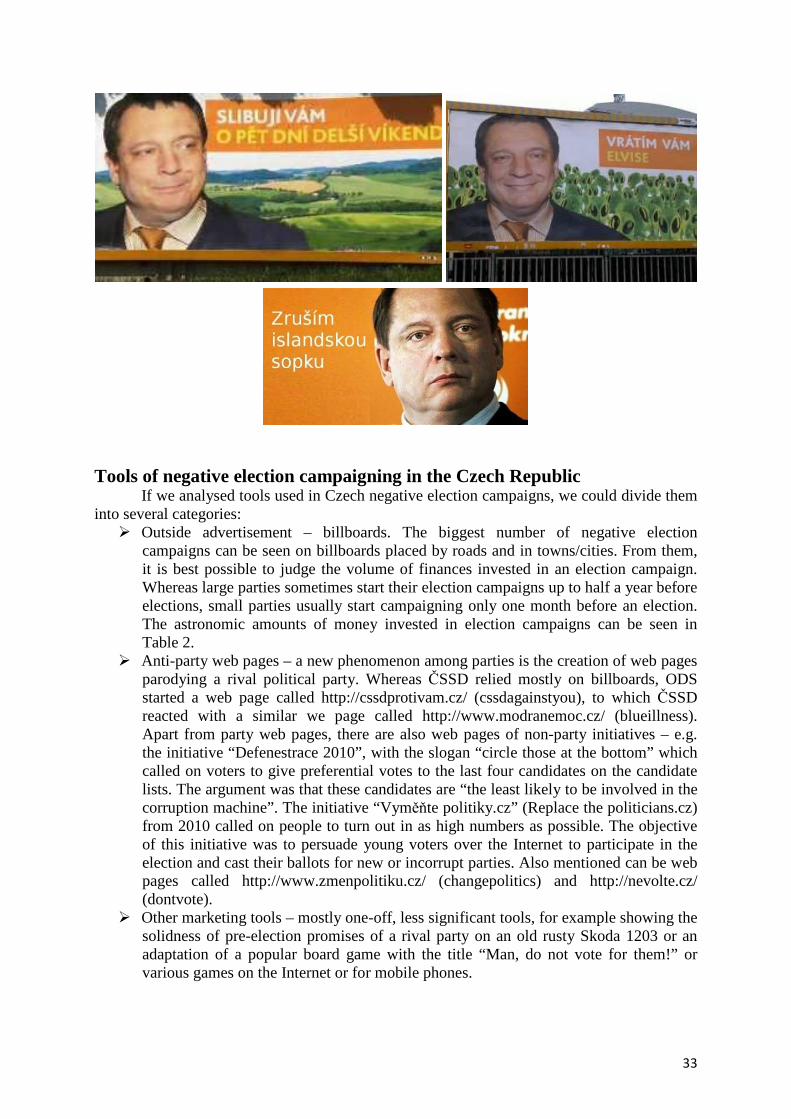
33
Tools of negative election campaigning in the Czech Republic
If we analysed tools used in Czech negative election campaigns, we could divide them into several categories:
� Outside advertisement – billboards. The biggest number of negative election campaigns can be seen on billboards placed by roads and in towns/cities. From them, it is best possible to judge the volume of finances invested in an election campaign. Whereas large parties sometimes start their election campaigns up to half a year before elections, small parties usually start campaigning only one month before an election. The astronomic amounts of money invested in election campaigns can be seen in Table 2.
� Anti-party web pages – a new phenomenon among parties is the creation of web pages parodying a rival political party. Whereas ČSSD relied mostly on billboards, ODS started a web page called http://cssdprotivam.cz/ (cssdagainstyou), to which ČSSD reacted with a similar we page called http://www.modranemoc.cz/ (blueillness). Apart from party web pages, there are also web pages of non-party initiatives – e.g. the initiative “Defenestrace 2010”, with the slogan “circle those at the bottom” which called on voters to give preferential votes to the last four candidates on the candidate lists. The argument was that these candidates are “the least likely to be involved in the corruption machine”. The initiative “Vyměňte politiky.cz” (Replace the politicians.cz) from 2010 called on people to turn out in as high numbers as possible. The objective of this initiative was to persuade young voters over the Internet to participate in the election and cast their ballots for new or incorrupt parties. Also mentioned can be web pages called http://www.zmenpolitiku.cz/ (changepolitics) and http://nevolte.cz/ (dontvote).
� Other marketing tools – mostly one-off, less significant tools, for example showing the solidness of pre-election promises of a rival party on an old rusty Skoda 1203 or an adaptation of a popular board game with the title “Man, do not vote for them!” or various games on the Internet or for mobile phones.

34
Figure 5 – Other tools of negative election campaigning
Conclusion
In the last 6 years, the use of negative election campaigns has become an integral part of election campaigns in the Czech Republic on all levels. It makes election campaigns substantially more expensive and reduces the popularity not only of political parties, but also of all constitutional institutions. Another worrying trend is the vulgarization of campaigns and the significant deterioration of political culture across the political spectrum. Political parties “throw dirt” at each other, which distracts them from solving real problems. This leads to generalization of election topics, with no offer of specific solutions, and to populism in some political parties. The deterioration of political culture also leads to lower election turnouts and to growing disinterest and apathy of voters towards politics. A change in this regard was brought by non-party initiatives before the 2010 election, when 57% of existing members of parliament were replaced. Disappointed voters refused the behaviour and politics not only of specific political parties, but also of specific politicians. Who profited from this were new political parties.
But let us return to the contents of negative campaigns and to the tools used in them. It is obvious that not all features used in elections in the USA or in Great Britain can be successfully applied in the Czech Republic. For example, when ODS copied the concept of David Cameron (Great Britain) with rolled-up sleeves, it had no significant impact in the Czech Republic. In regard to the use of negative campaigns, the clear leader is ČSSD which not only hired a foreign consultancy company called PBS, but also invests the most money in election campaigns. The reason behind this can be its role as political opposition. Thanks to the volume of money invested in the 2010 election campaign, it managed to negotiate exclusive rebate conditions with advertisement agencies – 75% discount on outside advertisements and almost 90% on printed advertisements. The intensity of negative campaigns is also negatively influenced by pre-election surveys, for example in the case of predicted deadlocked results. So far, in no political party in the history of the Czech Republic has the amount of negative campaigning exceeded the amount of positive campaigning, although ČSSD came close to 50% in the 2010 elections.

35
Even though negative campaigning plays an important (some may even say an indispensable) role, it should not be overrated. In the Czech Republic, some elections are taking place almost every year; the year 2010 was sometimes called a “super election year” when three elections took place – general elections, municipal elections and senatorial elections. For the year 2014, four elections are scheduled in the Czech Republic. The higher frequency of elections and the use of negative campaigning will probably lead to a higher and higher professionalization of election campaigns, where renowned foreign specialists are hired to manage the elections. In conclusion, it should be noted that every political party should possess a sufficient amount of self-reflection and if it is unable to correctly analyze election results and does not learn for the future, the next elections can turn out to be a disaster, which can even signal its possible departure from the political scene. This can be shown on the example of several smaller political parties. In this case, not even negative campaigning against other parties will help.
Literature: 1. BRADOVÁ, E., et al. Negativní kampaně a politická reklama ve volbách.
Olomouc : Periplum, 2008. 136 pgs. ISBN 978-80-86624-44-0.
2. BRADOVÁ, E., ŠARADÍN, P. Permanentní kampaň a proces vládnutí: politika v éře konzultantů. In ŠARADÍN, P. (eds.). Politické kampaně, volby a politický marketing. Olomouc : Periplum, 2007. 142 pgs. ISBN 978-80-86624-36-5.
3. ČSSD oprášila kampaň "ODS mínus" s názvem "ODSouzeni k reformě" [online]. Praha : Borgis, 2008, 11.4.2008 [cit. 28.9.2012]. Available at WWW: <http://www.novinky.cz/domaci/137449-cssd-oprasila-kampan-ods-minus-s-nazvem-odsouzeni-k-reforme.html>.
4. FOJTŮ, M. Historie a zajímavosti politického marketingu [online]. Brno : Masarykova univerzita, 2009, 29.10.2009 [cit. 25.9.2012]. Available at WWW: <http://www.online.muni.cz/tema/1613-historie-a-zajimavosti-politickeho-marketingu->.
5. KAID, L. L. (eds.). Handbook of Political Communication Research. London : Lawrence Erlbaum Associates, 2004. 560 pgs. ISBN 978-0805837759.
6. MACHOVÁ, M. Nová hodnota kampaní: ČSSD za 500, ODS za 290 milionů [online]. Praha : Aktuálně.cz, 2010 [cit. 28.9.2012]. Available at WWW: <http://aktualne.centrum.cz/domaci/politika/clanek.phtml?id=673910>.
7. Negativní kampaně táhnou. Ale nesmí se to s agresí přehnat" [online]. Praha : Mafra, 2009, 31.8.2009 [cit. 29.9.2012]. Available at WWW: <http://www.lidovky.cz/negativni-kampane-tahnou-ale-nesmi-se-to-s-agresi-prehnat-pea-/ln_domov.asp?c=A090831_112356_ln_domov_mel>.
8. PAVLÍK, J. Sedmé masmédium [online]. Desná : Java Micro Edition, 2010, 14.9.2010 [cit. 25.9.2012]. Available at WWW: <http://jme.jpweb.cz/sedme-masmedium>.
9. SCAMMELL, M. Designer Politics. How Elections are Won. Basingstoke : Palgrave Macmillan, 1995. 354 pgs. ISBN 978-0333586723.

36
10. SCHULZ, W. Proces politické komunikace: vymezen problémů a kladení otázek. In SCHULZ, W., REIFOVÁ, I. (eds.), et al. Analýza obsahu mediálních sdělení. Praha : Nakladatelství Karolinum, 2004. pgs. 26.
11. ŠARADÍN, P. Česká republika a Slovensko: Dvojí cesta k negativní reklamě? In BRADOVÁ, E. (eds.): Negativní kampaně a politická reklama ve volbách. Olomouc : Periplum, 2008. pgs. 45-57. ISBN 978-80-86624-44-0.
Contact
Ing. Jiří Dušek, Ph.D.
Katedra managementu a marketingu služeb Vysoká škola evropských a regionálních studií, o.p.s. Žižkova 6 370 01 České Budějovice Česká republika E-mail: [email protected] doc. Dr. Lubomír Pána, Ph.D. Katedra společenských věd Vysoká škola evropských a regionálních studií, o.p.s. Žižkova 6 370 01 České Budějovice Česká republika E-mail: [email protected]
37
Jaroslava Ester Evangelu
FACULTY OF ECONOMICS AND MANAGEMENT UNIVERSITY OF DEFENCE, BRNO
DIFFERENT APPROACHES AND SOLUTIONS OF CZECH AND
GERMAN MANAGERS IN INTERCULTURAL STRESSFUL SITUATIONS
Abstract Shortly after joining the EU, we decided to conduct research focused on investigation similarities and differences in dealing with intercultural differences in interpersonal communication on representative sample of Czech and German managers. The research consists of three stages, which was attended by a total of 240 respondents (180 respondents completed the research). Based on the results of the research were created several specialized workshops. Managers looked for synergistic approach in dealing with intercultural conflict situations. Our aim is to manage control research that addresses the question of whether in the course of evolution of the situation in the time, which approach was changed more - Czech or German managers. Key wodrs: Research, G. Hosfstede, hypothesis., cultural standards.
Shortly after joining the EU, we decided to conduct research focused on investigation similarities and differences in dealing with intercultural differences in interpersonal communication on representative sample of Czech and German managers. The research consists of three stages, which was attended by a total of 240 respondents (180 respondents completed the research). Based on the results of the research were created several specialized workshops. Managers looked for synergistic approach in dealing with intercultural conflict situations. Our aim is to manage control research that addresses the question of whether in the course of evolution of the situation in the time, which approach was changed more - Czech or German managers. After joining the EU much more foreign companies begun to establish themselves in our country. Those who implemented the intercultural management found themselves in an unexpected communication problems. Clashes which managers from the intercultural teams had to solve against „single cultures“ have grown on intensity Open minded could think that the reasons are logical and trivial. As the work psychologists - we have found out in deeper analysis that the more clear problems have appeared in the communication groups across the company in management, motivation and classification. The real essence of the problems was latent – hidden communication problems. They were not openly discussed for various reasons: due to an influences and a status of various managers with which the problems have arisen, from the endeavour to enforce the „functioning“ methods of solutions from their native country, from the unfamiliarity of the cultural differences etc. As the requests wishing to solve these situations have appeared more often, we decided for their systematical clarifying and looking for existing regularities which could lead to the fundaments of professional and goal-directed educational program. We have defined the main parameters of the most frequent customers of past year and we reached for our important target group: Czech-German machinery companies. We decided to conduct the research just on them. As the main target of our research we have set up to find out the accords in solving and coping the intercultural communication differences on a chosen example of Czech and

38
German managers. As a follow-up targets of the research we have planned to compare presentation of intercultural purviews in a multicultural process in a group of Czech and German respondents and then compare obtained data with those ones obtained in a likewise specialized research projects. In defining the assumptions and utilizing the research methods (mainly the projective ones) we started from the popular theory of G. Hofsted, with regarding to its competent critical reviews. His five characteristics have served us as a diagnostic instrument for surveying positions of Czech and German cultures, eventually combinations of their placement in existing domain. We have achieved assumption in aid of our existing experience, in regards to the most frequent problematic situations from work experience and findings from similar research projects. We have defined one hypothesis to each Hofstede´s characteristics which we then have tested in our research: H1 We assume that clashes in a mutual communications among Czech and German managers are caused by a different view on keeping accepted norms , rules, executed schedules and to an ability to communicate unambiguously and clearly (small/big effort to avoid the risk). H2 We assume that Czech managers accentuate to those manager´s attributions (concerning influence and direction), which show the need of good relations, German managers accentuate to a dynamic and goal-seeking behavior (small/big distance from the power positions). H3 We assume that Czech manager in a communication process markedly tries to avoid conflicts and market depends on a relation net in solving the problems, German manager asserts his own responsibility, he is not afraid of going into conflict and affect current relations. H4 We assume that Czech managers assert on mainly such called feminine values (bearing on social relationships, disposition to a sympathetic behavior, modesty and compromises), German managers are markedly oriented to such called masculine values (bearing on accomplishment, firmness, success, assertive tendencies), (ascendancy on feminine/masculine values). H5 We assume that the importance of the term „effective manager“ is understood from the side of Czech managers as a distinctive specialist in branch with an ability to solve creatively (operatively) the unexpected problems, from the side of German managers as a verbally skilled worker oriented to a along termed goals with a wide range of skills from various branches. (Short termed/long termed orientation and the way of views on the own social role).
We have divided our research to three differently specialized stages, which concurred to each other and gave us chances to specify efficiency of used methods and allowed us to capture big amount of case studies. For the research we have used quantitative and qualitative methods. We have carefully chosen respondents to three periods, parameters as the length of managers´s job, length of the job in the multicultural company, length of residence in the Czech environment etc. were among criteria. In sampling the research methods at the German managers we have capitalized on the knowledge of one of the members of the research team, who used to be an expert in culturology and had lived in Germany for twenty years. By this we have empowered the managers to use their native language and catch a very delicate nuance during communication. In the first period the main method was an open dialogue and observation. We have found there the critical situations which then have served to create questionnaires and projective methods. Simultaneously we have reached the most frequent words, which we then used in the following periods utmost – we have embedded them to questionnaires, half structured interview etc. Such called critical situation looked like too noticeably.
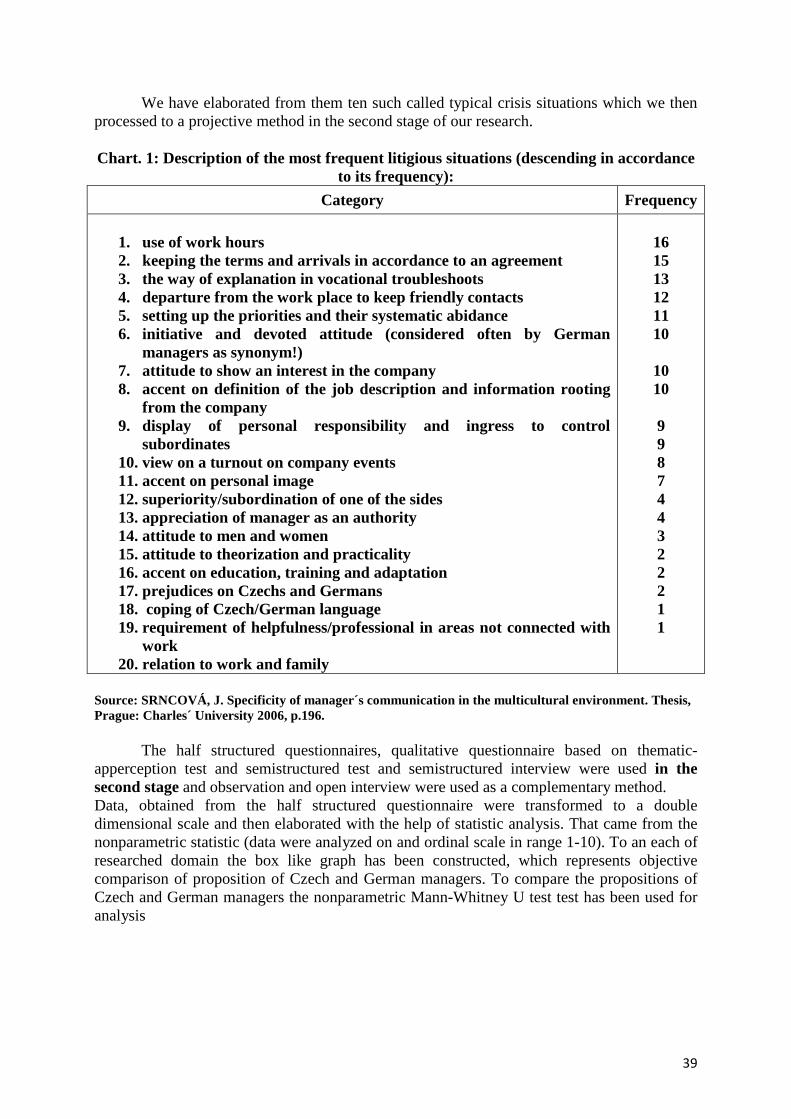
39
We have elaborated from them ten such called typical crisis situations which we then processed to a projective method in the second stage of our research. Chart. 1: Description of the most frequent litigious situations (descending in accordance
to its frequency):
Category Frequency
1. use of work hours 2. keeping the terms and arrivals in accordance to an agreement 3. the way of explanation in vocational troubleshoots 4. departure from the work place to keep friendly contacts 5. setting up the priorities and their systematic abidance 6. initiative and devoted attitude (considered often by German
managers as synonym!) 7. attitude to show an interest in the company 8. accent on definition of the job description and information rooting
from the company 9. display of personal responsibility and ingress to control
subordinates 10. view on a turnout on company events 11. accent on personal image 12. superiority/subordination of one of the sides 13. appreciation of manager as an authority 14. attitude to men and women 15. attitude to theorization and practicality 16. accent on education, training and adaptation 17. prejudices on Czechs and Germans 18. coping of Czech/German language 19. requirement of helpfulness/professional in areas not connected with
work 20. relation to work and family
16 15 13 12 11 10
10 10 9 9 8 7 4 4 3 2 2 2 1 1
Source: SRNCOVÁ, J. Specificity of manager´s communication in the multicultural environment. Thesis, Prague: Charles´ University 2006, p.196. The half structured questionnaires, qualitative questionnaire based on thematic-apperception test and semistructured test and semistructured interview were used in the second stage and observation and open interview were used as a complementary method. Data, obtained from the half structured questionnaire were transformed to a double dimensional scale and then elaborated with the help of statistic analysis. That came from the nonparametric statistic (data were analyzed on and ordinal scale in range 1-10). To an each of researched domain the box like graph has been constructed, which represents objective comparison of proposition of Czech and German managers. To compare the propositions of Czech and German managers the nonparametric Mann-Whitney U test test has been used for analysis

40
Picture.1: Example of graphic comparison of expressions of Czech and German managers at H1
Source: SRNCOVÁ, J. Specificity of manager´s communication in the multicultural environment. Thesis, Prague: Charles´ University 2006, p. 277. From the results of this graph arises that the Czech manager doesn´t prefer keeping the rules or even doesn´t have a need to mind norms and schedule, he is satisfied with operative and time consuming situations. German manager is appreciated as a man who keeps the detailed keeping of norms, still controls and wants to have an overview. German manager has a similar opinion: sees his „own“ German colleagues as a precise, faithful, concrete; conversely Czech managers takes as not very precise,
Opinions of Czech manager on:
P
r
o
p
o
s
i
t
i
o
n
s
d
i
m
e
Czech manager German manager
Opinions of German manager on:
P
r
o
p
o
s
i
t
i
o
n
s
d
i
m
e
On Czech On German

41
unforeseeable, with doubtful expression. Both groups of managers have the exactly same opinion on this dilemma. All assumptions of the research are elaborated in a similar way, with more exact expression and quoted annotation. Another pivotal method form the second stage of our research was the qualitative questionnaire based on a thematic-apperception test. Picture. 2: Example of one picture (one from ten) of qualitative questionnaire based on
thematic-apperception test
Man – workshop supervisor comes to a hall where all work behind their machines, only two workers chat. What manager says about it?
Source: SRNCOVÁ, J. Specificity of manager´s communication in the multicultural environment. Thesis, Prague: Charles´ University 2006, p. 262. The whole qualitative questionnaire contains of ten pictures with the next issues: 1. Man – workshop supervisor comes to a hall where all work behind their machines, only
two workers chat. What manager says about it? 2. Worker comes to the gatehouse, perhaps he comes late again. What is the reaction of
German manager and the Czech one? 3. The deadline for submissions of the order is not kept, manager needs an explanation. 4. Manager is passing by the canteen and sees two of his subsidiaries chatting there out of
the regular break. 5. Secretary is in a time pressure, doesn´t keep the dead line, but is seen watering the
flowers. 6. Manager received the conclusion on the continuance of an order, he is not satisfied and
asks presents for suggestions for improvement. 7. Four people stand in front of the call board where are displayed the shots from the
company event, photos of employees, graph of profit. Manager passes by, hears their conversation. What are they talking about?
8. Manager returns earlier from the training and sees two of his employees in a friendly chat. How does he react? What does he tell them?

42
9. Accountant leaves during work hours from the office. Why – what is your experience? 10. Only half of the employees turned out at the company´s party. You are beginning with the
speech, how will you comment on it?
Critical situation from the questionnaire served to control the results from the assumption testing but we also planned to reach the most frequent shade of the communication act of the Czech and German managers. For the comparison we have used the Bales´ system of observing categories and statistic analysis. During processing of data we have divided the propositions into groups called „propositions of Czech managers“ and „propositions of German managers“. Then we have divided them in accordance with their emotional shade, created for the Bates´ system of observing categories. From the results of the second stage of our research emerged the following conclusions: „H1 results confirmed, that Czech manager has a small disposition to avoid the risk, German manager has a high disposition to avoid the risk; both groups apprehend this issue same way; H2 results confirmed, that Czech manager apprehends the small distance from power position, German manager apprehends the big distance from power position; both groups apprehend this issue same way; H3 results confirmed, that Czech manager uses the high scale of collectivism in action, German manager prefers individualism in action; both groups have a same view on this issue; H4 results confirmed, that Czech manager prefers feminine values in action, German managers prefer masculine values; both groups have same view on this issue; H5 results have unapproved unambiguously defined hypothesis: Czech manager supports the opinion that Czech and Germans have the same attitude – they orientate themselves to a long term attitude; German manager supports the opinion that Czechs are very ambiguous in their expression“.
Results of the qualitative questionnaire and semistructured questionnaire confirmed eminently the results of tested hypothesis. We have stepped up to the third leg of the research after reading the expert literature concerning the similar researches from the past years. After studying it we have found out that our results from H5 are different. So we submitted propositions of the Czech and German workers to the Czech and German managers and let them subsume to Bates´ scale. For the purpose of control we have let to work on the same task their subsidiaries – results of managers and subsidiaries coincided again with the conclusions from second stage of the research. Results of the whole project have pointed on a different view of cultural norms in a group of Czech and German managers. It is a group of workers on which the success of cooperation and its long termed aim, fulfilling of strategic plans depend. Even if our group contained respondents who could communicate well in one language (German) it didn´t mean an automatic understanding and comprehension. For that it´s necessary to know the culture and mainly its different aspects which cause such called communication distances of two cultures. The results of the research have been used to a long termed educational project for multicultural companies. Goal-directed courses and workshops were created on its base, their aim is to connect both cultures and streamline mutual communication, especially on leading positions. Currently, we plan to repeat this research and find out, if the behavior of both managers´ groups based on a many years of cooperation have changed, if more positive understanding and appreciation happens and if so, we are going to move to a direction of mutual tolerance.
43
Contact
Mgr. et Mgr. Jaroslava Ester Evangelu, Ph.D. Department of leading human resources Faculty of economy and management University of Defence Kounicova 156/65 662 10 Brno Czech Republic E-mail: [email protected]

44
Janusz Falecki
THE JAN KOCHANOWSKI UNIVERSITY IN KIELCE, POLAND
SELECTED ELEMENTS OF THE POLISH ARMED FORCES’ SUPPORT FOR CIVIL AUTHORITIES IN COMBATING AND
ELIMINATING THE EFFECTS OF NON-MILITARY THREATS Abstract The primary mission of the Polish Armed Forces in time of peace is to support civil authorities in combating and eliminating the effects of non-military threats. The legal grounds for the implementation of this mission are dispersed in a number of acts and regulations resulting from them and do not constitute uniform regulations. The Polish Armed Forces can be used to support civil authorities in counter-terrorism operations and maintenance of public order, search and rescue operations, in situations that require the use of specialized equipment, as well as cleaning the area from the explosive and dangerous objects of military origin and their neutralization, to monitor and evaluate the non-military threats’ effects, liquidate chemical and radioactive contamination, repair and reconstruction of destroyed technical infrastructure and ensure openness of routes, counteract epidemics, hygienic and sanitary actions, give first aid and eliminate biological contamination and infections, moreover to evacuate people and property and to protect the area during the non-military threats. Key words: non-military threats, support of civil authorities, Armed Forces of the Republic of Poland.
The Polish Armed Forces participate in a national crisis management system, constantly developing its ability to assist the relevant public authorities and the society in the event of natural disasters, man-made disasters and terrorist threats1. An efficient implementation of these tasks requires not only legal grounds that would be adequate to current threats, but also pre-defined tasks of interaction with the non-military subsystem, government and local government authorities as well as the relevant procedures of the use of allocated forces of the Armed Forces of the Republic of Poland. What is also crucial is to allocate all the possible to employ forces and means in accordance with the potential that the Polish Armed Forces have, their training, maintain the proper operating condition and provide additional equipment taking into account the need to combat and eliminate the consequences of non-military threats2.
The legal grounds of the civil authorities support in combating and eliminating the effects of non-military threats and the range of tasks performed by the Polish Armed forces are contained in the acts on: state of emergency, natural disaster, crisis management, the
1 Por. Strategia Bezpieczeństwa Narodowego Rzeczypospolitej Polskiej, Warszawa 2007, p. 25. 2 A non-military threat is a type of a threat, where there occurs a danger of a situation which causes human and material losses, destabilization of development and functioning of the state, causing tensions and uncertainty, or that could lead to uncontrolled development of events destabilizing the state. Such threat may be caused by natural phenomena or human activity including terrorist activities and social conflicts. The source: J. Falecki, Udział Sił Zbrojnych RP w zwalczaniu i likwidowaniu skutków zagroŜeń niemilitarnych, the doctoral thesis, AON, Warszawa 2008, p. 34.

45
Police and the universal duty to defend the Republic of Poland, and the executive regulations issued on their basis3.
During the state of emergency the Polish President, at the request of the Prime Minister, may decide to use units and subunits of the Polish Armed Forces to restore normal functioning of the state if the applied forces and means have been exhausted4. However, in the executive regulation to the Act of 21 June 2002 on the state of emergency, it was only generally determined that "the units of the Armed Forces perform the tasks according to their special training and equipment, and the executive abilities"5.
During the state of natural disaster, if the use of other forces and means is impossible or insufficient, the Minister of National Defense may at the disposal of governor, at whose area of operations a natural disaster occurs, allocate the subunits and units of the Polish Armed Forces along with directing them to perform tasks related to preventing the effects of natural disaster or to eliminate them.6. It is important that the Regulation to the Act of 18 April 2002 on the state of natural disaster defines the scope of tasks performed by the army, which include:
- participation in the monitoring of threats; - performance of tasks related to the assessment of the effects of phenomena
occurring in the area of hazard; - performance of search and rescue tasks; - evacuation of injured people and property; - performance of tasks aimed at preparing the conditions for a temporary stay in
designated places of the evacuated population; - participation in the protection of property left in the area of occurring hazards; - isolation of the area of hazard occurrence or the place of rescue operation; - performance of security, rescue and evacuation works at the threatened wealth of
culture; - conducting works requiring the use of specialized technical equipment or
explosives that are in the resources of the Polish Armed Forces; - removal of hazardous materials and their disposal by use of forces and means
being in the equipment of the Polish Armed Forces; - eliminating biological contamination and infections; - performance of tasks related to the repair and reconstruction of technical
infrastructure; - participation to ensure the openness of routes; - giving first aid, performance of hygienic and sanitary action as well as counteract
epidemics7.
It is also possible to use the Polish Armed Forces without the introduction of states of emergency. Thus, under the Act of 6 April 1990 on the Police, where the use of armed police
3According to the current legal status, the Polish Armed Forces serve the auxiliary and supporting role for the non-military subsystem in situations where the powers of other forces and means have been exhausted or are insufficient. The exception is the situation concerning terrorist threats from the air attack of RENEGADE type, in which the Polish Armed Forces play a leading role, and the non-military subsystem the auxiliary role. 4 Regulation of 21 June 2002 on the state of emergency (Journal of Laws No. 113, item 985 of 20 June 2002), sec. 11. 5 Regulation of the Council of Ministers of 6 May 2003 on the detailed rules for the participation of subunits and units of the Polish Armed Forces during the state of emergency, (Journal of Laws no. 89, item 821, 2003), § 2. 3. 6 The Act of 18 April 2002 on the state of natural disaster (Journal of Laws No. 62, item 5581), art. 18. 7 Por. The Regulation of the Council of Ministers of 20 February 2003 on the detailed rules for the participation of subunits and units of the Polish Armed Forces in preventing the effects of a natural disaster or their removal (Journal of Laws of 10 March 2003), § 2. 1.

46
units and subunits is insufficient, the Polish President at the request of the Prime Minister may decide to use units and subunits of the Armed Forces, in the situation:
- of the universal danger to life, health or freedom of citizens, - of threat to property, important state facilities and devices, - of terrorist attack threat, where the use of armed police units and subunits is
insufficient8.
At the same time, in case of threat to security and public order, where the police forces are inadequate, the Prime Minister, at the request of the Minister of Interior and Administration agreed with the Minister of National Defense, may order the use of the Military Police to assist the Police9. Furthermore, in accordance with the Act of 21 November 1967 on the common duty to defend the Republic of Poland, the Polish Armed Forces can participate in combating natural disasters and elimination of their consequences, anti-terrorist activities, search and rescue of human life operations, as well as in clearing areas of explosives and dangerous objects of military origin and their disposal.
However, under the Act of 26 April 2007 on emergency management, if the use of other forces and means during the state of emergency is impossible or insufficient, the Minister of National Defense, at the request of Governor may delegate at his disposal subunits or units of the Armed Forces of the Republic of Poland to perform tasks from the scope of emergency management. The tasks of the emergency management include:
- participation in the monitoring of threats; - performance of tasks related to the assessment of the effects of phenomena
occurring in the area of hazard; - performance of search and rescue tasks; - evacuation of injured people and property; - performance of tasks aimed at preparing the conditions for a temporary stay in
designated places of the evacuated population; - participation in the protection of property left in the area of occurring hazards; - performance of security, rescue and evacuation works at the threatened structures
and monuments; - isolation of the area of hazard occurrence or the place of rescue operation; - conducting works requiring the use of specialized technical equipment or
explosives that are in the resources of the Polish Armed Forces; - removal of hazardous materials and their disposal by use of forces and means
being in the equipment of the Polish Armed Forces; - chemical decontamination and elimination of biological contamination and
infections; - removal of radioactive contamination; - performance of tasks related to the repair and reconstruction of technical
infrastructure; - giving first aid, performance of hygienic and sanitary action as well as counteract
epidemics 10.
To accomplish the above mentioned support of civil authorities tasks in combating and eliminating the effects of non-military threats, scattered in different legal acts, there are held within the Polish Armed Forces the designated special forces and means ready for use, in
8 The Act of 6 April 1990 on the Police, (Journal of Laws No. 277, item 2742 of 2004), art. 18. 9 Ibidem art. 18 a. 10 Por. The Act of 26 April 2007 on emergency management (Journal of Laws 07 no. 89 as amended), art. 25.

47
accordance with the "Emergency Management Plan of the Ministry of National Defense"11. This plan was developed in accordance with the Act of 26 April 2007 on emergency management, which obliges ministers in charge of government departments to develop an emergency management plans, which in particular take into account: analysis and evaluation of the possibility of threats occurrence, including critical infrastructure, specific ways and means to respond to threats, and mitigation and elimination of their consequences, organization of the threats’ monitoring and execution of tasks of permanent duty within the advanced readiness of state defense and the organization of tasks realization in the field of critical infrastructure protection12. The objective plan consists of the main body, threats register and annexes. The main body describes among other things: the scope of the plan, the tasks of the key officers of ON resort, ways of activation and withdrawal of the allocated forces, logistics safeguards modes or the rules of command and communication securities. The register of threats contains classification and a brief description of selected factors from the area of non-military emergency threats where the allocated forces and means of the Polish Armed Forces can be used for the neutralization and / or removal of the consequences of their occurrence. The annexes contain information that allow to plan and use allocated forces and means of the Polish Armed Forces to implement specific tasks resulting from the current legal status in the event of an emergency situation of a non-military nature. The plan contains the following annexes: Annex no. 1 - The use of the Polish Armed Forces in counter-terrorism and maintenance of public order operations.
Annex no. 2 - The use of the Polish Armed Forces in isolating the area of hazard and in the security, rescue and evacuation works at the threatened structures and monuments.
Annex no. 3 – The use of the Polish Armed Forces in search and rescue operations.
Annex no. 4 - The use of the Polish Armed Forces in situations requiring the use of specialized equipment and clearing the area of explosive and dangerous objects of military origin and their neutralization.
Annex no. 5 - The use of the Polish Armed Forces in the monitoring and evaluation of the effects of non-military threats.
Annex no. 6 - The use of the Polish Armed Forces in the liquidation of chemical and radioactive contamination.
Annex no. 7 - The use of the Polish Armed Forces in the repair and reconstruction of destroyed infrastructure and assurance of the openness of routes;
Annex no. 8 - The use of the Polish Armed Forces in counteracting epidemics, hygienic and sanitary actions, giving first aid and eliminating biological contamination and infections.
Annex no. 9 - The use of the Polish Armed Forces in the evacuation of people and property and protection of the area during the non-military threats.
Annex no. 10 - Protection and preservation of critical infrastructure facilities used by MON13.
11 The Emergency Management Plan of the Ministry of Defense brought into effect in the Armed Forces of the Republic of Poland with the order no. 1125/OPER/P3 of the Chief of General Staff on December 22, 2010 12 Por. The Act of 26 April 2007 on emergency management (Journal of Laws 07 no 89 as amended), art 12 par. 2. 13M. Banasik, the lecture on 18 January 2011 at Wydział Bezpieczeństwa Narodowego Akademii Obronny Narodowej on Zadania i organizacja Centrum Zarządzania Kryzysowego Ministerstwa Obrony Narodowej.

48
According to „The MON’s Emergency Management Plan", the Polish Armed Forces keep in the alert for use about 9,525 soldiers and 2,150 units of equipment including: 4 planes, 37 helicopters, 37 PTS transporters, 742 cross-country trucks, 317 pick-ups, 55 emergency vehicles and 32 specialized vehicles14.
The Polish Armed Forces can support the Ministry of Interior as part of the counter-terrorism and maintaining public order operations in the scope of: the support of actions of anti-terrorist subunits of the Police, strengthening the protection and isolation of objects, including objects of particular relevance to the security or defense of the state as well as searching the areas, support of the specialized actions of the Police as well as assistance for the Police operations in maintaining public order especially during the unrest caused by social discontent groups or large mass events. The principal forces allocated for anti-terrorist operations are elements of military intelligence, special forces, elements of the air defense system with the fighter air force means on duty and air transport means for the transit of special forces and other battle subunits15. The Armed Forces can fight and remove the effects of a terrorist attack from the air, at sea and on land. During the fight against terrorist attack from the air of RENEGADE type16 a key role play forces and means of the Polish Air Force on duty being on alert duty within the NATO Integrated Air Defense System. In the event of an attack of "Renegade" type the Duty Air Defense Commander17, after the conducted analysis, depending on the degree of certain criteria fulfillment qualifies an aircraft to one of three categories: SUSPECTED RENEGADE, PROBABLE RENEGADE and CONFIRMED RENAGADE. He qualifies to a specific category basing on information that can be obtained from: the national air traffic management authorities, civilian and military airport bodies of the air traffic service, the air traffic authorities of other states of the command post of the NATO system or the commander of interceptor18. In the case of classification of the aircraft to CONFIRMED category, the procedure to decide on its destruction is as follows:
- The Duty Air Defense Commander submits to the Minister of National Defense a report on the situation with the grounds to qualify for CONFIRMED category and application to decide on its destruction,
- The Minister of National Defense decides whether to destroy or not destroy the aircraft19,
- The Duty Air Defense Commander forwards the decision to the forces completing the mission20.
The principal forces allocated to counter terrorist threats at sea are the Naval forces: ships on duty, reconnaissance aircrafts, helicopters and the Naval special forces, and the naval assault group (a combat team) from the GROM unit21. The allocated forces can implement the
14 Ibidem. 15 Lt. Z. Piątek, Zasady uŜycia sił zbrojnych podczas zagroŜeń niemilitarnych, Problemy Ochrony Granic, Bulletin no. 33, p.6. 16 The RENEGADE term refers to a civil aircraft that does not comply with the requests of the air traffic management authority and can be used as a means of air terrorist attack. Por. The source: Regulation of the Council of Ministers of 14 December 2004 on the proceeding in the application of air defense against foreign aircraft not complying with the calls of the state traffic management art. 2 par. 2. 17By the Duty Air Defense Commander one should understand the Air Force Commander of the Polish Armed Forces or other officer of at least a brigadier general rank appointed by the Air Force Commander of the Polish Armed Forces to serve as the Duty Air Defense Commander. The source: Ibidem, art. 2 par. 3. 18Ibidem, art. 4. 19The Act of 12 October 1990 on the protection of the state border (Journal of Laws No. 78, item 461, as amended), art. 18b. 20 Ibidem, art. 6,7. 21 Z. Piątek, Zasady uŜycia sił… , wyd. cyt., p. 8.

49
anti-terrorist tasks in the territorial waters and seaports for all ships in international waters only with reference to ships under the Polish flag.
In the event of a terrorist attack on land, the Polish Armed Forces may participate in execution of the following tasks:
- monitoring of threats and conducting reconnaissance of objects, - the air transport of anti-terrorist subunits, - liquidation of groups and terrorist organizations as well as demolition of terrorist
infrastructure22, - release of hostages and recovery of hazardous materials and military equipment
from terrorists, - the detection and removal of explosives, - the protection of important people and objects, - performance of tasks in the field of psychological impact on people's behavior,
favorable in the achievement of desired goals, - the cover and isolation of determined objects, roads, allocated streets or cities, - liquidation of effects of terrorist attack23. The main activities carried out by specialized subunits in the scope of repair and
reconstruction of damaged technical infrastructure and assurance of the openness of routes that the Armed Forces execute together with local authorities and non-military subsystem entities include:
- protection of bridges, locks, water dam constructions and other hydraulic structures on the rivers by: - ice crushing, ice jams breaking, - execution of mine works connected with the removal of ice-cap and ice
jams, - temporary repair of road and bridge infrastructure, - restoration of the damaged road and bridge infrastructure, - maintenance of openness of routes.
The participation of subunits and units of the Polish Armed Forces in counteracting floods and ice phenomena is aimed at direct protection of objects, people and property threatened by the effects of the high water flow and ice flow, and in particular:
- recognizing and determining the degree of the threat of flood areas, - protection of bridges and hydraulic structures by crushing ice, ice jams
breaking, loading the bridges, etc., - protection of the flood banks by their temporary strengthening, - removal of obstacles causing water dams, - temporary repair of roads and bridges, - evacuation of people and their property from particularly threatened and
flooded areas and left property protection, - delivery of food, medical supplies, drinking water and fodder to the areas
covered by the flood24.
22 The objective task results from the amendment of the Act of 6 April 1990 on the Police, which enables the use of subunits of the Polish Armed Forces in counter-terrorist operations with the use of firearms under the terms determined for the policemen without introduction of the state of emergency. 23 As a result of terrorist attacks there may occur phenomena exhausting the traits of natural disasters such as floods, fires, mass occurrence of infectious diseases or radiation, chemical and biological contamination or construction disasters. 24J. Falecki, Udział specjalistycznych sił i środków Wojska Polskiego w działaniach ratowniczych, [w:] Ratownictwo w sytuacjach kryzysowych, II Scientific Conference „Zarządzanie Kryzysowe”, Szczecin 2004, p. 41.

50
The fundamental substance of the forces allocated to counteract floods and ice phenomena are the forces and means of engineers and in particular engineering rescue battalions, equipped among others in the bridging equipment (amphibious tractors, assault crafts). This equipment is used for the evacuation of people and their property, as well as the distribution of food, medicine and other basic necessities to the flood affected areas. In readiness for action remain mine groups on helicopters, equipped with explosive for crushing ice jams to prevent flooding and protect water infrastructure (bridges, sluices, weirs, etc.) To rebuild the infrastructure destroyed by the passage of the flood wave there are prepared appropriate groups endued with engineering equipment (bulldozers, excavators, cranes, etc.). There is also the possibility of introduction into action of forces and means of general-military subunits to the cleaning and protection works25.
According to the Act on the state of natural disaster, also the subunits and units of the Polish Armed Forces can be used for the operation of snow clearance of routes and infrastructure facilities of significant importance for the efficient functioning of the state in cases of torrential or long-lasting snowfall, assuming the traits of a natural disaster. The subunits and units of the Polish Armed Forces can be used only when the forces and means of the Ministry of Infrastructure has been fully exploited for snow clearance and the military assistance will guarantee the possibility of proper functioning of the state26. The main tasks carried out by the military in the operation of snow clearance include:
- participation in snow clearance and maintenance of routes and transport junctions clearance that are of significant importance for the efficient transport functioning,
- evacuation of passengers from trains, cars or other means of communication being trapped in snow drifts,
- snow clearance of important state-controlled economy facilities, - provision of necessary means and materials supplies to impassable and
isolated areas.
The military forces allocated to snow clearance operations use an engineering equipment depending on the demands (such as ploughs, bulldozers, excavators, cranes, tippers) and evacuation equipment (pick-up trucks, helicopters, etc.) for the evacuation of people and their property, and to distribute food, medicines and other basic necessities in areas impassable due to snow cover. The support provided by the armed forces to civil services in snow clearance operations is particularly important in allocation of specialized engineering and evacuation equipment27. The Polish Armed Forces have the capacity in chemical and radioactive recognition and decontamination generated in the country’s territory as a result of acts of terrorism with the use of weapons of mass destruction or failure (destruction) of objects with the industrial toxic agents, as well as the removal of consequences of natural disasters. For this purpose the Early Warning Subsystem elements of the Polish Armed Forces and Chemical Emergency Response Subsystem are kept in readiness. The Early Warning Subsystem is responsible for providing information to the command bodies on the occurrence of contamination, releases of chemicals and radioactive agents incidents caused by incidents other than the impact of weapons of mass destruction, as well as the development of applications and proposals in the scope of alerting and warning. The main tasks of this subsystem include:
25 Z. Piątek, Zasady uŜycia sił… , wyd. cyt., p. 10. 26 J. Falecki, Udział Sił Zbrojnych RP w kryzysach pozamilitarnych na terenie RP, [w:] Zarządzanie kryzysowe w transporcie lądowym na Pomorzu, I Scientific Conference „Zarządzanie Kryzysowe”, Szczecin 2003, p. 122. 27 Z. Piątek, Zasady uŜycia sił… , wyd. cyt., p. 10.
51
- monitoring the sources of contamination hazards as well as contamination causing threat to military units and institutions;
- detection of radioactive and chemical contamination; - development of the contamination state assessment; - warning and notifying troops and military institutions of the contamination threat; - identification of radioactive and chemical contamination zones; - marking the contaminated and dangerous areas; - exchange of information with the non-military system of organizational units under
the terms specified in the cooperation organization.
The Early Warning Subsystem consists of: - Contamination Analysis Centre (CAC) - the Management Point of the Contamination
Detection System is organized on its base. It constitutes the essential element in collecting, processing and transmission of information about the contaminations,
- Contamination Analysis Centres (WLąd., SP, MW, IW SZ, KZ)/(Land Troops, Air Force, Navy, Inspectorate for Armed Forces Support, Mechanized Corps)
- a network of base monitoring points operating on the basis of duty services of the military units and institutions as well as contamination detection sections,
- a network of automatic registration of gamma radiation rate dose station (SAPOS-90MS).
- sampling units and mobile and specialist analytical laboratories appointed to conduct analyzes28.
The Chemical Emergency Response Subsystem is responsible for assessing the risk in the area of failure and removing the effects of chemical and radioactive contamination. The fundamental tasks of Chemical Emergency Response Subsystem include:
- performance of tasks related to the assessment of phenomena occurring in the region of hazard occurrence,
- reduction of the contamination spreading, - chemical decontamination, - removal of radioactive contamination, - participation in the removal of toxic liquid industrial agents with the use of forces and
means being on the equipment of the Polish Armed Forces.
The Chemical Emergency Response Subsystem consists of the management and coordination elements and response elements. The elements of management and coordination consists of: The Commanders-In-Chief of OPBMR (Defense Against Mass Destruction Weapons) of the Polish Armed Forces WP, COAS (Contamination Analysis Centre), Inspectorate of Military Health Service and OPBMR Mobile Response Team. The OPBMR Mobile Response Team is a prepared and equipped staff of experts, oriented at the execution, on behalf of the Chief-In-Commander of OPBMR SZ WP, of expert and advisory tasks and coordination of operations in the scope of OPBMR organization during the time of crisis or emergence of contamination. It consists of: Operational Team, Contamination Detection Team and Biomedical Team.
Whereas, the response elements of Chemical Rescue Subsystem consists of: OPBMR Mobile Laboratory, Chemical and Radiation Emergency Teams of Land Troops and Chemical Rescue Teams of Land Troops, Navy and Air Force. The elements of Chemical Emergency Response Subsystem are prepared to remove the effects of chemical failures, radiation accidents and acts of terrorism with the use of weapons of mass destruction in the territory of 28 Lt. E. Moskal, Wojskowe systemy rozpoznania i likwidacji skaŜeń, [w:] Zarządzanie kryzysowe w transporcie lądowym na Pomorzu, I Scientific Conference „Zarządzanie Kryzysowe”, Szczecin 2003, p. 103.

52
military (institutions) units. In addition, they can be used to support rescue operations of the chemical emergency response units of the non-military system in the elimination of consequences of failures of objects with toxic or radioactive industrial agents , in industrial plants and on the transportation routes in the territory of the country in cases where the use of other forces is not possible or is insufficient.
The OPBMR Mobile Laboratory is an organizational unit of COAS, designed for sampling of contaminated materials and conducting biological, chemical and radiological field studies. The laboratory also provides the necessary data to assess the actual situation of contamination and to assess the risk of Weapons of Mass Destruction. The main tasks of the mobile laboratory, among others, include: collection, preparation and transportation of samples of materials contaminated with toxic warfare agents toxic industrial agents, conducting qualitative and quantitative analysis of chemical, radioactive and biological contamination or development of conclusions and proposals of toxicity assessment procedures, ways of the contamination impact on the human body, protection methods and pollution reduction and elimination29. The Chemical and Radiation Emergency Response Teams are created temporarily from the already designated and appropriately prepared military chemical subunits. They consists of: the command, the Chemical Emergency Response Team, The Contamination Elimination Groups as well as Security Groups. However, the Chemical Emergency Response Group consists of the commander and four chemical rescuers. The action readiness for the Chemical and Radiation Emergency Response Team is 12 hours from the signal receiving, and for the Chemical Emergency Response Group 3h. The specified time does not include the redeployment time. At the disposal of the CARERT ( CERG) commander there are two Mi-8 transport helicopters. The procedures of use of the Chemical Emergency Response Subsystem elements provide for the use of the whole Team or Chemical Emergency Response Group. It depends on the scale of threat and the complex demand - needs of non-military subsystem30. The basic tasks being performed by CARERT include: measurement of contamination in the area of failure, identifying chances and conditions of conducting the rescue operation and removal of causes and effects of the failure, reduction of contamination spreading, participation in the neutralization of liquid toxic industrial agents and decontamination of people, equipment, buildings, installations and land in the area of failure (including those due to acts of terrorism).
The Polish Armed Forces support civil authorities in situations requiring the use of specialized equipment and in clearing the area from explosive and dangerous military objects and in their disposal. Within the scope of the procedures concerning execution of this task, the government authorities or the police units accept reports on finding explosives and dangerous objects from people, institutions, state and state-controlled economies units, verify whether the reported object is explosive and dangerous, secure the place, assess the degree of risk to the immediate surroundings and inform the appropriate military unit. The time of execution of the report, which consists of securing the findings and disposal and destruction of the found explosives and other dangerous objects, is less than 3 days from the date of notification, and applies only to findings of military origin31. The urgent reports, i.e. such that report on the detection of explosives or dangerous objects wherever they pose a
29 Lt. P. Maciejewski, W. Robak, Mobilne Laboratorium Obrony przed Bronią Masowego RaŜenia – nowy element systemu wykrywania skaŜeń, Research Bulletins of WSOWL, no. 1 (147) 2008, p. 106-107. 30 Lt. P. Maciejewski, R. Pich, Współpraca Wojsk Chemicznych i elementów podsystemu niemilitarnego podczas likwidacji skaŜeń po uŜyciu „brudnej bomby” – analiza moŜliwości sprzętu wojskowego, Research Bulletins of WSOWL, no. 2 (152) 2009, p. 134. 31 Destruction of dangerous findings that do not bear marks of military origin is not in the competence of the army.

53
particular risk to people, cause the suspension of work, learning (the areas of schools, workplaces, streets, towns, and areas of construction, drainage and road works) are implemented immediately. In the Polish Armed Forces thirty-seven miners’ clearance patrols and two naval-miner groups remain ready to act in the areas of responsibility. The areas of responsibility of allocated patrols cover the territory of the whole country as well as the beaches and coastal waters of the Baltic Sea. Each clearance patrol is equipped in three cars (SUV, a special "Minesweeper" type and a studebaker) properly marked and adjusted for transporting hazardous materials and the equipment for reconnaissance and destruction of explosives, means of communication, protective measures and other auxiliary equipment. The clearance patrols’ activity is an intervention activity based on engagement and destruction of explosives and dangerous objects reported by the authorized state authorities. Each misfire or unexploded shell should be removed in 72 hours, and the removal of dangerous objects in public places (schools, roads, constructions) is considered as an urgent intervention, to be implemented within 24 hours. Police is responsible for the protection of the place where the unexploded shell was found until the arrival of the clearing patrol. The unexploded shell being undertaken by the clearance patrol is later transported to detonation place, which is usually a military training ground. In addition, the Polish Armed Forces are able to support the anti-terrorist police subunits, BOR (Government Security Office) , ABW (Internal Security Agency) in clearing the area with explosives and dangerous objects and improvised explosive devices used by terrorists.
As part of participation in the monitoring and evaluation of the effects of non-military threats it is not expected to allocate the forces and means of the Polish Armed Forces to support the civil authorities but the realization of this task takes place through the exchange of information about the threats of this type between the relevant individuals and organizational units of the Ministry of National Defense and the elements of non-military subsystem32. The information about threats is exchanged under the continuous mode by operations on duty and services on duty – according to competence - with the non-military subsystem institutions, in particular with the Government Centre for Security, Counter-Terrorist Centre, ABW, National Centre for Rescue Coordination and Civil Protection, Police Headquarters (Provincial Police Headquarters), Border Guard Headquarters, Institute of Meteorology and Water Management, National Atomic Energy Agency, State Sanitary Inspection and Maritime Search and Rescue Services. In the event of an escalation of the emergency situation and positioning of Emergency Management System elements of the Ministry of Defense, the monitoring of non-military threats is implemented within the system through its selected items and at all levels. The Polish Armed Forces monitor: the situation of contamination, the epidemiological situation and the sanitary - hygienic state of army, threats terrorist in nature, in particular the situation in the airspace and maritime areas of the Republic of Poland, fire risks, the hydrometeorological situation, state of the environment and the transport of dangerous cargo.
32 Special forces and means of the army, mainly from the chemical and medical troops composition may be allocated to support civil authorities to execute the tasks within the scope of the assessment of the effects of the phenomena emerged in the area of threat occurrence and to conduct reconnaissance in the areas of emergency situations occurrence.

54
The tasks of contamination monitoring in the Polish Armed Forces executes the Early Warning Subsystem, the aim of which is to provide current information about the Weapons of Mass Destruction strikes, releases of radioactive, chemical and biological agents caused by the incidents other than WMD strikes, and the occurrence of contamination as a result thereof, as well as the development of conclusions and proposals for alerting and warning the troops. The expert analysis of the information on the current situation of contamination provides the Contamination Analysis Centre which in the scope of exchanging information about the contamination situation cooperates with the National Centre for Rescue Coordination and Civil Protection and the National Atomic Energy Agency. CAC also serves as a dispositional centre of the Minister of National Defense, performing supervision and coordinating functions of the national system of contamination detection and alarming - in case of activation and positioning of elements of the system.
The tasks of monitoring the epidemiological situation and the counter-epidemics and counter-epizootic security within the Polish Armed Forces, as well as of performing specialist and medical supervision of the sanitary and hygienic state are realized by the Military Sanitary Inspectorate and specialized cells of Army Veterinary Service. The Military Sanitary Inspection performs its duties in relation to all organizational units subordinated to the Minister of National Defense and supervised by him, located in the areas of responsibility of Military Preventive Medicine Centres (MPMC) in the structure of which there are Sections of Epidemiology Surveillance and Medical Intelligence, performing tasks of the current and preventive sanitary monitoring as well as epidemiological monitoring of the military units and institutions in the areas of responsibility of the given MPMC. They determine the probability of occurrence and assess the susceptibility of their forces and civil environment for natural factors of epidemic threats and biological attack - by collecting and processing data and information on: the epidemiological situation and state of epidemiological security, the immunization status in the Polish Armed Forces and the civilian population, the availability of individual and collective protection measures, the sanitary and hygienic state of troops and the civilian population, possibility of detection and identification of the used agent as well as the translocation of own troops and the migration of civilian population. As part of the above mentioned activity the Military Preventive Medicine Centers work with: the Crisis Management Departments of Province Offices, the Provincial Sanitary Epidemiological Stations, the Provincial Headquarters of the State Fire Service, the Provincial Police Headquarters. The Polish Armed Forces conduct monitoring of terrorist threats in the airspace and maritime area of the Republic of Poland – in the scope resulting from the powers of the Minister of National Defense to counter terrorist threats from the air (as defined in the Act on the state border protection) and to counter terrorist threats of the threatened vessels, port facilities and ports as well as the infrastructure connected with them (as specified in the Act on the safety of navigation and maritime ports). The monitoring of terrorist threats in the airspace is executed by the Air Operations Center, and the tasks of monitoring the situation in the maritime area of the Republic of Poland performs the Maritime Operations Centre in cooperation with the Border Guard. The monitoring of terrorist threats to computer networks is one of the tasks of the Computer Incident Response System of the Ministry of National Defense. The Technical Support Center, included in the very system, continuously monitors the security status of departmental systems and communication networks, and the Military Office for Security of Communications and Informatics analyzes information about the events and on their basis creates periodic reports on the state of security in the systems and communication networks. The monitoring of the fire risk in the Polish Armed Forces is being realized in relation to organizational cells and units which are subordinate to the Minister of National Defense or

55
are supervised by the Military Fire Protection which consists of: the Military Fire Protection Inspectorate, ten delegacies of the Military Fire Protection and the military fire brigades. Exchange of information with the elements of non-military subsystem is executed in the relations between: the Military Fire Protection Inspectorate - the National Centre for Rescue Coordination and Civil Protection and delegacies of the Military Fire Protection – the command posts of the National Fire Service Headquarters.
The main tasks in the scope of hydrometeorological security of organizational units and cells of the National Defense Department are implemented by the Hydrometeorological Center of the Armed Forces (HC AF). The duty shift of HC AF acts as the superior meteorological cell in relation to duty shifts of all the hydrometeorological service cells in the Polish Armed Forces, i.e.: the Hydrometeorological Security Centre, the Naval Operations Centre, aerodrome meteorological offices, airport weather stations and meteorological posts located within the structures of the Army, Air Force and Navy. This unit coordinates the activity of the hydrometeorological service cells of AF in collecting, developing and broadcasting the meteorological hydrological and aerological information (including warnings on dangerous weather conditions and dangerous weather phenomena). The HC AF develops and distributes the aerial and special weather forecasts for the territory of the whole country and the area of interest. The Hydrometeorological Centre of the Polish Armed Forces cooperates with the Institute of Meteorology and Water Management in the scope of mutual exchange of data and meteorological and hydrological products and telecommunication services, as well as the meteorological and hydrological shield of the Armed Forces of the Republic of Poland.
In the scope of execution of tasks for the environmental protection in the Polish Armed Forces, the Contaminations Analysis Centre conducts measurements of radioactive contaminations within the frames of the functioning in the Polish Armed Forces automated network of air radioactive contaminations measurements as well as competent forces and means allocation for the completion of temporary biological, chemical and radioactive contamination measurements and it keeps the Central Hazardous Chemicals Database.
The organization of cargo transportation of dangerous goods including explosives and explosive objects is carried out in accordance with the Act of 28 October 2002 on road transport of dangerous goods. The transport monitoring is being performed by duty and operational services system which includes the Military Transport Command and the Military Police. Within this system, the person who executes the transport provides information on the transport execution and in particular on: the setting off and completion of the transit, reaching the designated checkpoints and on occurrence of possible interferences while executing road transit. Within the Polish Armed Forces there operates the Search and Rescue System which is defined as the use of aircrafts, ships, ground transport units and the ground search groups in search and rescue actions to search and rescue the injured and shipwrecked persons in the situations of threat for their lives and health on land and at sea. The main tasks of the system include:
o receiving and analysis of information about the security threat of crews and passengers of aircrafts and determining the level of threat,
o notifying interested institutions of the existing threat, o alerting and managing the actions of forces and means of the "system", as well as the
organization of interaction of these forces during the rescue operation, o quick finding of the place and victims of air and sea accidents, o providing assistance to people who have been injured as a result of an air or sea
accident, o evacuation of the injured from the scene of an accident,

56
o saving the possessions threatened as a result of the air or sea accident33. o The Organizational structure of the Search and Rescue System includes: o the Air Operations Centre, o the Command and Guidance Centres (Bydgoszcz, Poznań, Kraków), o the Maritime Rescue Centre of the Maritime Operations Centre - Gdynia, with the task
of coordinating maritime rescue tasks, o the military air traffic authorities, o the radio engineering (radiolocation) authorities, o means of communication, o aircrafts and salvage vessels on duty, o the Ground Search Groups, o units of the Military Police, fire protection and ground transportation34.
In the Polish Armed Forces, to support civil authorities in the counter epidemic and sanitary and hygienic operations, medical assistance and in elimination of biological contamination and infections, there are forces and means allocated of the Military Preventive Medicine Centres (MPMC), Military Hospitals, the Military Institute of Hygiene and Epidemiology (MIHE) and Epidemiological Response Center of the Polish Armed Forces. The Military Preventive Medicine Centers perform their duties in relation to all organizational units subordinated to the Minister of National Defense and supervised by him, located in the areas of those centres’ responsibility, which are determined on the basis of the administrative division of the country into provinces. Each MPMC consists of: the Biological Reconnaissance Team (BRT), the Environmental Health Team (EHT) and the Medical Toxicology Team (MTT). BRT are prepared to respond to each bioatack scenario. Their task is in particular: conduct biological reconnaissance, sampling, an initial identification of biological factors, prevent the spread of the disease, send samples for confirmatory testing at the Diagnostic Centre and cooperation with other services at the elimination of effects of an attack35. Apart from 5 BRT operating within MPMC, another 2 further function in MIHE in Warsaw and Puławy. One of BRT is also intended for missions outside the country. EHT are another mobile (equipped with a special vehicle) full-time MPMC modules. Their main task is to determine the probability and susceptibility assessment of the army and civil environmental to natural factors of epidemic threats and biological attack by collecting and processing information, inter alia about: the epidemiological situation and the state of epidemiological safety in the area of the responsibility, immunization status in the Armed Forces and the civilian population, availability of individual and collective protection measures and the possibility of detection and identification of the agent used. Another structural element of MPMC are mobile MTT. They constitute a specialist security in case of mass poisonings - according to areas of responsibility. Team members will provide consultation as far as the performance of a full set of diagnostic tests and full therapeutic protection is concerned by using a computer database to assist diagnosis and treatment of acute poisonings.
33 J. Falecki, Udział specjalistycznych sił i środków Wojska Polskiego w działaniach ratowniczych, [w:] Ratownictwo w sytuacjach kryzysowych, II Scientific Conference „Zarządzanie Kryzysowe”, Szczecin 2004, p. 46. 34 Lt. J. Falecki, Udział Sił Zbrojnych…, wyd. cyt. p. 123. 35 M. Bartoszcze, Gotowość na atak bioterrorystyczny. Polskie doświadczenia, Materials from the International Conference on "Bioterroryzm - Międzynarodowe Zwalczanie i Współpraca", Warszawa 2002, p. 9.

57
The Military Institute of Hygiene and Epidemiology operates as an independent research and development unit supervised by the Minister of National Defense. Its main tasks include:
- participation in epidemiological investigations and in eliminating the mass illness or diseases of an unusual course, posing threat to the environment,
- improvement of systems and methods for detecting harmful to human contamination and infections, environmental pollution by biotic and abiotic factors and the effects of a terrorist attack,
- participation in combating environmental emergencies, also in the framework of international security systems,
- performance of tasks of the referential centre and the leading unit in the Polish Armed Forces scale in protecting against biological weapon and specific sections of radiological protection and toxicology.
The Epidemiological team for the Infectious Diseases in the Polish Armed Forces is a functional element of MIHE performing tasks of the Military Sanitary Inspection. This team conducts continuous monitoring and analysis of the epidemiological situation in the scale of the entire Polish Armed Forces. The Centre for Diagnostics and Combating Biological Hazards in Puławy is an integral part of MIHE and participates , in functioning within the Polish Armed Forces , contamination detection system as well as improves systems and methods for detecting and counteracting the effects of biological infections and contamination. It has a specialized biosafety laboratory (BSL-3) of the 3 class, which is effective in conducting the full detection and identification of biological threat agents in accordance with the requirements and procedures of NATO. Apart from BSL-3, it Has 5 laboratories and positions of the 2 biosafety class (BSL-2). The same are also located in the Institute of Microbiology and Epidemiology of MIHE in Warsaw. The Laboratories of this biosafety class (BSL-2) will be objectively organized also in MPMC.
The Epidemiological Response Center of the Polish Armed Forces is an independent mobile unit of the military health service, the objective of which is, among others, to support military preventive medicine centers in performance of tasks carried out by these centers. The Centre shall consists of, inter alia, mobile biological laboratory, which operates similarly to biological reconnaissance units of MPMC.
It should be emphasized that the Polish Armed Forces have the equipment that enables to conduct operations from the mobile means , allowing them to redeploy forces and means in each location of the emergency on Polish territory in a relatively short period of time.
The non-military threats affect the safety of both the individual citizens of our country as well as the entire social groups, they are also a threat to their property and infrastructure of our country. Therefore, the Polish Armed Forces are ready to support civil authorities in the evacuation36 of people and property and protect the territory during non-military threats. In practice, the evacuation of people injured or directly threatened (including threatened property) after the occurrence of dangerous event (such as fire, explosion, or other local threats) on the premises or on land are the most frequent. Evacuation may also be preventive in nature, i.e., it can be conducted from the land and premises, in case of
36 Evacuation – an organized relocation (removing, moving) of the population, all kinds of property and livestock from the areas or objects at risk and affected by the effects of hostilities or disasters, for their protection, providing assistance (rescue) and reduction of the material losses. The source: K. Przeworski, Wpływ współczesnej mobilności mieszkańców aglomeracji miejsko-przemysłowej na przygotowanie ewakuacji ludności tych obszarów Polsce, Warszawa 1995, podaję za Słownik terminów z zakresu bezpieczeństwa narodowego, AON, Warszawa 2002, p. 35.

58
impending threat, e.g., associated with the proliferation of hazardous events occurring (flood, chemical disaster, etc.) or with the threat of military action, in the event of warfare threats. The tasks in the scope of preparation and conduct of evacuation and the related undertakings (e.g., providing conditions for the survival of the population evacuated, evacuated protection of the evacuated property, the isolation of risk area) is performed by many entities and their complex and multidirectional nature requires proper coordination of actions.
The allocated forces and means of the Polish Armed Forces execute tasks as part of the evacuation of injured people and property and protection of the area according to the findings of the provincial crisis management plans. After regrouping to the area of operation (to the concentration area in the vicinity of the conducted crisis management action) the person in charge of the action (the village mayor, the mayor / the city mayor /, staroste, governor) introduces military commander of the task group formation with the current situation and the task. The units and subunits of the Armed Forces can also be used to prepare the conditions for a temporary stay of the evacuated population. The places of stay of the evacuated population are formed on the basis of risk areas designated in the provincial crisis management plans. Depending on the scale of threat and area of risk occurrence, for a temporary stay of the population there are designated places having logistic and technical infrastructure (schools, dormitories, hotels, sports halls equipped with adequate sanitary units) or are organized temporary places equipped with field tents.
During the protection of property, the units and subunits of the Polish Armed Forces can be used to support full-time cleanup authorities or act independently. In such cases, the competent guard, service or inspection should determine the scope of protection of property left on the area of risks occurrence, the procedure in the event of detention of persons illegally residing in the protected area, a place where the detained are referred and the proceedings in the event of refusal to comply with the ban on entry into the protected zone. While performing these tasks, the units and subunits of the Polish Armed Forces units can be equipped with weapons and other coercive means. The participation of the Polish Armed Forces in supporting civil authorities in combating and eliminating the effects of non-military threats is significant and the areas of this support mostly covers the specification of non-military threats and the tasks included in the acts and regulations resulting from them. However, the analysis of the scope of this support leads to the conclusion that there are possibilities of its increase and use of the potential owned by the military. The implementation of the mission, which bases on the participation of the Polish Armed Forces in combating and eliminating the effects of non-military threats, increases the sense of security of our citizens and allows for avoidance and reduction of losses among the population and damages to the infrastructure of our country. Therefore, the necessary action is to improve the support of civil authorities in combating and eliminating the effects of non-military threats in the changing security environment in order to improve the safety of our citizens. Literature:
1. Bartoszcze M., Gotowość na atak bioterrorystyczny. Polskie doświadczenia, [w:] Materiały z Międzynarodowej Konferencji nt. Bioterroryzm - Międzynarodowe Zwalczanie i Współpraca, Warszawa 2002.
2. Falecki J., Udział Sił Zbrojnych RP w kryzysach pozamilitarnych na terenie RP, [w:] Zarządzanie kryzysowe w transporcie lądowym na Pomorzu, I Konferencja Naukowa „Zarządzanie Kryzysowe”, Szczecin 2003.
3. Falecki J., Udział specjalistycznych sił i środków Wojska Polskiego w działaniach ratowniczych,

59
[w:] Ratownictwo w sytuacjach kryzysowych, II Konferencja Naukowa „Zarządzanie Kryzysowe”, Szczecin 2004.
4. Maciejewski P., Pich R., Współpraca Wojsk Chemicznych i elementów podsystemu niemilitarnego podczas likwidacji skaŜeń po uŜyciu „brudnej bomby” – analiza moŜliwości sprzętu wojskowego, Research Bulletin of WSOWL, no. 2 (152) 2009.
5. Maciejewski P., Robak W., Mobilne Laboratorium Obrony przed Bronią Masowego RaŜenia – nowy element systemu wykrywania skaŜeń, Research Bulletin of WSOWL, no. 1 (147) 2008.
6. Moskal E., Wojskowe systemy rozpoznania i likwidacji skaŜeń, [w:] Zarządzanie kryzysowe w transporcie lądowym na Pomorzu, I Scientific Conference „Zarządzanie Kryzysowe”, Szczecin 2003.
7. Piątek Z., Zasady uŜycia sił zbrojnych podczas zagroŜeń niemilitarnych, Problemy Ochrony Granic, Bulletin no. 33.
8. Strategia Bezpieczeństwa Narodowego Rzeczypospolitej Polskiej, Warszawa 2007.
9. The Act of 21 June 2002 on the state of emergency (Journal of Laws No. 113, item 985 of 20 July 2002).
10. The Act of 18 April 2002 on the state of natural disaster (Journal of Laws No. 62, item 5581).
11. The Act of 26 April 2007 on emergency management (Journal of Laws 07 no. 89 as amended).
12. The Act of 12 October 1990 on the protection of the state border (Journal of Laws No. 78, item 461, as amended).
13. The Act of 6 April 1990 on the Police (Journal of Laws No. 277, item 2742 of 2004).
14. The Regulation of the Council of Ministers of 20 February 2003 on the detailed rules for the participation of subunits and units of the Polish Armed Forces in preventing the effects of a natural disaster or their removal (Journal of Laws of 10 March 2003).
15. Regulation of the Council of Ministers of 6 May 2003 on the detailed rules for the participation of subunits and units of the Polish Armed Forces during the state of emergency, (Journal of Laws no. 89, item 821, 2003).
16. Regulation of the Council of Ministers of 14 December 2004 on the procedure for the use of air defense means against foreign aircrafts not complying with the request of the state traffic management authority (Journal of Laws no. 279, item 2757).
Contact
dr Janusz Falecki The Jan Kochanowski University in Kielce ul. śeromskiego 5 25-369 Kielce Poland

60
Rastislav Funta
FACULTY OF LAW CHARLES UNIVERSITY PRAGUE
THE EU DECLINE? FUTURE PROSPECT THROUGH INVESTMENT
STRATEGY Abstract Although Europe remains the world’s largest economic area it indicates a phase of relative decline due to the lack of its dynamism. The European Union (EU) is at a crossroads and will be faced with a whole range of challenges in the coming period. The current financial and debt crisis poses challenges to the European integration project - a guarantor of peace, development of existing welfare model (Wohlstandmodells) – and constitutes the biggest challenge for the EU since its foundation. Key words: Europe, financial and debt crisis. Introduction Europe currently has three respond options to the financial, debt and euro crisis:1 muddling will only increase and additionally prolong the crisis; the fall of the monetary union would mean the end of the European project and would result in an overall chaos; current political leaders don't trust themselves to take step towards a real economic and political integration because they do not believe to get the people for it. Whether these three options can be seen as the sole applicable, or whether there are other alternatives we will discuss in the present article. It is certain that the response to the crisis will not only decide about the future of the EU, the EU's capacity to act as a global player, but also about the question to what extent the social and ecological taming of globalization remains on the world agenda, thus for the future of multilateralism. New orientation of the EU project Starting with the three scenarios, there are many indications for a mix of option one [muddling] and two [the fall of the monetary union], but because the common look into the abyss has a healing power, this will force the option three [real economic and political integration] into the forefront. However, this list of scenarios is probably too one-dimensional. There is missing the backlash: a combination of option one [muddling] and three [integration] in the sense that only a minimum of institutional, fiscal and policy framework will be evaluated, in order to allow a long-term stability of the euro area. The interest in the existence of the EU and Monetary Union, both in the respective Member States as well as in the U.S. and China is too big to fail. At the same time there are institutions and mechanisms available to survive the liquidity and insolvency crises without full integration. But what could threat by such a scenario is a decade in which unemployment, low growth and mass poverty would affect the quality of life for millions of people in our European Union.
1 FUNTA, R. Economic Law and Economic Crisis. Where do we go from here? Economic, Legal and Political dimension, Brno: Danube Law and Economic review, 2011. pp. 65-67. ISSN 1804-6746.

61
Important in this context is to see that the current EU crisis is a political crisis, and that the question of the extent of economic integration is only one facet of a larger question of the objective and functional capability of the EU political project. In 1950, Robert Schuman presented his vision of a "European Federation" for the preservation of peace.2 The core of the European project since 1945 was and still is a rejection of a principle of balance of powers. Instead, to the forefront was put the European homeostatic system and hegemonic ambitions of individual states. On the other side is the opposite concept based on the close link between vital interests and limited transfer of national sovereignty rights to supranational European institutions. Due to the division of sovereignty, the concept of success is based on the capacity to take action and the capacity for peace. The peace policy justification remains important for the European project. The key political question is: Can the EU today, in a historical situation in which the overcoming of poverty and the prevention of global risks are to be performed at the same time, substantiate its common European objective? The EU can build on the experiences of the last 60 years. The existence of an efficient Europe3 and European currency could become an essential basis for the transition into an economically, socially and environmentally desirable global society. Investment strategy for the great transformation An important part of an offensive strategy of the EU, which combines the necessary austerity measures with the development of a forward-looking perspective, could represent a sensible investment strategy. Such a strategy of the EU, which promotes private investments towards a great transformation, can through the corresponding green growth strengthen the recovery and thus reduce the unemployment in Europe. Secondly, it can set the basis for achieving ambitious climate policy goals. Thirdly, this strategy can also effectively reduce the danger of further financial crises. An investment strategy in the sense of a great transformation requires a functioning banking and financial system. The collapse of the U.S. investment bank Lehman Brothers on 15 September 2008 brought a devastating chain reaction around the globe. The global financial system has come close to collapse (the world suffered a pecuniary loss of at least 15 trillion dollars). This showed how a bankruptcy of a single big bank could lead to global economic turmoil and freeze investment flows. A new European banking crisis would also - at least for some time – make impossible to finance an investment program. Probably the most effective and cost-effective prerequisite is, that banks need a recapitalization in order to be strong enough to resist state bankruptcies and sluggish growth. More powers and overcoming the EU's democratic deficit Natural representative of a European economic policy is the Commission. Only the Commission has the ability to propose new laws.4 It is an illusion to believe that the euro zone can be govern through biennial meetings of heads of government. But more powers for the Commission in specific policy areas would mean less democratic control. Concerning the calls about more Europe, more competencies, and overcoming of democratic deficit in the EU a question arises: How can the powers be democratically controlled? In the words of Jürgen Habermas: "The poor coordination, which legal status remains deliberately vague, is not
2 FUNTA, R., NEBESKÝ, Š., JURIŠ, F. Európske právo, Brno: Tribun EU, 2012. p. 46. ISBN 978-80-263-0227-8. 3 SVOBODA, P. Úvod do Evropského práva, Praha: C.H. Beck, 2010. p. 3. ISBN 978-80-7400-313-4. 4 BORCHARDT, K. D. Die Rechtlichen Grundlagen der Europäischen Union, Heidelberg: C.F. Müller Verlag, 2010. pp. 182-192. ISBN 978-8252-1669-6.

62
enough for regulations that require joint action by the Union. Such decisions must be legitimized - not only in an indirect way by the governments represented in the Council, but also through the European Parliament. Otherwise, the familiar dynamics of the finger pointing on Brussels will be only accelerated."5 Multilateralism and the EU The Euro and EU crisis creates for the Union not only risks but also gives the opportunity to act rapidly and effectively. It is important to recognize the fate of the EU for the development of global multilateralism. The EU is currently the most successful example of how we could gain the ability to act through division of sovereignty. The lessons we in Europe were taught have made us stronger. Europeans know, that it is possible to pool sovereignty without losing identity. Not the right of the stronger, but the strength of law lies at the heart of these learning experiences. The EU with its export-oriented agricultural policy belongs to the actors which have, through export subsidies and dismantling of protective rights of small farmers in many developing countries, undermined the right to food. More powers for the EU itself are by no means a necessarily solution to issues of injustice between the countries. The common interest of the EU is by no means congruent with the interests of poor people in developing countries. The subsidies often undermine sustainable development of rural agriculture in the EU - and are often a factor that is undermining food security in developing countries. But with the loss of the model of the EU as a politically united player, with the loss of the EU as an example of action by the division of sovereignty would be a lot at stake. A relapse of the EU into a nation-state organisation and free trade zone would give additional impetus. This could mean: a tailwind for a "no" to a legally binding climate agreement, for national and regional interpretations of human rights, for a hegemonic rather than cooperative energy policy, for increased protectionism and a decline of importance of the UN. It would strengthen tendencies to chaos by resolving such issues, and weaken the scenario of global partnerships. The example of Copenhagen, as the U.S. president negotiated with the Chinese leader in the hotel room the deal, which was no deal at all, could be a paradigm for the regulation of such matters. Can the EU, in the multilateral context, be a more powerful player? It is needed an EU that use its experiences in order to face the great challenges of our time. But its future ability to act depends not only on the internal developments, but also from the evolution of the global governance system. The role of Germany in the EU crisis Germany is, as the most populous and economically most powerful country of the EU, a very central and special responsibility-standing player in the further development of the EU. There is no dispute concerning the fact that the unification of Europe was in Germany's interest. It is important to understand how the one-sided export-oriented German welfare model was responsible for the massive imbalances that have built up in the EU. Two driving factors have favored the strong German export success in recent years: on the one hand, the introduction of the euro single currency. The euro takes up the southern Euro-countries the ability to recover the competitiveness of their economies (at least partially) through a currency devaluation. German exports were relatively cheap. On the other hand, there was a strong employees wage restraint. Wherease in 1995 there were nearly 4.4 million workers in low-wage sector, in 2007 there were already 6.5 million of such workers. The German account
5 HABERMANS, J. Der Konstruktionsfehler der Währungsunion, Berlin: Blätter für deutsche und internationale Politik 5/2011. pp. 64-66. ISSN 0006-4416.

63
surpluses correspond almost to the account deficits of Greece, Spain, Italy and Portugal combined. In some respects, Germany is in a similar position as China (the world's biggest exporter). Firstly, a relatively cheap currency and secondly, a relatively low wage level - in China as an emerging market, in Germany through reduction in real wages of workers. Thirdly: Both Germany and China are faced with the challenge of taking distance from the one-sided welfare model - this turning point in China has been initiated by the adoption of 12th Five-Year Plan for National Economic and Social Development. And fourthly: in both countries a focus of economic and financial policy in massive investment in green sectors (in the context of the Great Transformation) could be the key elements for tackling the crisis and coming out of it stronger. By the combat of the crisis, it will be important to link the pressure to carry out radical reforms with the prospect for debt reduction and economic recovery. Final remarks: new way of thinking The German government has pushed the bailout with a little sensitivity, especially at the beginning of the euro crisis. As a result, the neighboring countries have no longer pointed to "Brussels", but on the German egoism. Observers such as Paul Krugman have stated that "From the beginning, euroskeptics worried about one-size-fits-all monetary policy, but what we're getting is worse: one-size-fits-one, Germany first and only. That's a recipe for a prolonged, painful slump in the periphery, large defaults, almost surely; a great deal of bitterness; and a significantly increased probability of a € crackup."6 This will determine whether the path leads to a politically more capable EU. Without confidence in the EU political capacity and their national states, the EU degenerates to a purely business-oriented free trade zone where we will see a dominance of national interests. Concerning the introduction of the euro we must say that the path of the unification of our continent was irreversible. In the meantime we have to sum up that the euro is a structure that can not remain in its present state. It's more or less about the political ability to act. With the necessary backbone of the acting politicians the crisis7 concerning the euro currency could bring the fruits that some had hoped for a common European foreign policy: a clear perspective by the social and ecological harnessing of casino capitalism;8 a willingness to gain the ability to act through sharing of sovereignty; and the awareness of a common European destiny - that is increasingly interlinked with the global destiny. Thus, it is important to look for ways in order to contribute to the debate where not the national self-interest, but a clear vision for the EU's role in internationally challenging times will be at the centre of interests. Literature:
1. [1]BORCHARDT, K. D. Die Rechtlichen Grundlagen der Europäischen Union, Heidelberg: C.F. Müller Verlag, 2010. 608 p. ISBN 978-8252-1669-6.
6 KRUGMAN, P. Why People Say “Eeh!” When They Learn About the ECB, The New York Times, 2011. April 8. Available on internet http://krugman.blogs.nytimes.com/2011/08/04/why-people-say-eeh-when-they-learn-about-the-ecb-redux/ 7 HENNINGHAUSEN, T. Die Stabilität Europas nach der Krise-Eine interdisziplinäre Betrachtung, Baden-Baden: Integration 3/2011, p. 172. ISSN 0720-5120. 8 SINN, H. W. Casino Capitalism - How the Financial Crisis Came about and What Needs to be done now, Oxford: Oxford University Press, 2010. pp. 1-103. ISBN 978-0-19-965988-3.

64
2. [2]FUNTA, R. Economic Law and Economic Crisis. Where do we go from here? Economic, Legal and Political dimension, Brno: Danube Law and Economic review, 2011. pp. 65-72. ISSN 1804-6746.
3. [3]FUNTA, R., NEBESKY, Š., JURIŠ, F. Európske právo, Brno: Tribun EU, 2012. 472 p. ISBN 978-80-263-0227-8.
4. [4]HABERMANS, J. Der Konstruktionsfehler der Währungsunion, Berlin: Blätter für deutsche und internationale Politik 5/2011. pp. 64-66. ISSN 0006-4416.
5. [5]HENNINGHAUSEN, T. Die Stabilität Europas nach der Krise-Eine interdisziplinäre Betrachtung, Baden-Baden: Integration 3/2011, pp. 172-178. ISSN 0720-5120.
6. [6]KRUGMAN, P. Why People Say “Eeh!” When They Learn About the ECB, The New York Times, 2011. April 8. Available on internet http://krugman.blogs.nytimes.com/2011/08/04/why-people-say-eeh-when-they-learn-about-the-ecb-redux/
7. [7]SINN, H. W. Casino Capitalism - How the Financial Crisis Came about and What Needs to be done now, Oxford: Oxford University Press, 2010. 400 p. ISBN 978-0-19-965988-3.
8. [8]SVOBODA, P. Úvod do Evropského práva, Praha: C.H. Beck, 2010. 304 p. ISBN 978-80-7400-313-4.
Contact
JUDr. Rastislav Funta, Ph.D., LL.M. Právnická fakulta UK nám. Curieových 7 116 40 Praha 1 Nové Město Czech republic Email: [email protected]

65
Katarína Havierniková
FACULTY OF SOCIAL AND ECONOMIC RELATIONS ALEXANDER DUBCEK UNIVERSITY OF TRENČÍN
CLUSTERS AND THEIR EFFICIENCY IN REGIONS OF THE SLO VAK
REPUBLIC
Abstract Clusters are considered as an important element of European competitiveness and they are an innovative approach to the business. Clusters represent local associations of three sectors: public, private and academic. The aim of this paper, based on the results of the questionnaire survey is point on the main problems with measuring the effectiveness of clustering in different regions of the Slovak Republic. Key words: Cluster, region, Slovak republic, efficiency, measuring of efficiency, methods, DEA. Introduction The clustering is not a new concept in the world economy. Questions about the formation of clusters as a strategic corporate purpose or to some extent give economists since the 19th century, for example Marshall in his work Principles of Economics (1890) who pointed on the importance of cooperation between industries that are concentrated in one place and can increase the benefit of the environment, for example through economies of scale. Marshall in his work so far defined the nature of clusters, but pointed out that the concentration and interconnectedness of businesses in industries concentrated in one place, in this way provides significant savings in localization. The clusters to further elaborate on important American economist Michael Porter, who in 19990 in his book "Competitive Advantage of Nations“, for example, described the importance of the association of Italian builders businesses in the area and connectivity of the Diamond model of competitive advantage. Porter in this work has defined clusters as clusters of competitive industries, which are dispersed throughout the economy, but they are usually linked through vertical (buyer - seller) and horizontal (common customers, technologies, distribution channels) relationships. Clusters of competitive industries generally dispersed physically tend to be concentrated geographically. One industry competitive industry helps to create more mutually reinforcing processes. The key factors in the current clusters included mainly the geographic concentration and its impact, cooperation versus competition, several typologies of clusters, specialization and a focus on innovation, cooperation including several sectors (research, science, education, financial institutions, government) networking in local, regional and internationals levels. According to many authors the clusters play an important role in several areas of state economy. Clusters represent one of the possibilities how to solve the problems with unbalanced economic development and growth, unemployment, financial stability not only in the region but also at the national level. The importance of clusters was described by many authors in many ways. For example we can find the works about the importance of clusters in regional development, the importance for small and medium sized enterprises, universities and so on. Fewer authors have dealt with how to quantify the efficiency of the clusters. Efficiency of clusters in the

66
Slovak economy is hardly detectable because the clusters as a whole do not show the required indicators for the input and output. The economic indicators show individual entities, as provided by law. The clusters in the Slovak economy are beginning to have a significant role despite, the fact that the issue of clustering is still new topic. The first created cluster was cluster Biterap in Kosice region (2004). The majority of the clusters were established in 2008. In our analysis we found 18 clusters, of which 1 association. We realized the questionnaire survey between all the 18 clusters, while the return of completed questionnaires was 45%. One of the objectives of the questionnaire survey was to determine whether it is possible to measure the efficiency of the cluster and what are the possibilities and main problems of measuring the efficiency of clusters in the regions of the Slovak republic. Results obtained from the questionnaire survey are part of this contribution. Cluster definition The cluster is an economic phenomenon that is placed in many research studies. Many definitions of cluster exist. In many research studies we can find definitions by default, context related and driven by purpose. The cluster concept has become a subject of intense research study conducted by Michael E. Porter (1990) – The competitive advantage of nations. In The Competitive Advantage of Nations (Porter, 1990), he put forward on a microeconomically based theory of national, state, and local competitiveness in the global economy. In this theory, clusters have a prominent role. Clusters are geographic concentrations of interconnected companies, specialized suppliers, service providers, firms in related industries, and associated institutions (e.g., universities, standards agencies, trade associations) in a particular field that compete but also cooperate. Clusters, or critical masses of unusual competitive success in particular business areas, are a striking feature of virtually every national, regional, state, and even metropolitan economy, especially in more advanced nations. By Malmberg (1996) regional clusters are limited geographical areas with a relatively large number of firms and employees within a small number of related industrial sectors. Thus, the clusters are specialised in a small number of industries. This reflects the more general point that economic, entrepreneurial and technological activities in specific industrial sectors tend to agglomerate at certain places. By the OECD in document Boosting Innovation the cluster approach, clusters can be interpreted as reduced-scale national innovation systems. The dynamics, system characteristics and interdependencies of individual clusters are similar to those of national innovation systems. With its focus on knowledge linkages and interdependencies between actors in networks of production, the cluster approach offers a useful alternative to the traditional sectoral approach. Clusters can be identified at various levels of analysis. Micro-level analysis focuses on inter-firm linkages, industry- (meso-)level analysis on inter- and intra-industry linkages in the production chain, while macro-level analysis examines how industry groups constitute the broader economic structure. Cluster analysis can also be applied at the regional level. According Habánik (2012) clusters are a group of interrelated industrial sectors and other entities important for competition. The reason for the existence of clusters are localization saving but also the atmosphere of the sector derived from the formal and informal contacts, working procedures and traditions of the region and the ability of university to support its competitive potential. In general clusters can be defined as a group of firms, related economic actors, and institutions that are located near each other. Clusters are defined by relationships and geography with the aspect of a concentration of one or more sectors, within a given region as

67
well as the emphasis on networking and cooperation between companies and institutions. Clusters have reached a sufficient scale to develop specialised expertise, services, resources, suppliers and skills. Data, methodology and discussion Cluster in the regions of the Slovak republic There are several dozen of clusters in the Slovak republic, but not all of them are active, or present their activities. According to the results of our analysis there are 18 clusters in the regions of the Slovak republic, which are divided into 3 types of clusters (technology clusters, clusters of tourism, knowledge cluster) operating in 9 sectors by economic activities (tourism, IT, electrical, automation and robotics, automotive industry, energetics, engineering, construction, plastics, renewable energy). Next scheme present the clusters in the regions of Slovakia.
Scheme 1: Clusters in the regions of the Slovak republic
In the questionnaire survey, were approached 18 clusters, but only 8 clusters completed the questionnaire. The table 1 shows an overview of the clusters in the regions of Slovakia according to number of analyzed clusters, the number of clusters which filled in a questionnaire, and how many of them are active.

68
Table 1: Clusters in the Slovak republic regions
Number of clusters
Questionnaire Region Analysis
returned number of active clusters
Bratislava 1
Trnava 6 4 3
Trencin 0 0 0
Nitra 2 1 1
Zilina 4 1 1
Banska Bystrica 2 1 1
Presov 0 0 0
Kosice 3 1 1
SR in total 18 8 7
Forming successful clusters needs tight cooperation of three sectors: the public sector, academic sector and the private one. The representatives of three sectors are included in the analyzed clusters. When a real and genuine cooperation exists within the cluster, the cluster has more opportunities to survive and to operate well. The establishment of Slovak clusters including cooperation of self-government, municipalities with universities and businesses. Percentage of the three sectors when the clusters were established is shown in Figure 1.
Figure 1 Establishing cluster
According to European Commission universities operate in an increasingly global environment, which is constantly changing and which is characterized by an increasing competition in attracting and retaining outstanding talent, as well as the emergence of new

69
tasks that must be fulfilled. In addition to education and scientific research is growing role in the complex process of innovation and other aspects of economic competitiveness and social cohesion is reflected in creation of clusters. The first established cluster with the participation of the University of Kosice was IT Valley Cluster (2007) in Kosice region, followed by the first Slovak engineering cluster in Banska Bystrica (2008), Z@ict in Zilina (2008), in Kosice region - Cluster AT + R(2010) and in the region of Bratislava - Danube knowledge cluster (2010).
Table 2: Relations between clusters and universities in the Slovak regions
Number of clusters involving universities
Number of universities in
region
The number of universities involved to
cluster Region
Analysis Questionnaire Analysis Bratislava 1 0 11 3 Trnava 2 2 4 3 Trencin 0 0 3 0 Nitra 1 1 3 1 Zilina 1 1 3 1 Banska Bystrica 1 1 3 1 Presov 0 2 0 Kosice 2 1 4 2 The table shows that in spite of the large number of universities in the region, only a small percentage is connected with the business sector and the local government. According to the results of questionnaire involvement of universities in the cluster provides the following benefits:
• transfer of innovation, • participation in large projects, • preparation and implementation of research and development projects, support for
research and development, • organization and realization of scientific and technological research and development
in the cluster.
The important roles in the cluster fulfill the small and medium sized enterprises. According Ivanova (2012) SMEs are stabilizing element in the economic system, most of the companies owned by domestic businesses, which create a strong central business level. Statistics show that SMEs have become an accelerator of economic development. SMEs in the cluster are primarily incorporated as subcontractors to large businesses and firms. Large businesses and firms in a horizontal position cooperate with competitors and in a vertical position they cooperate with key suppliers and customers - SMEs. In the Slovak regions, not all of the clusters include the SMEs. From analyzed clusters only 75% included SMEs. Participation of SMEs in the cluster shows this kind of benefits:
• production cooperation with large enterprises, • development and implementation of solutions for state and public administration,
research activities, • subcontractors for large enterprises, • opportunity to find a suitable partner, or supplier, • opportunity to exchange experiences, • the cluster provides a reduction in energy costs 30%.

70
As shown the table 3, in the Slovak regions operates a large number of SMEs that potential could be used for development of the cluster as well as the region itself.
Table 3 Clusters and small and medium sized enterprises
Region Number of clusters
Number of SME Number of clusters involving SME
Bratislava 0 42167 0 Trnava 4 11800 3 Trencin 0 11383 0 Nitra 1 13870 0 Zilina 1 13747 1 Banska Bystrica 1 12386 1 Presov 0 14120 0 Kosice 1 14661 1
Methodology Prior to a closer examination of the main elements of this paper we have to note, that clusters refer to a group of firms that cooperate on a joint development project - complementing each other and they are specializing in order to overcome common problems, achieve collective efficiency and conquer markets beyond their individual benefit are formed mainly by businesses, local governments and universities. The biggest influence on the economic development of the region has currently companies. It shows the correlation analysis prepared under Person coefficient, which shows a close relationship between business and employment indicators and regional GDP. As we can see in Figure 2, there is a correlation between the number of businesses and employment and in Figure 3 there is a correlation between the number of business and regional GDP. According to Grmanova (2006) the Pearson formula is:
−
−
−=
∑∑∑∑
∑ ∑ ∑
====
= = =2
11
22
11
2
1 1 1,
n
ii
n
ii
n
ii
n
ii
n
i
n
i
n
iiiii
yx
yynxxn
yxyxnr
(1) The range of the correlation coefficient is from -1 to 1. Since our result (correlation between the number of businesses and employment) is 0,6131 or 61%, which means the variables have a moderate positive correlation.
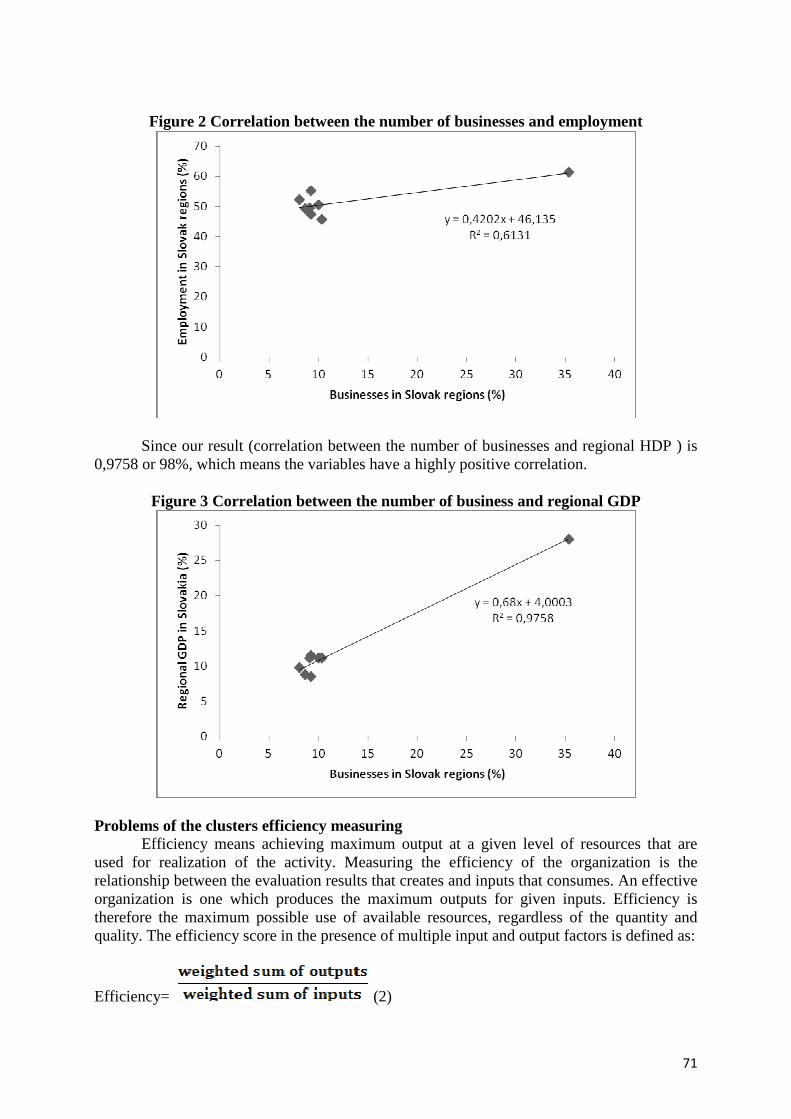
71
Figure 2 Correlation between the number of businesses and employment
Since our result (correlation between the number of businesses and regional HDP ) is 0,9758 or 98%, which means the variables have a highly positive correlation.
Figure 3 Correlation between the number of business and regional GDP
Problems of the clusters efficiency measuring Efficiency means achieving maximum output at a given level of resources that are used for realization of the activity. Measuring the efficiency of the organization is the relationship between the evaluation results that creates and inputs that consumes. An effective organization is one which produces the maximum outputs for given inputs. Efficiency is therefore the maximum possible use of available resources, regardless of the quantity and quality. The efficiency score in the presence of multiple input and output factors is defined as:
Efficiency= (2)

72
For assessing the efficiency of the cluster we can use several methods which are different in ways of doing the analysis, as well as factors and indicators, which are calculated in process of measuring. Frequently used method in research studies is the method of DEA (Data Envelopment Analysis). The management practices are mainly used methods that take into account the ratio indicators based on standard reporting of company. Disadvantage of these methods in comparison with the Data analysis envelopment is that they involve only two or a few factors that affect the overall efficiency of the organization concerned. Selection of appropriate methods and procedures for evaluating efficiency depends on many factors: for example, from the data available, the form of the variables to be evaluated, and so on. The segmentation of methods that assessing the efficiency according to the evaluated variables show Blumenberg (2004), who divides the methods of one variable approaches and approaches with several variables (multidimensional) – scheme 2.
Scheme 2 Methods of efficiency evaluation
Source: Kovalčík, M.: Evaluating the effectiveness of forestry, available at: http://www.forestportal.sk/ForestPortal/odborna_sekcia/doc/zbornik/hodnotenie_efekt.pdf Kovalčík provides further distribution methods and approaches for assessing the efficiency by attributes and values:
a) according Roders (1995) - normative approaches, approaches with real values, and attitudes of actual and normative values,
b) according Schefczyk and Gerport (1994): deterministic vs. stochastic character of production function, the evaluation of production function by parametric analysis, the evaluation of production function using mathematical models,
c) further breakdown: dynamic and static methods.
The measuring of cluster efficiency of the Slovak clusters is very difficult. According to the questionnaire survey the clusters do not show common indicators by which it could be to determine their efficiency. In this time it is possible to measure only efficiency by methods that take into account the ratio indicators based on standard reporting of company.

73
Conclusion Clusters in the Slovak regions, as in the EU regions were mainly created as a result of natural competitive advantages, market forces, or even randomly. Despite the great popularity in the EU, in the environment of the Slovak economy, clusters are not supported adequately according to their requirements. The overall development of cluster policy is at an early stage. Active clusters help exploit the economic and scientific potential of the region, thus contributing to enhancing the competitiveness of regions. In previous studies, however, do not measure the effectiveness of knowledge clusters in the regions of Slovakia. This issue we dealt with in the framework of the Internal Grant Scheme at Faculty of Social and Economic Relations at the University of Trencin, called: The problems of measuring the clusters efficiency. Measure the efficiency of the last two decades takes on importance. In the Slovak economy it would be appropriate to use the Data envelopment analysis for detection of cluster efficiency. DEA is a useful model of quantitative economic analysis for the assessment of production units. Literature:
1. CEGLIE, G., DINI, M. Boosting innovation the cluster approach, 1999, Vienna: UNIDO. 23 pg.
2. Council on Competitivenes: Cluster-Based Strategies for Growing State Economies. Available at http://www.nga.org/files/live/sites/NGA/files/pdf/0702INNOVATIONCLUSTERS.PDF
3. HABÁNIK, J., KOIŠOVÁ, E. Regional economy and policy, 2011, Bratislava: Sprint dva, ISBN 978-80-89393-55-8, p.175 (in Slovak).
4. HABÁNIK, J. Clusters and innovation in regional economy, 2012, Trencin: In: Social and economic revue No. 2/2012, volume 10. ISSN 1336-3727. pg. 15-22 (in Slovak).
5. IVANOVÁ, E. The importance of strategic marketing in enhancing the competitiveness of small and medium-sized enterprises, 2012 Trencin: In: Social and economic revue No. 1/2012, volume 10. ISSN 1336-3727. pg. 12-18(in Slovak).
6. KETELS, CH., LINDQVIST, G., SÖLVELL, Ö. Clusters an Cluster Initiatives, 2008, Stockholm, Center for strategy and competitiveness, Stockholm School of Economics, pg. 9.
7. KOVALČÍK, M.: Evaluating the effectiveness of forestry, available at: http://www.forestportal.sk/ForestPortal/odborna_sekcia/doc/zbornik/hodnotenie_efekt.pdf (in Slovak).
8. MALMBERG, A., BATHELT, H., MASKELL, P. Cluster and Knowledge: Local Buzz, Global Pipelines and the Process of Knowledge Creation. DRUID Working Paper No 02-12. ISBN 87-7873-128-3.
9. OECD proceedings: Boosting innovation the cluster approach. 1999. Available at http://www.clusterbg.net/content/library/EN/Boosting_Inovations_Cluster_Approach.pdf
10. PORTER M. E. Location, Clusters, and Company Strategy (chapter 13) in The Oxford Handbook of Economic Geography, Oxford University Press, 2000, ISBN 9780198234104, pg. 253 – 274.

74
11. PORTER M. E. The competitive advantage of nations. Harvard Business Review, march+ april 1990.
12. PORTER M. E. Location, clusters and company strategy.
13. TALLURI, S. Data envepolment analysis: Models and extension, In: Producciton / operations management, available at:
https://www.decisionsciences.org/DecisionLine/Vol31/31_3/31_3pom.pdf
Contact
Ing. Katarína Havierniková, PhD. Department of Economics and Economy Faculty of Social and Economic relations Alexander Dubcek University of Trencin Študentská 3 11 50 Trenčín Slovakia E-mail: [email protected]

75
Taťána Karásková
SILESIAN UNIVERSITY, SCHOOL OF BUSINESS ADMINISTRATION IN KARVINÁ SILESIAN UNIVERSITY IN OPAVA
ALTERNATIVE SOURCES OF FOOD IN THE THIRD MILLENNIUM
Abstract According to statistics gathered by the UN Food and Agriculture Organization, the number of people who were suffering from hunger around the world in 2010 reached 925 million. The sharp rise in global food prices has forced residents in unstable and poor countries to change their habits and in turn, consume cheaper food. This paper deals with alternative sources of nutrition, appeals made against the decision by the UN Food and Agriculture Organization to use insects as part of the human diet, and explains how the consumption of insects is being presented as an alternative solution to the food crisis. Other topics broached include the speculation surrounding the culinary use of edible flowers, the promising production of microbial biomass protein using other carbon substrates, and the possibility of obtaining starch from cellulose. Key words: Analysis of food consumption, edible flowers, entomophagy, food, insects, nutritional value. Introduction In 2000, world leaders committed themselves to the MDGs (Millennium Development Goals) to reduce the number of people suffering from hunger by half. It was an unprecedented and collective effort aimed at combating hunger and poverty in the world. However, current developments are lagging behind schedule and as a result have eliminated the achievement of targets originally set with the deadline of 2015. Although the number of people suffering from hunger in the world in 2010 decreased after exceeding 1 billion for the first time in history, it still remains unacceptably high. If Europe is to deal with the growing world population, rapid depletion of several resources, increasing pressures on the environment and climate change, it must radically change its approach to production, consumption, processing, storage, recycling and disposal of biological resources. According to statistics gathered by the UN Food and Agriculture Organization (FAO)1, the number of people who were suffering from hunger around the world in 2010 reached 925 million. Although in comparison to 2009 when more than a billion people worldwide suffered from hunger, there has been a reduction in these values due to a slight economic recovery. However, this does not mean that existing measures to reduce hunger have been implemented correctly. In LDCs (Least Developed Countries)2 more than 70% of the population is, in some way, involved in agriculture. 50% of those suffering from hunger are small farmers with less than two hectares of land, which when considered in figures, estimates to be between 1.9 – 2.2 billion people who are involved in small-scale agriculture. During a meeting held in 2010, the Committee for World Food Security (CFS) requested FAO to review its methodology for estimating malnutrition in order to provide more timely updates and include them in any analysis being carried out through large 1 Agriculture and Food Organization of the United Nations. 2 LDC - Least Developed Countries representing the poorest and weakest segment of the international community.

76
household surveys. This data should become available in the next few years. In 2010, a survey was carried out on a call made by CFS and then evaluated in 2011. The United Nations held a conference in Istanbul from the 9 – 13 May, 2011 in which they dealt with their program for the LDC countries and established a comprehensive ‘Program of Action’ (IPoA) for the global development co-operation for the next decade. The global food system Today’s international trade does not help improve the world hunger situation. Since the 1980’s, the International Monetary Fund (IMF) and the World Bank (WB) have enforced a liberalization policy as a price for their help in the Structural Adjustment Programs (SAP). However, liberalization for developing countries proved to be ineffective because these programs require restrictions on public spending, reducing subsidies and the abolition of constraints standing in the way of trade making these countries more vulnerable to external influences. Free trade and the agreements of the World Trade Organization (WTO) further increased the differences in income since it gave priority to well-paid, qualified workers from an unskilled labor force whose members do not have access to education, resources, information, equipment and markets. Only the rich countries seem to benefit from this system while the majority of the poor countries are doomed to food insecurity. Experts are warning of a possible slide into the first truly global food crisis since the end of the Second World War. The rising price of basic commodities is an accompanying phenomenon, particularly with rice and cereals. This situation has led to social unrest in Egypt, Indonesia and the Philippines. This turbulent course of events is not helped by other factors worldwide such as the long-term droughts affecting Australian agricultural production. The BBC has recently warned that the sharp rise in world food prices has also forced people in poor and unstable countries, such as Liberia, to change their dietary habits and start eating cheaper foods. According to representatives of international humanitarian organizations, the sharp price increases over the last year has been a disaster for the tens of millions of poor individuals worldwide who have no choice but to use most of their income on food. Analysis of food consumption in the year 2010 in the Czech Republic On April 10th, the Czech Statistical Office released the official figures of the analysis done for food consumption during 2010. The consumption of foods in the Czech Republic such as meats, vegetables, rice, and pasta among many more, is reflective of the change in eating habits. This is partly due to the influence of tourism to the country and the number of foreigners in the population. However, the largest impact on the consumption of specific foods is attributed to the rising food and energy prices, the cost and availability of seeds, feed, fertilizer, the varied chemicals needed to treat plants and animals, and the purchasing power of the population. The availability of different types of food in the market and the influencing use of advertising should be taken into account in regards to health education. Increasing food imports and the price ranges of selected items has an ever-growing effect on domestic food and agricultural competiveness. In 2010, there was an overall decrease in food consumption in kilogram per capita by 2.1% compared to 2009. In the long run, we can observe a decrease in consumption of bread and an increased consumption of pasta. While the consumption of milk has decreased, there is an increase of the intake of cheese and other dairy products. The increasing trend of fruit consumption is heavily dependent on domestic fruit harvest and leads to increased consumption of tropical fruit. Decreasing domestic vegetable production is being replaced by imports. While the Czech Republic still exports sugar, there has been more importation of products containing sugar, fruits, vegetables, baking ingredients, cocoa, etc. The Czech Republic is completely dependent on imports of rice,

77
seafood, tropical fruit, melons, somelegumes, cocoa beans, tea, coffee, salt and tobacco. The accompanying tables and graphs below reveal the statistical consumption figures in 2010 compared to 2009 and the long-term average since 1992.
Figure 1 Consumption of cereals in terms of flour 1990 2010
Source: Http://www.r-domain.net/report/www.czso.cz/?check=11347&url=www.czso.cz/csu/ redakce.nsf / news. Reduction in the consumption of wheat flour by 3.1kg (3.2%) to 93.6kg, and rye flour 1.9 kg (17.8%) to 8.5 kg. As depicted, there is an increased consumption of rice by 0.3 kg (6.9%) to 4.5 kg. Pasta consumption increased by 0.5 kg to 7.1 kg.
Figure 2 Consumption of meat and poultry
1990 2010
Pork Beef Poultry Other
Source: Http://www.r-domain.net/report/www.czso.cz/?check=11347&url=www.czso.cz/csu/ redakce.nsf / news. The consumption of meat and poultry increased by 0.3 kg to 79.1 kg, and this represents 10.3% of total amount of food consumed (long-term average consumption is 81.4 kg). Increased pork consumption by 0.7kg (1.7%) to 41.6 kg and decreased consumption of poultry meat by 0.3 kg to 24.5 kg. Beef consumption to 9.4 kg (with long-term average of 13.4 kg), veal (0.1kg), sheep, goat, horsemeat (0.4kg) and game (0.9 kg) remained at the same level since 2009.
Wheat Rye Barley Barley Other Rice Flour Flour groatsoat-flakes flour

78
Figure 3 Consumption of cheese
1992 1994 1996 1998 2000 2002 2004 2006 2008 2010
Source: Http://www.r-domain.net/report/www.czso.cz/?check=11347&url=www.czso.cz/csu/ redakce.nsf / news. Import of curd and cheese in 2009 accounted for 74.7 thousand tons while the export figures reached 26.1 thousand tons. The increasing trend of cheese and curd importation continued in 2011 as well as the consumption of eggs increasing by 4 percent.
Figure 4 – Consumption of fresh fruit
1992 1994 1996 1998 2000 2002 2004 2006 2008
Source: Http://www.r-domain.net/report/www.czso.cz/?check=11347&url=www.czso.cz/csu/ redakce.nsf / news. The largest decline recorded was for consumption of temperate zone fruit by 8.6 kg (15.6%). This is mainly due to lower domestic production. Total consumption of fruit compared to the total food consumption is 11% and tropical fruit being 4.9%.The Statistical Office recorded a reduction in the consumption of vegetables by 1.5kg (1.8%) to 79.7 kg. Average consumption for the last 19 years was also79.7 kg. One of the few major foods where there was an increase in the consumption is potatoes. Their consumption has increased by 2.4 kg (3.7%) to 67.3 kg.
natural cream other

79
Unconventional ways of obtaining food In addition to agriculture being a major producer of food, consider the possibility of obtaining food or nutrients in unconventional ways, possibly using non-traditional ingredients. A large amount of attention is being paid to getting protein through biomass. Besides the commercially obtained yeast protein with traditional carbohydrate substrates, there is now promise in producing microbial biomass protein using other carbonaceous substrates, in particular natural gas, methane, petroleum distillates containing n-alkanes of C12-C22, etc. The vast increase in the price of oil means production becomes economically inefficient, and therefore, many states are abandoning the production of proteins in this way. Other possible sources of protein are some algae since the cultivation can reach up to1.5 tons of matter during one day in a 1m2 area. Since dry matter contains 50 - 60% protein, it would be a significant source of protein. It is assumed that this could make the quantity that would correspond to 22 tons of proteins derived from 1 hectare per year. The limiting factor is the required amount of solar radiation. However, if artificial luminous sources were used, energy consumption would be disproportionately high. The meat of the future will grow up in a lab, where it will grow from stem cells in bioreactors. Mark Post, from Maastricht University, has been experimenting with growing artificial meat for many years and says that the goal is near. From the stem cells of pigs, fed by horse blood serum, he has successfully grown muscle tissue. At a press conference in September 2011, Mr. Post officially confirmed that in six months he would offer to the public the first sausages made through this scientific process. Realistic solutions seem focused on getting protein from seafood. Seafood contains avaluable protein concentrate called ‘Fish Protein Concentrate’ (FPC), but even so, it is not an inexhaustible resource. The more polluted the seas and oceans become, the bigger the threat of a breach to the ecological balance. Increased attention is therefore devoted to the production of microbial protein, obtained on carbon substrates. The primary source of carbonaceous material would have been cellulose from uneconomically used waste wood materials or other phytomass. The extraordinary role here seems to be played by Biotechnology (obtaining the necessary amount of depolymeras etc.). Workers from the famous Calvin Laboratory at the Technical University of Munich, approached formation of the first protein during their experiments dealing with the hydrolysis of different polymers of hydrogen cyanide. The two scientists on this project, Matheus and Moser, managed to suggest the possibility of obtaining starch from cellulose as a muchmore promising avenue for creating protein. Essentially, it is a way of obtaining glucose from cellulose, which is then converted into starch under the influence of D-glucose-6-fosfotransferasy (hexokinase), ATP and the phosphorylase. An experimental project was prepared quite a while back to gain 100 tons of starch per day at a cost of about $ 0.2/ kg. Another procedure to obtain starch from glycerol is using six enzyme types where two of them require ATP. The synthesis of the starch takes place via glyceraldehyde, glucose and fructose. So far, it does not appear that they could realize the synthesis of carbon dioxideover a fixed 15 step reaction involving 12 enzymes. Four of the required enzymes can be conveniently immobilized. Difficulties are with obtaining enzymes and the preparation of necessary coenzymes known as NADPH and ATP. In any case, the issue of synthesis of nutrients by imitating their biosynthesis is the current field of study within modern biotechnology. Time will show if this will be successfully done and if so, it will be a valuable contribution to ensure the sustenance of man kind.

80
Alternative food sources The assumption that the causes of food in security such as poor agricultural performance and low economic growth, among other things, brought agricultural engineers to address the idea of biotechnology (the use of biological systems for the production of organic products)and genetically modified organisms (GMOs), as a key solution to the problem of hunger. On the one hand, these methods increase yields and nutritional value of food, but on the other hand, these technologies are mostly financed and controlled by large companies that sell them at a higher price keeping it out of reach from poor farmers. There are also concerns about potential risks arising from the increased use of chemical fertilizers and pesticides, especially for their adverse effects on human and animal health, and because of their negative impact on the environment. Enthomophagy3 Currently, the consumption of insects and invertebrates (aquatic species, snails, molluscs and crustaceans) is mainly spread in Central and South America, Africa, Asia and Australia. In Africa, Southeast Asia and the northern part of Latin America, this large group of animals is not only a sought after delicacy, but sometimes a sustenance that lives literally depend on. In the developed world, especially Europe and North America, the reliance on this food group significantly lags behind. Dutch entomologist Arnold van Huis, a professor at Wageningen University, has been involved in promoting the idea of a return to a classic diet using insect meals as an alternative source of nutrition. Mr. van Huis has been dealing with tropical entomology since 2001 and is the coordinator of the interdisciplinary research program of the Convergence of Sciences (CoS). [5] At present, the university entomological laboratory under his leadership is conducting a basic and applied four-year research program called SUPRO2 and is funded by the Ministry of Agriculture. This program delves into the sustainable production of insect protein for human consumption in the period of 2010 to 2013. In the research, Mr. Van Huis and his team work with a farm run by the Callis family. Wageningen University is known for its specialization in food science and nutrition. Mr. Huis, in his lectures dealing with using insects as response to the impending food crisis, says that meat consumption will double in the years 2000 to 2050. This will result in a lack of land for animal husbandry. Professor Huis sees an opportunity in the future to feed the human population by consuming insects. According to Professor Huis, the only major problem is psychological. People might be more accessible and willing to adopt a diet of insects if they could first overcome their prejudices. The largest, and perhaps the only obstacle, is your own ideas of eating insects. Mr. Huis consequently looks for ways to relieve people’s resistance to the insect diet. Besides lectures, he also organizes tastings and cooking classes. Marcel Dicke also aims to promote the mass distribution of this type of diet and organizes lectures on this topic. The World Health Organization has published provision scalled Food defect action levels, which contains the names of edible insects that are safe for human nutrition4. Insects can be consumed in many different ways. In Japan, consumption of insects has been upgraded
3Entomophage in a broader sense is defined as an animal who needs insect for own development. In a narrower sense, the term is defined as the use of insect as form of food, or animal whose predominant part of the diet is insects.[11] 4Scientifically justified criteria for food safety (2003).

81
to a luxury affair where insects are served at top restaurants for considerable sums of money. In Africa or Southeast Asia, the consumption of insects is quite common. [12]
Table 1 Nutritional value per 100g of insects
Energy Protein Fat Hydrocarbons Calcium Iron
Chafer 77,8 13,4 1,4 2,9 22,6 6,0 Bugs (Lethocerus) 62,3 19,8 8,3 2,1 34,5 13,6 Ant 98,7 13,9 3,5 2,9 47,8 5,7 Ant eggs 82,8 7,0 3,2 6,5 8,4 4,1 Silkworm pupae 98,0 9,6 5,6 2,3 41,7 1,8 Beetle 108,3 17,2 4,3 0,2 3,9 7,7 Cricket 121,5 12,9 5,5 5,1 75,8 9,5
Source: RAMOS-ELORDUY, Julieta a Peter MENZEL. Creepy Crawly Cuisine: The Gourmet Guide to Edible Insects. Paperback: Park Street Pr, 1998. The nutritional value of insects is comparable to today’s commonly consumed foods. The composition of the foods used to feed insects can greatly influence future insect meat, making it more nutritious. [11] Powdered vitamins or raw fruits and vegetables can be added to the insect’s diet or to the final product. An insect contains a number of vitamins that are necessary for the human body such as A, C, D, E and B complex. Occurrences of magnesium and zinc explain why food from insects is considered as an aphrodisiac. [12] The presence of trace elements and vitamins is broken down in detail in Table 2. Table 2 Comparison of nutritional value, content of essential nutrients of various insects
and food
Energy (Cal/100 g)
Protein (g/100 g)
Fat (g/100 g)
Carbohydrates (g/100 g)
Silkworms(hoods) 98 9,6 5,6 2,3 Ant 98,7 13,9 3,5 2,9 Cricket 121,5 12,9 5,5 5,1
Inse
ct
Grasshopper 95,7 14,3 3,3 2,2 Roast chicken 162,8 31,4 3,5 - Minced beef 288,2 23,5 21,2 -
Foo
dstu
ffs
Eggs 150,0 12,0 10,0 2,0 Source: . RAMOS-ELORDUY, Julieta a Peter MENZEL. Creepy Crawly Cuisine: The Gourmet Guide to Edible Insects. Paperback,: Park Street Pr, 1998.

82
Table 3 The protein content of insect species as a percentage of dry matter: Name % Protein Dikraunera 56,22 Mealy worm 47,76 Beetle (larvae) 42,62 Weevil (larvae) 55,56 Honey bee (larva) 41,68 Eggs of Corixa and water boatman 63,80 Corixa 53,80 Shield bug 44,10 Ant 58,30 Grasshopper 75,30 Apamea 41,98 Skipper 30,28-51,00 Good Heavens 44,84-59,57
Source: RAMOS-ELORDUY, Julieta a Peter MENZEL. Creepy Crawly Cuisine: The Gourmet Guide to Edible Insects. Paperback,: Park Street Pr, 1998.
Table 4 Taste of insects
Ants sweet,almost nut Ascalapha odorata caterpillars herrin Apamea catterpillars raw corn Crickets and grasshoppers Delicate flavors of other overlap Aquatic insect larvae Fish Coreus Sweet gourd Scales Fried potatoes Moth caterpillars Root Shield bug Apples Termites Nuts The larvae ofwood-destroyin gbeetles Pork skin Auchenorrhyncha Avocados and fried zucchini Wasps Pine seeds Corixa (the adults) Fish, shrimp Eggs of Corixa water boatman Caviar Skipper caterpillars Greaves Meal worms Whole wheat bread
Source: BORKOVCOVÁ, Marie and TEAM, Kitchen insectdiversification.135 s. Brno: Lynx, 2009. Utilization of edible flowers in the diet of the population One alternative natural source of nutrition for the population is edible flowers, which from ancient times have been part of the human diet. New food technology, with fast refrigeration, distribution and eventually preservation, allow edible flowers to be used side by side with industrially treated fresh chilled vegetables and fruits. Globalization has contributed to a greater awareness and in turn, increased the popularity of an oriental life style, as found in countries like China and Japan where there is wide spread consumption of edible flowers and has been such for thousands of years. The main criterions for the evaluation of edible flowers are signs perceived by human senses. These include the identification of an appealing appearance, size, shape, color and especially taste and aroma. [9] The color of flowers is determined by many chemical

83
compounds and in particular, the content of carotenoids and anthocyanins. Edible flowers with a higher amount of anthocyanins are usually correlated with a higher amount of total flavonoids. This is also one of the causes that affect the high antioxidant activity of flowers as compared to most other plant organs. [7] Edible flowers also contain a number of important sensory materials. Examples of taste and protective substances include bitter substances that deliver a pleasant bitter taste such as gladioli, artichoke, dandelion, endive, and radicchio. Also found in this group are aromatic compounds such asallicin (flowersof chives), mucilaginous substances and allantoin (borage), dyes (garden marigold, hibiscus red, peony, etc.) and a variety of medicinal ingredients such as azulene found in chamomile and marigold, flavonoids inchamomile, lavenderoil, black elderberry flavonoids and glucosinolates in nasturtium. [8]. [7] The quality of flowers, which are collected as medicinal plants, is given by the quality standard DIN. [9] Therefore, it is necessary to respect the rules for the safe use of edible flowers, food safety and the possible options for cost-effective use. All post harvest handling of edible flowers until consumption must be maintained at a temperature below 4°C in order to uphold their quality by species, and within 2-7 days. The consumption of edible flowers also takes into account the complex nutrients, essential ingredients and substances that affect human health. The flowers are served mainly as a fresh garnish for various hot and cold dishes. The petals can be used in decorating salads and drinks while foods like pancakes can be decorated with small roses. This assumes preparation of economically efficient cultivation and harvesting technology that would provide a quick and cost efficient background material for the duration of a season. [9] Conclusion FAO is the UN agency for the development of agricultural areas and their activities aim to reduce poverty and hunger. FAO provides development assistance, advice on strategy and planning. They also collect, process and disseminate information and serves as an international forum for debate on issues of agriculture and nutrition. Specific programs run by FAO help countries face food crises and provide help in emergencies. Annual expenditure on these projects represents more than $300 million and sources are made up of contributions from donor organizations and governments. According to the UN Food and Agriculture Organization (FAO), in 2050, there will be nine billion people on the planet in a landscape where agricultural land is gradually decreasing. There are several causes of the economic and food crisis. These include careless attitudes and dealings with the environment, big changes in the weather such as frequent droughts and floods, related crop failures, large amounts of imports and rising consumption and waste of food in developed countries. These have been added as a decisive measure. Added into this, is the speculative fervor in agricultural commodities, the growth in energy prices that is subsequently reflected in the rising prices of fertilizers, pesticides and fuel for agricultural machinery, as well as the increase in bio fuel production (agricultural products grown for the fuel return more than those cultivated for food). Capitalist farms limit the growth of food crops on a smaller size and poorer soil quality). Rising food prices also mean an increasing number of people suffering from hunger. In this crisis, capitalism demonstrates once again that it is the system, with its own deep inner contradictions, manifested even at the global level.

84
Literature: 1. BAILEY, S., Bugfood II: Insects as Food!?!, University of Kentucky Department
of Entomology, Available from http://www.uky.edu/Ag/Entomology/ythfacts/bugfood/ bugfood2.htm, r trie ved October 3, 2008.
2. BORKOVCOVÁ, Marie. GUEST, Personality CT24: Cockroachin batteris a delicacy forconnoisseurs.In: Www.ct24.cz: text-scripts/19129-svab-v-testicku-je-pochoutka-pro-fajn smekry-rika-marie-borkovcova/video[online].Masaryk University in Brno [cit.01.10. 2013] .Available from: http://www.ct24.cz:8080/textove-prepisy/19129-svab-v testicku-je-pochoutka-pro-fajnsmekry-rika-marie-borkovcova/video/1/
3. BORKOVCOVÁ, Marie and TEAM. Kitchen insectdiversification 135 p.. Brno: Lynx, 2009. ISBN 978-808-6787-374.
4. Http://www.r-domain.net/report/www.czso.cz/?check=11347&url=www.czso.cz/csu/ redakce.nsf / news.
5. Is Biotechnology Really the Only Way to Solve Hunger? Consumer ratings of edible flower color, container size, and price. 2001. FoodFirst. Available from: http://www.fooditrg/en/node/2659. HorstScienc.
6. KELLEY, K. M., B. K. BEHE and J. A BIERENBAUM. Consumer preference for edible flower color, container size, and price. HortScience. 2001, vol. 36 (4), p. 801-804 th.
7. KELLEY, K. M., B. K. BEHE and J. A. BIERENBAUM. Consumer ratings of
8. Dible-flower quality, mix and solour. Horttechnology: 2010, vol. 11 (4), p. 644-647th.
9. KOPEC, K. Edible flowerst oliven up the menu. Nutrition and Food, the magazine of the Society for Nutrition. Prague: Výživaservis s.r.o., 2004, vol. 59, No. 2. ISSN 1211-846X.
10. Mlček, J. etal Nutritional and sensory quality of edible flowers. Nutrition and Food, the magazine of the Society for Nutrition. Prague: Výživaservis s.r.o., 2012, vol. 52, No. 2 ISSN 1211-846X.
11. RAMOS-ELORDUY, Julieta. Insects on a plate: cookbookfor lifeassurance: a gourmet guide to the world of edible insects. Prague: Volvox Globator, 1998, p. 126, [8] p colors. Appendix Fig Cookeryat the edge. ISBN 80-7207-193-9.
12. RAMOS-ELORDUY, Julieta a Peter MENZEL. Creepy Crawly Cuisine: The Gourmet Guide to Edible Insects. Paperback: Park Street Pr, 1998. Book Condition: Brand New: original edition. ISBN 0-89281-747-X / 9780892817474.
Contact Mgr. Taťána Karásková
Department of Tourism Business Administration Faculty in Karviná Silesian University in Opava Na Rybníčku 626/1, 74601 Opava - Předměstí Czech Republic E-mail: [email protected]

85
Marcel Kordoš
FACULTY OF SOCIAL AND ECONOMIC RELATIONS ALEXANDER DUBČEK UNIVERSITY IN TRENČÍN
TRANSATLANTIC BUSINESS DIALOGUE AS A KEY ELEMENT OF
US-EU ECONOMIC PARTNERSHIP Abstract The U.S.-EU economic relationship dominates the world economy by the sheer size of their combined economies. Developing the Transatlantic Agenda is a response to the desire to strengthen the relationship between the United States and the European Union in order to enhance and maintain world stability. The Trans-Atlantic Business Dialogue (TABD) was conceived to promote closer commercial ties between the U.S. and European Union. It offers a framework for cooperation between the transatlantic business community and the governments of the European Union (EU) and United States of America (US). U.S. and EU policymakers continually face the task of how to manage the increasingly complex bilateral economic relationship in ways that maximize benefits and keep frictions to a minimum. Key words: International economics, US-EU economic partnership, World Trade Organization, international business environment, Transatlantic Business Dialogue. Introduction
U.S.-EU economic relations exist within a framework of economic, political and security factors. Some of these factors have promoted closer economic relationships, while others have created tensions that have, at times, threatened to undermine the relationship.
The U.S.-EU economic relationship dominates the world economy by the sheer size of their combined economies. The combined population of United States and the EU members approaches 800 million people who generate a combined gross domestic product (GDP) that is roughly equivalent to 42% of world GDP in 2011. Combined EU and U.S. world trade accounts for over 40% of all world trade. In other words, the U.S.-EU economic relationship has clout.
The United States and the EU member countries are of roughly equivalent levels of economic development and are among the most advanced in the world. As a group they include the world’s wealthiest and most educated populations. The United States and the members of the EU, with a few exceptions, are major producers of advanced technologies and services. As a result U.S.-EU trade tends to be intra-industry trade; that is trade in similar products, such as cars and computers, dominate two-way trade flows. Furthermore, the United States and the EU have advanced and integrated financial sectors which facilitate large volumes of capital flows across the Atlantic. The Transatlantic Business Dialogue framework
The Transatlantic Business Dialogue (TABD) offers a framework for cooperation between the transatlantic business community and the governments of the European Union (EU) and United States of America (US). Structure of the TABD
The TABD is Co-chaired by a US and European CEO and/or chairman for a period of two years. The Co-chairmen lead an Executive Board of another 29 CEOs and/or chairmen representing major American and European companies with strong transatlantic

86
credentials, who together make up the membership of the TABD. The Executive Board agrees on the direction for the TABD, its activities both short and long term. The TABD is convened by the US Administration and the European Commission, and it is this mandate that allows the TABD to exist. On the US side, the mandate comes from the Department of Commerce. On the EU side, the mandate comes from the European Commission, and the Presidency of the European Union. Other US and EU government agencies and departments are included in the dialogue, specific to a particular issue addressed by the TABD. The TABD is funded exclusively by the companies that participate in the process. Activities
The TABD meets at the senior level, or the Executive Board, twice per year to lay out the priorities of the business community and direction of the TABD process. Throughout the year, the working level representatives of these companies meet to discuss the details on the recommendations established by the Executive Board. Outreach to other companies and business organizations are conducted at this level to ensure that the TABD's recommendations represent the widest business consensus possible. The TABD works in close cooperation with its conveners in the U.S. Administration, the European Commission and the Presidency of the European Council. The TABD also keeps legislators in the European Parliament and the US Congress informed of its activities. TABD´s key agenda
TABD thinks that the way to foster innovation, expand economic growth and promote job creation in the U.S. and Europe is to establish a Barrier-Free Transatlantic Market. A key feature of a Barrier-Free Transatlantic Market is an open investment climate. An essential element is closer regulatory cooperation to speed up the removal of existing barriers to trade and investment and to avoid the creation of new ones. Other key priorities include the integration of transatlantic capital markets, joint action to balance security concerns while facilitating trade and the movement of people; stimulating transatlantic innovation and protecting and enforcing intellectual property against counterfeiting and piracy. Maintaining an open investment climate
No other commercial relationship in the world is as broad and as deep as the transatlantic commercial relationship, which is illustrated by staggering levels of investment: in 2005, U.S. foreign direct investment in Europe and European foreign direct investment in the U.S. each exceeded $ 1 trillion. Despite the demonstrated benefits of foreign investment, the TABD is concerned about protectionist tendencies limiting an open investment climate. Politicization of the investment review procedures and resulting protectionism drives up costs, enhance risk, hold back review procedures and generally generate business uncertainty that is inimical to cross border investment. (www.usembassy.org.uk, 2012) Accomplishments � Adoption of the Framework for Advancing Transatlantic Economic Integration. The
Framework was adopted at the 2007 US-EU Summit and reflects many of TABD’s policy priorities towards realizing the Barrier-Free Transatlantic Market. The Framework foresees in the establishment of a Transatlantic Economic Council, which will adopt a work program to achieve the objectives of the Framework, and will oversee progress towards these objectives. The TABD has been chosen by the Summit Leaders to represent the transatlantic business community on the Advisory Council that sits with the Transatlantic Economic Council.

87
� Convergence of accounting standards. The U.S. Securities and Exchange Commission (SEC) has made proposals to eliminate the reconciliation requirement for foreign private issuers who comply with International Financial Reporting Standards (IFRS) as approved by the International Accounting Standards Board (IASB). This is an important step on the roadmap towards convergence of IFRS and US Generally Accepted Accounting Principles (GAAP), which has been a long-standing TABD priority.
� Implementation of a transatlantic Innovation Healthcare agenda. In 2007, the TABD organized a high-level conference on innovation-related healthcare issues. US Deputy Secretary of Commerce Sampson and EU Commission Vice-President Verheugen endorsed the recommendations coming out of the conference.
� Joint EU US action in third countries to protect intellectual property rights. Through the efforts of TABD and others, the US and EU agreed in 2006 a EU- US Action Strategy for the Enforcement of Intellectual Property Rights, naming the TABD as a key interlocutor for both strategy development and execution.
� The establishment of the transatlantic Regulatory Cooperation Forum in 2005. Previously, the TABD had helped finalize negotiations on the US-EU Guidelines for Regulatory Cooperation by proposing specific language on "operational transparency" to break the impasse between the governments. (www.tabd.com, 2012)
Establishment and current issues of the TABD
Originally the idea of the late U.S. Secretary of Commerce Ron Brown, the Trans-Atlantic Business Dialogue (TABD) was conceived to promote closer commercial ties between the U.S. and European Union. Brown, together with his counterparts in the European Commission, Martin Bangemann and Sir Leon Brittan, created the dialogue system as a mechanism to encourage public and civil society input to fostering a more closely integrated transatlantic marketplace. Both governments saw their business communities as a resource to provide innovative ideas into further expanding economic interaction while also reducing costly inefficiencies resulting from out-dated regulatory and legislative practices. Bangemann, Brittan and Brown sent a joint survey to over 1800 firms asking for their advice, input and commitment to the new dialogue process.
Based on the responses received, Xerox Corporation and Goldman Sachs International offered to begin preparations for a wide-ranging CEO-level meeting in Seville, Spain in November 1995. The first TABD CEO Conference resulted in over 70 recommendations to the EU-US Presidential Summit held in Madrid in December 1995. This dialogue system was also a key part of the governments' 1995 New Transatlantic Agenda (NTA), which laid out a plan to enhance overall transatlantic economic and political relations. (Krajňáková, 2013) Re-launching the TABD
In 2003, the decision was taken to re-launch the TABD in a new format, with a new structure, membership, and focus. Under the leadership of Douglas Daft of the Coca-Cola Company and Niall Fitzgerald of Unilever, the TABD adopted an overarching goal of the creation of a Barrier-Free Transatlantic Market. At the same time, the TABD extended the length of the role of the chair company to two years instead of one, and decided to hold two annual Executive Board meetings instead of one annual CEO conference, which were to take place on the margins of the annual US-EU Summit and the World Economic Forum meetings in Davos, Switzerland.
The ''new'' TABD Executive Board met for the first time in June 2004 on the margins of the EU-US Summit in Dromoland, Ireland, where the TABD outlined its new vision, set out the agenda priorities to achieve a Barrier-Free Transatlantic Market, and called on EU and US political leaders ''to regain a shared sense of mission that will push forward the frontiers of

88
transatlantic cooperation to stimulate innovation, investment and the creation of new jobs.'' The response from the Summit meeting in Ireland was adoption of the goal of greater transatlantic economic integration and the start of work on a ''forward-looking strategy'' for achieving it.
In June 2005, the TABD Executive Board met on the margins of the US-EU Summit in Washington DC, where the TABD report to the US-EU Summit prioritized the goal of achieving progress towards a Barrier-Free Transatlantic Market. Among the main TABD recommendations were the creation of a Regulatory Cooperation Forum (RCF) and the development of a joint US-EU strategy to fight counterfeiting and intellectual property rights violations in third countries. Both these recommendations were adopted by the US and EU, as well as a broad-based work program covering more than a dozen areas of activity very much in line with TABD priority recommendations. (europa.eu, 2012)
Biotechnology crisis
Despite its privileged role in transatlantic policy relations, there are fortunately real limits to the TABD's powers. This has become clear for instance in the case of biotechnology. Market access for genetically modified products has been top of the TABD's agenda since the start in 1995, but despite continued support from the EC and US government the business dialogue has failed to find an effective response to snowballing consumer opposition.
In the TABD's Agri-Food Biotechnology group, US and EU industry has been united in striving for ways to overcome restrictions imposed by European governments. While often described as a battle between US and Europe, the real struggle is between the transatlantic business-friendly elite, and consumers in Europe and in the US. Together, the EU and the US government, with the biotech industry, have been working to find ways around hostile public opinion. Throughout the process, EU and US officials have adopted many of the TABD's proposals, such as the pilot project on biotechnology approvals (a step-by-step process, starting with harmonized EU and US data requirements for new GM products). The results, however, have been rather limited. (www.tda.gov, 2012) Critical and priority issues
However, despite the continued far-reaching commitment and involvement of the European Commission and the US government, the TABD's 'success rate' has diminished in recent years. Among the reasons for the loss of momentum is the growing opposition against key TABD goals such as free trade in genetically modified organisms (GMOs) and a new round of trade and investment deregulation talks in the World Trade Organization (WTO).
Established in 1995, the TABD is undoubtedly the most far- reaching international corporate-state alliance. With a mandate from the US government and the European Commission, the 150 large corporations that make up the TABD work meticulously to identify "barriers to transatlantic trade." In effect, this means any regulation or policy proposal that does not fit the corporate agenda on either side of the Atlantic. While the TABD's demands closely resemble those of corporate lobby groups, it is far more than just another industry group seeking political influence for its member corporations. The deep engagement of the US government and the European Commission in the TABD process sets it apart - and makes it dangerous.
After the wave of early successes, the TABD's main impact in the last few years seems to have been "defensive" - delaying, weakening or even dismantling a wide range of existing and proposed regulations, most of which aimed to protect the environment, consumers and workers. A recent example is the planned EU ban on marketing of animal-tested cosmetic products, which the TABD has opposed since its 1999 Berlin Conference. The TABD brought the proposal into the EU-US Early Warning system, claiming that a ban would violate WTO

89
rules. The European Commission first decided to postpone the ban until June 2002, and then proposed to replace it with a reduced testing ban only within the EU. This would mean that cosmetics that are tested on animals in countries outside the EU could still be marketed within the EU. The European Parliament is meanwhile trying to defend a combined testing and marketing ban. The TABD has also successfully pressurized the European Commission into watering down a draft directive on Electrical and Electronic Equipment that has now entered the final stages of EU decision-making. Mirroring demands of Brussels industry lobbyists, the TABD wants to reduce the scope of proposed bans on toxic materials as well as to limit producer's responsibilities for take-back and recycling of products. (europa.eu, 2012)
Other "CEO Priority Issues" include the resolution of outstanding EU-US trade disputes, including disagreements over the EU ban on hormone-treated beef and US tax rules subsidizing US-based exporters. The TABD calls for increased and more effective use of the Early Warning system, in which officials negotiate changes in proposed rules and regulations in order to prevent new open trade conflicts from arising. Issues that the TABD has brought into the Early Warning system include restrictions on EU market access for genetically modified agricultural products, and the plans for phase-out of HFCs (greenhouse gas used in refrigerators) as well as the aforementioned ban on animal testing for cosmetics and the proposed EU legislation on recycling of electronic and electric waste. To further tighten corporate control, the TABD demands that trade interests are further 'up streamed' in the decision making process, for instance through 'trade impact assessments' for all new regulatory and legislative proposals. (www.ustr.gov, 2012)
The TABD's call for a beefed-up Early Warning system has strong support in the US government. Instead of bringing conflicts to the WTO dispute settlement system, which more often than not leads to open trade wars (beef-hormone, bananas, etc.); the US wants a "bilateral, pre-WTO" system in place in the transatlantic arena. Certainly a second layer of WTO-style 'dispute settlement mechanism' would strike a blow against progress on environmental and social issues. Conclusion
While it is hardly surprising that large corporations remain enthusiastic about the TABD process, it is remarkable that the political support for the business dialogue remains largely unchallenged. The European Commission, which has embarked on a charm offensive since Seattle and claims to want to "harness globalization" and give it a "human face', continues to empower the TABD, working to implement its recommendations. It refuses to see that shaping its regulatory and international trade policies around corporate priorities is fundamentally at odds with environmental and social progress, let alone democratization of decision-making.
Despite the continued support from the European Commission, the TABD's future looks uncertain. Widespread opposition to GM food is only one example of the enormous potential of grassroots activism to interfere with the corporate trade agenda. As campaign groups pursue progress in social, environmental and consumer protection and defend their achievements against corporate counter-campaigns, government officials will be increasingly unable to respond to the TABD's calls for implementation of business demands. The effect will be to further slow down the TABD's momentum and effectively undermine the process.
In conclusion generally we can say that further TBD effective work regarding the enhancing of US and EU corporations to be more involved in mutual EU-US trade relations is somewhat uncertain. On the other hand the TABD still remains a very important key element within the transatlantic economic relations being able to promote the US-EU economic ties in the international economics trade and business environment.

90
Literature:
1. Cihelková, E. a kol. (2009). Světová ekonomika. Obecné trendy rozvoje. 1. vyd. Praha : C.H.Beck, 2009.
2. Cooper, William H.: EU-U.S. Economic Ties: Framework, Scope, and Magnitude. In: International Trade and Finance, March 20, 2009.
3. Hamilton, L., Webster, Ph.: The International Business Envirnoment. Oxford University Press, 2009.
4. Jovanović, M. N. (2005). The Economics of European Integration. Edward Eglar Publishing UK, USA, 2005.
5. Krajňáková E. (2013). Riadenie amerických nefinančných korporácií. In: Finančné trhy. Január 2013, roč. 10, č. 8. ISSN 1336-5711.
6. Lipková Ľ.: Medzinárodné hospodárske vzťahy. Sprint, Bratislava 2005.
7. Lipková Ľ.: Európska únia. Sprint, Bratislava 2011.
8. Neumann, P.: Bilance ekonomiky a hospodářské politiky USA na prahu nového tisíciletí. In: Aktuální otázky ze světové ekonomiky. Praha : VŠE, 2001, č.7.
9. Todaro, P. M.: Economic Development. New York University, New York, 2000.
10. The Transatlantic Economic Partnership Overview and Assessment (2000).
www.doc.gov - Dept. of Commerce.
11. U.S. State Department Bureau of European and Canadian Affairs. (2012). U.S.-European Union Relations. [online]. [acc. 2012-10-15]. Available at: http://www.state.gov/www/ _http://www.state.gov/www/_
12. Transatlantic Declaration on EC-US Relations. (2012). [online]. [acc. 2012-10-15]. Available at:
http://europa.eu.int/en/comm/dg01/decl.htm, http://europa.eu.int/en/comm/dg01/ decl.htm_
13. The New Transatlantic Agenda. (2012). [online]. [acc. 2012-11-11]. Available at: http:// europa.eu.int/en/comm/dg01/agenda.htm _http://europa.eu.int/en/comm/dg01/ agenda.htm_
14. U.S. Embassy, London, England. 04-12-95 Fact Sheet: The New Transatlantic Agenda. (2012). [online]. [acc. 2012-10-24]. Available at: http://www.usembassy.org.uk/nta2.html _http:// www.usembassy.org.uk/nta2.html_
15. The European Union. (2012). Transatlantic Agenda. [online]. [acc. 2012-11-19]. Available at:
http://www.eurunion.org/partner/agenda.htm_http://www.eurunion.org/partner/ agenda.htm_
16. The New Transatlantic Agenda. (2012). [online]. [acc. 2012-11-15]. Available at: http:// europa.eu.int/en/comm/dg01/agenda.htm_http://europa.eu.int/en/comm/dg01/ agenda.htm_
17. European Union - Summit Press Package: New Transatlantic Agenda Senior Level Group Report to the EU/US Summit London, 18 May 2012. [online]. [acc. 2012-11-14]. Available at:
http://europa.eu.int/en/comm/dg10/0518slg.htm

91
http://europa.eu.int/en/comm/dg01/ 0518slg.htm_
18. http://www.ustr.gov – (Office of the U.S. Trade Representative)
19. http://www.tda.gov – (Trade and Development Agency)
20. http://www.tabd.com – (Transatlantic Business Dialogue)
Contact
Ing. Marcel Kordoš, Ph.D. Faculty of Social and Economic Relations Alexander Dubček University in Trenčín Študentská 2, 911 50 Trenčín Slovak Republic E-mail: [email protected]
92
Aisulu Kozhabayeva
FACULTY OF INTERNATIONAL RELATIONS UNIVERSITY OF ECONOMICS IN BRATISLAVA
ENERGY POLICY IN KAZAKHSTAN:
TENDENCIES AND RISKS
Abstract Kazakhstan, being a young sovereign country which has rich deposits of oil and natural gas, attracts the interests of energy consuming states. Landlocked position and weak infrastructure makes the country lead a more active foreign policy based on the energy factor. Complex geopolitical environment and relatively small, young economy of Kazakhstan emerge as the main reasons for conducting multi-vector and balanced foreign policy. In this paper the author tries to define the peculiarities of the energy policy of Kazakhstan focusing on the relations Russia, China, the USA and the European Union. Key words: energy policy, Kazakhstan, oil, gas, USA, China, Russia, EU. Introduction With energy prices reaching new heights, sources of oil and natural gas outside the Caspian region is gaining more importance in the World Energy Space. The Caspian region has the third largest oil and gas deposits in the world after the Persian Gulf and Russia. In contrast to the Gulf, it demonstrates relative political stability and a lower level of terrorist threats and religious strife1. Kazakhstan has emerged as a regional leader and an example of successful economic development for the rest of the new independent Central Asian states. During the Soviet era, Kazakhstan in particular and the Caspian basin in general comprised the de facto strategic petroleum reserve of the Soviet Union. Although discovered in the 1970s and 1980s, the large hydrocarbon deposits of the Caspian region remained practically unexplored until the mid-1990s. The giant Tengiz oil field was the only exception. Work on this field started in the late 1980s. As part of Mikhail Gorbachev’s policy of openness to the West, the Soviet Union signed a major investment deal with US-based Chevron, which became the first major Western corporation to enter the country. After the collapse of the Soviet Union and getting independence, it was obvious that Kazakhstan would lead its external policy based on hydrocarbon reserves. It ranks the second place after Russia on this parameter among all former soviet republics. Due to rich natural resources inside the borders and the Caspian Sea Kazakhstan attracts attention of powerful energy consuming states, which are playing a “New Great Game” around the Caspian’s energy resources. In this new geopolitical reality, the region is drawing increasing attention from the U.S., Russia and China as well as Europian Union. Energy sphere was and remains as one of the basic factors that shape both internal and external policies of Kazakhstan, as well as those of other actors such as Russia and the European Union. This report reviews the development and future prospects of independent Kazakhstan`s policy in the energy sector, through the prism of its uneasy but to date relatively
1 COHEN, A. 2008. Kazakhstan: The road to independence. Energy policy and the birth of a Nation. The Central Asia-Caucasus Institute & Silk Road Studies Program, 2008. Printed in Singapore. ISBN: 978-91-85937-36-3.

93
successful relations with the world’s most powerful geopolitical players and risks threatening the energy security. Energy resources of Kazakhstan Kazakhstan owns large reserves of energy resources, and therefore the energy policy of Kazakhstan has influence over the world's overall energy supply. Although Kazakhstan has not described itself as an energy superpower, Kazakhstan's president Nursultan Nazarbayev has claimed Kazakhstan will become a factor of energy security in Asia and Europe2. Kazakhstan has a strategic geographical location to control oil and gas flows from Central Asia to East (China) and West (Russia, global market). According to BP statistics 2011:
- Kazakhstan's proved oil reserves account for 6,5 billion tons (39,8 billion barrels), 3,2 % of world's reserves.
- Proved gas reserves amount to 1,82 trillion m3, 1,7 % of world's reserves. - proved uranium reserves - 1,69 million tons, 21 % of world's reserves.
Table 1 Kazakhstan's place in the world's energy reserves and production
Source: BP statistics 2011 http://www.bp.com/sectionbodycopy.do?categoryId=7500&contentId=7068481 The New Great Game and Energy policy of Kazakhstan New Great Game: Multi-Vector Energy Geopolitics Competition among the global actors in the Caspian and Central Asian regions has prompted many analysts to compare the situation with the “Great Game”—a confrontation between the Russian and British empires for influence in Central Asia in the 19th century. In the 21st century, however, more players are competing for presence in the region3. The struggle for Caspian energy resources that started right after the independence of the Central Asian countries was actually a quest for laying down pipelines and buying concessions over Central Asian oil and gas fields. Four key powers dominate the geopolitical landscape around Kazakhstan’s sector of the Caspian Sea—Russia, China, the U.S., and Europe. Kazakhstan has chosen a path of transparency concerning the country’s foreign policy in order to maintain a balance of external interests. Over the years Nazarbayev, regardless of the geopolitical climate at the time, has undertaken Eurasian integration initiatives, as well as consulting with the political leadership in Moscow, Washington and Beijing on all important projects in the oil and gas sector. This multi-vector policy course has thus far prevented a single global political player from achieving complete hegemony over Central Asia.
2 Roberts and Cohen,. 2012. 3 COHEN, 2008.
Reserves in the world Production in the world
Oil 9th place Oil 18th place
Gas 14th place Gas 14th place
Uran 3d place Uran 1st place
Coal 7th place Coal 10th place

94
Kazakhstan has seen a significant increase in foreign investment following its independence and there are now a number of international oil companies that are involved in the country's major projects. Chevron holds the largest stake of any foreign international oil company (IOC) and is the largest producer in the country. It has a 50-percent stake in the Tengiz field and a 20-percent stake in the Karachaganak field. Chevron has been operating in Kazakhstan for decades, having entered the country during the Soviet era. In addition to Chevron, other IOCs operating in Kazakhstan are ExxonMobil, Shell, Total, ConocoPhillips, Eni, CNPC, PetroChina, LUKoil, as well as a number of other smaller international oil companies. Russian vector For Kazakhstan, Russia is an important partner in the political and economic fields. Energy is a sphere which demonstrates the interconnections and the interdependence between policy and economy. For both Russia and Kazakhstan, cooperation in the energy sphere is considered as the main feature of their foreign policy. In the economic sphere both countries share a common energy infrastructure that was constructed during Soviet period. The Atyrau-Samara pipeline was the only route through which Caspian oil could be transported abroad, to Europe. The Central Asia-Center (CAC) gas pipeline has been connecting with Turkmenistan, Uzbekistan, Kazakhstan, and Russia for 40 years. In 2001 the new oil Caspian Pipeline Consortium was launched. Three states Russia, Kazakhstan and Oman and eight companies divided the shares of the CPC, but the largest belongs to Russia. Today oil is transported to Russia by land pipelines, while transportation to Europe bypasses Russian territory by going through the Caspian Sea with tankers. The former way is cheaper and more effective. Kazakhstan has the only export route (CAC), which carries natural gas to the European part near to Russia. However, due to its landlocked position in the center of the continent, Kazakhstan always needs to rely on the good will of its neighbors for transporting oil and gas4. Kazakhstani party supplies its gas through CAC gas pipeline only till the Kazakh-Russian border, which is then processed at the Orenburg gas processing plant. One part of the processed gas in accordance with the agreements goes to Kazakhstan; the other part goes to export. But Kazakhstan is not directly involved in the export transactions, that is to say, “not admitted” to the Russian pipeline system. Gazprom's monopolistic domain of transport infrastructure is certainly a limiting factor in the expansion of export opportunities of Kazakhstan in the supply of gas to the world markets. The fact that both countries are getting closer during recent years and heading the same integration processes5, can favor Kazakhstan's export opportunities through Russia. The most effective organization in the energy field is the Eurasian Economic Community, whose members, Belarus, Kazakhstan, Kyrgyzstan, Russia, and Tajikistan have committed themselves to adopting common policies on trade, migration, currency exchange, and infrastructure development. In the framework of this organization the Customs Union and Common Economic Space between Russia, Kazakhstan and Belarus have the following positive tendencies: the Customs Union expands opportunities to accelerate movement of goods, increasing the volume of trade between the member countries; and the Common Economic Space allows to realize such relevant for Kazakhstan legal norms as non-use of quantitative restrictions in the mutual trade by the parties and export duties, uniform tariffs for
4 Yesdauletova, 2009. 5 the Eurasian Economic Community (EAEC), the Customs Union (Russia, Belarus and Kazakhstan), Common Economic Space (Russia, Belarus and Kazakhstan) and the Collective Security Treaty Organization (CSTO).

95
the transit of hydrocarbons, non-discriminatory access to the pipeline system of the member countries. However, as the practice shows6, effective cooperation of Kazakhstan with the countries of Customs Union in the petroleum sector is undermined by several problems: 1. Incoordination in the formation of tariffs for the transit of oil and gas resources. 2. Lack of equal access to the Russian gas transportation system for Kazakh gas. These problems are a deterrent to enhance integration and cooperation. It appears that these problems will be solved in the framework of the Common Economic Space, that creates the conditions for the free movement of goods, capital, services and labor. Nevertheless, the unresolved problem within the Common Economic Space remains the fact, that the accepted agreement on the rules of access to services of natural monopolies in the sphere of gas transportation, including the basis of pricing and tariff policy, regulates only the relations of gas supply within the Common Economic Space. In the respect further development of integration within the Common Economic Cooperation supposes the adoption of measures to improve the regulatory framework and the creation of conditions for cooperation between oil and gas complexes of the member countries. American vector USA energy companies (Chevron) were among the first non-CIS foreign investors in Kazakhstan. According to the contract, oil reserves of 6-9 bn barrels will be developed in one of the largest oil-fields of the world by Kazakh – American joint venture Tengizchevroil over 40-year period . At the end of 1990s and the beginning of 2000s the USA began to take more active policy position, which was linked to the aim to weaken the geopolitical influence of Russia and become more independent in the transportation of oil and gas. Russia`s parliament refused to ratify the Energy Charter Treaty; consequently the foreign firms were not allowed to access the transportation infrastructure in the Russian Federation. Therefore, the USA and the EU agreed to construct a new pipeline bypassing the Russian Federation, which was more a political decision than economic. Although the Baku-Tbilisi-Ceyhan (BTC) was not economically effective because the transportation took place through the troubled areas of Caucasus (Nagorny Karabachos and Gerorgia), after series of negotiations, Kazakhstan decided to join this western oil pipeline in June 2006. BTC was the first route that would avoid the Russian territory and diversified oil export, on one hand. On the other hand, Kazakhstan needed the support of the United States in geopolitical terms and definiely it needed the foreign investments. The USA invested the essential amount into Kazakhstan, total up to 13.8 bln doll from 1991-2007, which is about 30 % of all the direct foreign investments to Kazakhstan7. Chinese vector Today China, breaks down the US monopoly in the regions called by the USA as „the zone of its strategic interests“ - the Middle East, Central Asia, the Caspian region, Latin America. China is a relatively new actor in Central Asia. In 1980s China was main exporter of hydrocarbon in East Asia region. But since 1993 the Chinese People's Republic has been an importer of oil and gas8. Nowadays China is the second consumer of energy in the world, right after the United States.
6 Rakhmatulina, 2011. 7 Yesdauletova, 2009. 8 Korzhanevsky N. 2005.

96
Until recent years, the West and the European markets played a more important role in the energy trade of Kazakhstan as well as Russia. However the eastern direction is gradually becoming the main export route in Kazakhstan. The first step was undertaken in June 1997, when Chinese National Petroleum Company acquired a 60.3% stake in AktobeMunaiGas. Since then the chinese investments in the energetic spere of Kazakhstan reached 1,5 bln. doll. In 2004 the agreement on the construction of the pipeline Atasu-Alashankou was signed. In 2005 the first sector of the pipeline with the capacity of 20 million tonnes per year was launched. Therefore, Kazakhstan is approaching its main goal to diversify transit routes. Kazakhstan and China collaborate on a bilateral and regional level. In 2006 within the framework of the Shanghai Cooperation Organization its members announced the formation of the Energy Club. The main aim of this club is to coordinate efforts and exchange information in order to integrate countries into a common energy market connecting six states—China, Kazakhstan, Kyrgyzstan, Russia, and Uzbekistan which are the members of the SCO. The idea of creating energy club of SCO countries is strongly supported by Kazakhstan. As Sheryazdanova pointed out, “it is one of key projects, where Kazakhstan's role in the future can essentially increase. Energy policy becomes the main expression of multiplicity principle”9. However American and European scholars and politicians are more skeptic about this initiative. Matusov states that “the agreements which have emerged in the energy sphere are not products of the SCO, primarily they are reached outside of the SCO framework, or bilaterally, meaning it is quite conceivable that these deals would have been signed even if the SCO did not exist”. In addition, many authors share the opinion that China and Russa are becoming competitors in Central Asia more than being partners10. In spite of the widespread opinion that China has an expansion policy in Central Asia, Chinese scholars are convinced that China „has very limited national interests as a great power outsider in the Caspian region. It has no intention but normal commercial consideration“11. European vector Growing disbalance between demand and supply during the last years (reduction of oil, natural gas and coal) and disputes between Russia and Ukraine in 2006, Russia and Belarus in 2007, the EU began to seek alternative sources of energy, and the Caspian countries formed a such group. It adopted a lot of documents during 2006-2008 period: Green Paper „A European strategy for sustainable competitive and secure energy“, „External energy relations – From principles to action“, „Action plan for the period 2007-2009“, in 2006 the Memorandum of Understanding with Kazakhstan, „The EU and central Asia: Strategy for a new partnership“ and others. Kazakhstan`s relations with the countries of EU rest on a framework of agreements, the most important of which is Partnership of Cooperation Agreement (PCA). The EU assisted Kazakhstan and other Central Asian countries with the programs of the Interstate Oil and Gas Transport to Europe (INOGATE) and Transport Corridor Europe-Caucasus-Asia (TRACECA). TACIS was one of the first programs that provided technical assistance to the post-Soviet countries. At the same time, the implementation of the European strategy faces some serious obstacles. Other states, first of all, Russia and China have stronger positions in Central Asia. However, Kazakhstan`s political leaders make attempts to keep a balance between Russia and China. Still, the EU has some advantages in its relationship with Kazakhstan. First, the EU is able to offer essential foreign investments and programs. The purpose of TRACECA and
9 Sheryazdanoca K. 2008. 10 Blagov, 2007; Marat and Murzakulova, 2007. 11 LY Gang, 2005.

97
INOGATE programs is to ensure that the development of Caspian Basin`s energy reserves serves European interests. In contrast, Russia cannot invest in Kazakhstan`s economy since it needs a great sum of investments for improving its energy infrastructure. The EU invested 1.3 billion Euros from 1991 to 2006. The new strategy declared that in order to reflect greater EU engagedmen in the region, the EC assistance budget to Central Asia will be significantly increased under the new financial perspectives of 2007-2013 to a total of 750 million. Euros, with the average annual allocation to the region under the development cooperation instrument increased from 58 million in 2007 to 139 million in 201312. Conclusion Due to Kazakhstan's complex geopolitical position and the development of the so-called Great Game among powerful countries like the USA, Russia, China and the EU, Kazakhstan strives to achieve a balance and advantage from the situation. In my opinion, Kazakhstan will follow the multi-vector energy policy in the future. Nevertheless, Russia can be distinguished among other players. Both Kazakhstan and Russia are exporters of energy and in general share common views on the energy policy, while the USA the EU and China represent consumer countries. On the other hand, Kazakhstan has shown that it does intend to conduct a more independent foreign course, and seeks to be a more equal partner in the Western or Chinese business relationships. Also, the energy sector forms a large part of the revenues in the state's budget, representing almost 30% of GDP and 60% of all exports. Undeveloped domestic small and medium business and the one-side oriented economy make the government rely on energy trade and try to support all transit routes while they guarantee increasing income. Therefore, not only geopolitical imperatives, but also economic reasons lay in the basis of multi vector energy policy. Literature:
1. BLAGOV, S. 2007. Russia urges formation of Central Asian Neregy Club. [online]. Available at:
http://www.eurasianet.org/departments/insight/articles/eav110707a.shtml.
2. BP STATISTICS. 2011. [online]. Available at: http://www.bp.com/sectionbodycopy.do?categoryId=7500&contentId=7068481
3. BY LY GANG. 2005. Great powers' cooperation and China' roles in the Caspian region. Conference materials of Kazakhstan Institute of Strategic Researches. Perspectives for regional cooperation development in the Caspian region. Almaty, KISI Conference, May 27, 2005.
4. COHEN, A. 2008. Kazakhstan: The road to independence. Energy policy and the birth of a Nation. The Central Asia-Caucasus Institute & Silk Road Studies Program, 2008. Printed in Singapore. ISBN: 978-91-85937-36-3.
5. FORSYTHE,R. 1996. The politics of oil in the Caucasus and Central Asia. Adelphi, Paper 300. [online]. Available at: http://www.iiss.org/publications/adelphi- papers/adelphi-paper-list/
6. KORZHANEVSKY, N. 2005. Energeticheskaya Bezopasnost` Kitaya. [online]. Available at: http://www.wpec.ru/index.htm.
12 Yesdauletova, 2009.

98
7. MARAT, E & MURZAKULOVA, A. 2007. The SCO seeks energy cooperation, but problems remain. [online]. Available at: http://www.cacianalyst.org/news.
8. MATUSOV,A.2008. Energy cooperation int eh SCO: Club or gathering? [online]. Available at:
http://www.silkroadstudies.org/new/docs/CEF/Quarterly/August_2007/Matusov.pdf
9. RAKHMATULINA, G. 2010. Kazakhstan’s Positions in the Regional energy space. In: Central Asia`s Affairs 2010. Number 3-2010. [online]. Available at: http://www.kisi.kz/img/docs/5057.pdf.
10. RAKHMATULINA, G. 2011. Vliyanie Tamozhennogo Soyuza na ekonomicheskoe razvitie Kazakhstana. Perspektivy integracii v neftegazovom sektore. [online]. Available at:
http://www.eabr.org/general/upload/docs/publication/magazine/no1_2012/n1_2012_6. pdf
11. ROBERTS, J. COHEN, A. 2012. How More Economic Freedom Will Attract Investment to Kazakhstan and Central Asia. [online]. Available at: http://www.heritage.org/research/reports/2012/06/how-more-economic-freedom-will-attract-investment-to-kazakhstan-and-central-asia
12. SHERYAZDANOVA, K. 2008. Foreign policy priorities of the republic of Kazakhstan in the light of the president`s address. [online]. Available at: http://www.kisi.kz/sitehtml?id=2273.
13. YESDAULETOVA, A. 2009. Kazakhstan`s energy policy: its evolution and tendencies. In: Journal of US-China Public Administration. USA 2009, Volume 6, No.4 (Serial No.47). ISSN 1548-6591.
14. YESDAULETOVA, A. 2008. Energeticheskaya bezopasnost: Evropeiskyi soyuz, Rossiya, Kazakhsan. Moscow 2008. [online]. Available at: http://www.politex.info/content/view/475/30/.
15. YESDAULETOVA, A. 2009. Kazakhstan`s energy policy: its evolution and tendencies. In: Journal of US-China Public Administration. USA 2009, Volume 6, No.4 (Serial No.47). ISSN 1548-6591.
Contact
Mgr. Aisulu Kozhabayeva Department of International Economic Relations and Economic Diplomacy Faculty of International Relations University of Economics in Bratislava Dolnozemská cesta 1/b 852 35 Bratislava Slovakia E-mail: [email protected]

99
Irah Ku čerová
FACULTY OF SOCIAL SCIENCES CHARLES UNIVERSITY
REGION OF CENTRAL EUROPE OR MIDDLE EUROPE? 1
Abstract The crucial question - Central Europe or middle Europe (as a sub-region)? We think in terms of Central Europe as a region with its own distinctive characteristics, or whenever it will be just in Central Europe in the geographical definition? If you want to work with the region as a specific, then you need to think about what or whether it differs from Central Europe East and West Europe. Key words: geographical boundaries of the region, economic characteristics, political and institutional definition, prevailing discourse, geopolitics, geo-strategy. Introduction Institutionalization of the Middle, respectively Central Europe is quite explosive topic both west and east of the region. Exactly – discussions are gaining explosiveness rather talk in the East, because Russia refuses to recognize the specifics of this part of Europe with the fact that actually belong to the sphere of their geopolitical interests and also thanks to certain aspects of the historical, ethnic and language . West contrast is surprised emancipation endeavour Central European societies stand out as an independent entity as distinguished from the West and the East, because they perceive us as one set of Eastern Europe, and of course we are talking about Western societies. For the rest of the world is any division of Europe under the resolution. Eric Hobsbawm sees in Central Europe only political category, not geographical, not institutional. He speaks even more normative than positivist approach. It should be noted that the concept of Central Europe is historically relatively young. For the first time in his intentions wondering Johann Gottfried Herder, and in the 70th the 18th century, even in the period when the Central European peoples lived in large empires - Prussia , Austria, Russia. However Herder concept works not with the political plane, but institutional. In the 19th century were any emancipation´s efforts of these ethnic groups suppressed. It was only after the World War II, the results indicate geopolitical renaissance Central European affiliation, unfortunately only briefly, as the Cold War from the mid-20th century meant the integration of Central European countries into the Soviet empire. Release in the international relations of the second half 80th years, then brought a new momentum for controversy over middle or Central Europe, but which persist to this day, i.e. more than 20 years after the fall of the Berlin Wall - a symbol of the division of Europe into East and West. That is why Timothy Garton Ash could no longer say in 1986 that Central Europe is returned. If you want to work with the category of Central Europe as a distinct region, let's try to answer the following questions:
1) What is the defining character of the region of Central Europe? 2) Is the Central Europe a real entity? 3) Is it not just embarrassment over the differential development of the Central European countries compared to Western EU countries? What is the current discourse
1 The study is elaborated in the framework of the elementary science program P17 "Science of society, politics and the media" at the Faculty of Social Sciences of Charles University.

100
within the EU15 - perceived differences between Western Europe Central and Eastern Europe?
When processing the themes Central European countries will be based on the hypothesis that the countries of Central Europe are distinguished from other EU member states especially its institutional environment, do not have much economic level, both to Western European countries as well as Eastern European . From a methodological point of view, I will try to clearly differentiate the designation of the Central European region: if it is just a geographic specification, then the middle when thinking about Central Europe as a distinct entity, i.e. research subject, then Central Europe, which means consideration of issues of political, institutional and historical aspects. Definition of the region of Central Europe Central Europe as an independent entity is a construct of some historically influenced by the particular distribution of political forces. The strategic value of Central European territories for economic and therefore military targets is the reason for the very difficult and yet easily exploitable definition of Central Europe. The midpoint of Europe is a logical buffer strip between the western and eastern parts of Europe in the geographical context, between the West and the East, in the political and institutional sense. Also, the economic characteristics of the Central European countries have been and are still some transition between the Eastern and Western prosperity poverty. Let us try to define Central Europe as a specific region in two basic levels, and geographical and political.2 Do not be fooled by the seeming simplicity of the geographical definition since geography is an important aspect of geopolitics and its categorization therefore subject to political , economic and strategic and security challenges. And of course, we are talking about institutional characteristics. Not only the historical development of geographic borders shifted according to specific needs, but also within individual epochs was and is a different concept of Central European. "Geography gives the term 'Middle Europe´ ostensible commonplace and objectivity, which he does not own. Of course, that notion has its geographical boundaries ... but in one of its foundations, as well as many other seemingly definable terms of public discourse, to value judgments."3 Then "geographic definition is not yet important characteristic of the region than the political, economic and cultural definition."4 Somewhat looser geographical boundaries depending on the economic aspects of the offers Robert Kastner, for which the construction of Central Europe cooperation development process resulting in the creation of their own economic region with increasing mutual cooperation and creating a competitive environment. Central European market is formed by gradually linking individual economies, which develops depending on the intensity of mutual contacts. "Central Europe isn´t a bastion, or fortress."5 Therefore Kastner included in the Central European region, besides Germany, Austria, the four Visegrad countries and Slovenia. "Central Europe is a controversial area and the area in dispute: dispute with leads on what this space is."6 Very simply put the essence of the problem - it really is the Middle East entity, or on the contrary, only Central Europe ? Or, it is just a part of Europe States lying in the middle of the European continent, without any hint of originality?
2 Limits of this contribution doesn´t post here to analyze the economic and institutional characteristics. 3 Hobsbawn, E. J., 1989: 212. 4 Adámková, V., 1999: 5. 5 Kastner, R., 2002: 21. 6 Kosík, K., 1993, in Trávníček, J., 2009: 7.

101
The concept of Central Europe is the concept of moving changes. It is not possible to say exactly here's border."7 From this point of view, the positive evaluation - only body able to develop, stand, survive. But then we talked about Central Europe from a position of strength region. A "concept of regional resilience of any geopolitical entity has several strategic dimensions,"8 from the military- security, economic to social, including the comparative advantages of international cooperation. Geographical boundaries of Central Europe Specification of the Central European region faces various concepts which often comprise a broader range of countries than would strictly correspond to geographic destination. There are included countries that clearly hit the area in Western, the common denominator of the Alps and study are referred to as the Alpine country. Besides the typical Alpine countries such as Austria, Switzerland, Liechtenstein and Germany, we're talking about a majority of the territory is, however, beyond the Alps and Massif has his character rather natural conditions of Central Europe. On the other hand, is set in middle Europe Slovenia also included, which has not only a basis for geographic jurisdiction within the Alpine mountains, but I am convinced that Slovenia is in this group classifies mainly for historical reasons, when it was part of the Austrian monarchy quite a long time - longer since 13th century. Certainly another reason for the inclusion of Slovenia into categories we tracked European countries is its development in the socialist block. Lonnie Johnson from Oxford Slovenia clearly considered as a part of Central Europe, unlike in Austria (sic) and Germany, which understands only for Central European countries in a broader context. Slovenia has, on other hand, very narrow, historically contingent relations both with today's Austria and with Italy, which for his involvement in the area of Central Europe recorded.9 Slovenia is often associated with its potential to be a bridge between the EU and the Balkans. From purely geographical point of view, Slovenia falls into southern Europe, respectively in the Western Balkans. Narrower concept of Central Europe group reduces the country closer to the geographical heart of Europe. However, even in this case there is no clear definition. Almost all agree on the four countries making up the original grouping of the Visegrad Group (V -4), i.e. Poland, Czech Republic, Slovakia and Hungary. Although the Western geographers Hungary may be actually form the western border of Eastern Europe. Even Slovakia and Poland (sic!) can be understood as Eastern European countries, since the geographic midpoint is shifted considerably to the west , which includes both the Benelux and Alsace- Lorraine. The other two states lying in the middle of the European continent - Germany and Austria it in terms of geographical analysis is not a problem and clearly belongs here, even if only for someone in the extended context. Where hesitation is in place, the institutional aspects of the evolution of these states - so different from country W -4, so relative to them. From the historical, political, and in many ways an institutional perspective, Germany and Austria are clearly here. The influence of these countries on the social, cultural, political and institutional development of the Visegrad countries is undeniable, therefore, are thus not included in our analysis of Central Europe. Geographic contours defining Central Europe is a bit looser than expected for such relatively technical disciplines such as geography undoubtedly is expected. But the in terms of work definition prevails north-south axis that corresponds to the Narrowest border and works only with the Visegrad countries as technically the heart of the
7 Buzek, E., 2011. 8 Kučerová, I., 2006b: 170. 9 Johnson, L., 1996.
102
European continent, as other states located in the central part of Europe do not assume definite characteristics as the V-4 countries, and it depends on the analyst's decision whether to Central Europe included or not.10 Katzenstein like Johnson does not cover Austria or Germany in this category analyzed with respect to their institutional and political history. This means that operationally Central Europe coincides with today's four post-socialist states of the Visegrad group, but this is not purely geographical definition. However, the understanding of Central Europe as a region develops, so in 2012, in most analyzes narrows radius region, while twenty or more years ago, the Central European space understood in a much broader context. French geographer Foucher separated the center of Europe (Median/Middle Europe) into two sub-regions. Central- Northern Europe consists of seven states, namely Poland, the Czech Republic, Slovakia, Hungary, Slovenia, Croatia and Serbia. The second zone consists of the Central -Southern Europe, with four countries - Romania, Bulgaria, Macedonia and Albania, which completely excludes Greece from this group, though he added influence on the development of the countries of the European subregion. But then inevitably the question arises as to which countries make up the European south...11 Similarly, at the same time saw Central Europe and American historian Magocsi that the region saw the three zones, which shifted the geographical center of Europe is relatively far to the east. North zone defined territory between the Baltic Sea in Northern Kartpaty and Dnieper. Here as it covers the following countries: former East Germany, Poland, Lithuania, Belarus, Ukraine and Moldova. The so-called. Alpine- Carpathian zone corresponds with the former Austria -Hungary, which means the following countries: Czech Republic, Austria, Slovakia, Hungary, Romania, Slovenia and part of Croatia, Serbia and even northern Italy. The third region of Central- Eastern Europe, the Balkan zone covering the remaining part of Croatia and Serbia, and other countries of the former Yugoslavia, Albania, Greece, Bulgaria and the European part of Turkey.12 Although Magocsi talks about Central and Eastern Europe, I think that the geographical point of view there is clearly overlap between the political and institutional aspects that just simply divided Europe into two basic parts, the East and West. Another American historian of Polish origin Halecki separated the four macro-regions in Europe, the Western and Central -Western and Central -Eastern and Eastern region. Central and Eastern Europe formed the band states between Sweden, Germany and Italy on the one hand and Russia and Turkey on the other. This means that within these limits Halecki understood the gravity of Central and Eastern Europe in one category, especially from a historical perspective. However, he added, that all European states and their societies are mutually influenced and enriched, i.e. emphasized, that even Eastern influences in Western Europe. Region of Central Europe is defined flexibly depending not only on the geographical jurisdiction, but as you can see from the previous list, often it resentments rather historical, institutional, political, and economic parameters of connecting different states in this part of Europe. So, again, remind fundamental characteristic: "Central Europe is a bastion or fortress." New formation of Central Europe as an entity is a process of blazing after 1989 during the development of new forms of cooperation on the part of individual states, as well as individual entrepreneurs. Then the boundary of the region can move according to the intensity relations of neighbouring states, but always in the minimum geographic anchor. For
10 Katzenstein, P., 1997. 11 Foucher, M., 1993: 60. 12 Magocsi, P., 1993.

103
the purposes of this analysis, we work with a model of the Visegrad countries, complemented by Austria and Germany. Political definition of Central Europe Central Europe is considered to construct a kind of historical perspective is relatively modern. While in the Middle Age, this region has been relatively militarily, economically important, the onset of modern times shifted focus away and wholly significance of territory in the center of the European continent fell to Germanic sphere of influence, so the specificity of the Central European region, was not considered. Great Moravian Empire, "Slavic power in Central Europe"13 disappeared beneath raids Finno-Ugric tribes in the early 10th century, in the 11th century, Hungarian empire gradually linking Central Europe to the Balkans and from 12 century Hungarians joined a personal union with the Croatian Kingdom. Poland as a state was first recognized by the Holy Roman Emperor Otto III. in 999, and in the early 11th century Polish territory stretched from Prussia to Russia and became the largest Central European kingdoms of the time. Poland increased its importance Lithuanians form connections with the Polish- Lithuanian Union in the years 1386-1600, yielding a significant empire of the region. Developments in Central Europe was linked for centuries with Germanic influence within the Holy Roman Empire (962-1806 , respectively. 800-1806) with the centre of power in the German historical lands , except for a shorter period when Roman emperors were Czech kings Charles the Fourth and Sigismund. Nevertheless, even in the early days of the Holy Roman Empire was not just a mere dictation of the Germanic princes or kings, but there are also played an important role in the Central European nations, namely the role of linking Saint Adalbert or Slavnik. While throughout the Middle Ages in the administration of the Empire prevailed universalistic, transnational aspirations, from 17 century grew stronger tendency to understand " Holy Roman Empire of the German Nation " as a designation of the controlled territory. In the early Middle Ages at the time of the formation of the first government departments in deciding the destination affiliation to Christianity, therefore - in retrospect - to Western civilization. And we're at the underlying problem is the perception of today's Central Europe: Central Europe as an autonomous entity exists rather in understanding themselves Central Europeans. Not so already in Western Europe or even Americans, Asians, who called us all fighting on the Eastern Europe. Central Europeans like to differentiate from the East Europeans that would like to belong to the Western family. Suffice to say that there is good reason to feel the least close-fitting category of Central European countries, i.e. Visegrad states, as part of the West. It means in terms of their cultural and historical civilization interconnectedness with members of the Political indisputable the West, Austria and Germany. But the point of contention is the very perception of Western Europe, citizens of the new EU15 member states and its inhabitants. In that early period, the spread of Christianity, we assigned the so-called mainstream, ie. in the then known world of Europe the most powerful . Throughout the reign Ottokar the Second, after under Charles the Fourth and his son Sigismund, who were actually the only Czech and Central European monarchs crowned emperor of the Holy Roman Empire, reaching significance in Central Europe probably peaked. We talk on the 13th - 15 century. Christianity has thus become a major political, in this case, not institutional, major force shaping the empire. Christianity and acts as a political tool in expanding and consolidating power.
13 Krejčí, O., 2009: 56.

104
The importance of Central European history documented by the meeting of the three kings in Visegrad in 1335, when the Czech king John of Luxembourg , together with the Hungarian King Charles Robert of Anjou and the Polish king Casimir the Third the Great divides up spheres of influence in Central Europe, which define and stabilized against the Habsburgs temporarily developments in Central Europe. But ending the Middle Ages and the beginning of modern times is diagonal shift of economic and therefore political and cultural significance of the area of Central Europe towards the Mediterranean and Western Europe. It has to do with logical discovery overseas exploration, colonization of newly discovered territories and their exploitation. It has to do also with - today's terminology speaking - technical innovations. And also the fading importance of Central Europe associated with the development of business cooperation through sea routes, from which geographic Determination Central European countries excluded, respectively minimized. Napoleon Bonaparte to his interest in the creation of a large empire , to some extent, highlighted the strategic cost of Central Europe. After-Napoleon solution of Europe Congress of Vienna is apparently the first historically documented identification of Central Europe as a political entity14, as a modern vision of Central Europe.15 However, it is worth highlighting the fact that this entity has been seen in other borders than today in all their concepts. Certain shift in the perception of the Central European region brought a period of stormy industrialization of German territory in the first half of the 19th century, such as Friedrich List, a German economist, formulated in 1844 his idea of Central Europe clearly under German leadership, which has drawn the contours of Hamburg and Trieste, so that the German Empire became a strong competitor of the two Powers, France and Russia. Suffice to say that thinking within the customs union, i.e. not viewing angle violent Germanization. The successful development of Prussia in the last decades 19th century was reflected in the increasing militarization of society , the result of which were also considerations about the superiority of the Germanic race and the right to rule the stronger of the Slavic peoples. William the Second directly said he was as insulting to compare German Czechs, Slovenes, Hungarians or Germans. "In this context, the German newspapers and magazines after 1890 often wrote about creating a large economic area, which would be under German leadership comprised the greatest part of Europe, and could successfully compete with the British Empire, the United States and Eurasian Russia. This idea was already in the 19th and 20 century, mostly associated with the term Mitteleuropa as a necessary precursor to dominate the entire European continent. "16 Reflections on colonization in Germany, but not confined to the regions outside Europe, while in accordance with nationalism and spread the concept of Drang nach Osten17, or pressure in the eastern German states of neighbours in the first place in the Central European context. Drang nach Osten was pejoratively viewed primarily Slavic peoples and was associated with Germanization´s efforts. The difference between this process and the medieval Ostsiedlung18 or the colonization of the eastern territories was conceived as essential: Ostsiedlung in the Middle Age was in fact supported by the Slavic rulers, because colonization of empty territory was seen as a basis for economic development. In contrast,
14 The so-called Intermédiaire Europe, which has the title itself indicates the kind of category forming transition – i.e not fully clarified the definition. 15 Krejčí, O., 2009: 51. 16 Kořalka, J., 2009. 17 Authorship of the term is attributed to the Polish journalists Julian Klaczko, who had used in 1849; in English it means Foray to the East. 18 It means East-colonization.

105
Drang nach Osten was associated with violent Germanization, with power regionalism.19 Besides, "East German settlements, civilization and Germanization´s movement was fruitful and simultaneously disastrous. German history is the history of the expansion of the East."20 The fact that the pressure Germanization based inter alia on arrogance is revealed in the late 19 century at a time, evidenced by the considerations Frederick Engels in the revolutionary period from 1848 to 1849 : "However, as is often the case, the Czech nationality, which, according to all the facts of the last four centuries dies in 1848 last effort to regain his former life, and this abortive attempt, independently of any revolutionary considerations clearly proved that Czechs can continue to exist only as a part of Germany, although part of the population will still continue for several hundred non-German speaking language ... I strive for Charlemagne Germans very steadily and persistently on conquest, colonization or Civilization at least Eastern European ... The importance of the German element in Slavic border areas, which continually increases with the growth of cities, trade and industry, grew even more when it became clear that almost everything that belongs to the spiritual education is to be imported from Germany."21 Evidently needless comments on the prevailing nationalism and chauvinism... Economic Development of Germany during the 19th century accompanied by a growing population is reflected in the increased consumption of natural resources, including food. Escalating pressure on raw materials has led not only to the colonial expansion of Germany, but also to the development of expansionist ideology, according to many people, legitimate. Friedrich Ratzel in 1901 in Article Lebensraum (living space i.e.) is inclined to the geographical Darwinism, according to which the state can be seen as a living organism, because its population is born, develops, ages and dies. The state is obliged to ensure the livelihood of its citizens and is therefore in the interest of the people can follow the law stronger. For determinants of international policy states considered in addition to the size and the quantity and quality of soil22. Ratzel thus became the founder of geopolitics as a distinct discipline. Lebensraum idea is based on the traditional German nationalism, when Germany was seen as a dynamic nation, needing more resources, while Slavs were only static nations, without any effort to expand. Therefore, the Slavic nations according to German nationalists in decline and then their possible exploitation by Germanic peoples were seen as justified. The question is to what extent the terms of nationalism, how about chauvinism. We have the right to Lebensraum linked rather later, after the First World War with Karl Haushofer, geopolitics and successor Ratzel (and Swede Rudolf Kjellén, author of the term geopolitics, which attributed Germany moral right on Central and South-Eastern Europe in relation to the provision of German needs). Haushofer was based on the hypothesis viable states, which dominate the surrounding regions. According to Haushofer in the interwar period proved their vitality, and therefore permission dominance, only four pan-regions - USA, Germany, Russia and Japan.23 These regional powers have the right to expand its Lebensraum, living space at the expense of other countries in the neighbourhood. Lebensraum thus became imperial colonialism complemented by an innovative attempt to control key territories, or traffic routes, all insured autarkic rules in the economic sphere. Haushofer considered the creation of the state, which would include all Germans, their unification into one state. "It is necessary that all parts of a nation united and certainly understand that living room to Germany today is not enough, and its boundaries are unsustainable. German nation
19 Kučerová, I., 2006a: 76-77. 20 Schlögel, K., 1986: 56. 21 Engels, B., 1849. 22 http://cs.wikipedia.org/wiki/Friedrich_Ratzel, access 4. 7. 2011. 23 Kučerová, I., 2006a: 76, Kučerová, I., 2006b: 181.

106
with the help of geopolitics must realize crowding the space."24 Haushofer ideas became the basis for a clear reflection of Hitler and Nazi practices, respectively them are Haushofer´s theories associated. Nevertheless, became justification as Japanese, and Soviet expansion at the same time, so violent regionalism. Chronologically back to the early 20th century - against extreme nationalism propagate by All-German association appeared in 1915 with his book Mitteleuropa Friedrich Naumann , imperial deputy. Naumann defines Central Europe as the area between France and Russia. The shift in the role of Germany is associated with the idea of close cooperation as the two regional powers - Germany and Austria -Hungary, but also Slavic peoples living in the Habsburg monarchy. The basic tool is to be economic cooperation that will benefit all participating nations. Due to the fact British economic dominance in Europe, then to Central Europe together with Germany a unique chance to economically interconnect so that individual countries do not simply become a pendant, a satellite receiver either Britain or Russia.25 A prerequisite was then Naumann´s idea of respect for religious, ethnic or racial and linguistic diversity, which directly contradicts prevailing when the German attitude to the Central European region. Naumann understood Central Europe as a multicultural, multiethnic and multi-religious region, in which just saw its quality - but sheltered German institutional environment - from German as an official language after German legal system. Naumann´s vision of Central Europe and was clearly associated with the Teutonic dominance, although , as pointed out that economic progress in Central European countries is linked to the German or Austrian and German capital as a unifying language, but not with the violent colonization exactly not Germanization of Central European nations . Of course, the idea that such a post-war arrangement led to embarrassing reactions within Slavic elites. TG Masaryk insisted that the war in Central Europe26 must bring the freedom of nations which have long been subject to principalities and where national revival reached a certain degree. Must be based on the establishment of democratic states in the future, maybe connect a federation, but it will be their sovereign decision. Masaryk idea of Central Europe - New Europe concerned zones from the Baltic States, ie. Estonia, Latvia, Lithuania, to Albania and Greece. On the contrary, Germany and Austria Masaryk did not include in the Central European region, because it is perceived as institutionalized violence organized by the ruling minority over the majority, and the continuation of a medieval dynastic absolutism.27 This means that Masaryk Central region defined primarily by political factors, later also recognized the cultural specificity of the region.28 Event of August 1939 contributed to problems later on with the Central European identity - the Molotov- Ribbentrop Pact, or if the German- Soviet nonaggression pact , but the substance of which consisted in the distribution of future territorial gains of both signatory States. Stalin was the Baltics states and Bessarabia (Moldova mainly), Germans of Poland and the path to the north and west of Europe. Czesław Miłosz, a Polish- Lithuanian writer, Nobel Prize for Literature in 1980, defines Central Europe as simply "all countries that were in August 1939 real or hypothetical trade between the Soviet Union and Germany , ... removing the role of the subject is deep history arise trauma and explains our vigilance when considering on its two large neighbours."29
24 Haushofer, K., 1927, 1931. 25 The question is, how could the Central European nations worry about any technical, technological and economic competition from Russia then?!. 26 Masaryk is systematically avoided the term Central Europe in the context of the dismissal Naumann´s Milleteuropa , or returned to the Congress of Vienna term Intermédiaire Europe, in Czech therefore Mezievropa. 27 Masaryk, T. G., 1918. 28 Masaryk, T. G., 1925. 29 Trávníček, J., 2009: 71-72.

107
Post-war division of spheres of influence at the Yalta Conference (February 1945) and Potsdam (July 1945) developments in Central Eastern Europe quite tilted clearly pro-Soviet direction. Although in the interest of objectivity - in Yalta there primarily for distribution in Central and Eastern Europe, to a certain extent have a bilateral meeting with Churchill, Stalin in October 1944. Poland and Czechoslovakia did not concern the proposals. The problem was in a different conception of democracy between the West and the Soviets. A declaration did not contain a single "institutional guarantee mere trust in the good will of the Soviets in the future of democracy in Central Europe ... Jalta was lost ... because the agreement rested on the dubious assumption that Stalin and Western leaders give the same meaning to the words like democracy , sovereignty or independence."30 Contrary to Stalin at the same time pragmatically admitted: “This war is not like the previous ones, who occupied territory, who also installs its own social system. Everyone raises their system to where it will be his army."31 "Indulgent, romantic view of the Tsarist empire and the Soviet Union ... Russia Obvious errors can ever be put on an equal footing with the crimes of the enemy. Russia is closer to the West ... "32 That approach can be summarized as allies to the Soviet Union immediately after the Second World War. How naive... Conclusion Central Europe is a region specific or rather European sub-region, which has been beset with many problems of its definition. The seemingly easiest technical definition, and geography, is also not clear. It concerns the geopolitics that is unable to move geographic border according to political interests - possibly economic, strategic overall. Political features of the development of Central European nations clearly demonstrate the strategic value of the region for stronger players on both the west and the east. Differentiation of ethnic, linguistic, to some extent, religious within these companies recorded stronger, i.e. Germans, Austrians and Russians in their territorial expansion accompanied by political domination, including the institutional framework. The first question, "What is the defining character of the region of Central Europe? " Can be based on previous analyzes identify the following - this is an area between East and West Europe, both geographically as well as political, hence the strategic and institutional concepts. Another defining feature is clearly belonging to the Western branch of Christianity and Germanic influence millennial culture, language, overall institutional, and even the level of formal institutions. The second research question "Is Central Europe a real entity?" In this chapter can be answered only with difficulty. It is? I'm afraid that not only from a global perspective, but also from Europe is just hard verifiable. Central Europe is a majority opinion considered rather as a subregion. A certain disdain towards small nations that have been around for centuries part of the great empires, whether Prussians, Habsburg or Russian, respectively Soviet empire, has its own logic. Only in Poland due to its market size, respectively population and thus the importance of the EU negotiation process rather extends from Central Europe . The third question is whether "Not just the embarrassment of differential development of the Central European countries compared to Western EU countries?, it means the current discourse within the EU15, whether perceived differences between Western Europe Central and Eastern Europe? “ Answer is quite simple: they mix us up, there was no difference in the institutional environment between the Czech Republic,
30 Rupnik, J., 1988: 64-66. 31 Djilas, M., 1962: 90. 32 Davies, N., 2005: 61.

108
Slovakia, Romania and Western Balkans. Perhaps they feel differences only in the security situation. And it is interesting that the specifics of Central Europe feel perhaps only Central European society, which is quite significant. Neither West nor East in us sees anything special. West clearly identifies us as members of Eastern Europe, Eastern us unison matching the - one of the few exceptions where East and West resonates. Literature:
1. Adámková, V. (1999): Regionální ekonomická integrace v SVE a její sounáležitost se západoevropským integračním procesem, in Aktuální otázky světové ekonomiky, 1999/10, VŠE Praha.
2. Buzek, E. (2011): Střední Evropa je pohyblivá změna, Euroskop 16. 5. 2011, http://www.euroskop.cz/8801/18950/clanek.
3. Davies, N. (2005): Evropa. Dějiny jednoho kontinentu, Academia.
4. Djilas, M. (1962): Conversations with Stalin, Rupert Hart-Davis London.
5. Engels, B. (1849): Revoluce a kontrarevoluce v Německu: Poláci, Češi Němci, in ([Marx, K.- Engels, B. (1977): Vybrané spisy v pěti svazcích, sv. 2, Svoboda Praha.
6. Foucher, M. (1993): Fragments d’Europe – Atlas de l’Europe mediane et orientale, Paris.
7. Halecki, O. (1950): The Limits and Divisions on European History, Sheed&Ward, New York.
8. Halecki, O. (1952): The Borderlands of Western Civilization. A History of East Central Europe, New York.
9. Haushofer, K. (1927): Grenzen in ihrer geographischen und politischen Bedeutung Grunewald, K. Vowinckel Berlin
10. Haushofer, K. (1931): Geopolitik der Pan- Ideen, Zentral-Verlag Berlin.
11. Hobsbawn, E.J. (1989): Střední Evropa, politika a kultura, in Trávníček, J. (2009): V kleštích dějin, Střední Evropa jako pojem a problém, Host Brno, s. 212-222.
12. Johnson, L. R. (1996): Central Europe: Enemies, Neighbors, Friends, Oxford University Press.
13. Kastner, R. Th. (2002): Tržní prostor Střední Evropa, Barrister-Principal
14. Katzenstein, P. J. (1997): Mitteleuropa-between Europe and Germany: Oxford, Providence, Berghahn Books.
15. Korbel, P. (2011): České firmy s rodokmenem, in Ekonom 31-32, str. 56-58.
16. Kořalka, J. (2009): Mitteleuropa Friedricha Naumanna jako plán německé hegemonie v Evropě za první světové války, http://deliandiver.org, přístup 12. 8. 2011.
17. Kosík, K. (1992): Třetí Mnichov?, Listy 6/1992(XXII), s. 35.
18. Krejčí, O. (2009): Geopolitika středoevropského prostoru, Professional Publishing.
19. Krupnov, J. (2011): Ruský politolog žádá integraci střední Evropy s Ruskem, http://aktualne.centrum.cz/zahranici/evropa/clanek.phtml?id=699611, přístup 9. 5. 2011.

109
20. Kučerová, I. (2006a): Nový regionalismus versus geografický regionalismus, in Institucionalizace a decentralizace v EU, IPS FSV UK Praha, s. 67-89.
21. Kučerová, I. (2006b): Regional Resistence of Europe, in Instruments of European Integration, IPS FSV UK Praha, pp. 169-187.
22. Magocsi, P. R. (1993): Historic Atlas of east Central/Central Europe, University of Washington Press.
23. Masaryk, T. G. (1918): Nová Evropa: Stanovisko slovanské, Praha.
24. Masaryk, T.G. (1925): Světová revoluce 1914-1918, Orbis, Čin Praha.
25. Rupnik, J. (1988): Dědictví Jalty, in Trávníček, J. (2009): V kleštích dějin, Střední Evropa jako pojem a problém, Host Brno, s. 62-69.
26. Rupnik, J. (2009): Ani střední, ani východní. Česko je prostě Evropa., http://zpravy.idnes.cz, 24. 3. 2009.
27. Schlögel, K. (1987): Úvahy o střední Evropě, in Trávníček, J. (2009): V kleštích dějin, Střední Evropa jako pojem a problém, Host Brno, s. 47-61.
28. Trávníček, J. (2009): V kleštích dějin, Střední Evropa jako pojem a problém, Host Brno.
Contact
PhDr. Irah Kučerová, PhD. Department of International Relations Institute of Political Studies Faculty of Social Sciences Charles University of Prague U Kříže 8 158 00 Praha 5 Czech republic E-mail: [email protected]

110
Dušan Leška
FACULTY OF SOCIAL AND ECONOMIC SCIENCES COMENIUS UNIVERSITY IN BRATISLAVA
THE WAY OUT OF THE CRISIS OF THE EUROPEAN UNION
MORE EUROPE OR LESS EUROPE?
Abstract Global economic crisis that hit the European Union has acquired a new dimension to
the debt crisis of several euro area countries, which threaten the very existence of Monetary Union, the single currency. The EU institutions have adopted a decision on the establishment of a temporary European Financial Stability Facility (EFSF) and later the permanent European Stability Mechanism (ESM), the aim of which is to prevent the bankruptcy of the individual euro area countries. At the same time they search for a way out of the crisis in further integration, adopted programs to strengthen the economic and monetary union by creating a fiscal union and the banking union. Deepening integration, however, requires the transmission of additional competencies to the authorities of the Union which is now hinting at a growing euroscepticism, nationalism and extremism, which complicates the situation. Keywords: The European Union, the Eurozone, global crisis, debt crisis, the economic and monetary union, the fiscal union, the banking union.
The impact of the financial and economic crisis on the European Union and the eurozone The economic and financial crisis that erupted in the USA in 2008, affected the European Union significantly and, in particular, the eurozone, i.e. the countries of the European Union, which have created a monetary union and adopted common currency - euro. Crisis was accompanied by some of the classic symptoms – it caused a slowdown to slump in economic growth, economic recession, unemployment and growth in a number of cases, the deterioration of the social status of the majority of society. The specific manifestation of the crisis in the eurozone was the growth of external debt of the member states, the loss of their ability to borrow on international financial markets, which threatened national bankruptcy.
As this crisis had a hard impact in particular in the countries of eurozone, there have been disputes as to the extent the impact of the crisis was caused by the common currency euro. Not only eurosceptic-minded politicians, such as a British MEP N. Farage, but also a number of renowned economists had predicted a crash of the euro as a common currency, threatened by the emergence of the superstate, in which nation states are losing their sovereignty. Once again have accusations appeared that a common currency was adopted prematurely, it is primarily a political, or political-economic project. According to this authors still need to be ready preconditions for the common currency, as the eurozone includes countries which have significantly different degrees of economic and social development, social structures, historical traditions, and hence the common currency is untenable. Thoughts even went so far as to suggest just the common currency caused the rampant growth of foreign debt.1
1 For example: Tyler Cowen, an economics professor at George Mason University; Nobel Laureate in economics James Buchanan, American economist William Niskanen and others.

111
It is actually true that the crisis had the hardest impact on the eurozone countries and was accompanied by foreign debt crisis, which has brought some of the countries up to the brink of national bankruptcy. Greece was the first country, which has lost the ability to borrow on international financial markets and its representatives asked for help the EU authorities. The European Council has solved the situation at first with a bilateral loan to Greece from countries of the eurozone, together with the International Monetary amount of 80 billion euros. Draw on the loan was contingent with the fulfillment of hard austerity measures in the field of public finance; the fight with the gray economy; improve tax collection; structural changes in the economy, etc. Whereas the economic situation in Greece got worse and other countries of eurozone got into economic trouble and foreign debt, the European Council, the EU Council (mainly the Ecofin) together with the European Commission acceded to the creation of the European Financial Stability Facility (EFSF), and later to create a "permanent institution" – the European Stability Mechanism (ESM), which provides financial assistance to members of the eurozone in financial difficulty.
EFSF has become fully operational in August 2010, in late September 2010, it was awarded the highest rating by rating agencies AAA. EFSF did not have cash, eurozone countries guaranteed loans that it provided. The facility had capacity of 750 billion euros, but it was possible to activate only 220 billion euros, the amount that guaranteed the country with the highest AAA rating. ESM has the financial cash of 80 billion euros, which embedded the reciprocally individual eurozone countries, and the remaining amount of up to 750 billion euros provided warranty. In regard to the unfavorable situation ESM arose in July 2012 and it was decided that temporarily it was to act, together with the EFSF. This would increase its capacity by 200 billion euros from the EFSF. The purpose of these financial institutions was to provide loans to eurozone countries that found themselves in trouble on the international financial market.
The first country to ask for help from EFSF was Ireland, than Portugal, and later Greece applied again for a further loan. Then Spain found itself with major debt problems and asked for a loan of 40 billion euros for private banks. As the economic situation deteriorated in Italy it created a technocratic government led by M. Monti, and received an extensive program of austerity from public finances.
ESM bailouts are conditional on member states outlining a programme for the needed reforms or fiscal consolidation to be implemented in order to restore the financial stability. The country in concern will be analysed and evaluated on all relevant financial stability matters by the so-called Troika: European Commission, European Central Bank and IFM. The austerity programs cuts of states budgets deteriorated the overall economic situation in the eurozone and the entire Union, which went into an economic recession. Some analysts and economists have criticized the austerity programs, which realized all countries of eurozone as the most important and emphasized the need for economic incentives that would have revived economic growth and made it possible to get out of the crisis.
The important role played the ECB, which has launched a program of buying bonds of troubled countries on secondary markets so-called Security Market Program (SMP). In August 2012, the ECB prepared a new program of buying bonds called Outright Monetary Transactions (OMT). On the ground of program ECB purchases bonds in eurozone countries, at their request, but they must first apply to ESM, which based on analysis of the economy shall draw up a recovery program of the economy. If they accept the terms and conditions of financial aid, the program can be run. The programs works to subdue panic in international financial markets and, consequently, reduces interest costs of highly indebted countries and helps relieve the pressure on the markets of marginal states.

112
What revealed the economic crisis? The fact that the economic crisis has affected mainly the eurozone countries and has showed itself as a debt crisis is a results of the following. The problem did not lie in the adoption of the single currency, but herein that some countries did not fulfill essential requirements which were established when the countries would adopt the common currency. A common currency must firmly stand on two pillars, which form a common monetary policy and a common fiscal policy. But in present the situation in the eurozone has evolved so that a common monetary policy provide and ensure the European Central Bank (ECB), but a problem occurred with the second pillar – common fiscal policy. The minimal basic framework of a common fiscal policy had ensured the Stability and Growth Pact, a document which consists of the agreement of the European Council from 199 and of the two regulations: Regulation (EC) No 1466/97 on the strengthening of the surveillance of budgetary positions of the member states and the surveillance and coordination of economic policies (preventive part); Regulation (EC) No 1467/97 on implementation of the excessive deficit procedure, that is, if the budget deficit of a Member State exceeds the reference threshold set at 3% of gross domestic product (the corrective part).2
In conditions of the prosperity and economic growth, most eurozone countries went beyond these indicators, however, European Commission did not apply any penalties and it could seems that it does not obstruct economic growth and common currency the euro, whose value has been stable, and in a short time has become the world's second most important reserve currency after the dollar. Disobedience of criteria of the Stability and Growth Pact was one of the causes of the outbreak of a debt crisis in eurozone, because it has not secured the second pillar of the single currency – common fiscal policy. The cause of the debt crisis, therefore, was not in the single currency, but in the disobedience of the criteria of a common fiscal policy. It was therefore necessary to adopt a renewed Pact, part of which was the specific sanctions in case of its non-compliance. In March 2011, the EU member states adopted a new reform under the Open Method of Coordination, aiming at straightening the rules e.g. by adopting an automatic procedure for imposing of penalties in case of breaches of either the deficit or the debt rules.
The first steps of the European institutions and the eurozone countries were aimed at rescuing endangered countries, to avoid non-controlled bankruptcy and the rescue of the euro. Even uncontrolled bankruptcy of such a small country such as Greece (it contributes only 2% to GDP of EU) would cause a fluctuation of the euro and the eurozone economy, which may have inconceivable consequences for the economy of EU and could result in a collapse of the common currency. German chancellor A. Merkel pronounced at that time an important idea that the collapse of the euro can have not only tragic economic consequences, but could call into question the very idea of the of European integration and, ultimately, may result to the disintegration of the European Union.3
The first direction of the efforts of the EU consists in the construction of the mechanism that could stop the indebtedness, i.e. to create a mechanism able to provide loan to countries that find themselves in a debt crisis and cannot borrow on international financial markets, a sort of European monetary mechanism. The second direction of considerations the
2 PAKT STABILITY A RASTU.1997 [online] [cit. 10.1.2012] Dostupné na internete: http://www.europskaunia.sk/pakt_stability_a_rastu 3 MERKELOVÁ: NEÚSPECH EURA BY BOL ZLYHANÍM EURÓPY A JEJ ZJEDNOCOVANIA. In: ČTK, 13. mája 2010. [on line] 2010 HNonline [cit.5.1.2013] Dostupné na internete: http://spravy.pravda.sk/merkelova-neuspech-eura-by-bol-zlyhanim-europy-a-jej-zjednocovania-1f0-/sk_ekonomika.asp?c=A100513_172816_sk_ekonomika_p01

113
EU focused on the removal of the internal causes which triggered the crisis in the eurozone itself, and formulate the perspectives of further development and continuation of European integration.
The European Union thus once again finds itself at a historical crossroads and looking for ways ahead in the future. In the search for causes of the debt crisis and the way out of economic crisis again appeared the basic dividing line in the consideration of the European Union and perspectives of its development. Economists, political scientists, politicians and other analysts can be divided into the two main groups, which differ by their assessment of the processes of European integration and the prospects of its further development:
1. On the one hand was a group of eurosceptics who have argued that by the adoption of the Lisbon Treaty, the Union in legislative steps for the integration is going too far, directive of the European Committee tied up activity of the member countries, hampered their development and as a result the development of the entire Union and overcome the current crisis. Recommend to revert back, cancel the Lisbon Treaty, a number of EU directives and to return some powers back to Member States. They claimed that each state should find its way out of the crisis of its own forces, refused help for those countries that found themselves in trouble. According to them the Union can only be an alliance of strong, sovereign national States that work together on a mutually beneficial basis. A typical representative of this thought is former Czech President V. Klaus, in Slovakia promotes this line political party Freedom and Solidarity and partly Christian-Democratic Movement.
2. The second group believes that after the adoption of the common currency integration had not continued fast enough and has remained at the half-way. Therefore, they recommend making further important steps on the way of integration, which not only will allow overcoming the current economic and debt crisis, but will help restore its economic dynamism and return its status as a major global player. Very concisely the situation was characterized by the Nobel Laureate in economics J. Stiglitz in an interview for the magazine Der Spiegel: “Europe is facing a critical point. The alternatives are "more Europe" or "no." The halfway configuration is unstable ... Europe needs a common banking system and a common financial framework. If Europe borrows as a whole it could have even better access to credit than the United States."4
I am inclined to agree with J. Stiglitz that eurozone stopped on half-way and although it can be painful and required sacrifices, it is necessary to continue down the road of furthering integration. The European Council, the Council of EU especially Ecofin and the European Commission reached to similar conclusions. This fact was expressed by the Oli Rehn saying: "Economic and Monetary Union either will complete through a much deeper integration, or we will have to accept a gradual decomposition of the European integration process, which lasted more than half a century."5
The creation of economic, fiscal and banking union After lengthy negotiations between states at the level of the Council of EU preparation materials from the European Commission were adopted in March 2011 by the EU the “Euro Pact Plus”6, which included the most important points of document from previous materials,
4 Interview with the economist Joseph Stiglitz 'Tthe american dream has become a myth' In: Spiegel Online
October 02, 2012. Available on internet: http://www.spiegel.de/international/world/inequality-in-the-us-interview-with-economist-joseph-stiglitz-a-858906.html 5 REHN, O.: Eurozónu čaká buď hlbšia integrácia, alebo postupný rozklad In: Hospodárske noviny 30.11.2011. [online] [cit. 7.1.2012] Dostupné na internete: http://finweb.hnonline.sk/c1-53888890-ecb-upokoji-trhy-chce-vsak-zmeny-unijnych-zmluv 6 EURO PACT PLUS 2011. Brussels 20 April 2011. [Online] Available: http://www.consilium.europa.eu/uedocs/cms_data/docs/pressdata/en/ec/120296.pdf

114
“Pact for competitiveness” and “Pact for the euro". The main result of the meeting was the adoption of the documents on the establishment of a fiscal union and banking union. Pact includes the following proposals:
- The budgetary semester: EK will treat the proposal of the state budgets of the member states before they will be approved in national parliaments. EK will express its opinion, objections or recommendations from the perspective of long-term stability, sustainability on compliance with the criteria of the Stability and Growth Pact;
- In case the country breaches the rules of the Stability and Growth Pact, penalties shall by impose. The country, which exceeds these rules inserts the amount of 0,2% GDP in the ESM, or the EC and in the case that a deficit is not removed by, or if a country will not proceed according to the schedule drawn up by the EC, the amount of the budget will remain in the EU budget. The revised Stability and Growth Pact, which establishes a system of automatic sanctions entered into force in December 2011.
In March 2012 Leaders of the 25 European Union countries have signed so-called “fiscal compact. “The Treaty on Stability, Coordination and Governance in the Economic and Monetary Union (popularly known as the "fiscal compact") entered into force on 1 January 2013 following its ratification by Finland. The treaty aims to strengthen fiscal discipline in the euro area through the "balanced budget rule" and the automatic correction mechanism.”7 The Pact did not attach the United Kingdom and the Czech Republic.
The part of the Pact is so-called „debt brake”, which would strengthen fiscal discipline in the Union in order to prevent the debt crisis in Europe in the future. Debt brake requires that restrictive budgetary rules have been embedded in the constitutions of the individual member states. Member states should manage balanced budgets or end up in surplus every year. Maximum permissible structural budget deficit is expected to be 0,5 % of GDP. Penalties should by automatically imposed by the European Commission, and the possible withdrawal would have be agreed with 85% of the votes of the member states.
Negotiations are continued about other topics as well, for which, however, hard to find major promotion by member states, for example: harmonization of tax bases in case of corporate taxes of the eurozone; condition for a retirement age on population growth; the abolition of a rule under which, together with inflation increases the salaries (wage indexation).
In December 2012 the European Council adopted a further direction - to create a banking union within the eurozone. The first step in this way should by to prepare and carry out banking surveillance of the ECB in eurozone member states. The plan is based on a report entitled “Towards to real economic and Monetary Union”, drawn up by the President of the European Council Herman Van Rumpoy, together with President of European Commission, the President of the European Central Bank and chairman of the Eurogroup. It also takes into account a separate Concept for an extensive and genuine economic monetary Union, presented by the European Commission.8
7 “FISCAL COMPACT" ENTERED INTO FORCE ON 1 JANUARY 2013. Available on internet: http://www.consilium.europa.eu/homepage/highlights/fiscal-compact-enters-into-force-on-1-january-2013?lang=en 8 HERMAN VAN ROMPUY: Towards to real economic and Monetary Union. 5. December 2012. (On line) Available January 10th 2012: http://www.consilium.europa.eu/uedocs/cms_data/docs/pressdata/SK/ec/134198.pdf

115
The legislation of the banking union should be completed in February 2013. The ECB should start with surveillance already from July 2013 in the case of large, systemic important banks in Europe and in banks of troubled states. Surveillance should be gradually extended to all important banks. It was decided that surveillance will be applied to banks with assets exceeding 30 billion euros, or those that make up a significant share of the national banking market. This will increase the effectiveness of the spending of funds so as to use effectively in the interests of the whole and to not misuse.9 The emergence of the banking union foresees three areas where the introduction of prudential surveillance is only the first step:
a) Banking surveillance is the first step towards the creation of the bank union; b) Special fund to rescue banks that may get into trouble in the future; c) The creation of a Europe-wide fund to protect bank deposits.
Banking surveillance may prevent the bank going into risky operations; prevent financial bubbles; the abuse of financial capital. The ECB may, if necessary, withdraw the license for the banks.
Without the surveillance of the troubled banks in the eurozone and the EU cannot draw a direct assistance from the permanent fund's ESM. At the same time a clause has been embedded in the text of a fair balance in the position of parent banks and their subsidiaries to prevent the parent bank to deal with problems at the expense of its subsidiary banks. (This is very important for Slovakia, where all the larger banks are daughters of the foreign banks). The European Central Bank will gradually assume responsibility for all banks and their branches in the eurozone and in the countries which will join to the surveillance. The treatment involves the coordination of national reform, where in the paragraph 12 article a) sets out: “coordination of national reforms: the participating Member States will be invited to ensure, in line with Article 11 of the TSCG, that all major economic policy reforms that they plan to undertake will be discussed ex ante and, where appropriate, coordinated among themselves. Such coordination shall involve the institutions of the EU as required by EU law to this end. The Commission has announced its intention to make a proposal for a framework for ex ante coordination of major economic policy reforms in the context of the European Semester"10
There were also reflections on the establishment of a rating agency within the European Union, since all three reputable rating agencies are American (Moody´s, Standard and Poor´s, Fitch) and even though they act as private companies, a number of their decisions have been controversial, and often aggravate the situation of weakening countries. In addition, they have played a negative role in the process of the outbreak of the financial crisis in the U.S., when they awarded the highest ratings to products and companies which appeared on the edge of bankruptcy. The only thing that has been achieved in addition to the critiques and several lawsuits against credit rating agencies is that the EU adopted new rules for agencies in November 2012, aiming to reduce the undue reliance of the countries on ratings. The new rules would simplify way to sue the agencies if they make a mistake, for example, in the case of evaluation of the reliability of the state´s debt. "Rating agencies will need to be more
9 EUROPEAN COUNCIL 13/14. DECEMBER 2012. CONCLUSIONS [online] [cit.5.1.2013] Available on internet: http://www.consilium.europa.eu/uedocs/cms_Data/docs/pressdata/en/ec/134353.pdf 10 EUROPEAN COUNCIL 13/14. DECEMBER 2012. CONCLUSIONS. Article12, clause a). [online] [cit.5.1.2013] Available on internet: http://www.consilium.europa.eu/uedocs/cms_Data/docs/pressdata/en/ec/134353.pdf

116
transparent by assessing of the states; they will be accepting stringent rules and will thus have more responsibility for errors caused by intentionally or by negligently."11 Political context in the eurozone and the EU The paradox of the current times, however, is that the deepening of integration presupposes the transfer of other competences member states of eurozone to common European authority. On the other hand, however, economic and debt crisis, recession, to which the European Union has fallen, caused a rise of mistrust in most countries of the Union, of its ability to overcome the crisis, caused the growth of euroscepticism, nationalism, isolationism, which are in direct contradiction with the need for integration. In a number of EU countries it has strengthened the positions of the nationalist and anti-european parties, a number of them got to the national parliaments, or have even become members of the governing coalitions and got an opportunity significantly influence the government's decision (e.g. in Greece, the Netherlands, Belgium, Finland). Even some traditional parties are moving in their position more towards to euroscepticism for example, the British Conservative Party is increasingly slipping away from the Union and in the party there have appeared propositions to organize referendum in the United Kingdom on leaving the EU. In a number of EU countries there is intensified irredentist tendencies and efforts of the regions to separate from their mother countries. For example, Scotland has already agreed with the Central Government, that in 2014 they will hold a referendum on Scottish independence. In the Spanish autonomous region Catalonia nationalist parties won in the regional elections, which promised their followers to organize referendum on the independence of Catalonia. The situation is complicated even in the heart of the Union in Belgium where Flemish representatives’ carry out the long term issue of separation from the less developed Walloon.
"Europe is under the influence of its integration policy reshaping to the new Europe, but ethnicity remains a part of reshaping its political and non-political reality."12 This means that ethnicity that has been shaped by centuries still remains a potential political weapon and a part of the various ethnical concepts of European society. "Ethnicity is a reality of life that well-targeted policy can exploit"13
Herald a deterioration of the situation have been riots in the suburbs of the France but also the growth of nationalism and xenophobia in the Netherlands, Belgium and other countries. The outbreak of the current global economic crisis caused the increase all of the negative phenomena. Large parts of the society in particular, youth fell into a deadlock, are frustrated, can’t see any prospects for themselves in society and therefore are searching for the enemy, the one who caused the situation, and are looking for a simple solution. It is suitable for the growth of the influence of nationalistic, racist, a groundswell of neo-fascism movements. Their hatred is traditionally turning against immigrants, against citizens of other races, different religion, different nationalities and now have found their new enemy who causes their problems the European Union.
11 Ratingovým agentúram klepnú po prstoch, za chyby budú pykať. In: : webnoviny.sk. SITA 28. novembra 2012. [Online] [cit. 6.1.2014] Avialable on internet: http://www.webnoviny.sk/ekonomika/ratingovym-agenturam-klepnu-po-prstoc/584776-clanok.html?from=newest_articles 12 GBÚROVÁ, M.: Národné štáty a európska integrácia. In: GOŇCOVÁ, M. kol.: Evropská politická společnost. Brno: Masarykova univerzita 2010, p. 13. 13 Ibidem, p. 13.

117
Theoretical approaches to European Union A way of dealing with economic and debt crisis seems to have confirmed the theory of liberal intergovernmentalism14, especially in the early stages because the initiative to deal with the situation based on the tandem leaders of Germany and France Angela Merkel- Nikolas Sarkozy. They met regularly before the Summit of the European Council, agreed together on crucial things and then established and pushed their proposal on negotiations of the European Council. As a result, increased the importance of the European Council, which, as a summit of leaders of the Member States, is de facto intergovernmental authority. The European Council together with Ecofin adopted key decisions, which in turn were elaborated and realized by the European Commission and other supranational bodies of the Union. In this situation, the intergovernmental authorities appear to have stood above the supranational bodies, entrusted them by developing and implementing some of the concrete steps and measures. An argument against this theory is confirmed by the fact that even the most powerful States were aiming to assert its interests in the spirit of realism, but only joined the negotiation within the European Council, where each State has the right of veto and were looking for a mutually acceptable compromise. After the adoption of Single European Act and Maastricht treaty Council of Ministers can practice qualified majority voting, “…which allows even the larges states to be outvoted, was applied to a range of policy areas, thereby narrowing the scope of national veto.”15
At the same time EU and eurozone also contain many supranational elements – such as a common currency, European citizenship, the protection of human and civil rights, a common market allowing the free movement of capital, services and persons, the common agricultural policy, competition rules, etc. A number of the institutions of the Union are by their very nature supranational – e.g. the European Commission, the European Parliament, the European Court of Justice. 16 EU Member States are interdependent economically, financially, culturally and politically so much that they form a single unit that can successfully develop only a joint effort. This means that the characteristic features of supranationalism can be identified clearly.
Not one of these opposing concepts gives a comprehensive answer to the essence of European integration. All the important concepts of European integration, which arose in the past, had not taken into account sufficiently the globalization, which fundamentally changes the conditions of the European integration. In conditions of globalization nation States have lost much of their original sovereignty and they must submit to supranational corporations and global financial capital. "Any controls of this “dynamic balance„ are now out of reach and actually even the ambition the vast majority of otherwise sovereign (in the strict sense of control regulations) states."17 States fail to protect their citizens before them on the contrary; they get into depending on lobby and its global financial subject. Ideological expression of these groups is neoliberalism, which aims to create unregulated free market, privatization not only industry and services, but of the whole of the public sector. The starting point for the national States is close unit within the European Union, which can create a "protective umbrella" from the negative trends of globalization. Transfer of certain competences of the national States to the EU institutions is therefore not weakening or loss of sovereignty, but on
14 MORAVCSIK, A..- SCHIMMELFENNIG, F.: Liberal Integovernmentalism. In: Diez, T.- Wiener, A. (Eds.): European Integration Theory. Oxford: Oxford Univesity Press 2009, pp. 67 – 87: 15 HEYWOOD, A.: Political Theory. New York: PALGRAVE MACMILLAN 2004, p. 114. 16 CHRYSSOCHOOU, D. N.: Theorizing European Integration. London and New York: Routledge 2009, p. 11 - 13. 17 BAUMAN, Z.: Globalisation, Bratislava: Kaligram 2000, p.64.

118
the contrary, is the only way to salvage this sovereignty. Therefore, also stresses the idea that the current economic crisis the EU and eurozone can be solved together by member states.
The further development of the European Union by way of deepening integration is important, therefore, for Europe to remain a global player on the international scene. In the case that it fell apart, Europe will change to a handful of small and medium large states, which will squabble among themselves and lose any influence on the development of world events. Europe can only remain a global actor in the form of a strong and united European Union. Therefore, in addition to the completion of the monetary and economic Union more attention must be paid to the common foreign and security policy of the EU and the European security and defense policy.
The European Union is not just a simple international organization is not just an association of powerful national states pursuing their interests (as claimed by a liberal intergovernmentalism). It is something much more – there is a new type of community, which forms gradually, on the basis of common economy, by mutual convergence, breaking down the elements of nationalism and isolationism, which are still quite strong. „Supranational entities, like regions or continents, must seek to develop political solidarity among peoples who speak different languages, practice different religions, and are bound to very different traditions and cultures.”18 (Heywood 2004: 115) Literature :
1. A BLUEPRINT FOR A DEEP AND GENUINE ECONOMIC AND MONETARY UNION: LAUNCHING A EUROPEAN DEBATE. Brussels 30.11.2012. [online] European Commission [cit. January 10th 2013]. Available on internet: http://europa.eu/rapid/press-release_IP-12-1272_en.htm
2. BAUMAN, Z.: Globalisation, Bratislava: Kaligram 2000.
3. EURÓPSKA ÚNIA – KONSOLIDOVANÉ ZNENIE ZMLUVY O EÚ A ZMLUVY O ZALOŽENÍ ES. 2006. [online]. 2006. EUR-Lex [cit. 27.05.2012]. Dostupné na internete: http://eur-lex.europa.eu/LexUriServ/site/sk/oj/2006/ce321/ce32120061229sk00010331.pdf
4. EURO PACT PLUS 2011. Brussels 20 April 2011. [Online] [cit. January 7th 2013] Available on internet:
http://www.consilium.europa.eu/uedocs/cms_data/docs/pressdata/en/ec/120296.pdf
5. EUROPEAN COUNCIL 13/14. DECEMBER 2012. CONCLUSIONS [online] [cit. January 5th 2013] Available on internet:
http://www.consilium.europa.eu/uedocs/cms_Data/docs/pressdata/en/ec/134353.pdf
6. “FISCAL COMPACT" ENTERED INTO FORCE ON 1 JANUARY 2013. [online] [cit. January 5th 2013] Available on internet: Available on internet: http://www.consilium.europa.eu/homepage/highlights/fiscal-compact-enters-into-force-on-1-january-2013?lang=en
7. GBÚROVÁ, M.: Národné štáty a európska integrácia. In: GOŇCOVÁ, M. a kol.: Evropská politická společnost. Brno: Masarykova univerzita 2010.
18 HEYWOOD, A.: Political Theory. New York: PALGRAVE MACMILLAN 2004, p. 115.

119
8. HERMAN VAN ROMPUY: Towards to real economic and Monetary Union. 5. December 2012. [On line] [cit. January 10th 2012] Available on internet: http://www.consilium.europa.eu/uedocs/cms_data/docs/pressdata/SK/ec/134198.pdf
9. HEYWOOD, A.: Political Theory. New York: PALGRAVE MACMILLAN 2004.
10. CHRYSSOCHOOU, D. N.: Theorizing European Integration. London and New York: Routledge 2009.
11. INTERVIEW WITH THE ECONOMIST JOSEPH STIGLITZ ' THE AMERICAN DREAM HAS BECOME A MYTH ' In: Spiegel Online October 02, 2012. Available on internet: http://www.spiegel.de/international/world/inequality-in-the-us-interview-with-economist-joseph-stiglitz-a-858906.html
12. KOMENTÁR: AKO SA KRITICI EURA NEMÝLILI. Aktuality 19.11.2010. [online] [cit. 12.05.2013]. Dostupné na internete: http://www.aktuality.sk/clanok/176615/komentar-ako-sa-kritici-eura-nemylili/
13. MERKELOVÁ: NEÚSPECH EURA BY BOL ZLYHANÍM EURÓPY A JEJ ZJEDNOCOVANIA. In: ČTK, 13. mája 2010. [on line] 2010 hnonline [cit: 5.1.2013] Dostupné na internete: http://spravy.pravda.sk/merkelova-neuspech-eura-by-bol-zlyhanim-europy-a-jej-zjednocovania-1f0-/sk_ekonomika.asp?c=A100513_172816_sk_ekonomika_p01
14. MORAVCSIK, A..- SCHIMMELFENNIG,F.: Liberal Integovernmentalism. In: DIEZ, T.- WIENER, A. (Eds.): European Integration Theory. Oxford: Oxford Univesity Press 2009
15. PAKT STABILITY A RASTU 1997. [online] [cit. 10.1.2012] Dostupné na internete: http://www.europskaunia.sk/pakt_stability_a_rastu
16. RATINGOVÝM AGENTÚRAM KLEPNÚ PO PRSTOCH, ZA CHYBY BUDÚ PYKAŤ. In.: webnoviny.sk. SITA 28. novembra 2012. [Online] [cit. 6.1.2014] Avialable on internet: http://www.webnoviny.sk/ekonomika/ratingovym-agenturam-klepnu-po-prstoc/584776-clanok.html?from=newest_articles
17. REHN, O.: Eurozónu čaká buď hlbšia integrácia, alebo postupný rozklad In: Hospodárske noviny 30.11.2011. [online] [cit. 7.1.2012] Dostupné na internete: http://finweb.hnonline.sk/c1-53888890-ecb-upokoji-trhy-chce-vsak-zmeny-unijnych-zmluv
18. THE FISCAL COMPACT ENTERED INTO FORCE ON 1 JANUARY " 2013. [online]European Council[cit. January 6th 2013] Available on the Internet: ttp://www.consilium.europa.eu/homepage/highlights/fiscal-compact-enters-into-force-on-1-january-2013?lang=en (H)
19. THE CONCLUSIONS OF THE HEADS OF STATE OR GOVERNMENT OF THE EURO AREA OF 11 MARCH. 2011. [online]. The Council of the European Union. [cit: May 30th 2012]. Available on the Internet: http://www.consilium.europa.eu/uedocs/cms_data/docs/pressdata/en/ec/1198 09. pdf
20. TREATY ON STABILITY, COORDINATION AND GOVERNANCE. 2012 [online] European Council [cit. January 11th 2013] Available on the internet: http://european-council.europa.eu/media/639235/st00tscg26_en12.pdf
21. ÚNIA SPRÍSNILA PRAVIDLÁ RATINGOVÝM AGENTÚRAM. SITA 8. novembra 2012. [online] [cit. 28.11.2012] Dostupné na internete:

120
http://spravy.pravda.sk/unia-sprisnila-pravidla-ratingovym-agenturam-f44- /sk_ekonomika.asp?c=A121128_100312_sk_ekonomika_p01#ixzz2DVieFBxf
Contact
doc. PhDr. Dušan Leška, PhD. Ústav európskych štúdií a medzinárodných vzťahov Fakulta sociálnych a ekonomických vied Univerzita Komenského v Bratislave Mlynské luhy 4 821 05 Bratislava Slovenská republika E-Mail: [email protected]

121
Lukáš Melecký
FACULTY OF ECONOMICS VŠB-TECHNICAL UNIVERSITY OF OSTRAVA
INTEGRATED APPROACH TO REGIONAL DISPARITIES
EVALUATION IN VISEGRAD COUNTRIES 1
Abstract The paper evaluates the level of economic, social and territorial disparities in 35 NUTS 2 regions of Visegrad Four countries in the reference period 2000-2010. The evaluation analysis is based on selected mathematical and statistical methods that lead to construction of simple synthetic indices and weighted synthetic aggregate index of disparities. The theoretical part of the paper defines the concept of disparities in the EU and methodological background of convenient statistical methods for regional disparities evaluation. The empirical part of the paper deals with the measurement, evaluation and comparison of disparities rates in all NUTS 2 regions of selected explored EU countries through computed values of synthetic sub-indices of disparities and weighted (aggregate) synthetic index of disparities. All synthetic indices are calculated on the basis of Z-score standardized variables using Euclidean distance method. Key Words: Cohesion, disparities, Euclidean distance, NUTS 2, synthetic indices of disparities, standardized variable, weights, Z-score. Introduction
Although the European Union (EU) is one of the most developed world integration with high living standards, there exist significant economic, social and territorial disparities, mainly at regional level, having a negative impact on the balanced development across EU Member States and their regions, and thus weaken EU’s performance in a global context. Disparities measurement and evaluation at any level of territorial development is deeply associated with the lack of integrated approaches and methodologies in most cases. Within this paper, the application of integrated approach by using construction of three synthetic non-weighted indices and one weighted synthetic index of disparities are introduced in the topic of disparities within Visegrad Four (V4) countries, i.e. Czech Republic, Hungary, Poland and Slovakia at regional level (NUTS 2).
The aim of the paper is to measure, evaluate and compare the level of economic, social and territorial disparities that reflect the level of cohesion in 35 NUTS 2 Visegrad Four regions during period 2000-2010. The paper will verify integrated approach to disparities evaluation that is represented by determination and computation of synthetic indices of economic, social and territorial disparities and proposal of a construction of weighted (aggregate) synthetic index of disparities. The hypothesis of the paper is based on the generally accepted concept of Willem Molle (2007), that regions with the lower level of disparities achieve the higher level of cohesion in the territory that provides better conditions and assumptions for regional development potential, and vice versa. The paper, in content of previous hypothesis, intends to establish the general presumption that in regions with agglomerations of capital cities in Visegrad Four countries (V4) is lower level of regional
1 This paper was created under SGS project (SP2012/153) of Faculty of Economics, VŠB-Technical University of Ostrava.
122
disparities in comparison with the level of regional disparities in rest of NUTS 2 V4 regions in all three explored dimensions of disparities. Disparities and cohesion in the European Union
Disparities in the frame of regional development are a major obstacle to the balanced and harmonious development of the whole territory. Analysis of disparities brings the important information about the key problematic issues in region (and thus in country) on the one side and its development potential on the other side. There are different approaches to definition of regional disparities in the EU and therefore this term can be understood as a multidimensional problem (Kutscherauer, 2010).
According to previous realized empirical analysis and research (e.g. Melecký, 2012; Kutscherauer, 2010), this paper will recognize three general types of regional disparities: economic, social and territorial. Economic disparities represent different level of economic convergence of countries and regions (Molle, 2007) that can be measured by economic indicators. Social disparities are related to how people perceive spatially differentiated quality of the life, standard of living or social inequality (Molle, 2007) and they are mostly measured by the indicators of the labour market. Territorial disparities reflect the strong inequalities in the EU competitiveness factors. Territory inequality is expressed by the significant differences in the economic performance, geographical potential and transport and technical infrastructure, capacity for innovations or quality of environment (Molle, 2007).
In the European concept, the level of disparities can be regarded as a measure of cohesion. By Molle (2007), the cohesion can be expressed by such level of differences between countries, regions or groups that are politically and socially tolerable. Based on typology of disparities, three dimensions of cohesion are recognized, i. e. economic, social and territorial. Economic cohesion evaluates economic convergence and can be expressed by disparities reducing development levels of countries and regions by economic indicators. Social cohesion tends to achieve objectives in employment and unemployment, education level, social exclusion of different groups and in demographic trends. Territorial cohesion is a supplementary term to economic and social cohesion. This concept develops economic and social cohesion by transferring the basic objective of EU, i.e. balanced and sustainable development into territorial context (Kutscherauer, 2010).
Methods for disparities measurement and evaluation
Approaches of disparities measurement differ in structure of using the disparities indicators and ways of their processing. In the current regional practice, the methods based on cross-country (interregional) comparison or mathematical and statistical methods are often used. Among disparities assessment methods can be namely included interregional comparison method; methods utilizing Geographical information system; variability level (e.g. standard deviation and variation coefficient); multivariate statistical methods (e.g. method of main components and factor, cluster or discrimination analyses); simplistic models; method of real convergence; modified territorial Gini coefficient or method of artificial neuron nets (e.g. Kutscherauer, 2010; Tvrdoň, Skokan, 2011). The adequate indicators of national or regional disparities can be identified e.g. within the Reports on Economic, Social and Territorial Cohesion published by the European Commission. Other possible indicators appropriate for the evaluation of disparities are the EU Structural indicators or headline indicators for evaluation of achieving the targets of Strategy Europe 2020 (Hančlová et al, 2010; Staníčková, Skokan, 2012). Within the aim and scope of the paper, the selected mathematical and statistical methods as methods of standardized variable, i.e. transformation methods based on the normal distribution function (z-score) and method of distance from the imaginary point for partial calculation of synthetic indices of disparities have been used.

123
These methods are often used to identification the level of disparities and thus to evaluation of cohesion (see e.g. Křupka, Provazníková, Švejcar, 2011; Petr, Křupka, Provazníková, 2011; Melecký, 2012).
Z-score transformation method
Transformation function in the multidimensional context should satisfy at least two conditions. First, since the attributes (indicators) are measured in different units, they must be transformed into a common scale for aggregation. Second, the functions should avoid assigning high relative importance to extreme values if the original distribution has extreme values. Transformation of original variables therefore can be used to construct a multidimensional indicator, such as synthetic indices of disparities. The most commonly used transformation methods include standardization of variable based on range, on the normal distribution function (z-score) or on distance from the optimal value achieved by the attribute. As the application of classic data normalization method, we use Z-score transformation that provides a way of standardizing data across a wide range of disparities indicators. Data normalized by Z-score transformation are directly used in the calculation of synthetic indices of economic, social and territorial disparities. Z-score transformation of selected disparities indicators values for V4 NUTS 2 regions used in the paper is calculated by equation (1):
, ,, ,
,ˆi r t t
i r ti t
x xu
s
−= (1)
where:
, ,i r tu standardized value of i-th indicator for r-th region in time t;
, ,i r tx value of i-th indicator for r-th region in time t;
i indicator of disparities; r region; r = {1 = CZ01, … , 8 = CZ08, 9 = HU10, ..., 15 = HU33, … , 16 = PL11, …,
31 = PL63, 32 = SK01, …, 35 = SK04}; t time; t = {2000, …, 2010};
tx mean;
ts standard deviation.
Mean ( tx ) is calculated by equation (2):
, ,1
R
i r tr
t
xx
R==∑
(2)
where:
, ,i r tx value of i-th indicator for r-th region in time t;
R number of NUTS 2 regions; R=35; i indicator of disparities; r region; r = {1 = CZ01, … , 8 = CZ08, 9 = HU10, ..., 15 = HU33, … , 16 = PL11, …,
31 = PL63, 32 = SK01, …, 35 = SK04}; t time; t = {2000, …, 2010}. Standard deviation (ts ) is calculated by equation (3):
2, ,
1,
( )ˆ
1
R
i r t tr
i t
x xs
R=
−=
−
∑ (3)

124
where:
, ,i r tx value of i-th indicator for r-th region in time t;
R number of NUTS 2 regions; R=35; i indicator of disparities; r region; r = {1 = CZ01, … , 8 = CZ08, 9 = HU10, ..., 15 = HU33, … , 16 = PL11, …,
31 = PL63, 32 = SK01, …, 35 = SK04}; t time; t = {2000, …, 2010}. The Z-score standardized value has mean ( tx ) equals 0 and standard deviation ( ts ) equals 1.
Z-scores, however, take decimal values and can be also negative.
Euclidean distance method Z-score transformation is an example of linear transformation and thus it changed
scaling uniformly, but it doesn’t define the distance between standardized values. There are several convenient methods applicable for calculation of distance from the imaginary point that is usually presents as an optimal value. The most common way of computing distance between objects in a multidimensional space is to compute Euclidean distances, an extension of Pythagoras` theorem. The Euclidean distance is the square root of the sum of the squared differences in the variables’ values; see e.g. (Woodbury, 2001). As optimal value in computing of Euclidean distance in the paper analysis, the median is used. Euclidean distance for i-th indicator and c-th country in time t is calculated by equation (4):
2
, , , , 50ˆ( )i r t i r t iE u u= − (4)
where: E Euclidean distance;
, ,i r tu standardized value of i-th indicator for r-th region in time t;
50ˆ iu median for i-th indicator;
i indicator of disparities; r region; r = {1 = CZ01, … , 8 = CZ08, 9 = HU10, ..., 15 = HU33, … , 16 = PL11, …,
31 = PL63, 32 = SK01, …, 35 = SK04}; t time; t = {2000, …, 2010}.
Synthetic indices as integrated approach to disparities measurement
Construction of synthetic non-weighted or weighted indices of disparities for evaluation of regional disparities and derivation the level of cohesion includes dataset of 16 selected indicators of disparities. Each dimension of disparities is presented by selected indicators listed in Table 2. The construction of indices has been inspired by approaches of Farrugia and Gallina (2008) that proposed construction of index of territorial disparities and also by Bárcena et al. (Bárcena, Prado, Beccaria, Malchik, 2004) that evaluated social cohesion in Latin America by construction of index of social cohesion. Synthetic indices are compute as partial simple sub-indices for each individual dimension of regional disparities (Melecký, 2012). Synthetic indices of each region r, for each dimension of disparities d, in time t are calculated by equation (5):
, ,1
, ,
I
i r ti
r d t
EID
I==∑
(5)
where:

125
ID index (sub-index) of disparities; E Euclidean distance; r region; r = {1 = CZ01, … , 8 = CZ08, 9 = HU10, ..., 15 = HU33, … , 16 = PL11, …,
31 = PL63, 32 = SK01, …, 35 = SK04}; d dimension of disparities; d = {economic, social, territorial}; i indicator of disparities; t time; t= {2000;…, 2010}; I number of indicators i per one dimension of disparities; for NUTS 2 regions I = {6, 6,
4}. The construction of weighted synthetic index of disparities has been met with problems related to the weighting. We can aggregate data by using equal or differential weight given to all free dimensions of disparities (Melecký, 2012). On the background of descriptive statistics and variability of selected dataset of indicators, we have used differential weights for each dimension; however, some research may prove equal weighting (e.g. Farrugia, Gallina, 2008). Weights used in construction of weighted synthetic index presented in equation (7) are calculated by equation (6). Weights are designed and based on the rates of variability (variability characteristics), which express the distribution of values of a given variable around the mean value of the whole set of data. Therefore, weights reflect how values in the set of data are scattered around the centre, or whether there are extreme values in set of data. Like a variability characteristic, the Range has been used. Range presents a descriptive statistic of absolute variability of a set of data. It is the difference between the largest and smallest values. It is the size of the smallest interval which contains all the data and provides an indication of statistical dispersion. It is measured in the same units as the data. Since it only depends on two of the observations, it is most useful in representing the dispersion of small data sets (Woodbury, 2001, p. 74). Range R presented in equation (6) expresses difference between largest (maximum) and smallest (minimum) scores of each calculated synthetic sub-index of disparities.
, ,1
T
r d tr
td
R IDw
T==∑
(6)
where:
, , r d trR ID Range of each calculated synthetic sub-index of disparities of region r in time t;
max min, , , , , , r d t r d t r d trR ID ID ID= − , where
max, ,r d tID is maximum value of
index of disparities of region r for dimension d in time t;
min, ,r d tID is minimum value of index of disparities of region r for dimension d
in time t; ID index (sub-index) of disparities; wd weight per dimension of disparities; d dimension of disparities; d = {economic, social, territorial}; t time; t = {2000;…, 2010}; T T = 11. Weighted synthetic index is calculated from the partial indices of disparities for region r, for dimension d in time t by equation (7) on condition (8):

126
3
1
d
dd
w
w=∑
3
, , , , 31
1
dr d t r t d
dd
d
wIDW ID
w=
=
= ⋅∑∑
(7)
on condition:
3
1
1d
d d
w
w=
=∑∑ (8)
where: IDW weighted synthetic index of disparities of region r for dimension d in time t; ID index (sub-index) of disparities of region r for dimension d in time t; wd weight per dimension of disparities;
relative weight per dimension of disparities d in relation to other dimensions of
disparities in period t; d dimension of disparities; d = {economic, social, territorial}; r region; r = {1 = CZ01, … , 8 = CZ08, 9 = HU10, ..., 15 = HU33, … , 16 =
PL11, …, 31 = PL63, 32 = SK01, …, 35 = SK04}; t time; t = {2000;…, 2010}.
Application of synthetic indices approach for disparities analysis and cohesion evaluation in Visegrad Four NUTS 2 regions Methodological background of analysis
Analysis of economic, social and territorial disparities is based on 16 selected indicators of disparities in V4 NUTS 2 regions. Each dimension of disparities is presented by selected indicators listed in Table 2. The reference period (2000-2010) is determined by selection of all indicators and their data availability in territorial unit NUTS 2 for 35 regions of 4 countries, i. e. Czech Republic, Slovakia, Poland and Hungary. We have used the European Statistical Office database (Eurostat, 2012) as basic source of disparities indicators. Procedure of empirical analysis of cohesion evaluation in selected NUTS 2 regions is based on the procedure scheme listed in Table 1.
Table 1: Basic scheme of empirical analysis approach Input data analysis » Collection of convenient selected indicators of regional disparities for 4 countries and 35 NUTS 2 regions » » Data normalization (Z-score transformation method) » » Dataset of normalized variables for selected 4 countries and 35 NUTS 2 regions » Calculation of synthetic indices of disparities » Calculation of distance (Euclidean Distance Method) » » Calculation of synthetic indices of disparities » » Calculation of relative weight for each dimension of disparities » » Calculation of weighted synthetic index of disparities » » Descriptive characteristics of synthetic indices variability » Results and discussion » Comparison of regional disparities across all dimensions » » Derivation of cohesion level in explored NUTS 2 regions » » Interpretation of results and discussion » Source: Own elaboration, 2012

127
Data The selection of disparities indicators results from the concept of regional disparities
evaluation used in the EU. The adequate indicators of regional disparities can be identified within the Reports on Economic, Social and Territorial Cohesion that evaluate the trends of disparities and cohesion in the EU Member States and their regions (see European Commission, 2007, European Commission, 2010). However, the determination of appropriate and comparable regional statistics has faced the significant problems of the limited availability at the required territorial level (NUTS II) and length of time series (2000-2010). For the reasons mentioned above, 16 relevant indicators of regional disparities, available in Eurostat database for the reference period 2000-2010 with same scope of availability, has been chosen for the evaluation analysis. The economic disparities are covered by 6 selected indicators, social disparities are reflected by 6 selected indicators and territorial disparities are covered by 4 selected indicators. Selected indicators and their initial units are shown in Table 2.
Table 2: Selected indicators of regional disparities
Type of disparities
Indicator Units
GDP per head PPS Disposable income of households PPS/head Gross fixed capital formation Millions of euro Patent applications to the European Patent Office (EPO)
Number per million of inhabitants
Human Resources in Science and Technology % of active population
Economic disparities
Employment in technology and knowledge intensive sectors
% of active population
Employment rate % of population aged 15-64 Employment rate of older workers % of population aged 55-64
Employment rate of woman % of woman population aged 15-64
Unemployment rate % of labour force aged 15-64
Unemployment rate of youth % of labour force aged 15-24
Social disparities
Long-term unemployment rate % of labour force aged 15-64
Establishments, bedrooms and bed-places (Capacity of collective tourist accommodation)
Number of establishments, bedrooms and bed-places
Tourism intensity Number of collective tourist accommodation establishments
Crude death rate Number per 100,000 inhabitants
Territorial disparities
Victims in road accident Number of killed people Source: European Commission, 2007, European Commission, 2010, Eurostat, 2012; own elaboration

128
Results and discussion Average values of computed indices for each dimension of disparities for 35 NUTS 2
regions of V4 countries define the area of three polygons in Figures 1, 2 and 3. The optimal form of illustrated polygons will be such a one point that would corresponds with zero value of disparities in each dimension of disparities. Smaller area of polygon marks the lower rate of disparities in selected dimension and therefore the higher level of cohesion in selected dimension and region. Bigger area of polygon marks the higher rate of disparities in selected dimension and therefore the smaller level of cohesion in selected dimension and region.
Overall results presented in following figures (Figure 1, Figure 2 and Figure 3), based on results of computed average values of synthetic (sub) indices of economic, social and territorial disparities for V4 NUTS 2 regions during reference period 2000-2010 sign out, that the biggest value of regional disparities in V4 NUTS 2 regions has been reached in territorial dimension (max. 33.52 in region Mazowieckie (PL12)), followed by value of economic disparities (max. 18.18 in region Közép-Dunántúl (HU21)). Smallest value of regional disparities in V4 NUTS 2 regions has been identified at social dimension (max. 11.31 in region Východné Slovensko (SK04)).
Figure 1 shows calculated average values (of individual values for the period 2000-2010) of synthetic (sub) index of economic disparities at regional (NUTS 2) level in V4 countries. The best results have been reached (i.e. smallest level of disparities) in traditionally economic powerful NUTS 2 regions with agglomerations of capital cities in Czech Republic (Praha, CZ01), Slovakia (Bratislavský kraj, SK01), Hungary (Közép-Magyarország) and Poland (Mazowieckie, PL12). Economic disparities in most of Czech and Slovak NUTS 2 regions are, according to values of this synthetic index, lower than in Hungary and Poland. The highest value of synthetic index of economic disparities in V4 countries is represented by NUTS II region HU21 (Közép-Dunántúl), PL33 (Świętokrzyskie) and PL32 (Podkarpackie).

129
Figure 1: Values* of synthetic index of economic disparities in V4 NUTS 2 regions
Note: * Average values calculated for each NUTS 2 region in period 2000-2010 Source: Own calculation and elaboration, 2012
Figure 2 shows calculated average values (of individual values for the period 2000-
2010) of synthetic (sub) index of social disparities at regional (NUTS 2) level in V4 countries. Based on the results of synthetic index of social disparities, social disparities are lower in most of Czech NUTS II regions and several Hungarian NUTS 2 regions in comparison with NUTS II regions in Poland and Slovakia. The level of social disparities is the lowest one in comparison with the level of economic and territorial disparities across V4 NUTS 2 regions. The smallest value (i.e. the best results) of synthetic index of social disparities is represented by NUTS II region CZ01 (Praha), SK01 (Bratislavský kraj) and CZ02 (Střední Čechy). The highest value (i.e. the worst results) in social disparities is represented by NUTS II region SK04 (Východné Slovensko), PL62 (Warmińsko-Mazurskie) and PL42 (Zachodniopomorskie) throughout V4 countries.

130
Figure 2: Values* of synthetic index of social disparities in V4 NUTS 2 regions
Note: * Average values calculated for each NUTS 2 region in period 2000-2010 Source: Own calculation and elaboration, 2012
Figure 3 shows calculated average values (of individual values for the period 2000-
2010) of synthetic (sub) index of territorial disparities at regional (NUTS 2) level in V4 countries. Figure 3 demonstrates that highest level of disparities overall recognized in territorial dimension and there is also the biggest variability (range) of regional disparities across NUTS 2 regions. Based on synthetic index of territorial disparities, the best results have been reached in NUTS 2 region CZ05 (Severovýchod), PL42 (Zachodniopomorskie) and SK03 (Stredné Slovensko). The highest value of synthetic index of territorial disparities has been reached in NUTS II region PL12 (Mazowieckie), CZ02 (Střední Čechy) and HU33 (Dél-Alföld).
Based on the analysis of the results mentioned above the initial presumption of the paper, that in regions with agglomerations of capital cities in V4 countries is lower level of regional disparities in comparison with the level of regional disparities in rest of V4 NUTS 2 regions, has been confirmed partly, i.e. only in dimensions of economic and social disparities. Value of territorial disparities in NUTS 2 regions with capital cities differ in V4 from the best results in NUTS 2 region SK01 (Bratislavský kraj, 9th position), over NUTS 2 region CZ01 (Praha, 22nd position) to the worst results in NUTS 2 regions HU10 (Közép-Magyarország, 30th position) and PL12 (Mazowieckie, 35th position).

131
Figure 3: Values* of synthetic index of territorial disparities in V4 NUTS 2 regions
Note: * Average values calculated for each NUTS 2 region in period 2000-2010 Source: Own calculation and elaboration, 2012
Figure 4 shows the results of computed average values of weighted synthetic index of
disparities over the period 2000-2010 for 35 NUTS II regions of V4 countries. The overall evaluation of individual NUTS II regions shows that the best results, in terms of the smallest (smaller) value of weighted synthetic index of disparities and therefore the higher level of cohesion, NUTS II regions in the Czech Republic and Slovakia have reached in comparison with NUTS 2 regions in Hungary and Poland. Czech and Slovakian regions are ranked the best during the whole period, e.g. NUTS II regions CZ05 (Severovýchod, 1st), SK01 (Bratislavský kraj, 2nd), CZ01 (Praha, 3rd) and CZ06 (Jihovýchod, 4th). Best results and the smallest relative value of weighted synthetic index within Hungary and Poland have reached NUTS II region HU10 (Közép-Magyarország, 7th), PL63 (Pomorskie, 9th), PL21 (Małopolskie, 10th), HU22 (Nyugat-Dunántúl, 11th) and PL42 (Zachodniopomorskie, 13th). The worst results and therefore the highest relative value of weighted synthetic index of disparities across all V4 countries have been identified in NUTS 2 regions HU31 (Észak-Magyarország, 35th), PL12 (Mazowieckie, 34th) and PL11 (Łódzkie, 33th). Results of weighted synthetic index of disparities have mostly confirmed the initial presumption of the paper. Only in the case of NUTS 2 region PL12 (vojvodship Mazowieckie) the value of weighted synthetic index of disparities reached high level of disparities in comparison with regions of capital cities in the Czech Republic, Slovakia and Hungary.

132
Figure 4: Weighted Synthetic Index of Disparities in V4 NUTS 2 regions
Note: * Average values calculated for each NUTS 2 region in period 2000-2010 Source: Own calculation and elaboration, 2012
Conclusion
The measurement of disparities within this paper analysis has been performed through construction of non-weighted synthetic sub-indices and weighted synthetic index of disparities calculated from standardized values of disparities indicators computed by Z-score transformation and Euclidean distance. The main advantage of these methods consists namely in their ability to summarize the different units of measure under the one synthetic characteristic (index), which is the dimensionless figure. The analysis showed that, for the most part, there was a consensus in the trends of V4 NUTS II regions in terms of attainment level of disparities and development potential depending on the level of existing disparities. Construction of synthetic indices and calculation of disparities showed that since the year 2000 positive economic, social and territorial development has been monitored in NUTS II regions of Visegrad Four until the year 2008. In spite of narrowing rate of economic, social and territorial disparities and convergence process in level of cohesion, the significant regional disparities between V4 countries still remain (see Figure 4). The performed calculated indices also shown that the biggest disparities (in absolute terms) in 35 selected V4 NUTS II regions can be identified in territorial dimension, the smallest ones in the social dimension. In relative terms (without affecting the absolute values) index of social disparities in V4 countries achieved the highest rate of relative variability and index of territorial disparities achieved the smallest rate of relative variability presented by coefficient of variation.

133
Literature: 1. BÁRCENA, A., PRADO, A., BECCARIA, L. and S. MALCHIK. Social Cohesion in
Latin America – Concepts, frames of reference and indicators. United Nations, 2010. 194 p. Available from:
2. http://www.eclac.org/publicaciones/xml/1/42251/LCG2420i.pdf
3. EUROPEAN COMMISSION. Fifth report on economic, social and territorial cohesion - Investing in Europe's future. Brussels: European Commission, 2010. 304 p. ISBN 978-92-79-17800-9.
4. EUROPEAN COMMISSION. Growing Regions, Growing Europe. Forth Report on Economic and Social Cohesion. Luxembourg: Office for Official Publications of the European Communities, 2007. 222 p. ISBN 92-79-05704-5222.
5. EUROSTAT. Regions and cities. Regional Statistics. Epp.eurostat.ec.europa.eu [online]. 2012 [cit. 2012-11-16].
6. Available from: http://epp.eurostat.ec.europa.eu/portal/page/portal/region_cities/region al_statistics/data/database.
7. FARRUGIA, N., GALLINA, A. Developing Indicators of Territorial Cohesion. Federico Caffe Centre - Department of Society and Globalization, 2008. 55 p. ISSN 1396-5085.
8. HANČLOVÁ, J. et al. Makroekonomické modelování české ekonomiky a vybraných ekonomik EU. Ostrava: VŠB-TU Ostrava. 2010. 310 s. ISBN 978-80-248-2353-9.
9. KŘUPKA, J., PROVAZNÍKOVÁ, R., ŠVEJCAR, J. Multiple Criteria Decision Analysis of EU Project Implementation Benefits for the Impacted Micro-region. International Journal of Mathematical Models and Methods in Applied Science, Iss. 8, Vol. 5, 2011, pp. 1354-1362. ISSN 1998-0140.
10. KUTSCHERAUER, A. et al. Regionální disparity. Disparity v regionálním rozvoji země, jejich pojetí, identifikace a hodnocení. Series on Advanced Economic Issues, Vol. 3. Ostrava: VŠB-TU Ostrava, 2010. 235 p. ISBN 978- 80-248-2335-5.
11. MELECKÝ, L. Evaluation of Cohesion in Visegrad Countries in Comparison with Germany and Austria by Multivariate Methods for Disparities Measurement. International Journal of Mathematical Models and Methods in Applied Sciences, Iss. 8, Vol. 6, 2012, pp. 979-989. ISSN 1998-0140.
12. MOLLE, W. European Cohesion Policy: Regions and Cities. London: Routledge, 2007. 347 p. ISBN -415-43811-X.
13. PETR, P., KŘUPKA, J., PROVAZNÍKOVÁ, R. Multidimensional Modeling of Cohesion Regions. International Journal of Mathematical Models and Methods in Applied Science, Iss. 1, Vol. 5, 2011, pp. 150-158. ISSN 1998-0140.
14. STANÍČKOVÁ, M., SKOKAN, K. Evaluation of the EU Member States Efficiency by Data Envelopment Analysis Method. International Journal of Mathematical Models and Methods in Applied Sciences, Iss. 2, Vol. 6, 2012, pp. 349-357. ISSN 1998-0140.
15. TVRDOŇ, M., SKOKAN, K. Regional disparities and the ways of their measurement: The case of the Visegrad Four countries, Technological and Economic Development of Economy, Vol. 17, No.3, 2011, pp. 501-518. ISSN 1392-8619.
134
16. WOODBURY, G. An Introduction to Statistics. Cengage Learning, 2001. ISBN 0534377556.
Contact
Lukáš Melecký, MSc. Department of European integration Faculty of Economics VŠB – Technical University of Ostrava Sokolská třída 33 701 21 Ostrava Czech Republic E-mail: [email protected]

135
Pavlína Pellešová
SCHOOL OF BUSINESS ADMINISTRATION IN KARVINÁ SILESIAN UNIVERSITY IN OPAVA
INNOVATIONS IN TEACHING ECONOMIC POLICY
Abstract The paper within the project OPVK CZ.1.07/2.2.00/28.0017 deals with innovation of fractional policies as a part of innovation of the subject Economic Policy. Particular fractional policies are described, attention is devoted to goals, tools, effects on macroeconomic variables both in short-term and long-term periods, and also current questions connected with their functioning in Czech Republic and European Union. Chosen segments of economic policy are specified; current problems of CR and EU are stated. Moreover, legal form is stressed as the base of their functioning because mentioned policies arise from it. Key Words: Innovation, economic policy, fiscal policy, monetary policy, trade policy, rule of law The current state of economic policy The subject Economic Policy is taught at School of Business Administration, Silesian University in Karviná, in accordance with the profile of university study at the faculty. It is the basis for acquiring knowledge in other subjects, such as regional economy and policy, social policy, labor market and employment policy. Economic Policy builds on the basic knowledge of macroeconomics and economic policy includes partial and selected segments of practical economic policy, taking into account the integration process. Currently teaching economic policy A implemented in the form of lectures and seminars, where the teaching is used presentation media. This is a mandatory subject Bachelor's degree program of Economic Policy and Administration, Banking Study, European Integration, Social Management and Public Economics and Administration. The course includes basic knowledge of how fractional policies, for example fiscal, monetary and external trade of monetary policy and the individual segments of economic policy which introduce students to the possibilities of their integration in the system development and practical implementation of economic policy. Briefly outline the process of transformation of the Czech economy in the European Union. The course includes thirteen topics: 1. Introduction to Economic Policy, 2. Brief Development of the Theory of Economic Policy, 3. Partial Economic Policies - fiscal, monetary and external trade monetary policy, 4. Stabilization Policy, 5. Structural Policy, 6. Policy on the Protection of Competition, 7. Income Policy, 8. Social Policy, 9. Employment Policy, 10. Regional Policy, 11. Environmental Policy, 12. Microeconomic Policy of the State, 13. Economic Policy in the Czech Republic in the period of transformation, the development of the Czech Republic and the EU.

136
On the seminars are presented essays on current topics that students choose at the beginning of the semester. Innovations in teaching Economic Policy Course title Economic Policy A was modified on Economic Policy, a compulsory subject of the above program and courses Banking, European Integration, Social Management and Public Economics and Administration. The innovation Economic policy A was to respond to new knowledge in the monitored area, particularly in relation to the Czech Republic's membership in the European Union and the changing legal standards that are the basis for the functioning of the market itself, but also the realization of the partial policies and individual segments of economic policy. Structure of the course was maintained, was upgraded content of each chapter and accompanied by a selection of legal standards relating to the policy and new knowledge and its application in the area of policy in terms of both the Czech Republic and the EU perspective. Chapter Introduction to Economic Policy is the first chapter covering the characteristics of economic policy, the subject, object and bearers of that policy. Attention is also focused on the different types of economic policies such as macroeconomic and microeconomic, supply-and demand-oriented, system-and regulatory, theoretical and practical. Further describes its objectives and instruments broken down by different criteria, different possibilities and limits of economic policy, followed by specification of the concept of economic policy and the definition of economic policy, including its graphic representation. The final subchapter concentrates on issues of economic policy of the Czech Republic and the European Union. The second chapter Brief Development of the Theory of Economic Policy starts with the beginnings of the theory of economic policy, through the four stages of individual economic policy. Followed by a description of practical economic policy in selected countries, the USA, Great Britain, Germany, Sweden and Japan. The final subchapter describes the basic concept of economic policy directions that continue practical economic policy. Chapter Partial Economic includes fiscal, monetary and external trade monetary policy. Subchapter Fiscal Policy consists of a description of the state budget, function of the state budget, types of budget deficits, internal and external debt, objectives and instruments of fiscal policy. Specifies different types of fiscal policy as expansive and restrictive with its short-term and long-term effects and ends characteristic of selected aspects of fiscal policy in the Czech Republic and the European Union, where there is talk of government debt, public finance reform, update of the convergence program of the Czech Republic for the period 2011 - 2015 Convergence Programme of the Czech Republic, the National Development plan of the Czech Republic from 2007 to 2013, the draft budget for 2012, the budget of the European Union, equal access to the taxation of savings and pensions, and selected legislation. Subchapter monetary policy is formulated by defining the primary objective, of monetary policy instruments, divided into indirect and direct instruments with an emphasis on those tools of the Czech National Bank. Are also characterized by different types of monetary policy as it is expansive and restrictive with its short-term and long-term effects, both in the money market, as well as using the model of aggregate supply - aggregate demand, the role of the central bank and its dilemma. The following is a description of the coordination of fiscal and monetary policy, supplemented by sight antagonistic relationship, cooperative relationship, the dominance of fiscal policy and monetary policy dominance. Followed subchapter involving view of the monetary policy of the Czech Republic, the updated Czech Republic's accession to the eurozone. Chapter is concluded characteristics of selected laws

137
and aspects of monetary policy in the Czech Republic and the European Union, which is clarified by the Law on Banks, inflation targeting, the European Central Bank's, monetary policy strategy, European monetary policy instruments and a part of the Treaty on the Functioning of the European Union, where is defined by monetary policy. Subchapter external trade monetary policy is formulated by defining monetary policy, external trade, openness of the economy, the principles of this policy, its objectives and tools divided into autonomous and contractual. Continued specification of the export policy, development of exchange rates, balance of payments and balancing mechanisms, followed by defining the external economic balance, the balance, external trade monetary policy, divided into short-term and long-term effects of both expansive and restrictive policy on and the uses to the two models, this is the model of aggregate supply - aggregate demand and the Keynesian model. It also describes the process of cooperation and integration in the divided microeconomic and macroeconomic, Export Strategy of the Czech Republic 2012 - 2020, common commercial policy under the Lisbon Treaty and its instruments. Finally, look at the selection of legal regulations of the Czech Republic and the European Union. The whole chapter is accompanied by a graphical representation of certain situations in the individual policies context. Fourth chapter Stabilization Policy first outlines the economic cycle, its phases, according to the nature of the causes of action of the impulse, the type of impulse and direction of the impulse, accompanied by graphical interpretation. To anticipate cyclical business cycle indicators are used where specified and listed specific business cycle indicators: indicator of confidence in industry and construction, indicator of confidence in trade and selected services, indicator of consumer confidence, the composite confidence indicator and composite indicator. Is then characterized by stabilization policy, its objectives and instruments and interpreted graphically. Further describes the consequences of a combination of fiscal and monetary policy, Keynesian and monetarist concept of stabilization policy, pitfalls (hazards) stabilization policies, among which we classify time delays and expectations. Followed by explanation the perspective of monetarists and Keynesians on stabilization policy and followed the original concept, short and long-term Phillips curve. The fifth chapter Structural Policy explains concepts such as structure, structural change and structural crisis, describes the factors of structural change, the types of structural policies and theoretical approaches, among which we include liberal and interventionist approach. It is listed as a list of the most important planned actions that are part of detailed review of priorities in the area of structural policies in the National Reform Programme of the Czech Republic (ÚV, 2012). Followed by the conception of structural policy, objectives and instruments of structural policy. Last subchapter is the problem of structural policy in the Czech Republic and the European Union, which are listed by Macroeconomic Forecast Czech Republic from July 2012 (chapter Structural Policy) main areas: business environment, taxation, financial markets, energetics and environmental protection. Followed by a description of the stages of structural changes in the transit economies, structural policy of the European Union, which is based on the Treaty on the Functioning of the European Union. Sixth chapter Policy on the Protection of Competition defines the concept of competition and competitive environment, defines the form of distortions of competition that makes existence monopoly and oligopoly. Described here are theoretical concepts policy on the protection of competition, including the concept of classical school of economics, the neoclassical concept of politics of competition, the Austrian approach, a concept of workable competition and school optimal intensity of competition. It continues the explanation of individual forms of limiting competition, forming the characteristic of contractual agreements, abuse of economic power, merging entities (concentration), government intervention or

138
regulation and unfair competition, adding wording of specific legal standards. Other subchapter includes objectives and policy instruments for the protection of competition, applying the supporters of this policy. The culmination of this chapter is the issue of protection of economic competition in the Czech Republic and the European Union (based on the Treaty on the Functioning of the European Union) and a list of selected legal standards in the area of policy of protection of competition. Chapter Seven Income Policy is characterized by revenue and wealth, the differences in income and wealth disparities, identifies ways of measuring inequality in income, including the Lorenz curve, Gini coefficient, Robin Hood index, quantile distribution and index of poverty. It describes the process of redistribution, redistribution of instruments constituting budget system and its elements, parafiscal systems, regulation of certain conditions and the distribution of state participation in the negotiations on the distribution of future revenues between employers and employees. Subchapter issues of income policy in the Czech Republic and the European Union first emphasizes the fundamental law comes out of income policy in the Czech Republic, the Czech income system and income reform. The income policy of the European Union is focused on the common goals of the European Union in the area of income systems. The eighth chapter describes the definition of social policy, its relationship to economic policy. Another subchapter will theoretical social policy based on social doctrines, such as conservatism, Christian social teaching and Democratic Socialism. It describes various types of social policy disaggregated according to various aspects of social policy, description of the principles of social policy, the principles of social justice and social policy functions. Characterizes the social insurance according to the Ministry of Labour and Social Affairs includes pension insurance, sick insurance, health insurance and social insurance. Subchapter Objectives and instruments of social policy instruments are categorized according to various criteria and are listed here as well as specific doses, which solves assistance in material need in the Czech Republic. Finally, as in other chapters mentions the issue of social policy in the Czech Republic and the European Union, including the selected legal standards, it is described in more detail issues such as subsistence levels in the Czech Republic, state social support system. The ninth chapter first outlines the theoretical background, which are characterized by labor supply, labor demand and the role of trade unions in the labor market. More details are given various forms of unemployment, encompassing the frictional, structural, cyclical and seasonal unemployment. In the subchapter employment policy, its objectives and the policy instrument is divided by level, followed by specification of objectives and instruments of employment policy, again categorized according to various criteria, with an emphasis on the tools of active and passive employment policy. Selected legal standards in the area and the issue of employment policy in the Czech Republic and the European Union, the end of a chapter and include a definition of the state employment policy, the labor office, employment agencies, the National Development Plan 2007-2013 and the EU's role in employment policy. Tenth chapter Regional Policy defines the concept of regional policy, as well as classification of the regions under the National Development Plan of the Czech Republic 2007 - 2013, themes of existence, namely economic, social, political, and environmental and regional policy principles. Another subchapter specifies the objectives and instruments of regional policy are broken down by various aspects. Theoretical aspects of regional policy are two basic types of economic policy, based either on state interventionism, or preferring the release of market forces on the ground, based on faith in the private sector. Finally of the chapter are selected legal rules in this area and the problems of regional policy in the Czech Republic and the European Union, which includes such major aspects of the National

139
Development Plan of the Czech Republic 2007 - 2013, EU funds as the main instrument for implementing the EU's economic and social cohesion. The eleventh chapter Environmental Policy is focused on defining environment, macroeconomic relationship context creation protection and creation of the environment, describes the factors causing load environment. Subject of the next subchapter is to define the concept of environmental policy, its relation to the use of limited resources and solutions externalities, complete graphic explanation. Followed by explanation of macroeconomic objectives and environmental protection are introduced to various instruments of environmental policy, which is graphically demonstrated the relationship of environmental quality and economic policy objectives. Conclusion of the chapter is devoted to selected legal standards in the area and application of environmental policy in the Czech Republic and the European Union, where as more fully described Operational Programme Environment offers in years 2007 - 2013, the National Development Plan of the Czech Republic 2007 - 2013 and the environment. Twelfth chapter Microeconomic Policy of the state defines microeconomic policy and its causes, initiatives and measures serving the Government to reduce the negative consequences of market failure. It also describes the types of market failures such as imperfect competition, externalities, public goods, and asymmetric information, which are accompanied by graphical representation. Chapter also includes the characteristics of tools of microeconomic policy, which the government uses to eliminate or mitigate the impact of market failures, these are the rules of conduct of market players, subsidies and grants, government regulation and taxation policy. Finally, we discuss the tax system in the Czech Republic. The last chapter Economic Policy in the Czech Republic in the period of transformation describes the background and principles of economic transformation after 1990, the privatization process, the process of liberalization (price liberalization, liberalization of foreign trade) and basic transformation steps. Another subchapter characterizes the Copenhagen criteria, including political and economic conditions necessary for entry into the European Union, also presents pre-accession strategy, the recruitment procedure of the Member States, European Union enlargement. Finally, it is engaged in a process of convergence of the Czech economy to the level of the European Union. Compulsory and recommended literature was supplemented by a new literary sources and the current Internet resources, as well as legal standards relating to the studied subject. Literature includes resources from foundations of macroeconomics, through the history of economic theory, economic policy to integration processes.
Contact
doc. Ing. Pavlína Pellešová, Ph.D. Department of Economics School of Business admionistration in Karvina Silesian University in Opava Univerzitní náměstí 1934/3 733 40 Karviná Česká republika E-mail: [email protected]

140
Paula Puškárová
INSTITUTE FOR ECONOMICS AND MANAGEMENT UNIVERSITY OF ECONOMICS IN BRATISLAVA
R&D EFFECTIVENESS IN V4 COUNTRIES: NEW EVIDENCE ON
LEADING AND LAGGING V4 REGIONS
Abstract The aim of this paper is to empirically analyze innovation performance of V4 countries and their NUTS II regions using the selected parameters of R&D effectiveness. In the Introduction, the paper demonstrates the significance of innovation and R&D performance for economic growth. In its first part, the paper describes two selected parameters of R&D effectiveness – elasticity of R&D output on R&D input, and TFP. In its second part, the paper proceeds to empirical analysis of V4 countries and in its third part, it continues with the analysis of R&D effectiveness on NUTS II level of V4 countries. The Conclusion summarizes key ideas of the paper. Key Words: R&D, total factor productivity, V4, NUST II, elasticity Introduction
Emergence of Schumpeter’s work (1939, 1943) initiated considerate amount of work and discussions about true impact of innovation and creativity on economic growth, resulting in the theory of exogenous growth (e.g. Solow 1956, Swan 1956, Koopmans 1965) and endogenous growth (e.g. Eaton and Kortum 1999), national systems of innovation (e.g. Lundvall 2007) and in elaboration of many other scientific theses.
The efforts of the EU to boost economic convergence among its member states are safely anchored already in its first legal grounds (Article No 117 of the European Economic Community Treaty). In this paper, we concentrate on one region in the EU that represents, in our assumption, the key collision zone between the „old“ and „new“ member states, i.e. V4 countries. V4 do share several important economic and social characteristics as a result of their common history path as a part of Soviet Union while the Western countries were experiencing an accelerating pace of globalization and technological progress. The transition period cumulated in May 2004 when all V4 countries joined EU and other important international organizations (e.g. NATO).
Despite their integration, V4 countries do remember their former cooperation and therefore, continue to cooperate also separatedly from the EU on so called V4 summits. The results of their cooperation can be then observed in pursuing common policy in front of the EU in areas such as energy or transport. V4 region is at EU-level important since its population equals basically the population of France, the second most populated EU country (according to EUROSTAT 2012 data it is roughly 63 million).
It is, thus, completely reasonable, that this region acquires more and more attention in current literature. In particular, the V4 growth and catch-up process are beginning to be broadly analyzed (e.g. Puškárová 2012).
We decided to draw on this current state of literature and summarize key findings from comparative analysis of selected parameters of R&D effectiveness.

141
Parameterization of R&D effectiveness In this paper, we assess R&D effectiveness as ability of R&D to produce still larger
volume of output by still shorter volume of inputs. We can assess effectiveness directly or indirectly. The direct way to parameterize
R&D effectiveness is through comparison of input and output of R&D process – in most cases, patents or patent applications are taken as R&D output, and R&D expenditures, sometimes also R&D workforce is taken as R&D input. The indirect way to quantify R&D effectiveness is based on the effect of R&D activities on the real economy, aka it refers to the total factor productivity (TFP).
Both ways have, of course, their advantages and flaws.
Parameterization of R&D expenditures through elasticity of output on input Parameterization of R&D effectiveness through input-output comparison may not
reflect reliably the reality. First of all, it ignores stochastic nature of the innovation process (Keller 2010) as we
cannot safely determine direct irrevocable nexus between R&D expenditures and EPO patent applications of the same year. It is a common empirical experience that R&D expenditures may lead to their result – a patent (or a patent application) within several years. However, compared to using the number of patents granted, using number of patent applications (for analysis) reduces at least the delay of patent administration.
Second of all, even patent applications do not encompass all the innovations. Some patent applications are just upgrades of already existing patents, i.e. their value is already partially to be attributed to former R&D (e.g. Jaffe and Trajtenberg 2002), or they are just, due to its owner’s decision, not protected by an official patent, although used (e.g. Griliches 1990).
Parameterization of R&D expenditures through TFP
Parameterization of R&D effectiveness through TFP draws on the knowledge of the R&D effect – i.e. increased productivity of production inputs. This effect is in the literature quantified as parameter A = TFP (total factor productivity) from the Cobb-Douglas production function.
The advantage of the parameterization through the Solow residual (how TFP is often
addressed) is clear: as a residual of the inputs’ productivity, it comprises all the innovation (even unregistered patents) that is effectively used and contributes directly to the growth. Thus, it is the most reliable measure of R&D effect on growth.
However, the calculation of TFP is rather ambiguous due to risk of measurement error and risk of selected variable bias, when manipulation of primary data exerts significant effect on the calculated TFP in absolute terms by neglecting some of its value (Katayama et al 2009). To resolve these issues, the literature provides certain suggestions. One of them advises working with TFP growth rates instead of TFP absolute terms.
Analysis of V4 using R&D effectiveness parameters on national level
Based on the data availability, we decided to anchor our analysis in the data derived from EUROSTAT and OECD Stat, and TFP growth data from TED.

142
Elasticity of EPO patent applications on R&D expenditures R&D effectiveness as parameterized by the elasticity of EPO patent applications on
total R&D expenditures in V4 countries is demonstrated by Figure 1.
Figure 1: Elasticity of EPO patent applications (per million inhabitants) on R&D expenditures (constant 2000 prices, PPP, p.c.) in V4, <-∞;∞>
Source: own calculation, EUROSTAT 2012
Figure 1 demonstrates that the effectiveness of R&D rose in all V4 countries during the whole observed period. The most effective is, in this perspective, Hungary followed by the Czech Republic and then, Slovakia. The lowest effectiveness of the R&D expenditures was registered in Poland.
In our opinion, this ranking is not incidental. Hungary ranked number 1 as a result of the following:
1. swift growth of its business, aka for-profit investments into R&D while public R&D continue to drop,
2. in contrast to the other V4 countries, Hungary has been accumulating app. 10,5% of all its R&D sources from abroad – and for quite some time (Spisakova and Suhanyi 2009). The Czech Republic has, thus, found itself running “only” second in terms of R&D
expenditures effectiveness. Despite their patent applications equalling the Hungarian ones, Hungary manages to do so by lower R&D expenditures input than the Czech Republic.
Poland is running last among V4 due to its lowest volume of EPO patent applications among the V4 countries.
Total factor productivity growth
R&D effectiveness in V4 countries as parameterized through TFP is visualized by the Figure 2. As absolute TFP terms are viewed rather as an unreliable indicator, we decided to visualise its development by using its growth rate, i.e. its indices with the base of 100 in 1995.

143
Figure 2: TFP growth, indices of base 1995 = 100
Source: own calculation, data TED 2012
According to the Figure 2, it is clear that TFP growth has performed in the
observation period completely different trajectory as R&D indicators or patenting data themselves (EUROSTAT 2012).
The most visible difference can be observed since 2004 when the TFP growth can be viewed as synchronized between all V4 countries, or at least between Slovakia and the Czech Republic.
Figure 2 further claims that TFP rose most significantly in Slovakia followed by Poland. TFP in Czech Republic and Hungary is rather stagnating. Considering that Czech Republic and Hungary have in absolute terms the highest TFP, we may conclude that there is strong convergence between V4 in TFP.
Analysis of V4 using R&D effectiveness parameters on NUTS II level
In this part of the paper, we would like to point out differences in R&D effectiveness between the NUTS II regions of V4 countries. The data were derived again from EUROSTAT and for better visualisation, summarized separatedly for each V4 country. We decided to concentrate only on the direct method of R&D effectiveness parameterization.
The observed period is 2004-2009, aka since EU accession and beginning of statistical recording on the NUTS II level of V4 countries till less available data.
R&D effectiveness in the Czech Republic
The Czech Republic ranks second among V4 countries considering elasticity of EPO patent applications on R&D expenditures. Figure 3 visualise which Czech NUTS II regions drive this national R&D effectiveness, and if there is quite large dispersion of R&D effectiveness among the Czech regions.
Prague as the capital, surprisingly, does not perform as well as we would expect, in fact, it falls only among the average performing Czech regions. The best performing are in the observed period the eastern regions: Stredni Morava (Central Moravia), Jihovychod (Southeast) and Severovychod (Northeast) – on app. 0,7.

144
Figure 3 Elasticity of EPO patent applications on R&D expenditures in the Czech Republic, <-∞;∞>
Source: own calculation, EUROSTAT 2012
Among the lagging NUTS II, there ranks Moravskoslezsko (Moravian-Silesian
Region), even though Severozapad (Northwest) is not performing particularly better either. The dispersion of R&D effectiveness is not large and despite few fluctuations and the
impact of global financial and economic crisis in 2009, it ranges between 0,4 – 0,6.
R&D effectiveness in Hungary Hungary has been leading R&D effectiveness of V4 since 1995 (Figure 1).
Figure 4: Elasticity of EPO patent applications on R&D expenditures in Hungary, <-∞;∞>
Source: own calculation, EUROSTAT 2012

145
However, the dispersion of R&D effectiveness is rather large – regardless the impact of the global crisis, it still varies from 0,3 to 0,7.
The best performing NUTS II regions in Hungary are Kozep-Magyarorszag (Central Region, around the capital city), Del-Alfold (Southern Great Plain), and Eszak-Alfold (Northern Great Plain).
Thus, in contrast to the Czech regions, the capital region is driving the R&D effectiveness in Hungary.
The worst performing is indisputably Kozep-Dunantul (Central Transdanubia).
R&D effectiveness in Slovakia Slovakia ranked third in R&D effectiveness at the national level (Figure 1).
Figure 5: Elasticity of EPO patent applications on R&D expenditures in Slovakia, <-∞;∞>
Source: own calculation, EUROSTAT 2012
Figure 5 demonstrates that Slovakia is without doubt characterized by the largest dispersion of R&D effectiveness – varies from app. 0 to 1.
The capital region – Bratislavsky kraj (Bratislava region) is, as a matter of fact, however, the best performing region among V4 NUTS II and we may conclude that within the observed period, the EPO patent applications in the Bratislava region are elastic to R&D expenditures.
However, the global financial and economic crisis in 2009 resulted in serious drop of R&D effectiveness of the Bratislava Region – in fact, to the level of the second ranked Slovak region Vychodne Slovensko (Eastern Slovakia) that as the only region among Slovak regions managed to maintain their R&D effectiveness despite the crisis.
All the other Slovak regions fall far behind the R&D effectiveness of the Bratislava Region with the Stredne Slovensko (Central Region) performing in the crisis the worst. R&D effectiveness in Poland
Poland ranked last in R&D effectiveness at the national level.

146
Figure 6: Elasticity of EPO patent applications on R&D expenditures in Poland, <-∞;∞>
Source: own calculation, EUROSTAT 2012
Observing the Figure 6, it becomes clear that the southern and western regions of
Poland were more successful in terms of R&D effectiveness. Besides the two central regions – Lodzkie (with the biggest city Lodz) and Mazowieckie (Masovian Voivodeship, with the capital Warsaw), the most R&D-effective regions are the Malopolskie with the biggest city Krakow and the south-western regions of Lubuskie, Dolnoslaskie and Opolskie. Thus, the capital is also driving the national R&D effectiveness.
The dispersion of R&D effectiveness is also large – varies from 0 to 0,7.
Conclusion Paper presents a short analysis of selected parameters of R&D effectiveness. We
decided to concentrate on two parameters: elasticity of output (EPO patent applications) on input (R&D expenditures), and TFP.
In terms of elasticity of output on input, the paper demonstrates that for almost the whole observed period of 1995-2009, Hungary ranks number one among V4 countries. We suspect that the reason may be found in high percentage of R&D expenditures coming from abroad – from more successfully innovation performing countries, e.g. USA funding CEU research.
In terms of TFP growth, Slovakia dominates the V4 countries. In overall, we can detect convergence of absolute TFP between the V4 countries and that, in our opinion, verifies also the presence of international technology spillovers – especially in case of Slovakia where the share of foreign R&D expenditures is the highest among V4 countries.
Analyzing the R&D effectiveness among NUTS II regions of V4 countries, we may conclude that the one of the main (if not only) driver(s) of national R&D effectiveness is the capital region – only Prague is exception. The Czech Republic is also the only V4 country, in which the dispersion of R&D effectiveness is narrow and varies only by 0,2 elasticity units.
Empirical data also proves that Slovakia’s capital region – the Bratislava Region is the best performing region in terms of R&D effectiveness among all the V4 NUTS II regions.

147
Literature: 1. EATON, J. – KORTUM, S. 1999. International technology defusion: Theory and
measurement. In International Economic Review. 1999, Vol. 40, pp. 537-570.
2. EUROSTAT, 2012. EUROSTAT Database [online]. 2012. Available at: <http://epp.eurostat.ec.europa.eu/portal/page/portal/statistics/search_database> [cit. 2012-03-31].
3. GRILICHES, Z. 1990. Patent Statistics as Economic Indicators: A Survey. In Journal of Economic Literature. 1990, vol. 28, pp. 1661-1707
4. JAFFE, A. – TRAJTENBERG, M. 2002. Patents, citations and innovations: A window on the knowledge economy. Cambridge (MA) : MIT Press, 2002. 478 p. ISBN 0-262-10095-9.
5. KATAYAMA, H. – LU, S. – TYBOUT, J. R. 2009. Firm-level productivity studies: Illusions and a solution. In International Journal of Industrial Organization. 2009, Vol. 27, No. 3, pp. 403-413.
6. KELLER, W. 2010. International trade, foreign direct investment, and technology spillovers. In HALL, B. – ROSENBERG, N. (Eds): Handbook of the Economics of Innovation – Volume 2. North-Holland : Elsevier, 2010. pp. 793-829.
7. KOOPMANS, T. C. 1965. On the Concept of Optimal Economic Growth. In Pontificae Academiae Scientiarum Scripta Varia. 1985, Vol. 28, pp. 225-300.
8. LUNDVALL, B. Å. 2007. Innovation system research and policy. Where it came from and where it might go. Oslo : Center for Advances Studies - Norwegian Academy of Science and Letters. Mimeo. 2007.
9. PUŠKÁROVÁ, P. 2012. Inovačná výkonnosť krajín V4. In EDAMBA 2012 [elektronický zdroj] : proceedings of international scientific conference for doctoral students and young researchers : 22nd November, 2012 Bratislava / editors Martina Machová, Andrea Petianová. Bratislava : Publishing House EKONÓM, 2012. ISBN 978-80-225-3549-6. s. 972-985.
10. SCHUMPETER, J. A. 1939. Business Cycles: Theoretical, Historical and Statistical Analysis of the Capitalist Process. New York Toronto London : McGraw-Hill Book Company, 1939. 461 p. ISBN 0-306-48082.
11. SCHUMPETER, J. A. 1943. Capitalism, Socialism and Democracy. London : Allen and Unwin, 1943. Reprinted in London : Routledge, 1994. 437 p. ISBN 0-415-10762-8.
12. SOLOW, R. M. 1956. A Contribution to the Theory of Economic Growth. In Quarterly Journal of Economics. 1956, Vol. 70, No. 1, pp. 65-94.
13. SPIŠÁKOVÁ, E. – SUHÁNYI, L. 2009. Podpora výskumu a vývoja v krajinách V4. In Transfer inovácií č. 13/2009. s. 57-60.
14. SWAN, T. W. 1956. Economic Growth and Capital Accumulation. In Economic Record. 1956, Vol. 32, Iss. 2, pp. 334-361.
15. TED – The Conference Board Total Economy Database, 2012. Total Economy Database [online]. 2012 Available at: http://www.conference-Board.org/data/economydatabase/ [cit. 2012-02-20].

148
Contact
Ing. Paula Puškárová, DiS. art. PhD. Institute for Economics and Management University of Economics in Bratislava Dolnozemská cesta 1/b 852 35 Bratislava Slovakia E-mail: [email protected]

149
Chalotorn Sinproh
FACULTY OF INTERNATIONAL RELATIONS UNIVERSITY OF ECONOMICS IN BRATISLAVA, SLOVAKIA
THE GLOBAL IMBALANCES FROM THE PERSPECTIVE OF THE
OIL-EXPORTING COUNTRIES
Abstrakt ‘‘Globálne nerovnováhy’’ sa odvíjajú od rozdielov medzi štrukturálnym vonkajším deficitom a prebytkom rozvíjajúcich sa krajín a krajín vyvážajúcich ropu. Cieľom tohto príspevku je zhodnotiť a zamerať sa na relevantné otázky, s ktorými sa stretávajú globálne ekonomiky z pohľadu krajín vyvážajúcich ropu. Svet je svedkom vzniku globálnych nerovnováh, veľkých a pretrvávajúcich prebytkov bežného účtu v niektorých krajinách a deficitov bežného účtu u ostatných krajinách. Veríme, že také nerovnováhy môžu zhoršiť nadmernú menovú tvorbu, pretože rozvíjajúce sa krajiny a krajiny vyvážajúce ropu obnovujú svoje externé prebytky do krajín OECD (najmä v USA) prostredníctvom akumulácie devízových rezerv. Neudržateľnosť s týmto problémom vyvoláva obavy z rozšírenia globálnych rizík. Kľúčové slová: globálne nerovnováhy, prebytok bežného účtu, petrodolar, efektívne devízové kurzy, krajín vyvážajúcich ropu. Abstract “Global imbalances” refer to the differences between the structural external deficit and surpluses of emerging and oil-exporting countries. The aim of this contribution is to assess and focus on certain issues encountering the global economy from the perspective of oil – exporting countries. The world has witnessed emergence of global imbalances; large and persistent current account (CA) surpluses in some countries and CA deficits in others. Such imbalances are believed to exacerbate excessive monetary creation, because emerging and oil-exporting countries recycle their external surpluses to OECD countries (mainly in the USA) via the accumulation of foreign exchange reserves. The unsustainability of this pressing concern has raised some fears of increased global risks. Key Words: Global imbalances, Current Account Surpluses, Petrodollars, Effective Exchanges Rate, Oil exporters. Introduction In recent years, Global imbalances have been the subject of numerous debates. As we all know, a key challenge facing the world economy today is the growing external financial imbalances. Several American politicians and analysts explain their country's colossal current-account deficit by pointing at the surpluses of Asian economies, particularly China with occasional nods to Germany and Japan. China has been at the centre of heated rhetoric over its contribution to global imbalances and a corresponding shortfall in global aggregate demand. In actual fact, looking at the world as a whole, the group of countries with the biggest current-account surpluses is no longer Asia but oil exporters, on which high prices have bestowed a gigantic windfall. Economies can take many years to adjust to changes in oil prices, which tend to be large and persistent. Oil exporters typically run surpluses for several years after an increase in oil prices. Oil prices and oil production are clearly exogenous to current account balances.This means the surpluses of oil exporters has been overlooked as the

150
one bigger of major regions whose their current-account surpluses chiefly contribute to the Global imbalances1. However, in the early 80s much of the discussion concerned the role of large oil-exporting countries’ current account surpluses and the consequent recycling of ‘petro-dollars’ e.g. into Latin America. According to the Economist, The biggest counterpart to America's current-account deficit is the combined surplus of oil-exporting economies. This year 2012 the IMF expects them to run a record surplus of 740 billion USD, three-fifths of which will come from the Middle East. That will dwarf China's expected surplus of 180 billion USD. Since 2000 the cumulative surpluses of oil exporters have come to over 4 trillion USD, twice as much as that of China. The International Monetary Fund estimated that oil exporters' current-account surplus might reach 400 billion USD, more than four times as much as in 2002. In real terms, this is almost double their dollar surpluses in 1974 and 1980, after the twin oil-price shocks of the 1970s—when Russia's hard-currency exports were tiny. The combined current-account surplus of China and other Asian emerging economies was put at only 188 billion USD in 2005. In addition, Some might say that the current increases in oil prices have not produced significant negative impacts on world economic growth or inflation so far, largely because productivity growth and improved energy-efficient technologies are driving today’s increasingly vibrant world economy. Here is it is some facts. In 2005, oil exporters hauled in 700 billion USD from selling oil to foreigners. This included not only the Organisation of Petroleum Exporting Countries (OPEC) but also Russia and Norway2.It is worth noting that the recent rise in oil prices can play a role in financing investment in expanded production capacities in the oil-exporting countries. When it comes to the question; what factors have determined the size and direction of current account imbalances in recent years? Answers to this question have tended to focus on OPEC price increases and surpluses. Observing that the large surpluses must be balanced in the aggregate by the deficits of oil-importing countries, many analysts have attributed the current account difficulties of individual countries to their oil imports and have regarded reduction of those imports as a major policy objective. Unquestionably, the supply demand mismatch in the world oil market is partly a result of limited investments in production, a result partly of the lower oil prices of the past. It follows, therefore, that higher oil prices will allow supplies to grow with demand, thereby supporting sustainable global growth. The International Energy Agency (IEA) estimates that the global energy sector will require about 16 trillion USD in investments to expand oil production capabilities from now until the year 2030. As the world economy recovers, the rising oil price would leave oil exporters awash with petrodollars once again. High oil revenues seem to spark off import booms with some lag. However, terms-of-trade shocks did have effects on the real exchange rate, which in turn affected imports. In general, there is evidence that exchange rate changes have a systematic effect on exports but not necessarily on current accounts. Drawing on observations from the 1980s and more recently from 2008 and 2009, it is expected that a significant drop of oil prices will lead to an adjustment of oil exporters’ current account surpluses. Global
1 U.S. Treasury.2006.Statement by G7 Finance Ministers and Central Bank Governors . Washington, DC: U.S. Treasury, 2006. .[cit. 13-09-2012]. Available on internet[online].: http://www.g8.utoronto.ca/finance/fm060421.htm 2 The world's second- and third-biggest earners, According to the IMF World Economic Outlook (2006), Russia and Saudi Arabia are the two countries with the largest current account, trade balance and oil balance surplus in US dollars among the oil exporting countries. Norway has the third largest current account and trade surplus and the seventh largest oil surplus.

151
imbalances are thus unlikely to remain a policy issue of the past. In this paper, we explore more about the role played by oil-exporting countries in global imbalances. Current Account Balances Surplus and Oil Exporters The current account position in oil-exporting countries shows high degree of volatility due to fluctuations in oil prices, and in some countries in production volumes and oil sector-related imports. The surge in oil revenues over the past four years is perhaps the biggest windfall ever enjoyed by a group of countries. In real terms, the oil exporters' current-account surplus is more than twice as big as it was at its peak in the 1970s' oil-price shocks. Many smaller private investors in the Middle East are keeping their money closer to home. The rising price of oil reduces the discretionary income of consumers and squeezes the profits of businesses, sapping demand from the world economy. But rising energy prices pose another threat – namely, that the accumulation of surpluses in oil exporting economies may be recycled into developed markets and contribute to excess lending and asset bubbles. In the 1970s and early 1980s equity markets barely existed in the Gulf. This time money has flooded into them. Increased liquidity flows in the past few years have resulted in sharp increases in asset prices in these markets. In December 1998, the price of high-quality crude oil briefly fell below 11 USD a barrel as financial crises in Asia, Russia, and Brazil dampened demand. Adjusted for inflation, the price was the lowest since 1973. As the world economy recovered and grew, the price of oil rose markedly, peaking at almost 70 USD per barrel in 20053 before ending the year at 61 USD per barrel. These days, the price continues to hover at around 110 USD. Assessing the appropriate current account level in oil-exporting countries is further complicated by a number of factors. Oil producers’ current account surpluses have increased already large global imbalances. First, the fact that oil resources are exhaustible raises the need for intergenerational equity considerations. This can be an especially pressing issue for countries close to the depletion of their oil resources. Second, the presence of the Dutch disease phenomenon, where an oil boom leads to a real appreciation of the domestic currency reducing the competitiveness of non-oil exports and increasing imports, adversely impacts the current account position and its prospects. Current account balances of oil exporters exhibit a higher volatility than those of emerging market economies due to oil price movements, and in times of high oil prices show high surpluses (Figure 1). The latter has been particularly pronounced since the beginning of this decade. While emerging markets on average have had gradually rising current account surpluses since 2000, reflecting developments in Asia in particular, oil exporters’ surpluses initially surged and then remained at high levels.Oil-exporting countries have contributed significantly to the emergence of global imbalances. The doubling of oil prices during 2002-2005 has made the group of oil-exporting countries a major player on the global current account imbalances scene. The increase in oil prices has shifted large additional sums of money from oil-consuming to oil-producing countries. Indeed, as shown in Figure 1, oil exporters4 experienced a sharp increase in current account surpluses amounting to 466 billion USD in 2007 compared to 518 billion USD for Emerging Asia. The oil exporters' current account surplus was small compared to the magnitude of the global imbalances in 2002, but its scale has been growing rapidly. As a result of the recent 3 Mathijs van Gool.2012. Big Oil: difficult conditions, breathtaking prospects. Groningen : European Energy Review,2012. [cit.19-09-2012]. Available on internet[online].: http://www.europeanenergyreview.eu/site/pagina.php?id=1411 4 Oil/gas exporting countries are Algeria, Angola, Azerbaijan, Bahrain, Congo, Ecuador, Equatorial Guinea,Gabon, Iran, Kazakhstan, Kuwait, Libya, Nigeria, Norway, Oman, Qatar, Russia, Saudi Arabia, Syria,Turkmenistan, United Arab Emirates, Venezuela, and Yemen.

152
rise in oil prices, oil exporters have become important counterparts to the United States in the ownership of foreign savings. Their current account surplus represented in 2005 some 40 percent of the U.S. current account deficit, nearly doubling in one year. According to the IMF, the cumulative surpluses of oil exporters could amount to 1.7 trillion5 USD in the five years to 2007, swamping China's likely stash of 700 billion USD. The forecast for 2008 exceeds that of Asia. These surplus countries seem to mirror the deficit of the United States (Figure 1).
Figure 1. Evolution of Current Account Imbalances, 2002- 2011
Source: IMF April ,2012 Global imbalances, as reflected in the current account deficits and surpluses of the world’s major regions, fell with the collapse of trade and oil prices in 2008, but should rise again as both recover. This chart shows that global imbalances are driven primarily by the U.S. and China. Absent significant macroeconomic policy changes in one or both, the likelihood of a sustained, significant improvement in global imbalances, without another crisis, is small. High oil prices have boosted the fortunes of oil exporters. In 2011, their combined export proceeds reached an unprecedented 2 trillion USD, and their aggregate current account surplus amounted to 600 billion USD or about 11 percent of the group’s total GDP. That amounted to the largest current account imbalance globally—compared to the U.S. current account deficit at 473 billion USD (see Figure 1and 2). In the Figure 2 below, one can see a close correlation between the average level of global imbalances and oil prices (the correlation coefficient is 0.47). Quite clearly, the levels of current account balances worldwide tend to rise and fall with energy prices. In addition, the rise in oil prices has so far not helped much to reduce current account imbalances between the United States and Asia. Even though it has been running a rising deficit in its oil trade accounts, Asia has not been dissaving as a consequence. In fact, Asia's current account has strengthened since 2002. By contrast, the United States' current account deficit has continued to widen, with the group of oil-exporting countries becoming an increasingly significant counterpart in the allocation of world current account imbalances (see Figure 2, left).
5 Giorgio S. F.,2011.In Policy Brief : The Economy in the Arab Uprisings: Difficulties and Transformations. Washington, DC: The German Marshall Fund of the United States (GMF).

153
Figure 2: World Current Account Balance and the Crude Oil Price, 1976-2010
Source: IMF WEO ,OPEC, 2012 ,OECD Factbook 2011, Author’s calculations What is interesting today is that the mix of surplus countries is also changing. Japanese surpluses used to be the main counterparts to the persistent current account deficits of the US, particularly in the 1980s through the mid- 1990s. But since then, Germany, China and the oil exporting countries have also become important surplus counterweights to the US deficits.As manifested by Figure 3 shows that the oil exporters’ current account follows closely the Real oil prices during period 1990 until 2011. Oil price dynamics are important in determining export revenues of oil exporters that in turn affect their external balances. The boom and bust cycles of oil prices transmit to the current account balances of oil exporters.
Figure 3: Oil Exporters’ Current Account Surplus and Real Oil Price (1990 -2011)
Source: IMF, International Financial Statistics, World Bank, OECD According to International Financial Statistics, current account imbalances are the result of persistent international differences in trade positions. In this view, persistent trade surpluses (or deficits) might arise in countries with a limited basis from which to export. For instance, countries which export relatively price-inelastic primary commodities such as oil might see their trade surplus increase following the cycle of international commodity prices. In particular, oil price hikes have been shown to explain the large current account surpluses of oil-exporting countries in the 1970s and the 2000s. The decline in oil prices in recent years is argued to be one of the driving factors behind the narrowing of current account imbalances in 2008 and the first half of 2009, before they widened again in the second half of 2009 and 2010.6 (European Union 2010).
6 European Union, 2010. European Economic Forecast - Spring 2010. EUROPEANECONOMY 2|2010. [Accessed July 7, 2010]. Available

154
Aided by higher oil prices, the oil exporters’ combined current account surpluses approached US$400 billion in 2011—almost double the 2010 level. This increase helped lift their official reserve position above the US$1 trillion mark and raised other foreign assets. Nevertheless, current account balances varied across oil-exporting countries, with GCC countries recording rising surpluses (reaching an average of more than one-fifth of GDP), while Sudan and Yemen registered deficits. According to the IMF’s October 2011 World Economic Outlook, the cumulative current account surpluses in oil exporting economies was projected to be less than 0.5% of global GDP from 2010 to 2015, down from a double peak of 0.94% of global GDP in 2006 and 0.92% in 2008.
Figure 4:Food and Oil Prices
Source: IMF WEO, 2012. From 2010 until early stage of year 2011, oil prices rose sharply to about $115 a barrel, then eased to about 100 USD a barrel, and now are back up to about 115 USD a barrel (Figure 4). Production recovered in Libya but fell in various other Organization of Petroleum Exporting Countries (OPEC) producers, and non-OPEC output remained relatively weak. In addition, geopolitical risks––notably those centered on the Islamic Republic of Iran—have boosted oil prices. IMF Projections for 2012–137 assume that oil prices recede to about 110 USD a barrel in 2013, in line with prices in futures markets, but in the current environment low stocks and limited spare capacity present important upside risks.
Figure 5: Current Account Balance MENA
Source: National authorities, and IMF staff calculations
at:http://ec.europa.eu/economy_finance/publications/european_economy/2010/p df/ee-2010-2_en.pdf 7 IMF WEO.2012. In World Economic outlook April 2012 : Growth Resuming, Dangers Remain. Washington, DC : World economic and financial surveys IMF, 229 p[cit.23-09-2012]. Available on internet[online].: www.imf.org/external/pubs/ft/weo/2012/.../weodata/index.asp ISBN 978-1-61635-246-2

155
Nonetheless, higher oil prices will help current account surpluses double from 2010 to 2012. In consonance with Figure 5,Economic growth in the Middle East and North Africa(MENA) region was below trend in 2011, primarily because of country-specific factors8. Among oil exporters, strong oil prices contributed to growth of 4 percent in 2011, which was held down by lower outcomes in the Islamic Republic of Iran related to a poor harvest and the effect of the subsidy reform. This low growth is a direct reflection of the effects of social unrest. Moreover, lower trade and remittance flows reflecting ongoing problems in Europe, anemic tourism associated with social unrest in the region, and strong oil prices are the major constraints of its recovery.
Gulf hydrocarbon producers basked in a massive current account surplus of nearly $322 billion in 2011 because of a sharp rise in their oil exports due to strong crude prices, for example in Saudi Arabia, the world’s largest oil exporter, the IMF estimates that the current account surplus is far below the actual trade surplus. Historically, these two figures stayed very closely linked, particularly during the period from 2004-2008, when the trade balance exceeded the current account balance by about 12% of GDP. But in 2010 the trade surplus was 32.9% of GDP while the IMF estimated the current account balance was only 6.7% of GDP, a difference of $114 billion. The Figure 5 showed the GCC’s trade surplus, the world’s largest in subset of Middle East and North Africa, is the predominant reason for its current account surplus given the group’s large crude oil production, estimated at around 16 million barrels per day last year. In 2011, Saudi Arabia is estimated to have had the world’s largest trade surplus of around $245 billion, just ahead of China, and the GCC regional balance was more than double that size, $520 billion (38 per cent of GDP).Qatar had the largest relative surplus, at 45 per cent of GDP, and Kuwait, Saudi Arabia and Oman were close behind. Bahrain and UAE had the lowest relative balances, at 16 and 23 per cent of GDP respectively in 2011.Kuwait’s surpluses are the largest in relative terms, equal to an estimated 35 per cent of its GDP in 2011. Kuwait benefits from a strong income surplus in addition to its trade surplus from hydrocarbon exports. The UAE has the smallest surplus, at 14 per cent of GDP as its economy is less dependent on oil exports, with a large services component to its GDP. The ratio of current account balance to GDP shows the volatility in this data
Figure 6: Change in Current Account Balances 2000 – 2011 (∆ In % of Bil. USD)
A)
2000 2011 ∆ (%)
Advanced economies -266.492 -102.776 -0.61
United States -416.342 -473.439 0.14
Euro area -35.62 40.952 -2.15
Germany -32.765 205.449 -7.27
Japan 119.605 120.241 0.01
Other advanced economies (Advanced economies excluding G7 and euro area) 85.317 304.755 2.57
8 The Data of Syrian Arab Republic has not been used in this analysis due to the uncertain political situation. Libya’s economic growth is affected by the civil war.

156
B)
2000 2011 ∆ (%)
Emerging and developing economies 99.616 476.296 3.78
China 20.519 201 8.80
CIS :Commonwealth of Independent States 48.253 112.453 1.33
Latin America and the Caribbean -48.459 -68.195 0.41
Middle East and North Africa 84.828 365.98 3.31
Central and eastern Europe -28.859 -114.144 2.96 Source: International Monetary Fund, World Economic Outlook Database, April 2012, Author’s calculations Source: IMF WEO, OECD 2012 As a result of the eminence increasing in the oil price and of energy in economic production processes implies a substantial global redistribution of wealth and, hence, purchasing power. How changes in oil prices affect global imbalances depends in part on the time period considered, how swiftly corrections in demand and supply respond to price changes, and perceptions about the durability of the price change. Price spikes, for instance, probably have relatively small, in some cases negligible, effects on global imbalances. In this case, however, the price increase has been sustained, and the impact on global imbalances has been significant. For example, the trade movement of the U.S, oil import rose from 11 092 thousand barrels daily in 2000 to 11 337 thousand barrels daily in 20119 whose value of oil imports is unexpectedly increase from 120.3 to 461.5 billion USD respectively at mentioned years, and the current account surplus of Saudi Arabia increased from 7.597 % of GDP to over 24% of GDP over the same period10. Figure 6 and 7 shows the 11-year change in the estimated external positions of major regions.
Figure 7:The ratio of current account balance to GDP shows the volatility in this data A)
2000 2011 ∆ (%)
Advanced economies -1.035 -0.231 0.80
United States -4.184 -3.137 1.05
Euro area -0.568 0.312 0.88
Germany -1.732 5.744 7.48
Japan 2.528 2.049 -0.48
Other advanced economies (Advanced economies excluding G7 and euro area) 3.29 4.916 1.63
9 BP Statistical Review of World Energy : http://www.bp.com/statisticalreview 10 International Monetary Fund, World Economic Outlook Database, April 2012

157
B)
2000 2011 ∆ (%)
Emerging and developing economies 1.521 1.887 0.37
China 1.712 2.754 1.04
CIS :Commonwealth of Independent States 13.654 4.618 -9.04
Latin America and the Caribbean -2.271 -1.215 1.06
Middle East and North Africa 10.715 13.236 2.52
Central and eastern Europe -4.822 -5.984 -1.16 Source : International Monetary Fund, World Economic Outlook Database, April 2012, Author’s calculations Conclusion Wrapping up, the movements of global imbalances from perspective of oil-exporting countries have continuously joining a group of large current account surplus countries. Current account balances of oil exporters exhibit a higher volatility than those of emerging market economies due to oil price movements, and in times of high oil prices show high surpluses. The oil exporters' current account surplus was small compared to the magnitude of the global imbalances in 2002, but its scale has been growing rapidly, widening existing imbalances. The oil exporters’ current account follows closely the real oil prices during period 1990 until 2011. The boom and bust cycles of oil prices transmit to the current account balances of oil exporters. The decline in oil prices in recent years is argued to be one of the driving factors behind the narrowing of current account imbalances in 2008 and the first half of 2009, before they widened again in the second half of 2009 and 2010. A close correlation between the average level of global imbalances and oil prices, It is evident that the levels of current account balances worldwide tend to rise and fall with energy prices. According to the IMF’s October 2011 World Economic Outlook, the cumulative current account surpluses in oil exporting economies was projected to be less than 0.5% of global GDP from 2010 to 2015, Economic growth in the Middle East and North Africa(MENA) region was below trend in 2011, primarily because of country-specific factors. This low growth is a direct reflection of the effects of social unrest. Moreover, lower trade and remittance flows reflecting ongoing problems in Europe and strong oil prices are the major constraints of its recovery.
The ratio of current account balance to GDP shows the 11-year change in the estimated external positions of major regions and occurs the biggest number coming down to Middle East and North Africa approximately 2.5 % of GDP. Higher oil prices will help current account surpluses double from 2010 to 2012 because since 2000 the cumulative surpluses of oil exporters have come to over twice as much as that of China. The GCC’s trade surplus is the predominant reason for its current account surplus given the group’s large crude oil production, estimated at around 16 million barrels per day last year. A lot of money has been invested in equities, hedge funds, private equity and property, where ownership is harder to track Most oil exporters peg their currencies to the dollar or resist appreciation through heavy intervention, in much the same way as China. The petrodollar explosion has two main consequences. Overall an increasingly tight correlation with the falling dollar mirroring the rising price of oil has reflected the same underlying geoeconomic factors. Pegging those currencies to the weak dollar also dampens demand for imports in their economies, and thus hinders the rebalancing of global current accounts. Higher levels of both imports and government spending by the oil-producing countries would help unwind the imbalances that

158
endanger the world's economic stability. The correct solution to global imbalances is for America to save more and for surplus countries, including both the oil exporters and the Asians, to spend more.
Literature: 1. BIS.2012. STATISTICS:Effective Exchange Rates,.Basel: Bank for International
Settlements (BIS),2012 [cit.08-06-2012]. Available on internet[online].: http://www.bis.org/statistics/eer/index.htm
2. Bureau of Economic Analysis (BEA).2012. US Current Account Balance and the Real Exchange Rate .[online]. Washington, DC: Bureau of Economic Analysis.,2012.[cit. 12-06-2012]. Available on internet[online].: http://www.bea.gov/national/nipaweb/SelectTable.asp
3. Fardoust, S.2012.In International Economic Bulletin: Managing High Oil Prices and Recycling Petrodollars. Washington, DC: Carnegie endowment, 2012 [cit.20-09-2012]. Available on internet[online].:
http://carnegieendowment.org/ieb/2012/05/31/managing-high-oil-prices-and- recycling-petrodollars/b10a
4. International Financial Statistics (IFS) IMF.2012. Real Effective Exchange Rate, Nominal Effective Exchange Rate, Balance of Payments Statistics (BOP), Foreign Exchange. [online]. Washington, D.C: International Monetary Fund, 2012, [cit. 10-06-2012]. Available on internet.:
http://imfstatext.imf.org/OECDStat_Metadata/ShowMetadata.ashx?Dataset=PGI&Coo rds=[DATASOURCE].[IFS]&ShowOnWeb=true&Lang=en
5. IMF WEO.2012. In World Economic outlook April 2012 : Growth Resuming, Dangers Remain. Washington, DC : World economic and financial surveys IMF, 229 p[cit.23-09-2012]. Available on internet[online].:
www.imf.org/external/pubs/ft/weo/2012/.../weodata/index.asp ISBN 978-1-61635- 246-2
6. LIPKOVÁ, Ľ. a kol. Medzinárodné hospodárske vzťahy, Bratislava:Sprint dva, 2011. 436 s. ISBN: 978-80-89393-37-4.
7. MM Habib, 2007. In WORKING PAPER SERIES: Are there oil currencies? The real Exchange rate of oil exporting countries. Berlin: European Central Bank,2007, No. 839.41p. [cit.13-09-2012]. Available on internet[online].:
http://www.ecb.int/pub/pdf/scpwps/ecbwp839.pdf ISSN 1561-0810
8. Rabah A. and Fuad H.2009. In IMF Working Paper :Global Imbalances and Petrodollars. Washington, DC: International Monetary Fund,2009. 27p [cit.18-09-2012]. Available on internet[online].:
http://www.imf.org/external/pubs/ft/wp/2009/wp0989.pdf
9. Saleh M. Nsouli. 2006. At the CESifo's International Spring Conference.Berlin : International Monetary Fund, 2006 [cit.19-09-2012]. Available on internet[online].: http://www.imf.org/external/np/speeches/2006/032306a.htm
10. Setser, B.2007. In Policy Brief : The Case for Exchange Rate Flexibility in Oil-Exporting Economies. Washington, DC: Peterson Institute for International
159
Economics, 2007.No. Pb07-8. [cit.23-09-2012]. Available on internet[online].: http://wwvv.iie.com/publications/pb/pb07-8.pdf
11. Sipko, J.2000. Medzinárodný platobný styk. Bratislava:Elita, 2000. 382 s. ISBN: 80-8044-072-7.
12. T. Ashby McCown, et al.2006 .In OCCASSIONAL PAPER NO. 1: Petrodollars and Global Imbalances. Washington, DC : Department of the Treasury Office of International Affairs, 2006. 7p [cit.12-09-2012]. Available on internet[online].: jamesgoulding.com/Research_II/Oil/Oil%20(Petrodollars).pdf ISSN 1725-2806.
13. The Economist.2012.Free exchange : Petrodollar profusion. New York: The Economist online, 2012[cit.20-09-2012]. Available on internet[online].: http://www.economist.com/node/21553424
Contact
Ing. Chalotorn Sinproh Department of International Economic Relations and Economic Diplomacy Faculty Of International Relations University of Economics in Bratislava Dolnozemská cesta 1/b 852 35 Bratislava 5 Slovak Republic E-mail : [email protected]

160
Michaela Staníčková
FACULTY OF ECONOMICS, DEPARTMENT OF EUROPEAN INTEGRATION VŠB-TECHNICAL UNIVERSITY OF OSTRAVA
OVERALL EVALUATION OF PERFORMANCE IN VISEGRAD
COUNTRIES AND REGIONS IN COMPARISON WITH AUSTRIA AN D GERMANY BY MULTIDIMENSIONAL DEA APPROACH 1
Abstract: The paper deals with an application of Data Envelopment Analysis (DEA) method to multi-criteria performance evaluation of countries and NUTS 2 regions in the Visegrad Four countries (V4) in comparison with selected advanced European Union’s (EU) countries, resp. their NUTS 2 regions – Austria and Germany. The aim of the paper is to analyse a degree of efficiency achieved in individual countries and regions which is perceived as a reflection of the level of competitive potential in reference period 2000-2010. The theoretical part of the paper is shortly devoted to the fundamental bases of competitiveness in the context of performance theory and efficiency analysis, and to the methodology of DEA approach. The empirical part is aimed at measuring the degree of productivity and level of efficiency changes of evaluated countries and regions by basic and advanced DEA models. The final part of the paper offers a comprehensive comparison of results obtained by DEA models. Keywords: Competitiveness; BCC, CCR, FDH, FRH, SBM model; CCI index; DEA method; efficiency, factor analysis; performance; RCI index. Introduction
European Union (EU) is a heterogeneous unit with significant disparities between its Member States and especially their regions. The support of cohesion and balanced development together with increasing level of EU competitiveness belong to the temporary EU’s key development objectives. The process of European integration is thus guided by striving for two different objectives: to foster economic competitiveness and to reduce territorial differences (Molle, 2007). Although the EU is one of the most developed world integration with high living standards, there exist huge economic, social and territorial disparities having a negative impact on the balanced development across Member States and their regions, and thus weaken EU’s competitiveness in a global context. In relation to competitiveness, performance and efficiency are complementary objectives, which determine the long-term development of countries and regions. Measurement, analysis and evaluation of productivity changes, efficiency and level of competitiveness are controversial topics acquire interest among researchers; see e.g. (Camanho, Dyson, 2006; Khan, Soverall, 2007).
The aim of the paper is to measure, evaluate and compare the efficiency level of countries and their NUTS 2 regions within the group of Visegrad Four (V4), i.e. Czech Republic, Hungary, Poland and Slovakia, in comparison with selected advanced European Union’s (EU) countries and their NUTS 2 region of Austria and Germany by application of Data Envelopment Analysis (DEA) models, in reference period 2000-2010. The performance analysis is used for evaluating national and regional development quality and potential (with respect to their internal factors endowment). DEA method represents a suitable tool for
1 This paper was created under SGS project (SP2012/153) of Faculty of Economics, VŠB-Technical University of Ostrava.

161
ranking competitive (uncompetitive) position of countries and regions based on efficiency within evaluated group. Application of DEA method is based on assumption that efficiency of evaluated countries and regions calculated by DEA method can be seen as the source of national and regional competitiveness; see e.g. (Melecký, Staníčková, 2011). Theoretical background of competitiveness in the context of performance
In the EU, the process of achieving an increasing trend of performance and a higher level of competitiveness is significantly difficult by the heterogeneity of countries and especially regions in many areas. The concept of competitiveness in the EU is specific regarding the inclusion of elements of European integration that goes beyond the purely economic parameters. The economy may be competitive but if the society and the environment suffer too much the country (and subsequent its regions) will face major difficulties, and vice versa. Therefore governments in the long run period cannot focus alone on the economic competitiveness of their country; instead they need an integrated approach to govern the country and regions and focus on the broadest aspects affecting competitiveness and thus efficiency (Barrell, Mason, O´Mahony, 2000).
Concept of competitiveness and efficiency analysis
In recent years, the topics about measuring and evaluating of competitiveness and efficiency have enjoyed economic interest. Although there is no uniform definition and understanding of these terms, these multidimensional concepts remain ones of the basic standards of performance evaluation and it is also seen as a reflection of success of area (country/region) in a wider (international/interregional) comparison. Performance, efficiency and competitiveness are complementary objectives, which determine the long-term development of an organization (e.g. companies, states, regions). Increasing productivity is generally considered to be the only sustainable way of improving living standards in the long term period (Nevima, Melecký, 2011).
Performance management is one of the major sources of sustainable national (and subsequent regional) effectiveness and a systematic understanding of the factors that affect productivity, and subsequently also competitiveness, is very important. The topics about measuring and evaluating of performance acquire economic interest, because performance remains one of the basic standards of efficiency evaluation. Performance is also highly important for many economic subjects (e.g. companies, states, regions) as a whole and for the individuals involving in it. Performance comprises both a behavioural and an outcome aspect. It is a multi-dimensional and dynamic concept as well as competitiveness. Despite the great relevance of performance and widespread use of this term as an outcome measure in empirical research, relatively little effort has been spent on clarifying the performance concept.
In relation to competitiveness and performance, efficiency is a term that recently has come to the forefront of the scientific world. As the world struggles to accommodate the enormous growth in population and to manage the distribution of resources, to reach higher competitive potential, the effort to make things more efficient has become increasingly more relevant. Efficiency is a central issue in broker analyses of economic growth, the effects of fiscal policies, the pricing of capital assets, the level of investments, the technology changes and production technology, and other economic topics and indicators. In a competitive economy, therefore, the issue of efficiency, resp. dynamic efficiency, can be resolved by comparing these economic issues (Staníčková, Skokan, 2012; Staníčková, Skokan, 2013).
Nowadays efficiency is one of the fundamental criteria for evaluating economic performance and reflects the success in the broader comparison. Organizations (e.g. companies, states, regions) need highly performing units in order to meet their goals, to deliver the products and services they specialized in, and finally to achieve competitive

162
advantage. Low performance and not achieving the goals might be experienced as dissatisfying or even as a failure. Moreover, performance – if it is recognized by others organizations (companies, countries, regions) – is often rewarded by benefits, e.g. better market position, higher competitive advantages, financial condition etc. Performance is a major – although not the only – prerequisite for future economic and social development and success in the broader comparison (Hančlová, 2012). Approaches to evaluation of efficiency
Evaluating of efficiency belongs to main issues of economic research, which also lacks a mainstream approach. Efficiency evaluation in terms of differences between countries and regions should be measured through complex of economic, social and environmental criteria identifying imbalance areas that cause main disparities. Currently not only quantitative but also qualitative development at national level, and especially at regional level, increase socio-economic attraction and create new opportunities that are fundamentals for subsequent overcoming disparities and increasing the performance of territory.
The primary problem in creating an effective evaluation system is establishing clear performance and efficiency standards and priorities at the beginning of the performance cycle. The early research on this problem focused on separate measures for productivity and there was a failure to combine the measurements of multiple inputs into any satisfactory measure of efficiency. These inadequate approaches included forming an average productivity for a single input (ignoring all other inputs), and constructing an efficiency index in which a weighted average of inputs is compared with output. Responding to these inadequacies of separate indices of labour productivity, capital productivity, etc., in 1957 Farrell proposed an activity analysis approach that could more adequately deal with the problem. His measures were intended to be applicable to any productive organization; in other words, from a workshop to a whole economy (Mohammadi, Ranaei, 2011). Farrel confined his numerical examples and discussion to single output situations, although he was able to formulate a multiple output case. Twenty years after Farrell’s model, and building on those ideas, Charnes et al. (1978), responding to the need for satisfactory procedures to assess the relative efficiencies of multi-input/multi-output production units, introduced a powerful methodology which has subsequently been titled Data Envelopment Analysis (DEA) (Zhu, 2012).
Measurement and evaluation of performance, efficiency and productivity is an important issue for at least two reasons. One is that in a group of units where only limited number of candidates can be selected, the performance of each must be evaluated in a fair and consistent manner. The other is that as time progresses, better performance is expected. Hence, the units with declining performance must be identified in order to make the necessary improvements (Greenaway, Görg, Kneller, 2008). The performance of a countries and regions can be evaluated in either a cross-sectional or a time-series manner, and the DEA is a useful method for both types of efficiency evaluation (Mohammadi, Ranaei, 2011).
Methods for measuring of efficiency and competitive potential
The most common quantitative methods convenient for a high number of multivariate measured variables can be identified as multivariate statistical methods. Multivariate analysis is an ever-expanding set of techniques for data analysis that encompasses a wide range of possible research situation (Hair, Black, 2009). Between collections of multivariate statistical methods we can include e.g. Method of main components, Factor analysis or DEA method, which are used in the paper. Measuring the efficiency level of evaluated countries is based on procedure in following Table 1. The European Union makes an effort to restore the foundations of its competitiveness and economic performance through increasing its growth potential and its productivity. Based on the above facts, the performance analysis provided by

163
the specialized DEA method can be used in evaluating national and regional efficiency with respect to national and regional factor endowment.
Table 1: Basic scheme of efficiency measuring and evaluation
Pre-processing phase Collection of indicators » Data analysis of indicators » Groups of input/output indicators Factor analysis Correlation » Input factors/Output factors » Set of new composite indicators DEA modeling CCR CRS model » Malmquist index » Efficiency evaluation
Source: own elaboration, 2013
Theoretical basis of DEA method Since DEA was first introduced in 1978, researchers in a number of fields have
quickly recognized that it is an excellent and easily used methodology for modelling operational processes for performance evaluations. This has been accompanied by other developments. DEA is based on simple Farrell model for measuring the effectiveness of units with one input and one output, which has been found out in 1957. Farrell model has been initially expanded in 1978 by A. Charnes, W.W. Cooper and E. Rhodes (CCR model) and later modified in 1984 by R. A. Banker, A. Charnes and W. W. Cooper (BCC model). DEA methods also include advanced additive models, such as Slack-Based Model (SBM) performed by K. Tone in 2002 or Free Disposal Hull (FDH) and Free Replicability Hull (FRH) models that have been firstly formulated in 1984 by D. Deprins, D. Simar and H. Tulkens (Cook and Zhu, 2008).
DEA is a relatively new data oriented approach for providing a relative efficiency assessment (DEA efficient) and evaluating the performance of a set of peer entities called Decision Making Units (DMUs) which convert multiple inputs into multiple outputs. DEA is thus a multicriteria decision making method for evaluating effectiveness, efficiency and productivity of homogenous group (DMUs). The definition of a DMU is generic and flexible. DEA is convenient to determine efficiency of DMU which are mutually comparable – using same inputs, producing same outputs, but their performances are different. The efficiency score of DMU in the presence of multiple input and output factors is defined by the following equation (1) (Zhu, 2012):
_ _ _.
_ _ _
weighted sum of outputsEfficiency
weighted sum of inputs= (1)
The aim of DEA method is to examine DMU if they are effective or not effective by the size and quantity of consumed resources by the produced outputs (Andresen and Petersen, 1993). The best-practice units are used as a reference for evaluation of other group units. DMU is efficient if the observed data correspond to testing whether the DMU is on the imaginary production possibility frontier. All other DMU are simply inefficient. For every inefficient DMU, DEA identifies a set of corresponding efficient units that can be utilized as benchmarks for improvement. However DEA is primarily a diagnostic tool and does not prescribe any reengineering strategies to improve performance of DMUs (Coelli et al., 2005).
In recent years, we have seen a great variety of applications of DEA for evaluating the performances of many different kinds of entities engaged in many different activities. Because of low assumption requirements DEA has also opened up possibilities for use in cases which have been resistant to other approaches because of the complex (often unknown) nature of relations between multiple inputs and multiple outputs involved in DMUs. DEA method can be seen as convenient method for comparing national or regional efficiency as an assumption for performance of territory because DEA does not evaluate only one factor, but a set of

164
different factors that determine degree of economic development. DEA method used in analysis of V4 countries and regions is based on a particular set of input and output indicators. Inputs and outputs form key elements of system evaluated for every country and regions within V4 in the sense of their effective (ineffective) economic position. For this purpose, DEA method can identify a competitive/uncompetitive position of each country and region.
Basic characteristics of empirical analysis
Based on the facts above, it is possible to determine the initial hypothesis of the analysis. The hypothesis is based on the assumption that countries and regions achieving best results in efficiency coefficients are advanced selected EU countries and their regions (i.e. Austria and Germany) best at converting inputs into outputs and therefore having greater performance and productive potential than V4 countries and regions.
DEA is in following analysis applied to 6 countries and 83 NUTS 2 regions within the group of V4 countries and advanced EU countries – Austria and Germany. Reference period is created by all years in range 2000-2010.
The efficiency analysis starts from building database of indicators that are part of a common approach of WEF and EU in the form of Country and Regional Competitiveness Index (CCI, RCI). The aim of this approach is to develop a rigorous method to benchmark national and regional competitiveness and to identify the key factors which drive the low competitiveness performance of some countries and regions. The reference to CCI and RCI is the well-established Global Competitiveness Index (GCI) by the WEF, but some variations and adaptations have been considered necessary especially in order to address the regional dimension. Eleven pillars may be grouped according to the different dimensions (input versus output aspects) of national or regional competitiveness they describe. The terms ‘inputs’ and ‘outputs’ are meant to classify pillars into those which describe driving forces of competitiveness, also in terms of long-term potentiality, and those which are direct or indirect outcomes of a competitive society and economy. From this point of view, methodology of Country and Regional Competitiveness Index is suitable for measuring regional competitiveness by DEA method (Annoni, Kozovska, 2010). The indicators selected for the CCI and RCI framework are all of quantitative type (hard data) and the preferred source has been the European Statistical Office (Eurostat). Whenever information has been unavailable or inappropriate at the required territorial level, other data sources have been explored such as the World Bank, Euro barometer, the Organisation for Economic Co-operation and Development (OECD) and the European Cluster Observatory. In the paper, database analysis consists of 66 selected indicators – 38 of them are inputs and 28 outputs. We do not use all indicators included in CCI because all indicators were not available for the whole period for each country and region, but for some indicators we found comparable indicators. All CCI/RCI indicators are not use because some indicators were excluded based on factor analysis (highlighted by cross out font in Table 2 and Table 3), indicators relevant to DEA modeling are listed by bold font in Table 2 and Table 3.

165
Table 2: Indicators of Inputs in Period 2000-2010 Relevant to DEA modeling Dimension Pillar Indicator*
1. Institution In: Political Stability Out: Voice and Accountability, Government Effectiveness, Regulatory Quality, Rule of Law, Control of Corruption
2. Macroeconomic Stability
In: Harmonized Index of Consumer Prices, Gross Fixed Capital Formation Out: Income, Saving and Net Lending/Net Borrowing, General Government Gross Debt, Total Intramural Research & Development Expenditure, Labour Productivity per Person Employed
3. Infrastructure In: Railway transport - Length of Tracks, Air Transport of Passengers, Volume of Passenger Transport, Volume of Freight Transport Out: Motorway Transport -Length of Motorways, Air Transport of Freight
4. Health In: Healthy Life Expectancy, Infant Mortality Rate, Cancer Disease Death Rate, Heart Disease Death Rate, Suicide Death Rate Out: Hospital Beds, Road Fatalities
5. + 6. Primary, Secondary and Tertiary Education, Training and Lifelong Learning
In: Mathematics-Science-Technology Enrolments and Graduates, Pupils to Teachers Ratio, Financial Aid to Students, Total Public Expenditure at Primary Level of Education, Total Public Expenditure at Secondary Level of Education, Total Public Expenditure at Tertiary Level of Education, Participants in Early Education, Participation in Higher Education, Early Leavers from Education and Training, Accessibility to Universities Out: Lifelong Learning
Inputs
9. Indicators for Technological Readiness
In: Level of Internet Access Out: E-government Availability
Note: * Number of indicators was decreased after correlation from 38 to 23 Source: own elaboration, 2012
Table 3: Indicators of Outputs in Period 2000-2010 Relevant to DEA modeling
Dimension Pillar Indicator
7. Labour Market Efficiency
In: Labour productivity, Male employment, Female employment, Male unemployment, Female unemployment, Public expenditure on Labour Market Policies Out: Employment rate, Long-term unemployment, Unemployment rate
8. Market Size In: Gross Domestic Product Out: Compensation of employees, Disposable income
10. Business Sophistication
In: Gross Value Added in sophisticated sectors, Venture capital (expansion- replacement) Out: Employment in sophisticated sectors, Venture capital (investments early stage) Outputs
11. Innovation
In: Human resources in Science and Technology, Total patent applications, Employment in technology and knowledge-intensive sectors, Employment in technology and knowledge-intensive sectors-by gender, Employment in technology and knowledge-intensive sectors-by type of occupation, Employment in technology and knowledge-intensive sectors-by level of education Out: Human resources in Science and Technology – Core, Patent applications to the EPO, Total intramural R&D expenditure, High-tech patent applications to the EPO, ICT patent applications to the EPO, Biotechnology patent applications to the EPO
Note: * Number of indicators was decreased after correlation from 28 to 15 Source: own elaboration, 2012.
For calculations of economic efficiency of NUTS 2 regions, we used ten selected DEA models with multiple inputs and outputs:
1. CCR input oriented model assuming constant returns to scale (CRS), 2. CCR output oriented model assuming CRS, 3. BCC input oriented model assuming variable returns to scale (VRS), 4. BCC output oriented model assuming VRS, 5. SBM additive model not-focusing on input and output assuming CRS, 6. SBM additive model not-focusing on input and output assuming VRS, 7. FDH input oriented model, 8. FDH output oriented model, 9. FRH input oriented model, 10. FRH output oriented model.
Basic DEA models, primary CCR input/output oriented models (with multiple inputs and outputs), are assuming constant returns to scale (CRS). In 1984, Banker, Charnes and Cooper suggested a modification of CCR model, which considers variable returns to scale (VRS) (decreasing, increasing or constant) – BCC input/output oriented models (with multiple inputs and outputs). VRS enable better identify more efficient units. The assumption of VRS

166
provides a more realistic expression of economic reality and factual relations, events and activities existing in countries and regions. CCR and BCC models evaluate the efficiency of units (countries and regions) for any number of inputs and outputs. The coefficient of efficiency is the ratio between the weighted sum of outputs and the weighted sum of inputs. Each country selects input and output weights that maximize their efficiency score. In DEA models aimed at inputs the efficiency coefficient of efficient countries and regions (located on the efficient frontier package) always equals 1, while the efficiency coefficient of inefficient countries and regions is less than 1. In DEA models aimed at outputs the efficiency coefficient of efficient countries and regions (located on the efficient frontier package) always equals 1, but the efficiency coefficient of inefficient regions is greater than 1. DEA also allows for computing the necessary improvements required in the inefficient countries’ and regions’ inputs and outputs to make it more efficient.
CCR and BCC models are radial, which means that they contain radial variables θq (for models aimed at inputs) and φq (for models aimed at outputs). These variables indicate the required level of reduction in all inputs (θq) and the rate of increase of all outputs (φq) to achieve efficiency. However, CCR and BCC models must focus on the distinction between inputs and outputs. SBM additive models measure directly the effectiveness of using additional variables (s+ and s−). In formulation of SBM additive models is not necessary to distinguish between a focus on inputs and outputs. As mentioned above, in CCR and BCC models, the efficiency coefficient of efficient units always equals 1, while the efficiency coefficient of inefficient units is less/greater than 1. In SBM models, the efficiency coefficient of efficient units always equals 0, because it is the sum of additional variables for inputs and outputs (s+ and s−), which express the distance from the efficient frontier. The sum of additional variables for inputs and outputs is lower, evaluated unit (in our case regions) is closer to the efficient frontier package and thus has a higher degree of efficiency, and otherwise (Cook, Seiford, Zhu, 2004; Cook and Zhu, 2008).
Basic DEA models compare inputs and outputs of evaluated units (country, region) with a linear (convex) combination of inputs and outputs of other units. This unit is not in most cases assessed to really existing unit, but to a kind of virtual unit, which is a combination of inputs and outputs of existing units. The basic idea of FDH model, which was first formulated by Deprins, Simar and Tulkens (1984), is unconvexity of set of production possibilities. This means that evaluated unit can be only relatively compared towards really existing units. For comparison with CCR and BCC models, it should be added that limits of efficiency rate is similar to these models, and it depends on model orientation on inputs or outputs. Rate of efficiency, obtained by FDH models, is generally higher than in CCR and BCC models. This is due to the possibility that a production unit is dominated not only by specific production units of set of units (CCR and BCC models), as well as convex combinations of these units. A simple extension of FDH model is FRH model, which unlike FDH model, allows evaluated unit compares with multiplied combinations of other units.
Assuming 6 countries and 83 NUTS 2 regions within evaluated countries, each with m inputs and r outputs, the relatively efficiency score of a tested country and region q is obtained by solving equations (2)–(10) (Zhu, 2012).
CCR input oriented model (with multiple inputs and outputs), assuming constant returns to scale (CRS), can be defined by following equation (2):
max ,r
i iqi
z u y=∑ (2)
on conditions:
, 1,2,..., ,r m
i ik j jki j
u y v x k n≤ =∑ ∑

167
1,m
j jqj
v x =∑
ui ≥ ε, i = 1, 2, …, r, vj ≥ ε , j = 1, 2, …, m, where z is the coefficient of efficiency of unit Uq; ui weights assigned to the i-th output; vj
weights assigned to j-th input; ε represent an infinitesimal constant; xjk is value of j-th input of unit Uk; xjq is value of j-th input of unit Uq; yik is value of i-th output of unit Uk; yiq is value of i-th output of unit Uq; m represent inputs; r represent outputs. All of the variables have the same meaning in equations (3) – (5).
For CCR output oriented model (with multiple inputs and outputs), assuming constant returns to scale (CRS), we use following equation (3):
min ,m
j jqj
g v x=∑ (3)
on conditions:
, 1,2,..., ,r m
i ik j jki j
u y v x k n≤ =∑ ∑
1,r
i iqi
u y =∑
ui ≥ ε, i = 1, 2, …, r, vj ≥ ε , j = 1, 2, …, m, where g is the coefficient of efficiency of unit Uq. All of the variables in equation (3) have the same meaning as in equation (2).
BCC input oriented model (with multiple inputs and outputs), assuming variable returns to scale (VRS), can be defined by following equation (4):
max ,r
i iqi
z u y µ= +∑
(4)
on conditions:
, 1,2,... ,r m
i iq j jki j
u y v x k nµ+ ≤ =∑ ∑
1,m
j jqj
v x =∑
ui ≥ ε, i = 1, 2, …, r, vj ≥ ε , j = 1, 2, …, m, where µ is dual variable associated with convexity condition eTλ = 1. All of the variables in equation (4) have the same meaning as in equation (2).
For BCC output oriented model (with multiple inputs and outputs), assuming variable returns to scale (VRS), we use following equation (5):
min ,m
j jqi
g v x v= +∑ (5)
on conditions:
, 1,2,..., ,r m
i ik j jki j
u y v x v k n≤ + =∑ ∑
1,r
i qi
u y =∑
ui ≥ ε, i = 1, 2, …, r,

168
vj ≥ ε , j = 1, 2, …, m, v – arbitrary, where v is dual variable associated with convexity condition eTλ = 1. All of the variables in equation (5) have the same meaning as in equation (2).
For SBM additive models not-focusing on input and output (with multiple inputs and outputs), the following equation is used (6):
max ( ) ,z + −= +T Te s e s
(6) on conditions:
,−+ = qXλ s x
,+− = qYλ s y
1,≤=≥Te λ , , , 0,+ − ≥λ s s
where z is the coefficient of efficiency of unit Uq; s+, and s− are vectors of additional variables
for inputs and outputs; λ represent vector of weights assigned to individual units, λ ≥ 0, λ = (λ1, λ2, …, λn); e
Tλ is convexity condition according to the nature of returns to scale, ie. for CRS eT λ = arbitrary, for VRS eT λ = 1; xq means value of input of unit Uq; yq means value of output of unit Uq.
For FDH input oriented model (with multiple inputs and outputs), the following equation (7), where θ is required rate of input reduction to achieving the efficient frontier, all of other variables in equation (7) have the same meaning as in equation (2) and (6):
min ( ) ,z θ ε + −= − +T Te s e s
(7) on conditions:
,θ−+ = qXλ s x
,+− = qYλ s y
1,=Te λ , , 0,+ − ≥s s
λ – binary. For FDH output oriented model (with multiple inputs and outputs), we use following
equation (8):
max ( ) ,qg φ ε + −= + +T Te s e s
(8) on conditions:
,−+ = qXλ s x
,qφ+− = qYλ s y
1,=Te λ , , 0,+ − ≥s s
λ – binary,
where g is the coefficient of efficiency of unit Uq, φ is required rate of input increase to achieving the efficient frontier. All of the variables in equation (8) have the same meaning as in equation (2) and (6).
For FRH input oriented model (with multiple inputs and outputs), the following equation (9), where θ is required rate of input reduction to achieving the efficient frontier, all of other variables in equation (9) have the same meaning as in equation (2) and (6):
min ( ) ,z θ ε + −= − +T Te s e s
(9)

169
on conditions: ,θ−+ = qXλ s x
,+− = qYλ s y
, 0,+ − ≥s s 0,≥λ
λ – integer. For FRH output oriented model (with multiple inputs and outputs), the following
equation (10), where all of the variables in equation (8) have the same meaning as in equation (2), (6) and (8).
max ( ) ,qg φ ε + −= + +T Te s e s
(10) on conditions:
,−+ = qXλ s x
,qφ+− = qYλ s y , 0,+ − ≥s s
0,≥λ λ – integer.
For solution of factor analysis statistical package IBM SPSS Statistics-Version 20 and for solution of DEA method software tools based on solving linear programming problems are used in the paper, e.g. Solver in MS Excel, such as the DEA Frontier. Application of DEA approach for efficiency analysis in V4 countries, Austria and Germany and their NUTS 2 regions
The initial assumption ´that areas achieving best results in efficiency are areas best at converting inputs into outputs and therefore having the greatest performance and productive potential was partly confirmed by analysis as show following evaluation. Evaluation of national efficiency by DEA models
In the case of national efficiency evaluation was found out that in used DEA models were comparable results in all V4 countries, but also in Austria and Germany. Table 4 presents a comparison of efficiency evaluation of V4 countries in comparison with Austria and Germany by CCR, BCC, SBM, FDH and FRH models. At national level, it is evident that levels of efficiency of individual V4 countries are on average lower in CCR models than in BCC, FDH and FRH models (except Austria and Germany, which were evaluated to be efficient in all models during the referred period). This fact confirms theory that in BCC models with VRS, the coefficients of efficiency reach higher values and higher number of evaluated DMUs is classified as efficient. This has been also confirmed in SBM models with VRS by higher number of evaluated units identified as efficient compared to SBM models with CRS. This fact is also confirmed in FDH and FRH models, because these models relatively compare inputs and outputs of evaluated countries towards really existing countries, and not to virtual countries.
The overall evaluation of efficiency of V4 countries, Austria and Germany shows that the best results achieved 2, respectively 3 of 6 countries during the period 2000-2010. The best results are predictably achieved by economically powerful countries which were efficient during the whole referred period; see Table 4 and Table 5. It means that the outputs achieved were greater than incurred inputs. Ratio of inputs and outputs is in an optimum and there is no requirement to change them. These countries were efficient in both CCR and BCC inputs/outputs oriented models, as well as in SBM, FDH and FRH models, and therefore,

170
according to the hypothesis, should have the greatest competitive potential. Efficient countries are highlighted by dark grey colour in Table 4. These countries are Austria and Germany. The Czech Republic was evaluated also as effective, but only in BCC models, SBM model with VRS and FDH models.
The efficient countries are followed by a group of countries which are also highly efficient. These countries do not achieved efficiency equal to 1 in CCR, BCC, FDH and FRH models or low sum of values of additional variables in SBM models, but their efficiency indices reached consistently highly effective values close during the referred period (coloured by light grey colour in Table 4). These countries are Slovakia and Poland in all used models, thus CCR, BCC, SBM, FDH and FRH models. In the case of CCR models, SBM model with CRS and FRH models, the Czech Republic was evaluated also as highly efficient.
Only Hungary was classified as inefficient in all used DEA models, so it shows low competitive potential and development perspective (coloured by ultra-light grey colour and italics in Table 4).
Table 4: Comparison of Efficiency in DEA Models for V4, Austria, Germany
DEA MODELS CCR IO
CCR OO
BCC IO
BCC OO
SBM CRS
SBM VRS
FDH IO
FDH OO
FRH IO
FRH OO
Country
CE* CE* CE* CE* CE* CE* CE* CE* CE* CE*
AT 1,000
1,000
1,000
1,000
0 0 1,000
1,000
1,000 1,000
DE 1,000
1,000
1,000
1,000
0 0 1,000
1,000
1,000 1,000
CZ 0,995
1,009
1,000
1,000
3 867 0 1,000
1,000
0,997 0,999
HU 0,910
1,075
0,940
1,057
1 422 912
246 397
0,950
0,950
0,940 0,950
PL 0,950
1,052
0,969
1,030
45 882 27 901 0,975
0,980
0,970 0,975
SK 0,975
1,028
0,980
1,015
16 493 9 617 0,989
0,990
0,980 0,985
Note: * Coefficient of efficiency = average efficiency rate of country in period 2000-2010 IO = input oriented model, OO = output oriented model Source: Own calculation and elaboration, 2012
Table 5 shows positions of individual V4 countries and Austria and Germany within
selected models in terms of the order of achieved average values of efficiency coefficients in CCR, BCC, FDH and FRH models or sum of values of additional variables in SBM models over the period 2000-2010. The overall evaluation of individual countries shows that the best results, in terms of efficiency in all used DEA models, Austria and Germany have reached and are ranked in first place during the whole period. These countries thus effectively utilize their competitive advantages and have the highest development potential. In second place, there is the Czech Republic, which was evaluated as highly efficient, as it has reached full level of efficiency in BCC and FDH models, also in SBM model with VRS, and high level of efficiency in CCR and FRH models, in SBM model with CRS too. Slovakia and Poland are ranked in third and fourth place because they have reached the lower values of efficiency coefficients in CCR, BCC, FDH and FRH models, and higher sum of values of additional variables in SBM models. Hungary was ranked in last – fifth place, because it was classified

171
as inefficient and reached the lowest values of efficiency coefficients in CCR, BCC FDH and FRH models, and the highest sum of values of additional variables in SBM models.
Table 5: Ranking of V4, Austria, Germany in DEA Models by Values of CEs
DEA MODELS CCR IO
CCR OO
BCC IO
BCC OO
SBM CRS
SBM VRS
FDH IO
FDH OO
FRH IO
FRH OO Countr
y Rank
Rank
Rank
Rank Rank Rank
Rank
Rank Rank Rank
Average Rank of Country*
Absolute Rank of Country*
AT 1 1 1 1 1 1 1 1 1 1 1,0 1. DE 1 1 1 1 1 1 1 1 1 1 1,0 1. CZ 2 2 1 1 2 1 1 1 2 2 1,5 2. HU 5 5 4 4 5 4 4 4 5 5 4,5 5. PL 4 4 3 3 4 3 3 3 4 4 3,5 4. SK 3 3 2 2 3 2 2 2 3 3 2,5 3.
Note: * Average and absolute ranking of countries is based on their rank in DEA models in period 2000-2010 IO = input oriented model, OO = output oriented model Source: Own calculation and elaboration, 2012
It is necessary to note that ‘old’ EU Member States, thus Austria and Germany,
reached comparable and balanced values for the referred period. Development in ‘new’ EU Member States, thus in V4 countries, has a convergence trend towards ‘old’ ones. There was a growth in their performance, increasing trend in effective use of their advantages and improve in competitive position. Most countries experienced also a decline in their performance (outputs decline as a result of declines in inputs) as a result of economic crisis. This is proved by a decrease in the efficiency index. Evaluation of regional efficiency by DEA models
The best results are traditionally achieved by economically powerful regions (in most cases) which were efficient during the whole referred period, so the resulting efficiency index is equal to 1 in CCR, BCC, FDH and FRH models or sum of values of additional variables is equal to 0 in SBM models. This means that the outputs achieved were greater than those incurred inputs. Efficient V4, Austria and Germany NUTS 2 regions are mentioned by dark grey colour and bold font in Table 6. Group of efficient regions includes the regions of the capital cities of the Czech Republic (Prague), Slovakia (Bratislava Region), Poland (Warszawa), Austria (Wien) and Germany (Berlin). The socio-economic situation of these regions is significant different from other regions, this fact confirms the combination of the regions to one homogeneous group. This homogenous group of efficient regions includes the regions of capital city Prague, Bratislava Region, Wien and Berlin, and after 10 years the capital cities have separated from other regions, this confirms the persistent disparities between metropolitan areas and the rest of regions. There are also other cohesion regions in the Czech Republic – CZ01 (Prague) and CZ02 (Central Bohemia). In Poland, the one effective province is region PL12 (Mazowieckie). In Slovakia there is an effective region SK01 (Bratislava Region). In Austria, we have found out three effective regions – AT13 (Wien), AT21 (Kärnten) and AT33 (Tirol). In Germany, the group of effective regions confirm of DE11 (Stuttgart), DE12 (Karlsruhe), DE30 (Berlin), DE50 (Bremen), DE60 (Hamburg), DE71 (Darmstadt), DE80 (Mecklenburg-Vorpommern), DE92 (Hannover), DEA1 (Düsseldorf), DEA2 (Köln), DED2 (Dresden) and DEF0 (Schleswig-Holstein). The best final

172
position is thus reached by performance of regions with agglomerations of major cities and regions in their surroundings, and big industry cities. These regions, in the frame of our hypothesis, could be regions with the best competitive potential and perspective to further development. The analysis at regional level also showed that in Hungary we find no region, which would be classified as an effective during the referred period.
To the group of effective regions it is possible include also regions which were not efficient during the whole referred period, but the resulting efficiency index was equal to 1 in CCR, BCC, FDH and FRH models or sum of values of additional variables is equal to 0 in SBM model in several years in the reference period. These regions are DE22 (Niederbayern) in Germany and AT11 (Burgenland) in Austria. These regions are mentioned by light grey colour and italics font in Table 6.
The efficient regions are followed by a group of regions which are slightly inefficient. These regions do not achieved efficiency equal to 1 in CCR, BCC, FDH and FRH models or low sum of values of additional variables in SBM models, but their efficiency indices reached consistently highly effective values close during the referred period (coloured by light grey colour in Table 6). There are NUTS 2 regions in Poland PL43 (Lubuskie) and PL52 (Opolskie), in Austria AT22 (Steiermark) at 32 (Salzburg). In Germany, DE13 (Freiburg), DE14 (Tübingen), DE21 (Oberbayern), DE23 (Oberpfalz), DE24 (Oberfranken), DE25 (Mittelfranken), DE26 (Unterfranken), DE91 (Braunschweig), DE93 (Lüneburg), DE94 (Weser-Ems), DEA3 (Münster), DEA4 (Detmold) and DEA5 (Arnsberg) belong to the group of slightly efficient regions.
Other regions are classified as ineffective in CCR, BCC, FDH, FRH and SBM models, i.e. these regions are considered as non-competitive. Most inefficient regions are highlighted by ultra-light grey colour and italics font in Table 6. There is the least efficient NUTS 2 region in Poland, there are the least efficient NUTS 2 provinces PL21 (Malopolskie), PL31 (Lubelskie) and PL32 (Podkarpackie).
Table 6 also shows position of individual V4, Austria and NUTS 2 regions within selected models in terms of the order of achieved average values of coefficients of efficiency (CE) in CCR, BCC, FDH and FRH models, or sum of values of additional variables in SBM models, over the period 2000–2010. The overall evaluation of individual V4 regions shows that the best results, in terms of efficiency in all used DEA models, have reached effective regions. These regions: in the Czech Republic CZ01 (Prague) and CZ02 (Central Bohemia), in Poland PL12 (Mazowieckie), in Slovakia SK01 (Bratislava Region), in Austria, AT13 (Wien), AT21 (Kärnten) and AT33 (Tirol) and in Germany DE11 (Stuttgart), DE12 (Karlsruhe), DE30 (Berlin), DE50 (Bremen), DE60 (Hamburg), DE71 (Darmstadt), DE80 (Mecklenburg-Vorpommern), DE92 (Hannover), DEA1 (Düsseldorf), DEA2 (Köln), DED2 (Dresden) and DEF0 (Schleswig-Holstein); have thus ranked first positions among all evaluated regions during reference period. In second place, there is German region DE22 (Niederbayern). In third place was Austrian AT11 (Burgenland).
Table 6 shows also position of regions that have ranked in last places in overall order. These regions have achieved the worst results in terms of efficiency in all used DEA models. At 53th place, thus the third worst place in final order is placed polish region PL21 (Malopolskie). At 54th place is again polish region PL31 (Lubelskie). The least efficient region (placed at 55th place) is polish region PL32 (Podkarpackie).
The best results and also first positions, in the Czech Republic have reached regions CZ01 (Prague) and CZ02 (Central Bohemia). The worst results and also last position, in the Czech Republic has reached region CZ04 (Northwest). In Hungary, the best results and also first position, region HU31 (Észak-Magyarország-Northern Hungary) has reached. The worst results and also last position, in Hungary has reached region HU33 (Dél-Alföld- Southern Great Plain). The best results and also first position, in Poland has reached region PL12

173
(Mazowieckie). The worst results and also last position, in Poland has reached region PL32 (Podkarpackie). In Slovakia, the best results and also first position, region SK01 (Bratislava Region) has reached. The worst results and also last position, in Slovakia has reached region SK04 (East Slovakia). In Austria, the best results and also first positions have reached regions AT13 (Wien), AT21 (Kärnten) and AT33 (Tirol). The worst results and also last position, region AT12 (Niederösterreich) has reached in Austria. The best results and also first positions have reached regions DE11 (Stuttgart), DE12 (Karlsruhe), DE30 (Berlin), DE50 (Bremen), DE60 (Hamburg), DE71 (Darmstadt), DE80 (Mecklenburg-Vorpommern), DE92 (Hannover), DEA1 (Düsseldorf), DEA2 (Köln), DED2 (Dresden) and DEF0 (Schleswig-Holstein) in Germany. The worst results and also last position, region DED3 (Leipzig) has reached in Germany.
Table 6: Comparison of Efficiency Results in selected DEA Models: CCR, BCC, FDH,
FRH and SBM for NUTS 2 regions in V4, Austria and Germany DEA MODELS CCR IO
CCR OO
BCC IO
BCC OO
SBM CRS
SBM VRS
FDH IO
FDH OO
FRH IO
FRH OO
Region
CE* CE* CE* CE* CE* CE* CE* CE* CE* CE*
Absolute Rank of Region**
CZ01 1.000 1.000 1.000 1.000 0 0 1.000 1.000 1.000 1.000 1. CZ02 1.000 1.000 1.000 1.000 0 0 1.000 1.000 1.000 1.000 1. CZ03 0,850 1.224 0.889 1.263 17,180 16,193 0,850 1.244 0.853 1.236 27. CZ04 0.571 1.705 0.829 1.575 37,810 30,654 0.671 1.625 0.929 1.545 42. CZ05 0.867 1.201 0.908 1.248 16,299 16,011 0.867 1.299 0.978 1.218 26. CZ06 0.696 1.713 0.735 1.665 25,406 18,260 0.756 1.653 0.835 1.545 35. CZ07 0.864 1.190 0.914 1.246 16,129 11,233 0.898 1.247 0.964 1.203 22. CZ08 0.760 1.249 0.928 1.209 20,742 15,720 0.860 1.214 0.978 1.187 31. HU10 0.841 1.148 0.889 1.127 18,090 17,360 0.866 1.137 0.892 1.118 28. HU21 0.756 1.254 0.858 1.231 31,366 27,356 0.765 1.242 0.873 1.221 38. HU22 0.814 1.181 0.865 1.186 19,022 17,176 0.834 1.175 0.875 1.148 30. HU23 0.666 1.334 0.769 1.301 45,971 31,696 0.701 1.329 0.882 1.267 44. HU31 0.820 1.176 0.996 1.072 19,759 11,121 0.868 1.157 0.998 1.059 24. HU32 0.642 1.477 0.976 1.082 24,746 18,349 0.673 1.435 0.984 1.077 34. HU33 0.611 1.550 0.911 1.361 45,753 39,540 0.634 1.527 0.923 1.299 45. PL11 0.544 1.690 0.885 1.689 123,986 112,113 0.664 1.668 0.891 1.623 51. PL12 1.000 1.000 1.000 1.000 0 0 1.000 1.000 1.000 1.000 1. PL21 0.489 1.827 0.853 1.894 139,856 120,728 0.591 1.856 0.889 1.826 53. PL22 0.562 1.537 0.763 1.564 113,971 94,457 0.681 1.401 0.890 1.414 50. PL31 0.442 2.082 0.848 2.254 141,554 129,136 0.467 1,989 0.875 2.228 54. PL32 0.560 1.650 0.880 1.786 155,891 122,667 0.576 1.635 0.895 1.732 55. PL33 0.495 1.699 0.736 1.598 133,971 104,457 0.681 1.421 0.875 1.452 52. PL34 0.662 1.437 0.863 1.464 103,971 95,457 0.679 1.426 0.884 1.445 49. PL41 0.732 1.298 0.896 1.330 57,843 48,898 0.775 1.274 0.905 1.315 47. PL42 0.811 1.168 0.933 1.189 64,149 41,274 0.836 1.149 0.948 1.168 46. PL43 0.997 1.003 1.000 1.000 0,984 0 0.999 1.001 1.000 1.000 4. PL51 0.866 1.118 0.980 1.080 25,797 16,279 0.889 1.098 0.996 1.023 32. PL52 0.951 1.059 0.977 1.048 5,489 4,212 0.973 1.041 0.985 1.032 9. PL61 0.814 1.212 0.949 1.193 65,744 50,638 0.838 1.199 0.952 1.174 48. PL62 0.789 1.240 0.974 1.229 43,072 26,810 0.801 1.227 0.981 1.211 43. PL63 0.827 1.158 0.946 1.154 31,255 28,873 0.842 1.145 0.959 1.136 39. SK01 1.000 1.000 1.000 1.000 0 0 1.000 1.000 1.000 1.000 1. SK02 0.834 1.110 0.876 1.072 13,476 8,622 0.855 1.089 0.887 1.562 20. SK03 0.789 1.146 0.812 1.186 26,928 17,908 0,813 1.113 0.828 1.099 36. SK04 0.676 1.184 0.699 1.219 34,955 32,634 0.701 1.168 0.723 1.147 41. AT11 0.997 1.003 1.000 1.000 0,961 0 0.999 1.001 1.000 1.000 3. AT12 0.914 1.081 0.965 1.086 9,022 7,176 0.934 1.075 0.975 1.048 18. AT13 1.000 1.000 1.000 1.000 0 0 1.000 1.000 1.000 1.000 1. AT21 1.000 1.000 1.000 1.000 0 0 1.000 1.000 1.000 1.000 1. AT22 0.951 1.059 0.977 1.048 3,489 2,212 0.973 1.041 0.985 1.032 6. AT31 0.934 1.030 0.976 1.022 3,476 1,622 0.955 1.025 0.987 1.002 5.

174
AT32 0.967 1.101 0.988 1.048 6,299 5,011 0.987 1.089 0.995 1.023 12. AT33 1.000 1.000 1.000 1.000 0 0 1.000 1.000 1.000 1.000 1. AT34 0.941 1.048 0.989 1.027 6,090 5,360 0.966 1.037 0.992 1.018 13. DE11 1.000 1.000 1.000 1.000 0 0 1.000 1.000 1.000 1.000 1. DE12 1.000 1.000 1.000 1.000 0 0 1.000 1.000 1.000 1.000 1. DE13 0.969 1.099 0.991 1.035 5,999 5,017 0.989 1.075 0.997 1.019 10. DE14 0.968 1.102 0.989 1.041 6,032 5,991 0.982 1.087 0.996 1.020 16. DE21 0.960 1.103 0.980 1.084 6,199 5,081 0.972 1.099 0.984 1.069 12. DE22 0.998 1.002 1.000 1.000 0,764 0 0.999 1.001 1.000 1.000 2. DE23 0.951 1.059 0.977 1.048 5,099 4,105 0.973 1.041 0.985 1.032 8. DE24 0.967 1.101 0.988 1.048 6,242 5,009 0.987 1.089 0.995 1.023 11. DE25 0.953 1.055 0.980 1.045 5,075 4,071 0.978 1.039 0.989 1.027 7. DE26 0.964 1.105 0.984 1.054 6,329 5,233 0.978 1.099 0.980 1.051 14. DE27 0.864 1.190 0.914 1.246 16,129 15,233 0.898 1.247 0.964 1.203 25. DE30 1.000 1.000 1.000 1.000 0 0 1.000 1.000 1.000 1.000 1. DE41 0.867 1.201 0.908 1.248 16,299 16,011 0.867 1.299 0.978 1.218 26. DE42 0.834 1.210 0.876 1.272 23,476 18,622 0.855 1.389 0.887 1.362 33. DE50 1.000 1.000 1.000 1.000 0 0 1.000 1.000 1.000 1.000 1. DE60 1.000 1.000 1.000 1.000 0 0 1.000 1.000 1.000 1.000 1. DE71 1.000 1.000 1.000 1.000 0 0 1.000 1.000 1.000 1.000 1. DE72 0.914 1.081 0.965 1.086 9,222 8,176 0.934 1.075 0.975 1.076 19. DE73 0.922 1.079 0.971 1.070 8,992 7,089 0.942 1.069 0.981 1.079 17. DE80 1.000 1.000 1.000 1.000 0 0 1.000 1.000 1.000 1.000 1. DE91 0.989 1.026 0.992 1.016 6,928 4,908 0,993 1.013 0.995 1.009 15. DE92 1.000 1.000 1.000 1.000 0 0 1.000 1.000 1.000 1.000 1. DE93 0.953 1.055 0.980 1.045 5,075 4071 0.978 1.039 0.989 1.027 7. DE94 0.964 1.105 0.984 1.054 6,329 5,233 0.978 1.099 0.980 1.051 13. DEA1 1.000 1.000 1.000 1.000 0 0 1.000 1.000 1.000 1.000 1. DEA2 1.000 1.000 1.000 1.000 0 0 1.000 1.000 1.000 1.000 1. DEA3 0.989 1.026 0.992 1.016 6,928 4,908 0,993 1.013 0.995 1.009 15. DEA4 0.953 1.055 0.980 1.045 5,075 4,071 0.978 1.039 0.989 1.027 7. DEA5 0.964 1.105 0.984 1.054 6,329 5,233 0.978 1.099 0.980 1.051 14. DEB1 0.934 1.130 0.976 1.112 13,476 11,622 0.955 1.115 0.987 1.092 21. DEB2 0.914 1.081 0.965 1.086 29,022 27,176 0.934 1.075 0.975 1.048 37. DEB3 0.922 1.079 0.971 1.070 18,992 17,089 0.942 1.069 0.981 1.039 29. DEC0 0.964 1.105 0.984 1.054 6,329 5,233 0.978 1.099 0.980 1.051 14. DED1 0.820 1.176 0.896 1.072 19,759 11,121 0.868 1.157 0.898 1.149 22. DED2 1.000 1.000 1.000 1.000 0 0 1.000 1.000 1.000 1.000 1. DED3 0.864 1.190 0.914 1.246 36,129 25,233 0.898 1.247 0.964 1.203 40. DEE0 0.914 1.081 0.965 1.086 29,022 27,176 0.934 1.075 0.975 1.048 37. DEF0 1.000 1.000 1.000 1.000 0 0 1.000 1.000 1.000 1.000 1. DEG0 0.934 1.130 0.976 1.112 13,476 11,622 0.955 1.115 0.987 1.092 21.
Note: * Coefficient of efficiency = average efficiency rate of country in period 2000-2010 ** Absolute ranking of V4, Austria and Germany NUTS 2 regions is based on their rank in DEA models in period 2000–2010 Source: Own calculation and elaboration, 2012
Conclusion
Competitiveness, performance and efficiency are complementary objectives, which determine the long-term development of countries and regions. These are also concepts that cannot be avoided in economic theory and practice. Evaluation of competitiveness, performance and efficiency can be performed only if we use existing concept of these terms or selected mainstream. Because of the fact that there is no mainstream in competitiveness, performance and efficiency evaluation, especially at regional level, there is space for alternative approach in this area. It is necessary to note that using different approaches to evaluation generate different results. This is logical and predictable. It cannot be expected that different approaches lead to identical conclusions about the level of competitiveness, performance and efficiency. Many methods and approaches to competitiveness, performance and efficiency evaluation are (to a certain extent) incomparable, and therefore their results

175
must be taken into account individually. A certain degree of individual assessment should therefore apply in terms of concrete results (and order) of individual V4, Austria and Germany and their NUTS 2 regions. National efficiency, as a mirror of performance, is based on competitive potential of individual regions.
The aim of this paper was to present efficiency evaluation of V4 countries, Austria and Germany, and their NUTS 2 regions in the reference period 2000–2010, through specific multicriteria approach – DEA method. The analysis evaluated the degree of relevance of ten selected DEA models for measuring national and regional efficiency. DEA generated relatively comparable results, throughout reference period and models.
The initial assumption has been confirmed through empirical analysis at national and regional level. Based on DEA analysis has been found out that in evaluated countries and regions there is a distinct gap between economic and social standards, so differences still remain. Regarding the findings and the analysis each country and region can decide whether it had a level of efficiency and productivity trend increase during the time period, or not. By having this information and dividing efficiency and subsequent productivity into its elements, the basic trend in efficiency level and productivity trend whether it be increase or decrease is observed. According to DEA models, it is necessary to note that in all evaluated countries and regions was mostly achieved noticeable efficiency and productivity increases and thus performance strengthening during reference period. Most countries and regions experienced decline in their performance (outputs decline as a result of declines in inputs) as a result of economic crisis. The recent economic crisis has seriously threatened the achievement of sustainable development in the field of competitiveness. The crisis has underscored importance of competitiveness, supporting economic environment to enable economies to better absorb shocks and ensure solid performance going into the future. Literature:
1. ANNONI, Paola and Kornelia KOZOVSKA. EU Regional Competitiveness Index 2010. Luxembourg: Publication Office of the European Union, 2010. ISBN 978-92-79-15693-9.
2. BARRELL, R., G. MASON and M. O´MAHONY. Productivity, Innovation and Economic Growth. Cambridge: Cambridge University Press, 2000. ISBN 978-0521-780315.
3. CAMANHO, A.S., DYSON, R.G. Data envelopment analysis and Malmquist indices for measuring group performance. Journal of Productivity Analysis, 2006. Vol. 26 (no. 1), pp. 35-49.
4. CHARNES, A., W. COOPER and E. RHODES. Measuring the efficiency of decision making units. European Journal of Operational Research, 1978. Vol. 73 (no. 2), pp. 429-444. DOI: http://dx.doi.org/10.1016/0377-2217(78)90138-8.
5. COELLI, T. J., D.S.P. RAO, C. J. O’DONNELL and G.E. BATTESE. An Introduction to Efficiency and Productivity Analysis. New York: Springer, 2005. ISBN 978-0387-24265-1.
6. COOK, Wade D. and Joe ZHU (2008). Data Envelopment Analysis: Modelling Operational Processes and Measuring productivity. Boston: Kluwer Academic Publishers. ISBN 978-0387-24137-X.
7. COOPER, W.W., L.M. SEIFORD and J. ZHU. Data Envelopment Analysis: Models and Interpretations. Boston: Kluwer Academic Publisher, 2004. ISBN 978-1-4419-6150-1. DOI: 10.1007/978-1-4419-6151-8_1.

176
8. GREENAWAY, D., H. GÖRG and R. KNELLER. Globalization and Productivity. Cheltenham: Edward Elgar Publishing Limited, 2008. ISBN 978-1-8454-23803.
9. HAIR, J.F., W.C BLACK et al. Multivariate Data Analysis. New Jersey: Prentice Hall, 2009. ISBN 978-0-1381-32631.
10. HANČLOVÁ, Jana. The Effects of Domestics and External Shocks on a Small Open Country: the Evidence from the Czech Economy. International Journal of Mathematical Models and Methods in Applied Sciences, 2012. Vol. 6 (no. 2), pp. 366-375.
11. KHAN, Jamal and Wayne SOVERALL. Gaining Productivity. Kingston: Arawak Publications, 2007. ISBN 978-976-8189-93-6.
12. MELECKÝ, Lukáš and Michaela STANÍČKOVÁ. The Competitiveness of Visegrad Four NUTS 2 Regions and its Evaluation by DEA Method Application. In: Mathematical Methods in Economics 2011. Proceedings of the 29th International Conference. Part II. Prague: University of Economics, 2011, pp. 474 – 479. ISBN 978-80-7431-059-1. (Code UT WoS: 000309074600078).
13. MOHAMMADI, Ali and Habibollah RANAEI. The application of DEA based Malmquist productivity index in organizational performance analysis. International Research Journal of Finance and Economics, 2011. Vol. 6 (no. 62), pp. 68-76.
14. MOLLE, Willem. European Cohesion Policy. London: Rutledge, 2007. ISBN 978-0-415-43812-4.
15. NEVIMA, Jan and Lukáš MELECKÝ. Regional Competitiveness Evaluation of Visegrad Four Countries through Econometric Panel Data Model. In: Liberec Economic Forum 2011. Proceedings of the 10th International Conference. Liberec: Ekf TUL, 2011, pp. 348-361. ISBN 978-80-7372-755-0. (Code UT WoS: 000300261200038).
16. STANÍČKOVÁ, Michaela and Karel SKOKAN. Evaluation of the EU member states efficiency by data envelopment analysis method. International Journal of Mathematical Models and Methods in Applied Sciences, 2012. Vol. 6 (no. 2), pp. 349-357. ISSN 1998-0140.
17. STANÍČKOVÁ, Michaela and Karel SKOKAN. Multidimensional Approach to Assessment of Performance in Selected EU Member States. International Journal of Mathematical Models and Methods in Applied Sciences, 2013. Vol. 7 (no. 1), pp. 1-13. ISSN 1998-0140.
18. ZHU, Joe. Manual DEA Frontier – DEA Add-In for Microsoft Excel [Online]. DEAF, 2012 [cit. 2013-01-02]. Available at: <http://www.deafrontier.net/>.
Contact Michaela Staníčková, MSc. Department of European integration Faculty of Economics VŠB – Technical University of Ostrava Sokolská třída 33, 701 21 Ostrava Czech Republic E-mail: [email protected]

177
Luboš Štancl
FACULTY OF ECONOMICS AND MANAGEMENT UNIVERSITY OF DEFENCE
ECONOMIC COST AND ECONOMIC BENEFITS FOREIGN
PEACEKEEPING MISSIONS CZECH ARMY
Abstract In the treatise is justified by the complexity of the analysis of the economic aspects of the requirement of the foreign missions of the army of the CZECH REPUBLIC, including the process of justification for the requested funding, their use and the evaluation of the benefits achieved (effects). The author defines two kinds of economic benefits to foreign missions – the benefits of direct, immediate and indirect benefits, perspective. The author presents the possibility of planned expenditure for discussion on the security of foreign missions as the long-term capital investment, whose return is affected by the degree of coordination of economic and defence policy of the State. In conclusion, then, he justifies the need for harmonisation of economic and the defence policy as provided increasing economic efficiency of foreign missions of the army of the CZECH REPUBLIC. Key-Words: economic policy, defence policy, foreign missions, investment, externalities, the capital, military spending, democracy. Introduction Peace prospects, which humanity connected with the new conditions of development after the collapse of the bipolar division of the world, were soon cut the loss of hope for a safe life without armed conflict. The disintegration of the world has not become a safer bipolarity. Phenomenon of the present against the safety of the world community, it became the international terrorism. The fight against terrorism within the framework of international cooperation is a strategic interest of both the Czech Republic and part of the defence policy of the Government, as an instrument of its enforcement. An analysis of the development of the security environment and the emergence of potential threats shows that active participation in operations outside the territory of the Member States of NATO and the EU will in the next 20 years, most likely in the form of the deployment of the Army of the CZECH REPUBLIC. [1] In the context of these operations must be prepared in parallel, drive the Army to carry out the tasks facing not only to enforce the peace, but also to ensure that the tasks of peacekeeping and humanitarian assistance to the civilian population of the host country. The study of internationally-political, security, military or humanitarian foreign missions of the Czech Army page has in recent years devoted to the relatively concentrated attention to the professional public. Far less attention is devoted to the analysis of the economic aspects of the foreign missions of the army of the CZECH REPUBLIC (ACR), which we consider very important and high current.

178
The requirement analysis of the complexity of the economic aspects of the foreign missions The annual approval of the expenditure on foreign missions of the CZECH REPUBLIC is a source of very lively parliamentary discussion and, meanwhile, raised some political forces arguments about unnecessarily and inefficiently spent resources which could be better used in other areas of the life of the company. Even in the general public, there are images of no good use and disproportion of the financial requirements of the Defence Ministry to these activities. In the background of these objections lies the objective conflict between the objectives of economic and defence policies, and conflict between their tasks and the resources available. Therefore, the question of " what are the costs of the mission?" is the simplest, and perhaps the most common question at the same time, which is usually the first to come in the run-up to any discussion of the foreign missions. According to the available data, the Ministry of defence was on foreign operations from 2001 to 2011, a total of 18.6 billion CZK spent. This amount corresponds to 43% of the budget chapter 307, the Defence Ministry for the year 2012, which is 43.47 billion CZK.
Table 1 Total expenditure spent on foreign missions of defence in the years 2006-2011
(in bln. CZK) Year 2006 2007 2008 2009 2010 2011 Expenditure 1,57 1,41 2,45 2,63 1,32 1,81
Source: [2] It is fair to the data that these expenses do not include the so-called hidden expenses, including expenses relating to security training for the purposes of foreign operations, the cost in the form of a permanent reduction in the value of fixed assets, i.e., costs given by wear and tear, the moral deterioration or obsolescence of the military technology deployed in foreign operations. In view of the needs of the solution to the conflict between the economic resources and tasks of the defence policy do not have the large explanatory value. It is more than 1 billion CZK, which is a year of spending from the State budget to foreign missions a lot or a little? It is money spent for nothing, or provides any real effect? What is the resultant effect? The activity of foreign missions helps for solution of national economy tasks? If so, how? These and many similar questions is not possible altogether qualified to answer without more thorough analysis of the broader economic aspects, foreign missions, however, cannot be limited only to the "traditional" problem of economy, or in the provision of the necessary material efficiency, resources and services. Comprehensive approach – planning resources, consumption and formal effects Study of economic aspects of the foreign missions must be characterised by a comprehensive approach, i.e. attention must be paid to how the process of planning the required resources and their use (consumption) and the evaluation of effects, which were the activities of the unit during the foreign mission achieved. The first process has macroeconomic character and in the course of the size of the volume of the necessary means, which must be allocated from the State budget in order to ensure the quality of the substantive and financial conditions and the successful implementation of the Mission seconded units abroad. It is primarily a political decision. But this fact does not discharge the obligations of the Defence Department's management to address the problem of military-economic justification the optimal volume of the required resources. Political decision is always the result of a clash of political forces and the leadership of the Defence Department, how convincing arguments they will be armed with

179
these forces. The arguments in favour of foreign missions must contain the remittance to their economic benefits. In this context, cannot recall the words of the Minister of Defence of the CZECH REPUBLIC: "When it is directly challenged by the territory of the State, the use of the army to defend it is immediately understandable for everyone. Aware of the fact that threats to security of the CZECH REPUBLIC today are thousands of miles from our borders, requires further consideration. In the contemporary security theory is talk about the so-called paradox of an external nature of internal risks. When it converted to the comprehensible language, threats to the internal order in the CZECH REPUBLIC, such as the sale of drugs in the Czech cities or the possibility of a terrorist attack on the subway, there are not resulting in our territory, but when, for example, in Afghanistan...Explain the importance of the mission is a joint effort of political representation, media and members of the army. [3, p. 6] The second downstream process is the process the immediate use of earmarked funds, i.e. how are you doing in practice to realize the principle of economy and the principle of effectiveness in the use of limited resources. The principle of economy requires focus on minimizing costs in the acquisition of materials and services (inputs), while respecting the need for their quantity, but the quality of the timing of deliveries, relations with suppliers, etc. The implementation of the principle of austerity must not jeopardise the attainment of the objectives of the (outputs). The principle of effectiveness concerns the transformation process and describes the relationships between inputs and outputs. Its implementation requires "the ability to do things right" and required to achieve the outputs with a minimum quantity of inputs. It must be respected, the requirements to the extent, quality and timeliness of outputs. The practical implementation of these principles requires a creative application of tools and methods of the military-economic analysis in the command and control management activities from the units. The criterion of the effectiveness of foreign missions If the order of the second circuit of the problems of the economic aspects of foreign missions is currently the largest share of the attention, the issue of a third of the final process only marginal attention. While a comprehensive assessment of the effectiveness of the means employed, i.e. what kind of military, political, humanitarian and economic results were achieved, the decisive criterion for the conclusions on the economic (and total) the effectiveness of the foreign missions of the CZECH REPUBLIC Army. A comprehensive analysis of the prerequisites for each of the three time consecutive processes is one of the factors essential to the solution of the conflict between the objectives of economic and defence policy and available resources for their implementation. This analysis is the starting point for harmonization at the same time economic and defence policies as provided efficiency of foreign missions. From positive externalities to long-term capital improvements At first glance, it would seem that the evaluation of the effectiveness of the means employed is based on the tasks the Unit received before his departure, and to evaluate the success rate of their implementation, which is based on the authority of its military forces. In other words, the task forces deployed abroad is not only to "out the door", but also in order to "help establish order in the House or even rebuild it". Meet the "military, respectively military-political" objectives of the mission is undoubtedly the decisive role of each unit. At the same time is the starting point for consideration of other benefits of their activities, including the benefits of purely economic, which has not yet been paid almost no attention. This plane of reflection on the economic aspects of the foreign missions requires a deeper reflection on their "direct, immediate" and "indirect prospective" benefits.
180
Historical experience, but the experience from the current Afghanistan talks about, that the activities of foreign troops in the host country, a number of "positive spill-over effects", that its consequences can be economically significant benefits to our economic development. The mechanism of these side effects, which can be viewed from the perspective of economic theory as the positive externalities of units abroad, it can be briefly described as follows. The mechanism of positive externalities Members of the unit with the implementation of the main and decisive role, i.e.. by eliminating outbreaks of conflicts and possible threats, helping to promote peace in the host country or its maintenance. It is involved in creating the basic conditions for the solution of problems of the host country, in particular, internal security, the promotion of democratic development, economic and social development. Stabilization of the internal political and security situation in the country and begin reconstruction of the developing economic plans, usually aimed at the development of the agro-food industry complex, the primary processing of material resources and building the foundations of industrial development raises the need for the purchase of new industrial products and technologies, the investment units, professional consulting services, etc. This process is also accompanied by the needs of the development of education, health care and the social sphere. Its share of the start-up of these processes for mission abroad creates a clearway distance entry of Czech companies in the country to establish and develop mutually beneficial business relationships with companies in the host country. The direct and indirect benefits In theory considerations may be of positive externalities (benefits) generated in any stage of the process chain. However, in view of the immediacy of participation units of foreign missions, it is appropriate to distinguish the benefits of direct, immediate and indirect perspective benefits. The mechanism of the indirect perspective benefits was de facto already described above. For that, you can just add that when prospective benefits arise belong to the very important and irreplaceable role of mutual recognition, respecting national and cultural traditions and mutual confidence, built on the basis of solving challenging tasks of the defence of the nascent democratic State, etc. The direct benefits are generated by the immediate activities of the mission. For example, the training of the armed forces of the host country led by our members using the weapons and techniques of the Czech production may be the motive to weaponry and equipment order of Czech producers. Similarly, it is possible to obtain an economic advantage from foreign competition in the event of the sale or transfer of maintenance free and of arms and military technology to the host country, thus it "commit" to a possible future supply of spare parts and other material and services needed to ensure the operation of these weapons and technology. Closed business cases are leading to the promotion of exports of the country and to improve its trade balance. Similar examples can be mentioned more. The important thing is vigilance to create the atmosphere of understanding for the needs both of interested parties. Expenditure on foreign missions as a long-term capital investment If we look at the immediate benefits as of forward-looking positive externalities, which we can define as the unintended side result of the activity, its originator cannot steal, then in the interest of increasing the efficiency of the funds spent on the security of foreign missions is needed to begin to perceive the use of the funds as a proactive process of

181
investment and expenditure on foreign mission understood as long-term capital investment. The realisation of this investment is the start time of the adoption of the decision to send in troops to foreign missions and ends, for example, the signing of an international agreement on a common geological exploration and subsequent exploitation of oil or other energy and raw material resources. In another case, the investment result in the conclusion of agreements with Czech companies on building traffic, connection and service infrastructure, supply of energy blocks, etc. The benefits of the Mission for the domestic economy can also be generated for a long time after the withdrawal of troops from that site. In the implementation of expenditure on foreign mission as long-term investments you can expect the next multiplier effects, as creating the conditions for the activities of Czech companies in the host country at the same time increase the volume of necessary assumptions based investment. The purpose of Czech companies would not be to inline in the form of immediate investment return profits back to the Czech Republic. Interest of the business sector should, however, be achieving the prosperity of companies of the host country, and the creation of a clearway distance for the further development of mutual cooperation and the export of other investments. So it is a long-term issue. In its development cooperation as a result of these conditions not only for stabilisation creates a flow of our investments abroad, but also to increase their volume. But all of this requires multiannual planning, as with the gradual development of the economy of the host country will be more demanding projects requiring even still larger investment volumes, which are not subject to the expectations of one-year planning of budget funds. The need for a similar approach as Minister of Defence, when in conjunction with changes to the terms of approval of long-term pointed out that "these long-term missions should be approved for a longer period of time...". [3, p. 5] Unable to fight for peace, the achievement of peace requires the development of a conceptual approach, no improvisation, because at least the medium-term Outlook is required. This implies the need to develop the concept of government entities into broadcasting foreign missions with a view to at least three years, to ensure the harmonization of the objectives of economic development and defence policy and the coordination of activities, the progress and results of the foreign missions of the CZECH REPUBLIC Army, the ministries directly concerned. This concept should clearly define the Mission of the foreign missions and justification of why and where they are to be sent. Together with the political type would even define the concept should include expected results (including prospective), and, where applicable, the methods of their assessment. Conclusion Foreign missions of the Army of the Czech Republic represent a significant instrument of defence policy and strategic interests of the Czech Republic. Versatile and high-quality material and financial security of foreign missions required to allocate for the benefit of a big part of the financial resources. It is therefore in the interest of the company to try to coordinate the activities related to the sin of their use, which is, however, to some extent, outside the framework of the market mechanism and requires a control from one centre. The economic security of foreign missions is part of the tasks of the economic objectives of the security and defence policy, which are an integral part of the content of the economic policies of the State. At the same time the implementation of the objectives of the foreign peacekeeping missions must contribute to creating the conditions for achieving the objectives of the traced socio-political programmes. Respect for these links in the practice of consistent coordination of the content of the respective projected program, conceptual and other government documents and managed by the CZECH AIR FORCE missions, the stakeholders, ministries and administrations. Appropriate, current practice shows that it is necessary for the tasks and measures contained

182
in the policy documents have experienced long-term nature and complexity, a high degree of stability (as well as the necessary degree of flexibility and variability), balancing in relation to ensuring the objectives of economic and social development of society and the needs of the economic security of foreign missions. Evaluation of the effectiveness of the funds spent on the security of foreign missions must be comprehensive and include assessment of the direct and indirect benefits for economic development. The harmonisation of economic and defence policy of the State features in this context as a fundamental prerequisite to efficiency of foreign missions of the army of the Czech Republic. Literature :
1. Dlouhodobá vize resortu Ministerstva obrany. Praha 2008. URL: <http://www.army.cz/images/id_8001_9000/8492/Dlouhodob__vize_resortu_Ministerstva_obrany.pdf> (aktualizované 03. 09. 2009).
2. Závěrečné účty státního rozpočtu ČR. Kapitola 307 – Ministerstvo obrany. URL: <http://www.mocr.army.cz/ministr-a-ministerstvo/povinne-informace/zaverecne-ucty-statniho-rozpoctu-cr-kapitola-307-ministerstvo-obrany-cr> (aktualizované 10. 09. 2012).
3. Respektujeme ekonomickou situaci. Rozhovor s ministrem obrany ČR Martinem Bartákem. A report, 2009, č. 16, s. 6.
4. WIHARTA, S. A kol. The Effectiveness of Foreign Military Assets in Natural Disaster Response. Stockholm: SIPRI, 2008. 139 s. ISBN 978-91-85114-57-3.
Contact
doc. RSDr. Luboš Štancl, CSc. Faculty of Economics and Management University of Defence Kounicova 65 662 10 Brno Czech republic E-mail: [email protected]

183
Klára Vaclavinkova
SCHOOL OF BUSSINESS ADMINISTRATION IN KARVINÁ SILESIAN UNIVERSITY IN OPAVA
MAPPING THE STATE MARKET FOR ORGANIC FOOD IN THE CZECH REPUBLIC TO FOCUS ON ORGANIC AGRICULTURE
Abstract Organic product can be described as a raw material of animal or vegetable origin obtained in organic agriculture. Organic food is food made from organic ingredients as provided for in Council Regulation 2092/91 EC and Act No. 242/2000 Coll., On organic farming, has been issued a certificate of origin, organic food. The main objective of this paper is to define what is the current situation in the organic food market in the Czech Republic with a focus on Czech producers of organic food. Post serves as partial preparation of research to be followed on this issue. Key words: organic food, market demand, agriculture. Introduction Organic food is currently one of the topics discussed, the demand for them is increasing, as the number of producers and products from organic agriculture. The main issue that is often addressed is whether it is organic really healthier and more beneficial for the human body than food produced conventionally caused. The main objective of this paper is to describe the current situation in the Czech market with a focus on organic and exclusively Czech producers. This paper describes the situation on the market in the Czech Republic and offers a comprehensive view of organic farming and its possibilities and future prospects. The legislative documents for production of organic food Organic product can be described as a raw material of animal or vegetable origin obtained in organic farming, which is a way of farming that does not use chemical fertilizer, chemicals and other artificial substances and animals are not given antibiotics, do not feed them meat and bone meal and artificially stimulates their growth. It follows that it is the management-positive nature and animals. They may be in the form of vegetables, fruits, legumes, cereals, milk, eggs or animal at a time. Organic products are indeed available in commercial units, but there are still very few. The best way to get customers to them at the source, or to biofarmách [9]. Organic food is food made from organic ingredients as provided for in Regulation 2092/91 EC and Act No. 242/2000 Coll., On organic farming, has been issued a certificate of origin, organic food. With a higher quality, more distinctive taste and nutritional value. Every organic farmer must follow strict rules, which are based on the following legislation. This is the Regulation 834/2007 on organic production and labeling of organic products and repealing Regulation (EEC) No 2092/91 and Act No. 242/2000 Coll. on organic agriculture. The Act, in relation to a directly applicable regulation of the European Communities, the conditions of organic farming and the related certification and labeling of organic products, organic foods and other organic products, and exercise control and supervision over the observance of the obligations connected with it [6].

184
Basic possibilities of assessing the quality of organic food: 1. Nutritional value: high in vitamins, enzymes, minerals, balanced ratio of protein and
fat. 2. Hygienic value: lower incidence of foreign substances such as nitrates, pesticides,
herbicides, heavy metals, etc. 3. Technological value: better storability, lower storage losses, lower gluten content, etc. 4. Sensory value: the lower, the products are not so nice, colorful, fragrant seasoning as
natural products. Wildlife, however, prefer to forage on green crops [14]. Methodology The main objective of this paper is to define what is the current situation in the organic food market in the Czech Republic with a focus on Czech producers of organic food. Post serves as partial preparation of research to be followed on this issue. The methodology gives us the workflow of this work. It was to work with the available information both from the literature and from available electronic sources and the author's own observations. Author based on empirical methods, directly describes reality. The information was compared with each other and the result is a description of the situation on the market for organic food. Was working with secondary data and their analysis were evaluated in which direction the organic food market is heading. The content of the post were chosen parameters: the number and order of organic food producers, the proportion of major food categories in the total turnover of production in 2008, it was worked with statistical data on organic farming and the number of organic food producers from 2010 until 2011. The last figure, which could describe the issue, then the list of retail chains in the Czech Republic, which have in their offer organic or organic products. Based on the analysis of the data was then evaluated whether the production of organic food growing trend and whether the development of the organic food market in growth. Evaluation of the market situation in the Czech Republic. In the introduction, it is necessary to determine how much organic food producers in the Czech Republic there. The list of organic food producers was assembled according to their turnover in the Czech market in 2008. The order is specified by manufacturers sales turnover realized only on the Czech market (ie without export turnover). Moreover, it is included in the total turnover of organic food even companies that operate production and distribution of organic food at the same time (eg PROBIO, trading company Ltd., Country Life Ltd. resp. Čerozfrucht Ltd., etc.). For any company, it is stated that commodity deals.
1. PRO-BIO, a trading company with r.o. - Cereals, pasta, semi-milled products. 2. Country Life Ltd. - Cereals, pasta, bread. 3. OLMA, Inc. - Milk and milk products. 4. Biopark, Ltd. - Beef. 5. Sterba Jan, Ing. - Fruits and vegetables. 6. Čerozfrucht Ltd. fruit and vegetables 7. Bio NEBIO Ltd. - Biscuits, cereal mixture blanks. 8. Dairy Meziříčí, spol.s r.o. - Milk and milk products. 9. Josef glazier - meat and sausages. 10. Emco spol. s ro - cereal mixture. 11. Sun Gate, Ltd. - Cereals. 12. Racio, Ltd. - Biscuits. 13. Maštalíř Vladimir - St. Pierre - products made from goat's milk. 14. Lacrum Great Mezirici, Ltd. - Milk and milk products.

185
15. Lifefood Czech Republic Ltd. - Other foods (butter, candy, ...). 1
The previous list can be seen that in the Czech Republic is a producer of organic food enough and focus on diverse areas of production from cereals, dairy products all over cereals and meat. There have been deliberately included manufacturers with the highest turnover since these are delivered to supermarkets and chains, so they are closest to the customer. The proportion of main food categories in the total turnover of production. According to figures recorded the largest volume of production of "dairy" (approx. CZK 220 million, or 25% of total turnover of production), followed by the categories "Bakery products" including bakery and confectionery products fresh and long-life and other flour products, with a share 22% (about 188 million CZK). The third category, the category 'other processed foods' (about CZK 162 million), and within particular sub-category "Coffee and Tea" and "Condiments and seasonings" with almost 55% resp. 26% [11].
Chart 1:Share of the main food categories in the total turnover of production in year 2008.
Source :Statistical investigation ÚZEI 2009
1 Statistical investigation ÚZEI 2009; Yearbook Czech organic food market, 2009 (Green marketing).

186
Table 1 Comparison of basic statistical indicators of organic farming
31. 12. 2010 31. 12. 2011 The increase for January to December 2011
The increase for January to December 2011 (%)
Number of food producers 626 646 20 3 Number of organic farms 3 517 3 920 403 11 The area of agricultural land in organic farming (ha)
448 202 482 927 34 725 8
Share of organic farming in total agricultural land (%)
10,55 11,40 0,85
The area of arable land (ha) 54 937 59 281 4 344 8 The area of permanent grassland (ha)
369 272 398 060 28 788 8
The area of permanent crops (orchards) (ha)
5 128 6 453 1 325 26
The area of permanent crops (vineyards) (ha)
803 965 162 20
The area of permanent crops (planted) (ha)
8 10 3 25
Other area (ha) 18 054 18 158 103 1 Source: http://eagri.cz/public/web/file/148890/statistika_zakladni_31_12_2011.doc Table 1 shows a comparison of the statistical indicators of organic farming in the Czech Republic in the period 2010 to 2011. Number of producers of organic food grew by 3%, the number of organic farms has even increased from 3517 to 3920th This figure shows an increasing trend. In the Czech Republic's extensive support for organic agriculture by the state. Currently, entered into force document of the Ministry of Agriculture: National Action Plan for the development of organic agriculture in the years 2011-2015. Aiming to achieve a 15% share of agricultural land, while increasing the share of organic products in the food market at 3%. This disproportion is caused mainly by the fact that organic farming also performs secondary functions, not only productive functions. Approximately 80% of the acreage in organic form permanent grassland. This is mainly because a high proportion of less-favored areas in the Czech Republic (mainly mountainous and foothill areas). For these areas, landscape maintenance is important, because in these border areas, areas with a high proportion commanded management mode (National parks, protected landscape area). Agricultural production on arable land is not appropriate, therefore, is the basis for management of the grazing livestock, which contributes not only to the maintenance of the landscape, but also to retain a diverse range of protected plant species. Even in other parameters see ingrowing tendency [2].
Table 2 Number of food producers in 2001-2010 Year 2001 2002 2003 2004 2005 2006 2007 2008 2009 2010 2011 Number of food producers
75 92 96 116 125 152 253 422 497 626 646
Source:http://eagri.cz/public/web/file/148890/statistika_zakladni_31_12_2011.doc

187
Table 2 shows the number of food producers, which increases every year, it clearly indicates that there is potential for further development of the market. According to Green Marketing survey from 2009, the number of retailers offering organic food following. Organic shops and health food stores is 300, 200 independent stores, retail chains then presents ten of 1300 of stores Ahold, Billa, COOP, Globus, Interspar, Kaufland, Penny, Tesco and drugstore chains. Another place where you can buy organic food are chemists, when their number in 2009 was the 2000th Given that these figures are from 2009 and newer are not currently available, we can infer, based on past data, and that there was an increase in the number of distribution points.
Table 3 Overview of retail chains operating in the Czech Republic with organic food. Name of chain store
format Number of establishments
Number of organic food range
Own brand of organic food
Albert supermarket
supermarket 135 Albert bio
Albert hypermarket
hypermarket
280
240 Albert bio
Billa supermarket 200 175 Our Bio/Ja!Naturlich
COOP supermarket, menší prodejny
350 65 -
Globus hypermarket 14 336 - Interspar supermarket
hypermarket 32 309 NaturPur
Kaufland 95 238 Little Bee Penny diskontní
prodejna 300 58 Biostyle,
BabyTime Tesco hypermarket
supermarket 141 253 Tesco organic,
Tesco Bio dm drogerie drogistický
řetězec 190 488 Alverde
cosmetics Rossmann2 drogistický
řetězec 109 56 EnerBio
Zabka3 supermarket 100 106 - Source: Green marketig, november 2010. Green marketing survey in November 2010 gives an overview of retail chains operating in the Czech Republic. The most chain stores, which are offering organic supermarket Albert, Albert hypermarket, Billa, COOP, Globus, Interspar, Kaufland, Penny, Tesco, dm drugstore, Rossmann and Zabka. These are the supermarkets, hypermarkets, discount stores and drugstores. Most of them, including his own brand of organic food. The table is then seen that the widest range of organic food offers drugstore chain dm drugstore, but here it should be noted that most of the range consists of cosmetics Alverde, then the largest offer in Globus hypermarkets, Interspar, Albert hypermarket and Globus.
2 Rossmann drugstore in 2011 comes under drugstore chains Teta. 3 Stores Zabka in 2010-2011 were transferred to Tesco and currently works as a Tesco express.

188
Conclusion Post monitors the situation on the Czech market for organic food with a focus on Czech producers. Was working with secondary data, which came from the years 2009 - 2011. The above is due, in the Czech Republic there were in 2011 646 organic farmers. This number is growing character, just as in 2010, the number of organic farmers by 3%. Along with this data, the higher the annual acreage of agricultural land on which organic farming is implemented. From this we can conclude that there is potential for the development of organic agriculture and thus the production of organic food. Among the important indicators also means that every year there is an increase in the number of organic food producers and from 2001 to 2011 to about 571 manufacturers. Here we see that it shows a positive government support for organic farmers and growing interest among customers of this commodity. In the Czech Republic there are plenty of retailers that offer organic foods, it is mainly about Albert supermarkets and hypermarkets, Billa, COOP, Globus, etc. The strings also offer their own brand of organic food such as Albert bio, NaturPur and BIOSTYLE. Based on these data, we can assume that the market offer is wide and has an increasing trend, which creates a competitive environment. Among the categories of food, then we see that most are in the market represented dairy and bakery products, the largest producer of dairy products from organic products is then OLMA, as and Lacrum Meziříčí, Ltd. The most important producer is the company PRO - BIO, which focuses on the production of cereals, pasta and pastries. According to these data, we conclude that the offer of products on the Czech market is wide, suggesting a high number of organic farmers growing number of entrepreneurs in this area and a wide range of organic products in retail chains. However, this issue requires further study, since the data is already older character and it would be appropriate to use more recent data. In the future, we can say that production and thus also offer organic food will continue to have increasing character and there will be more choice in the market as well as other commodities, which is also stated in the Action Plan for the development of organic agriculture in the years 2011-2015, which aims to reach 15% of agricultural land, while increasing the share of organic products in the food market at 3%. It can also be expected that people are getting more concerned about their health and also because organic foods have future. Literature:
1. Brožová, Ž., Kaspříková, L.,(2008), L. Čerstvé potraviny na dosah: Založte si s přáteli bioklub. 2nd ed. Brno: Hnutí DUHA, ISBN 978–80–86834–23–8.
2. Bioinstitut, 2011. The Action Plan of the Czech Republic for the development of organic agriculture in the years 2011-2015. [online]. [cit.18.9.2012]. Dostupné z http://www.bioinstitut.cz/documents/Akcniplan2011-2015.pdf
3. Elliot, R. (1997), Vegetarian meals for students. 1st ed. London: Harper Collons Publishers, 80 p. ISBN 0583-33119-X.
4. Kotler, P. (2007), Marketing managament, 12th ed. Praha: Graha Publishing, 784 p., ISBN 978-80-274-1379-5.
5. Kozel, R. a kol. (2006), Moderní marketingový výzkum. 1st ed. Praha: Grada Publishing, 277 p. ISBN 80-247-0966-X.
6. Królová, K. (2009), Hygiena a výživa I.: distanční studijní opora. 1st ed. Karviná: SU-OPF, 116 p.

189
7. Maradová, E. (2007), Výživa a hygiena ve stravovacích službách. 2nd ed. Praha: Tiskářské služby – Rudolf Valenta, 196 p. ISBN 80-86578-69-9.
8. Ministry of Agriculture, (2009), Report on the State of Agriculture in 2009 "Green Report". 1. vyd. Praha: MS Polygrafie s.r.o. – Bělá pod Bezdězem, 224 s. ISBN 978-80-7084-940-8.
9. Moudrý, J. (1997), Bioprodukty. 1st ed. Praha: Institut výchovy a vzdělávání Mze ČR, 37 p. ISBN 80-7105-138-1.
10. Portal e-Agri, 2011. [online]. [cit. 17.9.2012]. http://eagri.cz/public/web/file/148890/statistika_zakladni_31_12_2011.doc
11. Potravinářská komora, 2010. Analysis of the market for organic food in the Czech Republic. [online]. [cit.18.9.2012]. Dostupné z:
http://www.google.cz/url?sa=t&rct=j&q=Green+marketing+- +Cenov%C3%BD+BIOmonitor%2C+listopad+2010&source=web&cd=4&ved=0CDc QFjAD&url=http%3A%2F%2Fwww.pro- bio.cz%2Fcms%2Fsoubor%2F1512%2FMicrosoft-Word---Analyza-trhu-s- biopotravinami-v- CR_2010.pdf%3FPHPSESSID%3Dzdfkysex&ei=6tRaUPqfCcmKswa85oHgBg&usg =AFQjCNGESTAioEQpPAYE1Fn9-swF8L46AA&cad=rja
12. Reinhold, M., Hermann, G., Kessler, T. (2003), Restaurace a host. 1st ed. Haan-Gruiten: Fachbuchverlag Pfannenberg, 604 p. ISBN 978-80-86706-18-4.
13. Stávková, J., Dufek, J. (2004), Marketingový výzkum. 2nd ed. Brno: Mendelova zemědělská a lesnická univerzita v Brně, 189 p. ISBN 80-7157-795-2.
14. Stříbrná , M., Mikula, P. (2003), Agroturistika a biopotraviny. 1st ed. Praha: Ústav zemědělských a potravinářských informací, 51 p. ISBN 80-7271-137-7.
15. Legislative documents:
16. Regulation of the European Parliament No. 178/2002 laying down general principles and requirements of food law, establishing the European Food Safety Authority and laying down procedures relating to food safety - Article 8, Article 18
17. Regulation of the European Parliament No. 834/2007 No. 834/2007 on organic production and labeling of organic products and repealing Regulation (EEC) No 2092/91
18. Regulation No. 852/2004 Food hygiene
19. Regulation No. 113/2005 Coll. of 4 March 2005 on the labeling of foodstuffs and tobacco products
20. Act No. 110/1997 Coll. The Ministry of Agriculture, Food and Tobacco Products
21. Act No. 242/2000 No. on organic agriculture and amending Act No. 368/1992 Coll., on administrative fees, as amended, as amended by Act No. 320/2002 Coll., No. 444/2005 Coll., No. 553/2005 Coll., No . 227/2009 Coll., No. 281/2009 Coll.

190
Contact
Mgr. KlaraVaclavinkova Department of Travel Movement School of business administrativ in Karvina Silesian University in Opava Na Vyhlidce 1079/1, 735 06 Karvina - Nove Mesto Czech republic E-mail: [email protected]

191
Vanda Vašková
INSTITUTE OF ECONOMIC RESEARCH SLOVAK ACADEMY OF SCIENCES
POST-CRISIS FINANCIAL MARKET REGULATION AND
SUPERVISION1 Abstract The financial turmoil, which started as a local crisis (USA, 2007) and swiftly turned into a global one, has revealed the fragility of the close interconnectedness of national financial systems and initiated the unprecedented rescue measures to stabilize private institutions from public sources. The analysis of the causes of the crisis had revealed the shortcomings in the field of financial regulation and supervision, which led to a revision of the EU institutional framework and of the Basel capital rules. Third generation of Basel package is mostly considered the move in the right direction, although partial and slow. But more effort will be needed to meet the transition period deadline of 1 January 2013 as the latest (October 2012) BIS report on implementation of agreed rules shows that only 8 of 27 member jurisdictions have issued their final set of Basel III related regulations. Key words: global financial crisis, regulation and supervision, de Larosière Report, new EU regulatory framework, Basel III, implementation report. Introduction The financial market in the era of globalization represents a highly complex mechanism characterized mainly by the liberalization of financial flows, integration and securitization; unprecedented interconnectedness; virtualization of trading; expansive quantitative increase in the number of financial operations; formation of new players on the market; a significant increase in institutional investments; as well as an increase in excessive disposable financial resources. Negative aspects include an increase in financial crime as the consequence of information systems abuse, lower predictability of development, higher risk rate, excessive volatility and crisis-prone environment. In Europe, the new currency has supported initiatives aimed at the creation of a single market for financial services, which have significantly influenced the European banking sector. The positive trend was, however, interrupted in 2008 by the global financial crisis which has negatively affected the European banks and the whole process of the EU financial integration. It became obvious that market complexity requires a highly competent and flexible system of financial regulation and supervision. The crisis has initiated the need for an economic reform within the framework of the Lisbon goals and it has amplified the need to create an environment which would enable timely recognition of threats of turbulences by national economies and ensure their stable economic performance. The third version of Basel rules was announced in September 2010 and subsequently endorsed by the G20 leaders at the Seoul Summit on 11-12 November. Basel III increases the resilience of the global banking system and enhances financial stability by both raising capital levels of banks and simplifying the regulatory framework. The Basel Committee on Banking
1 This paper was prepared thanks to the support of the VEGA project no. 2/0104/12 “Macroeconomic aspects of debt crisis – readiness to confront new challenges”.

192
Supervision plans to continue monitoring the member jurisdictions and publishing progress reports on Basel III implementation every six months. Revision of European regulatory and supervisory framework
The unprecedented recession of the world economy at the end of 2008 reconfirmed the gaps in the protection systems of national economies from the global market risks. There was a wide range of opinions regarding the nature, causes and the solutions to the crisis (see Figure 1) – from more narrow concepts, which saw the origin of the problem in the financial sector, to the widest ones, which considered it a systemic crisis, or a civilization problem. The unprecedented rescue initiatives aimed at stabilizing the financial sector have raised the question of moral hazard and affected the image of banking institutions connected with the decline in trust among their clients.
Figure 1: Causes of the global financial crisis 2007-
Source: own elaboration, Vašková N. and Vašková, V., 2010 Based on the analysis of the reasons behind the global financial crisis, the de Larosière Report2 has identified the shortcomings in the existing regulation and supervision3 and
2 The report on the future form of the European financial regulation and supervision, which was worked out by 8 experts authorized by the President of the European Commission, Mr. Barroso, was presented on 25/ 2/ 2009. The group was chaired by Jacques De Larosière. The aim of the so-called de Larosière Group was, based on the analysis of the reasons behind the global financial crisis, to identify the shortcomings in the existing regulation and supervision; and to propose a new framework (which would get Europe closer to a new regulatory agenda), stricter coordinated oversight and efficient crisis management. (De Larosière et al., 2009). 3 As the biggest source of problems in the area of regulation, supervision, and crisis management, The Report considers the regulated financial institutions whose internal models in use did not sufficiently evaluate the risk. They paid little attention to market liquidity and too much attention to individual companies, and by abstracting excessively from the development in the sectors and on the markets, they contributed to the problems of global scope. The multilateral oversight by IMF proved inefficient, too, as the macroeconomic imbalance had not been corrected in a timely manner. A coordinated activity by the Financial Stability Forum, G8 and other organizations was lacking, too. (De Larosière et al., 2009).
Underestimated
risks
Macroeconomic
failures
Failures of financial-
sector supervision and
regulation
World economies
Large, private, global
financial institutions
Global financial market
GLOBAL
FINANCIAL
CRISIS
Financial engineering
Foreign exchange
reserves
Global credit
boom
Poor risk
management

193
initiated the adoption of a new European regulatory and supervisory framework4. In the center of the new institutions is the European Systemic Risk Board (ESRB) – a consultative body with the majority of central bank representatives. It is responsible for the macro-prudential oversight, i.e. its task is mainly to define, identify, and prioritize macro-financial risks. The micro-prudential level is taken care of by the European System of Financial Supervisors (ESFS), which consists of three institutions: the European Banking Authority (EBA), European Insurance and Occupational Pensions Authority (EIOPA) and the European Securities and Markets Authority (ESMA). The Basel Committee on Banking Supervision has also responded to the results of the de Larosière Report by tightening the capital requirements5. These new rules, which have become part of the new financial architecture under the name Basel III, are aimed to improve the ability of the banking sector to absorb shocks arising from increased financial and economic stress regardless of its source, to limit the risk of spillovers from the financial sector into the real economy, to improve risk management and strengthen banks´ transparency. However, the stricter rules have spurred controversial reactions on both sides of the spectrum and serious doubts regarding their timelines and contents. There are concerns that the new Basel capital requirements will negatively affect not only the returns on assets and capital, with a direct impact on both shareholders and clients, but the economic growth as well. This ambiguity of opinions has its origin in different approaches to the general justification for state interventions in the functioning of markets. Will more regulation solve the problem?
Opinions on regulatory interventions into the functioning of financial markets are often rather controversial. Soros (2009) admits that financial markets do not head towards their balance; therefore, financial authorities have to supervise and, to some extent, manage them. ”The history of financial markets has been punctuated by crises and each crisis has led to an addition to the regulatory framework. ... The monetary authorities in the advanced industrial countries are well developed, but the evolution of the international regulatory framework has not kept pace with the globalization of financial markets.“ (pp. 83-84). Wolfson (and Tobin) also argue that tighter financial regulation can bring along economic stability and that the financial instability of the end of the 20th century was caused by the fact that the financial services industry has “overgrown” the regulation.
Staněk (2010), however, does not consider stricter regulation as the solution to the crisis-related problems – according to him, the regulatory mechanisms created in the 1990s were sufficient to stop the crisis from spreading and he sees the problem in their not having been consistently followed by governments and in their numerous exceptions. At the same time, he emphasizes the need to deal with the new rules at the supranational level. He accentuates proper differentiation of measures – at both the national and international levels – which are to be systemic and internally consistent so that in all the areas they create conditions for better functioning and development of the financial system as a whole. The de Larosière Report (2009) also clearly demonstrates the purpose to organize regulation and supervision in the future in a way which enables not only to maintain financial stability, but also, at the same time, to further deepen the European financial markets integration.
According to Klaus, the crisis was not caused by little regulation of markets, but, on the contrary, it was caused by “excessive state interventions, an irresponsible increase in
4 The final design of the new institutional structure of EU financial supervision, approved by the Ecofin Council on 9 June 2009, is to great extent the result of the De Larosière Report proposals implementation. 5 In its meeting on 12/9/2010; the rules were subsequently approved by the G20 member states at their Summit in Seoul in November of the same year.

194
government expenditure, and a wrong regulation of financial markets".6 Kalecki and Steindl are even more skeptical, they see the economic instability as much more interconnected with financial capitalism and, therefore, they do not really believe in the abilities of regulation to stabilize the economy (In: Toporowski, p. 151). Krugman (2009), too, argues that the more forbidden things there are, the more room they provide for corruption and clientelism. Moreover, Palan reminds us of the fact that at present about 80% of all the international financial transactions take place on the offshore financial markets, mainly out of reach of financial regulators. (In: Nesvetailova 2007, p. 52)
In connection with the failure of financial market supervision and in the interest of an increase in its efficiency, Workie Tiruneh (2009) emphasizes the need to transform relevant authorities and draws attention to the extensive problem of moral hazard, whether it is in connection with direct financial interventions of national governments, support of banks with deposit guarantees, or with payments of the so-called golden parachutes7. He places the argument “too big to fail“ in contrast with “too little to survive“. In this context he also reminds us of the fact that one of the dimensions of moral hazard connected with fiscal stimuli is the significantly negative impact of the stimuli on the formation of future perception of risk. Basel rules revisited – third generation package
Basel III contains macro-prudential as well as micro-prudential elements and deals with the problem of ratings, tightening of remuneration, implementation of bank levies, and systemically important financial institutions. The period 2011 – 2012 was a period of preparation and monitoring; in 2013 the Basel III rules will be implemented in practice; and its full implementation is to be terminated by 1 January 2019. This interim period is to enable banks to adapt to new requirements while simultaneously supporting the recovery of the economy. (BIS, 2009 and 2010)
The difference between Basel III and its predecessor lies mainly in the creation of a more complex system of regulation by focusing not only on capital adequacy, but on liquidity indicators and leverage ratio as well. The most significant changes in the new regulatory rules can be summarized as follows (see Table 1):
- An increase in the minimum level of common equity capital8 as of 1 January 2013 from the current 2 % to 3.5 % and its continuous increase by 0.5 % annually until it reaches the 4.5 % level by 1 January 2015;
- An increase in Tier 1 capital from the current 4 % to 4.5 % by 1 January 2013, to 5.5% by 1 January 2014, up to 6 % by 1 January 2015;
- An introduction of the so-called loss-absorbing “buffers” (see further in the text); - An introduction of two new liquidity standards: Liquidity coverage ratio (LCR) aimed
at short-term liquidity (up to 30 days) and Net stable funding ratio (NSFR) i.e. the ability of a bank to repay its commitments to clients over a time horizon of one year;
- An introduction of a new non-risk based indicator Leverage ratio (LR), which sets the ratio of bank capital to bank assets regardless of their risk weights.
6 Article published in HNonline on 22/10/2008: “Sarkozy chce podľa Klausa pochovať kapitalizmus“. 7 In connection with a speedy recovery of the financial sector from the crisis, when the majority of the support provided is returned within a year (especially in case of the TARP project). Moreover, Staněk (2010) argues that during the years 2008 and 2009 the state of the financial sector was not by far as critical that the national governments really had to intervene so intensively and to such extent rescue their financial sectors. 8 The highest form of the loss absorbing capital. (BIS, 2010).

195
On January 6, 2013 global banking regulators confirmed a compromise deal to ease bank liquidity rule and give banks more time to build up cash buffers against market shocks. New LCR will be introduced as planned in January 2015, but the minimum requirement will now begin at 60% and it will rise in equal annual steps of 10 percentage points to reach 100% in January 2019.
Table 1: Overview of tightened capital requirements under Basel III
2011 2012 2013 2014 2015 2016 2017 2018 2019 Minimum level of common equity capital (CET1)
2%
2%
3.5%
4%
4%
4.5%
4.5%
4.5%
4.5% Capital conservation buffer
0.625%
1.25%
1.875%
2.5%
Minimum level of Tier1 capital
4%
4%
4.5%
5.5%
6%
6%
6%
6%
6%
Minimum level of total capital
8%
8%
8%
8%
8%
8%
8%
8%
8%
Total capital adequacy (minimum level of total capital plus capital buffer)
8%
8%
8%
8%
8%
8.625%
9.125%
9.875%
10.5%
Source: own elaboration , Vašková V. and Vašková, N., 2012 (based on BIS 2010 data)
Capital is defined as a total of its two components, i.e. Tier 1 (going-concern capital) and Tier 2 (gone-concern capital). The emphasis is put on the quality of capital which is to be able to absorb losses in case of risk without endangering the operation of a banking institution, and to ensure resources to cover risks and make payments, and adequate funding. The capital conservation buffer is designed to ensure a build-up of capital buffers outside periods of financial and economic stress. It will amount to 0.625 % in 2016 and subsequently it will increase annually by the same percentage until it reaches the 2.5 % level by 1 January 2019. The countercyclical buffer of 0 – 2.5 % of common equity capital, or any other loss-absorbing capital, will be implemented according to national circumstances and its purpose is to meet a wider macro-prudential target, i.e. to protect the banking sector from excess aggregate credit growth9. The total capital requirement, which remains unchanged at the 8 % level, will – together with the capital conservation buffer – reach 10.5 % by 1 January 2019.
In case of the Leverage ratio (LR), a transitive period will be used to verify its design and calibration. Depending on the results, amendments can be made in the first half of 2017. The new liquidity indicators will also be monitored in order to verify their right design and calibration settings so as to avoid unexpected consequences for the banking or the whole system. The monitoring started in 2011 for LCR and in 2012 for NSFR. The date for the implementation of liquidity standards taking into account potential revisions in the monitoring period is set as follows: by 2015 for LCR and by 2018 for NSFR. Regulation of global systemically important financial institutions There were ongoing attempts to create a uniform definition of a systematically important financial institution as the question remained from which perspective to judge the size of a financial institution and the disruption its potential exit from the market could cause. The problem was that an event which seemed to be of local relevance could turn into a systemic crisis; therefore, the issue of global activity of a financial institution was not a sufficient indicator of potential systemic risk. Another issue was that of non-financial
9 I.e. only in case of such a systemic risk and referred to as “capital buffer range“.

196
institutions10 that might pose a threat to the financial system stability. From this point of view, it was important to measure systemic importance of all the subjects influencing the stability of the market. Basel Committee on Banking Supervision (BCBS) proposed a list of criteria to identify systemic importance of a financial institution at the end of July 2011 which are divided into five categories: size, interconnectedness, global activity, substitutability, and complexity. The proposed measurement is aimed at financial institutions which are subject to banking regulation under the so-called Basel capital rules.
Table 2: Global systemically important banks (G-SIBs) of November 2011 Continent: Country of domicile: Name of Banking Institution: North America USA Bank of America; Bank of New York Mellon;
Citigroup; Goldman Sachs; JP Morgan Chase; Wells Fargo; Morgan Stanley; State Street
Europe UK Barclays; HSBC; Lloyds Banking Group; Royal Bank of Scotland
Germany Commerzbank; Deutsche Bank Switzerland UBS; Credit Suisse Italy Unicredit Group Belgium Dexia France Banque Populaire CdE; BNP Paribas;
Group Crédit Agricole; Société Générale
Netherlands ING Bank Spain Santander Sweden Nordea Asia China Bank of China Japan Mitsubishi UFJ FG; Mizuho FG;
Sumitomo Mitsui FG Source: own elaboration, Vašková V. and Vašková, N., 2012 (based on FSB 2011 data) The Financial Stability Board11 (FSB) was asked by the G20 leaders last year to develop a framework addressing the risks connected with SIFIs. The policy framework, together with the timelines and implementation processes, was endorsed by G20 leaders in Seoul in the year 2010 and it is being implemented as of 2012, with a deadline for full implementation by 2019. In 2012, stronger standards aimed at reducing contagion risks in case of failure were finalized for core financial market infrastructures. As for global systemically important banking institutions, FSB and BCBS identified a group of 29 banks (see Table 2) which will need to meet the resolution planning requirements12and the additional loss absorption requirements13. These banks will have to meet the supervisory expectations for data aggregation capabilities by January 2016. The list will be updated annually and will be published by FSB in November every year. The methodology will be reviewed every 3 years. (FSB, 2011) The latest list of November 2012 numbers 28 global systemically important banks (G-SIBs)14 – 3 of last year identified 29
10 Such as government sponsored entities or public guarantors. (Deutsche Bank 2011). 11 FSB is the body charged withcoordinating the G20 reforms of the financial system. 12 By the end of 2012. 13 They will initially apply to banks which will be identified as globally systemically important in November 2014 (with the use of the BCBS methodology), these requirements will be phased in as of January 2016 and full implementation is expected by January 2019. (FSB, 2011). 14 “The list of global systemically important banks was drawn up as part of plans by the G20 to force banks that could damage the global economy if they were to fail to boost their core reserves by 1% to 2.5% above minimum international levels set under the international Basel III capital and liquidity rules.” (www.globalriskregulator.com).

197
banks have been removed (Dexia, Commerzbank and Lloyds)15 and 2 added (BBVA and Standard Chaptered). Regarding other (non-bank) financial institutions, FSB and BCBS work on extending the G-SIB framework to all systemically important financial institutions. By 2013 the International Association of Insurance Supervisors (IAIS) is expected to complete methodology for identifying SIFIs in the field of insurance and to develop a common framework for the supervision of those insurance groups that are active internationally so as to reach convergence of approaches in the field of regulation and supervision of the insurance market. The impact of Basel III on the banking sector
It is difficult to quantify the impact of the reformed Basel capital rules on the banking sector for several reasons. Most of all, the implementation of the rules represents a set of changes, the mutual interaction between which is questionable at present, as the starting points of the individual countries for regulation and the extent to which they have been affected by the global financial, economic, and now the EU sovereign debt crisis create different “start-up” conditions for the Basel capital rules implementation.
From a short-term perspective, the impact of the Basel III capital rules implementation is mostly connected with the quantification of capital volumes and sources of liquidity which banking institutions will need in order to meet the set higher limits of capital adequacy and new liquidity indicators (see Figure 2). In order to meet the deadline for full implementation of the rules in 2019, the European banks16 will need EUR 1,050 bn to meet the capital adequacy requirement and EUR 3,600 bn to meet the short-term and long-term liquidity requirements. Activities aimed at ensuring the availability of these funds can lead to an increase in the cost of capital, i.e. also in the cost of funding for the private sector. It is expected that the need to increase capital and ensure the required liquidity will result in the decrease in bank profitability17 (McKinsey, 2010). These expected negative affects of implementation on banks profitability development can be mitigated by banks targeted activities, such as, for instance, more efficient implementation of the Basel III capital rules, balance sheet restructuring, or revision of trading strategies and trading portfolio changes.
15 Dexia is undergoing an orderly resolution process, while global ysstemic importance of Commerzbank and Lloyds has declined. 16 An analysis of the 2nd quarter 2010 balance sheet data of the top 45 European banks (extrapolated data of the data from December 2009 in case data for the 2nd quarter of 2010 were not yet completed at the time of the study). The data from this analysis were scaled in order to quantify the impact on EU-27 and Switzerland. 17 The McKinsey study (2010) expects a decrease in ROE of the European banks (before tax) of about 4 percentage points (pp) on average, where the quality of capital would represent 0.8 pp, increased risk-weighted assets (RWA) 1.3 pp, increase in capital to the required level 1.3 pp, leverage ratio 0.1 pp, the need to ensure liquidity (holding more liquid assets) 0.2 pp and the cost of holding long-term funds 0.6 pp.

198
Figure 2: Outstanding amounts of capital and liquidity; year: 2019; in bn EUR; static perspective
0
500
1000
1500
2000
2500
Capital STL LTL
Europe USA
Source: own elaboration, Vašková V. and Vašková, N., 2012 (based on McKinsey 2010 data). The Euro Area bank assets represent approximately 350 % of its GDP, whereas in the
USA it is only about 83 %; and the share of banks in financial intermediation in the Euro Area represents about 74 %, while in the USA only about 24 %. The implementation of the Basel III capital rules is expected to bring along the following impacts on the Euro Area (IIF, 2010):
– A need of new capital amounting to EUR 230 bn by the year 2015 and to more than EUR 600 bn in total by the year 2020;
– A slowdown of economic growth by 4.4 % (cumulative GDP growth in the coming 10 years);
– A negative impact on the creation of jobs (5 million). Basel III implementation
To restore confidence in the regulatory framework for banks and to help ensure a safe and stable global banking system, the full, timely and consistent implementation of Basel III is considered to be essential. At Los Cabos Summit in June 2012 the G20 leaders welcomed “progress in implementing Basel II, 2,5 and III and urged jurisdictions to fully implement the standards according to the agreed timelines”18. Basel II (of June 2004, the deadline for implementation was the end of 2006) and Basel 2,5 (of July 2009, with the deadline for implementation set for end 2011) form integral parts of Basel III (of December 2010). Basel II was implemented in full by ¾ of member jurisdictions, five countries – Argentina, China, Indonesia, Russia and the United States are still in the process of implementing it; Basel 2,5 has been implemented by 20 of 27 member jurisdictions and final regulations issued by China, Saudi Arabia and United States should come into effect on 1 January 2013.
BIS report of October 2012 on Basel III implementation indicates that more effort will be needed to meet the transition period deadline of 1 January 2013: at the time of report, only 819 of the 27 Basel Committee member jurisdictions had issued their final set of Basel III related regulations, 17 had published draft regulations and 2 members had not yet published them. Considering there are only two months left this means a high probability that just 6 of the above mentioned 29 global systematically important banks identified by the FSB in November 2011 will be subject to Basel III regulations from the globally agreed start date. At mid-December meeting of Basel Committee it was confirmed that 8 of its member jurisdictions will miss the Basel III starting deadline of January 2013 because of implementation delays, including the United States and European Union.
18 Los Cabos G20 Leaders Declaration is available at www.g20.org. 19 Australia, China, Hong Kong SAR, India, Japan, Saudi Arabia, Singapore and Switzerland.
199
The process of monitoring members´ implementation of Basel III consists of the 3 levels of review: Level 1 – ensuring the timely adoption of Basel III, Level 2 – ensuring regulatory consistency with Basel III, and Level 3 – ensuring consistency of outcomes (initially focusing on risk weighted assets). While Levels 1 and 2 focus on national rules and regulations, Level 3 extends their scope to supervisory implementation at the bank level.
Conclusion The objective of the new framework of financial market regulation and supervision is
mainly to improve the ability of the banking sector to absorb shocks arising from financial and economic stress regardless of their origin; reduce the risk of spillovers from the financial sector into the real economy; improve risk management; and to strengthen bank transparency (BIS, 2009). Basel III represents a move in the perception of the need for capital in the banking sector and of the macro-prudential aspect of capital requirements. Evaluation of the impact of these new standards is demanding as they represent many changes, an individual quantification of which is possible, but prediction of mutual interactions is much more complicated. Also, the evaluation of the Basel III capital rules implementation impact on the economic growth is more demanding for there are several factors which can mitigate or worsen these impacts, such as the speed of capital markets response to the increase in banks common equity capital, the impact of the global financial crisis on individual banks, the existence of alternative sources of funding in individual national markets, supportive measures to mitigate the impact of regulation on national economies, etc.
Supranational banks are expected to maintain a group approach in their management regarding the new regulation, i.e. should the national supervision be costly there is a probability of pressure to transform the existing subsidiaries into branches. As the Governor of Bank of England King has wittily observed, ”financial institutions are global in life and national in death“ (King In: Davies, 2010.). Government financial support to banks in trouble falls back on national governments, despite the fact that the problems emerged outside the national market. In trying to improve the model of international regulation and supervision it is, therefore, important that it reflects the specificities of a country or a region. Another important question that remains is to what extent the regulation and supervision will be able to eliminate potential negative effects resulting from the increasing interconnectedness of global financial markets. It is necessary to pay more attention to symmetrical implementation of agreed conclusions which will enable to avoid problems with competitiveness in the future. Literature:
1. BIS (BANK FOR INTERNATIONAL SETTLEMENTS) (2012): Report to G20 Finance ministers and central bank governors on Basel III implementation. October/2012. ISBN: 92-9197-159-6.
2. BIS (BANK FOR INTERNATIONAL SETTLEMENTS), (2010): Basel III: A global regulatory framework for more resilient banks and banking systems. 12/2010. Available from: http://www.bis.org/publ/bcbs189.htm.
3. BIS (BANK FOR INTERNATIONAL SETTLEMENTS), (2009). Implementation of Basel II: Practical conciderations. 7/2004. Available from: <http://www.bis.org/publ/bcbs109.htm>.
4. DAVIES, H. (2010): Global Financial Regulation after the Credit Crisis. In: Global Policy, Volume 1, Issue 2. May 2010. DOI: 10.1111/j.1758-5899.2010.00025.x.

200
5. DEUTSCHE BANK RESEARCH. (2011): Identifying systemically important financial institutions (SIFIs). August 2011. Available from: www.dbresearch.com.
6. EBA (EUROPEAN BANKING AUTHORITY). (2011): The EBA details the EU measures to restore confidence in the banking sector. 26/10/2011. Available from: http://www.eba.europa.eu/News--Communications/Year/2011/The-EBA-details-the-EU-measures-to-restore-confide.aspx.
7. FSB (FINANCIAL STABILITY BOARD), (2011): Policy measures to address systemically important financial institutions. November/2011. Available from: http://www.financialstabilityboard.org/publications/r_111104bb.pdf.
8. IIF. (2010). Cumulative Economic Impact of Basel III. Available from: http://www.iif.com/press/press+203.php.
9. IVANI ČKA, K. et al. (2010). Overcoming crisis – creation of the new model for socio-economic development of Slovakia. Ekonóm, Bratislava. 2010. ISBN: 978-80-225-2882-5.
10. KRUGMAN, P. (2009). The return of depression economics and the crisis of 2008. Penguin Book Ltd., 2009. ISBN: 978-1-846-14239-0.
11. LAROSIÈRE, J. DE et al. (2009): The High-level group on financial supervision in the EU Report, 25.2. 2009. Available from: http://ec.europa.eu/internal_market/finances/docs/ de_larosiere_report_en.pdf.
12. LLEWELLYN D., T. (2011). Will the new EU architecture prevent future crisis: The road to „Basel N“ or pillar 4? Oesterreichische Nationalbank Annual Economics Conference, Vienna. May 23, 2011. Available from: http://www.oenb.at/de/img/llewellyn_tcm14-233105.pdf.
13. McKINSEY & COMPANY. (2010). Basel III and European banking: Its impact, how banks might respond, and the challenges of implementation. 2010. Available from: http://www.mckinsey.com/clientservice/Financial_Services/Knowledge_Highlights/~/media/Reports/Financial_Services/Basel%20III%20and%20European%20banking%20FINAL.ashx.
14. NESVETAILOVA, A. (2007): Fragile finance. Palgrave Macmillan 2007. ISBN 978-0-230-00690-4.
15. OJO, M. (2010). Preparing for Basel IV – Why liquidity risks still present a challenge to regulators in prudential supervision. Available from: http://mpra.ub.uni-muenchen.de/27627/.
16. SOROS, G. (2009): Nové paradigma pro finanční trhy: Úvěrová krize 2008 a co dál. ELK Praha 2009. ISBN 80-86316-82-6.
17. STANĚK, P.; IVANOVÁ, P. (2011). Globálna kríza a obnovenie globálnej rovnováhy. 2011. Vydavateľstvo Ekonóm, 2011. ISBN: 978-80-225-3197-9.
18. STANĚK, P. (2010). Globálna kríza – hrozba alebo výzva? Sprint dva, Bratislava, 2010, ISBN: 978-80-89393-22-0.
19. ŠIKULA, M. (2009). Kritická miera rozporov civlizácie a globálna ekonomická kríza (s. 195-208). In: WORKIE TIRUNEH, M. a kol.: Vývoj a perspektívy svetovej ekonomiky. Globálna finančná a hospodárska kríza: Príčiny-náklady-východiská. EÚ SAV, 2009. ISBN: 978-80-7144-175-5.

201
20. TOBIN, J. (2003): World finance and economic stability. Edward Elgar Publishing, 2003, ISBN 1-84064-926-7.
21. TOPOROWSKI, J. (2005): Theories of financial disturbance: An examination of critical theories of finance from Adam Smith to the present day. Edward Elgar Publishing. 2005. ISBN 1-84542-763-7.
22. VAŠKOVÁ, V. - VAŠKOVÁ, N. (2012).: Inception of post-crisis transformation processes in the EU financial market regulation and supervision, p. 230-254. In: Ivanička, K. et al.: New model of socio-economic sustainable development of the Slovak republic. School of economics and management in public administration in Bratislava, and Institute of European, national and global studies. Published by Institute of applied management Trenčín, april 2012. ISBN 978-80-89600-02-1.
23. VAŠKOVÁ, N. - VAŠKOVÁ, V. (2010). Breakdown of Trust in Financial Institutions in Light of the Global Financial Crisis, Journal of Advanced Studies in Finance, Volume 1/2010. ISSN: 2086-8393.
24. WORKIE TIRUNEH, M. (2009): Nové trendy vo svetovej ekonomike v kontexte finančnej a hospodárskej krízy: Globálny a regionálny pohľad, s. 15-38 In: WORKIE TIRUNEH, M. a kol.: Vývoj a perspektívy svetovej ekonomiky. Globálna finančná a hospodárska kríza: príčiny – náklady – východiská. EÚ SAV, 2009. ISBN 978-80-714.
Contact
Ing. Vanda Vašková, PhD. Institute of Economic Research Slovak Academy of Sciences Slovak Republic E-mail: [email protected]

202
Tomáš Verner Michal Tvrdo ň
SCHOOL OF BUSINESS ADMINISTRATION IN KARVINA
SILESIAN UNIVERSITY IN OPAVA
TESTING OF THE LONG-TERM RELATIONSHIP BETWEEN REGIONAL UNEMPLOYMENT 1
Abstract The aim of this paper is to discuss regional labour market performance of the Czech economy. The first part of the paper offers basic characteristic of the Czech regional economic performance. Using selected macroeconomic indicator like number of unemployed labour force, the paper examines trends in regional disparities at the NUTS 3 level during the period 2006-2012. Another goal of this paper is to test if regional total and regional long-term unemployment are co-integrated, in other words if the long-term relationship between regional total and regional long-term unemployment exists. Quarterly data from the Czech Statistical Office were used for the analysis. The Johansen test was applied on 2006-2012 data to examine co-integration. Key Words: Co-integration, Czech Republic, Error Correction Model, NUTS 3, Regional disparities, Unemployment. Introduction Long-term unemployment represents a serious problem in most EU Member States. However, particular countries or groups of countries differ in principle, namely the difference concerns duration of unemployment or a share of long-term unemployment in total unemployment. OECD uses five basic categories – a) unemployment shorter than one month; b) unemployment longer than one month but shorter than three months; c) unemployment longer than three months but shorter than six months; d) unemployment longer than six months but shorter than 12 months and the last category is represented by e) unemployment longer than 12 months (so-called long-term unemployment). For outlining situation in the labor market in these countries division of unemployment based on its duration into two groups is sufficient, when we merge all the shorter forms of unemployment (a+b+c+d) into unemployment, which duration does not exceed 12 months and we mark it generally as short term unemployment. The other category is long-term unemployment, thus unemployment longer than 12 months. In general, it is valid that the longer is duration of unemployment the more serious problem it represents, namely from the viewpoint of unemployed as well as from the viewpoint of potential employers and after all even from a viewpoint of a government. The aim of this paper is to estimate, based on econometric approach, relationship between regional total and long-term unemployment in the Czech Republic NUTS 3 regions, especially in the context of long-term time period. For this purpose the paper is divided into several parts. The first part is devoted to description of issues associated with regional
1 The research behind this paper was supported by the project Inovace studijních programů na Slezské univerzitě v Opavě, Obchodně podnikatelské fakultě v Karviné, číslo projektu CZ.1.07/2.2.00/28.0017.

203
unemployment. Second part deals with the econometric methodology and analytical tools. The third part contains empirical results of co-integration analysis and the final section summarizes all the key findings. The last part concludes. Long-term unemployment and its consequences on an economy Long-term unemployment, analogous to total unemployment, fluctuates consistent with a phases of the business cycle in the most countries. In addition Abraham and Shimer (2001) mention that at the most of proceeded economic cycles it was proved rather strong correlation between the unemployment level and average duration of unemployment. Besides, there is an interesting fact that the persistence of unemployment did not decrease after the economic recession in such intensity as in the case of a decrease of the unemployment rate. OECD study (1993) even declares that long-term unemployment tends to grow for a year or two since the beginning of decreasing of unemployment and afterwards it starts to decline slowly. The fundamental question than is, which factors cause a delayed reaction of long-term unemployment (in the sense of its decreasing) after subsiding of a shock. The study explains this phenomenon through the dynamics of the labour market, which is a function of speed recovery of the market, a degree of structural changes taking place in the economy. In addition it could be the setting of various government programmes assisting unemployed people and finally it is also the amount of previous short-term unemployed finding a new job. These measures are very important because if job applicants stay unemployed too long, they could have either stop to look for a job or they can lose their qualification and skills (see Beleva, 1997 or Tvrdoň, 2008). Moreover, employers may consider such candidates as risky and may be reluctant to hire them. It can cause an unwillingness of the long-term unemployed persons to actively search for a job. As long-term unemployed people stop to look for a job actively, they become irrelevant for forming wages. Companies do not take them into account and they do not include them into the labor supply. We also have to add the fact that even the employed labor force does not consider them as a competition - they become so-called outsiders. This is supported by Machnin & Manning (1998) by the statement, that long-term unemployment has “devastating” impacts on unemployed in two levels – partly in the level of their potential opportunities in the labor market and partly it generates serious physical and mental difficulties. Beleva (1997) argues that during the struggle for survival they often seek to participate in the shadow economy (see Alexandru, Dobre & Ghinararu, 2010), in extreme cases in a criminal activity. Data and econometric methodology Quarterly data of total unemployed persons and long-term unemployed persons (in thousands of persons) for the Czech Republic NUTS 3 regions were employed from 4th quarter 2006 to 2nd quarter 2012. All of the data were collect from the Czech Statistical Office, Division of Labour and Social Statistics. We converted all series into logs. Co-integration is an econometric technique for testing the relationship between non-stationary time series variables. This technique is often used because of many macroeconomic time series are not stationary in their levels. If two or more series each have a unit root, that is I(1), but a linear combination of them is stationary, I(0), then the series are said to be co-integrated. Thus co-integration analysis is an extension of the simple correlation based analysis. We used augmented Dickey-Fuller test (ADF test) to find out whether time series have unit root test, i.e. are non-stationary, which estimates the following regression (Gujarati, 2004):

204
∑=
−− +∆+++=∆m
itititt YYtY
1121 εαδββ (1)
where �t is a white noise error term and where �Yt = Yt – Yt-1, etc. The null hypothesis tests whether � = 0. Co-integration is based on the determination of r co-integration relations in the VAR model. Co-integration is confirmed if r>0 . For testing purposes, we applied Johansen co-integration method (Johansen, 1988 or Johansen, 1991). First of all we need to determine the lag order of vector autoregression through Schwarz information criterion (SC), which is defined as (Gujarati & Porter, 2009):
n
RSSn
n
unSC nknk /
2/ ˆ
== ∑ (2)
where RSS denotes the residual sum of squares, k/n is the penalty factor. The next step in Johansen’s approach is to estimate the number r of co-integrating vectors by means of two tests: (i) the trace test:
∑+=
∧
−−=m
riitrace nr
1
1ln)( λλ (3)
and (ii) the maximum eigenvalue test (Cipra, 2008):
−−= +
∧
1max 1ln)( rnr λλ (4)
where n is the sample size and ∧λ is the i:th canonical correlation. The trace test tests the null
hypothesis (H0 hereinafter) of at most r co-integrating vectors against the alternative more than r. The maximum eigenvalue tests H0 of r co-integrating vectors against the alternative of r+1 . Tests reject H0 if �trace(r) or �max(r) are larger than their critical values or significance level. The error2 should be obtained from the co-integration equation (5) and test for stationarity, i.e. errors need to be I(0) to confirm the long-run relationship (Koop, 2005 or Cipra 2008):
ttt XYe βα −−= (5) where Y means dependent variable, X explanatory variable, e denotes errors (ECT), �, � are long-run coefficients, t time. However, in some cases, we are interested in understanding short-run behaviour instead of the long-run only. The so-called Granger Representation Theorem showing precisely that co-integrated series can be represented by error correction models was originally stated and proved by Granger (Engle & Granger, 1987). According to this theorem the relationship between variables can be expressed as an error correction model (ECM3) estimated by maximum likelihood, (Johansen, 1988):
ttttt YYeY εωωλϕ +∆+∆++=∆ −−− 11101 (6)
where current changes in Y are a function of previous changes in Y and X - parameter ω and the degree to which the series are outside of their equilibrium in the previous time period – parameter � and��as intercept. The symbol e denotes the error from equation (5) and it can be thought of an equilibrium error, � represents ECM disturbance. Hence, the model is out of equilibrium, if it is non-zero. Empirical results 2 Sometimes also called error correction term (ECT). 3 Often also used – vector error correction model (VECM).

205
Praha and Středočeský region have the smallest average unemployment rate; on the contrary Ústecký and Moravskoslezský region have the greatest average unemployment rate. The ADF test of all time series implies that they are integrated of order one, I(1) at 5 % significance level. The optimal time delay through Schwarz information criterion equals to 1 (i.e. one quarter) for Praha and Moravskoslezský region and 2 lags (i.e. two quarters) for Středočeský and Ústecký region. Trace test and maximum eigenvalue test indicate one cointegrating equation for all regions at 5 % significance level. Results of cointegration rank based on Trace test can be seen in table 1.
Table 1 Unrestricted cointegration rank test (Trace test)
Region H0 Trace statistics 5 % critical value r = 0 16.57784 15.49471
Praha r = 1 2.10488 3.84147 r = 0 22.59623 15.49471
Středočeský r = 1 3.19268 3.84147 r = 0 28.29577 15.49471
Moravskoslezský r = 1 3.14536 3.84147 r = 0 19.64829 15.49471
Ústecký r = 1 3.70540 3.84147
Source: own calculations Based on maximum likelihood estimation of cointegration vectors we yield equation (7) for Praha region, (8) for Středočeský region, (9) for Moravskoslezský region and (10) for Ústecký region:
Praha region: ttt eNLN ++= 22.004.1 (7)
Středočeský region: ttt eNLN ++−= 06.133.1 (8)
Moravskoslezský region: ttt eNLN +−= 29.043.4 (9)
Ústecký region: ttt eNLN ++−= 98.055.0 (10) where LN denotes number of long-term unemployed persons and N number of unemployed persons. Errors (e) were tested for unit root, and ADF test indicates errors I(0) at 5 % significance level, hence time series are cointegrated and long-run relationship is confirmed. Positive long-run relationship was found out between number of unemployed persons and number of long-term unemployed persons in Praha, Středočeský and Ústecký region. Thus, increasing in number of unemployed persons about one per cent will cause increasing about 0.22 % in number of long-term unemployed persons for Praha region. On the contrary, in Moravskslezský region, there raising unemployed persons about 1 % will reduce long-term unemployed persons about 0.29 %. Error correction model (ECM) for selected region is given by equations (11-14):
Praha region:
111 01.038.09.002.0 −−−
∧∆−∆+−−=∆ tttt NLNeLN
(11)
Středočeský region:
21211 87.065.017.018.083.002.0 −−−−−
∧∆−∆−∆+∆−−=∆ tttttt NNLNLNeLN
(12)
Moravskoslezský region:
111 17.004.049.001.0 −−−
∧∆−∆−−−=∆ tttt NLNeLN
(13)
Ústecký region:
21211 5.089.019.057.068.0 −−−−−
∧∆−∆−∆+∆+−=∆ tttttt NNLNLNeLN
(14)

206
Positive et-1 implies that LNt-1 is above its equilibrium level therefore �LNt will be negative – holds for Středočeský, Moravskoslezský and Ústecký region and vice versa negative et-1 implies that LNt-1 is below its equilibrium level therefore �LNt will be positive – Praha region. About 0.9 % of deviation from equilibrium is corrected next period by changes in LN of Praha region. Conclusion Long-term unemployment represents a serious problem in most EU Member States. Quarterly regional number of employed and number of long-term employed during the period 2006-2012 was used to examine long-run relationship between them. The Johansen test was applied to estimate co-integration. The positive long-term relationship was proved for Praha, Středočeský and Ústecký region, on contrary, the negative long-term relationship was confirmed for Moravskoslezský region. Positive errors from error correction model suggest that number of long-term unemployed is above its equilibrium level – holds for Středočeský, Moravskoslezský and Ústecký region and vice versa for Praha region. Literature:
1. Abraham, K.G., Shimer, R. Changes in Unemployment Duration and Labor Force Attachement. NBER Working Paper No. 8513 [online]. Cambridge (MA): NBER [cit. 27.11.2012]. 2001. Available from <http://www.nber.org/papers/w8513>.
2. A. A. Alexandru, I. Dobre, and C. Ghinararu, “The relationship between unemployment rate and the size of the shadow economy. The case of United States,” WSEAS Transactions on Business and Economics, vol. 7, no. 4, October 2010, pp. 359-369.
3. Beleva, I. Long-term Unemployment as Social Exclusion. Pp. 29-36 in: N. Genov, (ed). Human Development Report. Sofia: UNDP. 1997.
4. Cipra, T. Finanční ekonometrie. Ekopress, Praha, 2008.
5. Engle, R.F., Granger, C.W.J. Co-Integration and Error Correction: Representation, Estimation, and Testing. Econometrica 55, No. 2 (1978), 251-276.
6. Gujarati, D. Basic Econometrics. The McGraw-Hill Companies, New York, 2004.
7. Gujarati, D., Porter, D.C. Basic Econometrics. 5th ed. McGraw-Hill, Boston, 2009.
8. Johansen, S. Statistical Analysis of Cointegrating Vectors. Journal of Economic Dynamics and Control 12 (1988), 231-251.
9. Johansen, S. Estimation and Hypothesis Testing of Cointegration Vectors in Gaussian Vector Autoregressive Models. Econometrica 59, No. 6 (1991), 1551-1580.
10. Koop, G. Analysis of Economic Data. John Wiley & Sons, Chichester, 2005.
11. Machnin, M., Manning, A. The Causes and Consequences of Long-Term Unemployment in Europe. Working paper N. 400 [Online]. London: Centre for Economic Performance, London School of Economics and Political Science, 1998. Available: http://cep.lse.ac.uk/pubs/download/dp0400.pdf.
12. OECD. 1993. OECD Employment Outlook 1993 [online]. Paris: OECD [cit. 25.11.2012]. Available from <http://www.oecd.org/dataoecd/59/22/2485426.pdf>.
13. Tvrdon, M. Institutional aspects of labour market. Politicka ekonomie, vol. 56, no. 5, 2008, pp. 621-642.

207
Contact Mgr. Ing. Michal Tvrdoň, Ph.D. Department of Economics School of Business Administration in Karvina Silesian University in Opava Univerzitní nám. 1934/3 733 40 Karviná Czech Republic E-mail: [email protected] Ing. Tomáš Verner Department of Economics School of Business Administration in Karvina Silesian University in Opava Univerzitní nám. 1934/3 733 40 Karviná Czech Republic E-mail: [email protected]

208
Authors
Adašková Daša, Mgr., PhD. Buzinkai Matej, Ing. Cyran Anna, Dr. Dušek Jiří, Ing., Ph.D. Evangelu Jaroslava, Mgr. etMg.PhD. Falecki Janusz, Dr. Funta Rastislav, JUDr., LL.M. Havierniková Katarína, Ing., PhD. Karásková Taťána, Mgr. Kordoš Marcel, Ing., PhD. Kozhabayeva Aisulu, Mgr. Kučerová Irah, PhDr., PhD. Leška Dušan, doc., PhDr., PhD. Melecký Lukáš, Ing. Pellešová Pavlína, doc., Ing., PhD. Puškárová Paula, Ing., DiS. art., PhD. Sinproh Chalotorn, Ing. Staníčková Michaela, Ing. Štancl Luboš, doc., RSDr., CSc. Tvrdoň Michal, Mgr., Ing., Ph.D. Vašková Vanda, Ing., PhD. Václavníková Klára, Mgr. Verner Tomáš, Ing.

209
Sponzori konferencie / Conference sponsors:
TAIPEI
REPRESENTATIVE OFFICE BRATISLAVA
Conference proceedings 13th International Scientific Conference International Relations 2012 Contemporary Issues Of World Economics And Politics © Faculty of International Relations University of Economics in Bratislava Dolnozemská 1/b 852 35 Bratislava Managing editor: PhDr. Lucia Milošovičová Pages: 208 ISBN 978-80-225-3560-1 The content of papers is a sole responsibility of authors.