conference proceedings: partnered by – reshamwala shipbrokers emerging trends in the edible oil...
TRANSCRIPT

Conference Proceedings:Partnered by – Reshamwala Shipbrokers
Emerging Trends In The Edible Oil Sector – A View From Pakistan
Presentation by: Abdul Rasheed Janmohammed
Globoil India 2015, September 29, 2015
Mumbai

GLOBOIL INDIA 2015
28th – 30th September 2015Renaissance Mumbai Convention Centre Hotel
“Emerging Trends In The Edible Oil Sector – A View From Pakistan.”.
By
Abdul Rasheed Janmohammed
Vice Chairman – Pakistan Edible Oil Refiners Association (PEORA)Chief Executive Officer – Mapak Edible Oils (Pvt.) Limited – JV Project Pakistan-Malaysia.

EDIBLE OIL SCENARIO
Per Capita Consumption 17kgs.
Total Consumption Around 3.5 Million Tons
Local Production 0.5-0.6 Million Tons
Import of Edible Oils Around 2.5 Million Tons
Oil Extracted from Imported Seeds Around 0.5 Million Tons
Total Import Bill of Edible Oil about US$ 1.8 to 2.0 Billion.
Total Import Bill of Oilseeds about US$ 0.5 to 0.6 Billion.

Product Import Duty (Malaysia)
Import Duty (Indonesia)
CED I.Tax FED
Olien 7742.50 7742.50 16% 5.5% 1000
RBDPO 9230 9230 16% 5.5% 1000
CPO 6850 6850 16% 5.5% 1000
Product Import Duty CED I.Tax FED
CDSBO 9100 16% 5.5% 1000
Edible Oil Duty Structure – Pak. Rupees / M.Tons


Import of Edible Oils in Pakistan(Basis Arrival) in M.Tons
For January-December 2013, 2014 and January-August 2015
Product 2013 2014 Jan-Aug 2015
Olien 979,308 1,093,958 853,137
RBDPO 998,619 1,122,857 610,150
CPO 278,118 104,290 106,561
CDSBO 55,214 122,862 45,290
Total 2,311,259 2,443,967 1,615,138
Anticipated Arrival of Soy Oil during September –December 2015 As of To-date
Sept-Dec 2015 Anticipated Jan-Dec 2015
134,350 MT 179,640 MT

Import of Palm Oil ProductsFrom Malaysia and Indonesia
During January-December 2013 in M.Tons (Basis Arrival)
Product Malaysia % Indonesia % Total
Olien 864,332 88 114,976 12 979,308
RBDPO 225,374 23 773,245 77 998,619
CPO 224,128 81 53,900 19 278,118
1,313,834 942,211
2,256,045
Malaysia 58%
Indonesia 42%

Import of Palm Oil ProductsFrom Malaysia and Indonesia
During January-December 2014 in M.Tons (Basis Arrival)
Product Malaysia % Indonesia % Total
Olien 416,540 38 677,418 62 1,093,958
RBDPO 120,515 11 1,002,342 89 1,122,857
CPO 99,790 96 4,500 4 104,290
636,845 1,684,260
2,321,105
Malaysia 27.50%
Indonesia 72.50%

Import of Palm Oil ProductsFrom Malaysia and Indonesia
During January-August 2015 in M.Tons (Basis Arrival)
Product Malaysia % Indonesia % Total
Olien 206,064 24 647,073 76 853,137
RBDPO 65,042 11 545,108 89 610,150
CPO 78,147 73 28,414 27 106,561
349,253 1,220,595
1,569,848
Malaysia 22%
Indonesia 78%

Year Malaysia % Indonesia %
2013 58 42
2014 27.50 72.50
Jan-Aug 2015 22 78
Percentage Of Palm Oil ProductsFrom Malaysia and Indonesia Imported
During Jan-Dec 2013, 2014 and Jan-Aug 2015 In M.Tons (Basis Arrival)

2013 2014 Jan-Aug 20150
10
20
30
40
50
60
70
80
90
58.00
27.50
22.00
42.00
72.50
78.00
MALAYSIA%INDONESIA%

Product Import Duty FED Sales Tax Advance I.Tax
Canola/Rapeseed 2% Rs. 400 PMT 16% 5.5%
Sunflower Seed 2% Rs. 400 PMT 16% 5.5%
Soybean Seed 2% Rs. 400 PMT 6% 5.5%
Oilseeds Duty Structure – Pak. Rupees / M.Tons

Production of Major Oilseeds Crop
2012-2013 Production 2013-2014 Production
2014-2015 Production
Oilseed Oil Oilseed Oil Oilseed Oil
(000 Tons) (000 Tons) (000 Tons)
Cotton Seed 3324 400 3592 431 3450 414
Rapeseed 216 66 189 60 181 58
Sunflower Seed 244 95 190 76 178 68
Canola Seed 16 6 16 6 16 6
Total 567 573 546
Source: Pakistan Oil Seed Development Board / Economic Survey of Pakistan.

Import of Oilseeds in Pakistan(Basis Arrival) in M.Tons
For January-December 2013, 2014 and January-August 2015
Product 2013 2014 Jan-Aug 2015
Rapeseed / Canola 534,384 982,870 549,695
Sunflower 185,985 193,186 30,486
Soybean Seed 0 9,094 254,143
Total 729,369 1,185,150 834,324

Anticipated Arrival of Canola / Rapeseed for the period of September –December 2015
AndJanuary-June 2016
Sept-Dec 2015 Jan-June 2016
256,100 MT NIL
Anticipated Arrival of Soybean for the period of September –December 2015
AndJanuary-June 2016
Sept-Dec 2015 Jan-June 2016
480,000 MT 372,000 MT
If we add the arrived quantity and the anticipated arrivals of Canola / Rapeseed/Soybeans, the total quantity this year will touch 1.58 Million Tons.

New trend is being created in Pakistan of importing Soybeans on Premium over CBOT basis. 2015 has been the first year that Pakistan have embarked very aggressively on the journey of importing Soybeans due to very weak Global prices and duty advantage over other Oilseeds. I must admit that Pakistan entrepreneurs have done a very innovative work by importing Soybeans only on premium over CBOT. This has given them a great flexibility of booking physical prices as and when required which is very much suitable in the bearish market.
The above statistics will prove that Pakistan buyers covered reasonable quantity of Soybeans in the year 2015 and have also covered the requirement for the first half of 2016. This shift of buying Soybeans will ultimately reduce the import of other Oilseeds like Canola, Rapeseed and Sunflower Seed.
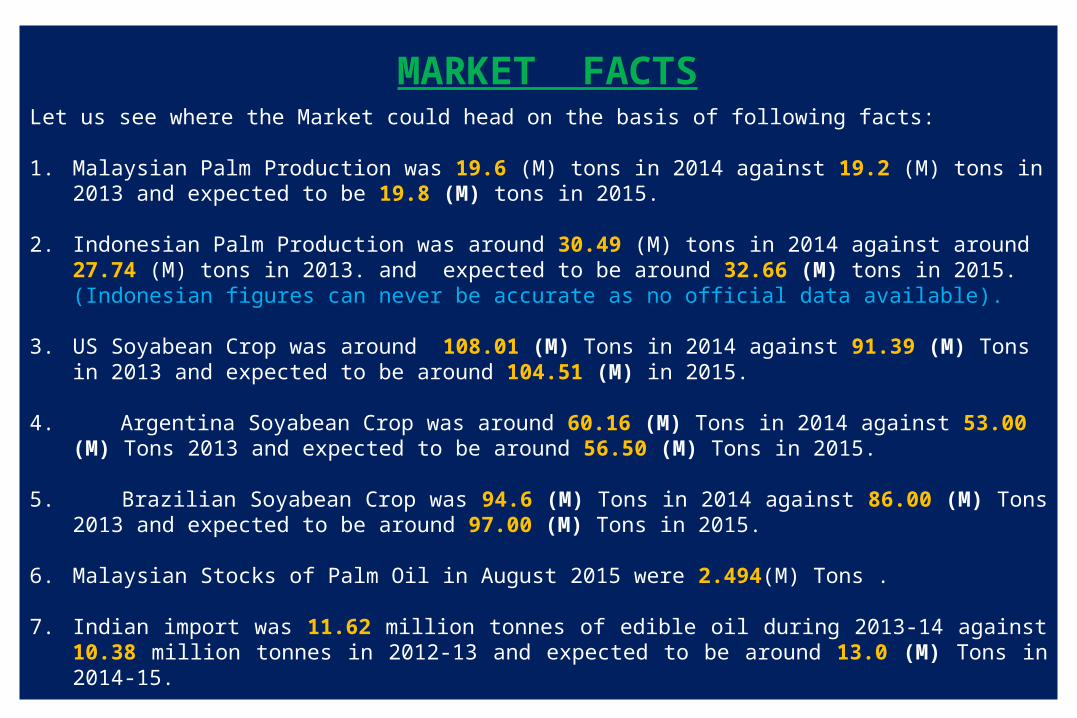
MARKET FACTSLet us see where the Market could head on the basis of following facts:
1. Malaysian Palm Production was 19.6 (M) tons in 2014 against 19.2 (M) tons in 2013 and expected to be 19.8 (M) tons in 2015.
2. Indonesian Palm Production was around 30.49 (M) tons in 2014 against around 27.74 (M) tons in 2013. and expected to be around 32.66 (M) tons in 2015. (Indonesian figures can never be accurate as no official data available).
3. US Soyabean Crop was around 108.01 (M) Tons in 2014 against 91.39 (M) Tons in 2013 and expected to be around 104.51 (M) in 2015.
4. Argentina Soyabean Crop was around 60.16 (M) Tons in 2014 against 53.00 (M) Tons 2013 and expected to be around 56.50 (M) Tons in 2015.
5. Brazilian Soyabean Crop was 94.6 (M) Tons in 2014 against 86.00 (M) Tons 2013 and expected to be around 97.00 (M) Tons in 2015.
6. Malaysian Stocks of Palm Oil in August 2015 were 2.494(M) Tons .
7. Indian import was 11.62 million tonnes of edible oil during 2013-14 against 10.38 million tonnes in 2012-13 and expected to be around 13.0 (M) Tons in 2014-15.
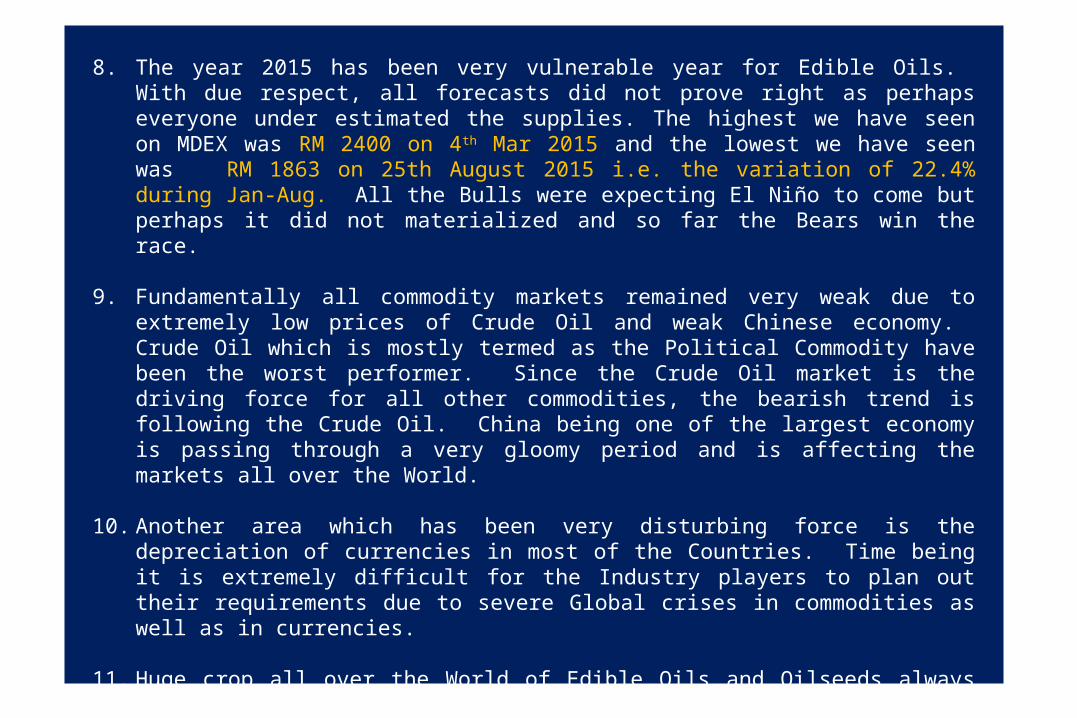
8. The year 2015 has been very vulnerable year for Edible Oils. With due respect, all forecasts did not prove right as perhaps everyone under estimated the supplies. The highest we have seen on MDEX was RM 2400 on 4th Mar 2015 and the lowest we have seen was RM 1863 on 25th August 2015 i.e. the variation of 22.4% during Jan-Aug. All the Bulls were expecting El Niño to come but perhaps it did not materialized and so far the Bears win the race.
9. Fundamentally all commodity markets remained very weak due to extremely low prices of Crude Oil and weak Chinese economy. Crude Oil which is mostly termed as the Political Commodity have been the worst performer. Since the Crude Oil market is the driving force for all other commodities, the bearish trend is following the Crude Oil. China being one of the largest economy is passing through a very gloomy period and is affecting the markets all over the World.
10. Another area which has been very disturbing force is the depreciation of currencies in most of the Countries. Time being it is extremely difficult for the Industry players to plan out their requirements due to severe Global crises in commodities as well as in currencies.
11. Huge crop all over the World of Edible Oils and Oilseeds always push the sellers to chase buyers which results in the glut of oils at the destinations.
12. Since production is multiplying in Indonesia, this origin will not only remain very competitive but will be an aggressive seller in terms of quantity particularly for Refined Palm Oil. Pakistan is perhaps the safe home for Indonesian Refined Palm Oil and this is the reason that prices of RBD Palm Oil remain much lower as compared to Olien for Indonesian origin. This will put additional pressure on the prices of PFAD as well being by-product of RBD Palm Oil.

The market facts being deliberated do give us certain direction. In the current year 2015 most forecasts proved incorrect as supply remained extremely large and exceeded all expectations.
While there is no doubt that supply still remain huge particularly Edible Oils and Oilseeds, there is a general belief that prices have already come down a lot. Palm Oil prices have slided too much. We have seen in past that Malaysia have the capacity to take care of their 2.00 million tons stocks without any problem, but this year even at lower stocks, markets were coming down purely on sentiments.
While we are anticipating increase in production figures during July-October 2015, we will be entering into the low production months commencing from November onwards.
Based on the above market facts, it is my belief that Palm prices may not go below RM 2200 and has the potential to go upto RM 2500 by December 2015.
For first quarter 2016 I believe Palm prices may remain between RM 2400 to RM 2700
FORECAST

I would like to conclude my Presentation with famous quote :
There are two kinds of people, those who do the work and those who take the credit.
Try to be in the first group; there is less competition there.
:- Indira Gandhi


Thank You

Conference Proceedings:Partnered by – Reshamwala Shipbrokers