conference of european statisticians’ set of core climate
TRANSCRIPT
Conference of European Statisticians’Set of Core Climate Change-related Indicators and Statistics
Using the System of Environmental-Economic Accounting
Conference of European Statisticians’ Set of Core Climate Change-related Indicators and Statistics U
sing the System
of Environmental-Econom
ic Accounting
U N I T E D N AT I O N S E CO N O M I C CO M M I S S I O N F O R E U R O P E
UN
ECE

ii
NOTE The designations employed and the presentation of the material in this publication do not imply the expression of any opinion whatsoever on the part of the Secretariat of the United Nations concerning the legal status of any country, territory, city or area, or of its authorities, or concerning the delimitation of its frontiers or boundaries.
ECE/STAT/NONE/2021/1
Copyright © United Nations, 2021 All rights reserved
iii
PREFACE Climate change is an existential threat and provides an immense challenge for humanity. A better understanding of all its aspects, through monitoring, modelling, analysis and reporting, is crucial to decide on the best course of action.
This document presents a set of core internationally comparable climate change-related indicators and statistics, developed by a dedicated UNECE Task Force established by the Conference of European Statisticians (CES). This indicator set (the CES Indicator Set) was endorsed in 2020 by the Heads of national statistical offices of more than 60 CES member countries.
The CES Indicator Set provides the foundation for developing national sets of climate change-related indicators intended to show the big picture of climate change-related issues, address the most relevant current policy questions and help meet upcoming information needs. It includes 44 indicators covering climate change drivers, emissions, climate change impacts, mitigation and adaptation. It also proposes corresponding contextual and operational indicators, helping interpret the core set in the national and global context, and provide more details according to national circumstances and priorities. The selection of indicators followed a careful vetting process based on the criteria of policy relevance, methodological soundness and data availability described in the present document. The CES Indicator Set is the recommended set of climate change-related indicators to be compiled and published in the CES member countries.
This document is accompanied by “Implementation Guidelines for the CES Set of Core Climate Change-Related Indicators and Statistics” and detailed information on individual indicators in the metadata sheets.

iv
ACKNOWLEDGEMENTS This publication reflects the contributions of many individuals and organizations, both those participating in the UNECE Task Force that prepared it, and those who played advisory roles.
The Task Force was chaired by Angelica Tudini (Italian National Institute of Statistics, ISTAT) and Olivier Thunus (Statistics Luxembourg) acted as Vice-Chair.
We are grateful for the contributions from the following experts who were members of the Task Force or contributed to its work: Lisa Grace Bersales (Philippine Statistics Authority), Maaike Bouwmeester (Eurostat), Carolyn Cahill (Statistics Canada), Jillian Campbell (United Nations Environment Programme (UNEP)), Sergio Castellari (European Environment Agency (EEA)), Silvia Cerilli (Food and Agriculture Organization of the United Nations (FAO)), Malgorzata Cwiek (UNECE), Angela Ferruzza (ISTAT Italy), Alessandro Flammini (FAO), Livia Hollins (United Nations Framework Convention on Climate Change (UNFCCC)), Francisco Javier Jiménez Nava (National Institute of Statistics and Geography (INEGI) of Mexico), Johanna Laiho-Kauranne (Statistics Finland), Marina Klevakina (Russian Federal State Statistics Service (Rosstat)), Lornaliza Kogler (UNFCCC), Sergey Kononov (UNFCCC), Myriam Linster (Organisation for Economic Co-operation and Development (OECD)), Jesarela López Aguilar (INEGI Mexico), Tiina Luige (UNECE), Michele McMillan (Statistics Canada), Tara Neville (World Health Organization (WHO)), Gherghița Nicodim (Romanian Ministry of Environment), Kanykey Orozbaeva (National Statistical Committee of the Kyrgyz Republic), Viveka Palm (Statistics Sweden), Anu Peltola (UNECE), Roberta Pignatelli (EEA), Matthew Prescott (Statistics Canada), Roberta Quadrelli (International Energy Agency (IEA)), Sjoerd Schenau (Statistics Netherlands), Reena Shah (United Nations Statistics Division (UNSD)), Anton Steurer (Eurostat), Giovanna Tagliacozzo (ISTAT Italy), Antti Takolander (Statistics Finland), Vlad Trusca (UNFCCC), Francesco N. Tubiello (FAO), Erhan Ünal (Turkish Statistical Institute (TURKSTAT)), Baktygul Ysabekova (National Statistical Committee of the Kyrgyz Republic) and Sainan Zhang (United Nations Population Fund (UNFPA)).
The Task Force worked under the guidance of the Steering Group on Climate Change-Related Statistics.
Michael Nagy (UNECE) served as secretary of the Task Force.

v
CONTENTS PREFACE ................................................................................................................................................................... III ACKNOWLEDGEMENTS ......................................................................................................................................... IV LIST OF ABBREVIATIONS ......................................................................................................................................... 1 EXECUTIVE SUMMARY ............................................................................................................................................. 2 1. INTRODUCTION .................................................................................................................................................. 5 2. CLIMATE CHANGE-RELATED STATISTICS: SCOPE AND RELEVANT POLICY AND STATISTICAL
FRAMEWORKS .................................................................................................................................................... 7 2.1 Scope of climate change-related statistics............................................................................................. 7 2.2 Global policy initiatives related to climate change............................................................................... 8
2.2.1 United Nations Sustainable Development Goals .............................................................................................. 8 2.2.2 Sendai Framework for Disaster Risk Reduction 2015-2030 ........................................................................ 10 2.2.3 Paris Agreement ............................................................................................................................................................ 12
2.3 Statistical frameworks supporting the production of climate change-related statistics ............. 13 2.3.1 System of Environmental-Economic Accounting ............................................................................................ 13 2.3.2 United Nations Framework for the Development of Environment Statistics ...................................... 14
3. SELECTION OF THE SET OF CORE CLIMATE CHANGE-RELATED INDICATORS ........................................ 15 3.1 Basic principles: hierarchical approach and definitions .................................................................... 15 3.2 Selection procedure ............................................................................................................................... 16 3.3 Specific methodological choices .......................................................................................................... 18
3.3.1 Coverage issues ............................................................................................................................................................. 18 3.3.2 Thematic coverage within the five areas (drivers, emissions, impacts, mitigation and
adaptation) and links between the areas ........................................................................................................... 20 3.3.3 Number of core indicators, spatial and temporal references .................................................................... 20
3.4 Role of SEEA Central Framework and the Framework for the Development of Environment Statistics in the selection procedure .................................................................................................... 21 3.4.1 SEEA Central Framework ........................................................................................................................................... 21 3.4.2 United Nations Framework for the Development of Environment Statistics ...................................... 21
3.5 Refinement of the initial set of core climate change-related indicators ........................................ 22 3.5.1 2017 pilot implementation ....................................................................................................................................... 22 3.5.2 Refinement procedure – methodological choices .......................................................................................... 22 3.5.3 Special case: climate change adaptation indicators ...................................................................................... 23
4. OUTPUT OF WORK .......................................................................................................................................... 27 4.1 Output 1: Set of core climate change-related indicators .................................................................. 27
4.1.1 The refined set of indicators .................................................................................................................................... 27 4.1.2 Major changes compared to the initial set of indicators ............................................................................. 33 4.1.3 Data availability ............................................................................................................................................................. 36
4.2 Output 2: Operational indicators ......................................................................................................... 37 4.3 Output 3: Contextual indicators ........................................................................................................... 38
4.3.1 General contextual indicators .................................................................................................................................. 38 4.3.2 Specific contextual indicators .................................................................................................................................. 39 4.3.3 Proxy indicators ............................................................................................................................................................. 39
4.4 Output 4: Core climate change-related statistics ............................................................................... 40 5. FOLLOW UP WORK .......................................................................................................................................... 43
5.1 Implementation of the set of core climate change-related indicators ........................................... 43 5.2 Further work on indicators .................................................................................................................... 44 5.3 Dissemination and use ........................................................................................................................... 44
6. REFERENCES ..................................................................................................................................................... 47 ANNEX I. UPDATED TERMS OF REFERENCE OF THE TASK FORCE ON A SET OF CORE CLIMATE
CHANGE-RELATED INDICATORS AND STATISTICS USING SEEA .............................................................. 49 ANNEX II. INITIAL SET OF CORE CLIMATE CHANGE-RELATED INDICATORS ............................................... 52

CES Set of Core Climate Change-related Indicators and Statistics Using SEEA
vi
ANNEX III. UMBRELLA QUESTIONS, POLICY QUESTIONS AND RELATED CORE CLIMATE CHANGE-RELATED INDICATORS .................................................................................................................................... 54
ANNEX IV. METADATA OF CORE CLIMATE CHANGE-RELATED INDICATORS (IN A SEPARATE FILE) ....... 63
TABLES Table 1 Areas and sub-areas of the set of climate change-related indicators ............................................ 20 Table 2 Number of core climate change-related indicators per area and sub-area ................................... 27 Table 3 Refined set of core climate change-related indicators ..................................................................... 28 Table 4 Reasons and open questions for classifying some indicators as tier III ......................................... 32 Table 5 Dual indicators in the set ...................................................................................................................... 34 Table 6 Core indicators and proxy indicators .................................................................................................. 40 Table 7 Statistics and accounts needed to produce the CES set of core climate change-related
indicators ................................................................................................................................................. 41
FIGURES Figure 1 The CES set of core climate change-related indicators ....................................................................... 4 Figure 2 Hierarchical relationship of the scope of climate change-related statistics, policy questions
and other information demand, indicators, and data sources (statistics and other data) .......... 15 Figure 3 Availability of the initial set of indicators in CES member countries (based on 41 replies) ........ 37

1
LIST OF ABBREVIATIONS CES Conference of European Statisticians
COP Conference of the Parties
EEA European Environment Agency
Eurostat Statistical Office of the European Union
FAO Food and Agriculture Organization of the United Nations
FDES United Nations Framework for the Development of Environment Statistics
GHG Greenhouse gas
HFA Hyogo Framework for Action 2005-2015: Building the Resilience of Nations and Communities to Disasters
IAEG-SDGs Inter-agency and Expert Group on SDG Indicators
IPCC Intergovernmental Panel on Climate Change
LULUCF Land use, land-use change, and forestry
NDCs Nationally determined contributions (Paris Agreement)
NSO National statistical office
OECD Organisation for Economic Co-operation and Development
OIEWG Open-ended Intergovernmental Expert Working Group on indicators and terminology relating to disaster risk reduction
SDGs United Nations Sustainable Development Goals
SEEA United Nations System of Environmental-Economic Accounting
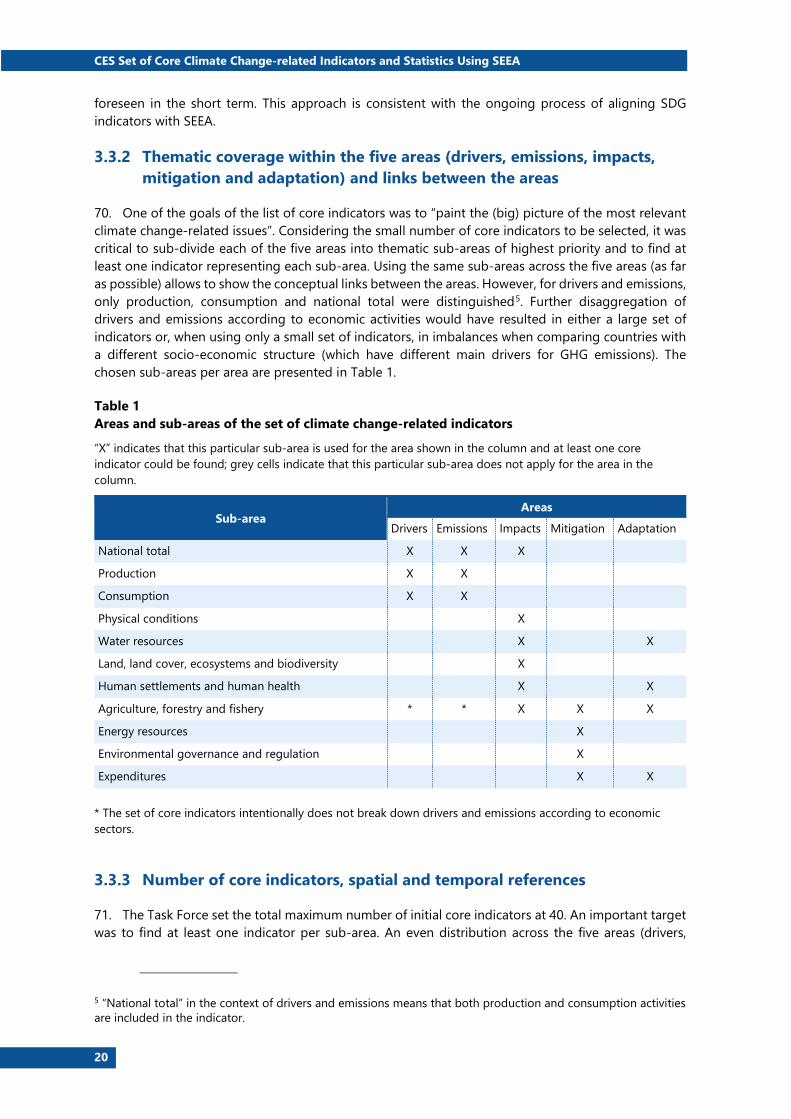
SEEA-EA United Nations System of Environmental-Economic – Ecosystem Accounting
SEEA-CF United Nations System of Environmental-Economic Accounting – Central Framework
SNA System of National Accounts
ToR Terms of reference
TPES Total primary energy supply
UNCEEA United Nations Committee of Experts on Environmental-Economic Accounting
UNECE United Nations Economic Commission for Europe
UNEP United Nations Environment Programme
UNFCCC United Nations Framework Convention on Climate Change
UNFPA United Nations Population Fund
UNSC United Nations Statistical Commission
UNSD United Nations Statistics Division
WMO Word Meteorological Organization
WHO World Health Organization

2
EXECUTIVE SUMMARY This document presents an internationally comparable set of core climate change-related indicators as well as a set of climate change-related statistics needed to produce greenhouse gas inventories and to compile the set of core climate change-related indicators.
The set of core climate change-related indicators serves multiple purposes:
• Painting the picture of the most relevant climate change-related issues
• Addressing most relevant current policy questions
• Helping to meet upcoming information needs
The set includes 44 indicators, which are grouped according to the structure recommended in the CES Recommendations on Climate Change-related Statistics (UNECE, 2014):
• Drivers: 9 indicators
• Emissions: 9 indicators
• Impacts: 13 indicators
• Mitigation: 8 indicators
• Adaptation: 5 indicators
Figure 1 at the end of the Executive Summary presents the list of indicators and their grouping.
Eight of the proposed indicators are SDG indicators (or conceptually identical), and four are global indicators for measuring the targets of the Sendai Framework on Disaster Risk Reduction. Twenty-seven of the proposed indicators can be produced from the SEEA-Central Framework (SEEA-CF) accounts or are related to SEEA Ecosystem Accounting (SEEA-EA).
Placeholders had to be included for an indicator measuring the contribution of forestry to climate change adaptation and for an indicator measuring the impact of climate change on biodiversity. Both areas are highly relevant, but the Task Force could not identify appropriate indicators after consulting with international subject matter experts. The two placeholders need further work.
Following a recommendation of UNCEEA and the UNECE Steering Group on Climate Change-related Statistics, the set of core climate change-related indicators currently includes both residence-based indicators that can be derived from SEEA and traditional territory-based indicators. This approach takes into account that several of the territory-based indicators (e.g. related to energy use and greenhouse gas emissions) are widely used for defining policy targets, so data and methodologies exist, and the indicators are internationally comparable. Currently, the production of SEEA-based indicators is not straightforward in many countries of the region. The planned revision of the set of indicators in 5 years should increase the share of SEEA-based indicators due to methodological developments and the increasing implementation of related SEEA modules. At the same time, the number of non-SEEA based indicators is expected to be reduced.
When implementing the set of indicators, NSOs are encouraged to give priority to SEEA-based indicators.
The set of climate change-related indicators, as well as a list of underlying climate change-related statistics, were developed by the UNECE Task Force on a Set of Key Climate Change-related Statistics using the System of Environmental-Economic Accounting (SEEA). The Bureau of the Conference of European Statisticians (CES) created this Task Force in 2014, based on a proposal for follow-up work identified in the CES Recommendations on Climate Change-related Statistics (UNECE, 2014).

Executive summary
3
The work took into account the Sustainable Development Goals (SDGs), the Sendai Framework on Disaster Risk Reduction (Sendai Framework) and the requirements under the United Nations Framework Convention on Climate Change (UNFCCC), including, as appropriate, the Paris Agreement (agreed at COP21 in December 2015 and entered into force on 4 November 2016).
By applying a selection procedure based on three criteria - relevance, methodological soundness and data availability - the Task Force identified an initial set of 39 core climate change-related indicators, which the Conference of European Statisticians endorsed in June 2017.
The Conference agreed that the initial set of core climate change-related indicators formed the basis for pilot testing and asked the involved countries to share the outcomes. Ten countries and FAO participated in the pilot testing.
The Conference extended the mandate of the Task Force to refine the initial set of core climate-change related indicators based on the outcomes of the pilot testing, and to identify methodologies, data sources and develop guidance for implementation.
There are three outputs of the second phase of Task Force’s work:
(a) The refined set of core climate change-related indicators, lists of operational and contextual indicators, core climate change-related statistics and the selection procedure presented in this document;
(b) “Implementation Guidelines for the CES Set of Core Climate Change-Related Indicators and Statistics” providing guidance on implementing national indicator sets based on the CES Set;
(c) Metadata sheets presenting detailed information on core indicators available in a separate file.
In March 2016, the UNECE work on climate change-related statistics was presented at the 47th Session of the United Nations Statistical Commission (UNSC). UNSC requested the UN Statistics Division to review and consider the work of the Task Force as a basis for developing a global set of climate change indicators and statistics applicable to countries at various stages of development (see United Nations, 2016c).
In March 2018, UNSC expressed its support for the work undertaken by the UNECE Task Force. Furthermore, the Statistical Commission noted that the use of SEEA for deriving the set of climate change-related statistics allows for linkages with the economy, which supports analytical work, and encouraged further consideration of SEEA, in particular in the context of the development of air emission accounts (see United Nations, 2018).

CES Set of Core Climate Change-related Indicators and Statistics Using SEEA
4
Figure 1 The CES set of core climate change-related indicators
DRIVERS 1a Total energy use by the national economy 1b Total primary energy supply (TPES) 2a Share of fossil fuels in total energy use by the national economy 2b Share of fossil fuels in total primary energy supply (TPES) 3 Losses of land covered by (semi-) natural vegetation 4 Total support for fossil fuels in relation to GDP 5a Total energy intensity of production activities of the national economy 6a Total CO2 intensity of energy used in production activities of the national economy 8a Energy use by resident households per capita
EMISSIONS 9a Total greenhouse gas emissions from the national economy 9b Total greenhouse gas emissions from the national territory 10a CO2 emissions from fuel combustion attributable to the national economy 10b CO2 emissions from fuel combustion within the national territory 11 Greenhouse gas emissions from land use change (LULUCF) 12 Total greenhouse gas emissions from production activities 13 Greenhouse gas emission intensity of production activities 14 Direct greenhouse gas emissions from households 15 Carbon footprint
IMPACTS 16 Mean temperature anomaly (compared to climate normal 1961 - 1990) 17 Percentage of land area suffering from unusually wet or dry conditions (Standard Precipitation Index) 18 Level of water stress: freshwater withdrawal as a proportion of available freshwater resources
Placeholder for an indicator on CC impact on biodiversity 20 Carbon stock in soil 21 Proportion of land that is degraded over total land area 22 Number of deaths and missing persons attributed to hydro-meteorological disasters per 100,000 population 23 Occurrence of extremes of temperatures and precipitation 24 Direct economic loss attributed to hydro-meteorological disasters in relation to GDP 25 Number of people whose destroyed dwellings were attributed to hydro-meteorological disasters 26 Incidence of climate-related vector-borne diseases 27 Excess mortality related to heat 28 Direct agricultural loss attributed to hydro-meteorological disasters
MITIGATION 29a Renewable energy share in total energy use by the national economy 29b Renewable energy share in the total final energy consumption within the national territory 30 Share of climate change mitigation expenditure in relation to GDP 31 Share of energy and transport related taxes in total taxes and social contributions 32 Total climate change-related subsidies and similar transfers in relation to GDP 33 Average trading carbon price 34 Amounts provided and mobilized in United States dollars per year in relation to the continued existing
collective mobilization goal of the $100 billion commitment through to 2025 81 Net emissions/removals of carbon dioxide by forest land
ADAPTATION 35 Share of government adaptation expenditure in relation to GDP 36 Change in water use efficiency over time 39 Proportion of agricultural area under productive and sustainable agriculture
82 Share of green urban areas in the total area of cities Placeholder for indicator on CC adaptation by forests

5
1. INTRODUCTION 1. The document presents the results of the work of the Conference of European Statisticians’ (CES) Task Force on a Set of Core Climate Change-Related Indicators and Statistics using the System of Environmental-Economic Accounting (SEEA)1.
2. The Task Force was created by the CES Bureau in October 2014, based on a proposal for follow-up work identified in the CES Recommendations on Climate Change-related Statistics (CES Recommendations; UNECE, 2014).
3. The main objective of the Task Force was to define an internationally comparable set of core
climate change-related indicators and statistics that can be derived from SEEA (to the extent possible) and other sources, such as the United Nations Framework for the Development of Environment Statistics (FDES). The work took into account the Sustainable Development Goals (SDGs), the Sendai Framework on Disaster Risk Reduction (Sendai Framework) and the requirements under the United Nations Framework Convention on Climate Change (UNFCCC), including, as appropriate, the Paris Agreement (agreed at COP21 in December 2015 and entered into force on 4 November 2016).
4. To limit the size of the set, the Task Force decided from the start that the set of core climate change-related indicators should consist of about 40 indicators serving multiple purposes:
(a) Painting the picture of the most relevant climate change-related issues;
(b) Addressing most relevant current policy questions;
(c) Helping to meet upcoming information needs.
5. At its sixty-fifth plenary session in June 2017 the Conference of European Statisticians endorsed the report of the Task Force on the initial set of 39 core indicators. The Conference agreed that this set formed the basis for pilot testing and asked the involved countries to share the outcomes of the testing. The Conference extended the mandate of the Task Force to refine the initial set of core climate change-related indicators based on the outcomes of the pilot testing, and to develop guidelines for implementation.
6. There are three outputs of the second phase of Task Force’s work:
(a) The refined set of core climate change-related indicators, lists of operational and contextual indicators, core climate change-related statistics and the selection procedure presented in this document;
(b) “Implementation Guidelines for the CES Set of Core Climate Change-Related Indicators and Statistics” providing guidance on implementing national indicator sets based on the CES Set;
(c) Metadata sheets presenting detailed information on core indicators available in a separate file.
7. Members of the Task Force represented the national statistical offices (NSOs) of Italy (chair), Canada, Finland, Kyrgyzstan, Luxembourg, Mexico, Netherlands, Philippines, Romania, Russian Federation, Sweden and Turkey. Furthermore, the following international organisations were members of the Task Force: the European Environment Agency (EEA), the Food and Agriculture Organization of the United Nations (FAO), the International Energy Agency (IEA), the Organisation for Economic Co-operation and Development (OECD), the Statistical Office of the European Union (Eurostat), the United Nations Environment Programme (UNEP), the United Nations Framework Convention on Climate
1 http://www.unece.org/statistics/networks-of-experts/task-force-on-a-set-of-core-climate-change-related-statistics.html
CES Set of Core Climate Change-related Indicators and Statistics Using SEEA
6
Change (UNFCCC), the United Nations Population Fund (UNFPA), the United Nations Statistics Division and the World Health Organization (WHO).
8. The following experts participated in the Task Force: Angelica Tudini (Italy, Chair), Olivier Thunus (Luxembourg, Vice-Chair), Ysabekova Baktygul (Kyrgyzstan), Lisa Grace Bersales (the Philippines), Maaike Bouwmeester (Eurostat), Jillian Campbell (UNEP), Carolyn Cahill (Canada), Sergio Castellari (EEA), Silvia Cerilli (FAO), Malgorzata Cwiek (UNECE), Angela Ferruzza (Italy), Alessandro Flammini (FAO), Livia Hollins (UNFCCC), Francisco Javier Jiménez Nava (Mexico), Marina Klevakina (Russian Federation), Sergey Kononov (UNFCCC), Johanna Laiho-Kauranne (Finland), Lornaliza Kogler (UNFCCC), Myriam Linster (OECD), Jesarela López Aguilar (Mexico), Michele McMillan (Canada), Michael Nagy (UNECE), Tara Neville (WHO), Gherghița Nicodim (Romania), Kanykey Orozbaeva (Kyrgyzstan), Viveka Palm (Sweden), Anu Peltola (UNECE), Roberta Pignatelli (EEA), Matthew Prescott (Canada), Roberta Quadrelli (IEA),Sjoerd Schenau (Netherlands), Reena Shah (UNSD), Anton Steurer (Eurostat), Giovanna Tagliacozzo, Antti Takolander (Finland), (Italy), Stefano Tersigni (Italy), Vlad Trusca (UNFCCC), Francesco N. Tubiello (FAO), Erhan Ünal (Turkey) and Sainan Zhang (UNFPA).
9. In March 2016, the UNECE work on climate change-related statistics was presented at the United Nations Statistical Commission (UNSC). UNSC requested the UN Statistics Division to review and consider the work of the Task Force as a basis for developing a global set of climate change statistics and indicators, applicable to countries at various stages of development (see United Nations, 2016c). The overall objective of the UNSD global set of climate change statistics and indicators2 is to provide a framework with suitable indicators to serve as guidance for countries to prepare for their own sets, especially for those with less developed statistical systems. The global set aims to meet the needs of all countries, and to contain a comprehensive list of indicators accompanied by metadata (including definitions, input variables, aggregations, measurement categories and data references). The selected indicators are structured according to the five IPCC areas: drivers, impacts, vulnerability, mitigation and adaptation.
10. In March 2018, UNSC expressed support for the work undertaken by the UNECE Task Force. Furthermore, it noted the use of SEEA for deriving the set of climate change-related statistics so as to allow for linkages with the economy to support analytical work, and encouraged further consideration of SEEA, in particular in the context of the development of air emission accounts (see United Nations, 2018).
2 A short introduction to the five areas and the key topics included in each of them is presented on UNSD website (https://unstats.un.org/unsd/envstats/ClimateChange_StatAndInd_global.cshtml).

7
2. CLIMATE CHANGE-RELATED STATISTICS: SCOPE AND RELEVANT POLICY AND STATISTICAL FRAMEWORKS
11. One of the main starting points for developing the set of climate change-related indicators presented here are the CES Recommendations. Section 2.1 summarises the main issues covered in the CES Recommendations, including the definition of climate change-related statistics, which was an important step towards clarifying the data needs of national and international climate change-related policy frameworks and the role of NSOs in addressing those needs.
12. Section 2.2 presents the most relevant recent climate change-related global policy initiatives and the related reporting frameworks:
(a) Sustainable Development Goals (SDGs);
(b) Sendai Framework for Disaster Risk Reduction (Sendai Framework);
(c) Paris Agreement under the United Nations Framework Convention on Climate Change (UNFCCC).
13. In addition to identifying the demand for data on climate change, an internationally comparable set of indicators also needs to take into account the main reference frameworks for supplying the data. Section 2.3 describes the main statistical frameworks for producing climate change-related statistics and indicators: the System of Environmental-Economic Accounting (SEEA) and the United Nations Framework for the Development of Environment Statistics (FDES).
2.1 Scope of climate change-related statistics
14. The CES Recommendations aim to improve the statistics related to climate change collected by national statistical systems and enhance their utility for the compilation of greenhouse gas (GHG) emission inventories. While the CES Recommendations primarily target official statisticians, they are also intended as a tool to promote discussions with stakeholders, including agencies responsible for greenhouse gas emission inventories and other producers and users of climate change-related statistics.
15. The CES Recommendations address the following issues in detail:
• Improving the utility of official statistics for the compilation of greenhouse gas (GHG) emission inventories
• Improving the utility of official statistics for carrying out climate change-related analysis more generally
• Improving operational and statistical infrastructures to better support the production of official climate change-related statistics
16. The CES Recommendations also provide a list of proposed next steps and unresolved issues, which include defining a set of core climate change-related statistics.
17. The CES Recommendations define the scope of climate change-related statistics as follows: “Environmental, social and economic data that measure the human causes of climate change, the impacts of climate change on human and natural systems, the efforts of humans to avoid the consequences as well as their efforts to adapt to the consequences”.
18. To narrow the scope in the context of the statistical system, it was recommended to focus on environmental, social and economic statistics that measure the following five climate change-related areas:

CES Set of Core Climate Change-related Indicators and Statistics Using SEEA
8
(a) Drivers: human causes of climate change that deal with sources of emissions;
(b) Emissions: GHG emissions and their human causes;
(c) Impacts: impacts of climate change on human and natural systems;
(d) Mitigation: efforts of humans to avoid the consequences;
(e) Adaptation: efforts to adapt to the consequences.
19. The scope identified in the CES Recommendations and the five areas listed above were the starting point for the selection of the set of core climate change-related indicators and statistics (see chapter 3).
2.2 Global policy initiatives related to climate change
2.2.1 United Nations Sustainable Development Goals
20. The 2030 Agenda for Sustainable Development, approved by the United Nations in 2015, set 17 goals and 169 targets for the eradication of poverty and the achievement of sustainable development. In March 2016, the forty-seventh session of the United Nations Statistical Commission (UNSC) agreed to a global indicator framework, specifying 230 indicators for measuring progress towards the Sustainable Development Goals. Goal 13 (“Take urgent action to combat climate change and its impacts”) is dedicated to climate change. Climate change-related issues can be also found in other SDGs and targets.
21. Goal 13 includes the following five targets:
• 13.1 Strengthen resilience and adaptive capacity to climate-related hazards and natural disasters in all countries
• 13.2 Integrate climate change measures into national policies, strategies and planning
• 13.3 Improve education, awareness-raising and human and institutional capacity on climate change mitigation, adaptation, impact reduction and early warning
• 13.a Implement the commitment undertaken by developed-country parties to the United Nations Framework Convention on Climate Change to a goal of mobilizing jointly $100 billion annually by 2020 from all sources to address the needs of developing countries in the context of meaningful mitigation actions and transparency on implementation and fully operationalize the Green Climate Fund through its capitalization as soon as possible
• 13.b Promote mechanisms for raising capacity for effective climate change-related planning and management in least developed countries and small island developing States, including focusing on women, youth and local and marginalized communities
22. The global SDG indicator framework (adopted by the UN General Assembly in July 2017) includes seven indicators to measure progress in achieving Goal 13 targets. The 2020 comprehensive review of the SDG indicator framework included proposals for some of these indicators to be replaced, one indicator to be deleted and one indicator added. The proposals were endorsed by the 51st session of UNSC (3-6 March 2020). The list below presents the original list of indicators together with the changes after the 2020 review3:
3 https://unstats.un.org/sdgs/indicators/Global%20Indicator%20Framework%20after%202020%20review_Eng.pdf

2. Climate change-related statistics: Scope and relevant policy and statistical frameworks
9
• 13.1.1 Number of deaths, missing persons and persons affected by disasters per 100,000 people
• 13.1.2 Number of countries with national and local disaster risk reduction strategies
o Replaced with “Number of countries that adopt and implement national disaster risk reduction strategies in line with the Sendai Framework for Disaster Risk Reduction 2015–2030”
• 13.2.1 Number of countries that have communicated the establishment or operationalization of an integrated policy/strategy/plan which increases their ability to adapt to the adverse impacts of climate change, and foster climate resilience and lower greenhouse gas emissions development in a manner that does not threaten food production (including a national adaptation plan, nationally determined contribution, national communication, biennial update report or other);
o Replaced with “Number of countries with nationally determined contributions, long-term strategies, national adaptation plans, strategies as reported in adaptation communications and national communications”
• New indicator 13.2.2 “Total greenhouse gas emissions per year”
• 13.3.1 Number of countries that have integrated mitigation, adaptation, impact reduction and early warning into primary, secondary and tertiary curricula;
o Replaced with “Extent to which (i) global citizenship education and (ii) education for sustainable development are mainstreamed in (a) national education policies; (b) curricula; (c) teacher education; and (d) student assessment”
• Deletion of indicator 13.3.2 “Number of countries that have communicated the strengthening of institutional, systemic and individual capacity-building to implement adaptation, mitigation and technology transfer, and development actions.”
• 13.a.1 Mobilized amount of United States dollars per year starting in 2020 accountable towards the $100 billion commitment;
o Replaced with “Amounts provided and mobilized in United States dollars per year in relation to the continued existing collective mobilization goal of the $100 billion commitment through to 2025”
• 13.b.1 Number of least developed countries and small island developing States that are receiving specialized support, and amount of support, including finance, technology and capacity-building, for mechanisms for raising capacities for effective climate change-related planning and management, including focusing on women, youth and local and marginalized communities;
o Replaced with “Number of least developed countries and small island developing States with nationally determined contributions long-term strategies, national adaptation plans, strategies as reported in adaptation communications and national communications”
23. Taking urgent action on climate change and its impacts is recognised as integral to the implementation of all SDGs. The following SDG targets relate specifically to climate change:
• 1.5 By 2030, build the resilience of the poor and those in vulnerable situations and reduce their exposure and vulnerability to climate-related extreme events and other economic, social and environmental shocks and disasters
• 2.4 By 2030, ensure sustainable food production systems and implement resilient agricultural practices that increase productivity and production, that help maintain ecosystems, that
CES Set of Core Climate Change-related Indicators and Statistics Using SEEA
10
strengthen capacity for adaptation to climate change, extreme weather, drought, flooding and other disasters and that progressively improve land and soil quality
• 3.d Strengthen the capacity of all countries, in particular developing countries, for early warning, risk reduction and management of national and global health risks
• 7.2 By 2030, increase substantially the share of renewable energy in the global energy mix
• 7.3 By 2030, double the global rate of improvement in energy efficiency
• 7.a By 2030, enhance international cooperation to facilitate access to clean energy research and technology, including renewable energy, energy efficiency and advanced and cleaner fossil-fuel technology, and promote investment in energy infrastructure and clean energy technology
• 7.b By 2030, expand infrastructure and upgrade technology for supplying modern and sustainable energy services for all in developing countries, in particular least developed countries, small island developing States and landlocked developing countries, in accordance with their respective programmes of support
• 9.4 By 2030, upgrade infrastructure and retrofit industries to make them sustainable, with increased resource-use efficiency and greater adoption of clean and environmentally sound technologies and industrial processes, with all countries taking action in accordance with their respective capabilities
• 11.b By 2020, substantially increase the number of cities and human settlements adopting and implementing integrated policies and plans towards inclusion, resource efficiency, mitigation and adaptation to climate change, resilience to disasters, and develop and implement, in line with the Sendai Framework for Disaster Risk Reduction 2015-2030, holistic disaster risk management at all levels
• 12.c Rationalize inefficient fossil-fuel subsidies that encourage wasteful consumption by removing market distortions, in accordance with national circumstances, including by restructuring taxation and phasing out those harmful subsidies, where they exist, to reflect their environmental impacts, taking fully into account the specific needs and conditions of developing countries and minimizing the possible adverse impacts on their development in a manner that protects the poor and the affected communities
• 14.3 Minimize and address the impacts of ocean acidification, including through enhanced scientific cooperation at all levels
• 15.2 By 2020, promote the implementation of sustainable management of all types of forests, halt deforestation, restore degraded forests and substantially increase afforestation and reforestation globally.
2.2.2 Sendai Framework for Disaster Risk Reduction 2015-2030
24. The Sendai Framework for Disaster Risk Reduction 2015-2030 (Sendai Framework) was adopted at the Third United Nations World Conference in Sendai, Japan, in March 2015. It is the outcome of stakeholder consultations initiated in March 2012 and inter-governmental negotiations from July 2014 to March 2015, supported by the United Nations Office for Disaster Risk Reduction at the request of the UN General Assembly.
25. The Sendai Framework is the successor instrument to the Hyogo Framework for Action (HFA) 2005-2015: Building the Resilience of Nations and Communities to Disasters. The HFA was conceived to give further impetus to the global work under the International Framework for Action for the International Decade for Natural Disaster Reduction of 1989, the Yokohama Strategy for a Safer World:

2. Climate change-related statistics: Scope and relevant policy and statistical frameworks
11
Guidelines for Natural Disaster Prevention, Preparedness and Mitigation and its Plan of Action, adopted in 1994 and the International Strategy for Disaster Reduction of 1999.
26. The Sendai Framework has seven global targets. These targets are measured at the global level with 38 indicators. National targets and indicators will contribute to the achievement of the outcome and goal of the present Framework. The seven global targets are:
(a) Substantially reduce global disaster mortality by 2030, aiming to lower the average per 100,000 global mortality rate in the decade 2020–2030 compared to the period 2005–2015;
(b) Substantially reduce the number of affected people globally by 2030, aiming to lower the average global figure per 100,000 in the decade 2020–2030 compared to the period 2005–2015;
(c) Reduce direct disaster economic loss in relation to global gross domestic product (GDP) by 2030;
(d) Substantially reduce disaster damage to critical infrastructure and disruption of basic services, among them health and educational facilities, including through developing their resilience by 2030;
(e) Substantially increase the number of countries with national and local disaster risk reduction strategies by 2020;
(f) Substantially enhance international cooperation to developing countries through adequate and sustainable support to complement their national actions for implementation of the present Framework by 2030;
(g) Substantially increase the availability of and access to multi-hazard early warning systems and disaster risk information and assessments to people by 2030.
27. On 3 June 2015, the United Nations General Assembly adopted the establishment of the “Open-ended Intergovernmental Expert Working Group on indicators and terminology relating to disaster risk reduction” (OIEWG) via resolution 69/284. In three meetings held between September 2015 and November 2016, OIEWG developed the set of indicators to measure global progress in the implementation of the Sendai Framework and agreed on the related terminology.
28. The report of OIEWG (A/71/644):
• Recommends 38 global indicators to measure the seven global targets of the Sendai Framework
• Recommends definitions for important terms and suggests a classification of hazards.
29. Important in the context of climate change are the following definitions:
• Disaster: A serious disruption of the functioning of a community or a society at any scale due to hazardous events interacting with conditions of exposure, vulnerability and capacity, leading to one or more of the following: human, material, economic and environmental losses and impacts.
• Hazard: A process, phenomenon or human activity that may cause loss of life, injury or other health impacts, property damage, social and economic disruption or environmental degradation.
30. Hazards include (as mentioned in the Sendai Framework) biological, environmental, geological, hydro-meteorological and technological processes and phenomena.
31. The Task Force decided to consider only hydro-meteorological hazards (and their impacts) as relevant for identifying climate change-related indicators. This class of hazards is defined as follows.

CES Set of Core Climate Change-related Indicators and Statistics Using SEEA
12
32. Hydro-meteorological hazards are of atmospheric, hydrological or oceanographic origin. Examples are tropical cyclones (also known as typhoons and hurricanes), floods including flash floods, drought, heatwaves and cold spells and coastal storm surges. Hydro-meteorological conditions may also be a factor in other hazards such as landslides, wildland fires, locust plagues, epidemics, and in the transport and dispersal of toxic substances and volcanic eruption material.
2.2.3 Paris Agreement
33. At the 21st Conference of the Parties (COP 21) in Paris (December 2015), the countries that are Parties to the United Nations Framework Convention on Climate Change reached an agreement on accelerating and intensifying the efforts to combat climate change. The Paris Agreement builds upon the Climate Change Convention. The modalities, rules and procedures for the implementation of the Paris Agreement utilize the experience with the reporting and review/analysis of climate-related information and data under UNFCCC. The Paris Agreement requires all Parties to put forward their best efforts to address climate change through “nationally determined contributions” (NDCs) and to strengthen these efforts in the years ahead. This includes the requirement that all Parties regularly report on their emissions and implementation efforts. There will also be a global stocktake every five years to assess the collective progress towards achieving the purpose of the agreement and to inform further individual actions by Parties. Following COP 21, the ratification of the Paris Agreement at national levels unfolded at an unprecedented pace. The Agreement entered into force on 4 November 2016, thirty days after the date on which at least 55 Parties to the Convention accounting in total for at least an estimated 55% of the total global greenhouse gas emissions have deposited their instruments of ratification, acceptance, approval or accession with the Depositary.4
34. At the 24th Conference of the Parties (COP 24) in Katowice (December 2018), the Paris Agreement Work Programme was adopted to make the Paris Agreement fully operational and all its institutions and processes to work efficiently. The Paris Agreement Work Programme contains rules governing the transparency framework, regular stocktakes on progressing mitigation, adaptation, financial flows, and addressing loss and damage.
35. The decision from Katowice requests all Parties to submit their first biennial transparency report and national inventory report under the Paris Agreement at the latest by 31 December 2024, whereas the least developed country Parties and small island developing States may submit at their discretion. In addition, developing country Parties shall be provided support on a continuous basis for building the transparency-related capacity and the Global Environment Facility will support developing country Parties in preparing their first and subsequent biennial transparency reports.
36. The modalities, procedures and guidelines for reporting contain the following sections:
(a) Introduction;
(b) National inventory report of anthropogenic emissions by sources and removals by sinks of greenhouse gases;
(c) Information necessary to track progress made in implementing and achieving nationally determined contributions under Article 4 of the Paris Agreement;
(d) Information related to climate change impacts and adaptation under Article 7 of the Paris Agreement;
(e) Information on financial, technology development and transfer and capacity-building support provided and mobilized under Articles 9–11 of the Paris Agreement;
4 More information about the Paris Agreement is available on the UNFCCC website at http://newsroom.unfccc.int/paris-agreement/

2. Climate change-related statistics: Scope and relevant policy and statistical frameworks
13
(f) Information on financial, technology development and transfer and capacity-building support needed and received under Articles 9–11 of the Paris Agreement;
(g) Technical expert review; and
(h) Facilitative, multilateral consideration of progress.
37. The reporting will require data on GHG emission inventories, and data relating to mitigation measures and their effects, vulnerability and adaptation, as well as data on (provided and received) support for climate action. The requirement to prepare and submit NDCs and other communications is a new, important element of the reporting under UNFCCC, as is the global stocktake under the Paris Agreement.
2.3 Statistical frameworks supporting the production of climate change-related statistics
2.3.1 System of Environmental-Economic Accounting
38. The System of Integrated Environmental and Economic Accounting – Central Framework (SEEA-CF) has been developed collectively by the United Nations, the European Commission, the International Monetary Fund, the Organisation for Economic Cooperation and Development and the World Bank to integrate environmental and economic information in one common framework. In 2012 the United Nations Statistical Commission approved SEEA-CF as a statistical standard for environmental accounting and encouraged all countries to compile their environmental-economic accounts on the basis of it as well as to report statistics derived from it. An important characteristic of environmental accounting is that the data are consistent with the System of National Accounts (SNA) principles, definitions and classifications.
39. Environmental accounting can be used to monitor and analyse a wide scale of environmental issues, including climate change, although no specific account for climate change exists within SEEA-CF.
40. SEEA-CF presents the environmental accounts under three main accounts:
• Physical flow accounts, recording the supply of resources - e.g. minerals, timber, fish - from the environment to the economy, the flows of products within the economy and the flows of residuals from the economy to the environment in the form of, for example, solid waste and air emissions;
• Environmental activity accounts and related flows, concerning the monetary transactions between economic units whose primary purpose is environmental protection and preservation;
• Asset accounts, measuring in quantity as well as monetary units, the stock of a specific environmental asset at the beginning and at the end of the accounting period and the changes (additions and reductions) during the accounting period; examples are asset accounts for land.
41. All three types of accounts can be used to analyse climate change-related issues. For example, physical flow accounts allow to identify GHG emissions caused by economic activities and households. The accounts for monetary transactions include expenditure for actions and activities to reduce, prevent or eliminate GHG emissions. Water asset accounts describe the changes in precipitation regimes and their implications for water stocks.
42. The SEEA Ecosystem Accounting (SEEA-EA) complements the SEEA Central Framework by taking a different perspective. SEEA-EA takes the perspective of ecosystems and considers how individual environmental assets interact as part of natural processes within a given spatial area. SEEA-EA plays a
CES Set of Core Climate Change-related Indicators and Statistics Using SEEA
14
potential role in measuring the impacts of climate change on ecosystems and their ecosystem services (carbon sequestration is probably the most relevant ecosystem service in the climate change context).
2.3.2 United Nations Framework for the Development of Environment Statistics
43. The United Nations Framework for the Development of Environment Statistics (FDES) is a multipurpose conceptual and statistical framework that provides an organizing structure to guide the collection and compilation of environment statistics.
44. Due to its large coverage, FDES is a valuable tool providing a set of environmental topics and individual statistics to inform on climate change. FDES consists of six main components, each of which includes some climate-change related data:
• Environmental conditions and quality, which includes, for example, air temperature or precipitation;
• Environmental resources and their use, which includes land use change or non-renewable production;
• Residuals, which includes GHG released to the atmosphere;
• Extreme events and disasters, which includes the impact of droughts or floods;
• Human settlements and environmental health, which includes data on epidemic changes;
• Environmental protection, management and engagement, which includes cost of climate change mitigation and adaptation measures.
45. Section 5.3 of FDES presents a cross-cutting application of FDES to the issues of climate change.
46. In FDES, climate change-related statistics are organised in four blocks based on the sequence of climate change-related events used by the Intergovernmental Panel on Climate Change (IPCC):
• Climate process drivers
• Climate change evidence
• Climate change impacts and vulnerability
• Mitigation and adaptation

15
3. SELECTION OF THE SET OF CORE CLIMATE CHANGE-RELATED INDICATORS
47. This chapter describes the methodological approach for the selection of the set of 44 core climate change-related indicators by the Task Force. Sections 3.1 - 3.4 describe the methodological approach for the selection of the initial set of 39 core climate change-related indicators. Section 3.5 presents the refinement of the initial set of indicators, which took place after adoption by CES in June 2017.
48. The final output of the Task Force is presented in chapter 4.
3.1 Basic principles: hierarchical approach and definitions
49. As the first step, the Task Force agreed on a set of basic principles for its work, including the main terminology and the hierarchical relationship between the CES framework, policy questions, indicators and data sources (statistics and other data) (see Figure 2).
50. The basis for developing the methodology of indicator selection were the CES Recommendations and its five areas that define the scope of climate change-related statistics (presented in the first row of Figure 2).
Figure 2 Hierarchical relationship of the scope of climate change-related statistics, policy questions and other information demand, indicators, and data sources (statistics and other data)
The boxes with “…” are placeholders for the two areas impacts and adaptation, their policy questions and indicators (which are not displayed due to space limitations)
51. Subsequently, the Task Force looked at policy questions and grouped the policy questions and other information demand into the five areas to identify the data needs related to climate change (second row of Figure 1, ‘PQ’). The relation between the areas of climate change-related statistics and policy questions is 1:n.
52. The policy questions were further broken down into indicators and the required underlying data. One or more indicators are needed to reply to a policy question (1:n relation), and more than one data

CES Set of Core Climate Change-related Indicators and Statistics Using SEEA
16
source may be needed to produce an indicator (m:n relation). The underlying data can originate from SEEA, other official statistics, or from data that is not part of the statistical system. In some cases, the required data might not be available.
53. The Terms of Reference of the Task Force use the terms “key climate change-related indicators” and “key climate change-related statistics”, for which clear definitions were needed. As mentioned earlier, the term “key” was later replaced by “core”. The Task Force agreed on the following two definitions:
• Core climate change-related indicators were defined as indicators that are needed to respond to main climate change policy questions and help paint the big picture of climate change-related phenomena. Thanks to that, the set of core climate change-related indicators is resilient and remains relevant even if some detailed policy questions change. Considering the final number of selected indicators (44) and following the terminology used in other indicator frameworks (such as the OECD Environmental Indicators, OECD, 2003), the term “core climate change-related indicators” was adopted for “key climate change-related indicators”.
• Core climate change-related statistics were defined as the basic statistics needed to derive the core climate change-related indicators and to compile emission inventories.
54. Inspired by Eurostat’s publication Towards a harmonised methodology for statistical indicators (Eurostat, 2014), the Task Force suggested developing an accompanying set of operational and contextual indicators, which can better address more specific information needs and provide a certain context:
• Operational indicators include indicators providing a sectorial or spatial breakdown of a given core indicator (e.g. GHG emissions per economic activity);
• Contextual indicators provide important background information (e.g. consumption of fossil fuels as contextual information for a core indicator on GHG emissions).
55. The main idea is that the set of core climate change-related indicators is produced and disseminated by all NSOs, whereas the selection of operational and contextual indicators depends on country-specific factors, such as size, climatic conditions, specific vulnerabilities to climate change, economic development or main economic activities. Countries are free to decide which operational and contextual indicators they choose to accompany the set of core climate change-related indicators.
56. Furthermore, the Task Force decided to suggest “proxy indicators” for some of the core indicators, in case there is no internationally agreed methodology (tier III) or countries currently cannot compile them (e.g. some of the residence-based indicators).
57. The recommended operational, contextual and proxy indicators are discussed in detail in chapter 4.
3.2 Selection procedure
58. The selection procedure for the initial set of core climate change-related indicators included the following steps:
• Identification of the first set of policy questions and related indicators derived from the most important climate change-related frameworks, studies, reports and international and national climate change-related indicator sets (e.g. the targets and their proposed indicators or the climate change indicators of the European Environment Agency (EEA)) (see chapter 6 for a full list of reference documents). 140 policy questions and 205 related indicators were identified in this step.
• Grouping the policy questions under the so-called “umbrella questions” with a broader scope, which reduced the 140 policy questions to 39 umbrella questions. Each umbrella question was

3. Selection of the set of core climate change-related indicators
17
assigned to one of the five areas - drivers, emissions, impacts, mitigation and adaptation. See annex III with the “umbrella questions”.
• Ranking the set of umbrella questions by relevance; the ranking was the output of a survey presented to the participants of the Expert Forum for producers and users of climate change-related statistics (Geneva, 2-3 September 2015).
• Selection of a preliminary set of core indicators related to policy questions with higher ranking on the basis of the criteria specified in the Eurostat (2014) methodology for the identification of headline indicators: relevance, soundness and measurability. Whenever possible, indicators having high relevance, sound methodology and high measurability (i.e. data availability) were selected as core indicators. At this stage, it was also decided to exclude indicators not relevant for a majority of the countries of the region, including indicators related to coastal areas or poverty. If relevant, countries can add such indicators in their national sets of climate change-related statistics and indicators (contextual indicators, see section 4.3).
• However, the Task Force acknowledged that for several policy relevant indicators, there is no internationally agreed methodology and/or data availability is poor. Given the high relevance of these indicators for policymakers, and to encourage countries to initiate data production, both the Expert Forum on Climate Change-related Statistics and the UN Committee of Experts on Environmental-Economic Accounting (UNCEEA) encouraged the Task Force to keep all relevant indicators in the set and recommended further work to develop methodologies and data sources. Therefore, also indicators without internationally agreed methodologies and/or poor data availability were kept in the list of indicators. The different degree of maturity of the selected indicators is described using “tier approach” similar to the one used for SDG indicators (see sub-section 3.3.1.2).
• Split of the 5 areas (drivers, emissions, impacts, mitigation and adaptation) into sub-areas (see sub-section 3.3.2) representing the most relevant themes per area. The split into sub-areas aimed to improve the comprehensiveness and coherence of the set, painting the “(big) picture of climate change-related issues”. In the case of sub-areas with no core indicators originating from the steps above, the Task Force tried to fill gaps with appropriate indicators identified at earlier steps.
• Further revisions were carried out based on feedback received from the Steering Group and UNCEEA.
59. As a result of the steps described above, by July 2016, the Task Force had identified 39 core climate change-related indicators (8 indicators for drivers, 7 for emissions, 13 for impacts, 6 for mitigation, and 5 for adaptation, see annex II). A survey on data availability for these indicators in CES member countries was carried out in August/September 2016. The 41 responses were used for a final review and to identify issues related to implementation and follow-up work.
60. As requested by CES in 2017, the Task Force under its renewed mandate refined the set of core climate change-related indicators, now resulting in a total number of 44 indicators. The refinement process is outlined in more detail in section 3.5.
61. The next section describes some basic methodological choices taken during the selection procedure.

CES Set of Core Climate Change-related Indicators and Statistics Using SEEA
18
3.3 Specific methodological choices
3.3.1 Coverage issues
3.3.1.1 Disaggregation
62. Some indicators can be broken down according to different parameters (e.g. economic activities or products), e.g. GHG emissions for selected economic activities or households. The Task Force recommended as a general rule to classify these kinds of indicators (the sectorial breakdowns) as operational indicators rather than core indicators and to exclude them from the list of selected core indicators.
3.3.1.2 Relevant indicators without agreed international methodology or where data are lacking
63. As described in section 3.2, the core indicators were selected from among those with high relevance, sound methodology and high measurability (i.e. data availability). However, for a number of highly relevant indicators, methodological soundness and/or measurability are not rated high. Examples are the share of climate change-related subsidies and similar transfers per GDP and the share of climate change mitigation expenditure to GDP, for which data are available only for a few countries. In these latter two cases, the Task Force considered these as very important mitigation indicators that should remain on the list of core indicators. The same applies to indicators referring to adaptation expenditures which are important but not well defined. A tier approach used for SDG indicators was introduced to keep these indicators in the set while identifying the different levels of maturity:
• Tier 1: Indicator conceptually clear, established methodology and standards available and data regularly produced by countries.
• Tier 2: Indicator conceptually clear, established methodology and standards available, but data are not regularly produced by countries.
• Tier 3: Indicator for which there are no established methodology and standards or methodology/standards are being developed/tested.
64. Data availability can be heterogeneous in countries, depending on national circumstances. For the purpose of this work, data availability is ranked high when several countries (but not necessarily all) produce the data. For other countries, the list of core indicators could provide an incentive for starting to produce the necessary data regularly.
3.3.1.3 SDG indicators
65. The Task Force took into account SDGs and relevant issues raised in the context of the 2030 Agenda both in the process and in the outcome of the work. In the process, the Task Force considered all the proposed SDG indicators (February 2015) related to climate change in the initial set of 205 indicators. The set was later checked against the final list of SDG indicators (March 2016). As an outcome, the set of core climate change-related indicators includes a number of SDG indicators. However, not all climate change-related SDG indicators are automatically part of the set of core climate change-related indicators. Reasons for that are:
• Several climate change-related SDG indicators are global indicators, which cannot be applied at the national level.
• The criteria for the selection of SDG indicators are different from those for the set of core climate change-related indicators.

3. Selection of the set of core climate change-related indicators
19
• Many of the proposed SDG indicators are climate change-related but focus on one specific topic (such as poverty or health). Therefore, according to the chosen criteria, they do not qualify as core indicators but rather as contextual or operational indicators.
• Including all the climate-related SDG indicators in the set of core indicators would lead to a much bigger set and uneven distribution across the five main areas. It would also undermine some of the agreed concepts (such as the criteria of relevance, soundness and measurability, or providing activity breakdowns only according to ISIC).
3.3.1.4 Data sources: dual measurement
66. The terms of reference of the Task Force explicitly mention that the internationally comparable set of core climate change-related statistics and indicators should be derived from the System of Environmental-Economic Accounting and other sources, such as the United Nations Framework for the Development of Environment Statistics (FDES, UNSD, 2013)).
67. For indicators related to air emissions and energy, the choice of the data source is not straightforward. In the case of indicators related to air emissions, on the one hand SEEA-based data availability is improving since more and more countries are implementing SEEA Air Emission Accounts. On the other hand, most international and national GHG-related policy targets and their measurement refer to GHG inventories reported under UNFCCC. These GHG inventories record GHG emissions on the national territory (territorial principle) and use a specific sector classification. SEEA Air Emission Accounts follow the residence principle (emissions are allocated to the country of residence, even if it physically happens outside the national territory), and activities are classified according to the ISIC economic activity classification. When deciding on the recommended data source for the core set of indicators (GHG inventories or SEEA Air Emission Accounts), the following should be taken into consideration:
• The indicator should be defined on the information need rather than the underlying data sets. Climate change-related information needs can refer to both GHG emissions on the national territory (e.g. GHG reduction goals usually refer to emissions generated on the national territory) and GHG emissions of its resident entities (e.g. GHG emission intensities and carbon footprint, which includes embedded emissions in imports, can benefit from statistics following the residence principle).
• There is an ongoing process to align SDG indicators with SEEA.
• Conceptual differences between GHG inventories and SEEA Air Emission Accounts can be shown via bridge tables.
• Any sectorial breakdown not compliant with ISIC will make further data integration (e.g. with economic statistics) more difficult and would not be in line with international statistical frameworks (such as SEEA or FDES).
• SEEA Air Emission Accounts are among the priority accounts to be implemented (priority by international organisations and many countries). Recommending SEEA Air Emission Accounts as a data source for certain core climate change-related indicators, would be an incentive for countries to start or accelerate the implementation.
68. Similar issues apply to energy-related indicators: energy data can originate either from energy balances of the International Energy Agency (IEA) following the territorial principle and specific industry classification, or national energy statistics and/or SEEA Energy Accounts that follow the residence principle and ISIC.
69. Taking into consideration the above, and the comments received from UNCEEA and the UNECE Steering Group on Climate Change-related Statistics, the Task Force adopted a dual approach: for all indicators that can also be derived from other sources than SEEA, a dual measurement should be
CES Set of Core Climate Change-related Indicators and Statistics Using SEEA
20
foreseen in the short term. This approach is consistent with the ongoing process of aligning SDG indicators with SEEA.
3.3.2 Thematic coverage within the five areas (drivers, emissions, impacts, mitigation and adaptation) and links between the areas
70. One of the goals of the list of core indicators was to “paint the (big) picture of the most relevant climate change-related issues”. Considering the small number of core indicators to be selected, it was critical to sub-divide each of the five areas into thematic sub-areas of highest priority and to find at least one indicator representing each sub-area. Using the same sub-areas across the five areas (as far as possible) allows to show the conceptual links between the areas. However, for drivers and emissions, only production, consumption and national total were distinguished5. Further disaggregation of drivers and emissions according to economic activities would have resulted in either a large set of indicators or, when using only a small set of indicators, in imbalances when comparing countries with a different socio-economic structure (which have different main drivers for GHG emissions). The chosen sub-areas per area are presented in Table 1.
Table 1 Areas and sub-areas of the set of climate change-related indicators
“X” indicates that this particular sub-area is used for the area shown in the column and at least one core indicator could be found; grey cells indicate that this particular sub-area does not apply for the area in the column.
Sub-area Areas
Drivers Emissions Impacts Mitigation Adaptation
National total X X X
Production X X
Consumption X X
Physical conditions
X
Water resources
X
X
Land, land cover, ecosystems and biodiversity
X
Human settlements and human health
X
X
Agriculture, forestry and fishery * * X X X
Energy resources
X
Environmental governance and regulation
X
Expenditures
X X
* The set of core indicators intentionally does not break down drivers and emissions according to economic sectors.
3.3.3 Number of core indicators, spatial and temporal references
71. The Task Force set the total maximum number of initial core indicators at 40. An important target was to find at least one indicator per sub-area. An even distribution across the five areas (drivers,
5 “National total” in the context of drivers and emissions means that both production and consumption activities are included in the indicator.
3. Selection of the set of core climate change-related indicators
21
emissions, impacts, mitigation, adaptation) was not deemed crucial. The actual distribution, with a larger number of indicators for the ‘impact’ area, is due to the specific features of this area.
72. After the refinement process (see section 3.5), the total number of core climate change-related indicators is 44 (including two placeholders).
73. The spatial reference of the indicators is national and the temporal reference is annual. The consideration of sub-national and seasonal phenomena, where relevant, can be done with operational indicators (see section 4.1.3).
3.4 Role of SEEA Central Framework and the Framework for the Development of Environment Statistics in the selection procedure
3.4.1 SEEA Central Framework
74. Consistently with the Task Force’s mandate (see annex I) that explicitly mentions SEEA as one of the main sources, SEEA was used in the selection procedure during three steps:
• First, SEEA-CF was thoroughly analysed to identify policy questions and related indicators. In particular, the paper “SEEA as a framework for assessing policy responses to climate change” (UNCEEA, 2010, drafted by Statistics Netherlands) provided an important source for policy questions and possible indicators derived from the SEEA Central Framework
• Second, the corresponding SEEA account was identified for all the selected policy questions and related indicators. The link is also maintained in the survey on data availability carried out in summer 2016)
• Third, following the Terms of Reference of the Task Force and the recommendations of UNCEEA (June 2016), SEEA was used as a basis for all indicators, where feasible. For all indicators that can also be derived from other sources than SEEA, a dual measurement is foreseen in the short term. This is consistent with the ongoing process of aligning SDG indicators with SEEA.
75. The main reasons for using SEEA as a basis for the indicators are the SEEA’s specific features presented in sub-section 2.3.1 and the need to ensure the harmonisation of the indicator compilation between countries. Additional reasons relate to the possible future extension of the current list of indicators to include operational indicators.
76. In this regard, SEEA provides a suitable framework for identifying operational indicators since the ISIC breakdown of several SEEA accounts allows integration with economic data.
3.4.2 United Nations Framework for the Development of Environment Statistics
77. Many topics and individual statistics that fall under different components of FDES may be used to provide information on the different aspects of climate change, in particular for those indicators that are not included in SEEA or other frameworks. FDES, and more specifically the statistics identified as having a link with climate change (contained in FDES section 5.3 “Climate Change”), was used in the selection procedure to carry out a cross-check of the completeness of the list of core indicators. Consistency of thematic coverage of the climate change-related statistics was ensured by verifying if the main sub-components mentioned in FDES section 5.3 were represented in the preliminary list of core climate change-related indicators.

CES Set of Core Climate Change-related Indicators and Statistics Using SEEA
22
3.5 Refinement of the initial set of core climate change-related indicators
78. After the endorsement of the report on the initial set of 39 core indicators by CES in June 2017 (see annex II), a pilot implementation was conducted in the second half of 2017 to test the initial set of core climate change-related indicators. The main results of the pilot implementation, presented in Section 3.5.1, were discussed at the Expert Forum for Producers and Users of Climate Change-related Statistics in October 2017, which provided important input for the subsequent refinement process.
79. Section 3.5.2 lists the methodological choices agreed upon by the Task Force for the refinement process as far as general issues are concerned, while ad hoc work was carried out in the case of adaptation indicators, as explained in Section 3.5.3.
3.5.1 2017 pilot implementation
80. Ten countries (Belarus, Georgia, Hungary, Israel, Latvia, Lithuania, Luxembourg, Poland, Russian Federation and Ukraine) and FAO participated in the pilot implementation carried out in summer 2017 to test the initial set of core climate change-related indicators. The following main results of the pilot implementation were presented at the Expert Forum for Producers and Users of Climate Change-related Statistics in October 2017:
• Time series for 10 indicators can be produced by more than 85% of the countries
• For five indicators6, less than 10% of the countries were able to produce at least one figure. The main reason was the lack of a clear indicator methodology
• For the 16 tier-I indicators, there were no problems with the methodology
• For some of the 6 tier-II indicators, it was suggested to improve the description of the methodology
• For the 17 tier-III indicators, improvement of the methodology is required.
81. The feedback received was taken into account by the Task Force together with other inputs received for defining criteria for the subsequent refinement process, described in the following section.
3.5.2 Refinement procedure – methodological choices
82. In order to identify changes to be introduced during the refinement process, the Task Force analysed feedback and input received at various stages, namely from the mentioned electronic consultation, CES, the 2017 UNECE Expert Forum on climate change-related Statistics, the pilot implementation of the initial core set and from members of the Steering Group on Climate Change-related Statistics.
83. The review of all inputs received allowed the group to define general principles for the refinement procedure as well as specific changes. This section lists the main principles and general criteria for revision and refinement.
84. All changes resulting from the implementation of the general criteria as well as additional specific revisions are presented in chapter 4 (sub-section 4.1.2). They include changes due to the consultation of specialised agencies (such as WHO and WMO) and experts, as in the case of the United Nations Committee of Experts on Environmental-Economic Accounting (UNCEEA), that provided crucial input
6 21-Proportion of land that is degraded over total land area, 38-Progress towards sustainable forest management, 30-Share of climate change mitigation expenditure relative to GDP, 35-Share of government adaptation expenditure to GDP, 19-Cumulative number of alien species

3. Selection of the set of core climate change-related indicators
23
for the revision of so-called ‘dual indicators’. The Task Force’s work to identify operational and contextual indicators is covered in sections 4.1.3 and 4.3.
85. The following main principles and general criteria for revision and refinement were agreed upon by the Task Force:
• General criteria for replacing and adding indicators to the core set:
o Generally, indicators should only be replaced when better indicators are available which fulfil the criteria of relevance, methodological soundness and data availability.
o For the set of adaptation indicators, it was recognised that the replacement or addition of indicators might be needed beyond the general rule due to the particularly dynamic feature of this area and the related developments both at the global level (e.g. Paris Agreement reporting requirements) and at the regional one (e.g. ongoing work of EEA). See also the specific section on the revision of adaptation indicators.
• Indicators that measure climate and weather directly (for example, anomalies and extremes of temperature and precipitation) can be part of the core set of climate change-related indicators.
o According to the CES Recommendations, the narrow definition of climate change-related statistics does not include measuring climate and weather directly, as it is usually done outside the national statistical system. However, the Task Force decided to include these indicators in the list as they are necessary for the measurement of anomalies and extreme climate indices, and to keep the full picture of the most relevant phenomena related to climate change.
• Lack of underlying data should not be a sufficient reason to delete or replace a highly relevant indicator. Keeping such indicators in the set can be an incentive for countries to develop an action plan to produce the required statistics in the medium term or long term.
• Indicators for which only punctual data for a single year are available can be part of the core set.
• In the case of indicators for which only small changes between years are expected (e.g. indicators related to the use of land), the methodological sheets will indicate a suitable reporting frequency.
• It should be possible for countries to calculate the core indicators by themselves, even if an international organisation makes country data available based on their own data sources and calculations. Indicators calculated by national organisations should be given priority unless data quality issues require the use of data from international organisations.
3.5.3 Special case: climate change adaptation indicators
86. Selecting indicators for climate change adaptation proved to be challenging since there is no internationally harmonised set of adaptation indicators available. After consulting with experts of the European Environment Agency (EEA) and UNFCCC, different opinions emerged on how to develop a set of adaptation indicators.
87. This area is very dynamic, and both countries and international organisations have gained experience in measuring climate change adaptation. Therefore, the Task Force decided to deviate from its general principles for the refinement procedure and to completely review its initial set of climate change adaptation indicators to take into account new guidelines (e.g. in regard to reporting under the Paris Agreement), methodological developments and experiences of countries and international organisations (e.g. the European Environment Agency).
CES Set of Core Climate Change-related Indicators and Statistics Using SEEA
24
88. The selection of climate change adaptation indicators is based on the following decisions of the Task Force:
• To adopt the EEA conceptual distinction of process-based and outcome-based indicators
• To show the close relationship between impact and adaptation indicators by using the same set of sub-areas (see Table 1)
• To present outcome-based indicators in the area “impacts” only without repeating them in the adaptation area. Ideally, there would be a pair of indicators (a process-based one under adaptation and a corresponding outcome-based one under impact); however, this was not possible in all cases for practical reasons. Therefore, the pairing is mainly represented by using the same sub-areas as explained above.
89. The following steps were taken to find appropriate adaptation indicators:
(a) The starting point for identifying a set of adaptation indicators were the sub-areas. They defined which kind of information (i.e. indicators) should be available;
(b) A literature review was carried out (as recommended by the European Environment Agency: UK adaptation indicators, German Strategy for Adaptation to Climate Change and an EEA technical paper for the development of adaptation indicators (EEA / ETC/CCA, 2018);
(c) Some sub-areas were added based on the literature review;
(d) Finally, appropriate indicators for each sub-area were taken from the list of indicators collected by the Task Force at the beginning of its work and the above-mentioned literature.
90. In the refinement process, the Task Force looked into many recent developments related to measuring climate change adaptation, such as:
• The developments of the SDG indicators metadata
• Efforts of the UNFCCC Adaptation Committee
• Various measurement approaches described in the UNEP Adaptation Gap Report
• A regional analysis of a few national adaptation indicator sets by EEA
• Insights from the global work on the indicators carried out by UNSD
91. Based on the findings, the Task Force concluded that:
• The Paris Agreement has accelerated the discussions on measuring and assessing adaptation actions at national and global levels. However, the adaptation goal of the Paris Agreement is qualitative, and countries will have flexibility in how they report on their adaptation actions.
• It is challenging to identify adaptation indicators that are internationally comparable and policy relevant. Policy relevant adaptation indicators should be suited to the national and local contexts, which vary within the UNECE region. Indicators on the number of risk reduction strategies or policies are comparable but of limited relevance.
• Only a few countries have developed national indicator sets so the Task Force could only evaluate the availability in this small sample.
• Even to show a general picture of climate change adaptation, many indicators would be needed. Indicators should cover vulnerability, adaptation actions (input), improved adaptive capacity (output) or reduced impacts (outcome) and give a breakdown by the locally relevant hazards. The most relevant hazards in UNECE region (and also relevant globally) include floods, heat waves and resulting droughts.
92. Therefore, the core adaptation indicators can only signal the most important issues and, in the national context, should be accompanied by a selection of contextual indicators.

3. Selection of the set of core climate change-related indicators
25
93. During the refinement procedure, in consultation with the Expert Forum for Producers and Users of Climate Change-related Statistics (October 2019), the Task Force decided to:
(a) Keep indicator “35 - Share of government adaptation expenditure to GDP” from the initial indicator set as a tier III indicator because of its policy relevance;
(b) Keep indicators “36 - Change in water-use efficiency over time” and “39 - Proportion of agricultural area under productive and sustainable agriculture”, which are SDG indicators 6.4.1 and 2.4.1 respectively, and update their metadata sheets in line with the developments of the SDG metadata, since they were reclassified to a higher tier;
(c) Replace the core indicator “37 - Proportion of population living in dwellings with air conditioners” with an indicator on the share of green spaces in cities. A wealth of material is available on the benefits of green spaces and healthy ecosystems and the services that they provide for climate change adaptation and building resilience, including from the IPCC, IUCN, and UNFCCC efforts on ecosystem-based adaptation under the Adaptation Committee, Least Developed Countries Expert Group and Nairobi Work Programme;
(d) Review the need of the indicator "38 - Progress towards sustainable forest management" in the set of core climate change-related indicators;
(e) Recommend a review of the set of core adaptation indicators by a small task team under the CES Steering Group on Climate Change-related Statistics in the future to take into account possible further developments;
(f) Recommend further research on an indicator related to consumption of energy for cooling/heating purposes and make the initial indicator “Proportion of population living in dwellings with air conditioners” contextual.

CES Set of Core Climate Change-related Indicators and Statistics Using SEEA
26
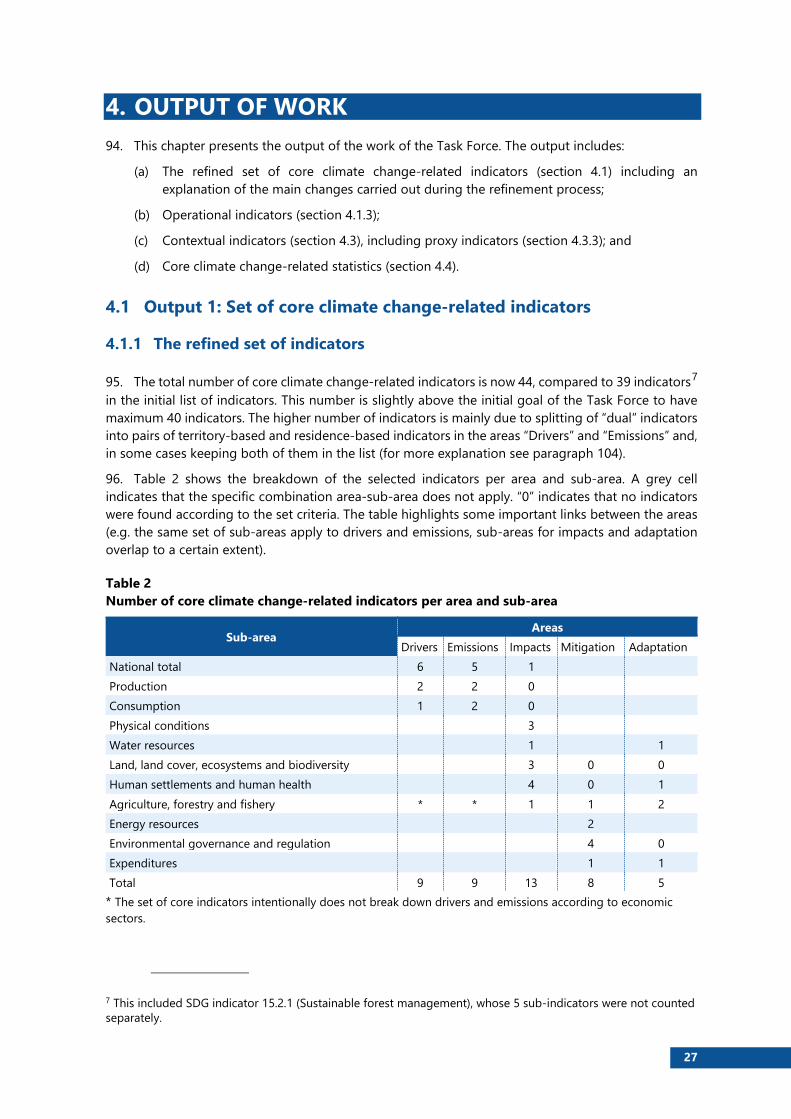
27
4. OUTPUT OF WORK 94. This chapter presents the output of the work of the Task Force. The output includes:
(a) The refined set of core climate change-related indicators (section 4.1) including an explanation of the main changes carried out during the refinement process;
(b) Operational indicators (section 4.1.3);
(c) Contextual indicators (section 4.3), including proxy indicators (section 4.3.3); and
(d) Core climate change-related statistics (section 4.4).
4.1 Output 1: Set of core climate change-related indicators
4.1.1 The refined set of indicators
95. The total number of core climate change-related indicators is now 44, compared to 39 indicators7 in the initial list of indicators. This number is slightly above the initial goal of the Task Force to have maximum 40 indicators. The higher number of indicators is mainly due to splitting of “dual” indicators into pairs of territory-based and residence-based indicators in the areas “Drivers” and “Emissions” and, in some cases keeping both of them in the list (for more explanation see paragraph 104).
96. Table 2 shows the breakdown of the selected indicators per area and sub-area. A grey cell indicates that the specific combination area-sub-area does not apply. “0” indicates that no indicators were found according to the set criteria. The table highlights some important links between the areas (e.g. the same set of sub-areas apply to drivers and emissions, sub-areas for impacts and adaptation overlap to a certain extent).
Table 2 Number of core climate change-related indicators per area and sub-area
Sub-area Areas
Drivers Emissions Impacts Mitigation Adaptation National total 6 5 1
Production 2 2 0
Consumption 1 2 0
Physical conditions
3
Water resources
1
1 Land, land cover, ecosystems and biodiversity
3 0 0
Human settlements and human health
4 0 1 Agriculture, forestry and fishery * * 1 1 2 Energy resources
2
Environmental governance and regulation
4 0 Expenditures
1 1
Total 9 9 13 8 5 * The set of core indicators intentionally does not break down drivers and emissions according to economic sectors.
7 This included SDG indicator 15.2.1 (Sustainable forest management), whose 5 sub-indicators were not counted separately.

CES Set of Core Climate Change-related Indicators and Statistics Using SEEA
28
97. Indicators on “impact” are slightly over-represented in the set. This can be explained by the bigger number of sub-areas to be addressed by impact indicators. Several of the impact indicators also serve as outcome-based adaptation indicators.
98. The complete list of indicators and their link to global policy frameworks and SEEA is presented in Table 3.
Table 3 Refined set of core climate change-related indicators
Area Sub-area ID* Indicator Tier
Indicator conceptually identical with indicator from
Can be produced from SEEA
Inputs from FDES-
themes**** SDGs** SF DRR***
Driv
ers
National total 1a Total energy use by the national economy
II Energy 2.2.2
1b Total primary energy supply (TPES)
I 2.2.2
2a Share of fossil fuels in total energy use by the national economy8
III Energy 2.2.2
2b Share of fossil fuels in total primary energy supply (TPES) 9
I 2.2.2
3 Losses of land covered by (semi-) natural vegetation
III Land 1.2.1
4 Total support for fossil fuels in relation to GDP
III Transactions
Production 5a Total energy intensity of production activities of the national economy
II Energy 2.2.2
6a Total CO2 intensity of energy used in production activities
II Energy, air emissions
2.2.2 3.1.1
8 Indicators 2a and 29a. These indicators are not complementary with each other and play different roles in the set. Indicators 2a and 29a are both tier III; for this reason, technical details explaining the differences between them that make them non-complementary cannot be specified further and will be provided once the methodology for indicators will be developed. 9 Indicators 2b and 29b appear to be complementary, but they are not for the following (main) technical reasons: 1. Total final energy consumption does not include energy products used in transformation processes by energy industries (excluded in the concept of final consumption in energy balances) whereas TPES includes it. 2. Fossil fuels and renewable sources do not add up to total energy resources because nuclear energy does not belong to any of the two categories. Therefore, indicators 2b and 29b are not complementary and play different roles within the set.

4. Output of work
29
Area Sub-area ID* Indicator Tier
Indicator conceptually identical with indicator from
Can be produced from SEEA
Inputs from FDES-
themes**** SDGs** SF DRR***
of the national economy
Consumption 8a Energy use by resident households per capita
I Energy 2.2.2
Emiss
ions
National total 9a Total greenhouse gas emissions from the national economy
I Air emissions 3.1.1
9b Total greenhouse gas emissions from the national territory
I 3.1.1
10a CO2 emissions from fuel combustion attributable to the national economy
III Air emissions 3.1.1
10b CO2 emissions from fuel combustion within the national territory
I 3.1.1
11 Greenhouse gas emissions from land use change (LULUCF)
I Air emissions,
carbon accounting
3.1.1
Production 12 Total greenhouse gas emissions from production activities
I Air emissions 3.1.1
13 Greenhouse gas emission intensity of production activities
I Air emissions 3.1.1
Consumption 14 Direct greenhouse gas emissions from households
I Air emissions 3.1.1
15 Carbon footprint II Air emissions 3.1.1
Impa
cts
National total 24 Direct economic loss attributed to hydro-meteorological disasters in relation to GDP
II 11.5.2 (tier II) C-1 4.1.2
Physical Conditions
16 Mean temperature anomaly (compared to climate normal 1961 - 1990)
I 1.1.1
17 Percentage of land area suffering from unusually wet or dry
I 1.1.1

CES Set of Core Climate Change-related Indicators and Statistics Using SEEA
30
Area Sub-area ID* Indicator Tier
Indicator conceptually identical with indicator from
Can be produced from SEEA
Inputs from FDES-
themes**** SDGs** SF DRR***
conditions (Standard Precipitation Index)
23 Occurrence of extremes of temperatures and precipitation
I 4.1.1
Water resources
18 Level of water stress: freshwater withdrawal as a proportion of available freshwater resources
I 6.4.2 (tier I) Water 2.6.1
Land, land cover,
ecosystems and
biodiversity
Placeholder for indicator on climate change impact on biodiversity
20 Carbon stock in soil III Carbon accounting
21 Proportion of land that is degraded over total land area
I 15.3.1 (tier I) Land and SEEA-EEA
Human settlements and human
health
22 Number of deaths and missing persons attributed to hydro-meteorological disasters, per 100,000 population
II 1.5.1, 11.5.1,13.1.1
(tier II)
A-1 4.1.1
25 Number of people whose destroyed dwellings were attributed to hydro-meteorological disasters
II B-4 4.1.2
26 Incidence of climate-related vector-borne diseases
II 5.2.3
27 Excess mortality related to heat
III
Agriculture, forestry and
fishery
28 Direct agricultural loss attributed to hydro-meteorological disasters
II C-2 Timber resources
and aquatic resources
4.1.2
Miti
gatio
n
Energy resources
29a Renewable energy share in total energy use by the national economy
III Energy 2.2.2

4. Output of work
31
Area Sub-area ID* Indicator Tier
Indicator conceptually identical with indicator from
Can be produced from SEEA
Inputs from FDES-
themes**** SDGs** SF DRR***
29b Renewable energy share in the total final energy consumption within the national territory
I 7.2.1 (tier I) 2.2.2
Expenditures 30 Share of climate change mitigation expenditure in relation to GDP
III Transactions 6.1.1
Environmental governance
and regulation
31 Share of energy and transport related taxes in total taxes and social contributions
I Transactions 6.2.2
32 Total climate change-related subsidies and similar transfers in relation to GDP
III Transactions 6.2.2
33 Average trading carbon price
I
34 Amounts provided and mobilized in United States dollars per year in relation to the continued existing collective mobilization goal of the $100 billion commitment through to 2025
II 13a.1 (tier II)
Agriculture, forestry and
fishery
81 Net emissions/removals of carbon dioxide by forest land
I Carbon accounting
3.1.1
Adap
tatio
n
Expenditures 35 Share of government adaptation expenditure in relation to GDP
III Transactions 6.1.1
Water resources
36 Change in water use efficiency over time
I 6.4.1 (tier I) Water 2.6.1 2.6.2
Human settlements and human
health
82 Share of green urban areas in the total area of cities
III SEEA-EA 1.2.1
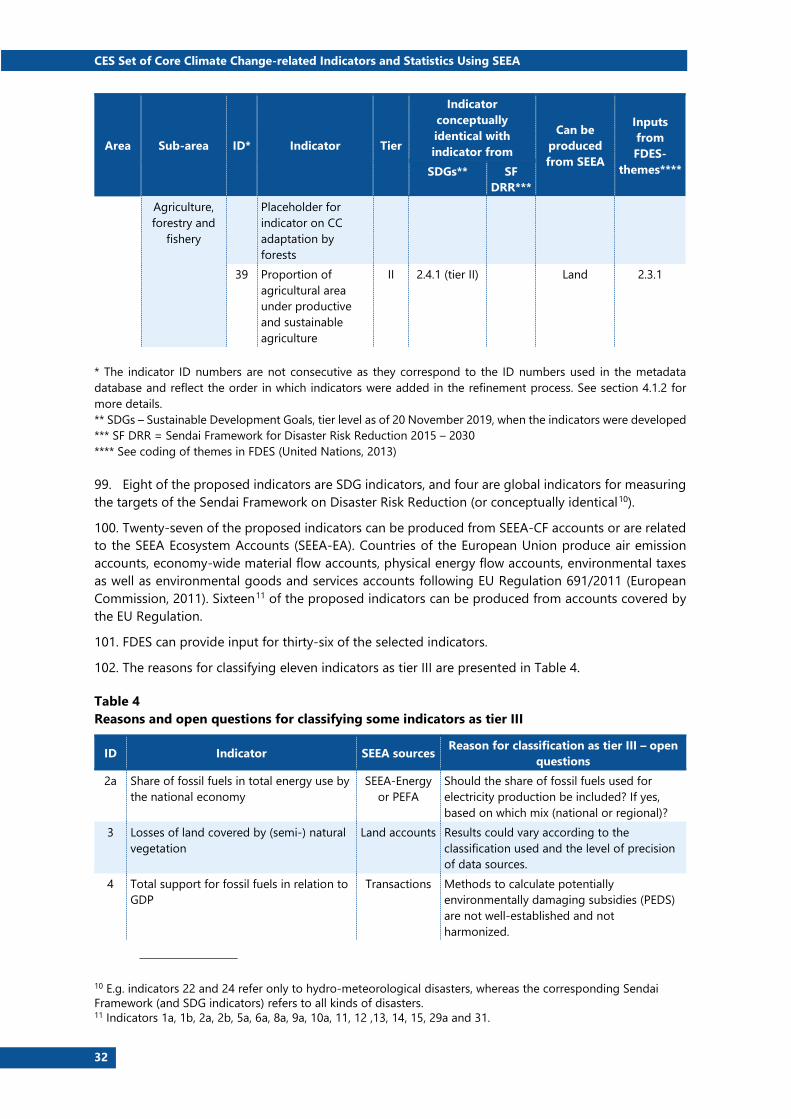
CES Set of Core Climate Change-related Indicators and Statistics Using SEEA
32
Area Sub-area ID* Indicator Tier
Indicator conceptually identical with indicator from
Can be produced from SEEA
Inputs from FDES-
themes**** SDGs** SF DRR***
Agriculture, forestry and
fishery
Placeholder for indicator on CC adaptation by forests
39 Proportion of agricultural area under productive and sustainable agriculture
II 2.4.1 (tier II) Land 2.3.1
* The indicator ID numbers are not consecutive as they correspond to the ID numbers used in the metadata database and reflect the order in which indicators were added in the refinement process. See section 4.1.2 for more details. ** SDGs – Sustainable Development Goals, tier level as of 20 November 2019, when the indicators were developed *** SF DRR = Sendai Framework for Disaster Risk Reduction 2015 – 2030 **** See coding of themes in FDES (United Nations, 2013)
99. Eight of the proposed indicators are SDG indicators, and four are global indicators for measuring the targets of the Sendai Framework on Disaster Risk Reduction (or conceptually identical10).
100. Twenty-seven of the proposed indicators can be produced from SEEA-CF accounts or are related to the SEEA Ecosystem Accounts (SEEA-EA). Countries of the European Union produce air emission accounts, economy-wide material flow accounts, physical energy flow accounts, environmental taxes as well as environmental goods and services accounts following EU Regulation 691/2011 (European Commission, 2011). Sixteen11 of the proposed indicators can be produced from accounts covered by the EU Regulation.
101. FDES can provide input for thirty-six of the selected indicators.
102. The reasons for classifying eleven indicators as tier III are presented in Table 4.
Table 4 Reasons and open questions for classifying some indicators as tier III
ID Indicator SEEA sources Reason for classification as tier III – open questions
2a Share of fossil fuels in total energy use by the national economy
SEEA-Energy or PEFA
Should the share of fossil fuels used for electricity production be included? If yes, based on which mix (national or regional)?
3 Losses of land covered by (semi-) natural vegetation
Land accounts Results could vary according to the classification used and the level of precision of data sources.
4 Total support for fossil fuels in relation to GDP
Transactions Methods to calculate potentially environmentally damaging subsidies (PEDS) are not well-established and not harmonized.
10 E.g. indicators 22 and 24 refer only to hydro-meteorological disasters, whereas the corresponding Sendai Framework (and SDG indicators) refers to all kinds of disasters. 11 Indicators 1a, 1b, 2a, 2b, 5a, 6a, 8a, 9a, 10a, 11, 12 ,13, 14, 15, 29a and 31.
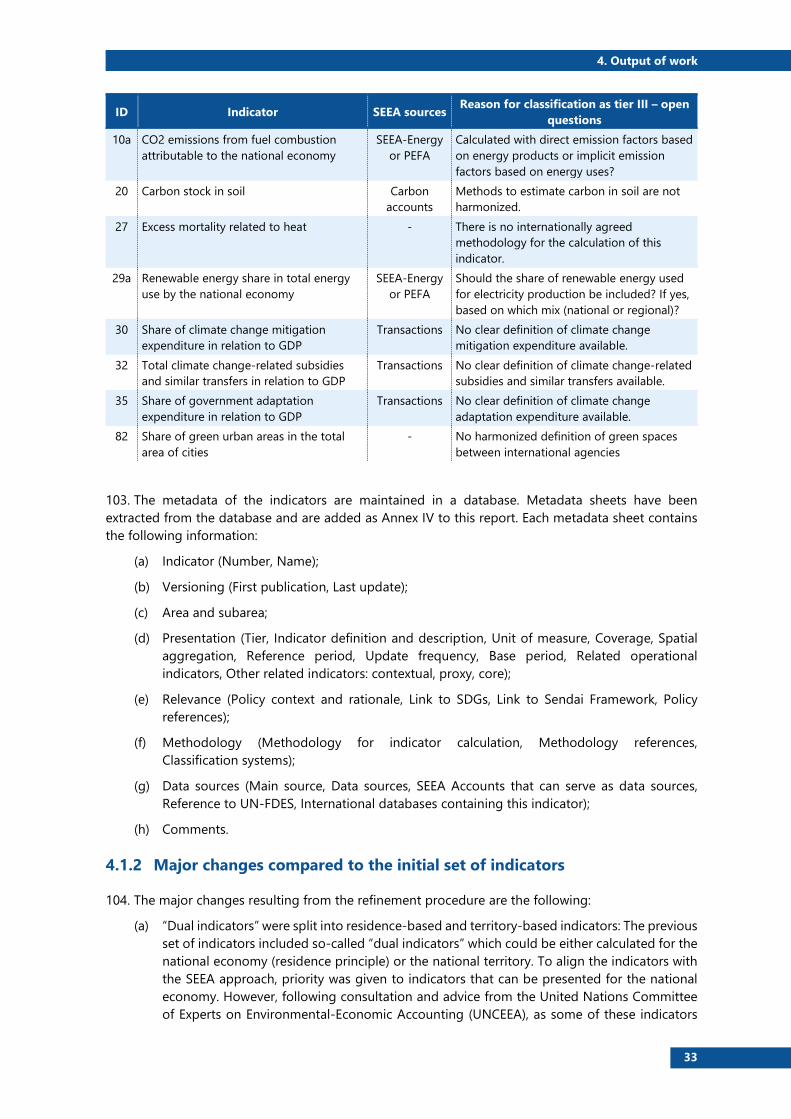
4. Output of work
33
ID Indicator SEEA sources Reason for classification as tier III – open questions
10a CO2 emissions from fuel combustion attributable to the national economy
SEEA-Energy or PEFA
Calculated with direct emission factors based on energy products or implicit emission factors based on energy uses?
20 Carbon stock in soil Carbon accounts
Methods to estimate carbon in soil are not harmonized.
27 Excess mortality related to heat - There is no internationally agreed methodology for the calculation of this indicator.
29a Renewable energy share in total energy use by the national economy
SEEA-Energy or PEFA
Should the share of renewable energy used for electricity production be included? If yes, based on which mix (national or regional)?
30 Share of climate change mitigation expenditure in relation to GDP
Transactions No clear definition of climate change mitigation expenditure available.
32 Total climate change-related subsidies and similar transfers in relation to GDP
Transactions No clear definition of climate change-related subsidies and similar transfers available.
35 Share of government adaptation expenditure in relation to GDP
Transactions No clear definition of climate change adaptation expenditure available.
82 Share of green urban areas in the total area of cities
- No harmonized definition of green spaces between international agencies
103. The metadata of the indicators are maintained in a database. Metadata sheets have been extracted from the database and are added as Annex IV to this report. Each metadata sheet contains the following information:
(a) Indicator (Number, Name);
(b) Versioning (First publication, Last update);
(c) Area and subarea;
(d) Presentation (Tier, Indicator definition and description, Unit of measure, Coverage, Spatial aggregation, Reference period, Update frequency, Base period, Related operational indicators, Other related indicators: contextual, proxy, core);
(e) Relevance (Policy context and rationale, Link to SDGs, Link to Sendai Framework, Policy references);
(f) Methodology (Methodology for indicator calculation, Methodology references, Classification systems);
(g) Data sources (Main source, Data sources, SEEA Accounts that can serve as data sources, Reference to UN-FDES, International databases containing this indicator);
(h) Comments.
4.1.2 Major changes compared to the initial set of indicators
104. The major changes resulting from the refinement procedure are the following:
(a) “Dual indicators” were split into residence-based and territory-based indicators: The previous set of indicators included so-called “dual indicators” which could be either calculated for the national economy (residence principle) or the national territory. To align the indicators with the SEEA approach, priority was given to indicators that can be presented for the national economy. However, following consultation and advice from the United Nations Committee of Experts on Environmental-Economic Accounting (UNCEEA), as some of these indicators
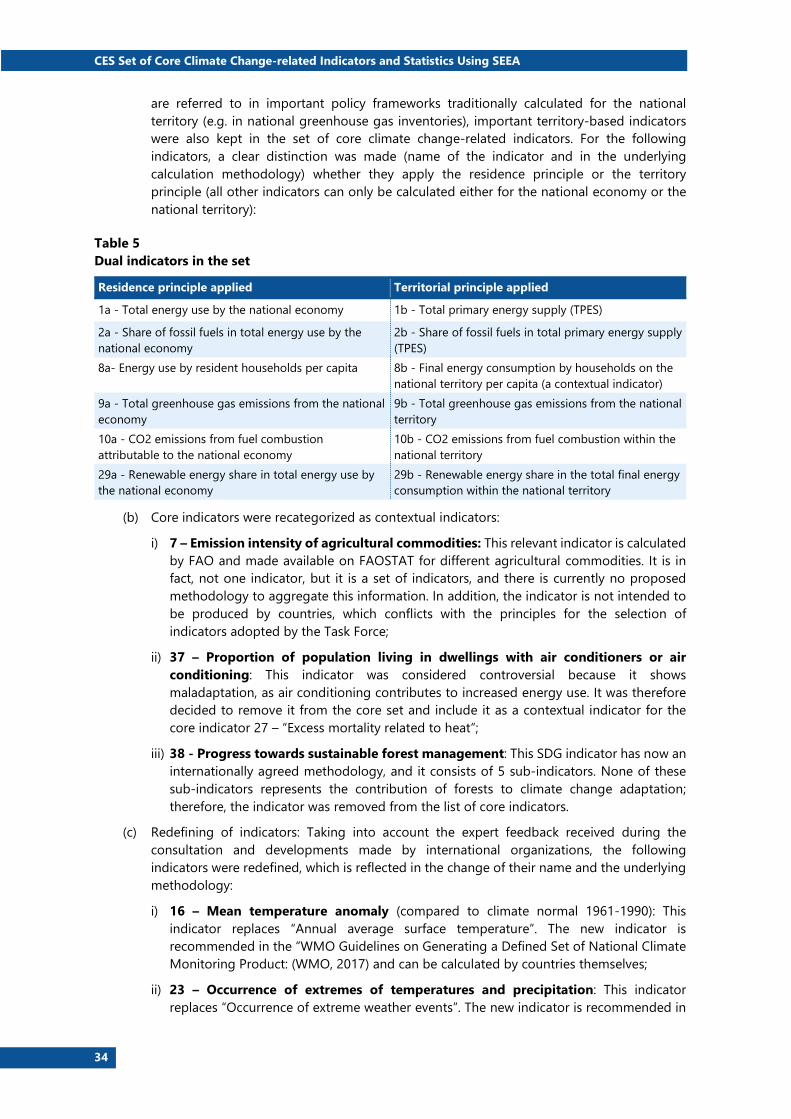
CES Set of Core Climate Change-related Indicators and Statistics Using SEEA
34
are referred to in important policy frameworks traditionally calculated for the national territory (e.g. in national greenhouse gas inventories), important territory-based indicators were also kept in the set of core climate change-related indicators. For the following indicators, a clear distinction was made (name of the indicator and in the underlying calculation methodology) whether they apply the residence principle or the territory principle (all other indicators can only be calculated either for the national economy or the national territory):
Table 5 Dual indicators in the set
Residence principle applied Territorial principle applied
1a - Total energy use by the national economy 1b - Total primary energy supply (TPES)
2a - Share of fossil fuels in total energy use by the national economy
2b - Share of fossil fuels in total primary energy supply (TPES)
8a- Energy use by resident households per capita 8b - Final energy consumption by households on the national territory per capita (a contextual indicator)
9a - Total greenhouse gas emissions from the national economy
9b - Total greenhouse gas emissions from the national territory
10a - CO2 emissions from fuel combustion attributable to the national economy
10b - CO2 emissions from fuel combustion within the national territory
29a - Renewable energy share in total energy use by the national economy
29b - Renewable energy share in the total final energy consumption within the national territory
(b) Core indicators were recategorized as contextual indicators:
i) 7 – Emission intensity of agricultural commodities: This relevant indicator is calculated by FAO and made available on FAOSTAT for different agricultural commodities. It is in fact, not one indicator, but it is a set of indicators, and there is currently no proposed methodology to aggregate this information. In addition, the indicator is not intended to be produced by countries, which conflicts with the principles for the selection of indicators adopted by the Task Force;
ii) 37 – Proportion of population living in dwellings with air conditioners or air conditioning: This indicator was considered controversial because it shows maladaptation, as air conditioning contributes to increased energy use. It was therefore decided to remove it from the core set and include it as a contextual indicator for the core indicator 27 – “Excess mortality related to heat”;
iii) 38 - Progress towards sustainable forest management: This SDG indicator has now an internationally agreed methodology, and it consists of 5 sub-indicators. None of these sub-indicators represents the contribution of forests to climate change adaptation; therefore, the indicator was removed from the list of core indicators.
(c) Redefining of indicators: Taking into account the expert feedback received during the consultation and developments made by international organizations, the following indicators were redefined, which is reflected in the change of their name and the underlying methodology:
i) 16 – Mean temperature anomaly (compared to climate normal 1961-1990): This indicator replaces “Annual average surface temperature”. The new indicator is recommended in the “WMO Guidelines on Generating a Defined Set of National Climate Monitoring Product: (WMO, 2017) and can be calculated by countries themselves;
ii) 23 – Occurrence of extremes of temperatures and precipitation: This indicator replaces “Occurrence of extreme weather events”. The new indicator is recommended in

4. Output of work
35
the “WMO Guidelines on Generating a Defined Set of National Climate Monitoring Product: (WMO, 2017) and can be calculated by countries themselves;
iii) 26 – Incidence of climate-related vector-borne diseases: This indicator replaces “Distribution of cases of vector-borne diseases” and is now classified as Tier II. The indicator was redesigned to take into account the feedback from electronic consultation and additional materials from WHO. It now includes the list of climate-sensitive vector-borne diseases with their ICD codes and provides the calculation methodology directly in the metadata sheet;
iv) 27 – Excess mortality related to heat: This indicator replaces “Heat-related mortality” and is now classified as Tier III. The indicator metadata were revised to reflect that although extreme high temperatures contribute directly to deaths from cardiovascular and respiratory diseases, this effect is difficult to measure directly and is usually estimated. The revised methodology includes information on an estimation method and the methodological challenges.
(d) New indicators - the following two indicators were added after consulting with the 2019 Expert Forum on Climate Change-related Statistics:
i) 81 – Net emissions/removals of carbon dioxide by forest land: The indicator was added to take into account the important role of forests in the region for the CO2 balance;
ii) 82 – Share of green urban areas in the total area of cities: This indicator was added as a result of reviewing the set of adaptation indicators. The Task Force considered it as relevant for climate change ecosystem-based adaptation in cities;
(e) Deleted core indicators and placeholders
i) Climate change impacts on biodiversity: The “Global Assessment Report on Biodiversity and Ecosystem Services” (IPBES 2019) considers climate change as the third-largest threat to biodiversity, after changes of land and sea use and direct exploitation, but climate change will soon be the largest threat. Experts of IUCN are currently exploring methods to measure the impact of climate change on biodiversity, but the attribution of biodiversity change to climate remains a challenge. After consulting IUCN experts, the Task Force decided to remove indicator 19 – Cumulative number of alien species and to add a placeholder for a future indicator on climate change impact to biodiversity instead;
ii) Contribution of forests to climate change adaptation: The forest sector contributes significantly to climate change adaptation in different ways, for example, as a protective forest, as an important regulator in the water cycle, by means of cooling and for recreation. The Task Force consulted the NSOs of Canada and Finland as well as experts from FAO and UNECE, and no appropriate indicator could be identified to represent the climate change adaptation function of forests. Therefore, the Task Force decided to add a placeholder for a future indicator. The initially recommended indicator 38 – Progress towards sustainable forest management (SDG indicator 15.2.1, now tier I) is actually a set of 5 sub-indicators and therefore does not fulfil the objective set by the Task Force of limiting the number of core indicators.
(f) Removal of sub-area “Extreme events and disasters”: As “extreme events and disasters” is thematically overlapping with other sub-areas, it was removed. The related indicators were allocated to other sub-areas as follows:
i) Indicator 22 ‘Number of deaths and missing persons attributed to hydro-meteorological disasters, per 100,000 population’, moved to “Human settlements and environmental health”;

CES Set of Core Climate Change-related Indicators and Statistics Using SEEA
36
ii) Indicator 23 ‘Occurrence of extremes of temperatures and precipitation’, moved to “Physical conditions”;
iii) Indicator 24 ‘Direct economic loss attributed to hydro-meteorological disasters in relation to GDP’, moved to new sub-area “National total”;
iv) Indicator 25 ‘Number of people whose destroyed dwellings were attributed to hydro-meteorological disasters’, moved to “Human settlements and environmental health”;
v) Indicator 28 ‘Direct agricultural loss attributed to hydro-meteorological disasters’, moved to “Agriculture, forestry and fishery”.
4.1.3 Data availability
105. A survey on data availability for the initial set of core climate change-related indicators was carried out in August 2016. The survey was sent to NSOs of all CES member countries. The aim of the survey was to identify the availability of data to produce the proposed set of core climate change-related indicators and to get information about possible alternative and additional indicators which are used by countries.
106. It was not possible to assess the data availability for the refined set of indicators. However, the refinement procedure addressed mainly indicators reported by countries as problematic (because of the lack of agreed methodology or lack of data), and availability of data was one criterion for redefining some of the indicators.
107. The following Figure 3 shows the availability of indicators in the 41 countries that responded to the survey. Seven of the indicators are already available in more than 75% of the countries and 15 indicators in more than 50% of the countries.
108. One indicator (cattle stock) was removed from the list after the survey had been carried out. A new indicator “Emission intensity of agricultural commodities” calculated by FAO for all countries, was added to the list. The names and/or definitions of 11 other indicators changed slightly after the survey was carried out for the following reasons:
(a) Change of definitions and names of indicators derived from the Sendai Framework (e.g. “Number of housing units damaged and destroyed by climatological, hydrological and meteorological disasters” changed to “Number of people whose destroyed dwellings were attributed to hydro-meteorological disasters”);
(b) Improved indicator definitions based on survey feedback and input of the Task Force (e.g. “Land use/cover change” changed to “Losses of land covered by (semi-) natural vegetation”);
(c) Change of the indicator name without changing the underlying methodology (e.g. “GHG emissions from LULUCF” changed to “GHG emissions from land use”).
109. It is assumed that this does not change the survey results significantly. The clearer definitions may even lead to better data availability. More detailed information on each indicator can be found in annex IV.
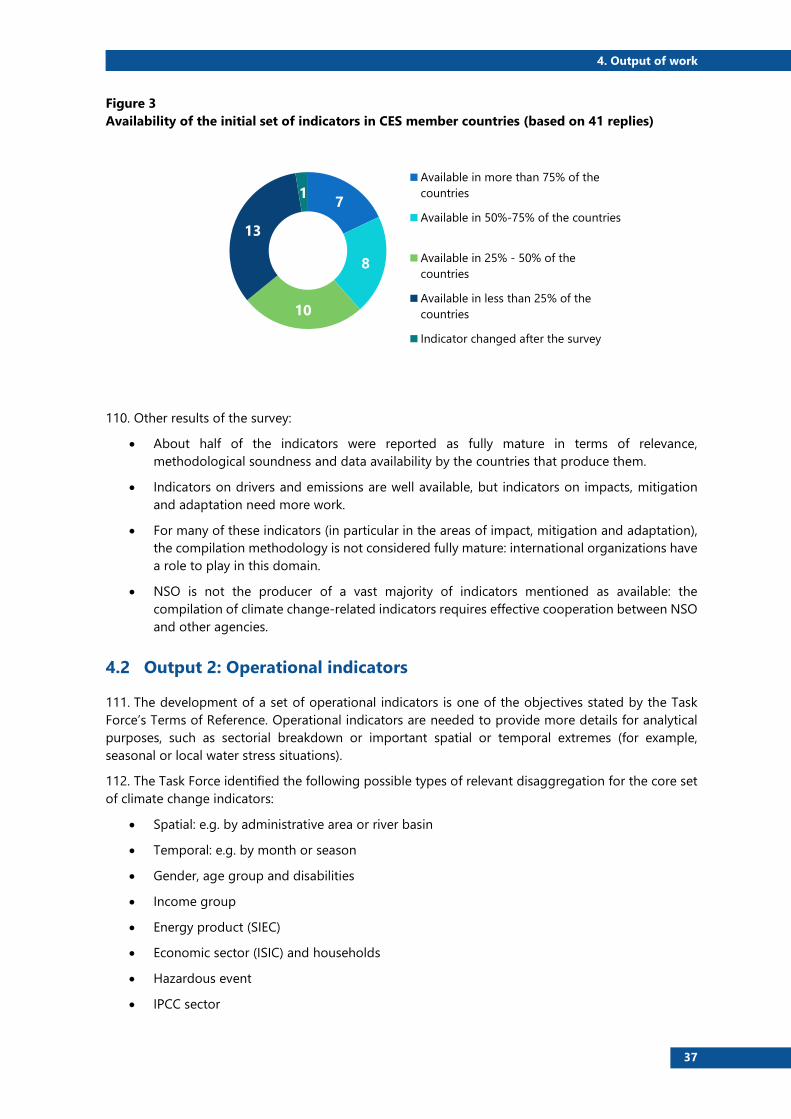
4. Output of work
37
Figure 3 Availability of the initial set of indicators in CES member countries (based on 41 replies)
110. Other results of the survey:
• About half of the indicators were reported as fully mature in terms of relevance, methodological soundness and data availability by the countries that produce them.
• Indicators on drivers and emissions are well available, but indicators on impacts, mitigation and adaptation need more work.
• For many of these indicators (in particular in the areas of impact, mitigation and adaptation), the compilation methodology is not considered fully mature: international organizations have a role to play in this domain.
• NSO is not the producer of a vast majority of indicators mentioned as available: the compilation of climate change-related indicators requires effective cooperation between NSO and other agencies.
4.2 Output 2: Operational indicators
111. The development of a set of operational indicators is one of the objectives stated by the Task Force’s Terms of Reference. Operational indicators are needed to provide more details for analytical purposes, such as sectorial breakdown or important spatial or temporal extremes (for example, seasonal or local water stress situations).
112. The Task Force identified the following possible types of relevant disaggregation for the core set of climate change indicators:
• Spatial: e.g. by administrative area or river basin
• Temporal: e.g. by month or season
• Gender, age group and disabilities
• Income group
• Energy product (SIEC)
• Economic sector (ISIC) and households
• Hazardous event
• IPCC sector
7
8
10
13
1Available in more than 75% of thecountries
Available in 50%-75% of the countries
Available in 25% - 50% of thecountries
Available in less than 25% of thecountries
Indicator changed after the survey
CES Set of Core Climate Change-related Indicators and Statistics Using SEEA
38
• Land cover class
• Product
• Disease
• Type of purpose: e.g. for heating, cooling, transport or other
• Type of tax: e.g. energy, CO2, transport, etc.
• Type of hazard
• Type of affection: e.g. dead persons, missing persons
• Type of damage: e.g. agricultural, other productive assets, critical infrastructure, cultural heritage, etc.
• Type of mitigation expenditure: e.g. renewable energy, energy saving, CO2 abatement, etc.
• Type of transfer: e.g. subsidies, current transfer, capital transfer
• Type of adaptation measure: e.g. flood protection, improvement of irrigation efficiency, etc.
• Type of forest
113. For each indicator, the Task Force identified a few relevant types of disaggregation out of the list above (for more information, see metadata sheets in annex IV). For SDG indicators and Sendai Framework indicators, this includes the recommended disaggregation specified in SDG indicator metadata and the technical guidelines for Sendai Framework indicators.
4.3 Output 3: Contextual indicators
114. The development of a set of contextual indicators is one of the objectives stated in the Task Force’s Terms of Reference. The Task Force recommends distinguishing general contextual indicators and specific contextual indicators:
(a) General contextual indicators help the user to better understand and interpret the entire set of core indicators in the context of the given country and in relation to global phenomena. General contextual indicators include indicators on the geographical, climatological, environmental, economic and social situation of the country. They also include some global indicators such as worldwide GHG emissions and global temperature change;
(b) Specific contextual indicators provide context for a given core indicator, for a group of core indicators or for important climate change-related phenomena which are relevant only for some countries of the region (e.g. climate change-related impacts on coastal zones, population at risk, poverty).
4.3.1 General contextual indicators
115. For general contextualisation of the set of core climate change-related indicators, the Task Force recommends the use of the following statistics and indicators:
(a) Global context:
i) Global GHG emissions (CO2 equivalents);
ii) Global temperature change (°C);
(b) Geographical information (FDES 1.1.3):
i) Area of the country (1,000 km2);
ii) Length of marine coastline (km);

4. Output of work
39
(c) Atmosphere, climate and weather (FDES 1.1.1):
i) Monthly average temperature (°C);
ii) Minimum monthly average temperature (°C);
iii) Maximum monthly average temperature (°C);
iv) Long-term annual average precipitation (mm);
(d) Land cover (FDES 1.2.1):
i) Area by land cover categories;
(e) Population:
i) Total population;
ii) Urban population;
iii) Population density;
(f) Economy:
i) GDP per capita;
ii) GDP by main economic sectors: Agriculture/forestry/fishing, manufacturing industry, mining and quarrying, service sector;
iii) Unemployment rate.
4.3.2 Specific contextual indicators
116. Depending on the national conditions, some core indicators require more additional information (context) than others, or a nationally important climate change-related phenomenon requires additional indicators in the national indicator set (e.g. for coastal zones, population at risk, poverty.
117. In some cases, context is already given in the set of core indicators itself (for example, the core indicators on energy consumption, the share of renewable energy etc., can be seen in close relation with the core indicators on GHG emissions).
118. In other cases, additional contextual indicators are needed for a better interpretation of a core indicator. For example, in countries with high water stress (core indicator 18 – Level of water stress), more information would be needed to understand the main causes of the water stress. This could be derived from a spatial and temporal disaggregation of the indicator (operational indicators), but also with additional contextual information (contextual indicators), for example, on the share of water uses among different economic activities and households or on the percentage of water lost in transport.
119. In some cases, an indicator can be produced for the national territory (the territory principle) and for the national economy (the residence principle), for example, GHG emissions. If the core indicator is based on the residence principle, then the indicator calculated for the national territory will provide important additional information, thus will be a contextual indicator (and can also serve as a proxy indicator, see below).
4.3.3 Proxy indicators
120. Proxy indicators are a special set of contextual indicators that can be used by countries as long as indicator methodologies are not finalised (tier III indicators) or if data is missing to calculate the core indicator. Proxy indicators can be found in the metadata sheets and are shown in Table 6 below.

CES Set of Core Climate Change-related Indicators and Statistics Using SEEA
40
Table 6 Core indicators and proxy indicators
Core indicator Proxy indicator
5a - Total energy intensity of production activities of the national economy
Energy intensity of GDP
6a - Total CO2 intensity of energy used in production activities of the national economy
Carbon intensity of TPES
8a - Energy use by resident households per capita Final energy consumption by households on the national territory per capita
16 - Mean temperature anomaly (compared to climate normal 1961 - 1990)
Temperature change compared to pre-industrial levels Temperature change (compared to the base period 1951 - 1980)
18 - Level of water stress: freshwater withdrawal as a proportion of available freshwater resources
Water exploitation index
4.4 Output 4: Core climate change-related statistics
121. Core climate change-related statistics consist of the set of basic statistics needed to produce GHG inventories and to produce the identified core indicators.
122. According to the CES Recommendations, the following activity data are needed for GHG inventories:
• Energy production and consumption
• Agriculture
• Forestry
• Mining
• Waste generation
• Transportation
• Land cover
• Manufacturing industries
• Households
123. The GHG emission data for the GHG inventories can be calculated by applying emission factors to activity data. This is usually not done by NSOs. The results are also often used for statistics on air emissions (which include other relevant pollutants).
124. The refinement process of the set of core indicators also resulted in minor changes to the list of core climate change-related statistics.
125. Table 7 gives an overview of which basic statistics and which SEEA accounts support the production of the refined set of indicators for each of the five areas.

4. Output of work
41
Table 7 Statistics and accounts needed to produce the CES set of core climate change-related indicators
Statistics and SEEA Accounts needed for the production of the indicators / area Drivers Emissions Impacts Mitigation Adaptation
STATISTICS
Energy X X
X
Air emissions* X X
X
Agriculture X X X
X
Forestry X X
X X
Land and land cover X X X X X
Physical conditions
X
Water
X
X
Biodiversity
X
Hazardous events and disasters
X
Health
X
Economy, National Accounts X X X X X
SEEA ACCOUNTS
Physical flow accounts for energy X
X
SEEA Agriculture, Forestry and Fishery
X X X
Physical flow accounts for water
X
X
Asset accounts for water
X
Environmental activity accounts and other transactions related to the environment
X
X X
Accounting for air emissions X X
X
Asset accounts for land X
X X X
Accounting for soil resources X
Ecosystem accounts
X
X
* Statistics on air emissions are understood to be built upon other statistics, such as activity data on energy consumption by different economic activities, waste, transport etc. These areas are not explicitly mentioned here.

CES Set of Core Climate Change-related Indicators and Statistics Using SEEA
42

43
5. FOLLOW UP WORK 126. The subsequent follow-up activities have been identified by the Task Force, taking into consideration the recommendations of the Steering Group on Climate Change-related Statistics, the Expert Forum on Climate Change-related Statistics and UNCEEA. The activities are grouped into three main areas:
(a) Implementation of the set of core climate change-related indicators;
(b) Further work on indicators;
(c) Dissemination and use.
127. All the proposed activities should be carried out in close collaboration with other international organisations (e.g. Eurostat, FAO, OECD, UNFCCC, UNSD etc.) to ensure the establishment of internationally comparable indicators and statistics and to avoid confusion and doubts among users.
5.1 Implementation of the set of core climate change-related indicators
128. The accompanying document “Implementation Guidelines for the CES Set of Core Climate Change-Related Indicators and Statistics” includes practical guidelines for the implementation of the set of indicators.
129. The Task Force recommends that countries start the implementation as soon as possible and identify statistical products for dissemination. The UNECE Expert Fora for producers and users of climate change-related statistics should regularly take stock of the number of countries implementing the set of indicators and continue to be a platform for exchanging of knowledge and experience. The countries are encouraged to share their experience through the Expert Fora and the UNECE wiki12 on good practices on climate change-related statistics.
130. International organisations should support capacity building in this area. The annual Expert Fora for Producers and Users of Climate Change-related Statistics can help to identify capacity development needs.
131. A strategy for encouraging countries to develop a national set of climate change-related indicators and statistics based on the CES core set could be useful. It could be based on the SEEA implementation strategy and its lessons learned. To the extent possible, this strategy should be aligned with related activities of other international organisations (e.g. Eurostat, OECD and UNSD).
132. NSOs should be encouraged to also implement tier III indicators based on methodologies referred to in the metadata sheets, even if they are not internationally clarified, or to use alternative indicators or nationally used methodologies. Countries’ experiences will also help in the planned review of the set of core climate change-related indicators in 5 years’ time. For some of the SEEA-related indicators, methodological development can be expected sooner from the SEEA research agenda.
133. For the sub-areas currently identified as “indicator placeholders”, countries are encouraged to use nationally available indicators and to share their experiences, for example, at the UNECE Expert Fora for Producers and Users of Climate Change-related Statistics.
12 https://statswiki.unece.org/display/GPCCS

CES Set of Core Climate Change-related Indicators and Statistics Using SEEA
44
5.2 Further work on indicators
134. This policy area is still in dynamic development. Therefore, it requires the use of some non-traditional indicators, which are undoubtedly relevant, but currently do not have underlying internationally agreed methodologies (including both SEEA-based indicators and SDG indicators). The set of core climate change-related indicators includes 11 tier III indicators for which no internationally agreed methodology is available. Furthermore, there are two indicator placeholders (one for climate change-related impacts on biodiversity and one for the climate change adaptation function of forests). In addition, there are many ongoing international activities in the area of climate change adaptation, which may result in more guidance on producing climate change adaptation indicators.
135. Further work on indicators therefore includes:
(a) Interaction with activities linked to the SEEA research agenda and alignment with progress in this field as well as with the increased use of SEEA in reporting initiatives (for example SDGs). Nine of the tier III indicators are indicators that could be derived from SEEA-CF and/or SEEA-EA (see Table 4). However, several methodological questions remain open. To pursue the objective of coordination with the SEEA developments, the Task Force recommends continuing close interaction with UNCEEA;
(b) Regular reviews of the set – a small task team (or thematic task teams) under the CES Steering Group on Climate Change-related Statistics should regularly review whether:
i) Internationally agreed methodologies have become available for other tier-III indicators;
ii) Indicator placeholders can be filled;
iii) There are developments related to climate change adaptation indicators that need to be considered.
136. The task team (or task teams) could present their findings at the annual UNECE Expert Fora for producers and users of climate change-related statistics.
137. A review of the entire set of core climate change-related indicators is recommended after 5 years. The review should take into account countries’ experience in implementing the indicators, methodological developments and new policy requirements.
138. A strategy or tool to evaluate the use of the set of indicators and if they are effectively answering the relevant questions could be helpful for preparing the review.
5.3 Dissemination and use
139. Despite the growing need for climate change-related information, users still have problems obtaining the relevant information, which is fragmented across different national and international institutions and often not comparable.
140. Some data portals, e.g. from The World Bank13 or the European Environment Agency already provide access to “climate change data”, usually originating from other international databases or calculated by international organisations. What is missing is a portal (or portals) that allows access to official national climate change-related statistics and indicators for different purposes of users.
141. An internationally comparable online available national set of core climate change-related indicators and statistics could provide the starting point for users to easily obtain the necessary information.
13 https://data.worldbank.org/topic/climate-change

5. Follow up work
45
142. Both countries and international organisations could provide access to the core set of climate change-related statistics and indicators via existing portals and online databases.
143. Best practices for this are available, e.g. in environment statistics through the “Shared Environmental Information System” (SEIS), which defines a set of principles for environment statistics and indicators that allow for sharing of this information on national platforms (e.g. publicly available databases of NSOs) and providing access for international users via an international data portal. Another example of an international portal is the UNECE Statistical Database, which harvests information from national and international databases without creating an additional reporting burden to countries.
144. It is recommended to explore the opportunities how nationally produced indicator sets could be made easily accessible for national and international users of climate change-related statistics and indicators. This should be based on existing experiences in other domains and coordinated with similar initiatives at the international level. Existing mechanisms for data sharing should be used as far as possible.
145. Further user needs in terms of data formats, reports, maps, graphs etc., are to be identified.
146. Countries and international organisations should explore whether the SEEA-based indicators can be used in form of "combined presentations", for example by combining monetary and physical indicators in tables or graphs.

CES Set of Core Climate Change-related Indicators and Statistics Using SEEA
46
47
6. REFERENCES Australian Bureau of Statistics (2012): Completing the Picture - Environmental Accounting in Practice,
http://www.abs.gov.au/ausstats/[email protected]/PrimaryMainFeatures/4628.0.55.001?OpenDocument
Bordt, M. and R. Smith (2008): Measuring the Impacts of Climate Change - Are Central Statistical Offices Prepared to Track the Impacts of Climate Change?, http://unstats.un.org/unsd/climate_change/docs/papers/CCPaper_CanadaREVISED.pdfConstantino, S., Steinbach, N., and Cederlund M. (2013): CREEA - Compiling and Refining Environmental and Economic Accounts - D6.4 Taxes and Subsidies, project funded by the EU’s Seventh Framework Program, http://mospi.nic.in/Mospi_New/upload/climate_change_29nov13.pdf
Costantino, C. and A. Tudini (2013): Climate Change and European Official Statistics, Statistika, Statistics and Economy Journal, Czech Statistical Office, Vol. 93 (2) 2013, https://www.czso.cz/documents/10180/20550305/180213q2100.pdf/325ac030-6153-4d88-be5b-5282c677e203?version=1.0
European Environment Agency (EEA, 2012): Climate change, impacts and vulnerability in Europe 2012, EEA Report No 12/2012, http://www.eea.europa.eu/publications/climate-impacts-and-vulnerability-2012
European Environment Agency (EEA, 2014): Trends and projections in Europe 2014 - Tracking progress towards Europe's climate and energy targets for 2020, EEA Report No 6/2014
European Environment Agency / European Topic Centre on Climate Change Impacts, Vulnerability and Adaptation (EEA / ETC/CCA, 2018): Indicators for adaptation to climate change at national level – Lessons from emerging practice in Europe, ETC/CCA Technical Paper 2018/3, https://www.adaptecca.es/sites/default/files/documentos/2018_etc_cca_national_indicators.pdf
European Commission (2011): Regulation (EU) No 691/2011 of the European Parliament and of the Council of 6 July 2011 on European environmental economic accounts. https://eur-lex.europa.eu/legal-content/EN/ALL/?uri=CELEX:32011R0691
Eurostat (2010): Using official statistics to calculate greenhouse gas emissions, A statistical guide
Eurostat (2011): Expenditure related to Climate Change Mitigation, http://www1.unece.org/stat/platform/download/attachments/107416104/ENV_ERT_RUMEA_TF_03%282011%29%20Climate%20change%20mitigation%20related%20expenditure.pdf?version=1&modificationDate=1427818776885&api=v2
Eurostat (2014): Towards a harmonised methodology for statistical indicators, http://bookshop.europa.eu/en/towards-a-harmonised-methodology-for-statistical-indicators-pbKSGQ14011/?CatalogCategoryID=zx8KABstS0cAAAEjr5EY4e5L
IPCC: 2006 IPCC Guidelines for National Greenhouse Gas Inventories – Chapter 4, Methodological choice and identification of key categories, http://www.ipcc-nggip.iges.or.jp/public/2006gl/pdf/1_Volume1/V1_4_Ch4_MethodChoice.pdf
Ministry of Statistics and Programme Implementation of India (2013): Statistics Related to Climate Change – India, http://www.indiaenvironmentportal.org.in/files/file/climate%20change%20related%20statistics%20-%20india%2029nov13.pdf
Organisation for Economic Development and Co-operation (OECD, 2003): OECD Environmental Indicators – Development, Measurement and Use, http://www.oecd.org/env/indicators-modelling-outlooks/24993546.pdf
Organisation for Economic Development and Co-operation (OECD, 2008): OECD Key Environmental Indicators, https://www.oecd.org/env/indicators-modelling-outlooks/37551205.pdf
Statistics Sweden (2012): Climate change adaptation expenditure – A proposal for a methodology to compile, define and classify national and EU economic information as statistics, http://www.scb.se/statistik/_publikationer/mi1301_2012a01_br_mift1201.pdf
Sue Wing, I. and E. Lanzi (2014): “Integrated Assessment of Climate Change Impacts: Conceptual Frameworks, Modelling Approaches and Research Needs”, OECD Environment Working Papers, No. 66, OECD Publishing, http://dx.doi.org/10.1787/5jz2qcjsrvzx-en
CES Set of Core Climate Change-related Indicators and Statistics Using SEEA
48
UNCEEA (2010): SEEA as a Framework for Assessing Policy Responses to Climate Change, prepared by Statistics Netherlands for the Fifth Meeting of the UN Committee of Experts on Environmental-Economic Accounting, http://unstats.un.org/unsd/envaccounting/ceea/meetings/UNCEEA-5-13.pdf
UNECE (2014): Conference of European Statisticians Recommendations on Climate Change-Related Statistics, http://www.unece.org/fileadmin/DAM/stats/publications/2014/CES_CC_Recommendations.pdf
UNFCCC (2015): Adoption of the Paris Agreement, FCCC/CP/2015/L.9/Rev.1, http://unfccc.int/resource/docs/2015/cop21/eng/l09r01.pdf
United Nations (2012): System of Environmental-Economic Accounting – Central Framework, http://unstats.un.org/unsd/envaccounting/seeaRev/SEEA_CF_Final_en.pdf
United Nations (2013): Framework for the Development of Environment Statistics, http://unstats.un.org/unsd/environment/FDES/FDES-2015-supporting-tools/FDES.pdf
United Nations (2016a): Report of the Inter-Agency and Expert Group on Sustainable Development Goal Indicators, E/CN.3/2016/2/Rev.1, http://unstats.un.org/unsd/statcom/47th-session/documents/2016-2-IAEG-SDGs-Rev1-E.pdf
United Nations (2016b): Report of the Open-ended intergovernmental expert working group on indicators and terminology relating to disaster risk reduction, A/71/644, http://www.preventionweb.net/files/50683_oiewgreportadvanceuneditedversion.pdf
United Nations (2016c): Statistical Commission, Report on the forty-seventh session (8-11 March 2016), E/2016/24-E/CN.3/2016/34, http://unstats.un.org/unsd/statcom/47th-session/documents/Report-on-the-47th-session-of-the-statistical-commission-E.pdf
United Nations (2018): Statistical Commission, Report of the forty-ninth session (6-9 March 2018), E/2018/24-E/CN.3/2018/37, https://unstats.un.org/unsd/statcom/49th-session/documents/Report-on-the-49th-session-E.pdf
Virola, R.A., Domingo, E.V., Talento, R.J., Amoranto , G.V. and E. P. Lopez-Dee (2008): Gearing a National Statistical System Towards the Measurement of the Impact of Climate Change: The Case of the Philippines, http://unstats.un.org/unsd/environment/FDES/Philippines_paper.pdf

49
ANNEX I. UPDATED TERMS OF REFERENCE OF THE TASK FORCE ON A SET OF CORE CLIMATE CHANGE-RELATED INDICATORS AND STATISTICS USING SEEA I. BACKGROUND
In June 2017, the Conference of European Statisticians (CES) endorsed the Initial Set of Key Climate Change-related Indicators using the System of Environmental-Economic Accounting. The Conference emphasized the need for further work to refine the initial indicator set, to develop common methodologies and improve the availability of data.
The Conference agreed that the initial set of core climate change-related indicators form the basis for pilot testing. In total, 17 countries and the Food and Agriculture Organization of the United Nations (FAO) volunteered to participate in the pilot testing14.
The Conference extended the mandate of the Task Force to refine the initial set of core climate-change related indicators based on the outcomes of the pilot testing, and to develop methodologies, data sources and guidance for implementation.
II. MANDATE
The work of the Task Force is conducted within the framework of CES and its Bureau. The Task Force will be created for a period of two years, after which it will submit a final report. The Steering Group on Climate Change-related Statistics will guide and oversee the work of the Task Force.
III. OBJECTIVE
The main objective of the Task Force will be to refine the initial set of core climate change-related indicators based on the outcomes of the pilot testing, and taking into consideration comments received during the electronic consultation with CES member States (carried out in February – March 2017).
Furthermore, the Task Force will develop a set of operational and contextual indicators to accompany the recommended set of core indicators.
As far as possible, the Task Force will identify methodologies for tier III indicators. This work will take into account developments related to the operationalization of indicators to monitor the Sustainable Development Goals (SDGs), the Sendai Framework on Disaster Risk Reduction (Sendai Framework), and the Paris Agreement on Climate Change (Paris Agreement). Experiences of individual countries will also be considered if internationally agreed methodologies are not yet available.
The Task Force will develop guidelines for the implementation of the refined set of indicators.
The Task Force will also contribute to the development of a global set of climate change statistics and indicators.
IV. PLANNED ACTIVITIES AND OUTPUTS
Building on the work accomplished to date, the Task Force will undertake the following activities:
14 Armenia, Belarus, Colombia, Finland, Georgia, Hungary, Israel, Latvia, Lithuania, Luxembourg, Mexico, Mongolia, Kyrgyzstan, Poland, Russian Federation, Turkey, Ukraine and FAO

CES Set of Core Climate Change-related Indicators and Statistics Using SEEA
50
• Take as a starting point the Initial Set of key climate change-related statistics and indicators using the System of Environmental-economic Accounting, the results of the pilot testing of the set of indicators, and the comments received from the electronic consultation;
• Analyse the results of the pilot testing and comments received from the electronic consultation to identify data sources, needs for practical guidance, and needs for further refinement of the set of indicators and the proposed methodologies;
• Make the necessary refinements to the set of core indicators. This includes a review of the organisation of the indicators according to areas and sub-areas, and improvements of the methodological sheets;
• Identify newly available methodologies for tier III indicators (e.g. from the work on SDG indicators and Sendai Framework), and revise methodologies for tier I and tier II indicators if necessary;
• Propose a set of contextual and operational indicators accompanying the set of core indicators;
• Consult with different users and producers of the set of core indicators (e.g. via Expert Forum on Climate Change-related Statistics) and assess the usefulness of the refined set of core indicators;
• Develop guidelines for implementation of the set of core indicators, including suggestions for the use of operational and contextual indicators;
• Contribute, as far as possible, to the development of a global set of climate change statistics and indicators.
The outputs will be (i) a refined set of core climate change-related statistics and indicators, and (ii) implementation guidelines for CES member countries for producing the indicator set.
V. Timetable
The activities of the Task Force are planned for the period from November 2017 to February 2020, according to the following tentative timetable:
Nov-Dec 2017 Draft a work plan with activities, timing and division of work Jan-Mar 2018 Analyse the results of the pilot testing (data sources, needs for further guidance,
needs for refinements of the set of indicators) Apr-Sep 2018 Refine the set of core indicators, taking into consideration the results of the pilot
testing and comments received from the electronic consultation: Revise and complete metadata sheets of tier I and tier II indicators, review tier III indicators and identify methodologies, revise the organisation of the indicators according to areas and sub-areas
Oct-Dec 2018 Present interim results to the Expert Forum on Climate Change-related Statistics, and implement recommendations
Jan-Apr 2019 Develop a set of operational and contextual indicators Apr – Sept 2019 Draft implementation guidelines and final report Oct- Nov 2019 Present draft implementation guidelines to Expert Forum on Climate Change-
related Statistics, and implement recommendations Dec 2019 Finalise the report and/or revise the set of statistics and indicators based on
feedback received Jan-Feb 2020 Submit the report to the CES Bureau

Annex I. Updated Terms of Reference of the Task Force on a Set of Core Climate Change-related Indicators and Statistics using SEEA
51
VI. METHODS OF WORK
The Task Force will primarily work via email and telephone conferences. Face-to-face meetings may be organized, preferably on the occasion of events attended by a significant number of Task Force members. Participation to the meetings will be self-funded.
The Task Force will report to the Steering Group on Climate Change-related Statistics and submit its findings for consultation to the Expert Meeting for producers and users of climate change-related statistics that involves national statistical offices, greenhouse gas inventory producers and key organizations active in the measurement of climate change and related phenomena.
VII. MEMBERSHIP
Countries and international organisations who have already participated in the Task Force on a Set of Key Climate Change-Related Statistics and Indicators using the System of Environmental-economic Accounting will be invited to participate in this Task Force. Participation is also open for other countries and international organisations.
UNECE acts as Secretariat to the Task Force.
* * * * *

52
ANNEX II. INITIAL SET OF CORE CLIMATE CHANGE-RELATED INDICATORS This table presents the initial set of core climate change-related indicators endorsed by CES in June 2017.
Area Sub-area No. Indicator Tier
Indicator conceptually identical with
Can be produced
from SEEA-CF accounts
SDGs* SF DRR**
Driv
ers
National total 1 Total primary energy supply (TPES)
I Energy
2 Share of fossil fuels in total primary energy supply (TPES)
I Energy
3 Losses of land covered by (semi-) natural vegetation
III Land
4 Total support for fossil fuels / GDP
II
Production 5 Total energy intensity of production activities
II Energy
6 CO2 intensity of energy for the economy
II Energy, air emission
7 Emission intensity of agricultural commodities
II AFF***
Consumption 8 Energy consumption by households / capita
I Energy
Emiss
ions
National total 9 Total GHG emissions I Air emission 10 CO2 emissions from fuel
combustion I Air emission
11 GHG emissions from land use I AFF Production 12 Total GHG emissions of
production activities I Air emission
13 GHG emission intensity of production activities
I Air emission
Consumption 14 Direct GHG emissions from households
I Air emission
15 Carbon footprint III Air emission
Impa
cts
Physical conditions
16 Annual average surface temperature
I
17 Percentage of land area suffering from unusual wet or dry conditions (Standard Precipitation Index)
I
Water resources
18 Level of water stress: freshwater withdrawal as a proportion of available freshwater resources
I 6.4.2 (tier 1) Water
Land, land cover, ecosystems and biodiversity
19 Cumulative number of alien species
III
20 Carbon stock in soil III 21 Proportion of land that is
degraded over total land area III 15.3.1
(tier 3) Land
Extreme events and disasters
22 Number of deaths and missing persons attributed to hydro-meteorological disasters, per 100,000
III 1.5.1 (tier 2), 11.5.1 (tier 2), 13.1.2 (tier 2)
A-1
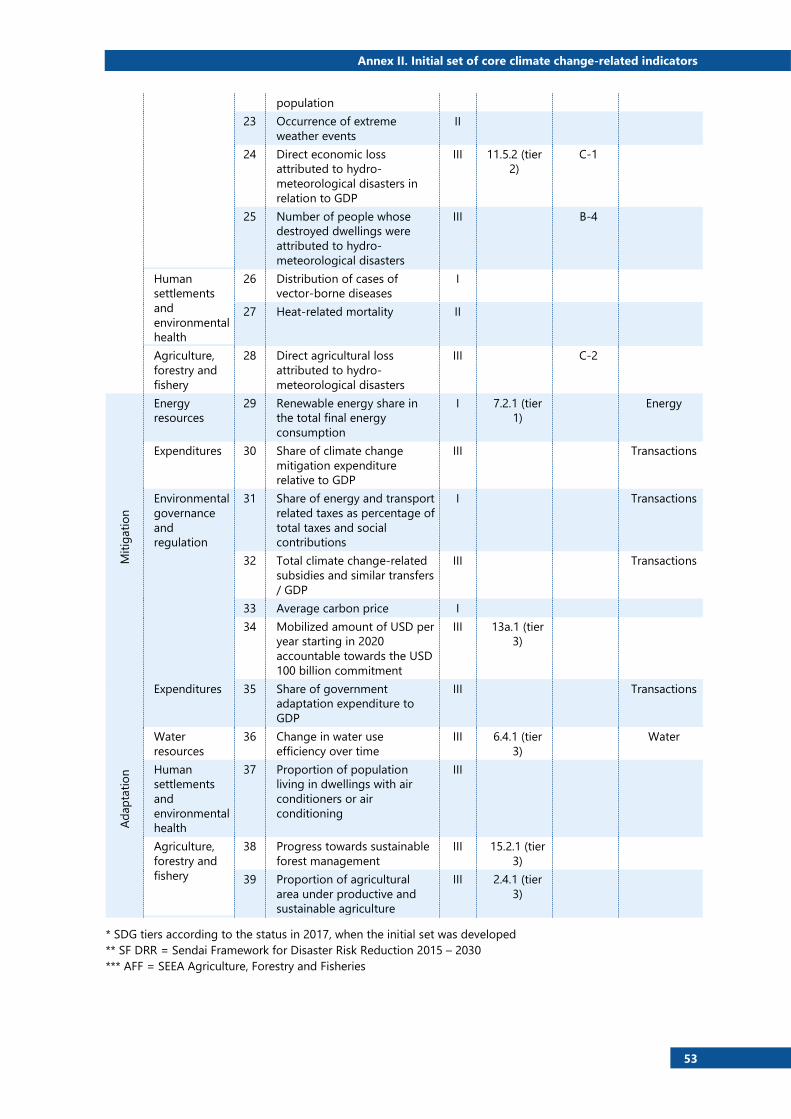
Annex II. Initial set of core climate change-related indicators
53
population 23 Occurrence of extreme
weather events II
24 Direct economic loss attributed to hydro-meteorological disasters in relation to GDP
III 11.5.2 (tier 2)
C-1
25 Number of people whose destroyed dwellings were attributed to hydro-meteorological disasters
III B-4
Human settlements and environmental health
26 Distribution of cases of vector-borne diseases
I
27 Heat-related mortality II
Agriculture, forestry and fishery
28 Direct agricultural loss attributed to hydro-meteorological disasters
III C-2
Miti
gatio
n
Energy resources
29 Renewable energy share in the total final energy consumption
I 7.2.1 (tier 1)
Energy
Expenditures 30 Share of climate change mitigation expenditure relative to GDP
III Transactions
Environmental governance and regulation
31 Share of energy and transport related taxes as percentage of total taxes and social contributions
I Transactions
32 Total climate change-related subsidies and similar transfers / GDP
III Transactions
33 Average carbon price I 34 Mobilized amount of USD per
year starting in 2020 accountable towards the USD 100 billion commitment
III 13a.1 (tier 3)
Adap
tatio
n
Expenditures 35 Share of government adaptation expenditure to GDP
III Transactions
Water resources
36 Change in water use efficiency over time
III 6.4.1 (tier 3)
Water
Human settlements and environmental health
37 Proportion of population living in dwellings with air conditioners or air conditioning
III
Agriculture, forestry and fishery
38 Progress towards sustainable forest management
III 15.2.1 (tier 3)
39 Proportion of agricultural area under productive and sustainable agriculture
III 2.4.1 (tier 3)
* SDG tiers according to the status in 2017, when the initial set was developed ** SF DRR = Sendai Framework for Disaster Risk Reduction 2015 – 2030 *** AFF = SEEA Agriculture, Forestry and Fisheries

54
ANNEX III. UMBRELLA QUESTIONS, POLICY QUESTIONS AND RELATED CORE CLIMATE CHANGE-RELATED INDICATORS This table presents the “umbrella questions” and the detailed underlying policy questions that guided the identification of relevant climate change-related indicators.
Umbrella question (formulated by the Task
Force)
Underlying policy questions (from literature)
Related indicators of the core set
What is the total amount of subsidies for climate change mitigation and who benefits from them?
What is the total amount of subsides for CC mitigation and who benefits from them?
30 - Share of climate change mitigation expenditure in relation to GDP 32 - Total climate change-related subsidies and similar transfers in relation to GDP
How much economic resources are used for climate change adaptation and what are the consequences on the overall economic performance?
How many economic resources are used for adaptation? What are the annual and total costs of adaptation measures? Which is the level of adaptation measures?
35 - Share of government adaptation expenditure in relation to GDP 34 - Mobilized amount of USD per year starting in 2020 accountable towards the USD 100 billion commitment
How much does the net forest conversion contribute to the overall GHG emissions?
Which is the impact of the net forest conversion?
81 - Net emissions/removals of carbon dioxide by forest land
What is the area of land used for climate change adaptation?
What is the share of total area being used for the maintenance and restoration of environmental function and the share of land owned by different industries?
82 - Share of green urban areas in the total area of cities 39 - Proportion of agricultural area under productive and sustainable agriculture
What is the national carbon footprint (total, per capita, per unit GDP, per unit of energy supply), and what are the trends in the footprint?
What is the national carbon footprint (total, per capita)?
15 - Carbon footprint
What is the total amount of environmental taxes related to climate change mitigation and to what extent does the polluter pays principle apply?
What is the total amount of environmental taxes and to what extent does the polluter pays principle apply?
32 - Total climate change-related subsidies and similar transfers in relation to GDP 31 - Share of energy and transport related taxes in total taxes and social contributions
What is the amount and trend of GHG emissions, and which are the main contributors and main drivers?
What is the amount and trend of GHG emissions and who are the main contributors? What is the role of energy sector in GHG emissions? What is the role of waste in GHG emissions? What is the role of agriculture in GHG emissions? What is the role of industries in GHG emissions? What are the emissions and removals from the LULUCF sector?
1a - Total energy use by the national economy 1b - Total primary energy supply (TPES) 2a - Share of fossil fuels in total energy use by the national economy 2b - Share of fossil fuels in total primary energy supply (TPES) 3 - Losses of land covered by (semi-) natural vegetation 4 - Total support for fossil fuels in relation to GDP
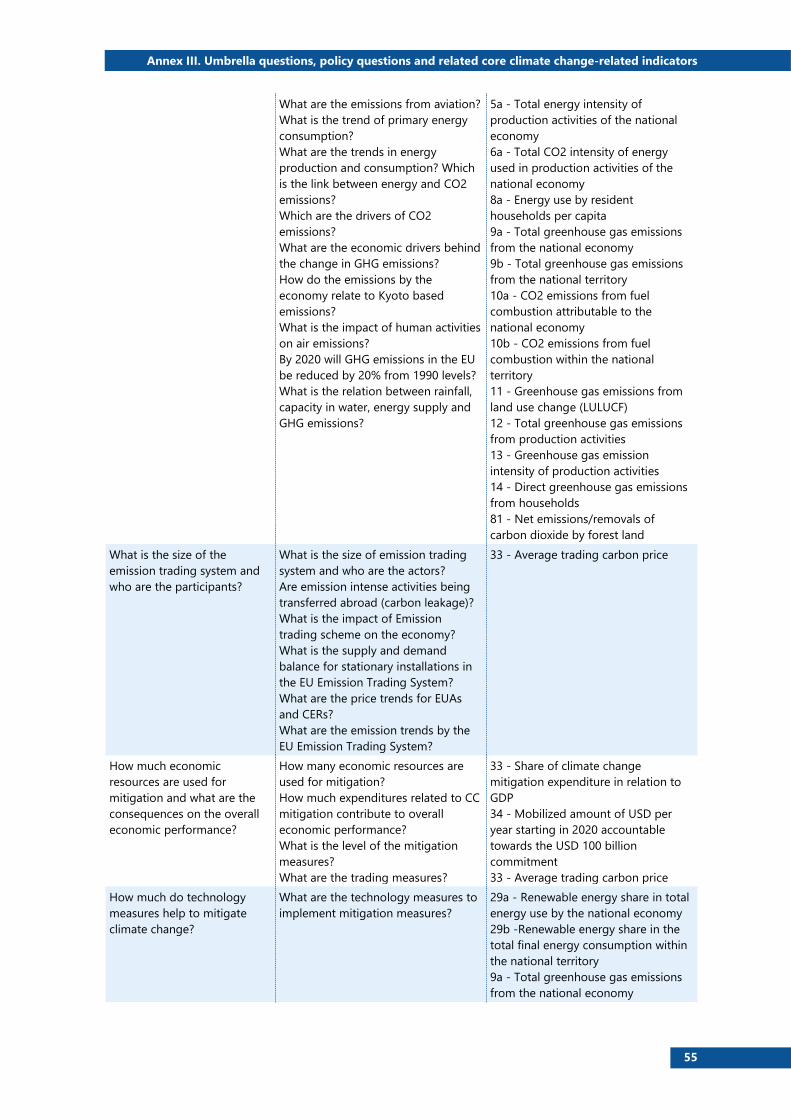
Annex III. Umbrella questions, policy questions and related core climate change-related indicators
55
What are the emissions from aviation? What is the trend of primary energy consumption? What are the trends in energy production and consumption? Which is the link between energy and CO2 emissions? Which are the drivers of CO2 emissions? What are the economic drivers behind the change in GHG emissions? How do the emissions by the economy relate to Kyoto based emissions? What is the impact of human activities on air emissions? By 2020 will GHG emissions in the EU be reduced by 20% from 1990 levels? What is the relation between rainfall, capacity in water, energy supply and GHG emissions?
5a - Total energy intensity of production activities of the national economy 6a - Total CO2 intensity of energy used in production activities of the national economy 8a - Energy use by resident households per capita 9a - Total greenhouse gas emissions from the national economy 9b - Total greenhouse gas emissions from the national territory 10a - CO2 emissions from fuel combustion attributable to the national economy 10b - CO2 emissions from fuel combustion within the national territory 11 - Greenhouse gas emissions from land use change (LULUCF) 12 - Total greenhouse gas emissions from production activities 13 - Greenhouse gas emission intensity of production activities 14 - Direct greenhouse gas emissions from households 81 - Net emissions/removals of carbon dioxide by forest land
What is the size of the emission trading system and who are the participants?
What is the size of emission trading system and who are the actors? Are emission intense activities being transferred abroad (carbon leakage)? What is the impact of Emission trading scheme on the economy? What is the supply and demand balance for stationary installations in the EU Emission Trading System? What are the price trends for EUAs and CERs? What are the emission trends by the EU Emission Trading System?
33 - Average trading carbon price
How much economic resources are used for mitigation and what are the consequences on the overall economic performance?
How many economic resources are used for mitigation? How much expenditures related to CC mitigation contribute to overall economic performance? What is the level of the mitigation measures? What are the trading measures?
33 - Share of climate change mitigation expenditure in relation to GDP 34 - Mobilized amount of USD per year starting in 2020 accountable towards the USD 100 billion commitment 33 - Average trading carbon price
How much do technology measures help to mitigate climate change?
What are the technology measures to implement mitigation measures?
29a - Renewable energy share in total energy use by the national economy 29b -Renewable energy share in the total final energy consumption within the national territory 9a - Total greenhouse gas emissions from the national economy
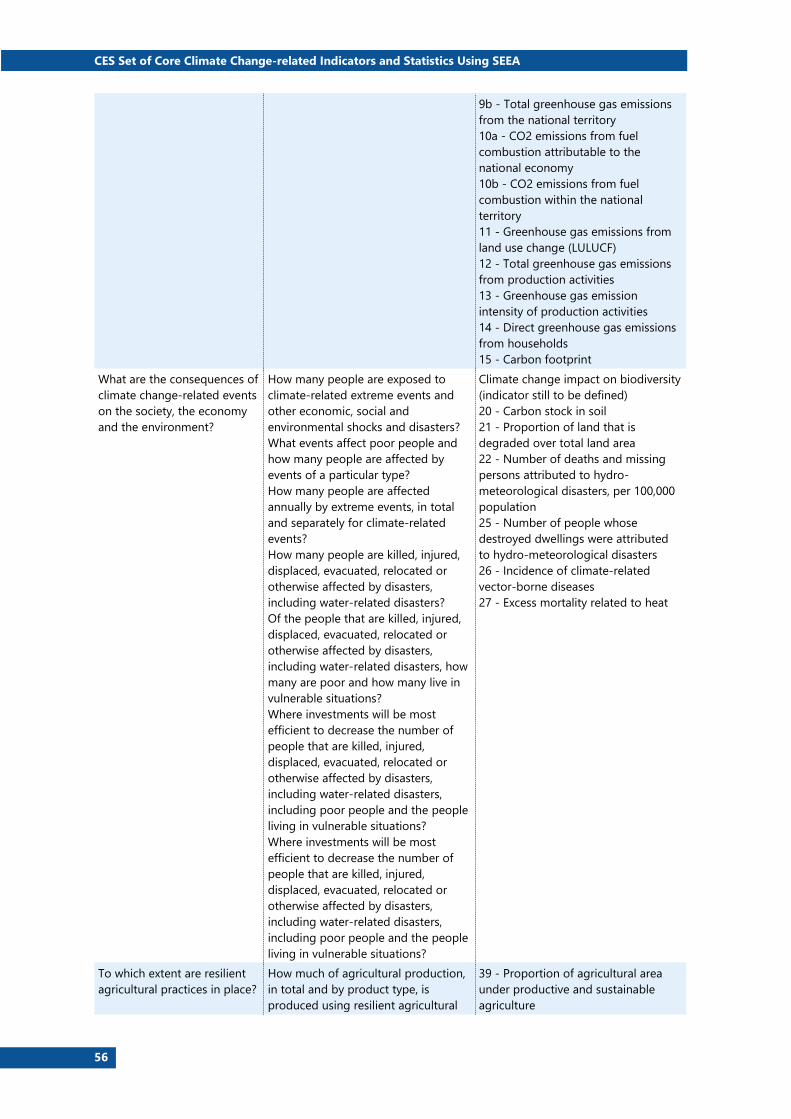
CES Set of Core Climate Change-related Indicators and Statistics Using SEEA
56
9b - Total greenhouse gas emissions from the national territory 10a - CO2 emissions from fuel combustion attributable to the national economy 10b - CO2 emissions from fuel combustion within the national territory 11 - Greenhouse gas emissions from land use change (LULUCF) 12 - Total greenhouse gas emissions from production activities 13 - Greenhouse gas emission intensity of production activities 14 - Direct greenhouse gas emissions from households 15 - Carbon footprint
What are the consequences of climate change-related events on the society, the economy and the environment?
How many people are exposed to climate-related extreme events and other economic, social and environmental shocks and disasters? What events affect poor people and how many people are affected by events of a particular type? How many people are affected annually by extreme events, in total and separately for climate-related events? How many people are killed, injured, displaced, evacuated, relocated or otherwise affected by disasters, including water-related disasters? Of the people that are killed, injured, displaced, evacuated, relocated or otherwise affected by disasters, including water-related disasters, how many are poor and how many live in vulnerable situations? Where investments will be most efficient to decrease the number of people that are killed, injured, displaced, evacuated, relocated or otherwise affected by disasters, including water-related disasters, including poor people and the people living in vulnerable situations? Where investments will be most efficient to decrease the number of people that are killed, injured, displaced, evacuated, relocated or otherwise affected by disasters, including water-related disasters, including poor people and the people living in vulnerable situations?
Climate change impact on biodiversity (indicator still to be defined) 20 - Carbon stock in soil 21 - Proportion of land that is degraded over total land area 22 - Number of deaths and missing persons attributed to hydro-meteorological disasters, per 100,000 population 25 - Number of people whose destroyed dwellings were attributed to hydro-meteorological disasters 26 - Incidence of climate-related vector-borne diseases 27 - Excess mortality related to heat
To which extent are resilient agricultural practices in place?
How much of agricultural production, in total and by product type, is produced using resilient agricultural
39 - Proportion of agricultural area under productive and sustainable agriculture

Annex III. Umbrella questions, policy questions and related core climate change-related indicators
57
practices that help maintain ecosystems and strengthen capacity for adaptation to climate change, extreme weather, drought, flooding and other disasters? How much of agricultural production, in total and by product type, is produced using resilient agricultural practices that help maintain ecosystems and strengthen capacity for adaptation to climate change, extreme weather, drought, flooding and other disasters? What policy measures can be taken to increase the use of such resilient agricultural practices?
Indicator on climate change adaptation by forests (indicator still to be defined)
What kind of legislation is in place to substantially increase the share of renewable energy?
Is legislation in place to increase substantially the share of renewable energy?
30 - Share of climate change mitigation expenditure in relation to GDP 31 - Share of energy and transport related taxes in total taxes and social contributions 32 - Total climate change-related subsidies and similar transfers in relation to GDP
What are the levels of the national and sectoral energy intensities and their trends?
How close we are in terms of energy efficiency to world average and to best practices? What is the rate of improvement in energy productivity in developing countries? By 2020 will EU's energy efficiency be improved by 20%?
5a - Total energy intensity of production activities of the national economy 6a - Total CO2 intensity of energy used in production activities of the national economy 8a - Energy use by resident households per capita
What is the ability, in terms of available technologies and financial resources, to provide support to other countries to facilitate their access to clean energy research and technology, including renewable energy, energy efficiency as well as advanced and cleaner fossil-fuel technology?
What is our ability, in terms of technologies available and financial resources, to provide support to other countries to facilitate their access to clean energy research and technology, including renewable energy, energy efficiency and advanced and cleaner fossil-fuel technology? How much funding and other support is provided to other countries to facilitate their access to clean energy research and technology, including renewable energy, energy efficiency and advanced and cleaner fossil-fuel technology? What is the percentage of international cooperation projects being implemented to facilitate access to clean energy? How much funding and other support is provided to developing countries to help them expand infrastructure and upgrade technology for supplying
34 - Mobilized amount of USD per year starting in 2020 accountable towards the USD 100 billion commitment

CES Set of Core Climate Change-related Indicators and Statistics Using SEEA
58
modern and sustainable energy services? How much funding and other support is provided to least developed countries and small island developing States to help them expand infrastructure and upgrade technology for supplying modern and sustainable energy services? How much resources has our country provided [for donors] or how much resources has our country received in the framework of the commitment undertaken by developed-country parties to the United Nations Framework Convention on Climate Change to a goal of mobilizing jointly $100 billion annually by 2020 from all sources to address the needs of developing countries in the context of meaningful mitigation actions and transparency on implementation and fully operationalize the Green Climate fund through its capitalization as soon as possible?
To which extent have cities and human settlements adopted and are implementing integrated policies and plans towards inclusion, resource efficiency, mitigation and adaptation to climate change, and resilience to disasters?
How many cities and human settlements have adopted and are implementing integrated policies and plans towards inclusion, resource efficiency, mitigation and adaptation to climate change, and resilience to disasters?
22 - Number of deaths and missing persons attributed to hydro-meteorological disasters, per 100,000 population 25 - Number of people whose destroyed dwellings were attributed to hydro-meteorological disasters 26 - Incidence of climate-related vector-borne diseases 27 - Excess mortality related to heat 82 - Share of green urban areas in the total area of cities
What is the level of holistic risk management in cities and human settlements?
How many cities and human settlements have developed and are implementing holistic risk management? For those cities and human settlements that are implementing holistic risk management, what is the managerial framework at all levels?
No indicator in the core set
What measures can be taken to rationalize fossil fuel subsidies and what would be the consequences of taking such measures?
What measures can be taken to rationalize fossil-fuel subsidies and what would be the consequences of taking such measures? "What are the existing fossil-fuel subsidies?
32 - Total climate change-related subsidies and similar transfers in relation to GDP 4 - Total support for fossil fuels in relation to GDP
How resilient are the society, economy and environment to climate-related hazards and natural disasters?
How resilient is our national economy to climate-related hazards and natural disasters?
24 - Direct economic loss attributed to hydro-meteorological disasters in relation to GDP 22 - Number of deaths and missing persons attributed to hydro-

Annex III. Umbrella questions, policy questions and related core climate change-related indicators
59
meteorological disasters, per 100,000 population 25 - Number of people whose destroyed dwellings were attributed to hydro-meteorological disasters 26 - Incidence of climate-related vector-borne diseases 27 - Excess mortality related to heat 28 - Direct agricultural loss attributed to hydro-meteorological disasters
What are the quantifiable economic, social and environmental impacts of extreme events, in total and separately for climate-related events?
What are the quantifiable economic, social and environmental impacts of extreme events, in total and separately for climate-related events? How are health and educational infrastructure affected by hazardous events? What are the annual economic losses from the consequences of extreme events, in total and separately for climate-related events? How many housing units are damaged or destroyed by disasters? "How many people are killed, injured, displaced, evacuated, relocated or otherwise affected by disasters, including water-related disasters? Of the people that are killed, injured, displaced, evacuated, relocated or otherwise affected by disasters, including water-related disasters, how many are poor and how many live in vulnerable situations? What measures can be taken to make our national economy more resilient to climate-related hazards and natural disasters, and how much such measures would cost?
24 - Direct economic loss attributed to hydro-meteorological disasters in relation to GDP 22 - Number of deaths and missing persons attributed to hydro-meteorological disasters, per 100,000 population 25 - Number of people whose destroyed dwellings were attributed to hydro-meteorological disasters 26 - Incidence of climate-related vector-borne diseases 27 - Excess mortality related to heat 28 - Direct agricultural loss attributed to hydro-meteorological disasters
Which climate change adaptation measures are part of national policies, strategies and planning?
Are adaptation measures identifiable within national policies, strategies and planning?
35 - Share of government adaptation expenditure in relation to GDP 82 - Share of green urban areas in the total area of cities
To what extent are climate change-related issues part of education curricula?
How many countries have integrated mitigation, adaptation, impact reduction and early warning into primary, secondary and tertiary curricula?
No indicator in the core set
What is the level of awareness of the population concerning climate change?
What is the percentage of population with increased knowledge on climate change?
No indicator in the core set
What measures can be taken to increase capacity for effective climate change-related planning and management in least developed countries, including
What measures can be taken to increase capacity for effective climate change-related planning and management in least developed countries, including for women, youth
No indicator in the core set

CES Set of Core Climate Change-related Indicators and Statistics Using SEEA
60
measures specifically targeted at women, youth and local and marginalized communities?
and local and marginalized communities?
What is the proportion of forests under sustainable management?
What is the proportion of forests under sustainable management practices in comparison with the total forest area?
No indicator in the core set
What is the current level of forest degradation and its trend?
What is the proportion of degraded forests in comparison with the total forest area?
21 - Proportion of land that is degraded over total land area
Are effective afforestation and reforestation policies in place?
What is the annual rate of afforestation and reforestation?
81 - Net emissions/removals of carbon dioxide by forest land
What is the ratio of GHG emissions from forests compared to the removals of GHG by forests?
What is the ratio of GHG emissions from forests compared to the removals of GHG emissions by forests? What are the net GHG emissions from forests?
81 - Net emissions/removals of carbon dioxide by forest land
What are the current levels of desertification and land degradation and their trends?
What is the current rate of desertification and land degradation?
3 - Losses of land covered by (semi-) natural vegetation
What is the current rate of restoration of degraded ecosystems and land, including the land affected by desertification?
What is the current rate of restoration of degraded land, including the land affected by desertification? What are the methods to facilitate restoration of degraded land, including the land affected by desertification, and how much they cost?
No indicator in the core set
What is the proportion of land/soils under sustainable management?
What is the area of land/soils under sustainable management?
39 - Proportion of agricultural area under productive and sustainable agriculture
What is the capacity for early warning, risk reduction and management of national and global health risks?
What is the capacity for early warning, risk reduction and management of national and global health risks? How many people have access to safe and affordable drinking water? How many people have access to safely managed sanitation services? What is the percentage of population having access to adequate and equitable sanitation and hygiene? What is the magnitude of international cooperation and capacity building to support developing countries in water- and sanitation related activities and programmes?
No indicator in the core set
What is the trend of degradation of natural habitats and the loss of biodiversity?
What is the trend of degradation of natural habitats and the loss of biodiversity?
3 - Losses of land covered by (semi-) natural vegetation Climate change impact on biodiversity (indicator still to be defined)
What are the major impacts of climate change, on the economy, ecosystems and the
What is the current level of ocean acidification and the trend in that level?
24 - Direct economic loss attributed to hydro-meteorological disasters in relation to GDP

Annex III. Umbrella questions, policy questions and related core climate change-related indicators
61
society, and how should they be quantified?
What are the impacts of ocean acidification and how they are measured? How the impacts of ocean acidification can be addressed? What are the changes of the average temperature? What is the impact of the not observed household market on climate change: collection of water and fuelwood by households, subsistence farming and other informal household sector activities? What is the impact of CC on soil and land ? What is the impact of global warming on ecosystem? What is the impact of global warming on water resources? What is the impact of global warming on food security ? What is the impact of global warming on human health? What is the impact of global warming on human settlements? Are glaciers melting? How do storm patters and storm activities change What are the impacts on health? Loss of cultural resources and values Viability of some economic activities that could lead to population redistribution What are the effects on agriculture and forestry? What are the effects on fisheries and aquaculture? What are the changes in energy demand patterns? What is the impact on transportation and access to resources? What is the impact on infrastructure and utilities? What are the changes on prices for resources and services? What is the impact of CC on atmosphere? What is the impact of CC on oceans?
16 - Mean temperature anomaly (compared to climate normal 1961 - 1990) 17 - Percentage of land area suffering from unusually wet or dry conditions (Standard Precipitation Index) 23 - Occurrence of extremes of temperatures and precipitation 18 - Level of water stress: freshwater withdrawal as a proportion of available freshwater resources Climate change impact on biodiversity (indicator still to be defined) 20 - Carbon stock in soil 21 - Proportion of land that is degraded over total land area 22 - Number of deaths and missing persons attributed to hydro-meteorological disasters, per 100,000 population 25 - Number of people whose destroyed dwellings were attributed to hydro-meteorological disasters 26 - Incidence of climate-related vector-borne diseases 27 - Excess mortality related to heat 28 - Direct agricultural loss attributed to hydro-meteorological disasters
How much can the use of renewable energy help in reducing GHG emissions, and will that be economically viable?
What is the share of renewable energy in total energy supply? How competitive is renewable energy now and in the future? What is the most promising type of renewable energy in our circumstances? Will the national targets for renewable energies for 2020 be achieved?
29a - Renewable energy share in total energy use by the national economy 29b - Renewable energy share in the total final energy consumption within the national territory

CES Set of Core Climate Change-related Indicators and Statistics Using SEEA
62
What is the contribution to the national targets for renewable energies by individual Renewable Energy Sources (RES) technologies?
What are the effects of mitigation strategies and actions on the economy, overall and by sector?
What is the impact of mitigation strategies on agriculture? What is the impact of mitigation strategies on energy consumption? What is the impact of mitigation strategies on transport? What is the impact of mitigation strategies on households? What is the impact of mitigation strategies on energy prices?
4 - Total support for fossil fuels in relation to GDP 31 - Share of energy and transport related taxes in total taxes and social contributions 32 - Total climate change-related subsidies and similar transfers in relation to GDP 33 - Average trading carbon price
What are the major effects of the current and envisaged adaptation strategies?
What is the impact of adaptation strategies on health? What is the impact of adaptation strategies on water? What is the impact of adaptation strategies on land use? What is the impact of adaptation strategies on new business? What is the impact of adaptation strategies on governance?
24 - Direct economic loss attributed to hydro-meteorological disasters in relation to GDP 17 - Percentage of land area suffering from unusually wet or dry conditions (Standard Precipitation Index) 18 - Level of water stress: freshwater withdrawal as a proportion of available freshwater resources Climate change impact on biodiversity (indicator still to be defined) 20 - Carbon stock in soil 21 - Proportion of land that is degraded over total land area 22 - Number of deaths and missing persons attributed to hydro-meteorological disasters, per 100,000 population 25 - Number of people whose destroyed dwellings were attributed to hydro-meteorological disasters 26 - Incidence of climate-related vector-borne diseases 27 - Excess mortality related to heat 28 - Direct agricultural loss attributed to hydro-meteorological disasters
How much land area is vulnerable to adverse impacts of climate change?
How much land area is vulnerable to adverse impacts of climate change?
17 - Percentage of land area suffering from unusually wet or dry conditions (Standard Precipitation Index) 21 - Proportion of land that is degraded over total land area
Is there water scarcity and what is the trend in time?
Is there water scarcity and what is the trend in time?
17 - Percentage of land area suffering from unusually wet or dry conditions (Standard Precipitation Index) 18 - Level of water stress: freshwater withdrawal as a proportion of available freshwater resources 36 - Change in water use efficiency over time
63
ANNEX IV. METADATA OF CORE CLIMATE CHANGE-RELATED INDICATORS (IN A SEPARATE FILE) The metadata sheets are presented as a separate file.
Conf
eren
ce o
f Eur
opea
n St
atis
ticia
ns’
Set o
f Cor
e Cl
imat
e Ch
ange
-rel
ated
Indi
cato
rs a
nd S
tati
stic
sU
sing
the
Syst
em o
f Env
ironm
enta
l-Eco
nom
ic A
ccou
ntin
g Climate change is an existential threat and provides an immense challenge for humanity. A better understanding of all its aspects, through monitoring, modelling, analysis and reporting, is crucial to decide on the best course of action.
This document presents a set of core internationally comparable climate change-related indicators and statistics, developed by a dedicated UNECE Task Force established by the Conference of European Statisticians (CES). This indicator set (the CES Indicator Set) was endorsed in 2020 by the Heads of national statistical offices of more than 60 CES member countries.
The CES Indicator Set provides the foundation for developing national sets of climate change-related indicators intended to show the big picture of climate change-related issues, address the most relevant current policy questions and help meet upcoming information needs. It includes 44 indicators covering climate change drivers, emissions, climate change impacts, mitigation and adaptation. It also proposes corresponding contextual and operational indicators, helping interpret the core set in the national and global context and provide more details according to national circumstances and priorities. The selection of indicators followed a careful vetting process based on the criteria of policy relevance, methodological soundness and data availability described in the present document. The CES Indicator Set is the recommended set of climate change-related indicators to be compiled and published in the CES member countries.
This document is accompanied by “Implementation Guidelines for the CES Set of Core Climate Change-Related Indicators and Statistics” and detailed information on individual indicators in the metadata sheets.
Palais des NationsCH - 1211 Geneva 10, SwitzerlandTelephone: +41(0)22 917 12 34E-mail: [email protected]: http://www.unece.org
United Nations Economic Commission for Europe
Conference of European Statisticians’ Set of Core Climate Change-related Indicators and Statistics U
sing the System
of Environmental-Econom
ic Accounting
UN
ECE