conference call 2021
TRANSCRIPT

2021
THIRD QUARTER
Conference Call 888-346-0688 | ID – EastGroup October 27, 2021 11:00 a.m. Eastern Time webcast available at EastGroup.net
Supplemental Information
400 W. Parkway Place, Suite 100, Ridgeland, MS 39157 | TEL: 601-354-3555 | FAX: 601-352-1441 | EastGroup.net
September 30, 2021
Page 2 of 24
Table of Contents
Financial Information:
Consolidated Balance Sheets ..................................................................................... 3 Consolidated Statements of Income and Comprehensive Income ............................ 4 Reconciliations of GAAP to Non-GAAP Measures .................................................. 5 Consolidated Statements of Cash Flows.................................................................... 7 Same Property Portfolio Analysis ............................................................................. 8 Additional Financial Information .............................................................................. 9 Financial Statistics ..................................................................................................... 10
Capital Deployment:
Development and Value-Add Properties Summary .................................................. 11 Development and Value-Add Properties Transferred to Real Estate Properties ....... 12 Acquisitions and Dispositions ................................................................................... 13 Real Estate Improvements and Leasing Costs ........................................................... 14
Property Information:
Leasing Statistics and Occupancy Summary ............................................................. 15 Core Market Operating Statistics............................................................................... 16 Lease Expiration Summary ........................................................................................ 17 Top 10 Customers by Annualized Base Rent ............................................................ 18
Capitalization:
Debt and Equity Market Capitalization ..................................................................... 19 Continuous Common Equity Program....................................................................... 20 Debt-to-EBITDAre Ratios ......................................................................................... 21
Other Information:
Outlook for 2021 ........................................................................................................ 22 Glossary of REIT Terms ............................................................................................ 23
FORWARD-LOOKING STATEMENTS The statements and certain other information contained herein, which can be identified by the use of forward-looking terminology such as “may,” “will,” “seek,” “expects,” “anticipates,” “believes,” “targets,” “intends,” “should,” “estimates,” “could,” “continue,” “assume,” “projects” or “plans” and variations of such words or similar expressions or the negative of such words, constitute “forward-looking statements” within the meaning of Section 27A of the Securities Act of 1933, as amended, and Section 21E of the Securities Exchange Act of 1934, as amended, and are subject to the safe harbors created thereby. These forward-looking statements reflect the Company’s current views about its plans, intentions, expectations, strategies and prospects, which are based on the information currently available to the Company and on assumptions it has made. Although the Company believes that its plans, intentions, expectations, strategies and prospects as reflected in or suggested by those forward-looking statements are reasonable, the Company can give no assurance that such plans, intentions, expectations or strategies will be attained or achieved. Furthermore, these forward-looking statements should be considered as subject to the many risks and uncertainties that exist in the Company’s operations and business environment. Such risks and uncertainties could cause actual results to differ materially from those projected. These uncertainties include, but are not limited to: international, national, regional and local economic conditions; the duration and extent of the impact of the coronavirus (“COVID-19”) pandemic, including as a result of any COVID-19 variants or as affected by the efficacy of COVID-19 vaccines, and any related lockdowns or other orders on our business operations or the business operations of our tenants (including their ability to timely make rent payments) and the economy generally; disruption in supply and delivery chains; the general level of interest rates and ability to raise equity capital on attractive terms; financing risks, including the risks that our cash flows from operations may be insufficient to meet required payments of principal and interest, and we may be unable to refinance our existing debt upon maturity or obtain new financing on attractive terms or at all; our ability to retain our credit agency ratings; our ability to comply with applicable financial covenants; the competitive environment in which the Company operates; fluctuations of occupancy or rental rates; potential defaults (including bankruptcies or insolvency) on or non-renewal of leases by tenants, or our ability to lease space at current or anticipated rents, particularly in light of the significant uncertainty as to when and the conditions under which current or potential tenants will be able to operate physical locations in the future; potential changes in the law or governmental regulations and interpretations of those laws and regulations, including changes in real estate laws or REIT or corporate income tax laws, and potential increases in real property tax rates; our ability to maintain our qualification as a REIT; acquisition and development risks, including failure of such acquisitions and development projects to perform in accordance with projections; natural disasters such as fires, floods, tornadoes, hurricanes and earthquakes; pandemics, epidemics or other public health emergencies, such as the outbreak of COVID-19; the terms of governmental regulations that affect us and interpretations of those regulations, including the costs of compliance with those regulations, changes in real estate and zoning laws and increases in real property tax rates; credit risk in the event of non-performance by the counterparties to our interest rate swaps; lack of or insufficient amounts of insurance; litigation, including costs associated with prosecuting or defending claims and any adverse outcomes; our ability to retain key personnel; the consequences of future terrorist attacks or civil unrest; and environmental liabilities, including costs, fines or penalties that may be incurred due to necessary remediation of contamination of properties presently owned or previously owned by us. All forward-looking statements should be read in light of the risks identified in Part I, Item 1A. Risk Factors within the Company’s Annual Report on Form 10-K for the year ended December 31, 2020, and in its subsequent Quarterly Reports on Form 10-Q. The Company assumes no obligation to update publicly any forward-looking statements, including its Outlook for 2021, whether as a result of new information, future events or otherwise.

Page 3 of 24
Consolidated Balance Sheets (In thousands, except share and per share data)
(Unaudited)
September 30, 2021 December 31, 2020ASSETSReal estate properties 3,484,743$ 3,159,497 Development and value-add properties 352,344 359,588
3,837,087 3,519,085 Less accumulated depreciation (1,031,027) (955,328)
2,806,060 2,563,757
Unconsolidated investment 7,111 7,446 Cash 247 21 Other assets 171,592 149,579
TOTAL ASSETS 2,985,010$ 2,720,803
LIABILITIES AND EQUITY
LIABILITIESUnsecured bank credit facilities, net of debt issuance costs 58,719$ 124,194 Unsecured debt, net of debt issuance costs 1,242,430 1,107,708 Secured debt, net of debt issuance costs 35,466 78,993 Accounts payable and accrued expenses 149,979 69,573 Other liabilities 78,676 69,817 Total Liabilities 1,565,270 1,450,285
EQUITYStockholders' Equity: Common shares; $0.0001 par value; 70,000,000 shares authorized; 40,684,273 shares issued and outstanding at September 30, 2021 and 39,676,828 at December 31, 2020 4 4 Excess shares; $0.0001 par value; 30,000,000 shares authorized; no shares issued - - Additional paid-in capital 1,765,748 1,610,053 Distributions in excess of earnings (344,378) (329,667) Accumulated other comprehensive loss (2,476) (10,752) Total Stockholders' Equity 1,418,898 1,269,638
Noncontrolling interest in joint ventures 842 880 Total Equity 1,419,740 1,270,518
TOTAL LIABILITIES AND EQUITY 2,985,010$ 2,720,803

Page 4 of 24
Consolidated Statements of Income and Comprehensive Income (In thousands, except per share data)
(Unaudited)
2021 2020 2021 2020
REVENUESIncome from real estate operations 104,584$ 92,000 302,063 270,077 Other revenue 13 12 40 278
104,597 92,012 302,103 270,355EXPENSESExpenses from real estate operations 29,644 26,325 85,521 77,505Depreciation and amortization 32,263 29,211 93,925 85,673General and administrative 3,559 3,714 12,081 11,020Indirect leasing costs 133 248 597 522
65,599 59,498 192,124 174,720OTHER INCOME (EXPENSE)Interest expense (8,416) (8,347) (24,873) (25,150) Other 210 244 621 711 NET INCOME 30,792 24,411 85,727 71,196
Net income attributable to noncontrolling interest in joint ventures (21) (10) (59) (14)NET INCOME ATTRIBUTABLE TO EASTGROUP PROPERTIES, INC. COMMON STOCKHOLDERS 30,771 24,401 85,668 71,182 Other comprehensive income (loss) - interest rate swaps 1,325 1,362 8,276 (16,252)
TOTAL COMPREHENSIVE INCOME 32,096$ 25,763 93,944 54,930
BASIC PER COMMON SHARE DATA FOR NET INCOME ATTRIBUTABLE TO EASTGROUP PROPERTIES, INC. COMMON STOCKHOLDERS Net income attributable to common stockholders 0.76$ 0.62 2.14 1.82
Weighted average shares outstanding 40,434 39,338 40,058 39,077
DILUTED PER COMMON SHARE DATA FOR NET INCOME ATTRIBUTABLE TO EASTGROUP PROPERTIES, INC. COMMON STOCKHOLDERS Net income attributable to common stockholders 0.76$ 0.62 2.13 1.82
Weighted average shares outstanding 40,567 39,450 40,165 39,168
Nine Months EndedSeptember 30,September 30,
Three Months Ended
Page 5 of 24
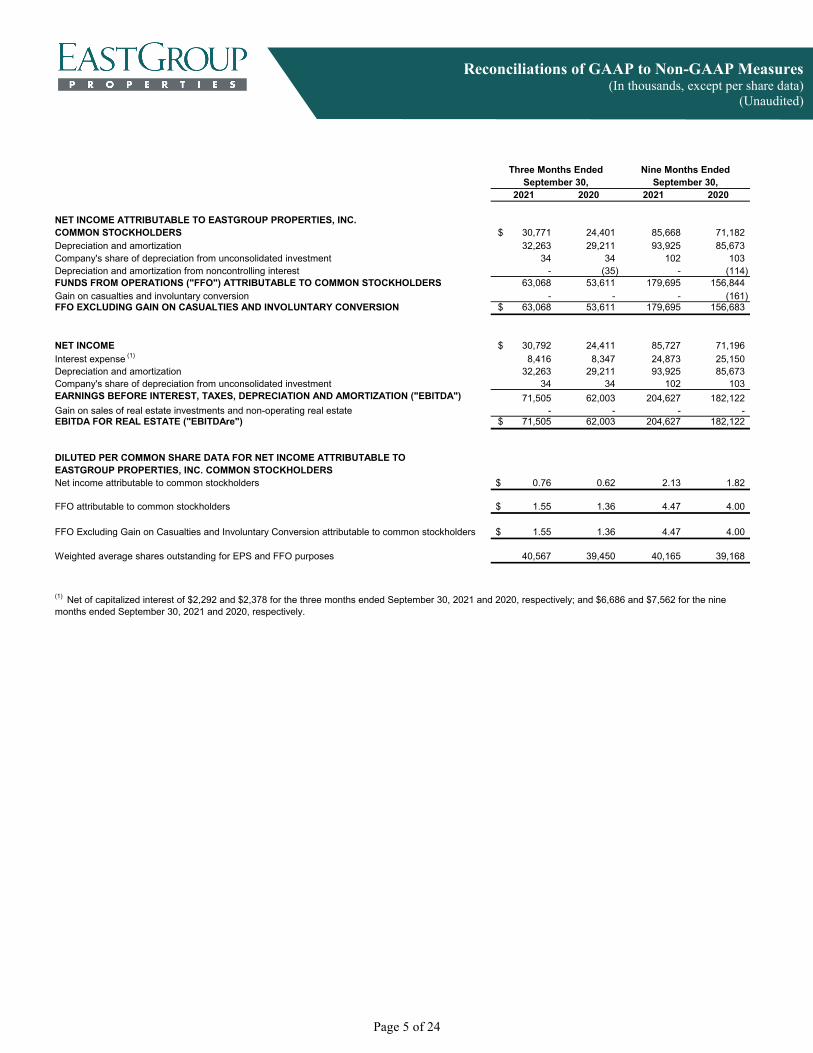
Reconciliations of GAAP to Non-GAAP Measures (In thousands, except per share data)
(Unaudited)
2021 2020 2021 2020
NET INCOME ATTRIBUTABLE TO EASTGROUP PROPERTIES, INC.COMMON STOCKHOLDERS 30,771$ 24,401 85,668 71,182 Depreciation and amortization 32,263 29,211 93,925 85,673 Company's share of depreciation from unconsolidated investment 34 34 102 103 Depreciation and amortization from noncontrolling interest - (35) - (114) FUNDS FROM OPERATIONS ("FFO") ATTRIBUTABLE TO COMMON STOCKHOLDERS 63,068 53,611 179,695 156,844 Gain on casualties and involuntary conversion - - - (161) FFO EXCLUDING GAIN ON CASUALTIES AND INVOLUNTARY CONVERSION 63,068$ 53,611 179,695 156,683
NET INCOME 30,792$ 24,411 85,727 71,196 Interest expense (1) 8,416 8,347 24,873 25,150 Depreciation and amortization 32,263 29,211 93,925 85,673 Company's share of depreciation from unconsolidated investment 34 34 102 103 EARNINGS BEFORE INTEREST, TAXES, DEPRECIATION AND AMORTIZATION ("EBITDA") 71,505 62,003 204,627 182,122 Gain on sales of real estate investments and non-operating real estate - - - - EBITDA FOR REAL ESTATE ("EBITDAre") 71,505$ 62,003 204,627 182,122
DILUTED PER COMMON SHARE DATA FOR NET INCOME ATTRIBUTABLE TO EASTGROUP PROPERTIES, INC. COMMON STOCKHOLDERSNet income attributable to common stockholders 0.76$ 0.62 2.13 1.82
FFO attributable to common stockholders 1.55$ 1.36 4.47 4.00
FFO Excluding Gain on Casualties and Involuntary Conversion attributable to common stockholders 1.55$ 1.36 4.47 4.00
Weighted average shares outstanding for EPS and FFO purposes 40,567 39,450 40,165 39,168
September 30,
(1) Net of capitalized interest of $2,292 and $2,378 for the three months ended September 30, 2021 and 2020, respectively; and $6,686 and $7,562 for the nine months ended September 30, 2021 and 2020, respectively.
Three Months EndedSeptember 30,
Nine Months Ended

Page 6 of 24
Reconciliations of GAAP to Non-GAAP Measures (Continued) (In thousands)
(Unaudited)
2021 2020 2021 2020
NET INCOME 30,792$ 24,411 85,727 71,196 Interest income (2) (36) (6) (86) Other revenue (13) (12) (40) (278) Indirect leasing costs 133 248 597 522 Depreciation and amortization 32,263 29,211 93,925 85,673 Company's share of depreciation from unconsolidated investment 34 34 102 103 Interest expense (1) 8,416 8,347 24,873 25,150 General and administrative expense (2) 3,559 3,714 12,081 11,020 Noncontrolling interest in PNOI of consolidated joint ventures (15) (46) (46) (130) PROPERTY NET OPERATING INCOME ("PNOI") 75,167 65,871 217,213 193,170 PNOI from 2020 and 2021 acquisitions (1,447) (129) (2,903) (300) PNOI from 2020 and 2021 development and value-add properties (7,184) (3,367) (18,501) (8,210) PNOI from 2020 operating property dispositions - (282) - (826) Other PNOI 77 65 178 169 SAME PNOI (Straight-Line Basis) 66,613 62,158 195,987 184,003 Net lease termination fee income from same properties (353) (192) (947) (661) SAME PNOI EXCLUDING INCOME FROM LEASE TERMINATIONS (Straight-Line Basis) 66,260 61,966 195,040 183,342 Straight-line rent adjustments for same properties (1,365) (62) (2,632) (530) Acquired leases — market rent adjustment amortization for same properties (96) (325) (522) (1,060) SAME PNOI EXCLUDING INCOME FROM LEASE TERMINATIONS (Cash Basis) 64,799$ 61,579 191,886 181,752
Nine Months EndedSeptember 30, September 30,
(1) Net of capitalized interest of $2,292 and $2,378 for the three months ended September 30, 2021 and 2020, respectively; and $6,686 and $7,562 for the nine months ended September 30, 2021 and 2020, respectively.(2) Net of capitalized development costs of $2,031 and $1,447 for the three months ended September 30, 2021 and 2020, respectively; and $5,311 and $5,052 for the nine months ended September 30, 2021 and 2020, respectively.
Three Months Ended
Page 7 of 24
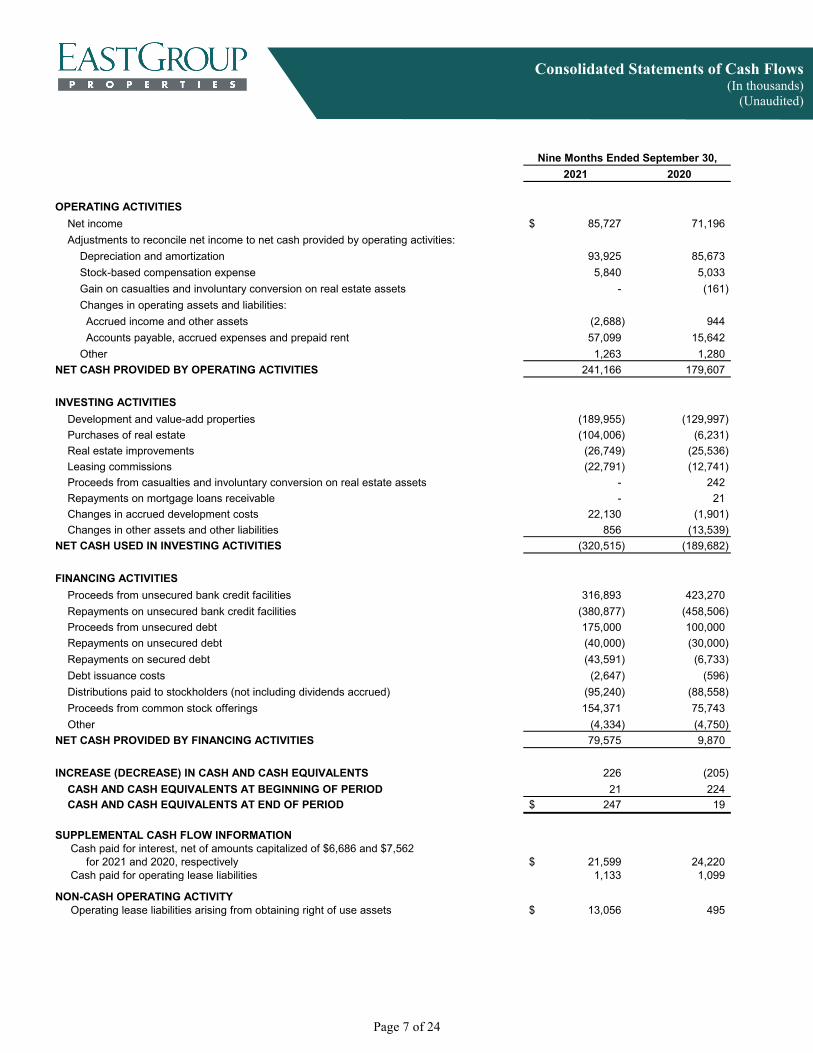
Consolidated Statements of Cash Flows (In thousands)
(Unaudited)
2021 2020
OPERATING ACTIVITIES Net income 85,727$ 71,196 Adjustments to reconcile net income to net cash provided by operating activities: Depreciation and amortization 93,925 85,673 Stock-based compensation expense 5,840 5,033 Gain on casualties and involuntary conversion on real estate assets - (161) Changes in operating assets and liabilities: Accrued income and other assets (2,688) 944 Accounts payable, accrued expenses and prepaid rent 57,099 15,642 Other 1,263 1,280 NET CASH PROVIDED BY OPERATING ACTIVITIES 241,166 179,607
INVESTING ACTIVITIES Development and value-add properties (189,955) (129,997) Purchases of real estate (104,006) (6,231) Real estate improvements (26,749) (25,536) Leasing commissions (22,791) (12,741) Proceeds from casualties and involuntary conversion on real estate assets - 242 Repayments on mortgage loans receivable - 21 Changes in accrued development costs 22,130 (1,901) Changes in other assets and other liabilities 856 (13,539) NET CASH USED IN INVESTING ACTIVITIES (320,515) (189,682)
FINANCING ACTIVITIES Proceeds from unsecured bank credit facilities 316,893 423,270 Repayments on unsecured bank credit facilities (380,877) (458,506) Proceeds from unsecured debt 175,000 100,000 Repayments on unsecured debt (40,000) (30,000) Repayments on secured debt (43,591) (6,733) Debt issuance costs (2,647) (596) Distributions paid to stockholders (not including dividends accrued) (95,240) (88,558) Proceeds from common stock offerings 154,371 75,743 Other (4,334) (4,750) NET CASH PROVIDED BY FINANCING ACTIVITIES 79,575 9,870
INCREASE (DECREASE) IN CASH AND CASH EQUIVALENTS 226 (205) CASH AND CASH EQUIVALENTS AT BEGINNING OF PERIOD 21 224 CASH AND CASH EQUIVALENTS AT END OF PERIOD 247$ 19
SUPPLEMENTAL CASH FLOW INFORMATION Cash paid for interest, net of amounts capitalized of $6,686 and $7,562 for 2021 and 2020, respectively 21,599$ 24,220 Cash paid for operating lease liabilities 1,133 1,099
NON-CASH OPERATING ACTIVITY Operating lease liabilities arising from obtaining right of use assets 13,056$ 495
Nine Months Ended September 30,

Page 8 of 24
Same Property Portfolio Analysis (In thousands)
(Unaudited)
2021 2020 % Change 2021 2020 % ChangeSame Property Portfolio (1)
Square feet as of period end 41,305 41,305 41,305 41,305 Average occupancy 97.7% 97.0% 0.7% 97.5% 96.9% 0.6%Occupancy as of period end 98.1% 96.9% 1.2% 98.1% 96.9% 1.2%
Same Property Portfolio Analysis (Cash Basis) (1)
Income from real estate operations 91,602$ 86,541 5.8% 270,518$ 256,304 5.5%Less cash received for lease terminations (396) (227) (1,087) (708)
Income excluding lease termination income 91,206 86,314 5.7% 269,431 255,596 5.4%Expenses from real estate operations (26,407) (24,735) 6.8% (77,545) (73,844) 5.0%
PNOI excluding income from lease terminations 64,799$ 61,579 5.2% 191,886$ 181,752 5.6%
Same Property Portfolio Analysis (Straight-Line Basis) (1)
Income from real estate operations 93,020$ 86,893 7.1% 273,532$ 257,847 6.1%Less cash received for lease terminations (396) (227) (1,087) (708)Add straight-line rent write-offs for lease terminations 43 35 140 47
Income excluding lease termination income 92,667 86,701 6.9% 272,585 257,186 6.0%Expenses from real estate operations (26,407) (24,735) 6.8% (77,545) (73,844) 5.0%
PNOI excluding income from lease terminations 66,260$ 61,966 6.9% 195,040$ 183,342 6.4%
(1) Includes properties which were included in the operating portfolio for the entire period of 1/1/20 through 9/30/21.
September 30, September 30,Three Months Ended Nine Months Ended

Page 9 of 24
Additional Financial Information (In thousands)
(Unaudited)
2021 2020 2021 2020SELECTED INCOME STATEMENT INFORMATION
Straight-line rent income adjustment 2,542$ 904 6,511 3,734 Recoveries (reserves) for uncollectible straight-line rent 183 (126) 445 (1,021) Net straight-line rent adjustment 2,725 778 6,956 2,713
Cash received for lease terminations 396 227 1,087 708 Less straight-line rent write-offs (43) (35) (140) (47) Net lease termination fee income 353 192 947 661
Recoveries (reserves) for uncollectible cash rent 73 (320) (99) (645)
Stock-based compensation expense (1,829) (1,612) (5,840) (5,033)
Debt issuance costs amortization (320) (354) (962) (1,045)
Indirect leasing costs (133) (248) (597) (522)
Gain on casualties and involuntary conversion (1) - - - 161
Acquired leases - market rent adjustment amortization 230 332 704 1,078
2021 2020 2021 2020
WEIGHTED AVERAGE COMMON SHARESWeighted average common shares 40,434 39,338 40,058 39,077 BASIC SHARES FOR EARNINGS PER SHARE ("EPS") 40,434 39,338 40,058 39,077
Potential common shares: Unvested restricted stock 133 112 107 91 DILUTED SHARES FOR EPS AND FFO 40,567 39,450 40,165 39,168
(1) Included in Other revenue on the Consolidated Statements of Income and Comprehensive Income; included in FFO.
September 30,
Three Months Ended
Three Months Ended
September 30,Nine Months Ended
September 30,
Nine Months EndedSeptember 30,
(Items below represent increases or (decreases) in FFO)
Page 10 of 24
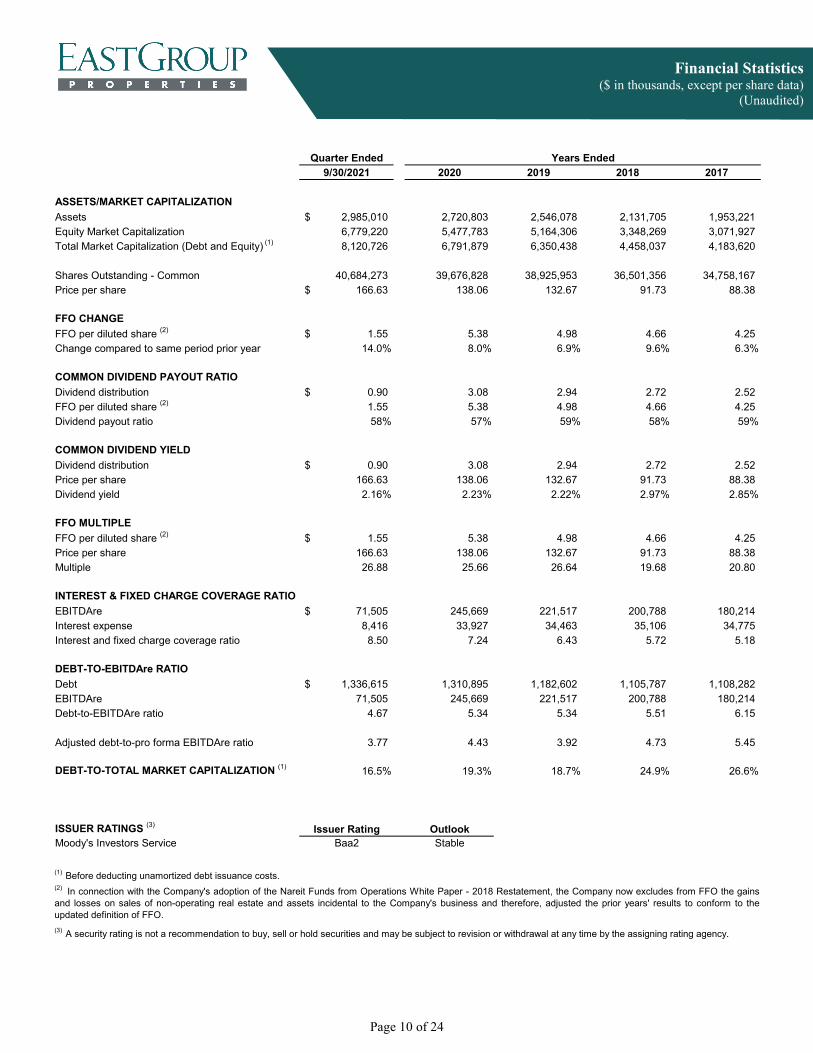
Financial Statistics ($ in thousands, except per share data)
(Unaudited)
Quarter Ended9/30/2021 2020 2019 2018 2017
ASSETS/MARKET CAPITALIZATIONAssets 2,985,010$ 2,720,803 2,546,078 2,131,705 1,953,221 Equity Market Capitalization 6,779,220 5,477,783 5,164,306 3,348,269 3,071,927Total Market Capitalization (Debt and Equity)
(1) 8,120,726 6,791,879 6,350,438 4,458,037 4,183,620
Shares Outstanding - Common 40,684,273 39,676,828 38,925,953 36,501,356 34,758,167Price per share 166.63$ 138.06 132.67 91.73 88.38
FFO CHANGEFFO per diluted share (2) 1.55$ 5.38 4.98 4.66 4.25Change compared to same period prior year 14.0% 8.0% 6.9% 9.6% 6.3%
COMMON DIVIDEND PAYOUT RATIODividend distribution 0.90$ 3.08 2.94 2.72 2.52FFO per diluted share (2) 1.55 5.38 4.98 4.66 4.25Dividend payout ratio 58% 57% 59% 58% 59%
COMMON DIVIDEND YIELDDividend distribution 0.90$ 3.08 2.94 2.72 2.52Price per share 166.63 138.06 132.67 91.73 88.38Dividend yield 2.16% 2.23% 2.22% 2.97% 2.85%
FFO MULTIPLEFFO per diluted share (2) 1.55$ 5.38 4.98 4.66 4.25Price per share 166.63 138.06 132.67 91.73 88.38Multiple 26.88 25.66 26.64 19.68 20.80
INTEREST & FIXED CHARGE COVERAGE RATIOEBITDAre 71,505$ 245,669 221,517 200,788 180,214Interest expense 8,416 33,927 34,463 35,106 34,775Interest and fixed charge coverage ratio 8.50 7.24 6.43 5.72 5.18
DEBT-TO-EBITDAre RATIODebt 1,336,615$ 1,310,895 1,182,602 1,105,787 1,108,282EBITDAre 71,505 245,669 221,517 200,788 180,214Debt-to-EBITDAre ratio 4.67 5.34 5.34 5.51 6.15
Adjusted debt-to-pro forma EBITDAre ratio 3.77 4.43 3.92 4.73 5.45
DEBT-TO-TOTAL MARKET CAPITALIZATION (1) 16.5% 19.3% 18.7% 24.9% 26.6%
ISSUER RATINGS (3) Issuer Rating OutlookMoody's Investors Service Baa2 Stable
(1) Before deducting unamortized debt issuance costs.
(3) A security rating is not a recommendation to buy, sell or hold securities and may be subject to revision or withdrawal at any time by the assigning rating agency.
Years Ended
(2) In connection with the Company's adoption of the Nareit Funds from Operations White Paper - 2018 Restatement, the Company now excludes from FFO the gainsand losses on sales of non-operating real estate and assets incidental to the Company's business and therefore, adjusted the prior years' results to conform to theupdated definition of FFO.

Page 11 of 24
Development and Value-Add Properties Summary ($ in thousands)
(Unaudited)
Anticipated3rd Qtr Cumulative Projected Conversion % Leased
Square Feet (SF) 2021 at 9/30/21 Total Costs Date (1) 10/25/21Lease-up Ridgeview 1 & 2 San Antonio, TX 226,000 641$ 19,114 21,300 10/21 90% Gilbert Crossroads C & D Phoenix, AZ 178,000 3,859 20,295 24,200 12/21 100% LakePort 1-3 Dallas, TX 194,000 2,310 23,132 25,300 12/21 100% Steele Creek 10 Charlotte, NC 162,000 567 10,757 12,600 12/21 100% Access Point 1 (2) Greenville, SC 156,000 436 12,388 12,600 01/22 70% Access Point 2 (2) Greenville, SC 159,000 499 11,302 12,400 05/22 36% Grand Oaks 75 3 Tampa. FL 136,000 1,218 10,041 12,000 09/22 50% Horizon West 2 & 3 Orlando, FL 210,000 2,242 16,564 18,200 09/22 17%Total Lease-up 1,421,000 11,772 123,593 138,600 71% Wgt Avg %
Lease-Up: Projected Stabilized Yield (3) 7.2%
Under Construction Speed Distribution Center San Diego, CA 519,000 21,748 53,966 88,600 02/22 100% Steele Creek 8 Charlotte, NC 72,000 2,000 2,000 8,400 08/22 100% CreekView 9 & 10 Dallas, TX 145,000 2,085 7,571 17,200 12/22 0% Tri-County Crossing 5 San Antonio, TX 105,000 2,071 3,674 10,300 01/23 0% Basswood 1 & 2 Fort Worth, TX 237,000 3,731 12,147 22,100 02/23 0% Grand Oaks 75 4 Tampa. FL 185,000 3,686 3,686 17,900 02/23 0% SunCoast 12 Fort Myers, FL 79,000 893 2,103 8,000 02/23 0% Gateway 3 Miami, FL 133,000 8,961 8,961 19,100 04/23 0% Americas Ten 2 El Paso, TX 168,000 3,655 3,655 14,100 05/23 0% Tri-County Crossing 6 San Antonio, TX 124,000 770 2,519 9,900 05/23 0% 45 Crossing Austin, TX 177,000 12,680 12,680 26,200 06/23 0% McKinney 3 & 4 Dallas, TX 212,000 5,365 5,365 26,300 06/23 0% Ridgeview 3 San Antonio, TX 88,000 1,978 1,978 10,700 06/23 0% Grand West Crossing 1 Houston, TX 121,000 3,801 3,801 15,700 08/23 0% I-20 West Business Center Atlanta, GA 155,000 2,126 2,126 14,200 10/23 0%Total Under Construction 2,520,000 75,550 126,232 308,700 23% Wgt Avg %
Under Construction: Projected Stabilized Yield (3) 6.7% 41% Wgt Avg %
Development: Projected Stabilized Yield (3) 6.9%Value-Add: Projected Stabilized Yield (3) 7.0%
Prospective Development Acres Projected SF Fort Myers, FL 42 543,000 514 8,078 Miami, FL (4) 17 243,000 (6,591) 14,202 Orlando, FL 107 1,278,000 1,003 25,435 Tampa, FL (4) 3 32,000 (3,313) 825 Atlanta, GA (4) - - (1,803) - Jackson, MS 3 28,000 - 706 Charlotte, NC (4) 23 250,000 (1,777) 2,661 Greenville, SC 59 400,000 1,685 1,685 Dallas, TX (4) 37 349,000 (4,889) 14,964 El Paso, TX (4) - - (2,885) - Fort Worth, TX 50 652,000 194 15,132 Houston, TX (4) 76 1,082,000 (3,233) 18,123 San Antonio, TX (4) 6 55,000 (1,420) 708 Total Prospective Development (4) 423 4,912,000 (22,515) 102,519Total Development and Value-Add Properties 423 8,853,000 64,807$ 352,344
(1) Development properties will transfer to the operating portfolio at the earlier of 90% occupancy or one year after shell completion. Value-Add properties will transfer at the earlier of 90% occupancy or one year after acquisition.(2) These value-add projects were acquired by EastGroup.(3) Weighted average yield based on estimated annual property net operating income on a straight-line basis at 100% occupancy divided by projected total costs.(4) Negative amounts represent land inventory costs transferred to Under Construction.
Costs Incurred

Page 12 of 24
Development and Value-Add Properties Transferred to Real Estate Properties
($ in thousands) (Unaudited)
3rd Qtr Cumulative Conversion % LeasedSquare Feet (SF) 2021 at 9/30/21 Date 10/25/21
1st Quarter Gilbert Crossroads A & B Phoenix, AZ 140,000 -$ 16,969 01/21 100% CreekView 7 & 8 Dallas, TX 137,000 - 17,691 03/21 100% Hurricane Shoals 3 Atlanta, GA 101,000 (9) 10,333 03/21 100% Northpoint 200 (1) Atlanta, GA 79,000 12 6,893 03/21 100% Rancho Distribution Center (1) Los Angeles, CA 162,000 270 27,645 03/21 100%
619,000 273 79,531
2nd Quarter World Houston 44 Houston, TX 134,000 108 9,126 05/21 100% Gateway 4 Miami, FL 197,000 396 23,762 06/21 100% Interstate Commons 2 (1) Phoenix, AZ 142,000 26 12,325 06/21 100% Settlers Crossing 3 & 4 Austin, TX 173,000 18 20,000 06/21 100% SunCoast 7 Fort Myers, FL 77,000 480 8,139 06/21 100% Tri-County Crossing 3 & 4 San Antonio, TX 203,000 351 16,066 06/21 100%
926,000 1,379 89,418
3rd Quarter Cherokee 75 Business Center 2 (1) Atlanta, GA 105,000 330 9,302 07/21 100% Northwest Crossing 1-3 Houston, TX 278,000 510 24,006 09/21 81%
383,000 840 33,308
Total Transferred to Real Estate Properties 1,928,000 2,492$ 202,257
Projected Stabilized Yield (2) 7.0% 97% Wgt Avg %
(1) These value-add projects were acquired by EastGroup.(2) Weighted average yield based on estimated annual property net operating income on a straight-line basis at 100% occupancy divided by projected total costs.
Costs Incurred
Page 13 of 24
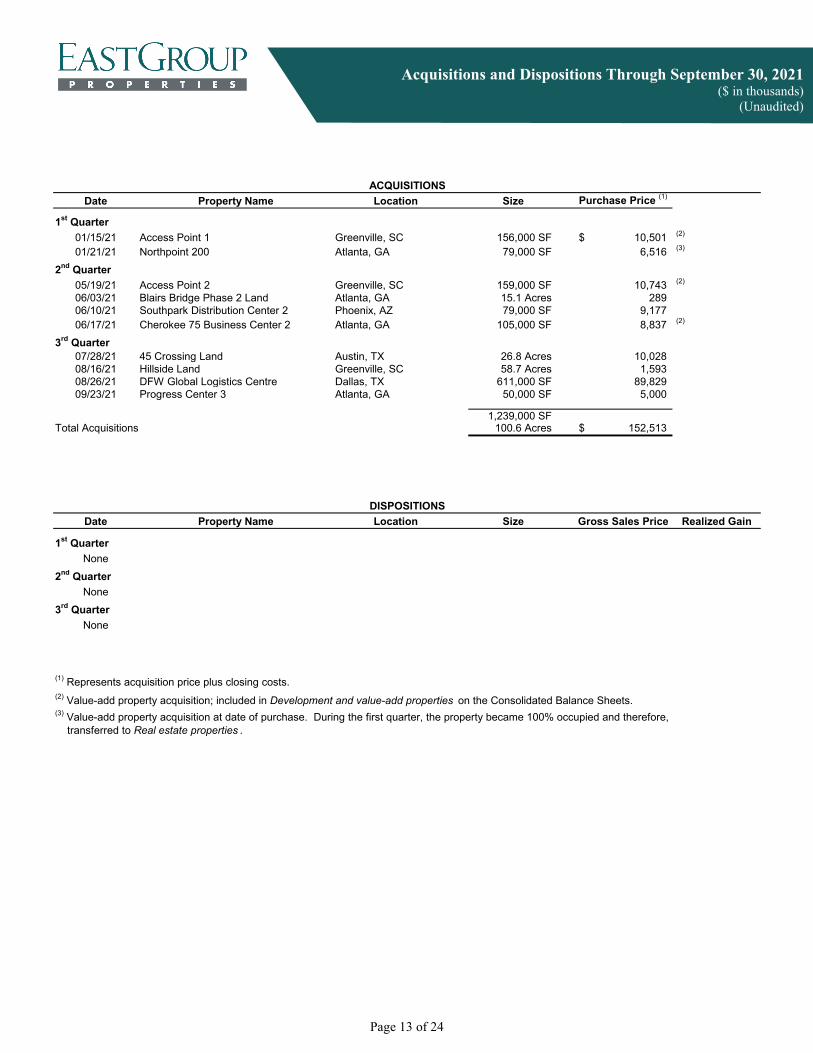
Acquisitions and Dispositions Through September 30, 2021
($ in thousands) (Unaudited)
Date Property Name Location Size Purchase Price (1)
1st Quarter01/15/21 Access Point 1 Greenville, SC 156,000 SF 10,501$ (2)
01/21/21 Northpoint 200 Atlanta, GA 79,000 SF 6,516 (3)
2nd Quarter05/19/21 Access Point 2 Greenville, SC 159,000 SF 10,743 (2)
06/03/21 Blairs Bridge Phase 2 Land Atlanta, GA 15.1 Acres 289 06/10/21 Southpark Distribution Center 2 Phoenix, AZ 79,000 SF 9,177 06/17/21 Cherokee 75 Business Center 2 Atlanta, GA 105,000 SF 8,837 (2)
3rd Quarter07/28/21 45 Crossing Land Austin, TX 26.8 Acres 10,028 08/16/21 Hillside Land Greenville, SC 58.7 Acres 1,593 08/26/21 DFW Global Logistics Centre Dallas, TX 611,000 SF 89,829 09/23/21 Progress Center 3 Atlanta, GA 50,000 SF 5,000
1,239,000 SFTotal Acquisitions 100.6 Acres 152,513$
Date Property Name Location Size Gross Sales Price
1st QuarterNone
2nd QuarterNone
3rd QuarterNone
(2) Value-add property acquisition; included in Development and value-add properties on the Consolidated Balance Sheets.
(1) Represents acquisition price plus closing costs.
Realized Gain
(3) Value-add property acquisition at date of purchase. During the first quarter, the property became 100% occupied and therefore, transferred to Real estate properties .
DISPOSITIONS
ACQUISITIONS

Page 14 of 24
Real Estate Improvements and Leasing Costs
(In thousands) (Unaudited)
REAL ESTATE IMPROVEMENTS 2021 2020 2021 2020
Upgrade on acquisitions 214$ 117 368 282 Tenant improvements: New tenants 3,349 3,114 8,516 8,870 Renewal tenants 609 398 2,793 2,403 Other: Building improvements 1,521 1,195 4,925 3,185 Roofs 1,682 1,443 7,744 5,025 Parking lots 439 90 870 439 Other 160 207 853 560
TOTAL REAL ESTATE IMPROVEMENTS (1) 7,974$ 6,564 26,069 20,764
CAPITALIZED LEASING COSTS (Principally Commissions)
Development and value-add 1,369$ 1,356 8,928 3,873 New tenants 2,073 2,164 9,228 4,385 Renewal tenants 2,956 2,690 6,496 6,432
TOTAL CAPITALIZED LEASING COSTS (2)(3) 6,398$ 6,210 24,652 14,690
(1) Reconciliation of Total Real Estate Improvements to Real Estate Improvements on the Consolidated Statements of Cash Flows:
2021 2020
Total Real Estate Improvements 26,069$ 20,764 Change in real estate property payables 535 585 Change in construction in progress 145 4,187
26,749$ 25,536
(2) Included in Other Assets on the Consolidated Balance Sheets.(3) Reconciliation of Total Capitalized Leasing Costs to Leasing Commissions on the Consolidated Statements of Cash Flows:
2021 2020
Total Capitalized Leasing Costs 24,652$ 14,690 Change in leasing commissions payables (1,861) (1,949)
22,791$ 12,741
Nine Months Ended
September 30,Nine Months EndedThree Months Ended
September 30,
Nine Months EndedSeptember 30,
Leasing Commissions on the Consolidated Statements of Cash Flows
September 30,
Real Estate Improvements on the Consolidated Statements of Cash Flows
Page 15 of 24
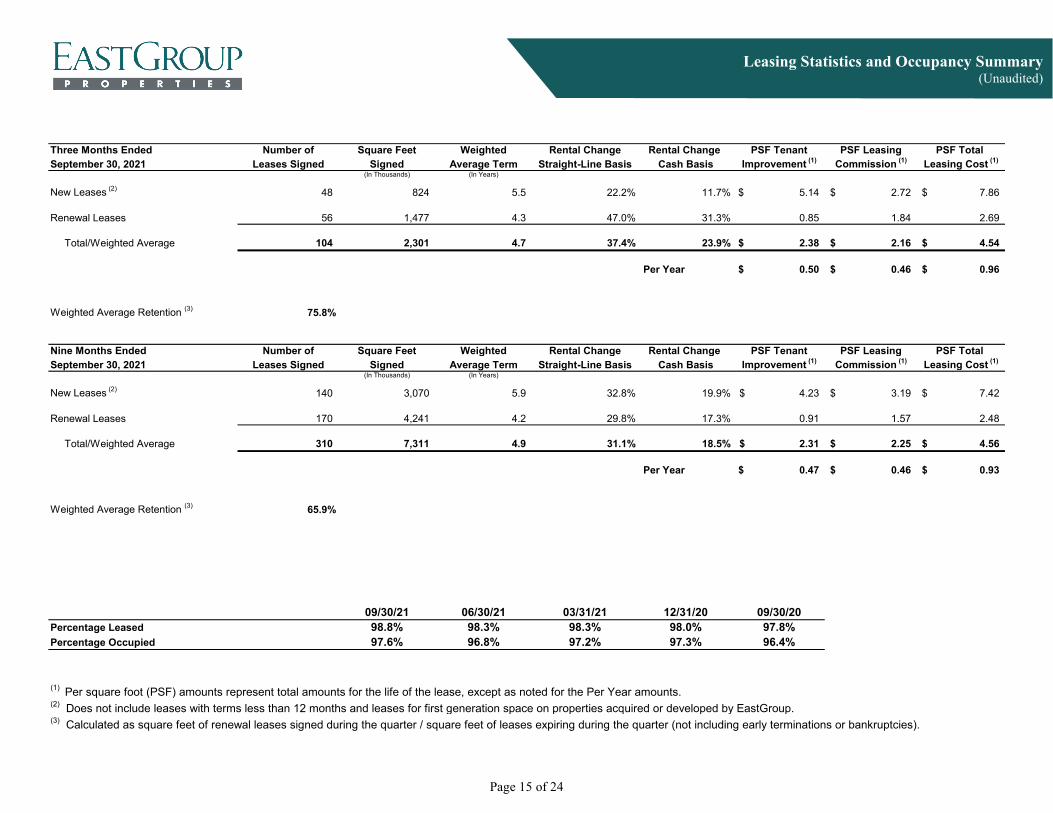
Leasing Statistics and Occupancy Summary (Unaudited)
Three Months Ended Number of Square Feet Weighted Rental Change Rental Change PSF Tenant PSF Leasing PSF Total September 30, 2021 Leases Signed Signed Average Term Straight-Line Basis Cash Basis Improvement (1) Commission (1) Leasing Cost (1)
(In Thousands) (In Years)
New Leases (2) 48 824 5.5 22.2% 11.7% 5.14$ 2.72$ 7.86$
Renewal Leases 56 1,477 4.3 47.0% 31.3% 0.85 1.84 2.69
Total/Weighted Average 104 2,301 4.7 37.4% 23.9% 2.38$ 2.16$ 4.54$
Per Year 0.50$ 0.46$ 0.96$
Weighted Average Retention (3) 75.8%
Nine Months Ended Number of Square Feet Weighted Rental Change Rental Change PSF Tenant PSF Leasing PSF Total September 30, 2021 Leases Signed Signed Average Term Straight-Line Basis Cash Basis Improvement (1) Commission (1) Leasing Cost (1)
(In Thousands) (In Years)
New Leases (2) 140 3,070 5.9 32.8% 19.9% 4.23$ 3.19$ 7.42$
Renewal Leases 170 4,241 4.2 29.8% 17.3% 0.91 1.57 2.48
Total/Weighted Average 310 7,311 4.9 31.1% 18.5% 2.31$ 2.25$ 4.56$
Per Year 0.47$ 0.46$ 0.93$
Weighted Average Retention (3) 65.9%
09/30/21 06/30/21 03/31/21 12/31/20 09/30/20Percentage Leased 98.8% 98.3% 98.3% 98.0% 97.8%Percentage Occupied 97.6% 96.8% 97.2% 97.3% 96.4%
(1) Per square foot (PSF) amounts represent total amounts for the life of the lease, except as noted for the Per Year amounts.(2) Does not include leases with terms less than 12 months and leases for first generation space on properties acquired or developed by EastGroup.(3) Calculated as square feet of renewal leases signed during the quarter / square feet of leases expiring during the quarter (not including early terminations or bankruptcies).

Page 16 of 24
Core Market Operating Statistics September 30, 2021
(Unaudited)
TotalSquare Feet % Annualized % % Straight-Line Cash Straight-Line Cash Straight-Line Cash Straight-Line Cash of Properties of Total Base Rent (1) Leased Occupied 2021 (2) 2022 Basis Basis (4) Basis Basis (4) Basis Basis (4) Basis Basis (4)
FloridaTampa 4,496,000 9.7% 9.1% 99.0% 98.3% 280,000 677,000 7.6% 8.0% 7.5% 7.3% 23.6% 12.1% 24.6% 13.3%Orlando 3,685,000 7.9% 8.3% 98.3% 98.3% 123,000 725,000 2.6% 3.7% 1.3% 1.9% 5.7% -9.9% 20.2% 9.5%Jacksonville 2,273,000 4.9% 3.7% 99.5% 94.9% 116,000 500,000 3.3% 5.5% 7.7% 8.2% 31.8% 18.5% 24.0% 13.3%Miami/Fort Lauderdale 1,656,000 3.6% 4.0% 97.8% 87.7% 7,000 100,000 1.6% 4.4% 1.4% 3.5% 36.2% 22.7% 25.0% 14.5%Fort Myers 626,000 1.3% 1.5% 100.0% 100.0% - 74,000 1.4% 2.6% 1.6% 4.4% N/A N/A 18.2% 6.3%
12,736,000 27.4% 26.6% 98.8% 96.4% 526,000 2,076,000 4.3% 5.5% 4.5% 5.1% 24.7% 12.1% 23.2% 12.3%Texas
Houston 6,208,000 13.4% 12.1% 96.7% 96.3% 235,000 848,000 -0.9% -4.0% -1.0% 0.2% 15.6% 5.2% 4.3% -4.5%Dallas 4,523,000 9.7% 9.2% 100.0% 99.4% 63,000 820,000 1.7% 3.1% 4.4% 4.3% 23.8% 18.5% 18.9% 11.5%San Antonio 3,867,000 8.3% 8.5% 97.9% 95.9% 120,000 396,000 4.0% 4.6% 3.8% 3.1% 19.8% 8.1% 15.6% 5.9%Austin 1,126,000 2.4% 3.0% 100.0% 98.4% 29,000 145,000 4.3% 8.9% 9.8% 13.6% 10.8% 7.2% 33.4% 27.2%El Paso 957,000 2.1% 1.5% 99.4% 99.4% - 118,000 9.5% 9.8% 9.9% 9.0% 42.6% 22.4% 25.1% 13.0%Fort Worth 794,000 1.7% 1.5% 100.0% 95.3% - 41,000 14.3% 21.7% 11.5% 12.2% N/A N/A N/A N/A
17,475,000 37.6% 35.8% 98.3% 97.3% 447,000 2,368,000 2.2% 1.9% 3.0% 3.5% 18.9% 9.8% 14.2% 5.5%California
Los Angeles (5) 2,484,000 5.3% 8.2% 100.0% 100.0% 8,000 210,000 32.3% 21.1% 29.9% 14.8% 144.1% 101.9% 77.0% 52.6%San Francisco 1,045,000 2.2% 3.4% 100.0% 100.0% - 202,000 44.2% 36.0% 36.1% 33.9% N/A N/A 19.3% 10.7%San Diego 867,000 1.9% 2.2% 93.9% 93.9% - 22,000 12.6% -15.4% 0.1% -7.9% N/A N/A 52.2% 39.0%Fresno 398,000 0.9% 0.6% 94.8% 88.4% 66,000 78,000 -0.5% -1.4% -1.8% 0.4% 29.2% 17.0% 26.0% 13.8%
4,794,000 10.3% 14.4% 98.5% 97.9% 74,000 512,000 29.2% 16.2% 23.1% 13.7% 134.2% 95.1% 67.0% 46.2%Arizona
Phoenix 2,862,000 6.2% 6.0% 100.0% 99.7% 79,000 445,000 9.6% 2.6% 12.8% 10.6% 21.7% 9.7% 18.3% 6.9%Tucson 848,000 1.8% 1.7% 100.0% 100.0% 5,000 5,000 1.5% 0.6% 0.0% -4.1% 15.9% 3.0% 5.6% -1.7%
3,710,000 8.0% 7.7% 100.0% 99.8% 84,000 450,000 7.4% 2.1% 9.2% 6.7% 21.1% 9.1% 16.5% 5.7%Other Core
Charlotte 3,407,000 7.3% 6.4% 100.0% 99.4% 148,000 817,000 4.9% 8.5% 0.9% 3.6% 15.6% 4.3% 18.1% 6.0%Atlanta 1,312,000 2.8% 2.4% 100.0% 100.0% 21,000 91,000 19.9% 14.2% 15.5% 7.5% N/A N/A 14.9% 5.4%Denver 886,000 1.9% 2.2% 95.1% 93.6% 50,000 211,000 -4.7% -4.0% -2.1% 2.4% 15.4% 11.7% 23.9% 15.9%Las Vegas 754,000 1.6% 2.0% 100.0% 100.0% 128,000 115,000 7.3% 7.8% 1.6% 3.1% 68.5% 47.0% 31.6% 19.9%
6,359,000 13.6% 13.0% 99.3% 98.8% 347,000 1,234,000 5.1% 6.5% 2.4% 3.8% 19.7% 10.8% 21.5% 10.4%
Total Core Markets 45,074,000 96.9% 97.5% 98.8% 97.5% 1,478,000 6,640,000 7.2% 5.5% 6.5% 5.6% 37.9% 24.2% 31.5% 18.9%
Total Other Markets 1,448,000 3.1% 2.5% 99.6% 99.6% 24,000 177,000 -2.8% -3.5% 3.1% 4.7% 6.8% 1.4% 14.7% 3.3%
Total Operating Properties 46,522,000 100.0% 100.0% 98.8% 97.6% 1,502,000 6,817,000 6.9% 5.2% 6.4% 5.6% 37.4% 23.9% 31.1% 18.5%
(1) Based on the Annualized Base Rent as of the reporting period for occupied square feet (without S/L Rent).(2) Square Feet expiring during the remainder of the year, including month-to-month leases.(3) Does not include leases with terms less than 12 months and leases for first generation space on properties acquired or developed by EastGroup.(4) Excludes straight-line rent adjustments and amortization of above/below market rent intangibles.(5) Includes the Company's share of its less-than-wholly-owned real estate investments.
Rental Change(excluding income from lease terminations) New and Renewal Leases (3)
Same Property PNOI Change
in Square FeetQTR YTD QTR YTDLease Expirations

Page 17 of 24
Lease Expiration Summary Total Square Feet of Operating Properties Based
On Leases Signed Through September 30, 2021 ($ in thousands)
(Unaudited)
Annualized Current % of TotalBase Rent of Base Rent of
Square Footage of % of Leases Expiring Leases ExpiringLEASE EXPIRATION Leases Expiring Total SF (without S/L Rent) (without S/L Rent)
Vacancy 569,000 1.2% -$ 0.0%
2021 - remainder of year (1) 1,502,000 3.2% 11,031 3.7%
2022 6,817,000 14.7% 45,157 15.0%
2023 6,914,000 14.9% 45,345 15.0%
2024 7,912,000 17.0% 51,371 17.0%
2025 6,138,000 13.2% 42,623 14.1%
2026 7,239,000 15.6% 46,660 15.5%
2027 3,643,000 7.8% 23,697 7.8%
2028 2,319,000 5.0% 14,874 4.9%
2029 1,180,000 2.5% 7,668 2.5%
2030 and beyond 2,289,000 4.9% 13,467 4.5%
TOTAL 46,522,000 100.0% 301,893$ 100.0%
(1) Includes month-to-month leases.

Page 18 of 24
Top 10 Customers by Annualized Base Rent As of September 30, 2021
(Unaudited)
% of Total# of % of Total Annualized
Customer Leases Location Portfolio Base Rent (1)
1 Starship Logistics LLC 1 Los Angeles, CA 262,000 0.6% 1.0%
2 The Chamberlain Group 2 Tucson, AZ 350,000 1 Charlotte, NC 11,000
0.8% 0.9%
3 Amazon 1 San Diego, CA 191,000 1 San Antonio, TX 57,000 1 Tucson, AZ 10,000
0.5% 0.8%
4 FedEx Corp. 1 Dallas, TX 157,000 1 Fort Myers, FL 63,000 1 Fort Lauderdale, FL 50,000 1 San Diego, CA 22,000 1 Jackson, MS 6,000
0.6% 0.8%
5 Novolex Holdings LLC 1 Los Angeles, CA 286,000 0.6% 0.8%
6 Essendant Co. 1 Orlando, FL 404,000 0.9% 0.8%
7 Mattress Firm 1 Houston, TX 202,000 1 Tampa, FL 109,000 1 Jacksonville, FL 49,000 1 Fort Myers, FL 25,000
0.8% 0.7%
8 Oceaneering International, Inc. 3 Orlando, FL 259,000 0.6% 0.6%
9 Pacific Asiana LLC 1 Los Angeles, CA 183,000 0.4% 0.6%
10 Agility 2 Houston, TX 246,000 0.5% 0.6%
24 2,942,000 6.3% 7.6%
(1) Calculation: Customer Annualized Base Rent as of 09/30/21 (without S/L Rent) / Total Annualized Base Rent (without S/L Rent).
LeasedTotal SF
Page 19 of 24
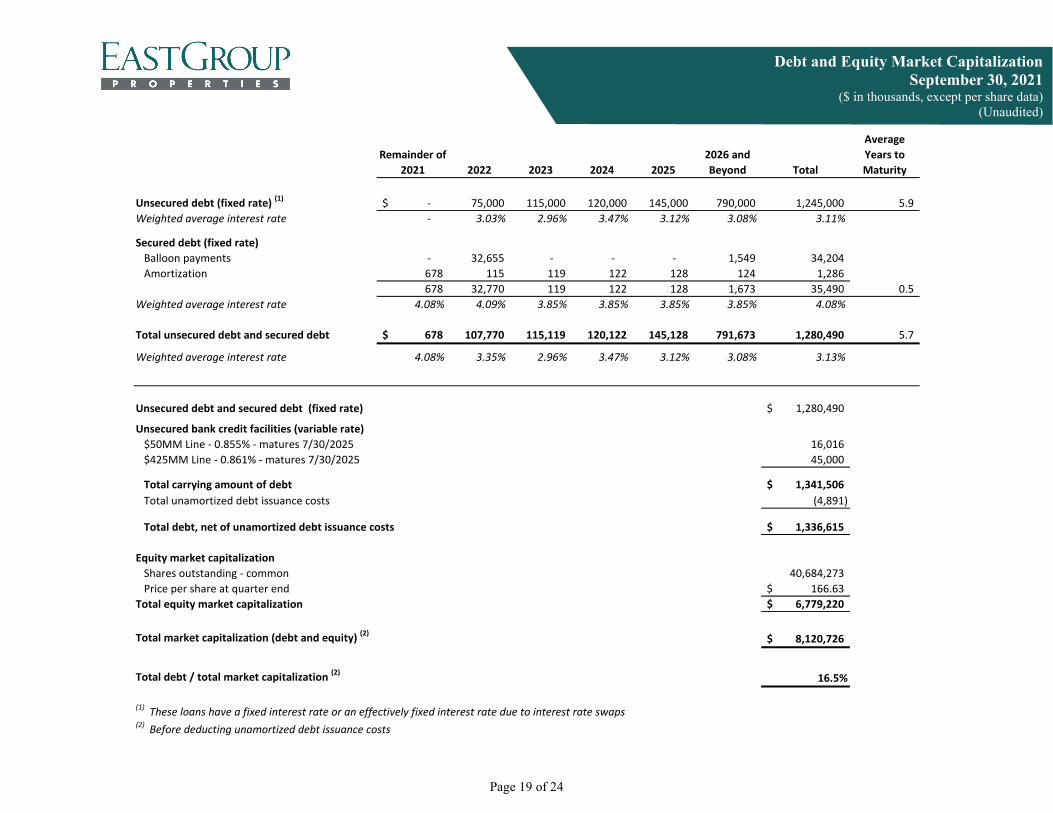
Debt and Equity Market Capitalization September 30, 2021
($ in thousands, except per share data) (Unaudited)
Remainder of 2021 2022 2023 2024 2025
2026 and Beyond Total
Average Years to Maturity
Unsecured debt (fixed rate) (1) -$ 75,000 115,000 120,000 145,000 790,000 1,245,000 5.9 Weighted average interest rate - 3.03% 2.96% 3.47% 3.12% 3.08% 3.11%
Secured debt (fixed rate)Balloon payments - 32,655 - - - 1,549 34,204Amortization 678 115 119 122 128 124 1,286
678 32,770 119 122 128 1,673 35,490 0.5 Weighted average interest rate 4.08% 4.09% 3.85% 3.85% 3.85% 3.85% 4.08%
Total unsecured debt and secured debt 678$ 107,770 115,119 120,122 145,128 791,673 1,280,490 5.7
Weighted average interest rate 4.08% 3.35% 2.96% 3.47% 3.12% 3.08% 3.13%
Unsecured debt and secured debt (fixed rate) 1,280,490$
Unsecured bank credit facilities (variable rate)$50MM Line - 0.855% - matures 7/30/2025 16,016 $425MM Line - 0.861% - matures 7/30/2025 45,000
Total carrying amount of debt 1,341,506$ Total unamortized debt issuance costs (4,891)
Total debt, net of unamortized debt issuance costs 1,336,615$
Equity market capitalizationShares outstanding - common 40,684,273Price per share at quarter end 166.63$
Total equity market capitalization 6,779,220$
Total market capitalization (debt and equity) (2) 8,120,726$
Total debt / total market capitalization (2) 16.5%
(1) These loans have a fixed interest rate or an effectively fixed interest rate due to interest rate swaps(2) Before deducting unamortized debt issuance costs

Page 20 of 24
Continuous Common Equity Program Through September 30, 2021 ($ in thousands, except per share data)
(Unaudited)
Shares Issued and Sold (1)
Average Sales Price (Per Share) Gross Proceeds
Offering-Related Fees and Expenses Net Proceeds
1st Quarter 317,538 141.72$ 45,000$ (515)$ 44,485$
2nd Quarter 370,177 162.08 60,000 (682) 59,318
3rd Quarter 278,893 176.45 49,210 (584) 48,626
TOTAL 2021 966,608 159.54$ 154,210$ (1,781)$ 152,429$
(1) As of October 26, 2021, the Company had common shares with an aggregate gross sales price of $501.9 million authorized and remaining for issuance under its continuous common equity program.

Page 21 of 24
Debt-to-EBITDAre Ratios ($ in thousands)
(Unaudited)
Quarter Ended Years Ended December 31, September 30, 2021 2020 2019 2018 2017
EBITDAre 71,505$ 245,669$ 221,517 200,788 180,214
Debt 1,336,615 1,310,895 1,182,602 1,105,787 1,108,282
DEBT-TO-EBITDAre RATIO 4.67 5.34 5.34 5.51 6.15
EBITDAre 71,505$ 245,669$ 221,517 200,788 180,214
Adjust for acquisitions as if owned for entire period 930 1,906 5,590 1,909 859
Adjust for development and value-add properties in lease-up or under construction
(337) (1,327) (2,072) (304) (679)
Adjust for properties sold during the period - (1,081) (3,812) (474) (1,031)
Pro Forma EBITDAre 72,098$ 245,167$ 221,223 201,919 179,363
Debt 1,336,615$ 1,310,895$ 1,182,602 1,105,787 1,108,282
Subtract development and value-add properties in lease-up or under construction (249,825) (225,964) (315,794) (149,860) (130,505)
Adjusted Debt 1,086,790$ 1,084,931$ 866,808 955,927 977,777
ADJUSTED DEBT-TO-PRO FORMA EBITDAre RATIO 3.77 4.43 3.92 4.73 5.45

Page 22 of 24
Outlook for 2021 (Unaudited)
Q4 2021 Y/E 2021 Q4 2021 Y/E 2021
Net income attributable to common stockholders 29,409$ 115,077 31,023 116,691 Depreciation and amortization 33,568 127,595 33,568 127,595 Funds from operations attributable to common stockholders 62,977$ 242,672 64,591 244,286
Diluted shares 40,923 40,355 40,923 40,355
Per share data (diluted): Net income attributable to common stockholders 0.72$ 2.85 0.76 2.89 Funds from operations attributable to common stockholders 1.54 6.01 1.58 6.05
The following assumptions were used for the mid-point:
MetricsFFO per share $6.01 - $6.05 $5.83 - $5.93 $5.38FFO per share increase over prior year 12.1% 9.3% 8.0%Same PNOI growth: cash basis (1) 5.1% - 6.1%(2) 4.7% - 5.7%(2) 3.2%Average month-end occupancy 96.6% - 97.2% 96.3% - 97.3% 96.7%Lease termination fee income $1.3 million $850,000 $709,000Reserves for uncollectible rent (No identified bad debts for remainder of year) $50,000 $950,000 $2.8 millionDevelopment starts: Square feet 2.8 million 2.4 million 851,000 Projected total investment $340 million $275 million $91 millionValue-add property acquisitions (Projected total investment) $35 million $35 million $29 millionOperating property acquisitions $105 million $10 million $49 millionOperating property dispositions (Potential gains on dispositions are not included in the projections)
$80 million $60 million $21 million
Unsecured debt closing in period $300 million at 2.65% weighted average interest
rate
$250 million at 2.58% weighted average interest
rate
$275 million at 2.56% weighted average interest
rateCommon stock issuances $230 million $185 million $94 millionGeneral and administrative expense $16.3 million $17.1 million $14.4 million
Low Range High Range
(In thousands, except per share data)
Revised Guidance for Year 2021
Release
Guidance for Year 2021
Actual for Year 2020
(2) Includes properties which have been in the operating portfolio since 1/1/20 and are projected to be in the operating portfolio through 12/31/21; includes 40,832,000 square feet.
(1) Excludes straight-line rent adjustments, amortization of market rent intangibles for acquired leases, and income from lease terminations.

Page 23 of 24
Glossary of REIT Terms
Listed below are definitions of commonly used real estate investment trust (“REIT”) industry terms. For additional information on REITs, please see the National Association of Real Estate Investment Trusts (“Nareit”) web site at www.reit.com.
Adjusted Debt-to-Pro Forma EBITDAre Ratio: A ratio calculated by dividing a company’s adjusted debt by its pro forma EBITDAre. Debt is adjusted by subtracting the cost of development and value-add properties in lease-up or under construction. EBITDAre is further adjusted by adding an estimate of NOI for significant acquisitions as if the acquired properties were owned for the entire period, and by subtracting NOI from development and value-add properties in lease-up or under construction and from properties sold during the period. The Adjusted Debt-to-Pro Forma EBITDAre Ratio is a non-GAAP financial measure used to analyze the Company’s financial condition and operating performance relative to its leverage, on an adjusted basis, so as to normalize and annualize property changes during the period. Cash Basis: The Company adjusts its GAAP reporting to exclude straight-line rent adjustments and amortization of market rent intangibles for acquired leases. The cash basis is an indicator of the rents charged to customers by the Company during the periods presented and is useful in analyzing the embedded rent growth in the Company’s portfolio. Debt-to-EBITDAre Ratio: A ratio calculated by dividing a company’s debt by its EBITDAre; this non-GAAP measure is used to analyze the Company’s financial condition and operating performance relative to its leverage. Debt-to-Total Market Capitalization Ratio: A ratio calculated by dividing a company’s debt by the total amount of a company’s equity (at market value) and debt. Earnings Before Interest Taxes Depreciation and Amortization for Real Estate (“EBITDAre”): In accordance with standards established by Nareit, EBITDAre is computed as Earnings, defined as Net Income, excluding gains or losses from sales of real estate investments and non-operating real estate, plus interest, taxes, depreciation and amortization. EBITDAre is a non-GAAP financial measure used to measure the Company’s operating performance and its ability to meet interest payment obligations and pay quarterly stock dividends on an unleveraged basis. Funds From Operations (“FFO”): FFO is the most commonly accepted reporting measure of a REIT’s operating performance, and the Company computes FFO in accordance with standards established by Nareit in the Nareit Funds from Operations White Paper — 2018 Restatement. It is equal to a REIT’s net income (loss) attributable to common stockholders computed in accordance with generally accepted accounting principles (“GAAP”), excluding gains and losses from sales of real estate property (including other assets incidental to the Company’s business) and impairment losses, adjusted for real estate related depreciation and amortization, and after adjustments for unconsolidated partnerships and joint ventures. FFO is a non-GAAP financial measure used to evaluate the performance of the Company’s investments in real estate assets and its operating results. FFO Excluding Gain on Casualties and Involuntary Conversion: A reporting measure calculated as FFO (as defined above), adjusted to exclude gain on casualties and involuntary conversion. The Company believes that the exclusion of gain on casualties and involuntary conversion presents a more meaningful comparison of operating performance. Industrial Properties: Generally consisting of four concrete walls tilted up on a slab of concrete. An internal office component is then added. Business uses include warehousing, distribution, light manufacturing and assembly, research and development, showroom, office, or a combination of some or all of the aforementioned. Leases Expiring and Renewal Leases Signed of Expiring Square Feet: Includes renewals during the period with terms commencing during the period and after the end of the period. Operating Land: Land with no buildings or improvements that generates income from leases with tenants; included in Real estate properties on the Consolidated Balance Sheets. Operating Properties: Stabilized real estate properties (land including buildings and improvements) in the Company’s operating portfolio; included in Real estate properties on the Consolidated Balance Sheets. Percentage Leased: The percentage of total leasable square footage for which there is a signed lease, including month-to-month leases, as of the close of the reporting period. Space is considered leased upon execution of the lease.
Page 24 of 24
Glossary of REIT Terms (Continued)
Percentage Occupied: The percentage of total leasable square footage for which the lease term has commenced as of the close of the reporting period. Property Net Operating Income (“PNOI”): Income from real estate operations less Expenses from real estate operations (including market-based internal management fee expense) plus the Company’s share of income and property operating expenses from its less-than-wholly-owned real estate investments. PNOI is a non-GAAP, property-level supplemental measure of performance used to evaluate the performance of the Company’s investments in real estate assets and its operating results. Real Estate Investment Trust: A company that owns and, in most cases, operates income-producing real estate such as apartments, shopping centers, offices, hotels and warehouses. Some REITs also engage in financing real estate. The shares of most REITs are freely traded, usually on a major stock exchange. To qualify as a REIT, a company must distribute at least 90 percent of its taxable income to its stockholders annually. A company that qualifies as a REIT is permitted to deduct dividends paid to its stockholders from its corporate taxable income. As a result, most REITs remit at least 100 percent of their taxable income to their stockholders and therefore owe no corporate federal income tax. Taxes are paid by stockholders on the dividends received. Most states honor this federal treatment and also do not require REITs to pay state income tax.
Rental changes on new and renewal leases: Rental changes are calculated as the difference, weighted by square feet, of the annualized base rent due the first month of the new lease’s term and the annualized base rent of the rent due the last month of the former lease’s term. If free rent is given, then the first positive full rent value is used. Rental amounts exclude base stop amounts, holdover rent, and premium or discounted rent amounts. This calculation excludes leases with terms less than 12 months and leases for first generation space on properties acquired or developed by EastGroup. Same Properties: Operating properties owned during the entire current and prior year reporting periods. Properties developed or acquired are excluded until held in the operating portfolio for both the current and prior year reporting periods. Properties sold during the current or prior year reporting periods are excluded. The Same Property Pool includes properties which were included in the operating portfolio for the entire period from January 1, 2020 through September 30, 2021. Same Property Net Operating Income (“Same PNOI”): Income from real estate operations less Expenses from real estate operations (including market-based internal management fee expense), plus the Company’s share of income and property operating expenses from its less-than-wholly-owned real estate investments, for the same properties owned by the Company during the entire current and prior year reporting periods. Same PNOI is a non-GAAP, property-level supplemental measure of performance used to evaluate the performance of the Company’s investments in real estate assets and its operating results on a same property basis. Same PNOI Excluding Income from Lease Terminations: Same PNOI (as defined above), adjusted to exclude income from lease terminations. The Company believes it is useful to evaluate Same PNOI Excluding Income from Lease Terminations on both a straight-line and cash basis. The straight-line basis is calculated by averaging the customers’ rent payments over the lives of the leases; GAAP requires the recognition of rental income on the straight-line basis. The cash basis excludes adjustments for straight-line rent and amortization of market rent intangibles for acquired leases; the cash basis is an indicator of the rents charged to customers by the Company during the periods presented and is useful in analyzing the embedded rent growth in the Company’s portfolio. Straight-Lining: The process of averaging the customer’s rent payments over the life of the lease. GAAP requires real estate companies to “straight-line” rents. Total Return: A stock’s dividend income plus capital appreciation/depreciation over a specified period as a percentage of the stock price at the beginning of the period. Value-Add Properties: Properties that are either acquired but not stabilized or can be converted to a higher and better use. Acquired properties meeting either of the following two conditions are considered value-add properties: (1) Less than 75% occupied as of the acquisition date (or will be less than 75% occupied within one year of acquisition date based on near term lease roll), or (2) 20% or greater of the acquisition cost will be spent to redevelop the property.