conditional conservatism and the cost of equity capital ... · 4 information quality incrementally...
TRANSCRIPT

Conditional Conservatism and the Cost of Equity Capital:
Informational, Fundamental, and Behavioral Effects
Gary C. Biddle University of Hong Kong
Mary L.Z. Ma Xiamen University
Feng Wu University of Macau
March 24, 2012
Corresponding emails: [email protected] (G. Biddle), [email protected] (M. Ma), [email protected] (F. Wu) Acknowledgements: We thank participants and discussants at the 2011 Canadian Academic Accounting Association conference, the 2011 Asian Academic Accounting Association conference, and the 2011 International Symposium on Empirical Accounting Research in China for their helpful comments. We are grateful for advices from Chaoli Guo, Tao Lin, Yan Luo, Xingrong Qiang, Tony Jun Ruan, Jing Wang, and Yanyan Wang. Any errors remain our responsibilities.

1
Conditional Conservatism and the Cost of Equity Capital:
Informational, Fundamental, and Behavioral Effects
ABSTRACT:
Prior studies report negative or insignificant relations between conditional conservatism and the
cost of equity capital, arguing that conservatism reduces information risk. Using equity cost
measures that control for cash flow news and accounting-based conditional conservatism proxies,
we document a significantly positive association between conditional conservatism and equity
cost, and detect three channels for the equity premium to conditional conservatism: informational
precision and information asymmetry effects, behavorial effects, and effects of earnings
downside risk. Using the Sarbanes-Oxley Act (SOX) as a natural experiment, we confirm that
these positive relations disappear in the post-SOX period, consistent with diminished
informational, behavioral and operational risk engendered by SOX regulations.
Keywords: conditional conservatism; cost of equity capital; asset pricing test; Sarbanes-Oxley
Act (SOX).
JEL Classifications: M41; G32; G12; G14.

2
Conditional Conservatism and the Cost of Equity Capital:
Informational, Fundamental, and Behavioral Effects
I. INTRODUCTION
Conditional conservatism (CON hereafter) is a salient feature of financial reporting that
reflects a firm’s commitment to timely bad earnings news disclosure.1 However, existing
evidence about relations between conditional conservatism and equity cost is mixed, with
findings of both negative and insignificant relations between them. Different from prior studies,
we provide robust evidence about a positive association between conditional conservatism and
the cost of equity capital, using accounting-based conservatism measure and equity cost measure
that control for potentially confounding cash-flow effects. We detect three channels that the
observed relation operates: informational effects, behavioral effects, and effects of earnings
downside risk. We also present confirming evidence that these positive associations disappear in
the post Sarbanes-Oxley (SOX) period, consistent with reduced information asymmetries that
SOX regulations were promulgated to promote, as well as diminished operational risk, and
behavioral effects engendered by the SOX regulations
Prior studies only examine information channel that conditional conservatism affects firms’
cost of equity capital. Analytical studies unanimously demonstrates that accounting conservatism
improves the overall information quality, e. g. via providing more accurate signal to mitigate the
payoff loss due to conservative bias (Fan and Zhang 2012), via alleviating dysfunctional earnings
1 As guidance, the FASB’s Statement of Financial Accounting Concepts No. 2 (1980, para. 95) intones that “if two estimates of amounts to be received or paid in the future are about equally likely, conservatism dictates using the less optimistic estimate.” The Accounting Principles Board (Statement No. 4 1970, para. 171) observes that “managers, investors, and accountants have generally preferred that possible errors in measurement be in the direction of understatement rather than overstatement of net income and net assets. This has led to the convention of conservatism.”
3
manipulation (Chen et al. 2007; Gao 2011), via limiting the probability of bad firms obtaining
high signals and reducing their free-riding benefits (Nan and Wen 2011), or via encouraging full
disclosure through more voluntarily convey of timely good news (Guay and Verrecchia 2007).2
Prior CON and equity cost studies achieve the general consensus that improved information
quality by CON increases the average information precision among investors and thus reduces
equity cost, ceteris paribus.3 Their implicit assumption is market efficiency and perfect market
such that the information precision effect of improved information quality dominate and its
effects on information asymmetry is not a concern.4
When competition is imperfect and markets are illiquid, however, enahnced information
quality by CON could also increase cost of capital via generating information asymmetry
(information asymmetry effects). Under this setting, Gow et al. (2011) and Lambert et al. (2012)
argue that publicly reported earnings information complements the private information held by
sophisticated investors, and higher information precision increases heterogeneity of opinions
among market participants and make them more dissimilarly informed, thus enhancing
information asymmetry. Akins et al. (2012), Armstrong et al. (2011), and Gow et al. (2011)
provide further evidence that information asymmetry in general or engendered by higher
2 There are different opinions regarding the conservative bias. Gigler et al. (2009) argue that conservatism exercises less verification over bad earnings news and reports income-decreasing events on cost of downwardly biased estimation, thus reducing its information contents. Nevertheless, Gao (2011) demonstrates that in presence of managerial opportunism (e.g., earnings management), which is likely in practice, the optimal measurement rule is conservative since it is less biased than that by a neutral rule. 3Using Basu’s (1997) conditional conservatism measure as a proxy for asymmetric response to good and bad earnings news, Francis et al. (2004) find insignificant associations between conditional conservatism and the cost of equity. Lara et al. (2011) construct a conditional conservatism proxy within the framework of Callen et al. (2010), finding a significantly positive relation between them. Guay and Verrecchia (2007) argue analytically that conditional conservatism reflects a firm’s commitment to timely disclosures of bad earnings news, which may reduce the uncertainty about expected cash flows and thus lower cost of capital. 4In classical competitive economy with noisy rational expectations, there is no cross-sectional effect of information asymmetry on cost of capital and only average information quality (precision) can be priced (Hughes et al. 2007; Lambert et al. 2012). For example, Hughes et al. (2007) indicate that the pricing of asymmetric information in a competitive market as claimed by Easley and O’Hara (2004) is a “misperception” and argue that only information asymmetry about systematic factors affects factor (market-wide) risk premia. Some early studies do not specifically differentiate information asymmetry and information precision effects (e.g., Diamond and Verrecchia 1991), or assume that better quality disclosure reduces information asymmetry via decreasing the information advantage of sophisticated investors (Botosan 2006; Francis et al. 2004).
4
information quality incrementally increases firms’ cost of capital when markets for the firms’
stocks are less than perfectly competitive.5 Indeed, CON hold the potential to create stronger
negative shocks and thus increases information asymmetry among investors and the cost of
equity. Biddle et al. (2012) argue that loan charge offs mandated by impairment rules increase
information asymmetry and negative shocks in the banking industry. Haggard et al. (2011)
provide complementary evidence that large asset write-downs increase information asymmetry.
Therefore, the influence of conditional conservatism on equity cost through the information
channel hinges on the combined information precision and information asymmetry effects. When
markets are efficient with perfect competition and liquidity, CON decreases equity cost only by
decreasing total information risk (information precision effects) since there is no information
asymmetry effect. When markets are imperfect, which is more likely in practice, the information
precision and information asymmetry effects of CON offset each other, with their combined
impact undetermined analytically. If the information precision effect dominates or CON
attenuates information asymmetry between the firm and investors (LaFond and Watts 2008), the
cost of equity will be reduced. Conversely, if conservatism exacerbates information asymmetry
(Biddle et al. 2012, Haggard et al. 2011), CON increases equity cost.
In addition, conditional conservatism also increases cost of capital via the fundamental
operational risk channel, either by enhanced perceptions of risk embedded in firms’
fundamentals or directly increasing firms' fundamental risk. Conservative disclosure induces
reported earnings numbers to timely reflect more pessimistic estimates, which increase earnings
downside risk and enhance its ability to capture fundamental operating risk. As documented in
Luo et al. (2012), higher earnings downside risk (especially accruals downside risk) is associated
5 Akins et al. (2012), Armstrong et al. (2011), and Gow et al. (2011) also find information asymmetry does not affect cost of equity incremental to market risk if firms’ stocks are traded in highly liquid and competitive markets.

5
with higher cost of equity capital (stock’s expected returns). Moreover, conservatism also de
facto enhances firms' fundamental risk. Analytically, better disclosure quality via conservatism
increases cost of capital via increasing firms' overall cash flow risk as new investment is
sufficiently elastic (Gao 2010), via dampening information producing by speculators in the
market and thus impeding investment efficiency (Gao and Liang 2011)),6 or by directly
affecting a firm’s real production and investment decisions and thus changing the impact of
expected cash flow on covariance risk(Lambert et al. 2007). If improved information quality
makes managers more aggressive in investment choice, the resulting investment inefficiency
may entail a higher equity cost.
In imperfect markets, conditional conservatism further affect the equity cost by engendering
behaviorally-induced mispricing. As advocated by FASB’s Statement of Financial Accounting
Concepts No. 2 (1980, para. 95), one major function of CON is to convey bad earnings news in a
timely manner. By conception, CON reports income-decreasing events with a downward bias,
i.e., earnings losses are revealed with larger magnitude and higher frequency than the true
economic earnings. Investors have asymmetrically stronger reactions to bad earnings news
conveyed by CON than to good news, exhibiting loss aversion as suggested by Roy (1952),
Kahneman and Tversky (1979), and Veronesi (1999). Such an effect can be further enhanced
with the existence of information inefficiency, as frequent biased loss reporting induces investors
to face more ambiguities and adopt shorter investment horizons, thus heightening their ambiguity
aversion (Epstein and Schneider 2008) and myopic loss aversion (Benartzi and Thaler 1985).
These behavioral influences lead to a higher perceived risk which causes investors to require a
6 Gao and Liang’s (2011) model is developed from Grossman and Stiglitz (1980) who demonstrate that “there is a fundamental conflict between the efficiency with which markets spread information and the incentives to acquire information.” The intuition is that more disclosure discourages private information acquisition by speculators, and the speculators’ information set is not a subset of the firm’s and is reflected via asset prices. Preemptive disclosure thus reduces price informativeness to the firm, leading to misallocation of resources and investment inefficiency.

6
higher compensation when providing equity funds, thus increasing a firm’s cost of equity.
In summary, prior studies suggest that conditional conservatism is related to the cost of
equity capital in a complex way. Especially in imperfect markets, information asymmetry,
fundamental operation risk, and behavioral influences produce an equity cost increasing effect
that counterbalances the equity cost decreasing effect of improved information quality by CON,
leaving the overall CON-equity cost relation an empirical issue. This paper is thus motivated to
investigate the relation between conditional conservatism and the cost of equity capital through
these effects which represent the aspects of CON that potentially increase equity cost.
To this end, we must adopt equity cost and conservatism constructs free of the implicit
market efficiency assumption. Existing CON-equity cost studies, however, adopt the stock price
based conservatism measure that is consistent with their implicit assumption of market efficiency
with perfect competition. For example, the Basu (1997) measure in Francis et al. (2004) which is
based on stock price’s asymmetric responses to good and bad earnings news, and the CR ratio
measure in Lara et al. (2011) that construct within the framework of Callen et al. (2010).7 These
measures facilitate investigating the information precision effects of conservatism that reduce
cost of equity, which is the research purpose in both studies because both measures implicitly
assume away the disturbing effects of information asymmetry, fundamental operation risk, and
investor loss aversion that exist in inefficient market and have the potential to increase equity
cost.8 However, to the extent that this study is purported to examine effects assumed away in
these market-based measures, they are no longer appropriate for this study.
7Other market-based CON measures, for example, the C-score in Khan and Watts (2009), also have the same implicit assumption of market efficiency and perfect competition. 8Both studies find negative (Lara et al. (2011)) or insignificant (Francis et al. (2004)) and explain the findings from the perspective of information risk, i.e., CON induces less information uncertainty and thus lowers the equity cost. This is mainly an information precision effect as demonstrated above
7
Therefore, we employ accounting information to construct a proxy for conditional
conservatism as the average of accumulated non-operational accruals and earnings skewness,
following Givoly and Hyan (2000) and Zhang (2008). This accounting-based measure relaxes
market efficiency assumption and more directly reflects earnings news conveyed to market
participants by conditionally conservative disclosure. It helps deliver clearer inferences regarding
the information asymmetry and behavioral effects driven by market activities, as well as the
operational risk effect determined by firms’ fundamentals. Further, it is equally vital to control
for the effect of cash flow shocks on estimated equity cost since conservative treatment like large
accrual expense constructs unexpected negative cashflow shocks that decrease realized stock
returns, thus resulting in a potential mechanically negative relation between CON and equity cost.
To factor out the disturbance of cash flow shocks, we adopt an ex ante cost of equity capital
measure as realized excess return adjusted for cash flow news, as suggested by Vuolteenaho
(2002), McInnis (2010), Ogneva (2010), and Botosan et al. (2011).9
We empirically examine the CON-equity cost relation utilizing standard asset pricing tests
including hedging portfolio analyses and multivariate regressions while controlling for industry
effects as suggested by Lewellen et al. (2010), and using a sample of U.S. public firms for the
period of 1986 to 2008. We document a significant positive relation between conditional
conservatism and the cost of equity capital, suggesting that CON-induced effects of information
asymmetry, fundamental downside risk, and investor loss aversion dominate the information
precision effects and ultimately increase firms’ cost of equity. In particular, a hedging strategy
for CON-sorted portfolios earns significantly positive excess returns. Firm-level Fama-MacBeth
regressions yield significantly positive associations between CON and future excess returns
9 Botosan et al. (2011) and Ogneva (2010) argue that cash flow news does not cancel out in large samples, therefore asset pricing tests may induce biases when future realized returns are used to proxy for expected returns.

8
adjusted for cash flow news, with and without controlling for firm risk characteristics.
Portfolio-level two-stage cross-sectional regressions reveal conservatism factor loadings to be
significantly positively associated with return spreads for CON-sorted portfolios, implying that
conditional conservatism is priced by market participants.
Further analysis presents supporting evidence regarding the information asymmetry,
fundamental downside risk, and behavioral effects on the CON equity cost relation. Portfolio
analyses indicate that larger CON is generally associated with higher information asymmetry and
earnings downside risk; controlling for information asymmetry and/or earnings downside risk in
Fama-MacBeth regressions substantially reduces the CON coefficients. The evidence suggests
that information asymmetry and fundamental downside risk at least partially explain the positive
CON-equity cost relation. Hedging portfolio analyses reveal that the positive returns to CON are
more prominent for higher CON portfolios, not affected by firm size, book-to-market ratio, and
total accruals, and do not concentrate in any single year. These findings suggest that
behavioral-based mispricing (overreaction to bad earnings news) also contributes to the positive
CON equity cost relation, which is partially caused by.
The passage of the Sarbanes-Oxley Act of 2002 (SOX) offers a nature experiment for further
investigating the channels for the observed positive CON-equity cost relation. SOX regulations
were promulgated to increase financial reporting transparency, reduce information asymmetry,
and improve market efficiency. Combined with effects of dampened risk-taking and constrained
level of capital which decrease firms’ operational risk (Kang et al. 2010; Bargeron et al. 2010),
we argue that SOX should have mitigated the information asymmetry, fundamental downside
risk, and behavioral influences of CON on cost of equity capital, despite a previously
documented enhanced conditional conservatism following the enactment of SOX (e.g., Lobo and

9
Zhou 2006). To test this conjecture, we examine Fama-MacBeth regressions before and after
SOX was enacted, and find confirming evidence that the positive association between CON and
cost of equity capital disappears in the post-SOX period. The finding suggests that the positive
CON-equity cost relation detected in the pre-SOX period is mainly driven by the information
asymmetry, fundamental risk, and behavioral effects.
This study contributes to the literatures on accounting conservatism, equity capital cost, and
SOX, and holds potential policy implications. We provide a comprehensive description about the
influences of CON on equity cost from the perspectives of information asymmetry, fundamental
risk, and investor behaviors in markets with inefficient information and imperfect competition.
We utilize conditional conservatism and cost of equity measures net of the influences from stock
market and cash flow shocks. Our finding of a positive relation between conditional
conservatism and the cost of equity capital supplements prior evidence of negative or
insignificant CON-equity cost associations and help deliver a more complete presentation of
conditional conservatism’s impact on firms’ cost of equity. This paper also confirms that SOX
produced structural changes in the association between CON and equity cost, consistent with its
intended functions of reducing information asymmetry and improving market efficiency.
Evidence documented in this study further helps inform deliberations regarding the economic
influence of accounting conservatism, which the FASB and IASB recently removed as a
fundamental characteristic of financial information in favor of neutrality.
We proceed as follows. Section II explains measures used for key variables and research
design. Section III reports main asset pricing test results. Section IV examines separately the
influences of information asymmetry, earnings downside risk, and investor behaviors. Section V
presents associations between conditional conservatism and equity cost before and after the
10
implementation of SOX. Section VI describes robustness checks. Section VII concludes.
II. MEASUREMENT AND RESEARCH METHODOLOGY
We examine the relation between conditional conservatism and the cost of equity capital
under an imperfect market setting and from the perspectives of informational, fundamental, and
behavioral influences. Ideally, the conditional conservatism measure should be free of the
confounding impact of stock market information, and realized equity return as proxy for ex anti
cost of equity should be net of unexpected cash flow shocks, as both could induce spurious
results and biased inferences about the association between CON and equity cost. In particular, a
qualified CON measure in this context should not endogenously incorporate stock return data
which already impound effect of information asymmetry and its feedback to firms’ investment
and investors’ behaviors. This is critical especially when cost of equity is measured by stock
return in market. Otherwise, a potential mechanical relation may arise by construction. For the
same reason, it is important to control for unexpected cash flow shocks (cash flow news)
embedded in realized stock returns when measuring investors’ expected returns for equity
investment. Prior evidence suggests that conditional conservatism is closely related to cash flow
news (e.g., Callen et al. 2010; Kim and Pevzner 2010) that is reflected in stock prices.10 Cash
flow news may also subsume private information feedback effect (Gao and Liang 2011) and
increase information asymmetry (Gow et al. 2011). Therefore, asset pricing tests without
controlling for cash flow news may yield spurious inferences about the impact of CON on cost of
capital.
To facilitate empirical analyses, we use realized excess stock returns that explicitly control
for cash flow news to measure cost of equity, and employ accounting-based CON measures that
10 Callen et al. (2010) develop CR ratio, a market-based conservatism measure, from the relation between conditional conservatism and cash flow news. Kim and Pevzner (2010) provide evidence that higher conditional conservatism is associated with lower probability of future bad cash flow news.

11
are immune from influences of market information. Both treatments are amendable to our
research purpose of a comprehensive examination on CON’s impact on firms’ equity cost under
inefficient and noncompetitive market conditions, which allows for the functions of information
asymmetry, fundamental risk, and investor behaviors in addition to the information precision
effect documented in prior studies. In this sense, our measures are supplements to rather than
substitutes for existing proxies for conditional conservatism and equity cost.
Conditional Conservatism Measure
In the main tests, our accounting-based conditional conservatism measure CON is designed
as the average of relative accumulated non-operational accruals (CON_Acm) and relative
earnings skewness (CON_Skew), defined as follows:
CON_Acm is negative one times the ratio of accumulated non-operating accruals to accumulated
total assets, with both computed using a moving average of current and prior two years for each
firm-year observation, and
Non-operating accruals = Total accruals - Δaccounts receivable (Compustat RECT) (1)
- Δinventories (Compustat INVT) - Δprepaid expenses (Compustat XPP)
+ Δaccounts payable (Compustat AP) + Δtaxes payable (Compustat TXT)
This measure follows Givoly and Hayn (2000) and Zhang (2008) and captures bad earnings
news reporting via non-operational accruals, e.g., those arising from restructuring charges and
asset write-downs.
CON_Skew is negative one times the ratio of the sum of ten and earnings skewness to the sum of
ten and OCF skewness, where skewness is estimated using a rolling window of 20 quarters, with
minimum requirement for 12 quarters of data. This measure derives from Givoly and Hayn
(2000) and adapts the negative skewness measure in Zhang (2008) to ensure that higher

12
skewness indicates higher degree of conditional conservatism. We deflate earnings skewness by
OCF skewness to control for the influence of shocks in cash flow.
Since CON_Acm and CON_Skew are both noisy proxies for conditional conservatism and
may capture non-conservatism elements such as big baths or accrual anomaly, we use their
average CON to help mitigate potential measurement errors. In robustness tests, we examine
CON_Acm and CON_Skew separately. We also employ negative earnings skewness Skew,
defined as the difference between the skewness of OCF and earnings estimated over a 20-quarter
rolling window (Callen et al. 2010), and CONA, the average of Skew and CON_Acm, as
alternative conditional conservatism measures.
Cost of Equity Measure
Our cost of equity measures control for the effect of cash flow news by subtracting it from
realized excess stock returns, extending the methodology in McInnis (2010) and Ogneva
(2010).11 Specifically, we calculate cash flow news (Ne) as follows: First, we estimate earnings
surprises (SURP) from a time-series earnings prediction model augmented by economic
determinants of earnings, assuming that annual earnings for firm i follow an AR (1) process. We
use a rolling window of five years to fit model (2) below by Fama and French (1997) industry
classifications:
EARNiy+1 = β0 + β1EARNiy + β2SALEiy + β3SIZEiy + εiy+1 (2)
where EARNiy+1 (EARNiy) is earnings over book equity for the next (current) fiscal year, SALEiy
is sales over book value of total assets for the current fiscal year, and SIZEiy is firm size
measured as the natural logarithm of market equity at the current fiscal year-end. Earnings
surprise SURPit+1 for month t+1 in year y+1 is then calculated as the difference between the
11 Another measure for cash flow news is earnings forecast error (Botosan et al. 2011; Ogneva 2010), which is not used in our main tests since earnings forecast errors introduce further estimation bias. However, in robustness checks, we use it as alternative proxy for cash flow news and obtain similar results.

13
actual and predicted EARNs times the book value of equity, scaled by the beginning-of-month
market value of equity.
We obtain cash flow news from monthly cross-sectional regressions of excess stock returns
(i.e., return adjusted by risk-free rate) on contemporaneous earnings surprises using a linear OLS
specification estimated each year by Fama and French (1997) industry classifications. Cash flow
news (Neit+1) is calculated as the product of SURPit+1 and its estimated coefficient, as shown in
the following models:
Runadjit+1= α0 + α1SURPit+1 + εit+1 (3)
Ne it+1= α1SURPit+1 (4)
where Runadj is monthly excess return. For the end of each month t, we use the next month’s
excess return adjusted for cash flow news Rit+1 as cost of equity capital proxy, i.e., Rit+1=
Runadjit+1 - Neit+1.
Information Asymmetry and Fundamental Risk Measures
We use three measures for information asymmetry: average daily percentage bid-ask spread
IRisk, average daily high and low spread HLSpread, and private information trading Itrade, with
definitions given below:
IRisk: average daily percentage bid-ask spread over the 12 months prior to the current fiscal
year-end.
HLSpread: average daily high and low spread over the 12 months prior to the current fiscal
year-end, calculated following Corwin and Schultz (2012).
Itrade: private information trading estimated as in Llorente et al. (2002) and Ferreira and Laux
(2007).

14
IRisk and HLSpread reflect information asymmetry in general, while Itrade denotes
information asymmetry arising from speculators' information hunting. We use IRisk in the main
tests and employ HLSpread and Itrade in robustness checks.
We adopt the following downside risk measures estimated on a five-year rolling window to
capture fundamental risk in firms’ operations, following Luo et al. (2012):
ERisk: relative root lower partial moment of total accruals calculated as the natural logarithm of
the ratio of one plus accruals root lower partial moment over one plus accruals root upper partial
moment.12
AERisk: relative root lower partial moment of earnings over total assets (ROA) calculated as the
natural logarithm of the ratio of one plus ROA root lower partial moment over one plus ROA
root upper partial moment.
Since accruals-based downside risk is the main source and a better reflection of fundamental
operation risk and thus drives its relation with the cost of capital (Luo et al. 2012), we use ERisk
in our main tests and AERisk in robustness checks.
Asset Pricing Methodology
Our main approach to examining the relation between conditional conservatism and cost of
equity capital follows standard asset pricing methods including hedging portfolio analysis,
Fama-MacBeth regression, and two-stage cross-sectional regression (2SCSR), as elaborated
below.
Hedging Portfolio Analysis
We first use a hedging portfolio method that buys (sells) stocks with high (low) CON to
assess the association of conditional conservatism with cost of equity (cash flow news adjusted
12 See Luo et al. (2011) for estimation details.

15
excess equity returns).13 Specifically, for each month, stocks are assigned to one of five
portfolios based on firms’ most recent CON (with at least four months lag), with portfolio 1 (5)
containing firms with the lowest (highest) level of CON. Monthly return difference between the
highest (portfolio 5) and lowest (portfolio 1) CON portfolios is computed. A significant positive
(negative) mean difference (i.e., hedging return) indicates a positive (negative) relation between
conditional conservatism and the cost of equity capital.
Firm-Level Fama-MacBeth Regression
To control for other factors that influence the CON-return relation, we regress firm-specific
excess returns adjusted for cash flow news on CON and other firm characteristics. We match
annual CON estimates with monthly returns in the next 12 months starting four months after the
fiscal year-end. For example, for firms with fiscal year t ending in December, we collect monthly
returns data from April of calendar year t+1 to March of calendar year t+2. The following
cross-sectional regression models are estimated monthly, and the coefficient parameters are
averaged following the procedures in Fama and MacBeth (1973):
Rit+1 = α + β1CONit + µit (5)
Rit+1 = α + β1CONit + β2Betait + β3Sizeit + β4BMit + µit (6)
Rit+1 = α + β1CONit + β2Betait + β3Sizeit + β4BMit + β5Momentumit + µit (7)
Rit+1 = α + β1CONit + β2Betait + β3Sizeit + β4BMit + β5TCAit + µit (8)
Rit+1 = α + β1CONit +β2Betait + β3Sizeit + β4BMit + β5Accit + β6Low_Pricedit + µit (9)
Rit+1 = α + β1CONit + β2Betait + β3Sizeit + β4BMit + β5Momentumit + β6TCAit (10)
+ β7Accit + β8 Low_Pricedit + µit
with variables defined as:
13 Henceforth, we use the terms “excess returns” or “stock excess returns” interchangeably with “cash flow news adjusted excess (equity) returns” or “excess returns adjusted for cash flow news”, provided that no confusion arises.

16
CONit = conditional conservatism measure for stock i in month t,
Rit+1 = monthly excess return adjusted for cash flow news for stock i in month t +1 with risk-free
return approximated by the U.S. one-month T-bill rate,
Betait = beta of stock i for month t estimated as in Fama and French (1992),
Sizeit = natural logarithm of market capitalization for stock i in month t as in Fama and French
(1992),
BMit = natural logarithm of the ratio of book to market equity for stock i in month t as in Fama
and French (1992),
Momentumit = buy-and-hold return of stock i for the 11-month period ending one month prior to
the current month t,
TCAit = total accruals measured in the balance sheet approach scaled by total assets, following
Sloan (1996),14
Accit = decile ranking of accrual quality from Kim and Qi (2010) and Ogneva (2010),15
Low_Pricedit = indicator variable for returns with two adjacent prices of less than five U.S.
dollars as defined in Kim and Qi (2010).
Among the control variables, Beta, Size, and BM are commonly accepted factors that affect
expected stock returns. We include Momentum to ensure that our results are not attributable to
conservative firms with previous bad return performance. Since one CON component
(CON_Acm) is accruals-based, we control for TCA and Acc to ensure that the relation between
conditional conservatism and equity return is robust to the pricing effects of TCA and Acc (Khan
14 TCAit = (ΔCAit - ΔCLit - ΔCashit + ΔSTDEBTit + ΔTPit - DPit)/ATAit, where ΔCAit is one-year change in current assets, ΔCLit is one-year change in current liabilities, ΔCashit is one-year change in cash, ΔSTDEBTit is one-year change in short-term debt, ΔTPit is one-year change in income tax payable, DP is depreciation expense, and ATAit is average total assets over years t-1, t, and t+1. 15 Acc is defined as the decile ranking of the ratio of standard deviation of residual from the regression TCAit = αt + β0t (1/ATAit) + β1tOCFit-1 + β2tOCFit + β3tOCFit+1 + β4tΔREVit + β5t PPEit + εit, where TCAit and ATAit are the same as defined in footnote (12), OCFit is operating cash flow for year t, ΔREVit is one-year change in revenues, and PPEit is property, plant, and equipment for year t.
17
2008; Ogneva 2010; Kim and Qi 2010). Low_Priced is also controlled along with Acc since
penny stocks substantially impact Acc’s pricing (Kim and Qi 2010). Following Lewellen et al.
(2010), we include industry dummies in cross-sectional regressions to address the concern that
missing industry effects may bias the coefficient estimates.
Portfolio-Level Two-stage Asset Pricing Test
We further conduct a two-stage cross-sectional regression analysis on Fama-French 25 size
and book-to-market (BM) portfolios to examine possible risk-based asset pricing implications of
conditional conservatism. In the first stage, we construct a conservatism factor RCON, which
represents return on a zero-investment portfolio buying the top 20 percent of firms and selling
the bottom 20 percent of firms sorted by CON. We then estimate multivariate betas from
time-series regressions of excess returns for a portfolio of firms according to size and BM on
contemporaneous returns to the Fama-French and momentum factors, along with RCON. The
first-stage models are:
Rqt = b0 + bq,RMRMt + bq,SMBSMBt + bq,HMLHMLt + bq,RCONRCONt + εqt (11)
Rqt = b0 + bq,RMRMt + bq,SMBSMBt + bq,HMLHMLt+ bq,ACCUMDt + bq,RCONRCONt + εqt (12)
with variable definitions as:
Rqt = average cash flow news adjusted excess return on size-BM portfolio q in month t,
RCONqt = return on CON factor as explained above,
RMt = excess return for market portfolio (CRSP value-weighted),
SMBt = return for a factor-mimicking hedging portfolio by size as in Fama and French (1993),
HMLt = return for a factor-mimicking hedging portfolio by BM as in Fama and French (1993),
UMDt = return for a factor-mimicking hedging portfolio by momentum as in Jegadeesh and
Titman (1993).

18
The second stage estimates cross-sectional regressions of mean cash flow news adjusted
excess portfolio returns on factor loadings estimated in the first-stage time-series regressions, as
follows:
Rq = a0 + a1bq,RM + a2bq,SMB + a3bq,HML + a4bq,RCON + ηqt (13)
Rq = a0 + a1bq,RM + a2bq,SMB + a3bq,HML + a4bq,UMD + a4bq,RCON + ηqt (14)
where Rq is mean cash flow news adjusted excess return for portfolio q, and bq,RM, bq,SMB, bq,HML,
bq,UMD, and bq,RCON are factor loadings estimated in the first stage. If the estimated coefficients for
bq,RCON are significantly positive (negative), then RCON is deemed to reflect a priced factor with
a positive (negative) risk premium.
Methodology for Examining Effects of Information Asymmetry, Fundamental Downside
Risk, and Behavior-based Mispricing
Using measures for information asymmetry and fundamental risk, we directly examine
their associations with conditional conservatism via a portfolio approach and their roles in
explaining the CON-equity cost relation by adding them as controls in multivariate regressions.
Specifically, we construct five CON-based portfolios, and check the levels of information
asymmetry (IRisk) and earnings downside risk (ERisk) in each portfolio. If high-CON portfolios
on average have significantly higher IRisk and/or ERisk, this suggests that conditional
conservatism can generally elevate perceptions of information asymmetry and/or earnings
downside risk. We then use the following Fama-MacBeth regression models to investigate the
explanatory power of these two influences:
Rit+1 = α + β1CONit + β2Betait + β3Sizeit + β4BMit + β5IRiskit+ ∑Industry_Dummies + µit (15)
Rit+1 = α + β1CONit + β2Betait + β3Sizeit + β4BMit + β5ERiskit+ ∑Industry_Dummies + µit (16)
Rit+1 = α + β1CONit + β2Betait + β3Sizeit + β4BMit + β5IRiskit+ β6ERiskit (17)
19
+ ∑Industry_Dummies + µit
where Rit+1, Betait, Sizeit, and CONit are defined as in models (5)-(10), and Industry_Dummies are
Fama and French (1997) industry classifications. If CON affects cost of equity capital via
information asymmetry and/or earnings downside risk, then adding IRisk and ERisk should
weaken their relation as reflected in reduced magnitude and significance levels of the CON
coefficients.
To test the existence of behavior-based mispricing, we adopt a double-sorted portfolio
approach that first controls for commonly perceived risk factors like size, BM, and total accruals,
and then check difference in equity cost between high- and low-CON portfolios. We also
conduct hedging portfolio analysis for CON in each fiscal year. If high cost of equity is
associated with high CON after considering firm size and BM, and such a relation does not
cluster in any particular year, then mispricing may exist (Daniel et al. 2001; Bernard et al. 1997).
Additional evidence regarding asymmetric loss-aversion is obtained by examining the equity
cost difference separately in groups of high and low CON. For example, if equity cost spread
between the top two portfolios is larger than that between the bottom two portfolios, then
investors’ over-reactions to bad earnings news lend further support to a behavioral effect.
III. DATA AND MAIN RESULTS ON THE RELATION BETWEEN CONDITIONAL CONSERVATISM AND THE COST OF EQUITY
Our sample consists of all common stocks traded on the NYSE, NASDAQ, and AMEX
during the period from January 1986 to December 2008. Daily and monthly returns and the U.S.
one-month T-bill rates are obtained from CRSP, with corresponding accounting data retrieved
from COMPUSTAT annual files. Conditional conservatism estimates are winsorized to the 1%
and 99% percentiles of Fama and French (1997) industry distributions for each fiscal year to
abate potential biases from outliers. The final sample includes 62,833 firm-year observations

20
with valid CON estimates.
Insert Table 1 about here
Table 1 reports descriptive statistics for variables used in the main tests. Panel A shows
that the mean (median) of CON and its two components, CON_Acm and CON_Skew, are -0.5035
(-0.5129), 0.0085 (0.0116), and -1.0155 (-1.0303), respectively.16 Panel B indicates that the
Pearson and Spearman correlations of CON with CON_Skew and CON_Acm are significantly
positive, within the range of 0.1338 to 0.9913, lending construction validity to CON as a
representative conditional conservatism measure. Nonetheless, the Pearson (Spearman)
correlation between CON_Skew and CON_Acm is only 0.0018 (0.0623), with the former
statistically insignificant, which is not necessarily inappropriate since each of them gauges
conditional conservatism from different dimensions: CON_Skew measures conservatism arising
from earnings distribution, while CON_Acm captures conservatism arising from non-operating
accruals. In addition, all Pearson and Spearman correlations of conditional conservatism
measures with total accruals (TCA) are significantly negative, whereas those with accrual quality
(Acc) are significantly positive. This suggests that accounting-based conditional conservatism
measures convey information about TCA and ACC, but such information is not exactly the same
as (and therefore cannot be subsumed by) that contained in firms’ total accruals and accrual
quality.
Hedging Portfolio Analysis Results
Table 2 reports hedging portfolio results for average excess returns adjusted for cash flow
news and abnormal returns represented by alphas, as well as other measures that have influences
16 The mean (median) of total accruals TCA is 0.0099 (0.0080), which is higher than the documented negative values in Sloan (1996), due to different sampling periods. The sampling period in this study is 1986 to 2008, whereas the period in Sloan (1996) is 1962 to 1991. As we extend the sampling period back to 1962, the mean and median of total accruals become negative, in line with Sloan’s (1996) evidence.
21
on expected stock returns or equity cost. We construct five CON-sorted portfolios rebalanced
each month, with portfolio 1 (5) representing observations with the smallest (largest) CON.
Average cash flow news adjusted excess returns (Ret) and three abnormal return measures
(CAPM alpha, 3-factor alpha, 4-factor alpha) all increase monotonically across CON portfolios,
with average mean differences between the top and bottom portfolios as 0.0053, 0.0044, 0.0048,
and 0.0056, respectively, all statistically significant at the 1% confidence level. A similar pattern
is observed for Momentum. In contrast, total accruals (TCA) decline monotonically with CON,
with an average of 0.0181 for portfolio 1 and 0.0005 for portfolio 5. The mean difference of
-0.0176 is statistically significant, suggesting that CON is negatively correlated with TCA,
consistent with evidence in Table 1. The pattern for accrual quality Acc, although non-monotonic,
generally exhibits a positive relation with CON: the mean difference between portfolios 1 and 5
is 0.0338, statistically significant at the 1% confidence level. Overall, Table 2 provides evidence
that higher CON is associated with higher expected returns (alphas or cash flow news adjusted
excess returns), implying that higher conditional conservatism increases the cost of equity.
Moreover, CON is shown to be significantly correlated with return momentum, total accruals,
and accrual quality, indicating a need to control for these variables in multivariate cross-sectional
regressions.
Insert Table 2 about here
Firm-Level Fama-MacBeth Regression Results
Table 3 presents results for Fama-MacBeth cross-sectional regressions of monthly cash
flow news adjusted excess returns on CON and other firm risk characteristics including Beta,
Size, BM, Momentum, TCA, and Acc. Following Kim and Qi (2010), we also include Low-priced,
an indicator for low-priced shares along with Acc. Panels A and B present results without and

22
with controls for Fama and French (1997) industry effects, respectively.
Consistent with results from portfolio analysis, cross-sectional regression loadings on CON
are consistently positive and significant, with coefficients (t-statistics) of 0.0138 (3.54) and
0.0098 (3.32) in univariate regressions, without and with controlling for industry effects,
respectively.17 After Beta, Size, and BM are added as further controls, CON coefficients remain
significantly positive, with corresponding coefficients (t-statistics) of 0.0091 (3.42) and 0.0063
(2.77) in Panels A and B, respectively. Moreover, CON’s effect on cost of equity is not
subsumed by either Momentum, TCA, or Acc when they enter into the regressions individually or
collectively, suggesting that CON provides incremental information beyond that from
momentum, total accruals, and accrual quality. Therefore, results in Table 3 reconfirm that
conditional conservatism is positively related to the cost of equity capital, which cannot be
captured by standard risk factors and is not contributable to total accruals and/or accrual quality
effects. The CON-equity cost relation is also robust to industrial characteristics.
Insert Table 3 about here
Portfolio-Level Two-Stage Cross-Sectional Regression Results
To further confirm conditional conservatism’s impact on cost of equity, we conduct
two-stage cross-sectional regression analysis at portfolio level, which is less affected by
firm-specific characters that may contaminate the underlying relation considered. Table 4 reports
estimation results for models (11) to (14). Panel A presents the first-stage time-series regressions
of monthly portfolio excess stock returns adjusted for cash flow news on the CON factor
(RCON), Fama and French (1993) three factors (RM, SMB, HML), and Carhart (1997)
momentum factor (UMD). Factor loadings on RCON are significantly positive, with magnitudes
17 Rigorously speaking, Model 1 in Panel B is not an univariate regression because it also includes industry dummy variables. We call it univariate for simplicity.

23
(t-statistics) 0.4725 (4.16) when the three Fama-French factors are controlled, and 0.3814 (3.87)
when the momentum factor is further added.
Insert Table 4 about here
Panel B reports results for the second-stage cross-sectional regressions of mean cash flow
news adjusted excess portfolio returns on factor loadings estimated from the first stage. The
coefficients for factor loadings on RCON (βRCON) are significantly positive with magnitudes
(t-statistics) of 0.0051 (3.42) and 0.0055 (3.49) when loadings on Fama and French (1993) three
factors and Carhart (1997) four factors are controlled, respectively. The last column indicates
that when βRCON is included, average adjusted R2 jumps from 0.4170 to 0.7566 for the
three-factor model, and from 0.4086 to 0.7530 for the four-factor model. Therefore, evidence
from the 2SCSR analysis provides further support for the enhancing effect of CON on cost of
equity. In the next section, we explore the mechanisms that contribute to the positive
CON-equity cost relation.
IV. INFORMATIONAL, FUNDAMENTAL, AND BEHAVIORAL EFFECTS ON THE RELATION BETWEEN CONDITIONAL CONSERVATISM AND THE COST OF
EQUITY
Information Asymmetry and Fundamental Downside Risk Effects
Table 5 reports results from portfolio analyses and Fama-MacBeth regressions for testing
propositions regarding the information asymmetry and fundamental downside risk effects. Panel
A presents mean values of information asymmetry measure IRisk and fundamental (earnings)
downside risk measure ERisk in different CON-sorted portfolios, with portfolio 1 (5) containing
observations with smallest (largest) CON. IRisk increases non-monotonically with CON,
revealing an asymmetric “V” pattern. It falls from 0.0303 for portfolio 1 to 0.0284 for portfolio 2,
suggesting that conditional conservatism serves to reduce information asymmetry at lower levels.

24
Then IRisk increases monotonically to 0.0350 for portfolio 5, implying that CON increases
information asymmetry at higher levels. The mean difference of IRisk between portfolios 5 and 1
is 0.0047, statistically significant at the 1% confidence level. Therefore, CON is nonlinearly
associated with information asymmetry, but on average a positive relation dominates, suggesting
that high conditional conservatism can increase cost of equity capital via enhancing information
asymmetry as suggested by Lambert et al. (2012) and Gow et al. (2011). The earnings downside
risk measure ERisk increases monotonically with CON, and the mean difference (t-statistic)
between the top and bottom portfolios is 0.0567 (38.95). Since earnings downside risk induces
higher equity cost (Luo et al. 2012), this evidence suggests that the positive relation between
conditional conservatism and downside risk in earnings may also contribute to CON’s positive
association with cost of equity capital.
Insert Table 5 about here
Panel B of Table 5 presents evidence from Fama-MacBeth regressions estimated using
models (15) to (17) (with industry fixed effects) regarding the explanatory power of information
and earnings downside risks on the positive relation between CON and equity cost. The CON
coefficients become much smaller than in Panel B of Table 3 where IRisk and ERisk are not
controlled. In particular, the CON coefficients (t-statistics) drop to 0.0053 (2.13) and 0.0049
(2.22), respectively, after adding IRisk and ERisk as further controls in models in Panel B of
Table 5, compared with a figure of 0.0063 (2.77) in the model in Panel B of Table 3 that only
controls for three Fama-French factors. Importantly, the CON coefficient falls to 0.0041 when
both IRisk and ERisk are controlled, which is only marginally significant (t-statistic=1.68).
Combined, the findings indicate that information asymmetry or earnings downside risk partially
explains CON’s effect on cost of equity, and they further subsume a larger portion of CON

25
loading when both are included in regression model. This evidence lends support to the argument
that the positive CON-equity cost relation reflects the effects of information asymmetry and
fundamental downside risk.
Behavioral Effect
If markets are not perfectly efficient, conditional conservatism also holds the potential to
increase the cost of equity via mispricing caused by investors’ behaviors such as loss-aversion.
We test this conjecture following Daniel et al. (2001) and Bernard et al. (1997). Daniel et al.
(2001) argue that risk factors identified using asset pricing tests may still capture mispricing
since size or BM measures involve market value of equity. Bernard et al. (1997) observe that
mispricing may exist if returns for a hedging portfolio are persistent (e.g., consistently positive)
but do not cluster in any specific period or in firms with particular size and/or BM. Guided by
these reasoning, we first conduct hedging portfolio tests double sorted on CON and Size or BM.
For each month, we assign firm-month observations into two Size portfolios (small-bottom 50%,
large-top 50%) and three BM portfolios (Low-bottom 30%, Medium-middle 40%, High-top
30%). Within each portfolio, we further sort stocks into five groups by most recent (with at least
a four-month lag) CON, with group 1 (5) containing firms with small (large) CON.
Table 6 reports results for the behavioral effect test. Panel A shows that CON hedging
portfolio excess returns (after adjusting for cash flow news) are higher in small firms but do not
disappear in large firms. The mean hedging returns (t-statistics) are 0.0073 (3.90) and 0.0018
(1.75) for small and large size groups, respectively. Similarly, Panel B indicates that CON
hedging portfolio returns are all significant for high-, medium-, and low-BM firms, with positive
means (t-statistics) of 0.0078 (5.27), 0.0040 (2.65), and 0.0035 (1.85), respectively. These results
show that hedging portfolio returns do not concentrate in any particular groups of different size

26
and BM, suggesting behavior-induced mispricing may help explain the documented CON-equity
cost relation.
Insert Table 6 about here
Extending the above method, we further address the concern whether the behavioral effect
of conditional conservatism is a disguise of the accrual anomaly which is also subject to
mispricing explanations (Sloan 1996; Xie 2001; Richardson et al. 2005) by constructing
portfolios double-sorted on TCA and CON. We first assign firms into three TCA portfolios
(Low-bottom 30%, Medium-middle 40%, High-top 30%), and within each further sort stocks
into five CON groups. Results in Panel C of Table 6 show that CON hedging portfolio returns are
positive and significant for high-, medium-, and low-TCA firms, with means (t-statistics) of
0.0031 (1.76), 0.0048 (3.79), and 0.0061 (3.40), respectively. Therefore, despite that the cost of
equity spread is relatively smaller among firms with large total accruals, possible CON-induced
mispricing is not subsumed by and is not a camouflage for the accrual anomaly.
We then specifically check whether the CON hedging portfolio returns are clustered in any
particular period and report portfolio analysis results for each sample year from 1986 to 2008.
Table 7 shows that for the period prior to 2002 when the SOX was enacted, most years (15 out of
total 16 years) exhibit positive average return differences between high- and low-CON portfolios,
especially when statistically significant. For the period after 2003, the mean return differences
become negative and insignificant, possibly due to mitigated mispricing caused by enhanced
financial reporting transparency (and reduced information asymmetry) and market efficiency
after SOX, a phenomenon to be explained in more details in Section V. Generally, as suggested
by Bernard et al. (1997), the findings provide additional evidence that the positive association
between conditional conservatism and cost of equity in the pre-SOX period is partially explained
27
by behavioral effect.
Insert Table 7 about here
Next we explore potential causes for the behavioral effect on the CON-equity cost
association. A second look at Table 2 reveals that loss-aversion may be a partial explanation. If
there is no over-reaction to bad new driven by loss-aversion, then the return spread between
CON portfolios 2 and 1 should be no smaller than that between portfolios 5 and 4. Nonetheless,
for either cash flow news adjusted excess return Ret or abnormal returns (alphas), the 2-1 return
spreads are consistently smaller than the 5-4 spreads. For example, the differences in Ret
between portfolios 2 and 1 and between portfolios 5 and 4 are 0.0014 and 0.0019, respectively,
and the corresponding differences in 4-factor alpha are 0.0011 and 0.0023, respectively. Similar
patterns can be obtained for CAPM and 3-factor alpha too. These findings imply that
over-reaction to bad news via loss-aversion is at least partially responsible for the
behavior-related mispricing in explaining the positive relation between conditional conservatism
and the cost of equity capital.
V. SOX AND THE CONDITIONAL CONSERVATISM - EQUITY COST RELATION
Thus far we have found supporting evidence on the informational, fundamental, and
behavioral effects of conditional conservatism on its association with the cost of equity. If these
channels play a role, then the passage of SOX provides an ideal natural experiment wherein their
influences should be reduced (Chang et al. 2009; Skaife et al. 2009; Amir et al. 2010).18 SOX
legislation enacted by the U.S. Congress in 2003 in response to allegations of accounting
irregularities in Enron and other firms was intended in part to mitigate information asymmetry
18 Chang et al. (2009) report that SOX reduces the cost of equity capital in general by improving financial reporting quality; Skaife et al. (2009) document that SOX reduces equity cost via mandatory disclosures of internal control weaknesses; Amir et al. (2010) likewise argue that SOX enhances the negative relation between auditor independence and cost of debt capital proxied by bond ratings and yields.
28
between firms and investors and enhance market efficiency. Whereas several prior studies
document increased conditional conservatism in the post-SOX period (e.g., Lobo and Zhou
2006), our design lends itself to further detecting potential reductions in equity cost arising from
reduced information asymmetry after SOX, thus complementing prior findings. The mitigation
of information asymmetry further boosts market efficiency and shrinks potential mispricing.
SOX also constrained firms' investment and risk-taking (Kang et al. 2010; Bargeron et al. 2010),
implying a reduction in fundamental business risk as well as a diminished feedback effect.
Decreased fundamental risk in post-SOX era connotes a reduced equity premium on earnings
downside risk. Based on these arguments, we expect an attenuated association between CON and
equity cost after SOX was enacted. This serves to provide additional support for the
informational, fundamental, and behavioral influences of conditional conservatism to increase
cost of equity in the pre-SOX period.
Figure 1 graphically presents per-year average cash flow news adjusted excess returns to
CON-sorted hedging portfolios. A striking pattern is observed whereby hedging returns are
consistently positive for most years during the pre-SOX period of 1986-2002. The returns
become negative from 2004 through 2008, the post-SOX period, with generally smaller
magnitudes and variability compared with the pre-SOX period. The spike in 2003 is consistent
with enhanced revelations of bad news associated with the implementation of SOX.
Insert Figure 1 about here
To further examine the influence of SOX on CON-equity cost association, we conduct
firm-level Fama-MacBeth regressions of cash flow news adjusted excess returns on CON and
other control variables separately for the pre- and post-SOX periods, with results respectively
reported in Panels A and B of Table 8. To avoid possible noises from transient market reactions

29
to the SOX regulation, we omit years when SOX was passed (2002) and implemented (2003).
Panel A reveals that the positive CON-return relation is driven primarily by observations from
the pre-SOX period. In particular, CON loadings are positive and significant in all regressions
before the implementation of SOX. Panel B indicates that CON coefficients are generally
negative and/or insignificant in the post-SOX period, consistent with Figure 1. In summary,
results in pre- and post-SOX periods collectively corroborate the propositions about the
information asymmetry, fundamental risk, and behavioral channels through which conditional
conservatism enhances the cost of equity capital.
Insert Table 8 about here
VI. ROBUSTNESS CHECKS
To check the robustness of our main findings, we separately use CON_Skew, CON_Acm,
and the ranking of CON as alternative measures for conditional conservatism, with results
qualitatively unchanged. Using two other CON proxies Skew and CONA as introduced in Section
II also leads to qualitatively similar results. Moreover, extending Botosan et al. (2011), we use
analyst forecast error as an alternative approximation for cash flow news, which is computed as
the difference between reported annual earnings per share less its analysts’ forecast, deflated by
stock price. The empirical results are similar to previously reported.
For information asymmetry measures, we alternatively use average of daily high and low
spread HLSpread following Corwin and Schultz (2011), as well as Itrade following Llorente et
al. (2002) and Ferreira and Laux (2007). For earnings downside risk proxy, we also utilize Jones
(1991) model to predict total accruals in calculating ERisk. We further adopt the root lower
partial moment of ROA AERisk as another substitute measure. When these alternative proxies for
information asymmetry and earnings downside risk are used, results are consistent with those

30
reported in the main tests.
In alternative asset pricing tests, we follow McInnis (2010) and drop all return-months in
which a firm announces quarterly earnings to reduce the possibility that improper adjustments
for cash flow news may bias the results. We also add liquidity beta as a control for liquidity
effect not sufficiently captured by the Low-Priced dummy. Both schemes deliver findings that
are qualitatively similar to reported. Finally, to address the concern that the results for post-SOX
period are driven by the price plump and liquidity depletion during the 2007-2008 financial crisis,
we drop years of 2007 and 2008 from our post-SOX sample period and replicate Panel B of
Table 8, and achieve qualitatively unchanged results.
VII. CONCLUSIONS
Conditional conservatism helps lower cost of equity capital by improving disclosure
quality. At the same time, it also affects information asymmetry, influences firms’ fundamental
operation, and induces possible behavior-driven mispricing, especially in imperfect markets, all
of which hold the potential to increase cost of equity. How CON is related to equity cost is
determined by the combined effect from these channels. Using accounting-based conditional
conservatism measures and cash flow news adjusted equity cost proxies, we find a significantly
positive relation between CON and the cost of equity capital that operates via information
asymmetry, earnings downside risk, and behavioral effects. We provide confirming evidence that
the positive association between CON and equity capital cost largely disappears in the post-SOX
period, consistent with mitigated information asymmetry, diminished fundamental business risk,
and attenuated behavioral influence engendered by SOX.
By providing original evidence that conditional conservatism increases the cost of equity
capital, and by relating it to informational, fundamental risk, and behavioral dimensions, this
31
study supplements prior literature about the equity cost decreasing effect of CON via improved
information quality only. Our findings hold implications for ongoing deliberations regarding the
costs and benefits of conservatism as a basic tenet of financial accounting, and also augment the
SOX literature by documenting a diminution of the influence of CON on cost of capital,
suggesting that SOX regulations reduce the equity cost via informational, fundamental, and
behavioral effects relevant to CON, and connoting the importance of considering
regulation-induced structural changes in asset pricing tests.
In this study, we aim at providing a clearer inference about conditional conservatism’s
impact on cost of equity and propose three mediating channels of informational asymmetry,
operational risk, and behavioral influence, but with no intention to be exhaustive. In this sense,
our findings do not mean to depict all the facets of conditional conservatism, whose relation with
cost of equity is innately complicated. Therefore, the positive association between conditional
conservatism and equity cost documented in this study should be treated as a supplement to,
rather than as a substitute for, existing evidence on conservatism-capital cost relation that
warrants further enquiry.
32
REFERENCES
Akins, B. K., J. Ng, and R. S. Verdi. 2012. Investor competition over information and the pricing
of information asymmetry. The Accounting Review (forthcoming).
Armstrong, C., J. Core, D. Taylor, and V. Verrecchia. 2011. When does information asymmetry
affect the cost of capital? Journal of Accounting Research 49(1): 1-40.
Accounting Principles Board. 1970. Statement No. 4: Basic Concepts and Accounting Principles
Underlying Financial Statements of Business Enterprises. Stamford, CT: FASB.
Amir, E., Y. Guan, and G. Livne. 2010. Auditor independence and the cost of capital before and
after Sarbanes-Oxley: the case of newly issued public debt. European Accounting Review
19(4): 633-664.
Bargeron, L., K. M. Lehn, and C. J. Zutter. 2010. Sarbanes-Oxley and corporate risk-taking.
Journal of Accounting and Economics 49(1): 34–52.
Basu, S., 1997. The conservatism principle and the asymmetric timeliness of earnings. Journal of
Accounting and Economics 24(1): 3-37.
Benartzi, S., and R. Thaler. 1985. Myopic loss aversion and the equity premium puzzle.
Quarterly Journal of Economics 110(1): 73–92.
Bernard, V., J. Thomas, and J. Wahlen. 1997. Accounting-based stock price anomalies:
Separating market inefficiencies from mispricing. Contemporary Accounting Research
14(2): 89-136.
Biddle, G., M. Ma, and Y. Wang. 2012. Loan loss recognition and systemic risk in the banking
industry. Working paper, The University of Hong Kong.
Botosan, C. A. 2006. Disclosure and the cost of capital: What do we know? Accounting and
Business Research 36(3): 31-40.
Botosan, C. A., M. A. Plumlee, and H. Wen. 2011. The relation between expected returns,
realized returns, and firm risk characteristics. Contemporary Accounting Research 28(4):
1085-1122.
Callen, J. L., D. Segal, and O-K. Hope. 2010. The pricing of conservative accounting and the
measurement of conservatism at the firm-year level. Review of Accounting Studies 15(1):
145-178.
Carhart, M. 1997. On the persistence of mutual fund performance. The Journal of Finance 52(1):
57-82.
33
Chang, H., G. D. Fernando, and L. Liao. 2009. Sarbanes-Oxley act, perceived earnings quality
and cost of capital. Review of Accounting and Finance 8(3): 216-231.
Chen, Q., T. Hemmer, and Y. Zhang. 2007. On the relation between conservatism in accounting
standards and incentives for earnings management. Journal of Accounting Research 45(3):
541-565.
Corwin, S. A., and P. Schultz. 2012. A simple way to estimate bid-ask spreads from daily high
and low prices. Journal of Finance (forthcoming).
Daniel, K. D., D. Hirshleifer, and A. Subrahmanyam. 2001. Overconfidence, arbitrage, and
equilibrium asset pricing. Journal of Finance 56(3): 921–965.
Diamond, D., and R. E. Verrecchia. 1991. Disclosure, liquidity, and the cost of capital. Journal
of Finance 46(4): 1325-1359.
Easley, D., and M. O’Hara. 2004. Information and the cost of capital. The Journal of Finance
59(4): 1553–1583.
Epstein, L. G., and M. Schneider. 2008. Ambiguity, information quality and asset pricing.
Journal of Finance 63(1): 197-228.
Fama, E. F. and K. R. French. 1992. The Cross-section of expected stock returns. Journal of
Finance 47(2): 427-465.
Fama, E. F. and K. R. French. 1993. Common risk factors in the returns on stocks and bonds.
Journal of Financial Economics 33(1): 3-56.
Fama, E. F. and K. R. French. 1997. Industry cost of equity. Journal of Financial Economics
43(2): 153-193.
Fama, E. F. and J. MacBeth. 1973. Risk, return and equilibrium: Empirical tests. Journal of
Political Economy 81(3): 607-636.
Fan, Q., X. Zhang. 2012. Accounting conservatism, aggregation, and information quality.
Contemporary Accounting Research (forthcoming).
Ferreira, M. A., and P. Laux. 2007. Corporate governance, idiosyncratic risk, and information
flow. Journal of Finance 62 (2): 951-989.
Financial Accounting Standards Board (FASB). 1980. Statement of Financial Accounting
Concepts No. 2: Qualitative Characteristics of Accounting Information. Stamford, CT:
FASB.
34
Francis, J., R. LaFond, P. Olsson, and K. Schipper. 2004. Cost of equity and earnings attributes.
The Accounting Review 79(4): 967-1010.
Gao, P. 2010. Disclosure quality, cost of capital, and investor welfare. The Accounting Review
85(1): 1-29.
Gao, P. 2011. A contracting approach to conservatism and earnings management. Working paper.
University of Chicago.
Gao, P., and P. J. Liang. 2011. Informational feedback effect, adverse selection, and the optimal
disclosure policy. Working paper. University of Chicago.
Gigler, F., C. Kanodia, H. Sapra, and R. Venugopalan. 2009. Accounting conservatism and the
efficiency of debt contracts. Journal of Accounting Research 47(3): 767-97.
Givoly, D. and C. Hayn. 2000. The changing time-series properties of earnings, cash flows and
accruals: Has financial reporting become more conservative? Journal of Accounting and
Economics 29(3): 287-320.
Gow, I. D., D. J. Taylor, and R. E. Verrecchia. 2011. Earnings precision, information asymmetry,
and the cost of capital: Evidence of information complementarities. Working paper.
Harvard University.
Grossman, S. J., and J. E. Stiglitz. 1980. On the impossibility of informationally efficient
markets. The American Economic Review 70(3): 393–408.
Guay, W., and R. E. Verrecchia. 2007. Conservative disclosure. Working paper. University of
Pennsylvania.
Haggard, K. S., J. S. Howe, and A. A. Lynch. 2011. Asset write-downs and information
asymmetry: Do big baths muddy the waters or clear the air? Working paper. Missouri State
University.
Hughes, J. S., J. Liu, and J. Liu. 2007. Information asymmetry, diversification, and cost of capital.
The Accounting Review 82(3): 705–730.
International Accounting Standard Board (IASB). 2010. Conceptual Framework for Financial
Reporting, London: IASB.
Jegadeesh, N. and S. Titman. 1993. Returns to buying winners and selling losers: Implications
for stock market efficiency. Journal of Finance 48(1): 65–91.
Jones, J. 1991. Earnings management during import relief investigations. Journal of Accounting
Research 29(2): 193 – 228.

35
Kahneman, D. and A. Tversky. 1979. Prospect theory: An analysis of decision under risk.
Econometrica 47(2): 263-292.
Kang, Q., Q. Liu, and R. Qi. 2010. The Sarbanes-Oxley act and corporate investment: A
structural assessment. Journal of Financial Economics 96(2): 291-305.
Khan, M., 2008. Are accruals mispriced? Evidence from tests of an intertemporal capital asset
pricing model. Journal of Accounting and Economics 45(1): 55-77.
Khan, M., and R. L. Watts. 2009. Estimation and empirical properties of a firm-year measure of
accounting conservatism. Journal of Accounting and Economics 48(2-3): 131-150.
Kim, B. H., and M. Pevzner. 2010. Conditional accounting conservatism and future negative
surprises: An empirical investigation. Journal of Accounting Public Policy 29(4): 311–329.
Kim, D., and Y. Qi. 2010. Accruals quality, stock returns, and macroeconomic conditions. The
Accounting Review 85(3): 937–978.
LaFond, R., and R. L. Watts. 2008. The information role of conservatism. The Accounting
Review 83(2): 447–478.
Lambert, R., C. Leuz, and R. E. Verrecchia. 2007. Accounting information, disclosure, and the
cost of capital. Journal of Accounting Research 45(2): 385-420.
Lambert, R., C. Leuz, and R. E. Verrecchia. 2012. Information asymmetry, information precision,
and the cost of capital, Review of Finance 16(1): 1–29.
Lambert, and R. E. Verrecchia. 2010. Cost of capital in imperfect competition settings. Working
paper. University of Pennsylvania.
Lara, JM. G., B. G. Osma, and F. Penalva. 2011. Conditional conservatism and cost of capital.
Review of Accounting Studies 16(2): 247-271.
Lewellen, J., S. Nagel, and J. Shanken. 2010. A skeptical appraisal of asset pricing tests.
Journal of Financial Economics 96(2): 175-194.
Llorente, G., R. Michaely, G. Saar and J. Wang. 2002. Dynamic volume-return relation of
individual stocks. The Review of Financial Studies 15(4): 1005-1047.
Lobo, G. J. and Zhou, J., 2006. Did conservatism in financial reporting increase after the
Sarbanes-Oxley Act? Initial evidence. Accounting Horizons 20, 57-73.
Luo, Y., M. Ma, and F. Wu. 2012. Earnings downside risk. Working paper. Fudan University.
McInnis, J. 2010. Earnings smoothness, average returns, and implied cost of equity capital. The
Accounting Review 85(1): 315-341.
36
Nan, L., and X. Wen. 2011. Conservatism’s effects on capital structure efficiency and
information quality. Working paper. University of Illinois at Chicago.
Newey, W., and K. D. West. 1987. A simple, positive semi-definite, heteroskedasticity and
autocorrelation consistent covariance matrix. Econometrica 55(3): 703-708.
Ogneva, M. 2010. Accrual quality, realized returns, and expected returns: The importance of
controlling for cash flow shocks. Working paper. Stanford University.
Richardson, S. A., R. G. Sloan, M. T. Soliman, and I. Tuna. 2005. Accrual reliability, earnings,
persistence and stock prices. Journal of Accounting and Economics 39 (3): 437-485.
Roy, A. D. 1952. Safety first and the holding of assets. Econometrica 20(3): 431-449.
Skaife, H. A., D. W. Collins, W. R. Kinney, and R. LaFond. 2009. The effect of SOX internal
control deficiencies on firm risk and cost of equity. Journal of Accounting Research 47(1):
1-43.
Sarbanes-Oxley Act of 2002. 2002. Public Law 107-204, 107th U.S. Congress.
Sloan, R. 1996. Do stock prices fully reflect information in accruals and cash flows about future
earnings? The Accounting Review 71(3): 289-315.
Suijs, R. 2008. On the value relevance of asymmetric financial reporting policies. Journal of
Accounting Research 46(5): 1297-1321.
Veronesi, P. 1999. Stock market overreaction to bad news in good times: A rational expectations
equilibrium model. Review of Financial Studies 12(5): 975-1007.
Vuolteenaho, T. 2002. What drives firm-level stock returns? Journal of Finance 57(1): 233–264.
Xie, H. 2001. The mispricing of abnormal accruals. The Accounting Review 76 (3): 357-373.
Zhang, J. 2008. The contracting benefits of accounting conservatism to lenders and borrowers.
Journal of Accounting and Economics 45(1): 27–54.

37
TABLE 1. Descriptive Statistics for Conditional Conservatism and Firm Characteristic Variables Panel A: Summary Statistics CON CON_Skew CON_Acm TCA Acc IRisk ERisk Size Beta BM Momentum Mean -0.5035 -1.0155 0.0085 0.0099 0.0534 0.0278 -0.0063 2411.36 1.2276 0.6252 0.1570 STD 0.7700 0.2000 1.5200 0.1200 0.0500 0.0400 0.1200 12724.75 0.3500 0.4400 0.5900 Q1 -0.5780 -1.1477 -0.0231 -0.0316 0.0224 0.0061 -0.0544 55.95 0.9648 0.3256 -0.1667 Median -0.5129 -1.0303 0.0116 0.0080 0.0379 0.0170 -0.0076 228.47 1.1726 0.5167 0.0667 Q3 -0.4291 -0.8726 0.0425 0.0546 0.0664 0.0362 0.0393 1007.61 1.4421 0.7952 0.3403
Panel B: Correlation Matrix CON CON_Skew CON_Acm TCA Acc IRisk ERisk Size Beta BM Momentum CON 1 0.1338 0.9913 -0.0068 0.2244 0.0174 0.2947 -0.0054 0.0236 -0.0005 0.0016 CON_Skew 0.9129 1 0.0018 -0.0318 0.2552 0.0663 0.0681 -0.0426 0.1595 0.0434 0.0255 CON_Acm 0.4001 0.0623 1 -0.0027 0.0493 -0.0158 0.2887 0.0002 0.0027 -0.0063 -0.0017 TCA -0.0560 -0.0375 -0.0386 1 -0.0451 -0.0254 -0.3036 -0.0018 0.0184 -0.1140 0.0112 Acc 0.2620 0.2780 0.0547 -0.0198 1 0.0419 0.0185 -0.0650 0.3004 -0.0714 0.0119 IRisk 0.0546 0.0942 -0.0699 0.0095 0.1154 1 0.0054 -0.1180 0.0588 0.3537 0.0653 ERisk 0.1447 0.0629 0.2484 -0.3270 -0.0026 -0.0112 1 0.0234 0.0099 0.0022 0.0268 Size -0.1047 -0.1442 0.0564 0.0221 -0.2798 -0.7671 0.0448 1 -0.1202 -0.1248 -0.0019 Beta 0.1474 0.1531 0.0518 0.0198 0.3271 0.0808 -0.0340 -0.2068 1 0.0114 0.0331 BM 0.0093 0.0305 -0.0622 -0.1314 -0.0880 0.3620 -0.0090 -0.4294 -0.0036 1 0.0619 Momentum -0.0051 -0.0162 0.0213 0.0019 -0.0717 0.0018 0.0412 0.1026 -0.0527 0.0472 1 This table reports descriptive statistics for conditional conservatism measures and firm characteristic variables for the sample period of January 1986 to December 2008. Panel A shows summary statistics, and Panel B presents Pearson and Spearman correlations among these variables in the upper and lower triangles, respectively. Highlighted numbers are statistically significant at the 10% confidence level. Variable definitions are available in Sections II.
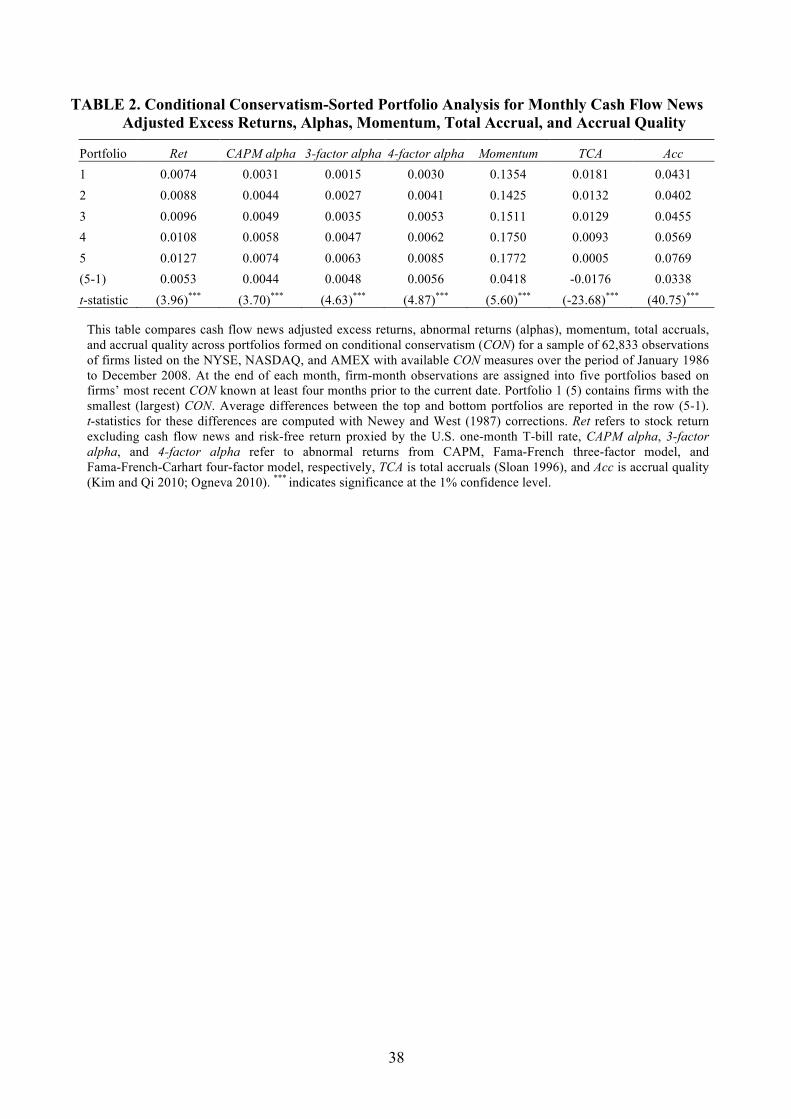
38
TABLE 2. Conditional Conservatism-Sorted Portfolio Analysis for Monthly Cash Flow News Adjusted Excess Returns, Alphas, Momentum, Total Accrual, and Accrual Quality
Portfolio Ret CAPM alpha 3-factor alpha 4-factor alpha Momentum TCA Acc 1 0.0074 0.0031 0.0015 0.0030 0.1354 0.0181 0.0431 2 0.0088 0.0044 0.0027 0.0041 0.1425 0.0132 0.0402 3 0.0096 0.0049 0.0035 0.0053 0.1511 0.0129 0.0455 4 0.0108 0.0058 0.0047 0.0062 0.1750 0.0093 0.0569 5 0.0127 0.0074 0.0063 0.0085 0.1772 0.0005 0.0769 (5-1) 0.0053 0.0044 0.0048 0.0056 0.0418 -0.0176 0.0338 t-statistic (3.96)*** (3.70)*** (4.63)*** (4.87)*** (5.60)*** (-23.68)*** (40.75)***
This table compares cash flow news adjusted excess returns, abnormal returns (alphas), momentum, total accruals, and accrual quality across portfolios formed on conditional conservatism (CON) for a sample of 62,833 observations of firms listed on the NYSE, NASDAQ, and AMEX with available CON measures over the period of January 1986 to December 2008. At the end of each month, firm-month observations are assigned into five portfolios based on firms’ most recent CON known at least four months prior to the current date. Portfolio 1 (5) contains firms with the smallest (largest) CON. Average differences between the top and bottom portfolios are reported in the row (5-1). t-statistics for these differences are computed with Newey and West (1987) corrections. Ret refers to stock return excluding cash flow news and risk-free return proxied by the U.S. one-month T-bill rate, CAPM alpha, 3-factor alpha, and 4-factor alpha refer to abnormal returns from CAPM, Fama-French three-factor model, and Fama-French-Carhart four-factor model, respectively, TCA is total accruals (Sloan 1996), and Acc is accrual quality (Kim and Qi 2010; Ogneva 2010). *** indicates significance at the 1% confidence level.
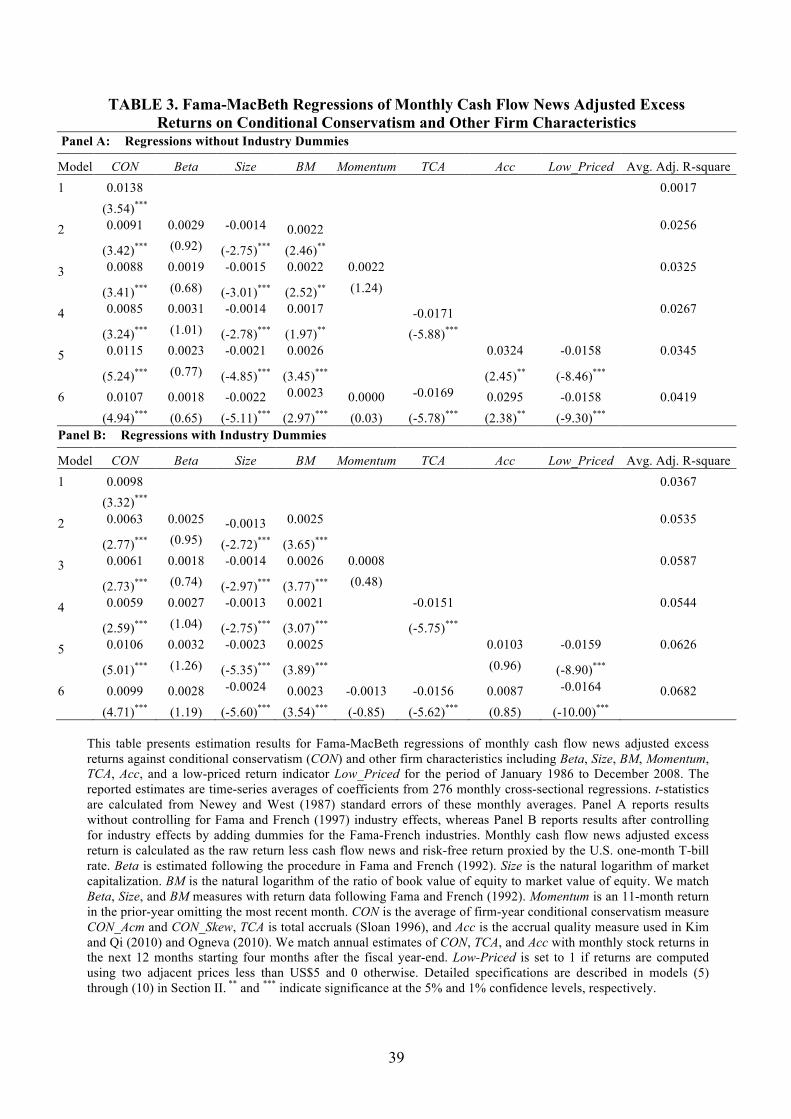
39
TABLE 3. Fama-MacBeth Regressions of Monthly Cash Flow News Adjusted Excess Returns on Conditional Conservatism and Other Firm Characteristics
Panel A: Regressions without Industry Dummies
Model CON Beta Size BM Momentum TCA Acc Low_Priced Avg. Adj. R-square 1 0.0138 0.0017 (3.54)*** 2 0.0091 0.0029 -0.0014 0.0022 0.0256
(3.42)*** (0.92) (-2.75)*** (2.46)**
3 0.0088 0.0019 -0.0015 0.0022 0.0022 0.0325
(3.41)*** (0.68) (-3.01)*** (2.52)** (1.24)
4 0.0085 0.0031 -0.0014 0.0017 -0.0171 0.0267
(3.24)*** (1.01) (-2.78)*** (1.97)** (-5.88)***
5 0.0115 0.0023 -0.0021 0.0026 0.0324 -0.0158 0.0345
(5.24)*** (0.77) (-4.85)*** (3.45)*** (2.45)** (-8.46)***
6 0.0107 0.0018 -0.0022 0.0023 0.0000 -0.0169 0.0295 -0.0158 0.0419 (4.94)*** (0.65) (-5.11)*** (2.97)*** (0.03) (-5.78)*** (2.38)** (-9.30)*** Panel B: Regressions with Industry Dummies
Model CON Beta Size BM Momentum TCA Acc Low_Priced Avg. Adj. R-square 1 0.0098 0.0367 (3.32)*** 2 0.0063 0.0025 -0.0013 0.0025 0.0535
(2.77)*** (0.95) (-2.72)*** (3.65)***
3 0.0061 0.0018 -0.0014 0.0026 0.0008 0.0587
(2.73)*** (0.74) (-2.97)*** (3.77)*** (0.48)
4 0.0059 0.0027 -0.0013 0.0021 -0.0151 0.0544
(2.59)*** (1.04) (-2.75)*** (3.07)*** (-5.75)***
5 0.0106 0.0032 -0.0023 0.0025 0.0103 -0.0159 0.0626
(5.01)*** (1.26) (-5.35)*** (3.89)*** (0.96) (-8.90)***
6 0.0099 0.0028 -0.0024 0.0023 -0.0013 -0.0156 0.0087 -0.0164 0.0682 (4.71)*** (1.19) (-5.60)*** (3.54)*** (-0.85) (-5.62)*** (0.85) (-10.00)***
This table presents estimation results for Fama-MacBeth regressions of monthly cash flow news adjusted excess returns against conditional conservatism (CON) and other firm characteristics including Beta, Size, BM, Momentum, TCA, Acc, and a low-priced return indicator Low_Priced for the period of January 1986 to December 2008. The reported estimates are time-series averages of coefficients from 276 monthly cross-sectional regressions. t-statistics are calculated from Newey and West (1987) standard errors of these monthly averages. Panel A reports results without controlling for Fama and French (1997) industry effects, whereas Panel B reports results after controlling for industry effects by adding dummies for the Fama-French industries. Monthly cash flow news adjusted excess return is calculated as the raw return less cash flow news and risk-free return proxied by the U.S. one-month T-bill rate. Beta is estimated following the procedure in Fama and French (1992). Size is the natural logarithm of market capitalization. BM is the natural logarithm of the ratio of book value of equity to market value of equity. We match Beta, Size, and BM measures with return data following Fama and French (1992). Momentum is an 11-month return in the prior-year omitting the most recent month. CON is the average of firm-year conditional conservatism measure CON_Acm and CON_Skew, TCA is total accruals (Sloan 1996), and Acc is the accrual quality measure used in Kim and Qi (2010) and Ogneva (2010). We match annual estimates of CON, TCA, and Acc with monthly stock returns in the next 12 months starting four months after the fiscal year-end. Low-Priced is set to 1 if returns are computed using two adjacent prices less than US$5 and 0 otherwise. Detailed specifications are described in models (5) through (10) in Section II. ** and *** indicate significance at the 5% and 1% confidence levels, respectively.

40
TABLE 4. Portfolio-Level Two-Stage Cross-Sectional Regressions
Panel A: First-Stage Time-Series Regressions of Portfolio Returns on Factor Returns Model Intercept RM SMB HML UMD RCON Adj. R-square 1 0.0053 1.0925 0.8475 0.2868 0.7626 (4.54)*** (42.25)*** (11.83)*** (4.05)*** 2 0.0031 1.0292 0.7242 0.333 0.4725 0.7857 (3.37)*** (31.14)*** (13.71)*** (4.92)*** (4.16)*** 3 0.0077 1.0457 0.8665 0.2272 -0.2305 0.7834 (6.38)*** (41.16)*** (11.96)*** (3.06)*** (-11.26)*** 4 0.0056 1.0003 0.7647 0.2718 -0.2023 0.3814 0.8024 (6.74)*** (30.52)*** (14.38)*** (3.83)*** (-11.70)*** (3.41)***
Panel B: Second-Stage Cross-Sectional Regressions of Mean Portfolio Returns on Factor Loadings Model Intercept βRM βSMB βHML βUMD βRCON Adj. R-square 1 0.0250 -0.0184 0.0061 0.0051 0.4170
(2.60)*** (-2.42)** (2.21)** (1.95)*
2 0.0282 -0.0180 -0.0049 0.0091 0.0051 0.7566
(4.52)*** (-3.66)*** (1.82) (4.93)*** (3.42)***
3 0.0263 -0.0214 0.0045 0.0070 -0.0090 0.4086
(2.68)*** (-2.53)** (1.33) (1.98)** (-0.61)
4 0.0275 -0.0159 -0.0044 0.0079 0.0050 0.0055 0.7530
(4.36)*** (-2.90)*** (-1.59) (3.45)*** (-0.51) (3.49)***
This table reports results of Fama-French 25 portfolio-level two-stage cross-sectional regressions for a sample over the 1986-2008 period. Panel A reports average factor loadings and adjusted R2 for the first-stage time-series regressions of monthly portfolio cash flow news adjusted excess returns against the three Fama-French factors, a momentum factor, and a conservatism factor RCON, using models (11) and (12) described in Section II. We construct RCON as the return on a zero-investment portfolio by buying the top 20 percent of firms and selling the bottom 20 percent of firms in terms of CON. Panel B reports estimated coefficients for the second-stage cross-sectional regressions of mean cash flow news adjusted excess portfolio returns on portfolio factor loadings estimated from the first stage, according to models (13) and (14) in Section II. t-statistics are given in parentheses, *, **, and *** indicate significance at the 10%, 5%, and 1% confidence levels, respectively.
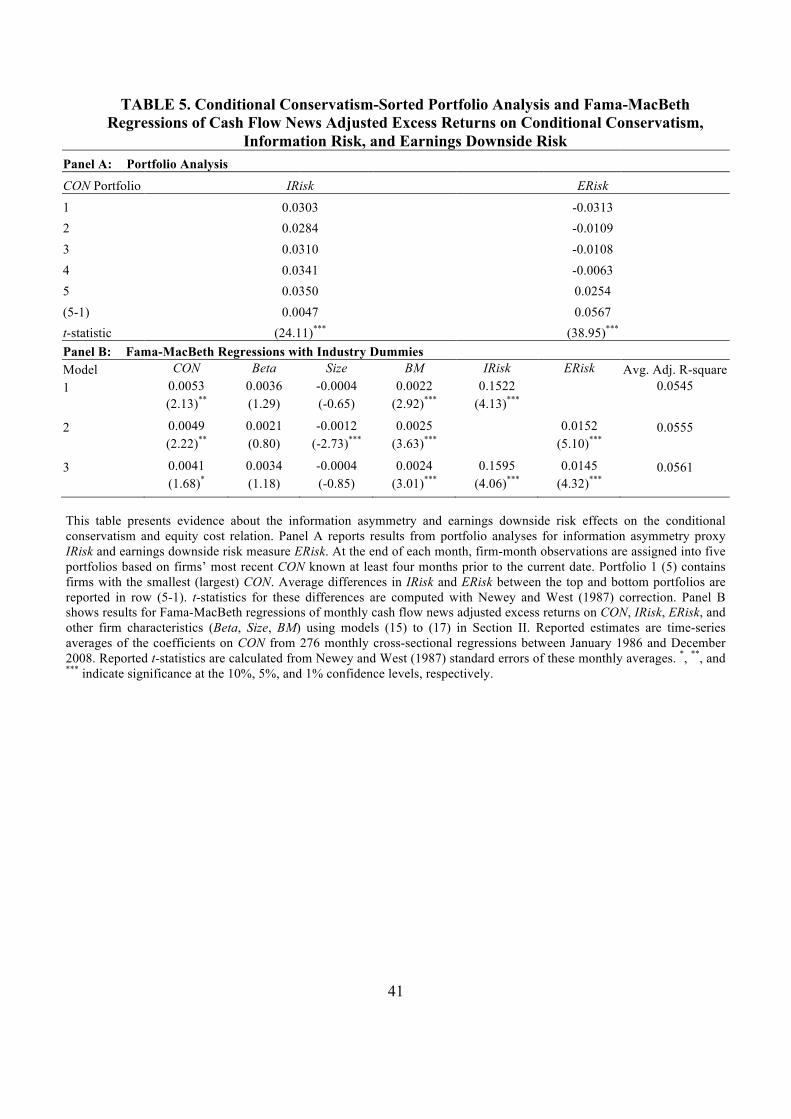
41
TABLE 5. Conditional Conservatism-Sorted Portfolio Analysis and Fama-MacBeth Regressions of Cash Flow News Adjusted Excess Returns on Conditional Conservatism,
Information Risk, and Earnings Downside Risk Panel A: Portfolio Analysis
CON Portfolio IRisk ERisk
1 0.0303 -0.0313 2 0.0284 -0.0109 3 0.0310 -0.0108 4 0.0341 -0.0063 5 0.0350 0.0254 (5-1) 0.0047 0.0567 t-statistic (24.11)*** (38.95)*** Panel B: Fama-MacBeth Regressions with Industry Dummies Model CON Beta Size BM IRisk ERisk Avg. Adj. R-square 1 0.0053 0.0036 -0.0004 0.0022 0.1522 0.0545
(2.13)** (1.29) (-0.65) (2.92)*** (4.13)*** 2 0.0049 0.0021 -0.0012 0.0025 0.0152 0.0555
(2.22)** (0.80) (-2.73)*** (3.63)*** (5.10)*** 3 0.0041 0.0034 -0.0004 0.0024 0.1595 0.0145 0.0561
(1.68)* (1.18) (-0.85) (3.01)*** (4.06)*** (4.32)***
This table presents evidence about the information asymmetry and earnings downside risk effects on the conditional conservatism and equity cost relation. Panel A reports results from portfolio analyses for information asymmetry proxy IRisk and earnings downside risk measure ERisk. At the end of each month, firm-month observations are assigned into five portfolios based on firms’ most recent CON known at least four months prior to the current date. Portfolio 1 (5) contains firms with the smallest (largest) CON. Average differences in IRisk and ERisk between the top and bottom portfolios are reported in row (5-1). t-statistics for these differences are computed with Newey and West (1987) correction. Panel B shows results for Fama-MacBeth regressions of monthly cash flow news adjusted excess returns on CON, IRisk, ERisk, and other firm characteristics (Beta, Size, BM) using models (15) to (17) in Section II. Reported estimates are time-series averages of the coefficients on CON from 276 monthly cross-sectional regressions between January 1986 and December 2008. Reported t-statistics are calculated from Newey and West (1987) standard errors of these monthly averages. *, **, and *** indicate significance at the 10%, 5%, and 1% confidence levels, respectively.
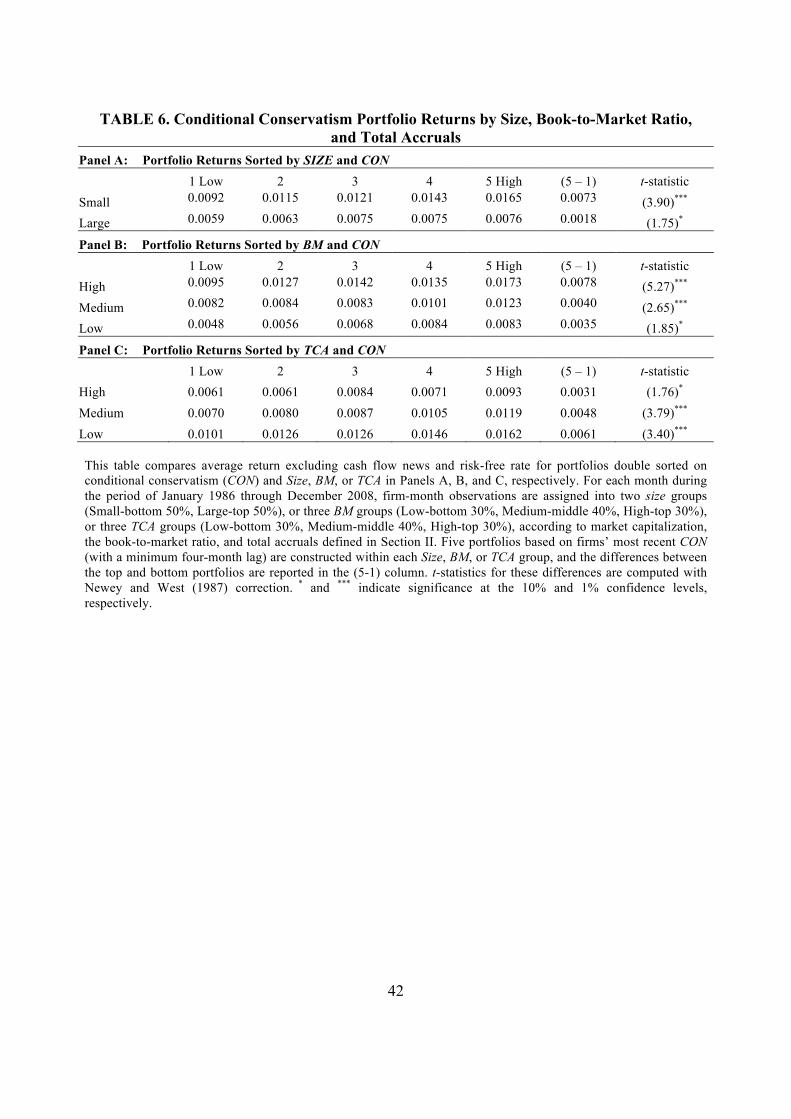
42
TABLE 6. Conditional Conservatism Portfolio Returns by Size, Book-to-Market Ratio,
and Total Accruals
Panel A: Portfolio Returns Sorted by SIZE and CON 1 Low 2 3 4 5 High (5 – 1) t-statistic Small 0.0092 0.0115 0.0121 0.0143 0.0165 0.0073 (3.90)*** Large 0.0059 0.0063 0.0075 0.0075 0.0076 0.0018 (1.75)*
Panel B: Portfolio Returns Sorted by BM and CON 1 Low 2 3 4 5 High (5 – 1) t-statistic High 0.0095 0.0127 0.0142 0.0135 0.0173 0.0078 (5.27)*** Medium 0.0082 0.0084 0.0083 0.0101 0.0123 0.0040 (2.65)*** Low 0.0048 0.0056 0.0068 0.0084 0.0083 0.0035 (1.85)*
Panel C: Portfolio Returns Sorted by TCA and CON 1 Low 2 3 4 5 High (5 – 1) t-statistic High 0.0061 0.0061 0.0084 0.0071 0.0093 0.0031 (1.76)* Medium 0.0070 0.0080 0.0087 0.0105 0.0119 0.0048 (3.79)*** Low 0.0101 0.0126 0.0126 0.0146 0.0162 0.0061 (3.40)*** This table compares average return excluding cash flow news and risk-free rate for portfolios double sorted on conditional conservatism (CON) and Size, BM, or TCA in Panels A, B, and C, respectively. For each month during the period of January 1986 through December 2008, firm-month observations are assigned into two size groups (Small-bottom 50%, Large-top 50%), or three BM groups (Low-bottom 30%, Medium-middle 40%, High-top 30%), or three TCA groups (Low-bottom 30%, Medium-middle 40%, High-top 30%), according to market capitalization, the book-to-market ratio, and total accruals defined in Section II. Five portfolios based on firms’ most recent CON (with a minimum four-month lag) are constructed within each Size, BM, or TCA group, and the differences between the top and bottom portfolios are reported in the (5-1) column. t-statistics for these differences are computed with Newey and West (1987) correction. * and *** indicate significance at the 10% and 1% confidence levels, respectively.
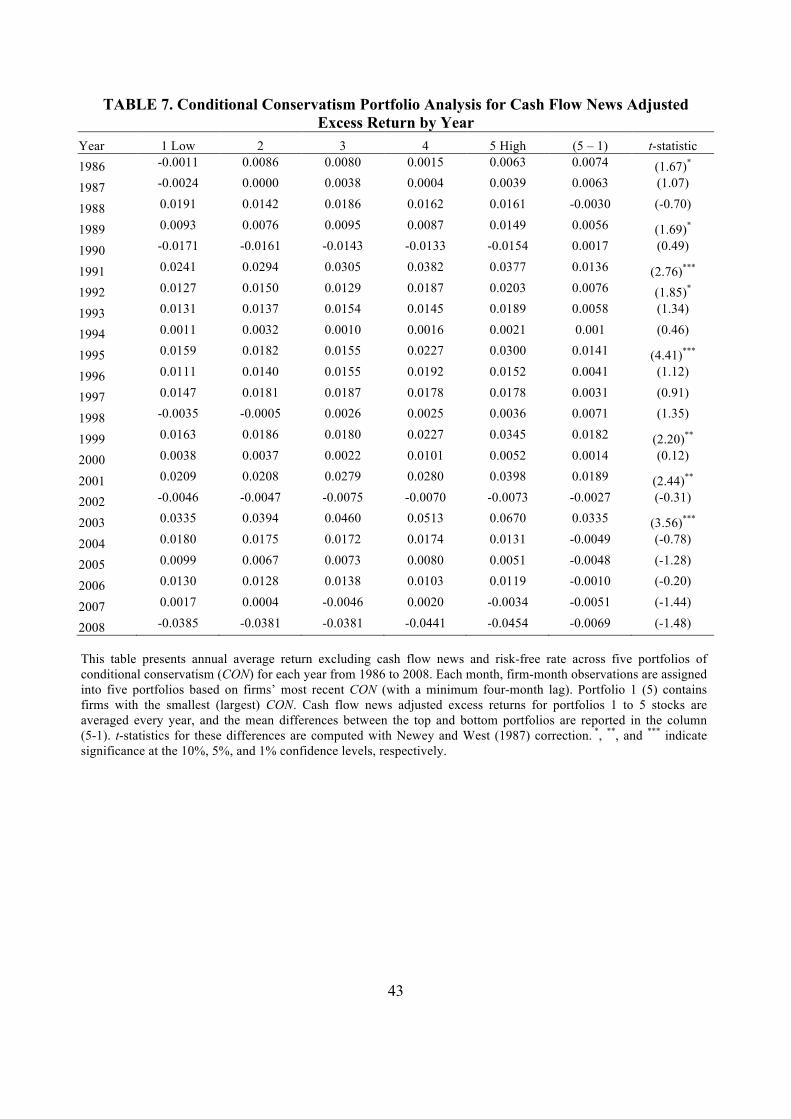
43
TABLE 7. Conditional Conservatism Portfolio Analysis for Cash Flow News Adjusted Excess Return by Year
Year 1 Low 2 3 4 5 High (5 – 1) t-statistic 1986 -0.0011 0.0086 0.0080 0.0015 0.0063 0.0074 (1.67)* 1987 -0.0024 0.0000 0.0038 0.0004 0.0039 0.0063 (1.07)
1988 0.0191 0.0142 0.0186 0.0162 0.0161 -0.0030 (-0.70)
1989 0.0093 0.0076 0.0095 0.0087 0.0149 0.0056 (1.69)* 1990 -0.0171 -0.0161 -0.0143 -0.0133 -0.0154 0.0017 (0.49)
1991 0.0241 0.0294 0.0305 0.0382 0.0377 0.0136 (2.76)*** 1992 0.0127 0.0150 0.0129 0.0187 0.0203 0.0076 (1.85)* 1993 0.0131 0.0137 0.0154 0.0145 0.0189 0.0058 (1.34)
1994 0.0011 0.0032 0.0010 0.0016 0.0021 0.001 (0.46)
1995 0.0159 0.0182 0.0155 0.0227 0.0300 0.0141 (4.41)*** 1996 0.0111 0.0140 0.0155 0.0192 0.0152 0.0041 (1.12)
1997 0.0147 0.0181 0.0187 0.0178 0.0178 0.0031 (0.91)
1998 -0.0035 -0.0005 0.0026 0.0025 0.0036 0.0071 (1.35)
1999 0.0163 0.0186 0.0180 0.0227 0.0345 0.0182 (2.20)** 2000 0.0038 0.0037 0.0022 0.0101 0.0052 0.0014 (0.12)
2001 0.0209 0.0208 0.0279 0.0280 0.0398 0.0189 (2.44)** 2002 -0.0046 -0.0047 -0.0075 -0.0070 -0.0073 -0.0027 (-0.31)
2003 0.0335 0.0394 0.0460 0.0513 0.0670 0.0335 (3.56)*** 2004 0.0180 0.0175 0.0172 0.0174 0.0131 -0.0049 (-0.78)
2005 0.0099 0.0067 0.0073 0.0080 0.0051 -0.0048 (-1.28)
2006 0.0130 0.0128 0.0138 0.0103 0.0119 -0.0010 (-0.20)
2007 0.0017 0.0004 -0.0046 0.0020 -0.0034 -0.0051 (-1.44)
2008 -0.0385 -0.0381 -0.0381 -0.0441 -0.0454 -0.0069 (-1.48)
This table presents annual average return excluding cash flow news and risk-free rate across five portfolios of conditional conservatism (CON) for each year from 1986 to 2008. Each month, firm-month observations are assigned into five portfolios based on firms’ most recent CON (with a minimum four-month lag). Portfolio 1 (5) contains firms with the smallest (largest) CON. Cash flow news adjusted excess returns for portfolios 1 to 5 stocks are averaged every year, and the mean differences between the top and bottom portfolios are reported in the column (5-1). t-statistics for these differences are computed with Newey and West (1987) correction. *, **, and *** indicate significance at the 10%, 5%, and 1% confidence levels, respectively.
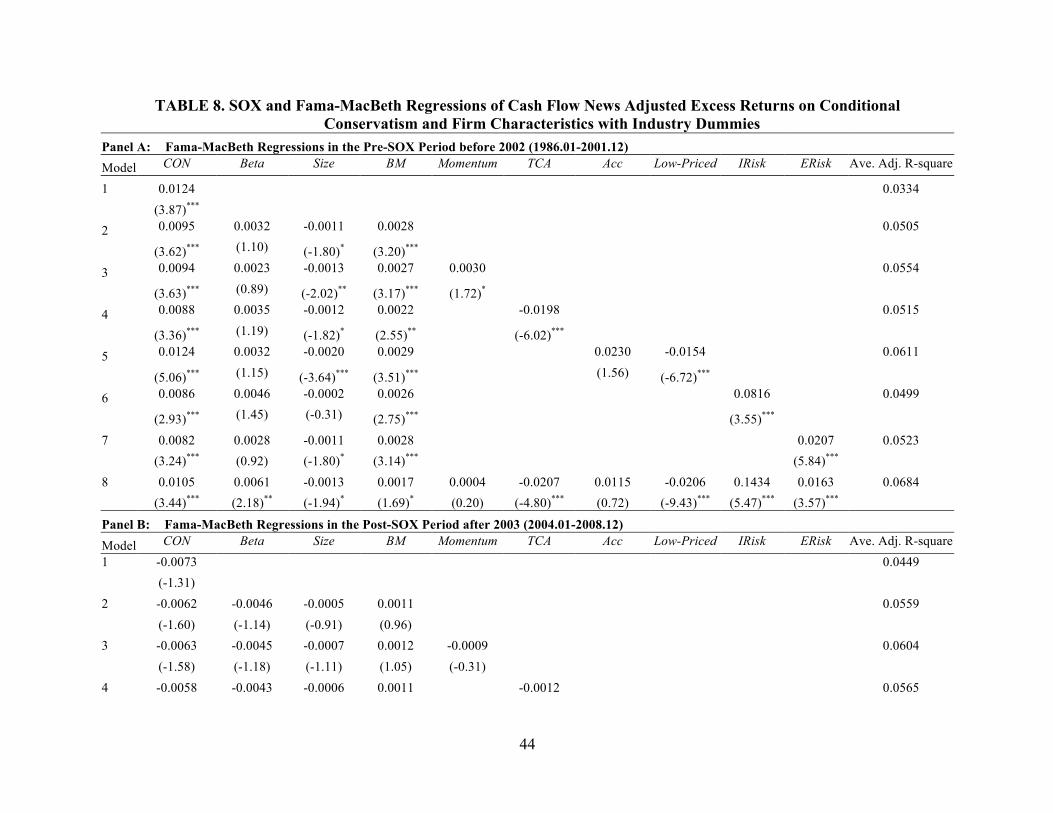
44
TABLE 8. SOX and Fama-MacBeth Regressions of Cash Flow News Adjusted Excess Returns on Conditional Conservatism and Firm Characteristics with Industry Dummies
Panel A: Fama-MacBeth Regressions in the Pre-SOX Period before 2002 (1986.01-2001.12) Model CON Beta Size BM Momentum TCA Acc Low-Priced IRisk ERisk Ave. Adj. R-square
1 0.0124 0.0334 (3.87)*** 2 0.0095 0.0032 -0.0011 0.0028 0.0505
(3.62)*** (1.10) (-1.80)* (3.20)***
3 0.0094 0.0023 -0.0013 0.0027 0.0030 0.0554
(3.63)*** (0.89) (-2.02)** (3.17)*** (1.72)*
4 0.0088 0.0035 -0.0012 0.0022 -0.0198 0.0515
(3.36)*** (1.19) (-1.82)* (2.55)** (-6.02)***
5 0.0124 0.0032 -0.0020 0.0029 0.0230 -0.0154 0.0611
(5.06)*** (1.15) (-3.64)*** (3.51)*** (1.56) (-6.72)***
6 0.0086 0.0046 -0.0002 0.0026 0.0816 0.0499
(2.93)*** (1.45) (-0.31) (2.75)*** (3.55)***
7 0.0082 0.0028 -0.0011 0.0028 0.0207 0.0523 (3.24)*** (0.92) (-1.80)* (3.14)*** (5.84)*** 8 0.0105 0.0061 -0.0013 0.0017 0.0004 -0.0207 0.0115 -0.0206 0.1434 0.0163 0.0684 (3.44)*** (2.18)** (-1.94)* (1.69)* (0.20) (-4.80)*** (0.72) (-9.43)*** (5.47)*** (3.57)***
Panel B: Fama-MacBeth Regressions in the Post-SOX Period after 2003 (2004.01-2008.12) Model CON Beta Size BM Momentum TCA Acc Low-Priced IRisk ERisk Ave. Adj. R-square 1 -0.0073 0.0449 (-1.31) 2 -0.0062 -0.0046 -0.0005 0.0011 0.0559 (-1.60) (-1.14) (-0.91) (0.96) 3 -0.0063 -0.0045 -0.0007 0.0012 -0.0009 0.0604 (-1.58) (-1.18) (-1.11) (1.05) (-0.31) 4 -0.0058 -0.0043 -0.0006 0.0011 -0.0012 0.0565

45
(-1.55) (-1.06) (-0.95) (0.99) (-0.28) 5 0.0046 -0.0025 -0.0022 0.0010 -0.0145 -0.0212 0.0599 (-1.19) (-0.63) (-4.35)*** (0.86) (-1.51) (-7.57)*** 6 -0.0068 -0.0043 0.0003 0.0007 0.3126 0.0595 (-1.71)* (-1.09) (-0.57) (0.62) (2.33)**
7 -0.0057 -0.0046 -0.0007 0.0010 -0.0002 0.0572 (-1.51) (-1.14) (-1.17) (0.83) (-0.04) 8 0.0027 -0.0014 -0.0004 0.0007 -0.0057 -0.0015 -0.0060 -0.0258 0.6457 0.0059 0.0714 (-0.71) (-0.38) (-0.73) (0.60) (-2.02)** (-0.35) (-0.61) (-8.98)*** (4.36)*** (-0.89)
This table presents estimation results for Fama-MacBeth regressions of monthly cash flow news adjusted excess returns on conditional
conservatism (CON), total accruals (TCA), accrual quality (Acc) (along with a low-priced return indicator variable Low-Priced), information asymmetry (IRisk), earnings downside risk (ERisk), and firm characteristics including Beta, Size, and BM, plus controls for dummies for Fama and French (1997) industries. Panel A reports average regression coefficients for the period of January 1986 to December 2001, a period before SOX; Panel B reports average coefficients for the period of January 2004 to December 2008, a period after SOX. Newey and West (1987) robust t-statistics are given in parentheses. *, **, and *** indicate significance at the 10%, 5%, and 1% confidence levels, respectively.

46
FIGURE 1. Average Cash Flow News Adjusted Excess Returns for Conditional Conservatism-Sorted Hedging Portfolios by Year
This figure presents average cash flow news adjusted excess returns for hedging portfolios sorted by conditional conservatism (CON) for each year within the period of 1986 to 2008. Each month, firm-month observations are assigned to five portfolios based on firms’ most recent CON (with a minimum four-month lag). Depicted are monthly differences in mean cash flow news adjusted excess returns between the top and bottom quintile portfolios sorted by CON in each year. Sarbanes-Oxley Section 404 regulations were implemented in 2003-2004.
Post-SOX Period