condition monitoring in the wind industry, relevant ... · condition monitoring in the wind...
TRANSCRIPT

Condition Monitoring in the Wind Industry, Relevant Technologies, and its Importance.

Outline
About Bachmann electronic
Overview of Maintenance Practices
Predictive Maintenance’s Role in Plant Management
Benefits of Condition Monitoring
Current Condition Monitoring Technology within wind
Vibration Based Condition Monitoring Systems
Why Bachmann CMS
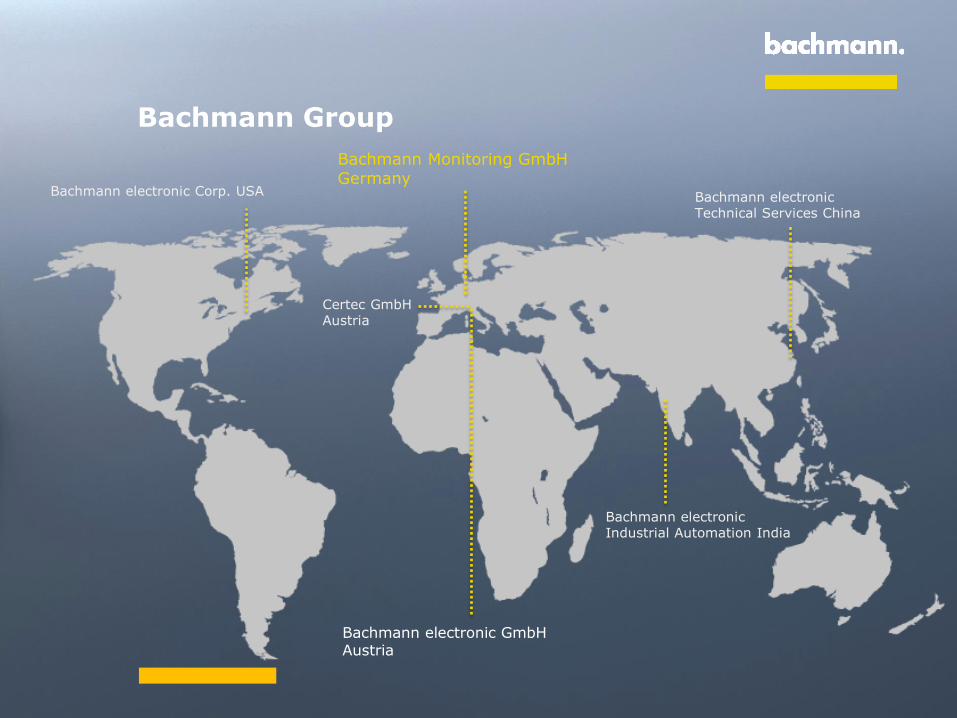
Bachmann Group
Bachmann electronic Corp. USA
Bachmann electronic Industrial Automation India
Bachmann electronic Technical Services China
Bachmann Monitoring GmbH Germany
Bachmann electronic GmbH Austria
Certec GmbH Austria

No. 1 wind automation
More than 70.000 installed turbine controls
Over 50% market share worldwide
From 500 kW to 7.0 MW
On and Offshore
SCADA
Condition Monitoring - over 4000 WT installs
Grid measurement and protection
Integrated safety concept
ColdClimate -40°C to +70°C

Office located in historic Schrafft’s Center in Charlestown, Massachusetts
Service North, South, and Central America
Provide training/certification – controls, CMS, Hardware installation
U.S. based monitoring center for CMS
Expanding team to meet growing demand of U.S. market
Developing field solutions for U.S. market: controller retrofit, SCADA, and CMS.
Bachmann U.S. Office

Different Maintenance Practices

Different Maintenance Practices (cont.)
A plant operating optimally will strike a balance between breakdown maintenance, predictive maintenance, preventive maintenance, and proactive maintenance.
For machinery that is non-redundant, costly, and mission critical, a predictive maintenance strategy is typically the preferred method of maintenance.
Detect Identify Assess Plan

Predictive/Condition Based Maintenance
Condition monitoring lends itself to predictive maintenance.
Why not perform maintenance exactly when needed?
Evaluate value/risk of asset failure to determine if CMS makes sense
Cost of monitoring vs. cost of failure
Is system redundant?
What happens if asset fails?
What is the value of asset?
What is the most effective CMS technology for my application?
Detect presence of worsening condition, identify source of failure, assess severity.

Informed Maintenance Decisions
Replacement costs can exceed the cost for repairs.
Maintenance is implemented on a basis of necessity rather
than predetermined schedules.
Unnecessary maintenance avoided.
Reduced Operational Downtime
Detect the occurance of faults and intervene before
catastrophic failure.
Extended total asset life
Continuous monitoring of asset health.
Maximize remaining useful life of parts.
Minimize total cost of ownership.
Benefits of Condition Monitoring (CM)

Parts failure is not a question of “If,” but of “when.”
Machinery is designed with lifetime in mind.
Parts lifetime depends on many uncontrollable variables (environmental, manufacturer defects).
Turbine Maintenance can be extremely costly.
Crane costs can be extremely high.
Optimize repair schedules (multiple repairs at once, maximize remaining useful life for parts, plan down-time around low-winds, etc.).
Order spare parts ahead of time.
Reactive spare parts purchasing can greatly reduce turbine availability.
Maximize remaining useful life of components by operating until maintenance is required
Reduce cost of ownership
Increase turbine availability
Reduce risk of catastrophic failure
Understand failure rates for specific turbine make/model
Lower risk for insuring specific sites
Condition Monitoring for Wind—Why?
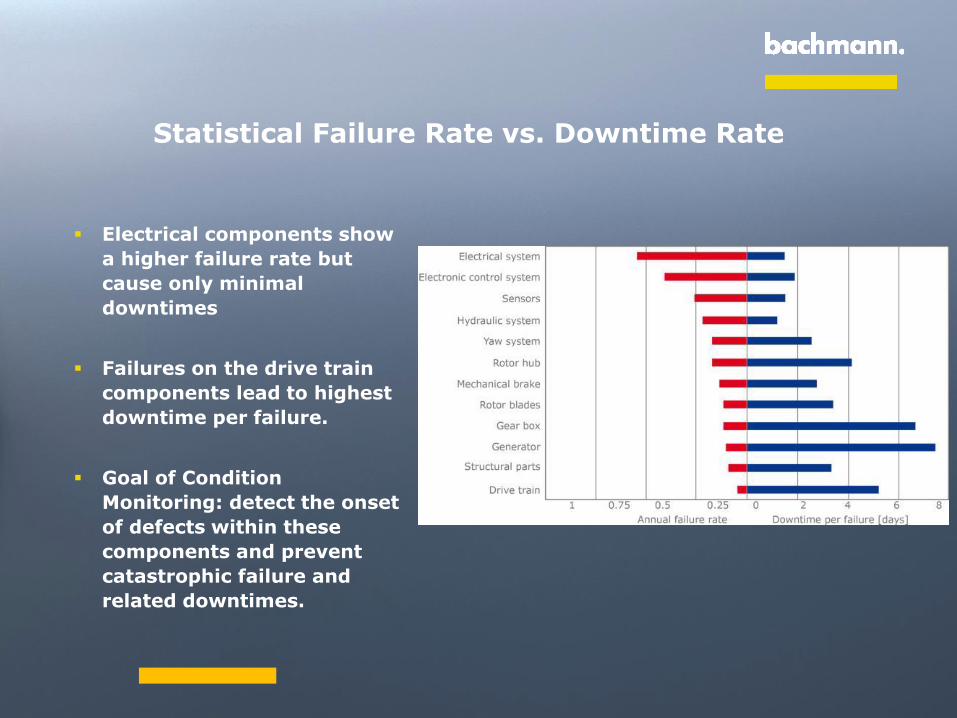
Electrical components show
a higher failure rate but
cause only minimal
downtimes
Failures on the drive train
components lead to highest
downtime per failure.
Goal of Condition
Monitoring: detect the onset
of defects within these
components and prevent
catastrophic failure and
related downtimes.
Statistical Failure Rate vs. Downtime Rate
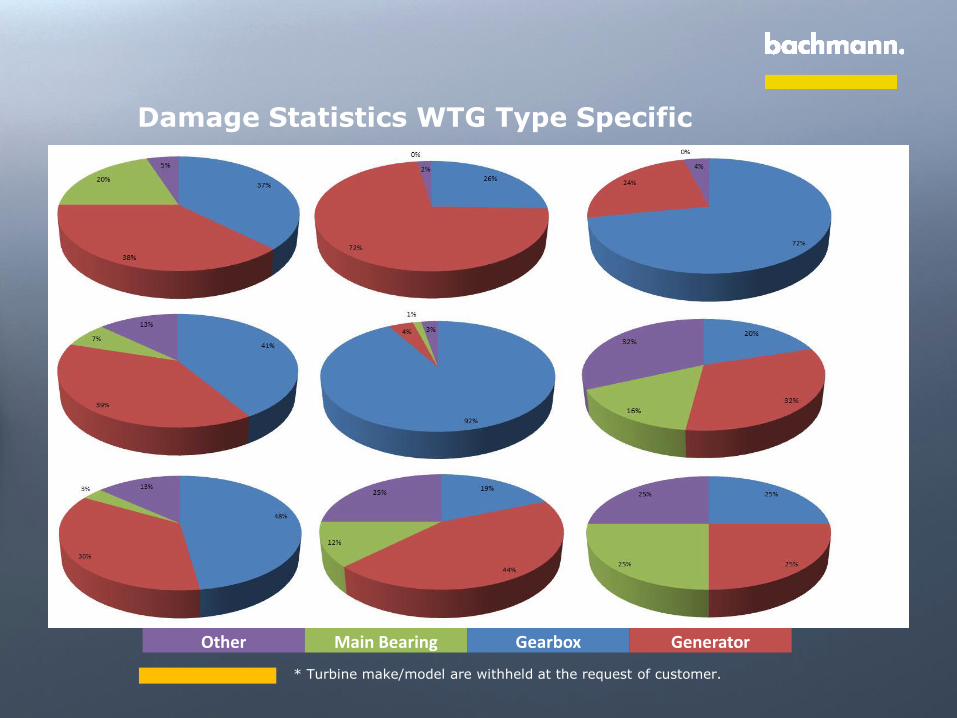
Damage Statistics WTG Type Specific
Other Main Bearing Gearbox Generator
* Turbine make/model are withheld at the request of customer.
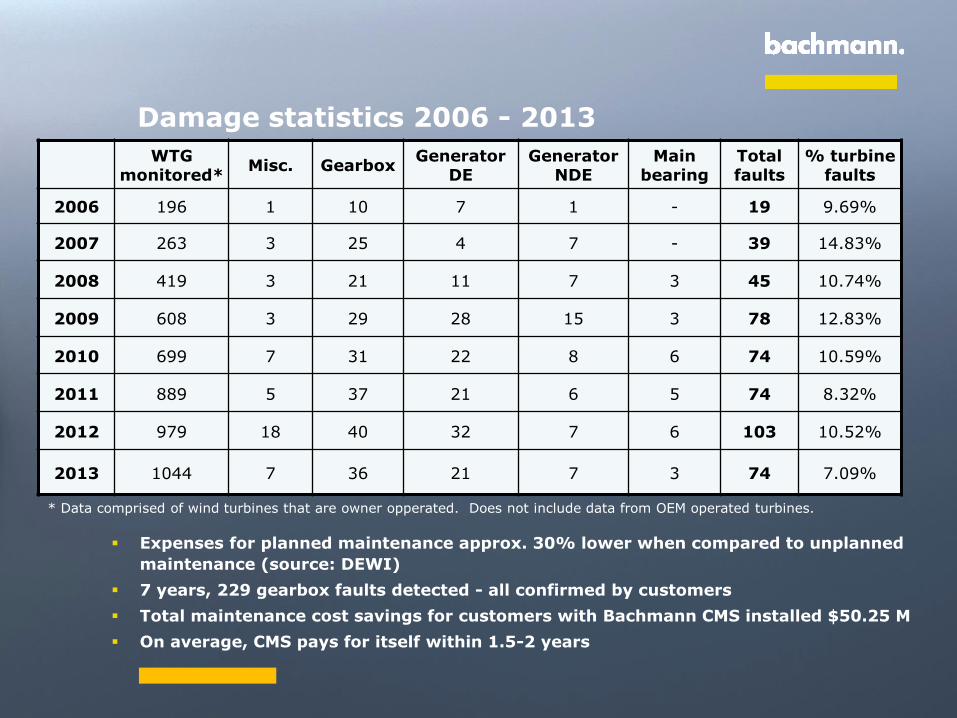
Damage statistics 2006 - 2013
Expenses for planned maintenance approx. 30% lower when compared to unplanned
maintenance (source: DEWI)
7 years, 229 gearbox faults detected - all confirmed by customers
Total maintenance cost savings for customers with Bachmann CMS installed $50.25 M
On average, CMS pays for itself within 1.5-2 years
* Data comprised of wind turbines that are owner opperated. Does not include data from OEM operated turbines.
WTG monitored*
Misc. Gearbox Generator
DE Generator
NDE Main
bearing Total faults
% turbine faults
2006 196 1 10 7 1 - 19 9.69%
2007 263 3 25 4 7 - 39 14.83%
2008 419 3 21 11 7 3 45 10.74%
2009 608 3 29 28 15 3 78 12.83%
2010 699 7 31 22 8 6 74 10.59%
2011 889 5 37 21 6 5 74 8.32%
2012 979 18 40 32 7 6 103 10.52%
2013 1044 7 36 21 7 3 74 7.09%
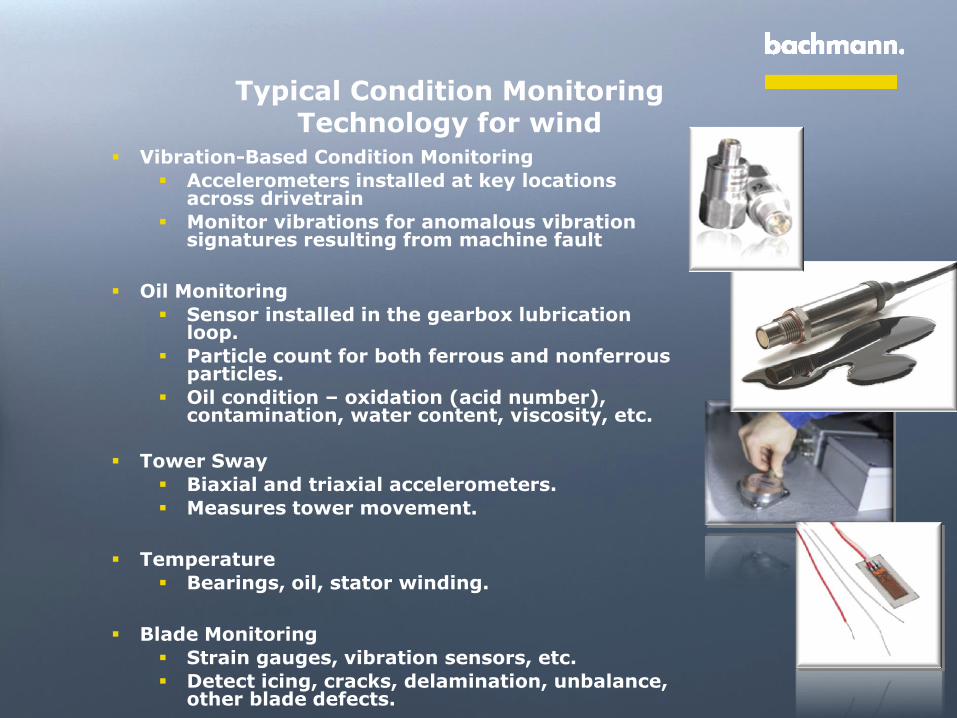
Vibration-Based Condition Monitoring
Accelerometers installed at key locations across drivetrain
Monitor vibrations for anomalous vibration signatures resulting from machine fault
Oil Monitoring
Sensor installed in the gearbox lubrication loop.
Particle count for both ferrous and nonferrous particles.
Oil condition – oxidation (acid number), contamination, water content, viscosity, etc.
Tower Sway
Biaxial and triaxial accelerometers.
Measures tower movement.
Temperature
Bearings, oil, stator winding.
Blade Monitoring
Strain gauges, vibration sensors, etc.
Detect icing, cracks, delamination, unbalance, other blade defects.
Typical Condition Monitoring Technology for wind
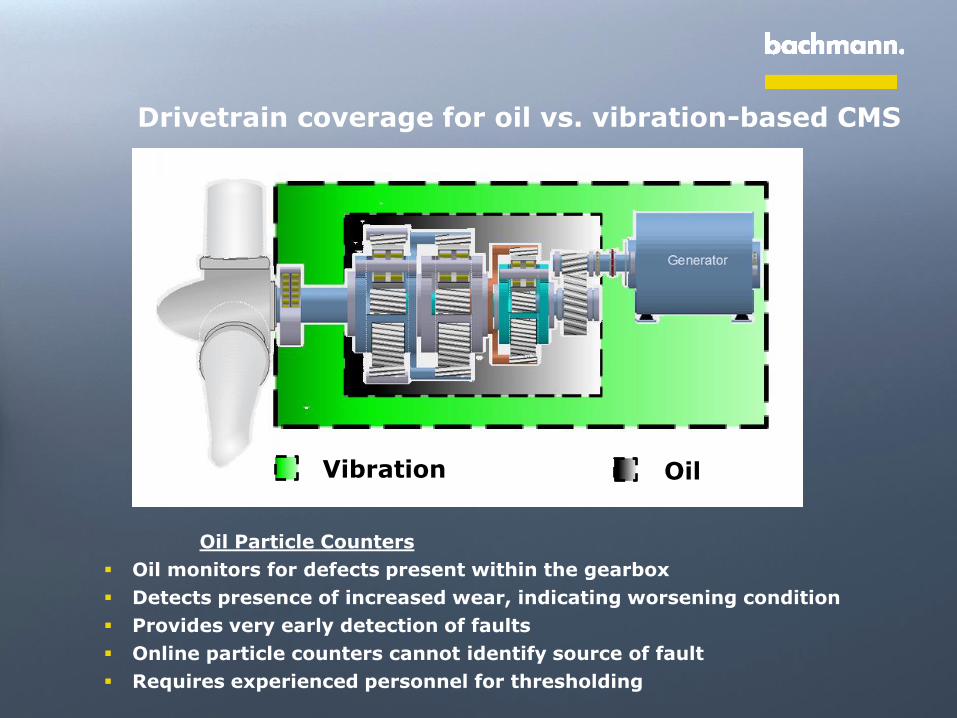
Drivetrain coverage for oil vs. vibration-based CMS
Vibration Oil
Oil Particle Counters
Oil monitors for defects present within the gearbox
Detects presence of increased wear, indicating worsening condition
Provides very early detection of faults
Online particle counters cannot identify source of fault
Requires experienced personnel for thresholding

Pros and Cons of Vibration-Based CMS
Detect defects in rotating components across the entire drivetrain (complete coverage – main bearing to generator)
Identify the source of fault (differentiate between bearings, gears, shaft, etc.)
Assess severity of fault (remaining useful life – prognostics)
Some CMS vendors are able to boast >99% detection rate across entire drivetrain
Matured and proven technology (used throughout other industries and adapted for wind)
× Lots of data
× Requires skilled analyst to interpret data
× Data only as good as sensor used and sensor installation
× Relatively high initial investment costs

For each major component (bearings, gears, etc.), install a sensor as
close as possible to the source of vibrations.
Rigid mounting is best (stud mounted or epoxied). Magnetic mounts
are not as good.
Install sensors on rigid portions of structure that are in direct contact
with major components liked bearing housings.
For specific faults being detected, consider sensor orientation: axial (in-
line with axis of shaft) or radial (perpendicular to axis of shaft).
Axial
Radial
bearing defects, gear faults, generator issues, unbalance
misalignment, bent shaft
How does CMS work?

Rotating machinery produces vibrations, whether the machine is deemed healthy or failing. Vibrations themselves are not indicative of a problem!
For each major component (gears, bearings, shafts, etc.), we need to understand failure modes.
Understand what to look for (fault frequencies)
Outer race defect
Cage defect
Ball defect
Inner race defect
Rolling element bearing

Calculate fault frequencies (characteristic values) for given fault
modes.
Fault frequencies (rolling element bearing)
BPFI = 𝑁𝑏𝑆𝑠ℎ𝑎𝑓𝑡 1+
𝐵𝑑𝐶𝑜𝑠 𝜃
𝑃𝑑
2
BPF0 = 𝑁𝑏𝑆𝑠ℎ𝑎𝑓𝑡 1−
𝐵𝑑𝐶𝑜𝑠 𝜃
𝑃𝑑
2
BSF = 𝑃𝑑𝑆𝑠ℎ𝑎𝑓𝑡 1−
𝐵𝑑𝐶𝑜𝑠(𝜃)
𝑃𝑑
2
2𝐵𝑑
FTF = 𝑆𝑠ℎ𝑎𝑓𝑡 1−
𝐵𝑑𝐶𝑜𝑠 𝜃
𝑃𝑑
2
𝑃𝑑
𝑵𝒃 = Number of balls
𝑩𝒅 = Ball diameter (in or mm)
𝑷𝒅 = Pitch diameter (in or mm)
𝑆𝑠ℎ𝑎𝑓𝑡 = speed of shaft (revolutions/second)
𝜃 = 𝑐𝑜𝑛𝑡𝑎𝑐𝑡 𝑎𝑛𝑔𝑙𝑒
𝐵𝑑

G1
G2
Sshaft1
Sshaft2
Fault frequencies (helical gears)
Chipped gear tooth
𝑻𝑴𝑭 = 𝒔𝒔𝒉𝒂𝒇𝒕𝟏 × #𝑻𝒆𝒆𝒕𝒉𝑮𝟏 = 𝒔𝒔𝒉𝒂𝒇𝒕𝟐 × #𝑻𝒆𝒆𝒕𝒉𝑮𝟐
𝑺𝒔𝒉𝒂𝒇𝒕 = 𝑺𝒑𝒆𝒆𝒅 𝒐𝒇 𝒔𝒉𝒂𝒇𝒕
𝑻𝑴𝑭 = 𝑻𝒐𝒐𝒕𝒉 𝑴𝒆𝒔𝒉 𝑭𝒓𝒆𝒒𝒖𝒆𝒏𝒄𝒚

Frequency domain
When analyzing vibration data, sometimes it’s difficult to interpret in the time domain.
Each rotating component that makes up the drivetrain produces its own vibrational signature.
Our sensor is measuring the sum of the vibrations from bearings B1-4 and the tooth meshing between G1/G2.
B1 B2 G1
G2 B3 B4
Time
Am
pli
tud
e
(g
)

Frequency domain
Time
Am
pli
tud
e
(g
)
Frequency (Hz)
Am
pli
tud
e
(g
)
BP
FI
GM
F
BP
FO
FTF
BS
F
Once we convert the signal to the frequency domain, it becomes a matter of thresholding and trending vibration levels.
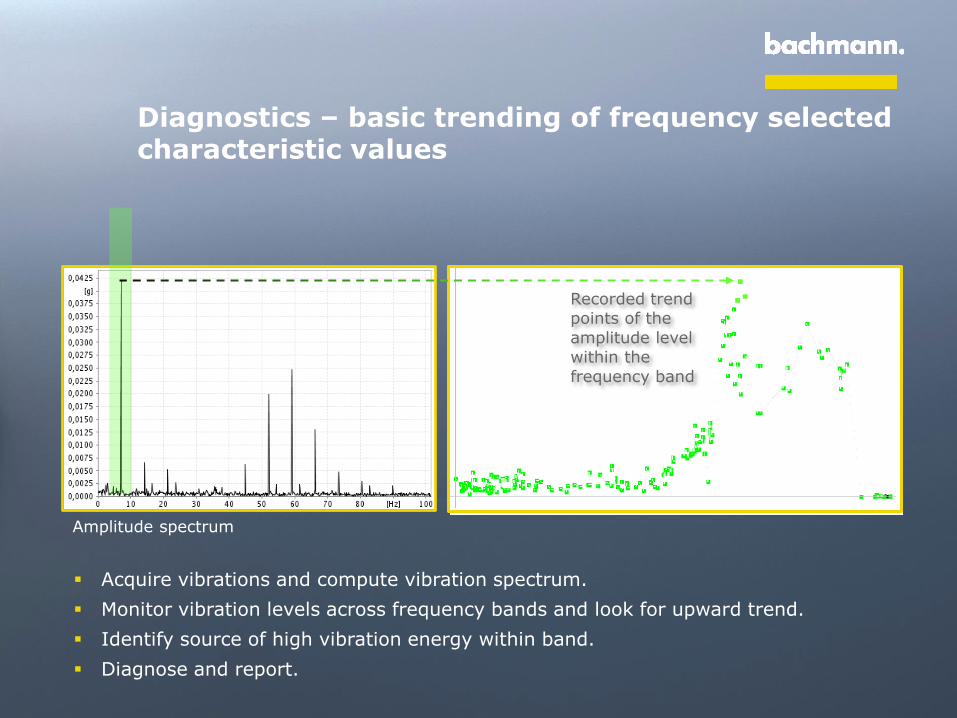
Amplitude spectrum
Recorded trend points of the
amplitude level within the
frequency band
Diagnostics – basic trending of frequency selected characteristic values
Acquire vibrations and compute vibration spectrum.
Monitor vibration levels across frequency bands and look for upward trend.
Identify source of high vibration energy within band.
Diagnose and report.

Diagnostics – Generator Bearing (GEN-NDE)
Generator bearing with defect.
Upward trend in vibration energy was
observed.
High energy in vibration spectrum at fault
frequency.

Product specifications: Sensors
BA
M1
00
• Sensitivity 100 mV/g
• Output IEPE-compatible
• Measuring range 0.5 Hz – 14 kHz
• recommended for monitoring fast rotating components
BA
M5
00
• Sensitivity 500 mV/g
• Output IEPE- compatible
• Measuring range 0.2 Hz – 14 kHz
• recommended for slow rotating components
µ
-brid
ge
• Sensitivity 0.7 V/N
• Output IEPE-compatible
• Measuring range 0.05 Hz – 1 kHz
• recommended for very slow rotating components
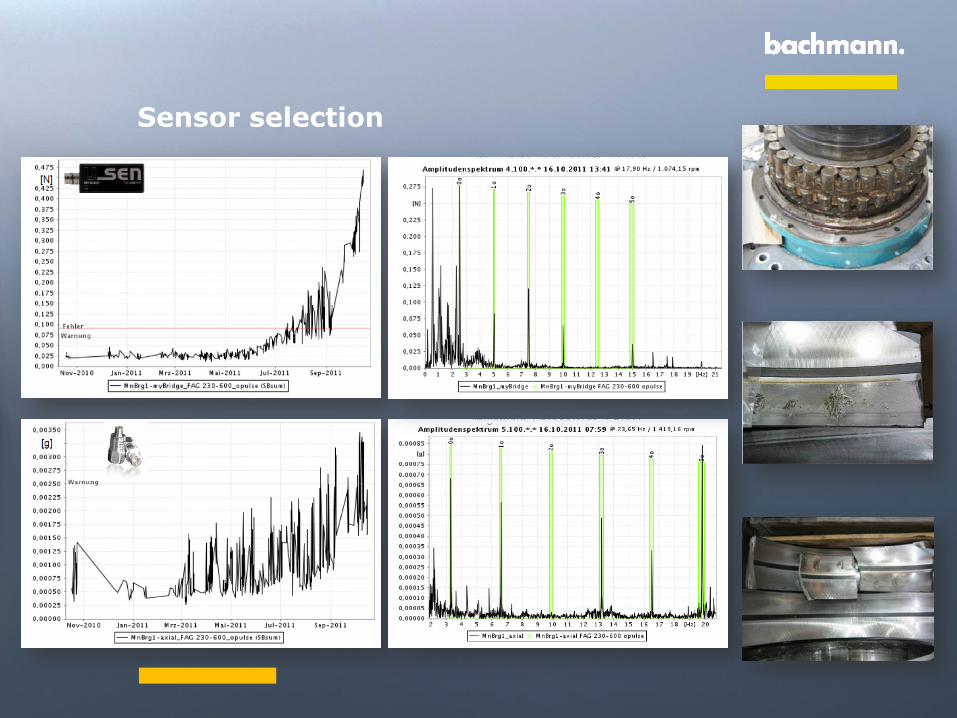
Sensor selection

Why Bachman CMS?

Over 15 years of experience in wind branch
Installed in over 4500 WTGs globally
Leading independent CMS supplier Worldwide
Covers
250kW – 5 MW
(including Offshore)
Monitor WTGs from
22 OEM customers
54 WTG types
(1.5MW, 2 MW,…) 80 Gear Box types
10 Drive train
structures
85 wind farms
(small and large
sized)
Bachmann Remote Monitoring – World Leading Experience

Certification compliant with worldwide standards

Comprehensive CMS Solutions - A Complete Package
Hardware Software
Remote monitoring
worldwide
