condensed interim financial statements/media/files/b/brookfield... · 2,000,000 cia de eletricidade...
TRANSCRIPT

2014Condensed Interim Financial Statements
For the period from January 1, 2014 to June 30, 2014
New Hor izons Master Fund
Brookfield Investment Management

New Horizons Master Fund
2014 Condensed Interim Financial Statements | 1
Notice to Reader
These condensed interim financial statements and related notes of New Horizons Master Fund (the“Fund”) for the six months ended June 30, 2014 have been prepared by management of the Fund. Theexternal auditors of the Fund have not audited or reviewed these condensed interim financialstatements.
CONTENTS
Condensed Interim Financial Statements 2Notes to the Condensed Interim Financial Statements 9Fund Information 23
New Horizons Master Fund
2014 Condensed Interim Financial Statements | 2
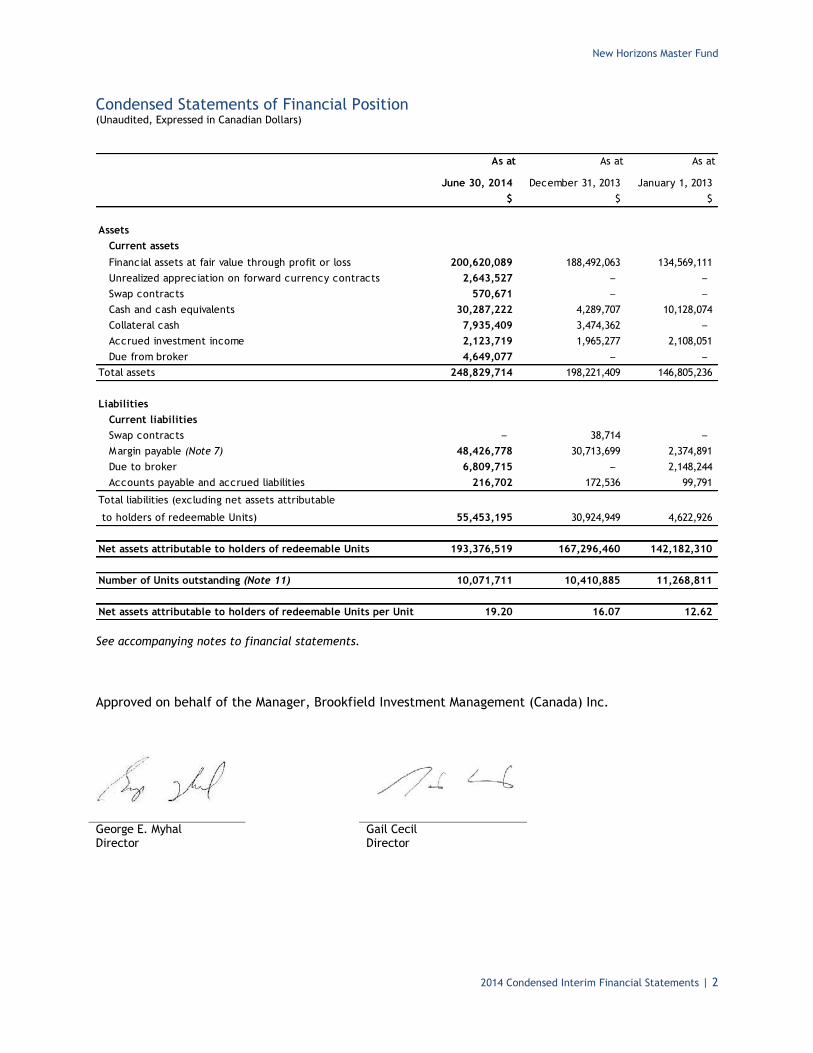
Condensed Statements of Financial Position(Unaudited, Expressed in Canadian Dollars)
As at As at As at
June 30, 2014 December 31, 2013 January 1, 2013$ $ $
AssetsCurrent assets
Financial assets at fair value through profit or loss 200,620,089 188,492,063 134,569,111Unrealized appreciation on forward currency contracts 2,643,527 − −Swap contracts 570,671 − −Cash and cash equivalents 30,287,222 4,289,707 10,128,074Collateral cash 7,935,409 3,474,362 −Accrued investment income 2,123,719 1,965,277 2,108,051Due from broker 4,649,077 − −
Total assets 248,829,714 198,221,409 146,805,236
LiabilitiesCurrent liabilitiesSwap contracts − 38,714 −Margin payable (Note 7) 48,426,778 30,713,699 2,374,891Due to broker 6,809,715 − 2,148,244Accounts payable and accrued liabilities 216,702 172,536 99,791
Total liabilities (excluding net assets attributable
to holders of redeemable Units) 55,453,195 30,924,949 4,622,926
Net assets attributable to holders of redeemable Units 193,376,519 167,296,460 142,182,310
Number of Units outstanding (Note 11) 10,071,711 10,410,885 11,268,811
Net assets attributable to holders of redeemable Units per Unit 19.20 16.07 12.62
See accompanying notes to financial statements.
Approved on behalf of the Manager, Brookfield Investment Management (Canada) Inc.
George E. MyhalDirector
Gail CecilDirector

New Horizons Master Fund
2014 Condensed Interim Financial Statements | 3
Condensed Statements of Comprehensive IncomeFor the six months ended June 30,(Unaudited, Expressed in Canadian Dollars)
2014 2013
$ $Income
Interest income for distribution purposes 5,635,398 5,965,487Dividend Income 1,887,753 657,907
Net realized foreign exchange (loss) gain (945,954) 475,386
Other changes in fair value on financial assets and liabilities
at fair value through profit and loss Net realized gain on sale of investments 13,965,609 3,549,828 Net realized gain on swap contracts 2,505,180 − Change in unrealized depreciation on foreign exchange (318,551) (111,015) Change in unrealized appreciation (depreciation) on forward contracts 2,643,527 (251,084) Change in unrealized appreciation on swap contracts 609,385 − Change in unrealized appreciation on investments 6,664,468 9,613,987
Total income 32,646,815 19,900,496
Expenses (Note 9)Management fees 302,682 249,560Interest expense 188,047 34,761Brokerage commissions and other charges 98,529 34,491Audit fees 13,195 15,073 1
Legal fees 4,225 8,313 1
Operating expenses 44,915 36,030Total expenses 651,593 378,228
Operating profit 31,995,222 19,522,268
Withholding taxes (85,163) (1,011)
Increase in net assets attributable to holders of redeemable Units 31,910,059 19,521,257
Increase in net assets attributable to holders of redeemable Units per Unit 3.14 1.79
1 Audit fees and Legal fees have been broken out from Operating expenses for comparative purposes for the six monthsended June 30, 2013.
See accompanying notes to financial statements.

New Horizons Master Fund
2014 Condensed Interim Financial Statements | 4
Condensed Statements of Changes in Net Assets Attributable to Holders ofRedeemable UnitsFor the six months ended June 30(Unaudited, Expressed in Canadian Dollars)
2014 2013
$ $
Net assets attributable to holders of redeemable Units, beginning of period 167,296,460 142,182,310
Increase in net assets attributable to holders of redeemable Units 31,910,059 19,521,257
Redeemable unit transactions
Proceeds from issuance of Units − −
Amounts received from reinvestment of distributions of Units − −
Amounts paid for redemption of Units (5,830,000) (6,160,000)
Net decrease from redeemable Unit transactions (5,830,000) (6,160,000)
Distributions to holders of redeemable Units
From net investment income − −
Total distributions to holders of redeemable Units − −
Net increase in net assets attributable to holders of redeemable Units 26,080,059 13,361,257
Net assets attributable to holders of redeemable Units, end of period 193,376,519 155,543,567
See accompanying notes to financial statements.

New Horizons Master Fund
2014 Condensed Interim Financial Statements | 5
Condensed Statements of Cash FlowsFor the six months ended June 30,(Unaudited, Expressed in Canadian Dollars)
2014 2013
$ $
Cash flows provided by (used for):
Cash flows from operating activities
Increase in net assets attributable to holders of redeemable units 31,910,059$ 19,521,256$
Adjsutments for:
Net realized foreign exchange loss (gain) 945,954 (475,386)
Net realized gain on sale of investments (13,965,609) (3,549,828)
Change in unrealized appreciation on investments (6,664,468) (9,613,987)
Change in unrealized (appreciation) depreciation on forward currency contracts (2,643,527) 251,084
Change in unrealized appreciation on swap contracts (609,385) −
Increase in collateral cash (4,461,047) −
(Increase) decrease in accrued investment income (158,442) (300,966)
Increase (decrease) in accounts payable and accrued liabilities 44,166 158,524
Proceeds from sale of investments 89,730,435 36,488,515
Amounts paid for purchase of investments (79,067,746) (64,892,611)
Net cash from operating activities 15,060,390 (22,413,399)
Cash flows from financing activities
Margin payable, net (repayments)
borrowings and foreign exchange17,713,079 22,114,932
Amounts paid for redemption of Units (5,830,000) (6,160,000)
Net cash from financing activities 11,883,079 15,954,932
Net increase (decrease) in cash and cash equivalents 26,943,469 (6,458,467)
Net realized foreign exchange (loss) gain (945,954) 475,386
Cash and cash equivalents, beginning of period 4,289,707 10,128,074
Cash and cash equivalents, end of period 30,287,222$ 4,144,993$
Supplemental Information:
Dividend received, net of withholding taxes 1,661,106 656,896
Interest Received 5,618,441 5,665,521
See accompanying notes to financial statements.

New Horizons Master Fund
2014 Condensed Interim Financial Statements | 6
Schedule of InvestmentsAs at June 30, 2014(Unaudited, Expressed in Canadian Dollars)
Average Cost Fair Value % of Net
Quantity Security $ $ Assets
Bonds
United States Dollar Denominated
6,780,000 Arch Coal Inc. 7.250% 10/01/2020 5,401,008 5,434,370 2.81
5,000,000 Banco Do Brasil S.A. 9.000% 12/31/2049 5,349,138 5,260,803 2.72
10,000,000 BlackBerry Ltd. 6.000% 11/30/2020 10,408,535 13,848,088 7.16
4,400,000 Empresas ICA SAB de CV 8.875% 05/29/2024 4,851,285 4,830,268 2.50
1,225,000 First Data Corp. 11.250% 01/15/2021 1,451,607 1,526,634 0.79
8,780,000 First Data Corp. 11.750% 08/15/2021 10,712,259 11,093,888 5.74
7,400,000 Forbes Energy Services Ltd. 9.000% 06/15/2019 7,251,723 8,177,732 4.23
582,474 GP Investments Ltd. 10.000% 1/29/2049 594,453 631,283 0.33
7,400,000 Hexion US Finance Corp. 9.000% 11/15/2020 7,748,329 8,039,794 4.16
2,200,000 Just Energy Group Inc. 6.500% 7/29/2019 2,181,399 2,226,175 1.15
9,000,000 Lightstream Resources Ltd. 8.625% 02/01/2020 8,866,811 10,065,720 5.21
5,500,000 MBIA Inc. 7.000% 12/15/2025 4,717,943 6,385,608 3.30
450,000 New Albertson's Inc. 8.000% 05/01/2031 472,552 469,734 0.24
987,000 New Albertson's Inc. 8.700% 05/01/2030 1,062,905 1,056,565 0.55
840,000 New Albertson's Inc. 7.450% 08/01/2029 858,145 852,231 0.44
1,518,000 New Albertson's Inc. 7.750% 06/15/2026 1,614,184 1,592,653 0.82
9,434,000 Niska Gas Storage Canada ULC 6.500% 04/01/2019 10,044,755 9,646,731 4.99
5,000,000 Texas Competitive Electric
Holdings Co LLC 11.500% 10/1/2020
4,615,470 4,726,628 2.44
5,200,000 Walter Energy Inc. 9.500% 10/15/2019 5,668,856 5,621,891 2.91
93,871,357 101,486,796 52.49
Canadian Dollar Denominated
89,000 Just Energy Group Inc. 5.750% 9/30/2018 70,866 76,540 0.04
5,098,000 Just Energy Group Inc. 6.000% 6/30/2017 4,304,644 4,611,141 2.38
4,375,510 4,687,681 2.42
Brazilian Real Denominated
2,000,000 Cia de Eletricidade do Estado da Bahia
11.750% 4/27/2016
1,330,146 932,692 0.48
1,330,146 932,692 0.48

New Horizons Master Fund
2014 Condensed Interim Financial Statements | 7
Equities
United States Dollar Denominated
78,843 BP PLC, ADR 3,363,368 4,429,948 2.29
106,250 China Mobile LTD., ADR 5,702,433 5,501,329 2.84
98,300 General Motors Co. 3,774,268 3,800,783 1.97
40,600 HSBC Holdings PLC, ADR 2,213,251 2,196,861 1.14
53,700 J.P. Morgan Chase & Co. 3,258,372 3,295,797 1.70
32,700 Royal Dutch Shell PLC 2,245,062 3,031,496 1.57
20,556,754 22,256,214 11.51
Canadian Dollar Denominated
723,135 AGF Management Ltd. Class B 7,730,758 9,024,725 4.67
310,000 Canadian Oil Sands Ltd. 5,990,751 7,495,800 3.88
831,600 Lightstream Resources Ltd. 5,841,107 6,785,856 3.51
191,100 Sun Life Financial Inc. 4,329,743 7,494,942 3.88
23,892,359 30,801,323 15.94
British Pound Denominated
545,300 Aberdeen Asset Management PLC 4,508,500 4,507,835 2.33
106,000 British American Tobacco PLC 5,631,474 6,714,408 3.47
5,660,645 Man Group PLC 7,837,344 10,845,609 5.61
130,000 Unilever PLC 5,152,787 6,276,613 3.25
23,130,105 28,344,465 14.66
Hong Kong Dollar Denominated
1,765,300 COSCO Pacific Ltd. 2,611,494 2,605,641 1.34
2,611,494 2,605,641 1.34
Term Loans
United States Dollar Denominated
10,630,797 SuperMedia Inc. 11.600% 12/31/2016 7,679,209 9,505,277 4.92
7,679,209 9,505,277 4.92
Transaction costs (183,946)
Total investments 177,262,988 200,620,089 103.76
Accrued investment income 2,123,719 1.10Cash and cash equivalents1 30,287,222 15.66Collateral cash 7,935,409 4.10Derivative instruments (see schedule of derivative instruments) 3,214,198 1.66Liabilities, net of other assets (50,804,118) (26.27)Total net assets 193,376,519 100.01
1 Cash and cash equivalents was impacted by pending trade settlements and margin loan repayments.As at June 30, 2014, the Fund had employed leverage of 17.98% of net assets.
See accompanying notes to financial statements.

New Horizons Master Fund
2014 Condensed Interim Financial Statements | 8
Schedule of Derivative InstrumentsAs at June 30, 2014(Unaudited, Expressed in Canadian Dollars)
Swap Contracts
Underlying Asset Counterparty
Number of
Shares
Settlement
Date
Notional
Value
Unrealized
Gains / (Losses)
$
Banco do Brasil S.A. J.P. Morgan 385,000 26-Jun-15 4,694,747 (39,999)
CCR S.A. J.P. Morgan 160,000 18-Feb-15 1,413,348 (27,414)
EV Energy Partners LP J.P. Morgan 186,500 30-Oct-14 7,558,651 311,093
Mark West Energy Partners LP J.P. Morgan 85,800 6-Apr-15 6,215,425 325,614
Niska Gas Storage Partners LLC J.P. Morgan 154,000 29-May-15 2,522,829 1,377
Total swap contracts 570,671
Unrealized
Maturity Gains /(Losses)
Forward Currency Contracts Date $
Buy CAD 43,394,000, Sell USD 40,000,000 9-Jul-14 777,134
Buy CAD 44,547,000, Sell USD 40,000,000 9-Jul-14 1,929,679
Buy CAD 11,279,693, Sell GBP 6,200,000 5-Jan-15 (63,286)
2,643,527Total forward currency contracts
See accompanying notes to financial statements.

New Horizons Master Fund
2014 Condensed Interim Financial Statements | 9
Notes to the Condensed Interim Financial Statements
1. THE FUND
New Horizons Master Fund (the “Fund”) is an investment fund established under the laws of theProvince of Ontario pursuant to a Declaration of Trust dated March 1, 2011. The Fund began operationson April 1, 2011 when it issued 12,910,000 units (the “Units”) at $10.00 for gross proceeds of$129,100,000.
The investment objective of the Fund is to provide holders of the Units (“Unitholders”) with theopportunity to preserve the net asset value of the Fund by investing in a portfolio (the “Portfolio”)which focuses on, but is not limited to, investments in high yield corporate debt, and publicly-listedsecurities in infrastructure and real estate companies, across a global universe.
Brookfield Investment Management (Canada) Inc. (“BIM Canada”) is the manager (the “Manager”) andinvestment manager (the “Investment Manager”) of the Fund. The Investment Manager makes all of theinvestment and trading decisions on behalf of the Fund. Pursuant to the terms of the declaration oftrust, BIM Canada replaced Caledon Trust Company as trustee of the Fund effective June 1, 2013. BIMCanada does not receive any fees for providing this service. The Fund’s registered office is BrookfieldPlace, 181 Bay Street, Suite 300 Toronto, Ontario Canada M5J2T3. These financial statements wereauthorized for issue by the Manager on August 29, 2014.
2. BASIS OF PRESENTATION AND ADOPTION OF IFRS
These financial statements have been prepared in compliance with International Financial ReportingStandards ("IFRS") as issued by the International Accounting Standards Board (“IASB”). The Fundadopted this basis of accounting in 2014 as required by Canadian securities legislation and the CanadianAccounting Standards Board. Previously, the Fund prepared its financial statements in accordance withCanadian generally accepted accounting principles as defined in Part V of the Chartered ProfessionalAccountants of Canada (“CPA”) Handbook ("Canadian GAAP"). The Fund has consistently applied theaccounting policies used in the preparation of its opening IFRS statement of financial position atJanuary 1, 2013 and throughout all periods presented, as if these policies had always been in effect.
The financial statements have been prepared on the historical cost basis, except for the revaluation ofcertain financial instruments. Historical cost is generally based on the fair value of the considerationgiven in exchange for assets. Note 14 discloses the impact of the transition to IFRS on the Fund'sreported financial position, financial performance and cash flows, including the nature and effect ofsignificant changes in accounting policies from those used in the Fund's financial statements for theyear ended December 31, 2013 which were prepared under Canadian GAAP.
In applying IFRS, management makes estimates and assumptions that may affect the amounts of assets,liabilities, income and expenses reported in these financial statements. The most significant estimatesrelate to the valuation of investments. Actual results may differ from the estimates.
3. SIGNIFICANT ACCOUNTING POLICIES
Financial InstrumentsThe Fund’s investments in equity and fixed income securities are designated at fair value throughprofit or loss (“FVTPL”) at inception. The Fund’s derivatives are categorized as held for trading. As aresult of such designation and categorization, the Fund’s investments and derivatives are measured atFVTPL. The Fund’s accounting policies for measuring the fair value of its investments and derivativesare identical to those used in measuring its published Net Asset Value (NAV).

New Horizons Master Fund
2014 Condensed Interim Financial Statements | 10
OffsettingFinancial assets and liabilities are offset and the net amount presented in the statement of net assetsonly when the Fund has a legal right to offset the amounts and intends either to settle on a net basis orto realize the asset and settle the liability simultaneously. In the normal course of business, the Fundenters into various master netting agreements or similar agreements that do not meet the criteria foroffsetting in the Statements of Financial Position but still allow for the related amounts to be offset incertain circumstances, such as bankruptcy or termination of contracts.
Fair Value MeasurementFair value is the price that would be received to sell an asset or paid to transfer a liability in an orderlytransaction between market participants at the measurement date. The fair value of financial assetsand liabilities traded in active markets (such as publicly traded marketable securities) are based onquoted market prices at the close of trading on the reporting date. The Fund uses the last tradedmarket price for both financial assets and financial liabilities where the last traded price falls withinthat day’s bid-ask spread. In circumstances where the last traded price is not within the bid-askspread, the Manager determines the point within the bid-ask spread that is most representative of fairvalue based on the specific facts and circumstances. The Fund’s policy is to recognize transfers intoand out of the fair value hierarchy levels as of the date of the event or change in circumstances givenrise to the transfer.
The fair value of financial assets and liabilities that are not traded in an active market including over-the-counter derivatives, is determined using established valuation procedures. The Fund uses a varietyof methods and makes assumptions that are based on market conditions existing at each measurementdate. Valuation techniques include the use of comparable recent arm’s length transactions, referenceto other instruments that are substantially the same and others commonly used by market participantsand which make the maximum use of observable inputs. Refer to Note 6 for further information aboutthe Fund’s fair value measurements.
All investment transactions are accounted for on the trade date. Realized gains and losses frominvestment transactions and unrealized appreciation or depreciation in the value of investments arecalculated on an average cost basis, excluding transaction costs and the effect of foreign exchangefluctuations, which are disclosed separately.
Other assets and liabilitiesFor the purpose of categorization, accrued investment income is recorded at cost or amortized cost.Similarly, margin payable, payables for securities purchased, distributions payable and accountspayable and accrued liabilities are deemed to be other financial liabilities and reported at amortizedcost. All other financial assets and liabilities are measured for at amortized cost. Under this method,financial assets and liabilities reflect the amounts required to be received or paid, discounted whenappropriate, at the financial instrument’s effective interest rate. The fair values of the Fund’sfinancial assets and liabilities that are not carried at FVTPL approximate their carrying amounts due totheir short-term nature.
Revenue recognitionDividend income is recognized on the ex-dividend date and the interest for distribution purposes shownon the Statements of Comprehensive Income represents the coupon interest received by the Fundaccounted for on an accrual basis. The Fund does not amortize premiums paid or discounts received onthe purchase of fixed income securities except for zero coupon bonds which are amortized on a straightline basis.
Transaction costsTransaction costs, such as brokerage commissions incurred in the purchase and sale of securities by theFund, are expensed and are included in operating expenses in the Statements of ComprehensiveIncome. Transaction costs are incremental costs that are directly attributable to the acquisition, issue

New Horizons Master Fund
2014 Condensed Interim Financial Statements | 11
or disposal of an investment, which include fees and commissions paid to agents, advisors, brokers anddealers, levies by regulatory agencies and securities exchanges, and transfer taxes and duties.
Foreign currencya) Functional and presentation currencyThe performance of the Fund is measured and reported to investors in Canadian dollars. The Managerconsiders the Canadian dollar as the currency that most faithfully represents the economic effects ofthe underlying transactions, event and conditions. These financial statements are presented inCanadian dollars, which is the Fund’s functional currency.
b) Foreign currency translationInvestments and other assets denominated in foreign currencies are translated into Canadian dollarsusing the rate of exchange prevailing on the trade date. Investment transactions and income andexpenses are translated at the rate of exchange on the date of such transactions. The fair values ofinvestments and other assets and liabilities in foreign currencies are translated at the period-endexchange rates.
Forward currency contractsForward currency contracts, if applicable, are valued at current market value on each valuation date.The value is determined as the gain or loss that would be realized, if on the valuation date, theposition of the forward currency contracts were closed out.
Redeemable UnitsThe Fund’s redeemable Units are classified as financial liabilities. Distributions to holders ofredeemable Units are recognized in Statement of Changes in Net Assets Attributable to Holders ofRedeemable Units when they are authorized.
New standards and interpretations not yet adopted:The final version of IFRS 9, Financial Instruments, was issued by the IASB in July 2014 and will replaceIAS 39 Financial Instruments: Recognition and Measurement. IFRS 9 introduces a model for classificationand measurement, a single, forward-looking ‘expected loss’ impairment model and a substantiallyreformed approach to hedge accounting. The new single, principle based approach for determining theclassification of financial assets is driven by cash flow characteristics and the business model in whichan asset is held. The new model also results in a single impairment model being applied to all financialinstruments, which will require more timely recognition of expected credit losses. It also includeschanges in respect of own credit risk in measuring liabilities elected to be measured at fair value, sothat gains caused by the deterioration of an entity’s own credit risk on such liabilities are no longerrecognized in profit or loss. IFRS 9 is effective for annual periods beginning on or after January 1,2018, however is available for early adoption. In addition, the own credit changes can be early appliedin isolation without otherwise changing the accounting for financial instruments. The Fund is in theprocess of assessing the impact of IFRS 9 and has not yet determined when it will adopt the newstandard.
4. CRITICAL ACCOUNTING ESTIMATES AND JUDGEMENTS
The preparation of financial statements in conformity with IFRS requires the Manager to makejudgments, estimates and assumptions that affect the application of accounting policies and thereported amounts of assets, liabilities, income and expenses. Actual results may differ from theseestimates.
Estimates and underlying assumptions are reviewed on an ongoing basis. Revisions to estimates arerecognized in the period in which the estimates are revised and in any future period affected.

New Horizons Master Fund
2014 Condensed Interim Financial Statements | 12
Fair Value Measurement of Derivatives and Securities Not Quoted in an Active MarketThe Fund may hold financial instruments that are not quoted in active markets. Fair values of suchinstruments are determined using valuation techniques and may be determined using reputable pricingsources (such as pricing agencies) or indicative prices from market markers. Broker quotes as obtainedfrom the pricing sources may be indicative and not executable or binding.
5. MANAGEMENT OF FINANCIAL RISKS
The Fund is exposed to various financial risks, including market risk (consisting of currency risk,interest rate risk, and other price risk), credit risk and liquidity risk. The Fund’s overall riskmanagement programme seeks to minimize potentially adverse effects of those risks on the Fund’sfinancial performance by employing experienced portfolio managers and by continuous monitoring ofthe Fund’s securities positions and markets. The Manager maintains a corporate governance structurethat oversees the Fund’s investment activities. The Fund may use derivative financial instruments tomitigate certain risk exposures.
Currency riskCurrency risk is the risk that the value of an investment will change due to fluctuations in foreignexchange rates.
The Fund’s net assets attributable to holders of redeemable units are measured in Canadian dollars andpayments to Unitholders are made in Canadian dollars. The Fund is exposed to currency risks as it mayhold assets or have liabilities denominated in currencies other than in Canadian dollars. As at June 30,2014, December 31, 2013 and January 1, 2013, the Fund was exposed to currency risk as the value ofany assets or liabilities denominated in currencies other than the Canadian dollar will vary due tochanges in foreign exchange rates. Currency risks of the Fund can be mitigated with the use of forwardcurrency contracts. The following tables summarize the Fund’s exposure to currency risks, as at June30, 2014, December 31, 2013 and January 1, 2013:
June 30, 2014 Investments Cash
Other Net Assets/
(Liabilities)*
Derivative
Instruments Total** Net Asset
$ $ $ $ $ %
U.S. Dollar 133,248,287 29,286,788 (21,853,985) (62,168,916) 78,512,174 40.60
British Pound 28,344,465 12,798 (19,499,134) (11,292,060) (2,433,931) (1.26)
Hong Kong Dollar 2,605,641 504 − − 2,606,145 1.35
Brazilian Real 932,692 − 19,874 (67,413) 885,153 0.46
Total 165,131,085 29,300,090 (41,333,245) (73,528,389) 79,569,541 41.15
*Other Net Assets includes borrowings of $48,426,778.
**Includes notional exposure from derivative positions.
December 31, 2013 Investments Cash
Other Net Assets/
(Liabilities)*
Derivative
Instruments Total** Net Asset
$ $ $ $ $ %
U.S. Dollar 142,580,303 4,030,566 (12,128,832) (44,822) 134,437,215 80.36
British Pound 14,145,195 52,180 (13,261,303) − 936,072 0.56
Brazilian Real 864,678 − 18,521 2,963,084 3,846,283 2.30
Total 157,590,176 4,082,746 (25,371,614) 2,918,262 139,219,570 83.22

New Horizons Master Fund
2014 Condensed Interim Financial Statements | 13
*Other Net Assets includes borrowings of $27,239,337.
**Includes notional exposure from derivative positions.
January 1, 2013 Investments Cash
Other Net Assets/
(Liabilities)*
Derivative
Instruments Total Net Asset
$ $ $ $ $ %
U.S. Dollar 109,510,422 9,943,781 (299,943) − 119,154,260 83.80
British Pound 2,911,445 780 (2,384,943) − 527,282 0.37
Brazilian Real 1,031,489 − 20,208 − 1,051,697 0.74
Total 113,453,356 9,944,561 (2,664,678) − 120,733,239 84.91
*Other Net Assets includes borrowings of $2,374,891.
As at June 30, 2014, had the Canadian dollar strengthened or weakened by 1% against each of the othercurrencies with all other variables remaining constant, net assets of the Fund would have decreased orincreased by $795,695 (December 31, 2013 - $1,392,196; January 1, 2013 - $1,207,332).
As at June 30, 2014, the Fund had entered into forward currency contracts with an unrealized gain of$2,643,527 to deliver currencies at specified future dates. For further information regarding forwardcurrency contracts, see the Schedule of Derivative Instruments. There were no such contractsoutstanding as at December 31, 2013 and January 1, 2013.
Interest rate riskInterest rate risk arises from the possibility that changes in interest rates will affect future cash flowsor fair values of financial instruments.
The Fund is exposed to interest rate risk from its holdings of fixed-rate debt instruments, the values ofwhich fluctuate due to changes in prevailing levels of market interest rates. As at June 30, 2014, theFund’s debt instruments’ remaining terms to maturity were as follows:
Debt Instruments $ % of Net Assets
Less than 1 year − −
1 to 3 years 15,049,110 7.78
3 to 5 years 17,901,002 9.26
Greater than 5 years 83,662,334 43.26
Total 116,612,446 60.30
As at December 31, 2013, the Fund’s debt instruments’ remaining terms to maturity were as follows:
Debt Instruments $ % of Net Assets
Less than 1 year − −
1 to 3 years 9,734,104 5.82
3 to 5 years 14,774,518 8.83
Greater than 5 years 119,341,652 71.34
Total 143,850,274 85.99

New Horizons Master Fund
2014 Condensed Interim Financial Statements | 14
As at January 1, 2013, the Fund’s debt instruments’ remaining terms to maturity were as follows:
Debt Instruments $ % of Net Assets
Less than 1 year − −
1 to 3 years 4,489,978 3.16
3 to 5 years 19,836,495 13.95
Greater than 5 years 96,011,187 67.54
Total 120,337,660 84.65
Interest rate risk of the Fund is currently mitigated by the relatively short duration and high creditspread of the high yield bonds and loans in the Portfolio. These characteristics make the Portfolio’ssensitivity to interest rate risk relatively less than what would be experienced by a portfolio withlonger duration investments that trade at tighter spreads to government-backed fixed incomesecurities. It would also be possible to hedge interest rate risk by shorting government-backed fixedincome securities or engaging in various interest rate derivatives. As at June 30, 2014, December 31,2013 and January 1, 2013, the Fund had no such hedges in place.
At June 30, 2014, if the prevailing interest rates had risen or declined by 0.25%, assuming a parallelshift in the yield curve, with all other variables held constant, the Fund’s net assets attributable toholders of redeemable units would have decreased or increased, respectively, by approximately$629,707 (December 31, 2013 - $1,254,772; January 1, 2013 – $1,297,319). The Fund’s sensitivity tointerest rate changes was estimated using the weighted average duration of the bonds. In practice, theactual results may differ from this sensitivity analysis and the differences could be material.
Other price riskOther price risk is the risk that the value of financial instruments will fluctuate as a result of changes inmarket prices (other than those arising from interest rate risk or currency risk). Such changes may bethe result of factors affecting multiple instruments traded in a market, market segment or asset class.
The Fund is exposed to other price risk in the Portfolio. The Fund may take outright long or shortpositions in any of its investments, which may include derivative instruments for purposes consistentwith its investment objectives and investment strategy and subject to its investment restrictions.
As at June 30, 2014 and December 31, 2013, the Fund had direct exposure to derivatives through itsholdings in equity total return swaps and as at June 30, 2014, through forward currency contracts. Asat January 1, 2013 the fund had no direct exposure to derivatives. Please refer to Schedule ofDerivative Investments which shows the underlying notional equity exposure.
All investments present a risk of loss of capital. The Manager mitigates this risk through carefulselection of securities and other financial instruments. As at June 30, 2014, December 31, 2013 andJanuary 1, 2013, the Fund had no securities sold short.
Credit riskCredit risk is the risk of non-payment of scheduled interest and/or principal payments.
The Fund is exposed to several types of credit risks including the risk that one or more investments inthe Portfolio will decline in price, or fail to pay interest or principal when due, because the issuer ofthe security experiences a decline in its financial status. As at June 30, 2014, the maximum exposureto any one debt issuer in the Portfolio was $13,848,088 (December 31, 2013 - $13,457,840; January 1,2013 - $10,893,158) representing 7.16% (December 31, 2013 – 8.04%; January 1, 2013 – 7.66%) of netassets attributable to holders of redeemable units.

New Horizons Master Fund
2014 Condensed Interim Financial Statements | 15
The performance of the Fund is also subject to general economic and specific industry conditions thatcould impact the fair value of one or more debt securities in the Portfolio. Securities with lower ratingstend to be more sensitive to these kinds of risks.
As at June 30, 2014, December 31, 2013 and January 1, 2013, the Fund was invested in debt securitieswith the following credit ratings. The following chart was consolidated for comparative purposes:
Debt Instruments by S&P Rating*
% of Net
Assets Total $
% of Net
Assets Total $
% of Net
Assets Total $
A 3.30 6,385,608 − − − −
BBB 0.48 932,692 14.84 24,821,307 8.00 11,370,842
BB 3.05 5,892,085 6.51 10,883,386 − −
B 19.83 38,342,341 26.19 43,820,547 54.04 76,810,485
CCC 20.46 39,571,149 26.08 43,636,952 19.12 27,188,554
Not rated** 13.18 25,488,571 12.37 20,688,082 3.49 4,967,779
Total 60.30 116,612,446 85.99 143,850,274 84.65 120,337,660
June 30, 2014 December 31, 2013 January 1, 2013
* Or, if not rated by S&P, the most closely comparable rating from Moody’s Investors Service** Not rated by Standard & Poor’s or Moody’s Investors Service
The Manager seeks to mitigate the above credit risk through the careful selection of investments,through the employment of experienced portfolio managers and through continuous monitoring of theFund’s investments.
Another type of credit risk is exposure to the creditworthiness of the Fund’s trading counterparties. Allsecurities transactions executed by the Fund are settled upon delivery using approved brokers. The riskof payment default on securities is considered negligible, as delivery of securities sold is only madeonce the broker has received payment on behalf of the Fund. Payment is not made on a purchase untilthe securities have been received by the broker on behalf of the Fund. The trade will fail if eitherparty fails to meet its obligation.
The Fund may enter into derivative contracts for a variety of purposes, including but not limited to (i)for the purposes of hedging as defined in NI-81-102 and (ii) as a substitute for purchasing or sellingsecurities. Derivative contracts involve risks arising from the possible inability of counterparties tomeet the terms of their contracts due to movement in currency, security values and interest rates.The Fund seeks to mitigate this risk through the careful selection of its derivative counterparties.
Liquidity riskLiquidity risk is the risk that the Fund may not be able to settle or meet its obligation on time or at areasonable price.
The Fund has current financial liabilities outstanding, including but not limited to, margin loans andinterest payable on its margin loans, accounts payable and accrued liabilities. The Manager seeks tomitigate this liquidity risk by ensuring that a reasonable portion of the Fund’s investments trade inactive markets and can be sold readily. There can be no assurance that an adequate market for theinvestments will exist at all times, or that the prices at which the investments trade, accurately reflecttheir fair value. Low trading volumes of the investments could also make it difficult to liquidateholdings quickly.

New Horizons Master Fund
2014 Condensed Interim Financial Statements | 16
6. FAIR VALUE OF FINANCIAL INSTRUMENTS
The Fund uses a three-tier hierarchy as a framework for disclosing fair value which reflects thesignificance of the inputs used in making the measurements. The hierarchy has the following levels:quoted prices in an active market (Level 1—unadjusted inputs); inputs other than quoted prices (Level2—directly or indirectly derived from observational market data); and inputs not based on observablemarket data (Level 3—unobservable inputs). In addition to the above disclosure requirements, Section3862 requires disclosure of significant transfers between Levels 1 and 2 since the prior reportingperiod, as well as reconciliation of Level 3 assets, disclosing separately changes during the reportingperiod attributable to (i) total gains or losses recognized in net income, and a description of wherethey are presented in the income statement, (ii) purchases, sales, issues and settlements, and (iii)transfers into or out of Level 3 and the reasons for those transfers. Any significant transfers betweenLevel 1 and Level 2 are disclosed. Further, for fair value measurements in Level 3, if changing one ormore type of the inputs to reasonably possible alternative assumptions would change fair valuesignificantly, the entity shall state this fact and disclose both the effect of those changes and how theeffect was calculated.
The following tables provide a summary of the inputs used as at June 30, 2014, December 31, 2013 andJanuary 1, 2013 in valuing the Fund’s investments carried at fair value:
Level 1 Level 2 Level 3 Total
As at June 30, 2014 $ $ $ $
Investments, at fair value:
Equities 84,007,643 − − 84,007,643
Fixed income
Corporate bonds − 107,107,169 − 107,107,169
Term loans − 9,505,277 − 9,505,277
Total Investments, at fair value 84,007,643 116,612,446 − 200,620,089
Derivative assets − 3,344,897 − 3,344,897
Derivative liabilities − (130,699) − (130,699)
Total 84,007,643 119,826,644 − 203,834,287
Level 1 Level 2 Level 3 Total
As at December 31, 2013 $ $ $ $
Investments, at fair value:
Equities 44,641,789 − − 44,641,789
Fixed income
Corporate bonds − 134,980,848 − 134,980,848
Term loans − 8,869,426 − 8,869,426
Total Investments, at fair value 44,641,789 143,850,274 − 188,492,063
Derivative assets − 6,108 − 6,108
Derivative liabilities − (44,822) − (44,822)
Total 44,641,789 143,811,560 − 188,453,349

New Horizons Master Fund
2014 Condensed Interim Financial Statements | 17
Level 1 Level 2 Level 3 Total
As at January 1, 2013 $ $ $ $
Investments, at fair value:
Equities 14,231,451 − − 14,231,451
Fixed income
Corporate bonds − 115,369,881 − 115,369,881
Term loans − 4,967,779 − 4,967,779
Total Investments, at fair value 14,231,451 120,337,660 − 134,569,111
All fair value measurements above are recurring. The carrying values of cash, subscriptions receivable,interest receivable, payable for investments purchased, redemptions payable, distributions payable,accrued expenses and the Funds’ obligations for Net Assets attributable to holders of redeemable Unitsapproximates their fair values due to their short-term nature.
The following provides details of the categorization in the fair value hierarchy by asset classes:
a) EquitiesThe Fund’s equity positions are classified as Level 1 when the security is actively traded and a reliableprice is observable.
b) Fixed incomeFixed income includes primarily corporate bonds, and also term loans which are valued at the bid priceprovided by recognized investment dealers. These prices are generally observable and therefore theFunds’ corporate bonds and term loans have been classified as Level 2.
c) Derivative assets and liabilitiesDerivative assets and liabilities consist of forward currency contracts which are valued based primarilyon the contract notional amount, the difference between the contract rate and the forward marketrate for the same currency, interest rates and credit spreads. Contracts for which counterparty creditspreads are observable and reliable, or for which credit-related inputs are determined not to besignificant to fair value are classified as Level 2. During the Period, there were no Level 3 assets heldby the Fund, nor were there significant transfers between levels.
7. BORROWINGS
Leverage is restricted to 25.00% of the total assets of the Fund. Accordingly, at the time of borrowing,the maximum amount of leverage that the Fund could employ is 1.33:1 (total long positions, includingleveraged positions, divided by net assets of the Fund). As at June 30, 2014, the Fund had employedleverage equal to 17.98% of the net assets of the Fund (December 31, 2013 – 18.90%; January 1, 2013 –1.67%) equating to $34,769,785 (December 31, 2013 - $31,615,061; January 1, 2013 - $2,374,891) whichincludes both margin payable and leverage obtained through derivatives. The minimum and maximumamount of borrowings outstanding during the six month period ended June 30, 2014 was $14,320,121and $39,348,069, respectively. The minimum and maximum amount of borrowings outstanding for theyear ended December 31, 2013 was $2,313,820 and $36,449,401, respectively and for the one yearperiod ended January 1, 2013 was $0 and $23,818,610, respectively. At June 30, 2014, the Fund held$7,935,409 of cash (December 31, 2012 - $3,474,362; January 1, 2013 - $0) in collateral with acounterparty in connection with the derivative positions.

New Horizons Master Fund
2014 Condensed Interim Financial Statements | 18
8. INCOME TAXES
The Fund is not subject to tax on that portion of its income, including net realized capital gains for itstaxation year, that is paid or payable to Unitholders. It is the intention of the Fund to pay all nettaxable income and sufficient net taxable gains so that the Fund will not be subject to income taxes.No provision for income taxes has been recorded in the accompanying financial statements as allincome and net realized capital gains are to be distributed to the Unitholders. Capital losses realized inexcess of those utilized to offset realized capital gains in the current taxation year can be carriedforward indefinitely and may be applied against future years’ capital gains. Non-capital losses may becarried forward for a period of 20 years and applied against future years’ taxable income.
Certain dividends received by the Fund are subject to withholding tax imposed in the country of origin.Such income and gains are recorded on a gross basis and the related withholding taxes are shownseparately in the Statements of Comprehensive Income.
9. EXPENSES OF THE FUND
The Manager is entitled to an annual management fee equal to 0.30% per annum based on the net assetvalue of the Fund. The management fee is calculated daily and payable monthly in arrears, plusapplicable taxes and totalled $302,682 and $249,560 for the six months ended June 30, 2014 and 2013,respectively.
The Fund pays for all ordinary expenses incurred in connection with its operation and administration,including, but not limited to, all costs of Portfolio transactions, fees payable to the Manager,administrator and other third party service providers, custodial fees, legal, accounting, audit andvaluation fees, other administrative expenses and any extraordinary expenses that the Fund may incur.
10. RELATED PARTY DISCLOSURE
The Manager is a wholly-owned subsidiary of Brookfield Asset Management Inc. (“Brookfield”) and itmanages the investment and trading activities of the Fund pursuant to a management agreement. Dueto Brookfield’s ability to control the Fund, Brookfield and its affiliates over which it has the ability toexercise control or significant influence, are related parties of the Fund by virtue of common control orcommon significant influence.
Transactions with related parties, including investment transactions, are conducted in the normalcourse of operations and are recorded at exchange amounts, which are equivalent to normal marketterms. Please refer to Note 9, “Expenses of the Fund”, which outlines the fees paid to the Manager bythe Fund.
During the Period, the Fund entered into inter-fund trades with Brookfield Select Opportunities IncomeFund (“BSO”) which is a related party of the Fund due to common control. The Investment Managerdetermined that these inter fund trades complied with the Fund’s and BSO’s investment restrictionsand that owning the securities was consistent with the Fund’s and BSO’s investment objectives. TheManager sought the approval of the Fund’s and BSO’s Independent Review Committee (the “IRC”) ofthe proposed inter-fund trades. The IRC provided its approval on the proposed inter fund trades on theManager’s recommendation.

New Horizons Master Fund
2014 Condensed Interim Financial Statements | 19
11. REDEEMABLE UNITS AND NET ASSETS ATTRIBUTABLE TO HOLDERS OF REDEEMABLE UNITS
The Fund is authorized to issue an unlimited number of redeemable and transferable Units of a singleclass, each of which represents an equal, undivided interest in the net assets of the Fund. Each Unit isentitled to one vote at all meetings of Unitholders and is entitled to participate equally with respect toany and all distributions made by the Fund. On the redemption of Units, however, the Fund may in itssole discretion designate payable to redeeming Unitholders, as part of the redemption price, anycapital gains realized by the Fund in the taxation year in which the redemption occurred. Ontermination or liquidation of the Fund, the holders of outstanding Units of record are entitled toreceive, on a pro rata basis, all of the assets of the Fund remaining after payment of all debts,liabilities and liquidation expenses of the Fund.
The Declaration of Trust provides that the Fund may not issue additional Units except: i) for netproceeds not less than 100% of the net asset value per Unit calculated as of the close of business on thebusiness day immediately prior to the pricing of such offering; or (ii) by way of Unit distributions.Unitholders are entitled to redeem Units outstanding on any business day and will receive a redemptionprice equal to the net asset value per Unit of the Fund.
Changes in the number of issued redeemable Units consisted of the following for the six month periodended June 30, 2014 and the year ended December 31, 2013:
For the period ended For the year ended
June 30, 2014 December 31, 2013
Beginning balance 10,410,885 11,268,811
Redemption of Units (339,174) (857,926)
Number of Units outstanding, end of period 10,071,711 10,410,885
Capital managementUnits issued and outstanding represent the capital for the Fund. The Fund has no restrictions or specificcapital requirements and is authorized to issue an unlimited number of transferable Units. Restrictionsand specific requirements on the redemption of Units are described above. The Statements of Changesin Net Assets Attributable To Holders of Redeemable Units and the above table outline the relevantchanges of the Fund’s Redeemable Units for the period.
The Fund manages its capital in accordance with its investment objectives and strategies and the riskmanagement practices outlined in Note 5 while maintaining sufficient liquidity to meet Unitholderredemptions.
12. DISTRIBUTIONS
Unitholders will be entitled to receive distributions if, as and when declared by the Fund from time totime. All distributions will be paid in Units. Immediately after any distribution in Units, the number ofoutstanding Units will be consolidated such that each Unitholder will hold after the consolidation thesame number of Units as it held before the distribution.

New Horizons Master Fund
2014 Condensed Interim Financial Statements | 20
13. FINANCIAL INSTRUMENTS BY CATEGORY
The following tables present the carrying amounts of the Fund’s financial instruments by category as atJune 30, 2014, December 31, 2013 and January 1, 2013:
At Amortized Cost
Held for
Trading
Designated
at InceptionTotal Total
$ $ $ $
Financial assets at fair value through profit or loss − 200,620,089 200,620,089 −
Unrealized appreciation on forward currency contracts 2,643,527 − 2,643,527 −
Swap contracts 570,671 − 570,671 −
Cash and cash equivalents − − − 30,287,222
Collateral cash − − − 7,935,409
Accrued investment income − − − 2,123,719
Due from broker − − − 4,649,077
Total 3,214,198 200,620,089 203,834,287 44,995,427
Held for
Trading
Designated
at InceptionTotal Total
$ $ $ $
Margin payable − − − 48,426,778
Due to broker − − − 6,809,715
Accounts payable and accrued liabilities − − − 216,702
Total − − − 55,453,195
Financial Liabilities as at June 30, 2014
At FVTPL
Financial Assets as at June 30, 2014
At Amortized Cost
Held for
Trading
Designated
at InceptionTotal Total
$ $ $ $
Financial assets at fair value through profit or loss − 188,492,063 188,492,063 −
Cash and cash equivalents − − − 4,289,707
Collateral cash − − − 3,474,362
Accrued investment income − − − 1,965,277
Total - 188,492,063 188,492,063 9,729,346
Held for
Trading
Designated
at InceptionTotal Total
$ $ $ $
Swap contracts 38,714 − 38,714 −
Margin payable − − − 30,713,699
Accounts payable and accrued liabilities − − − 172,536
Total 38,714 − 38,714 30,886,235
Financial Liabilities as at December 31, 2013
At FVTPL
Financial Assets as at December 31, 2013

New Horizons Master Fund
2014 Condensed Interim Financial Statements | 21
At Amortized Cost
Held for
Trading
Designated
at InceptionTotal Total
$ $ $ $
Financial assets at fair value through profit or loss − 134,569,111 134,569,111 −
Cash and cash equivalents − − − 10,128,074
Accrued investment income − − − 2,108,051
Total − 134,569,111 134,569,111 12,236,125
Held for
Trading
Designated
at InceptionTotal Total
$ $ $ $
Margin payable − − − 2,374,891
Due to broker − − − 2,148,244
Accounts payable and accrued liabilities − − − 99,791
Total − − − 4,622,926
Financial Liabilities as at January 1, 2013
At FVTPL
Financial Assets as at January 1, 2013
The following table presents the net gains (losses) on financial instruments at FVTPL by category forthe periods ended June 30, 2014 and 2013:
Category
2014 2013
$ $
Financial assets and liabilities at FVTPL:
Held for Trading 5,758,092 (251,084)
Designated at inception 20,630,077 13,163,815
Total Financial assets and liabilities at FVTPL 26,388,169 12,912,731
Net gains (losses)
14. TRANSITION TO IFRS
The effects of the Fund’s transition to IFRS are summarized in this note as follows:
Transition electionsThe only voluntary exemption adopted by the Fund upon transition was the ability to designate afinancial asset or financial liability at fair value through profit and loss upon transition to IFRS. Allfinancial assets designated at FVTPL upon transition were previously carried at fair value underCanadian GAAP as required by Accounting Guideline 18, Investment Companies.
Reconciliation of equity and comprehensive income as previously reported under Canadian GAAP toIFRS
Equity December 31, 2013 June 30, 2013 January 1, 2013
Equity as reported under Canadian GAAP 167,256,174 155,539,212 142,163,135
Revaluation of investments at FVTPL 40,286 4,354 19,175
Total equity 167,296,460 155,543,566 142,182,310

New Horizons Master Fund
2014 Condensed Interim Financial Statements | 22
Comprehensive Income
Year ended
December 31, 2013
Six months ended
June 30, 2013
Comprehensive income as reported under Canadian GAAP 36,973,039 19,536,077
Revaluation of investments at FVTPL 21,111 (14,821)
Total comprehensive income 36,994,150 19,521,256
Classification of redeemable units issued by the FundUnder Canadian GAAP, the Fund accounted for its redeemable units as equity. Under IFRS,International Accounting Standard, IAS 32 requires that units of an entity which include a contractualobligation for the issuer to repurchase or redeem them for cash or another financial asset be classifiedas financial liability. The Fund’s units do not meet the criteria in IAS 32 for classification as equity andtherefore, have been reclassified as financial liabilities on transition to IFRS.
Revaluation of investments at fair value through profit or lossUnder Canadian GAAP, the Fund measured the fair value of its investments in accordance with Section3855, Financial Instruments – Recognition and Measurement, which required the use of bid prices forlong positions and ask prices for short positions; to the extent such prices are available. Under IFRS,the fund measures the fair values of its investments using the guidance in Fair Value Measurement(“IFRS 13”), which requires that if an asset or a liability has a bid price and an ask price, then its fairvalue is to be based on a price within the big-ask spread that is most representative of fair value. Italso allows the use of mid-market pricing or other pricing conventions that are used by marketparticipants as a practical expedient for fair value measurements within a bid-ask spread. As a result,upon adoption of IFRS an adjustment was recognized to increase the carrying amount of the Fund’sinvestment by $40,286 as at December 31, 2013 and by $19,175 and at January 1, 2013. The impact ofthis adjustment was to decrease the fund’s Net Assets attributable to holders of redeemable units by$14,821 for the period ended June 30, 2013 and increase by $21,111 for the year ended December 31,2013.
Reclassification adjustmentsIn addition to the measurement adjustments noted above, the Fund reclassified certain amounts upontransition in order to conform to its financial statement presentation under IFRS. Withholding taxes of$1,011 for the period ended June 30, 2013 which were previously netted against dividend income underCanadian GAAP, have been reclassified and presented separately as expense under IFRS.
15. EVENTS AFTER STATEMENT OF FINANCIAL POSITION DATE
Management has evaluated subsequent events in the preparation of the Fund’s financial statementsand has determined that other than the items listed herein, there are no events that requirerecognition or disclosure in the condensed interim financial statements.

New Horizons Master Fund
2014 Condensed Interim Financial Statements | 23
FUND INFORMATION
MANAGER AND INVESTMENT MANAGER
Brookfield Investment Management (Canada) Inc.George E. MyhalDirector, President & Chief Executive Officer
Jonathan TyrasManaging Director, Chief Financial Officer,and General Counsel
Gail CecilDirector, Managing Director
Craig NobleDirector
INDEPENDENT REVIEW COMMITTEE
John P. Barratt (Chair)Corporate Director
James L. R. KellyPresidentEarth Power Inc.
Frank LochanCorporate Director
CONTACT INFORMATION
New Horizons Master Fund welcomes inquiries from Unitholders, analysts, media representatives orother interested parties.
Manager, Investment Manager, Transfer Agent, Registrar, and Trustee
Unitholder inquiries relating to distributions, address changes and Unitholder accountinformation should be directed to the Fund’s Transfer Agent:
Brookfield Investment Management (Canada) Inc.
Brookfield Place
181 Bay Street, Suite 300
Toronto, Ontario
M5J 2T3
t. 416.363.9491
w. www.brookfieldim.com
