condensation risk assessment - aivc.org · product of the frequency and the size of the consequence...
TRANSCRIPT

AIVC #13123
Condensation Risk Assessment
Arnold Janssens, Ph.D. Hugo Hens, Ph.D. Member ASHRAE
ABST RACT
The methodology of risk analysis and assessment is reviewed and applied to study the reliability of condensation control measures in lightweight building envelopes. It is generally recognized that airtight construction is an essential part of condensation control. Nowadays, different air barrier systems are developed and documented to prevent air leakage and moisture accumulation in the envelope. But does this mean that the condensation risk is sufficiently minimized and that the protective system is reliable? Considering the high occurrence of human error in the building process, the possibility of air barrier defects during the service life of
a building envelope may be high.
To define the reliability of the condensation control system, the consequences of air barrier failure are quantified using a twodimensional numerical control volume model for the calculation of combined heat, air; and vapor transfer in multilayered building
envelope parts. A set of failure modes and design calculation conditions is defined for an exemplary wood frame insulated roof, and a failure effect analysis is performed in order to predict the condensation risk as a result of air barrier defects. The effectiveness of redundant design measures to improve the reliability of the condensation control system is studied.
RISK ANALYSIS MET HODOLOGY
Risk analysis, as applied in this work, is a method to study the effects of uncertain events or unintentional actions on the
serviceability of a design in order to prevent or reduce the negative outcome of these effects (Ang and Tang 1984; Ansell et al. 1991). In this definition, risk not only refers to the prob
ability of failure but also incorporates a notion of the magnitude of the failure. The techniques to identify and reduce risks
were developed in the 1960s in the nuclear and chemical
industries (Kletz 1992). The analysis provides a systematic and structured framework with three main stages:
I . Risk identification
2. Risk assessment
3. Decision making
The first step to be addressed at the design stage of a project is the recognition �nd identification of th,e range of risks to which a system is subject. The ultimate aim of risk identification is to link the possible problems that a system might experience directly to externaJ factors and events involving component failures and human errors. The second
stage implies the use of probabilistic calculation and assessment methods in order to predict the system performance and the probability of failure as a result of the unintentional events. In industrial risk analysis, risk is generally determined as the product of the frequency and the size of the consequence of the event (Ansell et al. 1991; Kletz 1992). Risk is accepted when events that happen often have no or low consequences or when events involving serious problems are rare.
When the predicted risk cannot be justified, decisions should be taken to eliminate or minimize the risk, either by preventing the event or by reducing the consequences in case of occurrence. These decisions often imply redesign of the
system by the introduction of protective measures. There are
generally three types of strategies, with decreasing order of effectiveness: inherent, engineered, and procedural safety measures. The reliability of protective systems is often improved through some duplication of components. This is called "redundancy" if the protective components are the same or "diversity" if they are different. In a nonredundant system, the failure of the protective component leads inevitably to the failure of the entire system.
Arnold Janssens is a researcher and Hugo Hens is a professor at the Laboratory of Building Physics, K.U. Leuven, Belgium.
Thermal Envelopes VII/Moisture Assessments-Principles 199

Consider the example of fire risk prevention in buildings. A building is constructed with inflammable or fire-retarding materials whenever possible and affordable (inherent safety). Recognizing that fire risk is rarely eliminated, a sprinkler
installation may be designed and installed in the tailding (engineered safety). Final ly, to prevent casualties, a fire alarm and escape may be added (procedural safety). The reliability of the fire protection may be increased by installing two or
more fire alanns (redundancy) or adding both sprinkler and alann systems (diversity J.
There are similarities between the design of a hazard
protection and a building envelope system. The building enve
lope may be regarded as a multicomponent protective system to eliminate or minimize the discomfort of the environment.
The application of the redundancy concept is a common
element of building em·elope design. For instance, the reliability of rain control in the building envelope is often
improved by adding redundant components, such as drained
cavities, multilayered membranes, etc. Because of these similarities, the methodology of risk analysis may well be applied
to the performance analysis of building envelope systems.
In some recent publications on moisture control, the
concepts of risk analysis are implicitly present. It is recom
mended that designers incorporate moisture control measures
to ensure the performance of the envelope system in the case that something goes wrong during construction or operation, for instance, by accidental wetting or by human error. This subsystem is called "the second line of defense" (Lstiburek and Bomberg 1996).
UNCERTAINTIES IN CONDENSATION CONT ROL
Condensation Control Systems
Ten Wolde and Rose (1996) presented two major approache to moisture control in Lhe building envelope. The first is to design and construct the build1ng envelope for a high tolerance for moisture. The second is to l imit the moisture load on the envelope. Designing the envelope for a high moisture tolerance implies the use of measures to control the migration of moisture into the construction, to control moisture accumulation in building materials, or to enhance removal of moisture from the building assembly (Lstiburek and Carmody 1993). The limitation of the moisture load often involves control strategies on the level of building design and operation e.g., ventilation, dehumidification, or depressurization. Table l categorizes potential condensation control strategies for lhe building envelope . Table 2 lists measures to restrict the moi -lure toad by proper building design and operation. The individual measures may be combined to create an effective condensation control sy tern. The problem is to find out which combination of condensation control measures is the most reliable to reduce the condensation risk.
200
\ \ .
..
TABLEl Condensation Control Strategies
for the Building Envelope*
Strategy Aim Measure
Control of Eliminate air leakage Air barrier
moisture
access Restrict vapor diffusion Vapor retarder
Control of Raise temperature of Insulation outside of
moisture condensing surface condensing surface
accumulation Allow harmless High moisture capacity
accumulation at condensing surface
Removal of Promote drying Vapor permeable layers
moisture Capillary active layers
Cavity ventilation
Remove condensation Drainage
Reduction of Limit construction Initially dry materials
moisture load moisture
*afler Lstiburek and Carmody ( 1993) and TenWolde and Rose (1996)
TABLE2 Reduction of Moisture Load by
Building Design and Operation*
Aim Design Operation
Limit vapor in Natural ventilation Mechanical ventilation interior air system
Dehumidification
Control air pres- Airtight floor separations Depressurization
sure differentials (limit thermal stack height)
*after Lstiburek and Carmody ( 1993) and TenWolde and Rose ( 1996)
Uncertainties in Air Barrier Performance
It is generally recognized among building researchers that airtight construction is an essential part of any condensation
control system. Without effective control of air leakage, oLber
condensation control measures uch a vapor retarders are complete! y ineffecLi ve (ASHRAE 1997). Nowaday , different
air barrier sy terns are developed and documented, and mate
rial and system requirement are prescribed (Di Lenardo et al.
1995). However, in terms of ri k analysis, the air barrier i a nonredundant protective component. ff airtightness requirement. are not met in practice, there is a risk of serious conden·
salion problem . This implies that the uncertainties in
conden ation ontrol are primarily related to uncertainties in
air barrier performance.
The authors have conducted a survey of recent cases of
serious condensation problems in lightweight roofs (Jan ens
1998). They found that most problem were caused by a failure of the air barrier due to human error . ASHRAE Fundamentals (ASHRAE 1997) lists some of the most frequently observed leakage paths in lightweight wall and roof ystems.
Thermal Envelopes VII/Moisture Assessments-Principles

n
.1
n n
,f tS 1-J\y 1s.
·es
\ They may be divided into four cate[ories: (1) joints between different sheets or boards of the air b)rrier, (2) interfaces with other envelope systems, such as tt·e wall-roof and wallwindow interface, (3) junctions around structural penetrations (columns, joists, trusses, etc.), and (4) electrical and plumbing penetrations. Air barrier clefects at these locations may be caused by a combination of design and construction errors. Different parties in the design team and different trades in the construction team may contribute to the defects. Considering the high occurrence of human error in the building process, it is evident that the likelihood of air barrier defects is not negligible. Some redundancy in the design of the condensation control system may become necessary.
To decide in which condition changes in design are necessary and to find out which measures are effective in reducing condensation risk, it is necessary to quantify the effects of air leakage on the moisture performance of building envelope systems.
CONSEQUENCES OF AIR BARRIER DEFECT S
Analytical Study of Condensation Due to Air Leakage
Let us first consider the simple case of one-dimensional heat, air, and vapor flow. In steady-state conditions, this problem may be solved analytically (Hens 1996). The solution may help in understanding the conditions when air leakage causes condensation problems. It may also give a first idea of the potential measures to prevent problems. The condensation rate at a material interface in air permeable envelope systems is calculated according to Equation l:
where
11,. = condensation flow rate (kg/m2/s),
(1)
= airflow rate (negative sign in case of exfiltration) (kg/ m2/s),
= vapor capacity of air= 6.2xl0-6 kg/kg/Pa, 11; = interior vapor pressure (Pa), fl, = exterior vapor pressure (Pa), /l.,ar(0J == saturation vapor pressure at the condensation plane
(Pa),
·Z:- = sum of the vapor diffusion resistances between interior and condensation plane, .
Z:: = sum of the vapor diffusion resistances between condensation plane and exterior.
With even moderate air exfiltration rates (negative sign), the denominators with the exponential terms become unity and infinity, respectively. Equation 1 reduces to Equation 2:
Thermal Envelopes VII/Moisture Assessments-Principles
(2)
The condensation flow rate per unit flow of air is independent of the vapor transfer properties of the envelope system. Condensation will occur whenever the indoor vapor pressure exceeds the saturation vapor pressure of the condensation plane or when
where Ap = vapor supply in the building (Pa),
P; =Pe +Ap.
(3)
The left-hand side of Equation 3 characterizes the indoor climate, the right-hand side, the exterior climatic conditions.
Equation 2 shows that when exfiltration through the envelope is not stopped, there is only one way to prevent condensation: by increasing the temperature of the critical interface so as to lower the difference between the indoor vapor pressure and the saturation vapor pressure at the interface. This is practically done by applying insulated sheathing or by changing the envelope design with the principles of a warm deck construction.
Going back to Equation 1, it is possible to define a second type of potential protective measure. Suppose that the saturation vapor pressure at the condensation plane is above the exterior vapor pressure and that the vapor diffusion resistance to the outside Z/ is at least one order of magnitude smaller than the diffusion resistance to the inside Z{. For a certain range of air exfiltration rates, Equation 1 reduces to
(4)
This shows that measures to enhance moisture drying to the outside may be capable of preventing condensation problems, even when a perfect airtightness is not achieved. On the other hand, the use of vapor retarders is ineffective when air leakage is not stopped.
Failure Effect Analysis: Insulated Wood Frame Roof
Calculation Model. The authors developed a twodimensional numerical control volume model for the calculation of combined heat, air, and vapor transport in multilayered building envelope parts (Janssens 1998). The model considers airflow in porous material and laminar flow in cracks and air layers only. As a consequence, the equations for the conservation of momentum reduce to the linear Darcy and HagenPoiseuille flow equations. Airflow is driven by external pressures or thermal stack. The equations for the conservation of mass, momentum, and energy are iteratively solved. Underrelaxation techniques are applied to improve and accelerate the convergence of the solution. The heat and vapor flow equa-
201

tions are integrated using the exponential differential scheme. Condensation flows are calculated iteratively by changing variables whenever the calculated vapor pressure rises above the saturation vapor pressure. Eventually, in every calculation node, the airflow rates, temperatures, relative humidities, and condensation flow rates are defined. Thus, the model makes it possible to assess the effect of air leakage on the thermal and moisture performance of the building envelope.
Description of Boundary Conditions, Envelope System, and Failure Modes. A preceding comparison
between the results of transient and steady-state calculations showed that steady-state calculations are a good check for the moisture performance of lightweight envelope systems with nonhygroscopic layers (Janssens 1998). Unlike moisture accumulation as a result of vapor diffusion, condensation linked to air leakage is a fast and short-term phenomenon. The one-dimensional transient calculation was performed using a climate file of Manchester, U.K., with hourly averaged data. The results showed typical condensation periods of a couple of days to a week. A common characteristic of the boundary conditions during these periods was the negative net radiation to the exterior surface, in addition to the conditions described above. From this analysis, a set of weekly average design boundary conditions was composed for the two-dimensional steady-state calculation of condensation problems linked to
air leakage. They are listed in Table 3. The air pressure is imposed at the lowest point of the boundary.
TABLE3 Design Boundary Conditions for Condensation
Risk Assessment (Weekly Averages)
Vapor Surface Net Air Boundary Temp. Pressure Coefficient Radiation Pressure
Interior 18°C 950Pa 8 W/(m2·K) OW/m2 2 Pa
Exterior -2.5°C 450Pa 19 W/(m2·K) -30W/m2 OPa
As an exemplary case, a failure effect analysis is performed on an insulated wood frame roof that has, from inside to outside, the interior finish, a glasswool insulation layer, an air cavity, the underlay, and tiles. The interior finish
also includes the air/vapor barrier. It is assumed that the tile layer, due to an intensive mixing of air around the tiles, affects the temperature distribution in the roof only. Its thermal resistance is included in the underlay. Table 4 lists the material properties. The length of the roof is 3 m, and the slope is 45°. The U-value is 0.22 W/(m2·K). The moisture performance of the roof design is acceptable according to existing standards (e.g., DIN 4108, 1981). Under the above conditions, a Glaser calculation predicts a condensation amount of 0.01 L/m2 per week.
The calculation domain is discretized into a rectangular ,
grid with dimensions of 1 9 x 75 in the x and y direction, respectively. The first calculation assumes that no defects are present in either of the envelope layers. The underlay and
202
Layers
Internal lining
Fiberglass
Cavity
Underlay
TABLE4 Material Properties
d t..A Rx m W/m2/K m2·K/W
0.01 0.1 0.1
0.14 0.035/0.040 4.0
O.Ql 0.12
0.01 0.14 O.Q7
µd KJK1 m m2
5.0 l e- 12
0.2 4e-9/6e-9
1.5 l e-12
internal lining are essentially airtight, and airflow may develop in the air permeable fiberglass insulation only, due to
thermal stack.
Then a set of failure modes is defined, and all possible combinations are included in the envelope geometry (Figure 1 ). Table 5 lists the set of failure modes. One particular mode may consist of two or more defects that are supposed to occur together, for instance, air layers on either side of the thermal insulation or overlaps in the underlay. Some of them are not necessarily defects but may be inherent in the envelope design, for instance, overlaps in the underlay or cavity vents.
In total, 256 combinations (= 28) are calculated and the resulting heat flow, air flow, and condensation flow rates are statistically processed.
7 5 1
6
8
4 4 3 .0 m
45
v 6 � 8
2
7 5 3
� 017 m � Figure 1 Failure modes.
Thermal Envelopes VII/Moisture Assessments-Principles
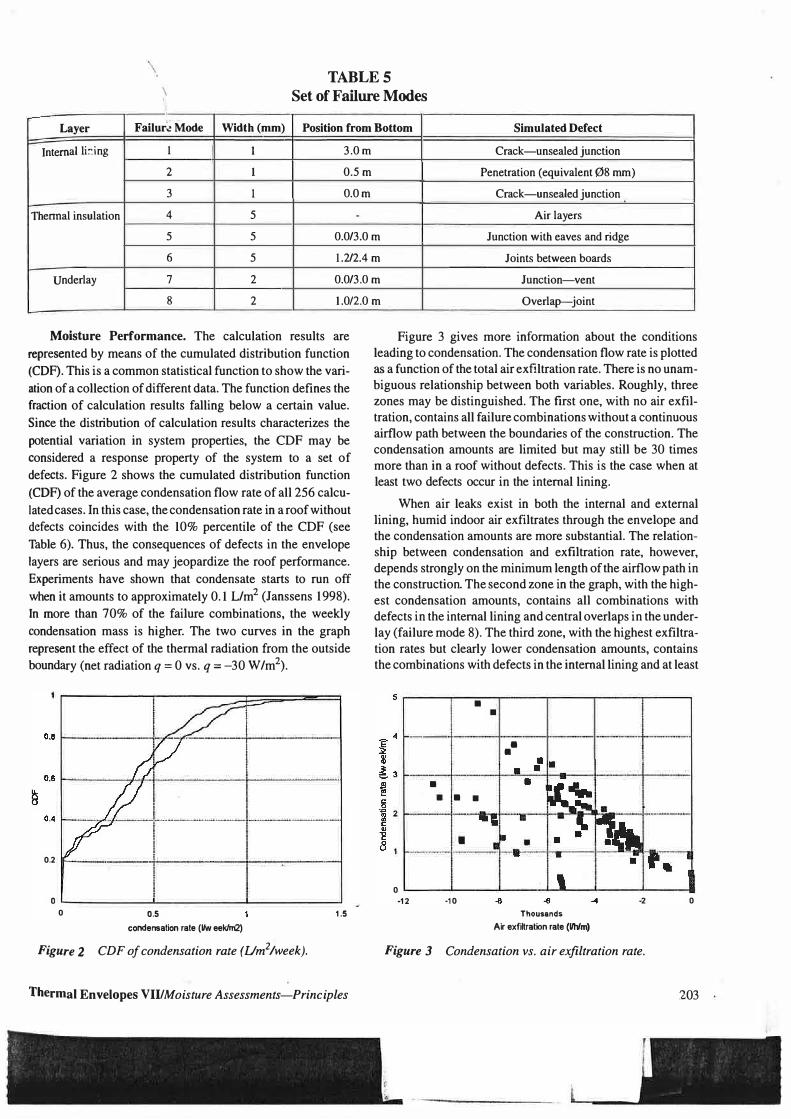
TABLES \ ' Set of Failure Modes
Layer Failur� Mode Width (mm) Position from Bottom Simulated Defect
Internal lbng 1 I 3.0m Crack-unsealed junction
2 l 0.5m Penetration (equivalent 08 mm)
3 l O.Om Crack-unsealed junction
Thennal insulation 4 5 - Air layers
5 5 0.0/3.0 m Junction with eaves and ridge
6 5 1.2/2.4 m Joints between boards
Underlay 7 2 0.0/3.0 m Junction-vent
8 2 1.012.0 m Overlap-joint
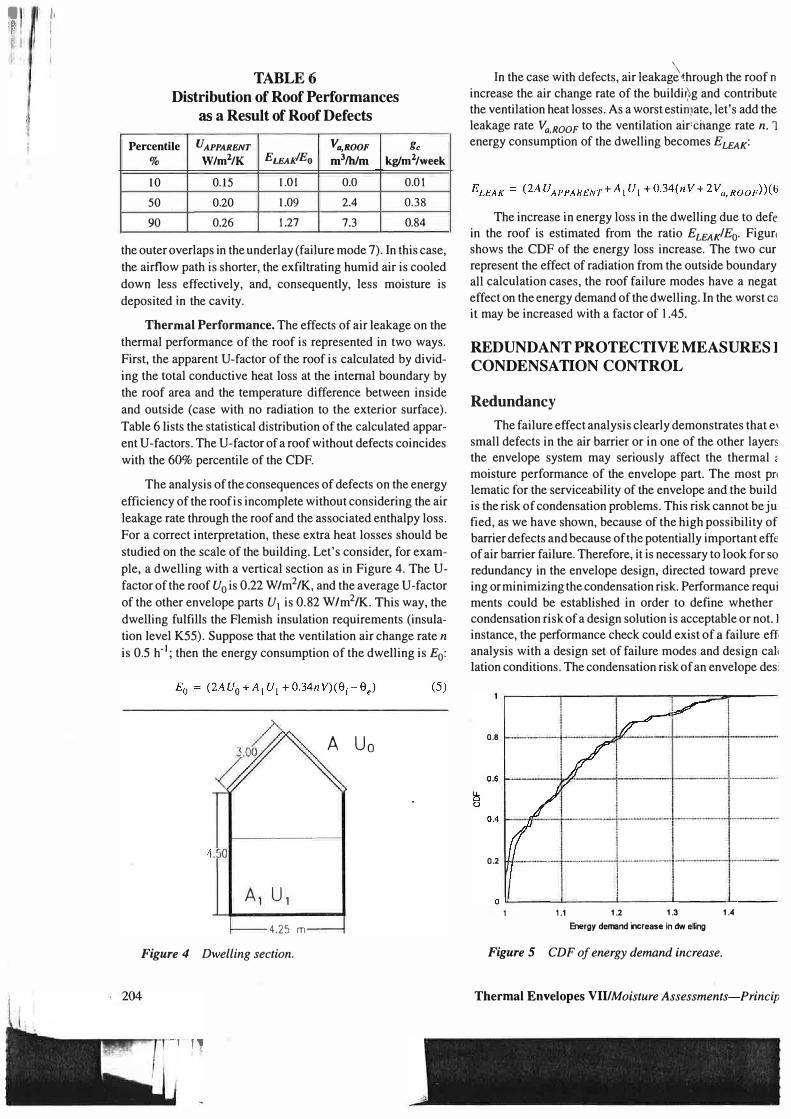
Moisture Performance. The calculation results are
represented by means of the cumulated distribution function
(CDF). This is a common statistical function to show the vari
ation of a collection of different data. The function defines the
fraction of calculation results falling below a certain value.
Since the distribution of calculation results characterizes the
potential variation in system properties, the CDF may be
considered a response property of the system to a set of
defects. Figure 2 shows the cumulated distribution function
(CDF) of the average condensation flow rate of all 256 calcu
lated cases. In this case, the condensation rate in a roof without
defects coincides with the 10% percentile of the CDF (see
Table 6). Thus, the consequences of defects in the envelope
layers are serious and may jeopardize the roof performance.
Experiments have shown that condensate starts to run off
when it amounts to approximately 0.1 L/m2 (Janssens 1 998). In more than 70% of the failure combinations, the weekly
condensation mass is higher. The two curves in the graph
represent the effect of the thermal radiation from the outside
boundary (net radiation q = 0 vs. q = -30 W/m2).
0.2 ------·-1--------i-----
0 �-----__._ ______ _,__ _____ ___. 0 0.5
condensation rate (l/w eek/m2)
Figure 2 CDF of condensation rate (Um2!week).
1.5
Thermal Envelopes VII/Moisture Assessments-Principles
Figure 3 gives more information about the conditions leading to condensation. The condensation flow rate is plotted as a function of the total air ex filtration rate. There is no unambiguous relationship between both variables. Roughly, three zones may be distinguished. The first one, with no air exfiltration, contains all failure combinations without a continuous airflow path between the boundaries of the construction. The condensation amounts are limited but may still be 30 times more than in a roof without defects. This is the case when at least two defects occur in the internal lining.
When air leaks exist in both the internal and external lining, humid indoor air exfiltrates through the envelope and the condensation amounts are more substantial. The relationship between condensation and exfiltration rate, however, depends strongly on the minimum length of the airflow path in the construction. The second zone in the graph, with the highest condensation amounts, contains all combinations with defects in the internal lining and central overlaps in the underlay (failure mode 8). The third zone, with the highest exfiltration rates but clearly lower condensation amounts, contains the combinations with defects in the internal lining and at least
•
-- __ · .· -+---t-·-· •
• • •
·---..-
• • ·-·--- -·-·--h.---+-_.,'411111 ...---.1
0 ...._ __ ....._ __ __. ___ _,_..._ _ __._ ___ .___ __ .... -12 -10 -2
Thousands Air exfiltration rate (Uhfm)
Figure 3 Condensation vs. air exfiltration rate.
0
203
. /, F:' I t· I I
TABLE6 Distribution of Roof Performances
as a Result of Roof Defects
Percentile UAPPARENT Va, ROOF Kc % W/m2/K ELEAIIEo m3/h/m kg/m2/week
10 0.15 LOI 0.0 0.01
50 0.20 1.09 2.4 0.38
90 0.26 1.27 7.3 0.84
the outer overlaps in the underlay (failure mode 7). In this case, the airflow path is shorter, the exfiltrating humid air is cooled down less effectively, and, consequently, less moisture is deposited in the cavity.
Thermal Performance. The effects of air leakage on the thermal performance of the roof is represented in two ways. First, the apparent U-factor of the roof is calculated by dividing the total conductive heat loss at the internal boundary by the roof area and the temperature difference between inside and outside (case with no radiation to the exterior surface). Table 6 lists the statistical distribution of the calculated apparent U-factors. The U-factor of a roof without defects coincides with the 60% percentile of the CDF.
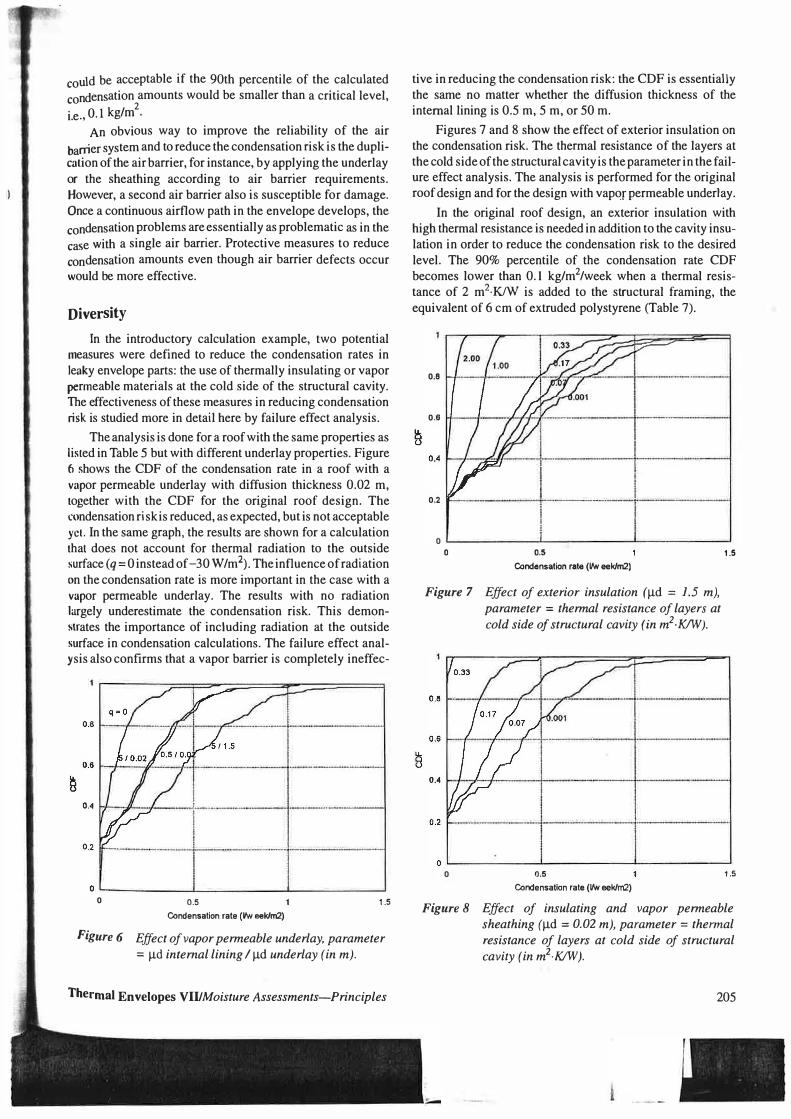
The analysis of the consequences of defects on the energy efficiency of the roof is incomplete without considering the air leakage rate through the roof and the associated enthalpy loss. For a correct interpretation, these extra heat losses should be studied on the scale of the building. Let's consider, for example, a dwelling with a vertical section as in Figure 4. The Ufactor of the roof U0 is 0.22 W/m2/K, and the average U-factor of the other envelope parts U1 is 0.82 W/m2/K. This way, the dwelling fulfills the Flemish insulation requirements (insulation level K55). Suppose that the ventilation air change rate n
is 0.5 h-1; then the energy consumption of the dwelling is £0:
A Uo
A1 U1
4.25 m
Figure 4 Dwelling section.
' In the case with defects, air leakag�\through the roof n
increase the air change rate of the buildir>g and contribute the ventilation heat losses. As a worst estiri1ate, let's add the leakage rate Va.ROOF to the ventilation air' change rate n. 1 energy consumption of the dwelling becomes ELEAK:
The increase in energy loss in the dwelling due to defe in the roof is estimated from the ratio ELEAKIE0. Figuri shows the CDF of the energy loss increase. The two cur represent the effect of radiation from the outside boundary all calculation cases, the roof failure modes have a negat effect on the energy demand of the dwelling. In the worst ca it may be increased with a factor of 1.45.
REDUNDANT PROT ECTIVE MEASURES 1 CONDENSATION CONT ROL
Redundancy
The failure effect analysis clearly demonstrates that e' small defects in the air barrier or in one of the other layers the envelope system may seriously affect the thermal < moisture performance of the envelope part. The most pr• lematic for the serviceability of the envelope and the build is the risk of condensation problems. This risk cannot be ju fied, as we have shown, because of the high possibility of barrier defects and because of the potentially important effe of air barrier failure. Therefore, it is necessary to look for so redundancy in the envelope design, directed toward preve ing or minimizing the condensation risk. Performance requi ments could be established in order to define whether condensation risk of a design solution is acceptable or not. I instance, the performance check could exist of a failure eff· analysis with a design set of failure modes and design cal• lation conditions. The condensation risk of an envelope desi
0.8 ,__ _______ _ .-----�
0.2 ---1----1·---
0 <L.-__ _. ___ _,__ ___ _._ __ _ ...._ __ _
1 1.1 1.2 1.3 Energy demand increase in dw elnng
Figure 5 CDF of energy demand increase.
1.4
Thermal Envelopes Vil/Moisture Assessments-Princip
could be acceptable if the 90th percentile of the calculated condensation amounts would be smaller than a critical level,
2 i.e., 0.1 kg/m .
An obvious way to improve the reliability of the air barrier system and to reduce the condensation risk is the duplication of the air barrier, for instance, by applying the underlay or the sheathing according to air barrier requirements. However, a second air barrier also is susceptible for damage. Once a continuous airflow path in the envelope develops, the condensation problems are essentially as problematic as in the case with a single air barrier. Protective measures to reduce condensation amounts even though air barrier defects occur would be more effective.
Diversity
In the introductory calculation example, two potential measures were defined to reduce the condensation rates in leaky envelope parts: the use of thermally insulating or vapor permeable materials at the cold side of the structural cavity. The effectiveness of these measures in reducing condensation risk is studied more in detail here by failure effect analysis.
The analysis is done for a roof with the same properties as listed in Table 5 but with different underlay properties. Figure 6 shows the CDF of the condensation rate in a roof with a vapor permeable underlay with diffusion thickness 0.02 m, together with the CDF for the original roof design. The condensation risk is reduced, as expected, but is not acceptable yet. In the same graph, the results are shown for a calculation that does not account for thermal radiation to the outside surface (q = 0 instead of -30 W /m2). The influence of radiation on the condensation rate is more important in the case with a vapor permeable underlay. The results with no radiation largely underestimate the condensation risk. This demonstrates the importance of including radiation at the outside surface in condensation calculations. The failure effect analysis also confirms that a vapor barrier is completely ineffec-
0 0.5 1.5
Condensation rate (l/w eek/m2) Figure 6 Effect of vapor permeable underlay, parameter
= µd internal lining I µd underlay (in m).
Thermal Envelopes VII/Moisture Assessments-Principles
tive in reducing the condensation risk: the CDF is essentially the same no matter whether the diffusion thickness of the internal lining is 0.5 m, 5 m, or 50 m.
Figures 7 and 8 show the effect of exterior insulation on the condensation risk. The thermal resistance of the layers at the cold side of the structural cavity is the parameter in the failure effect analysis. The analysis is performed for the original roof design and for the design with vapor permeable underlay.
In the original roof design, an exterior insulation with high thermal resistance is needed in addition to the cavity insulation in order to reduce the condensation risk to the desired level. The 90% percentile of the condensation rate CDF becomes lower than 0.1 kg/m2/week when a thermal resistance of 2 m2·KIW is added to the structural framing, the equivalent of 6 cm of extruded polystyrene (Table 7).
0.8
0.6
0.2
0 '--�����__..������������� 0 0.5 1.5
Condensation rate (lfw eek/m2)
Figure 7 Effect of exterior insulation (µd = 1.5 m), parameter = thermal resistance of layers at cold side of structural cavity (in m2
· K/W).
0 0.5
Condensation rate (lfw eek/m2) 1.5
Figure 8 Effect of insulating and vapor permeable sheathing (µd = 0.02 m), parameter= thermal resistance of layers at cold side of structural cavity (in m2
· KIW).
205

\
\ TABLE7
Distributi;�n of Condensation Rate as a Result of Roof Defects (kg/m2/week)
Properties of Layers at Cold Side of Structural Cavity
Diffusion Thickness µd = 1.50 m
Percentile Thermal Resistance (m2· KIW)
(%) 0.001 0.07 1.0 10 O.Ql 0.01 0
50 0.42 0.38 0.13
90 0.95 0.84 0.24
A vapor permeable underlay or sheathing is unable to reduce the condensation risk without additional thermal resistance. However, the combination of a high vapor permeance with a thermal resistance even as small as that of an air cavity is very effective in minimizing condensation risk. These results indicate that very simple and inexpensive design measures are capable of creating reliable condensation control systems in lightweight building envelopes.
CONCLUSIONS
The methodology of risk analysis and assessment has been reviewed and applied to study the reliability of condensation control measures in lightweight building envelopes. It is generally recognized that lack of airtightness is the more important cause of serious condensation problems, but in terms of risk analysis, the air barrier protective system is a nonredundant condensation control system. Considering the high occurrence of human error in the building process, it has been shown that the possibility of air barrier defects during the service life of the building envelope is high. To define the reliability of the condensation control system, the consequences of air barrier failure have been quantified using a two-dimensional numerical control volume model for the calculation of combined heat, air, and vapor transfer in multilayered building envelope parts.
A set of failure modes and design calculation conditions has been defined for an exemplary wood frame insulated roof, and a failure effect analysis has been performed to predict the condensation risk as a result of air barrier defects. The analysis has demonstrated that the condensation risk cannot be justified because of the potentially important effects of air barrier failure. Therefore, the effectiveness of redundant protective measures to reduce the condensation risk has been studied. The results have shown that the use of thermally insulating or vapor permeable materials at the cold side of the structural cavity are capable of creating reliable condensation control systems in lightweight building envelopes. The u e of a vapor barrier, on the other hand, is completely ineffective in reducing the condensation risk.
206
Diffusion Thickness µd = 0.02 m
Thermal Resistance (m2·KIW)
2.0 0.001 0.07 0.17 0.33 0 0 0 0 0
0.01 0.34 0.20 0.08 0
O.Q7 0.78 0.51 0.23 0.005
REFERENCES
Ang, A.H.-S., and W.H. Tang. 1984. Probability concepts in engineering planning and design, Volume II-Decision, risk and reliability. John Wiley & Sons, Inc.
Ansell, J., F. Wharton, and C. Wiley (eds.). 1991. Risk: Analysis, assessment and management.
ASHRAE. 1997. 1997 ASHRAE Handbook-Fundamentals. Atlanta: American Society of Heating, Refrigerating and Air-Conditioning Engineers, Inc.
Di Lenardo, B., W.C. Brown, W.A. Dalgleish, K. Kumaran, and G.F. Poirier. 1995. Technical guide for air barrier systems for exterior walls of low-rise buildings. Ottawa: Canadian Construction Materials Centre, National Research Council Canada.
DIN 4108. 1981. Wiirmeschutz im Hochbau. Deutsches lnstitut filr Normung e.V.
Hens, H. 1996. Heat, air and moisture transfer in insulated envelope parts (HAMTIE): Modelling. International Energy Agency Annex 24. Final report, Volume 1.
Janssens, A. 1998. Reliable control of interstitial condensation in lightweight roof systems: Calculation and assessment methods. Ph.D. thesis, K.U.Leuven, Laboratorium Bouwfysica, Heverlee.
Kletz, T. 1992. Hazap and Hazan, Identifying and assessing process industry hazards. Institution of Chemical Engineers. Bristol, Pa.: Hemisphere Publishing Corporation.
Lstiburek, J.W., and J. Carmody. 1993. Moisture control
handbook: Principles and practices for residential and small commercial buildings. New York: Van Nostrand Reinhold.
Lstiburek, J.W., and M.T. Bamberg. 1996. The performance linkage approach to the environmental control of buildings, Part II: Construction tomorrow. J. Thermal. lnsul. and Bldg. Envs. Vol. 19, pp. 386-403.
TenWolde, A., and W.B. Rose. 1996. Moisture control strat· egies for the building envelope. J. Thermal. Insul. and Bldg. Envs. Vol. 19, pp. 206-214.
Thermal Envelopes VII/Moisture Assessments-Principles