concurrent tonotopic processing streams in...
TRANSCRIPT
Cerebral Cortex V 14 N 4 © Oxford University Press 2004; all rights reserved Cerebral Cortex April 2004;14:441–451; DOI: 10.1093/cercor/bhh006
Concurrent Tonotopic Processing Streams in Auditory Cortex
Charles C. Lee1, Kazuo Imaizumi2, Christoph E. Schreiner2 and Jeffery A. Winer1
1Division of Neurobiology, Department of Molecular and Cell Biology, University of California, Berkeley, CA 94720-3200, USA and 2Coleman Memorial Laboratory, W.M. Keck Center for Integrative Neuroscience, University of California, San Francisco, CA 94143-0732, USA
The basis for multiple representations of equivalent frequency rangesin auditory cortex was studied with physiological and anatomicalmethods. Our goal was to trace the convergence of thalamic,commissural, and corticocortical information upon two tonotopicfields in the cat, the primary auditory cortex (AI) and the anteriorauditory field (AAF). Both fields are among the first cortical levels ofprocessing. After neurophysiological mapping of characteristicfrequency, we injected different retrograde tracers at separate,frequency-matched loci in AI and AAF. We found differences in theirprojections that support the notion of largely segregated parallelprocessing streams in the auditory thalamus and cerebral cortex. Ineach field, ipsilateral cortical input amounts to !70% of the number ofcells projecting to an isofrequency domain, while commissural andthalamic sources are each !15%. Labeled thalamic and corticalneurons were concentrated in tonotopically predicted regions and insmaller loci far from their spectrally predicted positions. The fewdouble-labeled thalamic neurons (<2%) are consistent with thehypothesis that information to AI and AAF travels along independentprocessing streams despite widespread regional overlap of thalamicinput sources. Double labeling is also sparse in both the cortico-cortical and commissural systems (!1%), confirming their independ-ence. The segregation of frequency-specific channels withinthalamic and cortical systems is consistent with a model of parallelprocessing in auditory cortex. The global convergence of cellsoutside the targeted frequency domain in AI and AAF couldcontribute to context-dependent processing and to intracorticalplasticity and reorganization.
Keywords: AAF, AI, branched axons, convergence, medial geniculate body, parallel processing, thalamocortical projections
IntroductionContemporary models of cortical function have often empha-sized the contribution of either thalamic (Reid and Alonso,1995; Miller et al., 2001), corticocortical (Wallace et al., 1991),or commissural (Imig and Brugge, 1978) connectivity. Athalamocentric or corticocentric perspective constrains under-standing of how the convergence of these systems can influ-ence an area. Numerical differences in thalamic and corticalinput likely have important consequences for the extrinsicexcitability of cortical neurons. Here we studied the individualand the collective contribution of these three systems to acommon functional domain in two subdivisions of primaryauditory cortex. In joint physiological-anatomical experiments,the tonotopic distribution of characteristic frequency (CF) wasmapped in primary auditory cortex (AI) and the anterior audi-tory field (AAF) in cats. We next injected different, but equallysensitive, retrograde tracers at the same CF locus in AI andAAF. This permitted the direct comparison of the numerical
strength of corticocortical, commissural, and thalamic converg-ence in the corresponding physiological locus in two adjoiningareas in the same experiment. Between the two fields wefound significant qualitative and quantitative differences inconvergence with regard to these three projection systems.
A major issue is how the organization of CF is achieved in AIand AAF since each has a somewhat different tonotopic organ-ization (Merzenich et al., 1975; Knight, 1977). As far as isknown there is a single continuous CF map in the ventral divi-sion of the medial geniculate body (MGB) (Aitkin and Webster,1972; Imig and Morel, 1985), while at least five independentCF representations have been described in auditory cortex(Imig and Reale, 1980; Reale and Imig, 1980; Morel and Imig,1987). How are these multiple representations achieved? Ifthese several cortical CF maps arise from thalamic neuronswith branched axons, as suggested by prior studies (Morel andImig, 1987), then one might expect to find sparse corticocor-tical connections between similar frequency regions intonotopic fields receiving many branched thalamic axons. Ineither case, the proportion of thalamic and cortical neuronsprojecting to the same CF in different areas has never beencompared systematically.
A current model of auditory thalamocortical connectivityemphasizes point-to-point connectivity with little allowancefor thalamic neurons with branched axons (Brandner andRedies, 1990). Such a paradigm is at odds with earlier studieswhich find a substantial proportion — up to 18% in certainprojections — of double labeled thalamocortical cells (Moreland Imig, 1987). A strict point-to-point scheme is at variancewith the pattern of thalamocortical projections to primaryvisual cortex (areas 17 and 18), which notes a significantproportion of thalamic Y cells that terminate in both areas viabranched axons (Humphrey et al., 1985b). Nevertheless, thepredictions of the point-to-point model have never been testedin AAF using modern tracers.
A related issue is whether AI and AAF are one region with adouble representation of frequency or two functional areas.Hierarchically, they appear to be equivalent (Rouiller et al.,1991), though prior work concluded that the ventral divisionof the medial geniculate body had a minor projection to AAF(Morel and Imig, 1987). The physiological data available showboth similarities (Eggermont, 1998) and differences betweenAI and AAF (Schreiner and Urbas, 1988; Valentine and Egger-mont, 2001; Noreña and Eggermont, 2002). The presentresults, when viewed within the context of thalamic andcortical connectivity, suggest that parallel streams of spectralinformation reach AI and AAF and that the input from each ofthe extrinsic sources is largely independent. Understandinghow auditory thalamic and cortical inputs reach the tonotopicsubregions of auditory cortex is a first step in establishing

442 Concurrent Tonotopic Streams in Auditory Cortex • Lee et al.
where any independent representations of frequency areachieved and how they are preserved at still higher levels. Italso addresses the question of whether this parallel segregationof pathways is a general property of auditory forebrain organ-ization that might be related to the two afferent streamsobserved within primate auditory cortex (Rauschecker et al.,1997; Romanski et al., 1999).
Materials and Methods
Surgical PreparationExperiments were conducted on the right auditory cortex of fouradult cats, three female and one male, following protocols approvedby the Institutional Animal Care and Use Committee of the Universityof California at San Francisco and the National Institutes of Healthguidelines. Animals were sedated with ketamine (22 mg/kg, i.m.) andacepromazine (0.11 mg/kg, i.m.) and anesthetized with sodium pento-barbital (15–30 mg/kg, i.v.) before tracheotomy and subsequentsurgical procedures. The head was immobilized while leaving the earsunobstructed. The skull and tissues overlying AI and AAF wereremoved and the brain surface was covered with silicon oil.
After the cortical exposure was completed, the animals received aconstant infusion of ketamine (2–10 mg/kg/h), diazepam (0.05–0.2mg/kg/h) and lactated Ringer’s solution (1–3 ml/kg/h), except for onecase that was infused with sodium pentobarbitol and lactated Ringer’ssolution. The animals were hydrated continuously and the bodytemperature was maintained at !37°C with a feedback-controlledwaterpad. Electrocardiogram and respiration were monitored con-tinuously.
Physiological MappingDuring the first 24 h of recording, CFs were mapped in AI and AAF toidentify isofrequency contours and the borders between fields. TheCF was defined by the frequency at which a response was elicited bythe lowest sound pressure level. The mapped area of AAF wasconstrained by the sulcal pattern and by unresponsiveness at the low-frequency pole. The dorsal and ventral borders of AI were identifiedbased on decreased tonotopy, broader tuning and decreased or absentauditory responsiveness. Parylene-coated tungsten microelectrodes(0.5–2.5 M") were used to record single- and multi-unit activity fromthe main thalamic recipient zone, layers IIIb and IV, at depths of700–1100 µm (Winer, 1984a).
Tone bursts (3 ms linear rise and fall; 50 ms total duration;400–700 ms interstimulus interval) were generated by a microproc-essor (TMS32010, 16-bit D–A converter at 120 kHz) and presentedthrough a STAX-54 headphone tube (Sokolich, US Patent 4251686,1981) inserted into the left external meatus. To map unit responses,675 pseudorandom tone bursts were presented at different frequen-cies (range 3–5 octaves) and intensities (range 70 dB). From theresponses, an excitatory frequency response area was generated todetermine CF. Post-experiment physiological analysis used MATLAB(MathWorks, Natick, MA). Tonotopic maps were depicted with theVoronoi–Dirichlet tessellation (DELDIR, Statlib, Carnegie MellonUniversity, Pittsburgh, PA), where polygon borders are defined by themidpoints between adjacent recording sites (Kilgard and Merzenich,1998).
Tracer Injection and PerfusionFollowing the initial physiological mapping, retrograde tracers,cholera toxin beta subunit (CT#) or cholera toxin beta subunit conju-gated with gold (CT#G; List Biological Laboratories, Campbell, CA),were injected into matching isofrequency loci in AI and AAF. Glasspipettes with a 20–30 µm tip diameter and containing mineral oil werefilled with tracer and lowered to 500, 1000 and 1500 µm below thepia. At each depth, a nanoliter injector (World Precision Instruments,Sarasota, FL) deposited 55.2 nl of tracer at a rate of 4.6 nl/15 s. Aninterval between deposits allowed for tracer equilibration beforepipette withdrawal.
After the deposits, the animal was maintained for 48–52 h to allowfor tracer transport and further physiological recordings. Animals
then received a lethal dose of sodium pentobarbital and wereperfused transcardially with 0.01 M phosphate buffered saline (PBS)followed by 4% paraformaldehyde/0.01 M PBS. The brain wasdissected and cryoprotected in 30% sucrose/4% paraformaldehyde/0.01 M PBS for 3 days.
HistologyTransverse sections were cut on a freezing microtome at 60 µm and a1:6 series was processed for the tracers. To visualize CT#G labeling,sections were rinsed in 50% ethanol, washed in double distilled water,silver-intensified for 3 h (Kierkegaard and Perry Laboratories,Gaithersburg, MD), washed in 1% sodium thiosulfate, then washed in0.01 M PBS.
For CT# labeling, sections were blocked for 1 h in 5% normal rabbitserum/0.3% Triton X-100, incubated overnight in a 1:7500 dilution ofgoat anti-CT# primary antibody (List Biological Laboratories, Camp-bell, CA) in 0.01 M PBS, then processed using a goat Vectastainavidin–biotin–peroxidase (ABC) kit (Vector Laboratories, Burlingame,CA) with diaminobenzidine (DAB) as the chromogen. Sections weremounted onto gelatin-coated slides, cleared and coverslipped.
Cytoarchitectonic AnalysisAdjacent series of sections were stained for the determination ofthalamic subdivisions and cortical areas with the Nissl stain and theSMI-32 antibody, which recognizes neurofilaments in pyramidalneurons (Campbell and Morrison, 1989) and defines AI. For SMI-32immunostaining, sections were blocked for 1 h in 5% normal horseserum/0.3% Triton X-100, incubated overnight in a 1:2000 dilution ofthe SMI-32 antibody (Sternberger Monoclonal Inc., Baltimore, MD),then processing with a mouse Vectastain ABC kit (Vector Laborato-ries) and a heavy-metal intensified DAB chromogen (Adams, 1981).Sections were mounted, cleared and coverslipped.
Anatomical AnalysisRetrogradely labeled cell bodies were charted with a microscopeconnected to a motorized stage, using an imaging system super-imposed on the microscope field (Lucivid) and a computer equippedwith the Neurolucida plotting and analysis software (MicroBright-Field, Colchester, VT). The thalamic and cortical labeling was plottedusing the Neurolucida at 200$. These plots were imported to theCanvas graphics software package (Deneba Software Inc., Miami, FL)and aligned with scanned 15$ drawings made independently of thesubdivisions from Nissl preparations. Plots of cortical sectionswere reconstructed using the three-dimensional solids module inthe Neuroexplorer analysis software (MicroBrightField). The three-dimensional model was processed in Canvas and aligned with sulcallandmarks from photographs of the brain to reconstruct lateral,surface views of cortical labeling. Counts of labeled cell populationsand other quantitative measures were then made with Neuroexplorer.Statistical analysis was performed using the Prism software package(GraphPad Software, San Diego, CA).
ResultsA defining feature of AI and AAF is their tonotopic organiza-tion. By limiting the study of their connectivity to a narrowfrequency range, a more precise picture of the similarities anddifferences in their convergent projections can be achieved.Frequency mapping in AI and AAF revealed the predictedsystematic representations of frequency; however, their organ-ization was not identical (Fig. 1A,C). Single- and multiunitextracellular maps of AI and AAF from two representativehemispheres (Fig. 1A,C: polygons represent Voronoi–Dirichlettessellations; see Materials and Methods) showed a frequencyreversal at the AI–AAF border (Fig. 1A,C: dashed lines). In eachhemisphere !150 points were mapped at a uniform spatialresolution and the resulting distribution of frequencies wasevaluated. The representation of mid-frequencies in AAF(green and yellow polygons in Fig. 1A,C) was smaller and morepatchy than in AI, suggesting they are underrepresented and

Cerebral Cortex April 2004, V 14 N 4 443
Figure 1. Distribution of characteristic frequencies (CFs) in AI and AAF and the ensuing patterns of thalamic retrograde labeling from two representative cases after tracer depositsat either low (3 kHz; A, B, E–H) or high (30 kHz; C, D, I–L) frequency loci. (A, C) Voronoi–Dirichlet tessellations illustrate the spatial distribution of CFs across AI and AAF. Circlesindicate the location and size of the retrograde tracer injections. A dashed line approximates the AI/AAF border. (B, D) Quantitative measures of the CF distribution plotted againstthe cumulative area mapped (red and blue circles). To compare directly the cumulative CF distributions, the AAF distribution was replotted for a CF range matching that in AI (bluecircles and red line). Unit penetrations spanning the border between AI and AAF, nine and ten cells in B and D, respectively, were included in both plots. Note the underrepresentationof middle-frequencies in AAF. (E–L) Plots of retrogradely labeled thalamic neurons after injections at either low (E–H) or high (I–L) frequency locations. The cells projecting to AI(blue dots) lie mainly in the ventral division (V) and are largely segregated from the cells projecting to AAF (red dots), which concentrate in the rostral pole (L: RP). The few neuronslabeled in the suprageniculate nucleus (Sgl) were unique to this experiment. Double-labeled cells (green circles) are sparse (<3%). Other cells occupy heterotopic positions outsidethe frequency-matched locations (arrows). Decimals, the section position as a percentage of the total caudal–rostral length of the medial geniculate body. Abbreviations used in allfigures: AAF, anterior auditory field; aes, anterior ectosylvian sulcus; AI, primary auditory cortex; AII, secondary auditory cortex; CF, characteristic frequency; Cg, cingulate gyrus;CT#, cholera toxin beta subunit; CT#G, cholera toxin beta subunit, gold-conjugate; D, dorsal nucleus of the medial geniculate body, or dorsal; DD, deep dorsal nucleus of the medialgeniculate body; DS, dorsal superficial nucleus of the medial geniculate body; EPD, posterior ectosylvian gyrus, dorsal part; EPI, posterior ectosylvian gyrus, intermediate part; EPV,posterior ectosylvian gyrus, ventral part; Ins, insular cortex; LGN, lateral geniculate nucleus; LGNd, dorsal lateral geniculate nucleus; LGNv, ventral lateral geniculate nucleus; LP,lateral posterior nucleus; M, medial division of the medial geniculate body, or medial; mss, middle suprasylvian sulcus; OT, optic tract; Ov, ovoid part of the medial geniculate body;P, posterior auditory cortex; pes, posterior ectosylvian sulcus; Pul, pulvinar; RP, rostral pole division of the medial geniculate body; SF, suprasylvian fringe cortex (dorsal auditory zone);Sgl, suprageniculate nucleus, lateral part; Sgm, suprageniculate nucleus, medial part; Te, temporal cortex; V, ventral division of the medial geniculate body, or ventral; Vb, ventrobasalcomplex; Ve, ventral auditory area; Vl, ventrolateral nucleus of the medial geniculate body; VP, ventral posterior auditory area; 35/36, parahippocampal areas 35 and 36.

444 Concurrent Tonotopic Streams in Auditory Cortex • Lee et al.
discontinuous. To quantify this, the area of each polygon wascomputed and normalized to the mapped AI or AAF area fromwhich we recorded. Cumulative plots were used to comparethe CF representations in AI and AAF, with shallow slopescorresponding to smaller CF representations. In the AAF areaplots (Fig. 1B,D: red circles), steps and subregions withshallow gradients occurred mainly in the 5–20 kHz mid-frequency region. The steps were not artifacts of systematicundersampling in certain subareas due to the presence of largeblood vessels, but reflected inequalities in the areal assignmentof frequency. By contrast, the AI area plot (Fig. 1B,D: bluecircles) was smooth and homogeneous, suggesting nearlyunbiased CF distribution for the entire mapped frequencyrange. Since the mapped CF ranges for AI and AAF differed dueto the limited recording time, differences in cortical magnifica-tion factors, and sulcal patterns (Merzenich et al., 1975; Realeand Imig, 1980), the distribution of cumulative areas was alsocompared within matched CF ranges (Fig. 1B,D: red line).Segments with shallow slopes in the mid-frequency range forAAF were maintained, suggesting that CF representation inAAF is smaller and less homogeneous than that in AI (Imaizumiet al., 2003).
From the CF maps, tonotopically-matched subregions in AIand AAF were identified and injected with tracers. Two repre-sentative experiments, one with low- (3 kHz; Fig. 1A,B) andone with high-frequency (30 kHz; Fig. 1C,D) injections areshown; the other cases had comparable origins, topography,numbers of labeled neurons and patterns of retrograde labeling(Table 1). Since the CF representation is larger in AI due to anexpanded magnification factor, three CT# deposits were madealong an AI isofrequency contour (Figs 1A,C: black dots; Fig.3A) and one of CT# conjugated to gold particles (CT#G) at amatching frequency in AAF (Fig. 1A,C: white dot; Fig. 3B).Each injection site was <1 mm in diameter, including diffusion,and did not enter the white matter (Fig. 3A,B). The position ofthe bulk of labeling in the thalamus and in the ipsilateral andcontralateral cortex, was consistent and closely related to CF inall experiments.
Thalamic ProjectionsDeposits in low frequency parts of AI labeled several clusters ofcells in the MGB, mainly in the lateral part of the ventral divi-sion (Fig. 1E–G: V, blue dots), in accord with physiological
studies (Aitkin and Webster, 1972). Neurons labeled by thelow-frequency AAF CT#G deposit (Fig. 1E–H: red dots) alsoformed clusters that partially overlapped the clusters from theAI deposit. Circumscribed cell clusters were present in themedial and dorsal divisions. Other labeled cells showed a morediffuse spatial distribution in tonotopically inappropriate(heterotopic) positions. Such heterotopic labeling was presentafter low- (Fig. 1F,G: arrows) and high-frequency (Fig. 1I,K:arrows) deposits and reflected both CT# and CT#G labeling. Inthe high-frequency deposits, the foci of CT# and CT#G labelinglay !1.5 mm apart, with the CT#G labeled cells dispersed acrossalmost 5 mm in the mediolateral axis. Few neurons (1.6 ± 0.3%)were double labeled (Table 2; Fig. 1E–L: large green circles;Fig. 3C: 3) in any experiment, further attesting to the independ-ence of these thalamocortical systems.
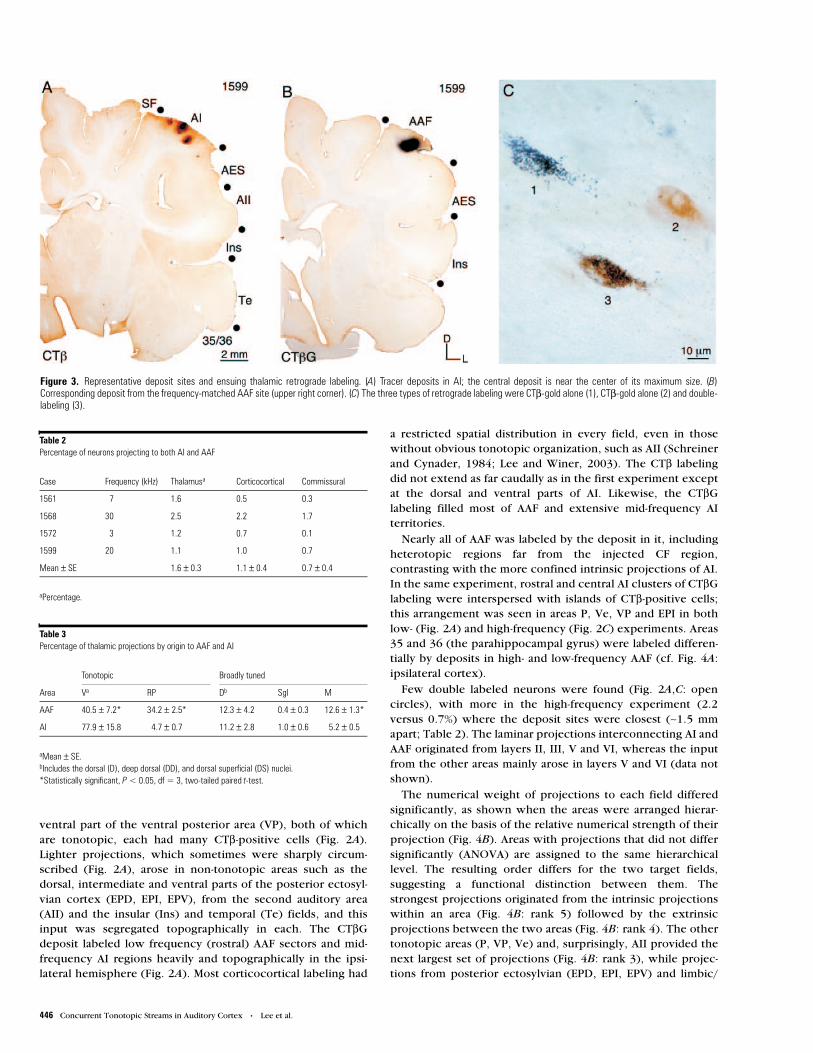
In the MGB, three of five main nuclei, including the ventraldivision, the rostral pole, which has also been designated asthe lateral part of the posterior group (Morel and Imig, 1987),and the medial division, showed statistically significant differ-ences (P < 0.05, two-tailed paired t-test, df = 3) in their projec-tions to AI and AAF (Table 3; Fig. 4A: thalamus) when theproportion of labeled cells in each was compared. Projectionstrength comparisons from the dorsal division nuclei showedno significant difference between the two fields. This suggestsdifferent thalamic origins for information sent to spectrallycongruent locations of these two cortical regions.
Corticocortical ProjectionsIpsilateral connections comprised !70% of the total number ofextrinsic cells projecting to both AI and AAF (Table 1). For thelow-frequency injection, large parts of ipsilateral AI, includinghigh- and low-frequency regions (Merzenich et al., 1975), hadCT#-labeled cells (Fig. 2A). These intrinsic projections weregenerally restricted along a dorsal–ventral axis, consistent withsimilar best frequencies. Nearly all ipsilateral fields had manylabeled neurons, with significant numbers in heterotopic terri-tories outside tonotopic subregions (Imig and Reale, 1980) inevery field. This included AI, where labeling far from theinjected CF was evident (Fig. 2A: arrow). Indeed, while most ofthe AI projection arose topographically and from tonotopicallyappropriate loci, there were scattered neurons in all sectorsexcept its rostral pole and extending to the borders ofadjoining fields. The dorsal part of the posterior area (P) and
Table 1Number of neurons and percentages of extrinsic convergent projections to AI and AAF
aTotal number of intrinsic and extrinsic neurons.bPercentage of the total number of neurons projecting from extrinsic sources.cPercentage of extrinsic projections from thalamus, ipsilateral or commissural cortex, respectively.
Case Frequency (kHz)
Total neuronsa Extrinsicb Thalamusc Corticocorticalc Commissuralc
AI AAF AI AAF AI AAF AI AAF AI AAF
1561 7 18 476 16 794 46.1 28.4 10.2 11.5 75.0 75.3 14.8 14.2
1568 30 21 816 54 677 40.8 52.2 10.6 7.0 75.6 85.7 13.8 7.3
1572 3 18 095 39 853 42.1 38.8 15.7 8.7 63.6 75.9 20.7 15.4
1599 20 11 274 31 191 33.7 35.7 25.7 16.7 56.9 69.5 17.4 13.8
Mean 17 415 35 628 40.7 38.8 15.5 11.0 72.2 76.6 14.7 12.7
SE 2211 7932 2.6 5.0 3.6 2.1 3.1 3.4 1.3 1.8

Cerebral Cortex April 2004, V 14 N 4 445
Figure 2. Lateral views of plots of retrogradely-labeled neurons projecting to AI (blue dots), AAF (red dots), or both (green circles) in the ipsilateral (A, C) and contralateral (B, D)cortex from the experiments shown in Figure 1. Large circles indicate injection sites. To facilitate comparison, the contralateral hemispheres match the ipsilateral orientation. (A, C)Both AI and AAF receive massive convergent topographic input from intrinsic, tonotopic (P, VP, Ve), and non-tonotopic (AII, Ins, Te, EP, SF) sources. Differential connections from thesuprasylvian fringe (SF) and the cingulate (not shown) and parahippocampal (35/36) cortex distinguish the fields. The vertical aliasing of the labeled cells is an artifact from aligningthe plotted sections; the labeling is actually continuous. The large number of intrinsic projection neurons in AI and AAF obscures many of the cross-projecting neurons in these fields.(B, D) Parallel commissural projections link AI and AAF with the contralateral homotopic area. In both hemispheres, few neurons project to both fields (<3%). In contrast, manymore neurons (!15%) are in tonotopically inappropriate (heterotopic) locations (arrows).
446 Concurrent Tonotopic Streams in Auditory Cortex • Lee et al.
ventral part of the ventral posterior area (VP), both of whichare tonotopic, each had many CT#-positive cells (Fig. 2A).Lighter projections, which sometimes were sharply circum-scribed (Fig. 2A), arose in non-tonotopic areas such as thedorsal, intermediate and ventral parts of the posterior ectosyl-vian cortex (EPD, EPI, EPV), from the second auditory area(AII) and the insular (Ins) and temporal (Te) fields, and thisinput was segregated topographically in each. The CT#Gdeposit labeled low frequency (rostral) AAF sectors and mid-frequency AI regions heavily and topographically in the ipsi-lateral hemisphere (Fig. 2A). Most corticocortical labeling had
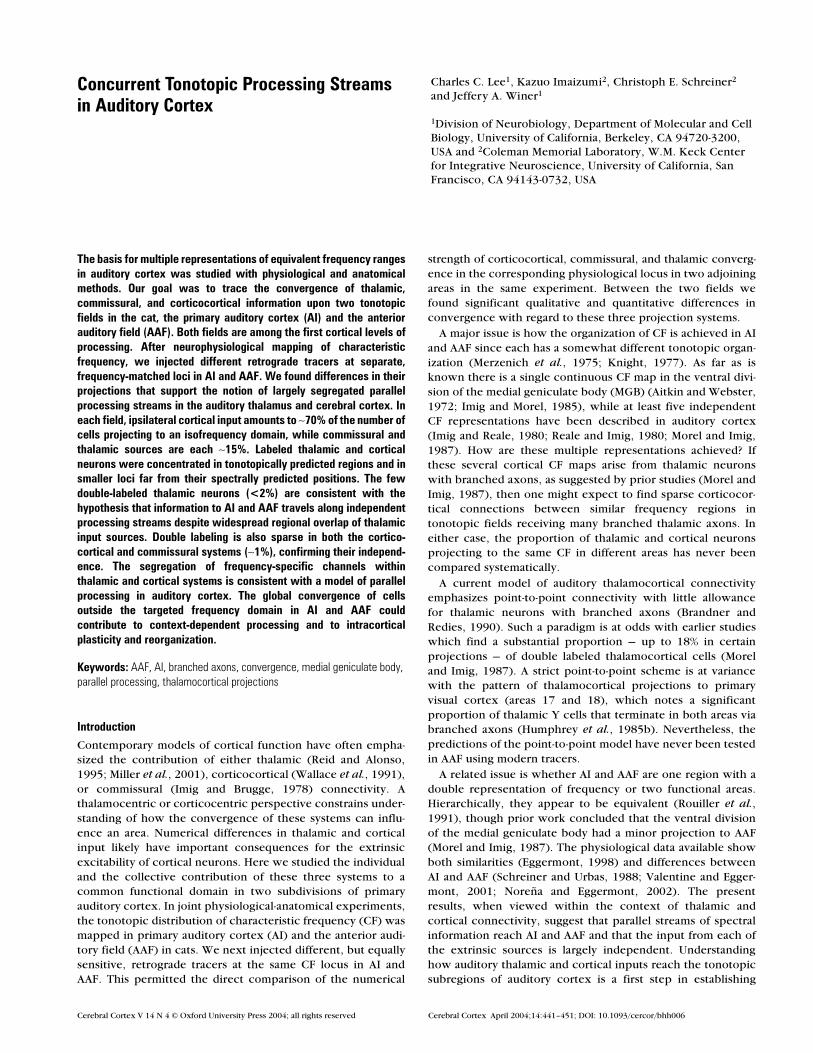
a restricted spatial distribution in every field, even in thosewithout obvious tonotopic organization, such as AII (Schreinerand Cynader, 1984; Lee and Winer, 2003). The CT# labelingdid not extend as far caudally as in the first experiment exceptat the dorsal and ventral parts of AI. Likewise, the CT#Glabeling filled most of AAF and extensive mid-frequency AIterritories.
Nearly all of AAF was labeled by the deposit in it, includingheterotopic regions far from the injected CF region,contrasting with the more confined intrinsic projections of AI.In the same experiment, rostral and central AI clusters of CT#Glabeling were interspersed with islands of CT#-positive cells;this arrangement was seen in areas P, Ve, VP and EPI in bothlow- (Fig. 2A) and high-frequency (Fig. 2C) experiments. Areas35 and 36 (the parahippocampal gyrus) were labeled differen-tially by deposits in high- and low-frequency AAF (cf. Fig. 4A:ipsilateral cortex).
Few double labeled neurons were found (Fig. 2A,C: opencircles), with more in the high-frequency experiment (2.2versus 0.7%) where the deposit sites were closest (!1.5 mmapart; Table 2). The laminar projections interconnecting AI andAAF originated from layers II, III, V and VI, whereas the inputfrom the other areas mainly arose in layers V and VI (data notshown).
The numerical weight of projections to each field differedsignificantly, as shown when the areas were arranged hierar-chically on the basis of the relative numerical strength of theirprojection (Fig. 4B). Areas with projections that did not differsignificantly (ANOVA) are assigned to the same hierarchicallevel. The resulting order differs for the two target fields,suggesting a functional distinction between them. Thestrongest projections originated from the intrinsic projectionswithin an area (Fig. 4B: rank 5) followed by the extrinsicprojections between the two areas (Fig. 4B: rank 4). The othertonotopic areas (P, VP, Ve) and, surprisingly, AII provided thenext largest set of projections (Fig. 4B: rank 3), while projec-tions from posterior ectosylvian (EPD, EPI, EPV) and limbic/
Figure 3. Representative deposit sites and ensuing thalamic retrograde labeling. (A) Tracer deposits in AI; the central deposit is near the center of its maximum size. (B)Corresponding deposit from the frequency-matched AAF site (upper right corner). (C) The three types of retrograde labeling were CT#-gold alone (1), CT#-gold alone (2) and double-labeling (3).
Table 2Percentage of neurons projecting to both AI and AAF
aPercentage.
Case Frequency (kHz) Thalamusa Corticocortical Commissural
1561 7 1.6 0.5 0.3
1568 30 2.5 2.2 1.7
1572 3 1.2 0.7 0.1
1599 20 1.1 1.0 0.7
Mean ± SE 1.6 ± 0.3 1.1 ± 0.4 0.7 ± 0.4
Table 3Percentage of thalamic projections by origin to AAF and AI
aMean ± SE.bIncludes the dorsal (D), deep dorsal (DD), and dorsal superficial (DS) nuclei.*Statistically significant, P < 0.05, df = 3, two-tailed paired t-test.
Tonotopic Broadly tuned
Area Va RP Db Sgl M
AAF 40.5 ± 7.2* 34.2 ± 2.5* 12.3 ± 4.2 0.4 ± 0.3 12.6 ± 1.3*
AI 77.9 ± 15.8 4.7 ± 0.7 11.2 ± 2.8 1.0 ± 0.6 5.2 ± 0.5
Cerebral Cortex April 2004, V 14 N 4 447
association areas (AES, Te, Ins) formed two groups, respec-tively, of weaker connections (Fig. 4B: ranks 2 and 1). Threeother regions, the suprasylvian fringe cortex (SF), parahippoc-ampal areas (35/36) and the anterior cingulate cortex (Cg),differed significantly in their relative input, confirming furtherdifferences between AI and AAF (Fig. 4A,B).
Commissural ProjectionsCommissural projections comprised !15% of the input to AI andAAF (Fig. 2B,D), far less than the corticocortical (Fig. 2A,C)projection. The heaviest foci of CT# and CT#G labeling were inregions matching spatially the contralateral deposit site,though many heterotopic cells were far beyond the <1 mmdiameter of the deposit, particularly in the high frequencysectors of AI and AAF (Fig. 2B: arrows). The labeling elsewherewas lighter but still clustered spatially. Thus, AII containedcaudal foci of CT# and rostral CT#G labeling, with littleoverlap. In the high-frequency case commissural labeling was
again lighter and concentrated in mirror image to the depositsite, except for the low frequency sector of AAF (Knight, 1977)and in central AI (Fig. 2D: arrows), where it was heterotopicand unexpectedly robust. The remaining projections were farlighter and always involved the same fields as the ipsilaterallabeling. Once again, there was connectional topography evenamong non-tonotopic fields: in the ipsilateral AII, the projec-tion shifted from rostrodorsal, in the 3 kHz case, to caudoven-tral, in the 30 kHz case. The two commissural areas showedsignificant differences in their AI/AAF projections (Fig. 2B,D:commissural; Fig. 4A: contralateral cortex). The principalhomotopic labeling in both areas arose from neurons in layersIII and V, but differed in their relative contributions [layer III/Vratio: AI (!70/30%), AAF (!50/50%); data not shown].
Double labeling was again sparse (0.7 ± 0.4%) and moreprominent in the high- than the low frequency (1.7 versus0.1%) cases, where the deposits were much nearer (Table 2)
Figure 4. (A) Graphic summary of statistically significant differences in the projections to AI (blue) and AAF (red) from the thalamus and ipsilateral and contralateral cortex. Thearea of each contour is proportional to the relative strength of the input from each source. AI receives its major thalamic input from the ventral division (V) and substantial corticalprojections from the suprasylvian fringe (SF) and the contralateral AI. By comparison, AAF has larger input from the rostral pole (RP) and medial division (M) of the medial geniculatebody and the contralateral AAF, plus unique projections from the cingulate (Cg) and parahippocampal areas (35/36) that distinguish it from AI (P < 0.05, df = 3, two-tailed, pairedt-test). (B) Hierarchical arrangement of corticocortical projections for AI and AAF. The projections to the two fields were ordered according to their proportion of the total numberof projecting neurons. Levels ranged from weak to strong: (0) 0%, (1) 0.01–1%, (2) 1–5%, (3) 5–10%, (4) 10–15% of the total extrinsic projection (!40% of total combined input);level (5) represents the intrinsic projection within an area (!60% of total combined input). Fields with statistically indistinguishable projection sizes (ANOVA, P > 0.05) wereassigned to the same hierarchical level.

448 Concurrent Tonotopic Streams in Auditory Cortex • Lee et al.
and where the cortical frequency representation is morecompressed than that at lower CFs (Merzenich et al., 1975).
DiscussionPhysiological mapping in conjunction with anatomical tracingof thalamic, corticocortical and commissural projectionsreveals independent projections to areas AI and AAF, with fewneurons in any source of extrinsic input terminating in bothareas. This finding is interpreted within the context of parallelprocessing for spectral information.
Methodological IssuesEarlier conclusions regarding local and ipsilateral connectionsfor AI and AAF were based on much larger deposits and usedless sensitive tracers or methods that could injure axons inad-vertently (Diamond et al., 1968; Kawamura, 1973) or tracerdeposits so small that they might fail to saturate fully a pia-to-white-matter column (Matsubara and Phillips, 1988). We usedhighly and equally sensitive tracers (Ruigrok et al., 1995) withlittle capacity for diffusion (Llewellyn-Smith et al., 1990) andwhose limits could be estimated accurately in these mappedhemispheres. We find that the corticocortical system has widerareal inputs and larger within-area projections than arepredicted by point-to-point homotypic models (Brandner andRedies, 1990) of thalamic projections (cf. Fig. 5C). In none ofthe 16 deposit sites in four hemispheres was there significantinvolvement of the white matter. Thus, any contribution fromsevered fibers was deemed to be negligible (Chen and Aston-Jones, 1995).
One interpretive caveat to the present results is that we havenot performed experiments in which the two tracers weremixed and injected at a single locus, which ought to labelnearly all cells in the center of the heaviest concentrations. Itis, therefore, possible that our estimates of double labeling areunduly low.
Validity of Heterotopic ProjectionsThe thalamic retrograde labeling arose from much largermedial geniculate body territories than appear to be devoted tothe CF representation injected in prior mapping studies (Aitkinand Webster, 1972; Imig and Morel, 1984). Thus, the 3 kHzdeposit arose from thalamic cells separated in the medio-lateraldimension by up to 5 mm and by !3 mm in the 30 kHz experi-ment, respectively. Thalamic labeling in other experiments hadan analagous distribution (data not shown). We estimate thatour deposits were restricted to !10% of the surface area of AIand AAF and are thus centered within targeted isofrequencydomains even as they spread slightly toward higher and loweradjoining frequencies. This would seem to preclude the unin-tended involvement of adjoining isofrequency regions, as doesthe breadth of the thalamic origins. Perhaps the less completeand more variable CF gradient in AAF contributes to theappearance of a wider distribution of the input sources than inAI. At least parts of the thalamic (Morel et al., 1987) andcortical (Schreiner and Sutter, 1992) isofrequency representa-tions must include heterotopic cells outside the CF domain asdemonstrated in fine-grain mapping studies where theresponses in single, near-vertical electrode penetrations oftenspan !3 octaves (Imig and Morel, 1985; Morel et al., 1987). Thepresent results suggest that such variability of topographicrepresentation is a natural component of the isofrequencydomain. The same principle of heterotopic origins applies tothe ipsilateral, corticocortical and commissural projections.
Comparison with Other Studies of Thalamocortical ProjectionsThe massive labeling (several thousand cells from even onespatially confined deposit) suggests that the magnitude ofthalamic and cortical projections in older studies that used lesssensitive methods (Winer et al., 1977; Niimi and Matsuoka,1979; Andersen et al., 1980) may have been underestimated.
Figure 5. Schematic models of the auditory thalamocortical projection. (A) Essential and sustaining projections proposed by Rose and Woolsey (1958) suggested the existence ofbranched projections across areas. (B) While unbranched projections within an area predominate, interareal branching was believed to provide substantial input (!15%) (Imig andMorel, 1984). (C) Studies of thalamic projections to binaural subdomains indicate modular specificity of intraareal branching (Middlebrooks and Zook, 1983; Brandner and Redies,1990). (D) Widespread laminar distribution of thalamic input (Huang and Winer, 2000), coupled with the present findings of sparse interareal divergence (present results), suggestthat parallel streams originate from the thalamus and branch specifically within an area to support modular computations. Differences in the thickness of lines represents axons ofdifferent caliber. A similar model has been proposed in the rabbit auditory thalamocortical pathway (Velenovsky et al., 2003).

Cerebral Cortex April 2004, V 14 N 4 449
While many of the projection patterns noted here have beenseen in earlier work, several others have not been previouslydocumented and the robust labeling implies a richness ofconnectivity not evident with other methods.
We found a small projection from the dorsal division to AIand AAF that constituted <10% of the thalamic projection. It isdifficult to compare the present study to prior work (Andersenet al., 1980) since the latter study used tracers which labeledonly a fraction of the thalamocortical connections seen here.Moreover, since thalamic boundaries were not included (e.g.their Figures 8 and 10), any direct comparison is constrained.In contrast, we found only modest input from the dorsal divi-sion to both AI and AAF in all but one experiment. Likewise,another study that used horseradish peroxidase, wheat germagglutinin, or [3H]bovine serum albumin (Morel and Imig,1987) as retrograde tracers, found a different pattern of thal-amocortical projections than we did. For example, they sawlittle labeling in the ventral division with horseradish perox-idase alone and a concentration of cells in the rostral pole ofthe medial geniculate body (their Fig. 12) after 4 tracerdeposits in AAF. Our single, much smaller AAF deposit (Fig.1A,C) produced the same pattern of labeling in the rostral poleof the medial geniculate body and labeled far more cells in theventral division than would have been expected by theprevious studies. We attribute this to the superior sensitivity ofthe newer tracers. Beside the unexpected ventral divisionprojection to AAF, the rostral pole had a larger than predictedinput to AI (Table 3: rostral pole). This suggests a closer align-ment of AI and AAF in their thalamic, but not in their extra-auditory, cortical input (Fig. 4A).
Comparison with Prior Work on Corticocortical ProjectionsPrevious studies showed more restricted corticocorticalorigins (Matsubara and Phillips, 1988; Wallace et al., 1991)than those from our deposits. We found ipsilateral labelingwithin AI and AAF up to 3 mm from the deposits; these hetero-topic projections are far from the deposit sites and well beyondthe boundaries predicted by their CF organization (Fig. 2A,C).The breadth of these intrinsic connections was larger in AAF,suggesting greater convergence of local input to a frequencydomain than in AI.
Other corticocortical retrograde labeling had even moreremote areal origins and was robust. The laminar sources ofthese projections to both fields from outside areas involvemainly the deep cortical layers, which are associated with feed-back connections (Felleman and Van Essen, 1991). This isconsistent with an early position for both AI and AAF in hier-archical models of auditory cortical processing (Rouiller et al.,1991).
Virtually all auditory areas, primary and non-primary,converge upon AI. There is also input unique to AI from non-primary areas related to duration processing (suprasylvianfringe; He et al., 1997) and whose role in AI function isunknown. This implies that AI and AAF cells receive massiveconvergent input complementary to their divergent outputs(Imig and Reale, 1980). The corticocortical connections of AAFalso set it apart from AI. Thus, input to AAF arises from unex-pected sources as remote as the parahippocampal and cingu-late gyri, regions associated with auditory attention (anteriorcingulate gyrus; Benedict et al., 2002; Sevostianov et al., 2002)and learning and memory (parahippocampal gyrus; Burwell,
2002). AI and AAF thus have shared input from tonotopic audi-tory cortical areas, while a different pattern of limbic and peri-auditory input sets AAF apart (Fig. 4A: ipsilateral cortex).
The spatial breadth of these connections might explain whyinactivating one tonotopic field could have so little effect onanother (Kitzes and Hollrigel, 1996), why lesions involvingmany auditory areas (Neff et al., 1975) are required to produceglobal effects on behavior, and they could underlie other func-tional distinctions between AI and AAF (Ehret, 1997).
Branched Axons are Rare in the Auditory ForebrainThe percentage of double labeled neurons in the present studyis much smaller than that seen using other methods (Morel andImig, 1987), despite the fact that our experimental design andthe sensitivity of the tracers ought to have maximized theirnumber and detection. This is consistent with the idea of inde-pendent connectional systems and this principle wasconserved in all three types of connections. This implies afundamental difference between the auditory forebrain and thebrainstem, where axons subdivide profusely to innervate manydifferent targets (Irvine, 1986). Such a pattern would seem toset the auditory forebrain apart from the visual cortex (Bullieret al., 1984).
Functional ImplicationsWe find differences in the CF representations and its distribu-tions in AI and AAF that support the notion of separate func-tional roles. Previous work also noted that AAF neurons haveslightly shorter latencies, lower thresholds, broader tuningcurves and higher spontaneous rates of discharge (Eggermont,1998; Valentine and Eggermont, 2001; Noreña and Eggermont,2002; Imaizumi et al., 2003) than AI neurons. Prospectivedifferences between AI and AAF pertain to responses todynamic stimuli, such as frequency or amplitude modulationsand vocalizations, many aspects of which either remain to bestudied or are inconclusive (Schreiner and Urbas, 1988; Tianand Rauschecker, 1994; Eggermont, 1999). There are also func-tional parallels with tonal receptive field properties in bothareas that are broadly distributed and largely overlapping. Thedifferential homogeneity in AI and AAF frequency gradients(Fig. 1B,D) could either reflect unique inputs from thalamic(Middlebrooks et al., 1980) and/or extrathalamic sources (Fig.4A: AAF) or it might embody intrinsic cortical mechanisms fordifferential task- or context-dependent organizations and repre-sentational modulations (Weinberger, 1998; Kilgard andMerzenich, 2002).
The parallel nature of processing in AI and AAF is alsosupported by findings from cross-correlation analysis (Egger-mont, 2000) that showed higher peak correlation coefficientsfor neurons from within AI, compared to correlations betweenthe two fields. The very modest contribution from branchingaxons to the two fields may account for this difference in intra-versus inter-areal synchrony.
There are many instances of functional modularity in AI,such as binaural bands (Imig and Adrián, 1977) and spectralintegration modules (Schreiner et al., 2000). We find that suchmodularity of receptive field parameters, such as threshold,Q10, Q40 and latency, is less prominent in AAF, extending thefunctional distinctions between fields (Imaizumi et al., 2003).
A functional difference attributed to subcortical processingis the spatial segregation of thalamic binaural input to AI(Middlebrooks and Zook, 1983; Velenovsky et al., 2003) and

450 Concurrent Tonotopic Streams in Auditory Cortex • Lee et al.
analogous commissural segregation (Imig and Adrián, 1977).There is no similar evidence available for AAF. This contrastswith subdivisions in primary visual (areas 17 and 18) andprimary somatosensory (areas 3a and 3b) cortex wheredominant inputs can be traced to segregated subcorticalstreams, e.g. visual X and Y cells (Humphrey et al., 1985a), ormodule-specific segregation of receptor populations, e.g.somatosensory cutaneous and musculoskeletal receptors(Jones and Porter, 1980), that are presumably established inthe periphery. Despite the many parallels between the auditoryand visual systems, emergent global distinctions in the princi-ples organizing thalamic (Huang and Winer, 2000; Smith andPopulin, 2001), corticocortical (Read et al., 2001) and commis-sural pathways (present results), as well as in neuronalmorphology (Winer, 1984b; Smith and Populin, 2001), suggestmodality-specific principles of organization.
Models of Thalamocortical ConnectivityThese results further refine and constrain the models ofconnectivity in the thalamocortical auditory system. From ahistorical perspective, it is possible to identify at least fourmodels of thalamic input (Fig. 5). Single neurons were earlyproposed to have either an essential projection that terminatedin one area and degenerated after large lesions of this area,while sustaining projections were preserved by collaterals toother, intact areas (Fig. 5A) (Rose and Woolsey, 1958). Experi-ments using a dual retrograde tracing strategy with sensitivetracers suggested that this interareal branching contributed asubstantial fraction (!15%) of the thalamocortical input (Fig.5B) (Morel and Imig, 1987). Subsequent work on divergenceled to the idea that aurally specific thalamic neurons project tosimilar functional domains within an area (Fig. 5C) (Middle-brooks and Zook, 1983; Brandner and Redies, 1990; Velen-ovsky et al., 2003). Analyses of the laminar distribution of thethalamic input has also demonstrated a network of input acrossseveral (and sometimes all) cortical layers (Fig. 5D) and findsthat small deposits of anterograde tracers in the thalamus labelhighly divergent cortical terminal zones (Huang and Winer,2000). The present findings suggest that interareal branching issparse and, therefore, likely contributes little to the globaldistribution of information across fields (Fig. 5D). Rather,parallel systems of thalamocortical input terminate in eacharea, where they branch locally and across layers to supportfunctional modularity and subsequent computations. Itremains for future work to elaborate plausible models ofcommissural and ipsilateral corticocortical connectivity as partof a larger paradigm for understanding the ordinal flow of infor-mation through auditory cortex.
NotesWe thank David Fitzpatrick and Edwin Rubel for advice, David Larueand Tania Bettis for histological assistance and Andrew Tan, BenedictePhilibert and Poppy Crum for their participation in the physiologicalrecordings. These studies were supported by National Institutes ofHealth grants R01 DC2260-07 (C.E.S.) and R01 DC2319-24 (J.A.W.).
Address correspondence to Charles C. Lee, Department of Molec-ular and Cell Biology, Division of Neurobiology, Room 285 LSA,University of California at Berkeley, Berkeley, CA 94720-3200, USA.Email: [email protected].
ReferencesAdams JC (1981) Heavy metal intensification of DAB-based HRP
reaction product. J Histochem Cytochem 29:775.
Aitkin LM, Webster WR (1972) Medial geniculate body of the cat:organization and responses to tonal stimuli of neurons in ventraldivision. J Neurophysiol 35:365–380.
Andersen RA, Knight PL, Merzenich MM (1980) The thalamocorticaland corticothalamic connections of AI, AII, and the anterior audi-tory field (AAF) in the cat: evidence for two largely segregatedsystems of connections. J Comp Neurol 194:663–701.
Benedict RHB, Shucard DW, Santa Maria MP, Shucard JL, Abara JP,Coad ML, Wack D, Sawusch J, Lockwood A (2002) Covert auditoryattention generates activation in the rostral/dorsal anterior cingu-late cortex. J Cogn Neurosci 14:637–645.
Brandner S, Redies H (1990) The projection of the medial geniculatebody to field AI: organization in the isofrequency dimension. JNeurosci 10:50–61.
Bullier J, Kennedy H, Salinger W (1984) Bifurcation of subcorticalafferents to visual areas 17, 18, and 19 in the cat cortex. J CompNeurol 228:308–328.
Burwell RD (2002) The parahippocampal region: corticocorticalconnectivity. Ann N Y Acad Sci 911:25–42.
Campbell MJ, Morrison JH (1989) Monoclonal antibody to neurofila-ment protein (SMI-32) labels a subpopulation of pyramidalneurons in the human and monkey neocortex. J Comp Neurol282:191–205.
Chen S, Aston-Jones G (1995) Evidence that cholera toxin B subunit(CTb) can be avidly taken up and transported by fibers of passage.Brain Res 674:107–111.
Diamond IT, Jones EG, Powell TPS (1968) The association connectionsof the auditory cortex of the cat. Brain Res 11:560–579.
Eggermont JJ (1998) Representation of spectral and temporal soundfeatures in three cortical fields of the cat. Similarities outweighdifferences. J Neurophysiol 80:2743–2764.
Eggermont JJ (1999) Neural correlates of gap detection in three audi-tory cortical fields in the cat. J Neurophysiol 81:2570–2581.
Eggermont JJ (2000) Sound-induced synchronization of neural activitybetween and within three auditory cortical areas. J Neurophysiol83:2708–2722.
Ehret G (1997) The auditory cortex. J Comp Physiol A 181:547–557.Felleman, DJ and Van Essen, DC (1991) Distributed hierarchical
processing in the primate cerebral cortex. Cereb Cortex 1:1–47.He J, Hashikawa T, Ojima H, Kinouchi Y (1997) Temporal integration
and duration tuning in the dorsal zone of cat auditory cortex. JNeurosci 17:2615–2625.
Huang CL, Winer JA (2000) Auditory thalamocortical projections inthe cat: laminar and areal patterns of input. J Comp Neurol427:302–331.
Humphrey AL, Sur M, Uhlrich DJ, Sherman SM (1985a) Projectionpatterns of individual X- and Y-cell axons from the lateral genicu-late nucleus to cortical area 17 in the cat. J Comp Neurol233:159–189.
Humphrey AL, Sur M, Uhlrich DJ, Sherman SM (1985b) Terminationpatterns of individual X- and Y-cell axons in the visual cortex of thecat: projections to area 18, to the 17/18 border region, and to bothareas 17 and 18. J Comp Neurol 233:190–212.
Imaizumi K, Priebe NJ, Crum PAC, Bedenbaugh PH, Cheung SW,Schreiner CE (2003) Modular functional organization in catanterior auditory field. Proc Soc Neurosci 29:488.6.
Imig TJ, Adrián HO (1977) Binaural columns in the primary auditoryfield (A1) of cat auditory cortex. Brain Res 138:241–257.
Imig TJ, Brugge JF (1978) Sources and terminations of callosal axonsrelated to binaural and frequency maps in primary auditory cortexof the cat. J Comp Neurol 182:637–660.
Imig TJ, Morel A (1984) Topographic and cytoarchitectonic organiza-tion of thalamic neurons related to their targets in low-, middle-,and high-frequency representations in cat auditory cortex. J CompNeurol 227:511–539.
Imig TJ, Morel A (1985) Tonotopic organization in ventral nucleus ofmedial geniculate body in the cat. J Neurophysiol 53:309–340.
Imig TJ, Reale RA (1980) Patterns of cortico-cortical connectionsrelated to tonotopic maps in cat auditory cortex. J Comp Neurol192:293–332.
Cerebral Cortex April 2004, V 14 N 4 451
Irvine DRF (1986) The auditory brainstem. A review of the structureand function of auditory brainstem processing mechanisms. In:Progress in sensory physiology (Autrum H, Ottoson D, Perl ER,Schmidt RF, Shimazu H, Willis WD, eds), pp. 1–279. Berlin:Springer Verlag.
Jones EG, Porter R (1980) What is area 3a? Brain Res Brain Res Rev2:1–43.
Kawamura K (1973) Corticocortical fiber connections of the cat cere-brum. I. The temporal region. Brain Res 51:1–21.
Kilgard MP, Merzenich MM (1998) Cortical map reorganizationenabled by nucleus basalis activity. Science 279:1714–1718.
Kilgard MP, Merzenich MM (2002) Order-sensitive plasticity in adultprimary auditory cortex. Proc Natl Acad Sci USA 99:3205–3209.
Kitzes LM, Hollrigel GS (1996) Response properties of units in theposterior auditory field deprived of input from the ipsilateralprimary auditory cortex. Hearing Res 100:120–130.
Knight PL (1977) Representation of the cochlea within the anteriorauditory field (AAF) of the cat. Brain Res 130:447–467.
Lee CC, Winer JA (2003) Topographic projections in cat auditorycortex. Proc Soc Neurosci 29:592.15.
Llewellyn-Smith IJ, Minson JB, Wright AP, Hodgson AJ (1990) Choleratoxin B-gold, a retrograde tracer that can be used in light and elec-tron microscopic immunocytochemical studies. J Comp Neurol294:179–191.
Matsubara JA, Phillips DP (1988) Intracortical connections and theirphysiological correlates in the primary auditory cortex (AI) of thecat. J Comp Neurol 268:38–48.
Merzenich MM, Knight PL, Roth GL (1975) Representation of cochleawithin primary auditory cortex in the cat. J Neurophysiol38:231–249.
Middlebrooks JC, Dykes RW, Merzenich MM (1980) Binaural response-specific bands in primary auditory cortex (AI) of the cat: topo-graphic organization orthogonal to isofrequency contours. BrainRes 181:31–48.
Middlebrooks JC, Zook JM (1983) Intrinsic organization of the cat’smedial geniculate body identified by projections to binauralresponse-specific bands in the primary auditory cortex. J Neurosci3:203–225.
Miller LM, Escabí MA, Read HL, Schreiner CE (2001) Functionalconvergence of response properties in the auditory thalamo-cortical system. Neuron 32:151–160.
Morel A, Imig TJ (1987) Thalamic projections to fields A, AI, P, and VPin the cat auditory cortex. J Comp Neurol 265:119–144.
Morel A, Rouiller E, de Ribaupierre Y, de Ribaupierre F (1987)Tonotopic organization in the medial geniculate body (MGB) oflightly anesthetized cats. Exp Brain Res 69:24–42.
Neff WD, Diamond IT, Casseday JH (1975) Behavioral studies of audi-tory discrimination: central nervous system. In: Handbook ofsensory physiology. Vol. V, part 2, auditory system, anatomy,physiology (ear) (Keidel WD, Neff WD, eds), pp. 307–400. Berlin:Springer Verlag.
Niimi K, Matsuoka H (1979) Thalamocortical organization of theauditory system in the cat studied by retrograde axonal transportof horseradish peroxidase. Adv Anat Embryol Cell Biol 57:1–56.
Noreña A, Eggermont JJ (2002) Comparison between local field poten-tials and unit cluster activity in primary auditory cortex andanterior auditory field in the cat. Hearing Res 166:202–213.
Rauschecker JP, Tian B, Pons T, Mishkin M (1997) Serial and parallelprocessing in rhesus monkey auditory cortex. J Comp Neurol382:89–103.
Read HL, Winer JA, Schreiner CE (2001) Modular organization ofintrinsic connections associated with spectral tuning in catauditory cortex. Proc Natl Acad Sci USA 98:8042–8047.
Reale RA, Imig TJ (1980) Tonotopic organization in auditory cortex ofthe cat. J Comp Neurol 182:265–291.
Reid RC, Alonso JM (1995) Specificity of monosynaptic connectionsfrom thalamus to visual cortex. Nature 378:281–284.
Romanski LM, Tian B, Fritz J, Mishkin M, Goldman-Rakic PS,Rauschecker JP (1999) Dual streams of auditory afferents targetmultiple domains in the primate prefrontal cortex. Nat Neurosci2:1131–1136.
Rose JE, Woolsey CN (1958) Cortical connections and functionalorganization of thalamic auditory system of cat. In: Biological andbiochemical bases of behavior (Harlow HF, Woolsey CN, eds), pp.127–150. Madison, WI: University of Wisconsin Press.
Rouiller EM, Simm GM, Villa AEP, de Ribaupierre Y, de Ribaupierre F(1991) Auditory corticocortical interconnections in the cat:evidence for parallel and hierarchical arrangement of the auditorycortical areas. Exp Brain Res 86:483–505.
Ruigrok TJH, Teune TM, van der Burg J, Sabel-Goedknegt H (1995) Aretrograde double-labeling technique for light microscopy. Acombination of axonal transport of cholera toxin B-unit and a gold-lectin conjugate. J Neurosci Meth 61:127–138.
Schreiner CE, Cynader MS (1984) Basic functional organization ofsecond auditory cortical field (AII) of the cat. J Neurophysiol51:1284–1305.
Schreiner CE, Sutter ML (1992) Topography of excitatory bandwidthin cat primary auditory cortex: single-neuron versus multiple-neuron recordings. J Neurophysiol 68:1487–1502.
Schreiner CE, Urbas JV (1988) Representation of amplitude modula-tion in the auditory cortex of the cat. II. Comparison betweencortical fields. Hearing Res 32:49–64.
Schreiner CE, Read HL, Sutter ML (2000) Modular organization offrequency integration in primary auditory cortex. Annu RevNeurosci 23:501–529.
Sevostianov A, Fromm S, Nechaev V, Horwitz B, Braun A (2002) Effectof attention on central auditory processing: an fMRI study. Int JNeurosci 112:587–606.
Smith PH, Populin LC (2001) Fundamental differences between thethalamocortical recipient layers of the cat auditory and visualcortices. J Comp Neurol 436:508–519.
Tian B, Rauschecker JP (1994) Processing of frequency-modulatedsounds in the cat’s anterior auditory field. J Neurophysiol71:1959–1975.
Valentine PA, Eggermont JJ (2001) Spontaneous burst-firing in threeauditory cortical fields: its relation to local field potentials and itseffect on inter-area cross-correlations. Hearing Res 154:146–157.
Velenovsky DS, Cetas JS, Price RO, Sinex DG, McMullen NT (2003)Functional subregions in primary auditory cortex defined bythalamocortical terminal arbors: an electrophysiological andanterograde labeling study. J Neurosci 23:308–316.
Wallace MN, Kitzes LM, Jones EG (1991) Intrinsic inter- andintralaminar connections and their relationship to the tonotopicmap in cat primary auditory cortex. Exp Brain Res 86:527–544.
Weinberger NM (1998) Physiological memory in primary auditorycortex: characteristics and mechanisms. Neurobiol Learn Mem70:226–251.
Winer JA (1984a) Anatomy of layer IV in cat primary auditory cortex(AI). J Comp Neurol 224:535–567.
Winer JA (1984b) Identification and structure of neurons in the medialgeniculate body projecting to primary auditory cortex (AI) in thecat. Neuroscience 13:395–413.
Winer JA, Diamond IT, Raczkowski D (1977) Subdivisions of theauditory cortex of the cat: the retrograde transport of horseradishperoxidase to the medial geniculate body and posterior thalamicnuclei. J Comp Neurol 176:387–418.