concrete coefficient of thermal expansion testing 1 background 1 summary of coefficient of thermal...
TRANSCRIPT

State of California Department of Transportation Office of Concrete Pavements and Pavement Foundations Division of Maintenance
5900 Folsom Blvd. MS#5 Sacramento, CA 95819
April 2014
Concrete Coefficient Of
Thermal Expansion
Testing
i
Table of Contents
Purpose 1
Background 1
Summary of coefficient of thermal expansion results 2
Quarry summary table 2
District summary table 5
Project summary table 5
Coefficient of thermal expansion testing laboratories 7
Quarry test result graphs 8
Sample datasheet 30
Overall results map 31
Mechanistic-Empirical (M-E) design results 32
Conclusions 34
Appendix 1 – Sample report from Darwin M-E 35
Appendix 2 – Comment and Response Table 36

ii
List of Figures Figure 1: CoTE results for Harris Quarry 8
Figure 2: CoTE results for Upton Quarry 9
Figure 3: CoTE results for Hallwood Quarry 10
Figure 4: CoTE results for Perkins Quarry 11
Figure 5: CoTE results for Vernalis Quarry 12
Figure 6: CoTE results for Hanson Quarry 13
Figure 7: CoTE results for Clayton Quarry 14
Figure 8: CoTE results for Sunol Quarry 15
Figure 9: CoTE results for Kerlinger-Huck Quarry 16
Figure 10: CoTE results for Calmat/Sanger Quarry 17
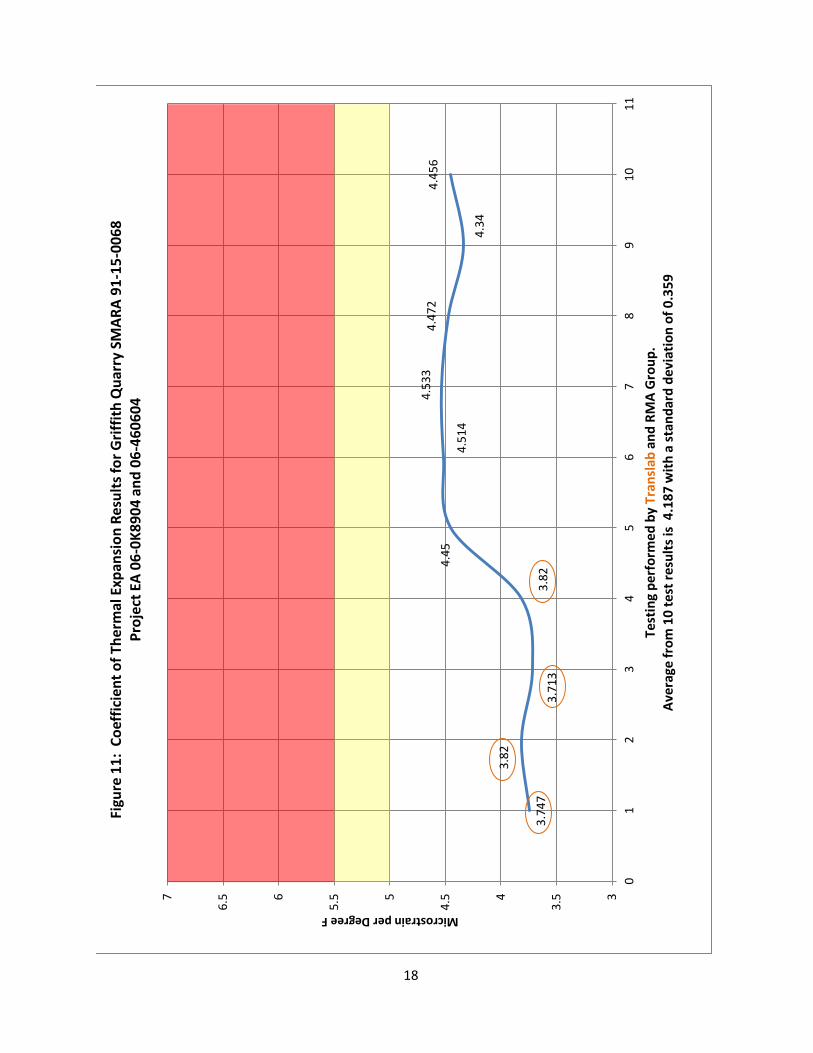
Figure 11: CoTE results for Griffith Quarry 18
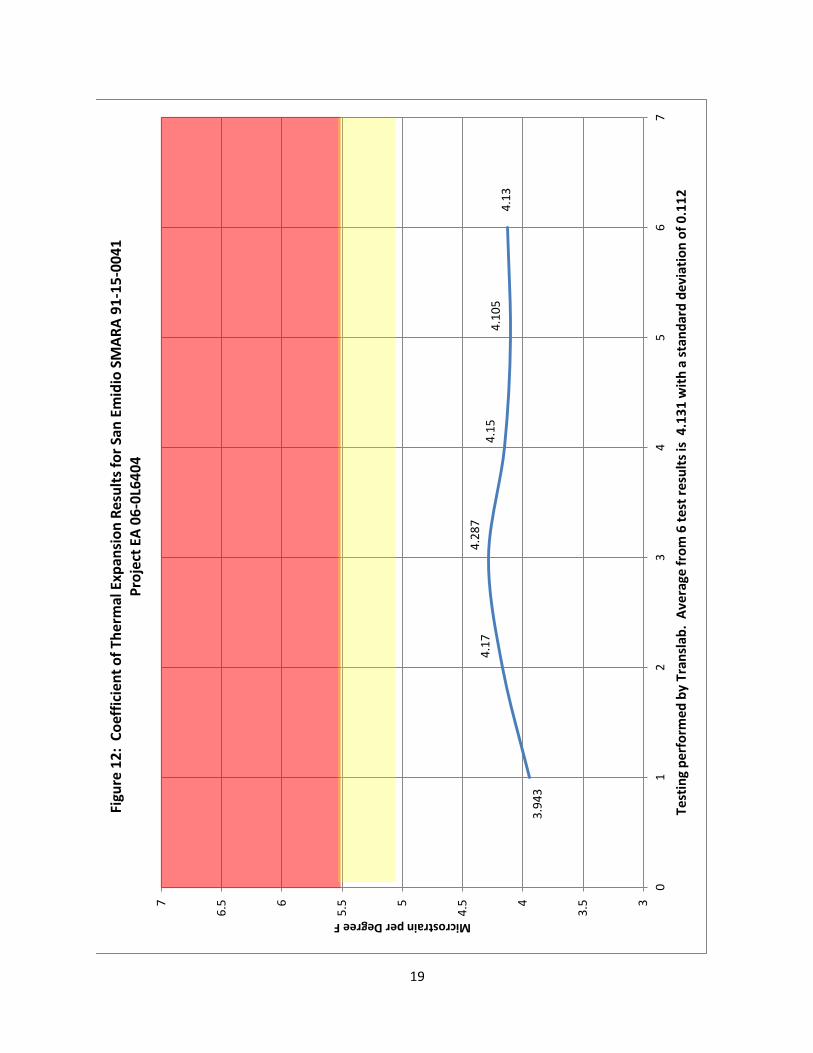
Figure 12: CoTE results for San Emidio Quarry 19
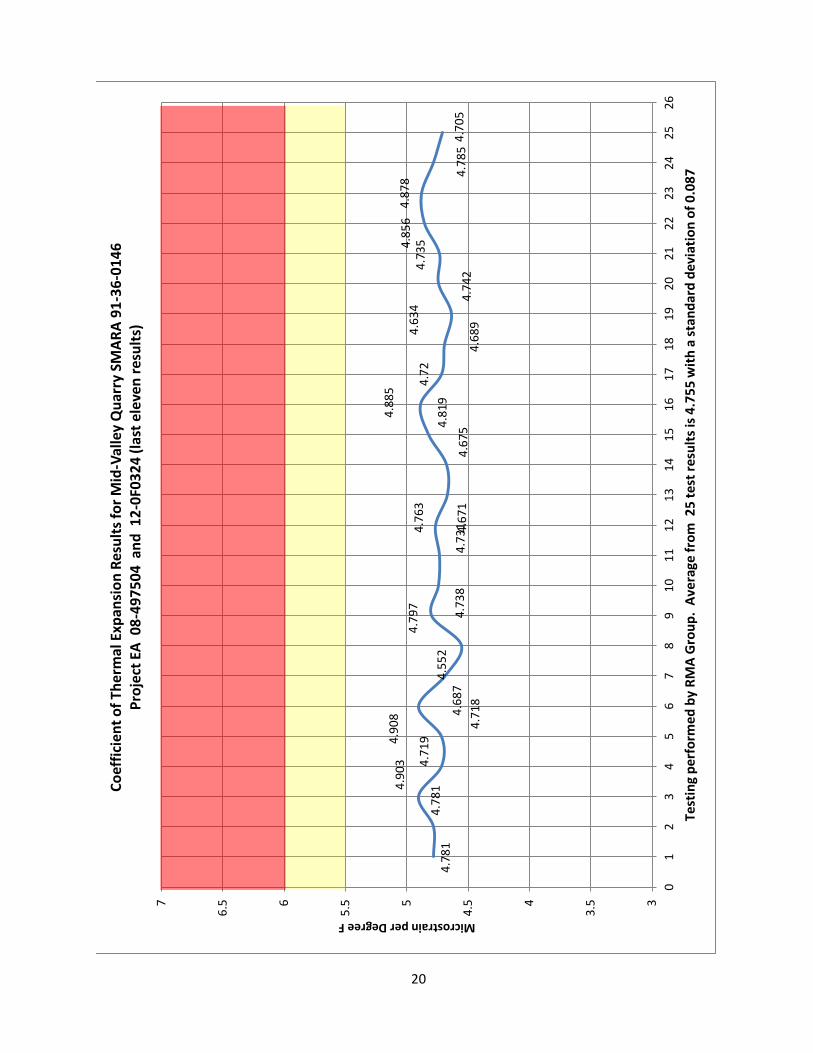
Figure 13: CoTE results for Mid-Valley Quarry 20
Figure 14: CoTE results for Lytle Creek Quarry 21
Figure 15: CoTE results for Foothill Quarry
22
Figure 16: CoTE results for Upland Quarry 23
Figure 17: CoTE results for Cabazon Quarry
24
Figure 18: CoTE results for Dillon Quarry
25
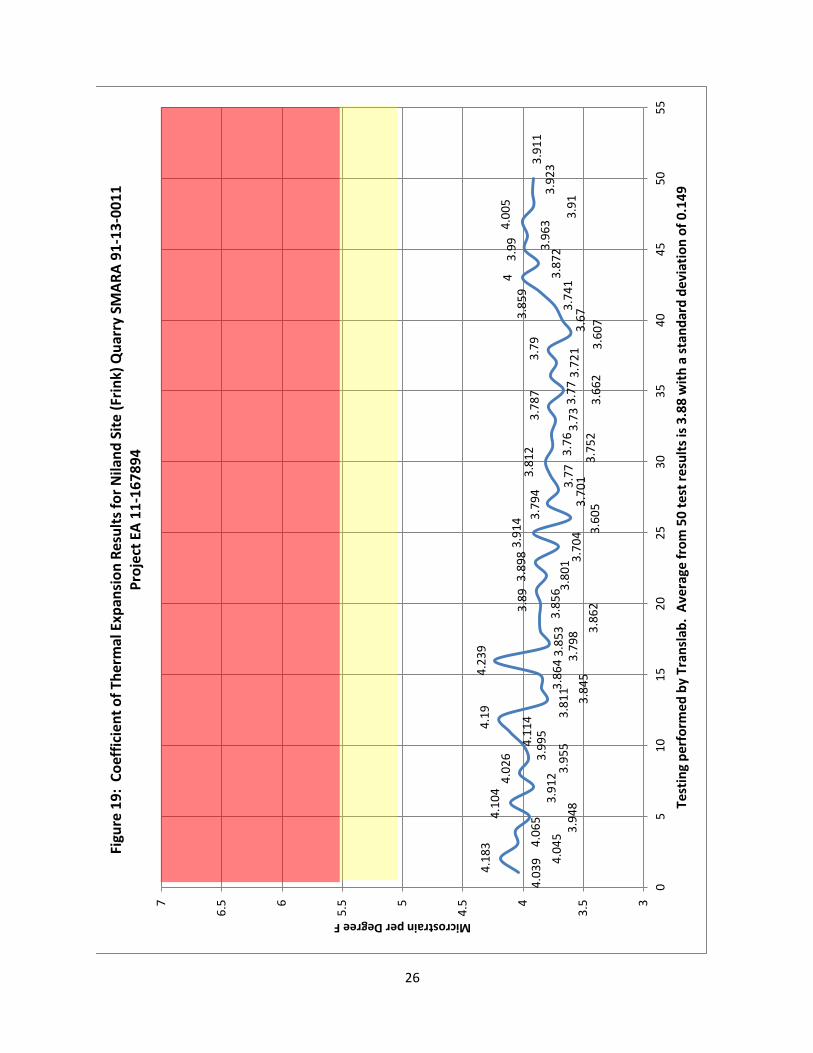
Figure 19: CoTE results for Nilan Site (Frink) Quarry
26
Figure 20: CoTE results for Otay Ranch Quarry 27
Figure 21: CoTE results for Robie Ranch Quarry 28
Figure 21: CoTE results for Hi-Grade Materials Quarry 29

1
Purpose The purpose of the study was to assess what values Caltrans is achieving for concrete coefficient of thermal expansion (CoTE) on construction contracts and whether there are sufficient aggregate sources to achieve the AASHTO recommended CoTE value of 5.5. Also, what is the impact to the pavement design of higher values in order to determine if it is important to measure CoTE for pavement construction. The study has shown that higher values of CoTE have a negative impact on long-term pavement performance. Background Caltrans is adopting Mechanistic-Empirical (M-E) Pavement Design for concrete pavements. M-E pavement design provides the means to predict the performance and durability of pavement using numerical models. CoTE is one of the factors to consider in the design of concrete pavements. Research has shown that the CoTE of a pavement can impact its performance. M-E Design has included CoTE data as an input. CoTE data can be used to help insure that what is built meets the performance intent from design during construction. The new pavement design methodology uses CoTE as an input. It is important to know the variation and acceptance criteria for this factor. The CoTE can be used to improve concrete joint design, calculate stresses, joint sealant design, and selecting sealant materials. CoTE is measured of the change in length of concrete specimens subjected to changes in temperatures, using AASHTO T 336, "Standard Test Method for Coefficient of Thermal Expansion of Hydraulic Cement Concrete." The test method determines the CoTE of a cylindrical concrete specimen with nominal dimensions of a 4-inch diameter and a 7-inch length. The specimen is maintained in a saturated condition and tested by measuring the length change of the specimen over a specified temperature range (50°F to 122°F). Length changes are measured using a submersible linear variable differential transformer (LVDT). The CoTE is calculated according to the following formula: CoTE = (ΔLa/L0) / ΔT Where: ΔLa = length change of specimen, L0 = initial measured length of specimen, and ΔT = temperature change.

2
Summary of Coefficient of Thermal Expansion Test Results
The results of coefficient of thermal expansion testing performed in 2012 and 2013 are summarized in Table 1. The overall average and average for each district are shown in Table 2. Table 3 is a summary by project. The overall result for each aggregate source is shown in the report figures. A typical data sheet from the testing laboratory shows the required inputs for calculating the sample results. Table 1 Summary by Quarry
Source Project EA
No. of Samples
Lowest Value
Highest Value
Ave µε/°F Standard Deviation
*Geologic Code
D01 91-23-0015 (HARRIS QUARRY)
01-480504
2 5.167 5.389 5.278 0.157 KJf
D02 91-47-0016 (UPTON MINE)
02-3E7604
5 4.017 4.132 4.087 0.045 Q
D03 91-34-0006 (PERKINS PLANT)
03-1E6704
2 5.139 5.169 5.154 0.021 Q
D03 91-58-0006 (HALLWOOD PLANT)
03-2C8601
37 4.625 5.583 5.06 0.242 Q
D03 91-39-0002 (VERNALIS)
03-3797U4
14 4.92 5.196 5.03 0.078 Q
D04 91-43-0004 (HANSON PERMANENTE CEMENT PERMANENTE
QUARRY)
04-0120S4
24 4.33 5.583 4.965 0.32 M
D04 91-07-0004 (CLAYTON)
04-2285C4
8 4.351 5.029 4.675 0.219 MzV diabase
D04 91-01-0007 (SUNOL)
04-4470U4
13 4.22 4.98 4.537 0.216 QPc

3
Source Project EA
No. of Samples
Lowest Value
Highest Value
Ave µε/°F Standard Deviation
*Geologic Code
D06 91-15-0068 (GRIFFITH COMPANY)
06-0K8904 06-460604
10 3.713 4.533 4.187 0.359 Qoa
D06 91-15-0041 (SAN EMIDIO)
06-0L6404
6 3.943 4.287 4.131 0.112 Q
D06 91-10-0010 (CALMAT/SANGER)
06-324504
1 4.86 4.86 4.86 N/A Qoa
D07 91-33-0008 (CABAZON QUARRY)
07-184104
2 4.441 4.671 4.556 0.163 Q
D07 91-19-0026 (HI-GRADE QUARRY)
07-199634
4 4.299 5.62 5.132 .575 Q
D08 91-36-0040 (LYTLE CREEK)
08-472224 12-0E5704
36 4.907 4.518 4.707 0.077 Q
D08 91-33-0072 (DILLON (AKA R-C SAND
& GRAVEL))
08-478604
16 3.84 4.17 4.001 0.082 Q
D08 91-36-0146 (MID-VALLEY SANITARY
LANDFILL)
08-497504 12-0F0324
25 4.552 4.908 4.755 0.087 Q
D10 91-39-0014 (KERLINGER - HUCK)
10-0M8004
1 5.54 5.54 5.54 N/A Q

4
Source Project EA
No. of Samples
Lowest Value
Highest Value
Ave µε/°F Standard Deviation
*Geologic Code
D10 91-05-0006 (ROBIE RANCH)
10-0G4704
8 4.811 5.403 5.169 0.190 Qpc
D11 91-13-0011 (NILAND SITE (FRINK))
11-167894
50 3.605 4.239 3.88 0.149 Q
D11 91-37-0035 (OTAY RANCH PIT #11)
11-265304
1 4.587 4.587 4.587 N/A Qoa
D12 91-36-0006 (FOOTHILL QUARRY AND
PLANT)
12-071624
37 4.351 4.917 4.616 0.129 Q
D12 91-36-0014 (UPLAND)
12-071634
10 4.303 4.534 4.42 0.065 Q
*Geologic Code: Kjf - Franciscan Complex: Cretaceous and Jurassic sandstone with smaller amounts of shale, chert, limestone, and conglomerate. Includes Franciscan melange, except where separated. Q - Alluvium, lake, playa, and terrace deposits; unconsolidated and semi-consolidated. Mostly nonmarine, but includes marine deposits near the coast. M - Sandstone, shale, siltstone, conglomerate, and breccia; moderately to well consolidated. MzV - Undivided Mesozoic volcanic and metavolcanic rocks. Andesite and rhyolite flow rocks, greenstone, volcanic breccia and other pyroclastic rocks; in part strongly metamorphosed. Includes volcanic rocks of Franciscan Complex: basaltic pillow lava, diabase, greenstone, and minor pyroclastic rocks. QPc - Pliocene and/or Pleistocene sandstone, shale, and gravel deposits; mostly loosely consolidated. Qoa - Older alluvium, lake, playa, and terrace deposits

5
Table 2 Summary by District District
No. of Projects No. of
Samples Lowest Value
Highest Value
Average Std Dev
D01 - 1 2 5.167 5.389 5.278 0.157 D02 - 1 5 4.017 4.132 4.087 0.045 D03 - 3 53 4.625 5.583 5.055 0.207 D04 - 3 45 4.22 5.583 4.79 0.335 D06 - 4 17 3.713 4.86 4.207 0.325 D07 - 2 6 4.299 5.61 4.94 0.540 D08 - 3 63 3.84 4.908 4.528 0.319 D10 - 2 9 4.811 5.54 5.21 0.217 D11 - 2 51 3.605 4.587 3.894 0.178 D12 - 4 61 4.303 4.917 4.624 0.161
Overall results 312 3.605 5.61 4.578 0.465 Table 3 Summary by Project
Project Aggregate Source
No. of Samples
Lowest Value
Highest Value
Average Std Dev
Testing Lab
01-480504 91-23-0015 (HARRIS QUARRY)
2 5.167 5.389 5.278 0.157 AMEC
D02 91-47-0016 (UPTON MINE)
02-3E7604
5 4.017 4.132 4.087 0.045 RMA Group
03-1E6704 91-34-0006 (PERKINS PLANT)
2 5.139 5.169 5.154 0.021 Twining
03-2C8601 91-58-0006 (HALLWOOD
PLANT)
37 4.625 5.583 5.06 0.242 Twining
03-3797U4 91-39-0002 (VERNALIS)
14 4.92 5.196 5.030 0.078 RMA Group
04-0120S4 91-43-0004(HANSON
PERMANENTE CEMENT PERMANENTE QUARRY)
20 4.873 5.583 5.080 0.202 Twining
04-0120S4 91-43-0004(HANSON
PERMANENTE CEMENT PERMANENTE QUARRY)
4 4.33 4.435 4.392 0.050 Translab
04-2285C4 91-07-0004 (CLAYTON)
8 4.351 5.029 4.675 0.218 Twining

6
Project Aggregate Source
No. of Samples
Lowest Value
Highest Value
Average Std Dev
Testing Lab
04-4470U4 91-01-0007 (SUNOL)
13 4.22 4.98 4.537 0.215 RMA Group
06-0K8904 91-15-0068 (GRIFFITH
COMPANY)
4 3.713 3.82 3.775 0.054 Translab
06-0L6404 91-15-0041 (SAN EMIDIO)
6 3.943 4.287 4.131 0.112 Translab
06-324504 91-10-0010
(CALMAT/SANGER)
1 4.86 4.86 4.86 N/A RMA Group
06-460604 91-15-0068 (GRIFFITH
COMPANY)
6 4.34 4.533 4.461 0.068 RMA Group
07-184104 91-33-0008 (CABAZON
QUARRY)
2 4.441 4.671 4.556 0.163 Twining
07-199634 91-19-0026 (HI-GRADE
QUARRY)
4 4.299 5.62 5.132 .575 Twining
08-472224 91-36-0040 (LYTLE CREEK)
33 4.518 4.843 4.691 0.058 RMA Group
08-478604 91-33-0072 (DILLON (AKA R-C
SAND & GRAVEL))
16 3.84 4.17 4.001 0.082 Translab
08-497504 91-36-0146 (MID-VALLEY
SANITARY LANDFILL)
14 4.552 4.908 4.745 0.092 RMA Group
10-0M8004 91-39-0014 (KERLINGER -
HUCK)
1 5.54 5.54 5.54 N/A CEMEX
10-0G4704 91-05-0006
(ROBIE RANCH)
8 4.811 5.403 5.169 0.190 Twining
11-167894 91-13-0011 (NILAND SITE
(FRINK))
50 3.605 4.239 3.88 0.149 Translab
11-265304 91-37-0035 (OTAY RANCH PIT
#11)
1 4.587 4.587 4.587 N/A RMA Group
12-0E5704 91-36-0040 (LYTLE CREEK)
3 4.832 4.907 4.878 0.04 RMA Group

7
Project Aggregate Source
No. of Samples
Lowest Value
Highest Value
Average Std Dev
Testing Lab
12-071624 91-36-0006 (FOOTHILL QUARRY AND PLANT)
37 4.351 4.917 4.616 0.129 Twining
12-071634 91-36-0014 (UPLAND)
10 4.303 4.534 4.42 0.065 Leighton
12-0F0324 91-36-0146 (MID-VALLEY
SANITARY LANDFILL)
11 4.634 4.885 4.768 0.083 RMA Group
Coefficient of Thermal Expansion Testing Laboratories
Caltrans-DES METS TRANSLAB, MS 5 5900 Folsom Blvd, Sacramento, CA 95819-4612 Twining 2883 East Spring Street Suite 300, Long Beach, CA 90806 RMA Group 3150 Fitzgerald Road, Rancho Cordova, CA 95742 Leighton Consulting Inc. (Smith-Emery Lab) 17781 Cowan, Irvine, CA 92614 AMEC 9177 Sky Park Court, San Diego, CA 92123 CEMEX Tampa Technical Center 6725 78th Street, Riverview, FL 33578

5.38
9 5.
167
3
3.5 4
4.5 5
5.5 6
6.5 7
1 2
Microstrain per Degree F
Test
ing
perf
orm
ed b
y Am
ec.
Aver
age
from
2 te
st re
sults
is 5
.278
with
a st
anda
rd d
evia
tion
of 0
.157
Figu
re 1
: Co
effic
ient
of T
herm
al E
xpan
sion
Res
ults
for H
arris
Qua
rry
SMAR
A 91
-23-
0015
Pr
ojec
t EA
01-4
8050
4
8

4.10
6 4.
017
4.11
3 4.
069
4.13
2
3
3.5 4
4.5 5
5.5 6
6.5 7
1 2
3 4
5
Microstrain per Degree F
Test
ing
perf
orm
ed b
y RM
A G
roup
. Av
erag
e fr
om 5
test
resu
lts is
4.0
87 w
ith a
stan
dard
dev
iatio
n of
0.0
46
Figu
re 2
: Co
effic
ient
of T
herm
al E
xpan
sion
Res
ults
for U
pton
Qua
rry
SMAR
A 91
-47-
0016
Pr
ojec
t EA
02-3
E760
4
9

4.99
4.62
5 4.91
7 4.72
4 4.89
6 5.08
3 4.95
1 5.19
4 5.01
8 4.94
1 4.99
5.07
5.44
4
4.91
9 4.83
8 5.02
2
4.89
3 4.87
3 4.72
9 4.96
1 4.96
6 4.
966
5.58
3 5.44
6 5.36
1 5.51
4.90
6 4.91
1 5.02
5.44
6
5.58
3 5.16
1 5.05
3 5.05
3 5.30
1 4.91
7 4.94
3
3.5 4
4.5 5
5.5 6
6.5 7
0 5
10
15
20
25
30
35
40
Microstrain per Degree F
Test
ing
perf
orm
ed b
y Tw
inin
g. A
vera
ge fr
om 3
7 te
st re
sults
is 5
.06
with
a st
anda
rd d
evia
tion
of 0
.242
Figu
re 3
: Co
effic
ient
of T
herm
al E
xpan
sion
for H
allw
ood
Qua
rry
SMAR
A 91
-58-
0006
Pr
ojec
t EA
03-2
C860
1
10

5.16
9 5.
139
3
3.5 4
4.5 5
5.5 6
6.5 7
1 2
Microstrain per Degree F
Test
ing
perf
orm
ed b
y Tw
inin
g. A
vera
ge fr
om 2
test
resu
lts is
5.1
54 w
ith a
stan
dard
dev
iatio
n of
0.0
21
Figu
re 4
: Co
effic
ient
of T
herm
al E
xpan
sion
Res
ults
for P
erki
ns Q
uarr
y SM
ARA
91-3
4-00
06
Proj
ect E
A 03
-1E6
704
11

4.92
4.
931 5.
196 5.
017
5.02
4 5.
068
4.98
5.03
8
4.97
8
5.08
8
4.93
5
5.11
3
5.08
5
5.04
6
3
3.5 4
4.5 5
5.5 6
6.5 7
0 1
2 3
4 5
6 7
8 9
10
11
12
13
14
15
Microstrain per Degree F
Test
ing
perf
orm
ed b
y RM
A G
roup
. Av
erag
e fr
om 1
4 te
st re
sults
is 5
.03
with
a st
anda
rd d
evia
tion
of 0
.078
Figu
re 5
: Co
effic
ient
of T
herm
al E
xpan
sion
Res
ults
for V
erna
lis Q
uarr
y SM
ARA
91-3
9-00
02
Proj
ect E
A 03
-379
7U4
12

5.02
2 5.36
1 5.30
1 4.89
3
4.96
6
4.37
3 4.33
4.43
5 4.
43
4.87
3 5.
022
4.91
7 4.94
1 5.05
3 5.
161
4.89
3
4.96
6
5.03
5 4.91
7
4.94
5.16
9 5.
139
5.58
3
5.44
6
3
3.5 4
4.5 5
5.5 6
6.5 7
0 5
10
15
20
25
Microstrain per Degree F
Test
ing
perf
orm
ed b
y Tw
inin
g an
d Tr
ansl
ab.
Aver
age
from
24
test
resu
lts is
4.9
65 w
ith a
stan
dard
dev
iatio
n of
0.
32
Figu
re 6
: Co
effic
ient
of T
herm
al E
xpan
sion
Res
ults
for H
anso
n Q
uarr
y SM
ARA
91-4
3-00
04
Proj
ect E
A 04
-012
0S4
13

4.35
1
4.68
5
5.02
9 4.
916
4.71
9 4.
555
4.64
1 4.
507
3
3.5 4
4.5 5
5.5 6
6.5 7
0 1
2 3
4 5
6 7
8 9
Microstrain per Degree F
Test
ing
perf
orm
ed b
y Tw
inin
g. A
vera
ge fr
om 8
test
resu
lts is
4.6
75 w
ith a
stan
dard
dev
iatio
n of
0.2
18
Figu
re 7
: Co
effic
ient
of T
herm
al E
xpan
sion
Res
ults
for C
layt
on Q
uarr
y SM
ARA
91-0
7-00
04
Proj
ect E
A 04
-228
5C4
14

4.32
4.
32
4.45
4.74
4.
56
4.51
4.56
4.
59
4.84
4.98
4.4
4.49
4.22
3
3.5 4
4.5 5
5.5 6
6.5 7
0 1
2 3
4 5
6 7
8 9
10
11
12
13
14
Microstrain per Degree F
Test
ing
perf
orm
ed b
y RM
A G
roup
. Av
erag
e fr
om 1
3 te
st re
sults
is 4
.537
with
a st
anda
rd d
evia
tion
of 0
.215
Figu
re 8
: Co
effic
ient
of T
herm
al E
xpan
sion
Res
ults
for S
unol
Qua
rry
SMAR
A 91
-01-
0007
Pr
ojec
t EA
04-4
470U
4
15

5.54
3
3.5 4
4.5 5
5.5 6
6.5 7
Microstrain per Degree F
Test
ing
perf
orm
ed b
y CE
MEX
. 1
test
resu
lt w
ith a
val
ue o
f 5.5
4
Figu
re 9
: Co
effic
ient
of T
herm
al E
xpan
sion
Res
ult f
or K
erlin
ger-
Huck
Qua
rry
SMAR
A 91
-39-
0014
Pr
ojec
t EA
10-0
M80
04
16

4.86
3
3.5 4
4.5 5
5.5 6
6.5 7
Microstrain per Degree F
Test
ing
perf
orm
ed b
y RM
A G
roup
. 1
test
resu
lt w
ith a
val
ue o
f 4.8
6
Figu
re 1
0: C
oeff
icie
nt o
f The
rmal
Exp
ansi
on R
esul
t for
Cal
mat
/San
ger Q
uarr
y SM
ARA
91-1
0-00
10
Proj
ect E
A 06
-324
504
17
3.74
7
3.82
3.71
3 3.
82 4.
45
4.51
4
4.53
3 4.
472
4.34
4.45
6
3
3.5 4
4.5 5
5.5 6
6.5 7
0 1
2 3
4 5
6 7
8 9
10
11
Microstrain per Degree F
Test
ing
perf
orm
ed b
y Tr
ansl
ab a
nd R
MA
Gro
up.
Aver
age
from
10
test
resu
lts is
4.1
87 w
ith a
stan
dard
dev
iatio
n of
0.3
59
Figu
re 1
1: C
oeff
icie
nt o
f The
rmal
Exp
ansi
on R
esul
ts fo
r Grif
fith
Qua
rry
SMAR
A 91
-15-
0068
Pr
ojec
t EA
06-0
K890
4 an
d 06
-460
604
18
3.94
3
4.17
4.
287
4.15
4.
105
4.13
3
3.5 4
4.5 5
5.5 6
6.5 7
0 1
2 3
4 5
6 7
Microstrain per Degree F
Test
ing
perf
orm
ed b
y Tr
ansl
ab.
Aver
age
from
6 te
st re
sults
is 4
.131
with
a st
anda
rd d
evia
tion
of 0
.112
Figu
re 1
2: C
oeff
icie
nt o
f The
rmal
Exp
ansi
on R
esul
ts fo
r San
Em
idio
SM
ARA
91-1
5-00
41
Proj
ect E
A 06
-0L6
404
19
4.78
1 4.
781 4.
903 4.
719
4.71
8
4.90
8 4.68
7 4.
552
4.79
7
4.73
8 4.
731 4.
763
4.67
1 4.
675 4.
819
4.88
5 4.72
4.68
9 4.63
4
4.74
2 4.73
5 4.85
6 4.
878 4.
785
4.70
5
3
3.5 4
4.5 5
5.5 6
6.5 7
0 1
2 3
4 5
6 7
8 9
10
11
12
13
14
15
16
17
18
19
20
21
22
23
24
25
26
Microstrain per Degree F
Test
ing
perf
orm
ed b
y RM
A G
roup
. Av
erag
e fr
om 2
5 te
st re
sults
is 4
.755
with
a st
anda
rd d
evia
tion
of 0
.087
Coef
ficie
nt o
f The
rmal
Exp
ansi
on R
esul
ts fo
r Mid
-Val
ley
Qua
rry
SMAR
A 91
-36-
0146
Pr
ojec
t EA
08-
4975
04 a
nd 1
2-0F
0324
(las
t ele
ven
resu
lts)
20

4.66
6 4.73
4.67
4 4.78
2 4.
735
4.70
8
4.68
3
4.69
5 4.71
5 4.69
6 4.70
8 4.71
4.51
8 4.66
5 4.65
8
4.67
8 4.68
4.72
9
4.71
7 4.84
3
4.70
1 4.70
3
4.77
1 4.
672
4.60
7 4.70
8 4.
732
4.66
1 4.
589 4.
616
4.64
2 4.68
3
4.73
4 4.90
7 4.83
2 4.
894
3
3.5 4
4.5 5
5.5 6
6.5 7
0 5
10
15
20
25
30
35
40
Microstrain per Degree F
Test
ing
perf
orm
ed b
y RM
A G
roup
. Av
erag
e fr
om 3
6 te
st re
sults
is 4
.707
with
a st
anda
rd d
evia
tion
of 0
.077
Figu
re 1
4: C
oeff
icie
nt o
f The
rmal
Exp
ansi
on R
esul
ts fo
r Lyt
le C
reek
Qua
rry
SMAR
A 91
-36-
0040
Pr
ojec
t EA
08-4
7222
4 an
d 12
-057
04 (l
ast t
hree
resu
lts)
21

4.62
1 4.64
1 4.65
1 4.55
5 4.70
9 4.67
8
4.50
7 4.52
4.43
5 4.44
7 4.47
5
4.54
1 4.
719 4.35
1 4.63
9 4.50
6
4.62
1
4.50
7
4.91
7 4.47
5 4.43
5 4.52
4.68
7
4.65
4.91
6 4.61
6
4.68
4 4.61
6 4.71
7 4.62
1
4.66
4 4.50
7 4.61
6
4.79
8 4.69
9 4.78
7 4.74
9
3
3.5 4
4.5 5
5.5 6
6.5 7
0 5
10
15
20
25
30
35
40
Microstrain per Degree F
Test
ing
perf
orm
ed b
y Tw
inin
g. A
vera
ge fr
om 3
7 te
st re
sults
is 4
.616
with
a st
anda
rd d
evia
tion
of 0
.129
Figu
re 1
5: C
oeff
icie
nt o
f The
rmal
Exp
ansi
on R
esul
ts fo
r Foo
thill
Qua
rry
SMAR
A 91
-36-
0006
Pr
ojec
t EA
12-0
7162
4
22

4.43
9 4.
418
4.36
6 4.
413
4.39
6
4.49
6
4.44
2
4.53
4
4.39
1
4.30
3
3
3.5 4
4.5 5
5.5 6
6.5 7
1 2
3 4
5 6
7 8
9 10
Microstrain per Degree F
Test
ing
perf
orm
ed b
y Le
ight
on.
Aver
age
from
10
test
resu
lts is
4.4
2 w
ith a
stan
dard
dev
iatio
n of
0.0
65
Figu
re 1
6: C
oeff
icie
nt o
f The
rmal
Exp
ansi
on R
esul
ts fo
r Upl
and
Qua
rry
SMAR
A 91
-36-
0014
Pr
ojec
t EA
12-0
7163
4
23

4.44
1
4.67
1
3
3.5 4
4.5 5
5.5 6
6.5 7
1 2
Microstrain per Degree F
Test
ing
perf
orm
ed b
y Tw
inin
g. A
vera
ge fr
om 2
test
resu
lts is
4.5
56 w
ith a
stan
dard
dev
iatio
n of
0.1
63
Figu
re 1
7: C
oeff
icie
nt o
f The
rmal
Exp
ansi
on R
esul
ts fo
r Cab
azon
Qua
rry
SMAR
A 91
-33-
0008
Pr
ojec
t EA
07-1
8410
4
24

3.95
5
4.08
3.97
3.95
4.
094
4.04
3.
968
4.01
3.93
7
3.99
4.11
4.17
3.97
9
3.92
3.84
4
3
3.5 4
4.5 5
5.5 6
6.5 7
0 1
2 3
4 5
6 7
8 9
10
11
12
13
14
15
16
17
Microstrain per Degree F
Test
ing
perf
orm
ed b
y Tr
ansl
ab.
Aver
age
from
16
test
resu
lts is
4.0
01 w
ith a
stan
dard
dev
iatio
n of
0.0
82
Figu
re 1
8: C
oeff
icie
nt o
f The
rmal
Exp
ansi
on R
esul
ts fo
r Dill
on Q
uarr
y SM
ARA
91-3
3-00
72
Proj
ect E
A 0
8-47
8604
25
4.03
9 4.18
3
4.04
5 4.06
5
3.94
8
4.10
4 3.91
2 4.02
6
3.95
5
3.99
5 4.
114 4.19
3.81
1 3.
845
3.86
4
4.23
9
3.79
8 3.
853 3.
862
3.85
6
3.89
3.80
1
3.89
8 3.70
4
3.91
4
3.60
5
3.79
4
3.70
1 3.77
3.81
2
3.75
2
3.76
3.73
3.78
7 3.66
2
3.77
3.7
21
3.79
3.60
7 3.67
3.74
1
3.85
9 4 3.
872 3.99
3.96
3 4.00
5
3.91
3.92
3 3.91
1
3
3.5 4
4.5 5
5.5 6
6.5 7
0 5
10
15
20
25
30
35
40
45
50
55
Microstrain per Degree F
Test
ing
perf
orm
ed b
y Tr
ansl
ab.
Aver
age
from
50
test
resu
lts is
3.8
8 w
ith a
stan
dard
dev
iatio
n of
0.1
49
Figu
re 1
9: C
oeff
icie
nt o
f The
rmal
Exp
ansi
on R
esul
ts fo
r Nila
nd S
ite (F
rink)
Qua
rry
SMAR
A 91
-13-
0011
Pr
ojec
t EA
11-1
6789
4
26

4.58
7
3
3.5 4
4.5 5
5.5 6
6.5 7
Microstrain per Degree F
Test
ing
perf
orm
ed b
y RM
A G
roup
. 1
test
resu
lt w
ith a
val
ue o
f 4.5
87
Figu
re 2
0: C
oeff
icie
nt o
f The
rmal
Exp
ansi
on R
esul
t for
Ota
y Ra
nch
Qua
rry
SMAR
A 91
-37-
0035
Pr
ojec
t EA
11-2
6530
4
27

5.27
8 5.
263
5.27
5.
403
5.23
5.10
9 4.
99
4.81
1
3
3.5 4
4.5 5
5.5 6
6.5 7
0 1
2 3
4 5
6 7
8 9
Microstrain per Degree F
Test
ing
perf
orm
ed b
y Tw
inin
g. A
vera
ge fr
om 8
test
resu
lts is
5.1
69 w
ith a
stan
dard
dev
iatio
n of
0.1
90
Figu
re 2
1: C
oeff
icie
nt o
f The
rmal
Exp
ansi
on R
esul
ts fo
r Rob
ie R
anch
Qua
rry
SMAR
A 91
-06-
0006
Pr
ojec
t EA
10-0
G47
04
28

4.29
9
5.36
1
5.61
5.25
6
3
3.5 4
4.5 5
5.5 6
6.5 7
0 1
2 3
4 5
Microstrain per Degree F
Test
ing
perf
orm
ed b
y Tw
inin
g. A
vera
ge fr
om 4
test
resu
lts is
5.1
32 w
ith a
stan
dard
dev
iatio
n of
0.5
75
Coef
ficie
nt o
f The
rmal
Exp
ansi
on R
esul
ts fo
r Hi-G
rade
Qua
rry
SMAR
A 91
-19-
0026
Pr
ojec
t EA
07-1
9963
4
29

30

31

Mechanistic-Empirical (M-E) Design Results
Mechanistic-Empirical (M-E) Design methodology is based on software-generated pavement responses (stresses, strains, and deflections) computed using detailed traffic loading, material properties, and environmental data. The responses are used to compute incremental damage over time. Pavement designs are analyzed using an iterative process based on analysis software results for trial pavement structures proposed by the designer. A trial design is analyzed for adequacy against input performance criteria. The output of the analysis software is a prediction of distresses and smoothness against set reliability values. If the predictions do not meet the desired performance criteria at the given reliability, the trial design is revised and the evaluation is repeated. The analysis software used in this study is DARWIN-ME from the American Association of State Highway and Transportation Officials (AASHTO). DARWIN-ME analysis is based upon the AASHTO Mechanistic-Empirical Pavement Design Guide. The effect of CoTE on pavement performance using DARWIN-ME analysis is summarized in the tables below. CRCP with an analysis period of 50 years was evaluated for three climate regions. The objective is to determine the minimum thickness of concrete pavement that will meet the performance requirements defined by the Caltrans Highway Design Manual. JPCP with an analysis period of 40 years was evaluated for the same three climate regions. The JPCP was evaluated for a joint spacing of 13.5 and 12.5 feet.
CRCP Thickness
CoTE Minimum Thickness to Meet Performance Thresholds (in.)
South Coast Inland Valley High Mountain 3.0 8 8 10B 3.5 8 8 10B 4.0 8 9B 11B 4.5 8 10B 11B 5.0 9B 10B 11B 5.5 10B 10B 12B 6.0 10B 11B 12B 6.5 10B 11B 12B 7.0 11B 11B 12B 7.5 11B 11B 13B 8.0 11B 12B 13B
Minimum thickness to prevent: A-Failure of IRI limit (160 in/mi), B-Failure of punchout limit (1/mi)
32

JPCP Thickness with 13.5 ft joint spacing and 1.5 in. dia. dowels for thickness ≥11 in.
CoTE Minimum Thickness to Meet Performance Thresholds (in.)
South Coast Inland Valley High Mountain 3.0 8C 9C 11A 3.5 9C 9C 11A 4.0 9C 9C 12A 4.5 9C 10C 13A 5.0 9A,C 11B 14A 5.5 11B,C 12C 16A 6.0 12C 14C 17A,B 6.5 14C 15C 20A,B 7.0 14C 15C N/A 7.5 15C 16C N/A 8.0 15C 16B,C N/A
Minimum thickness to prevent: A-Failure of IRI limit (160 in/mi), B-Failure of mean joint faulting (0.10 in), C- Failure of transverse cracking (10%)
JPCP Thickness with 12.5 ft joint spacing and 1.5 in. dia. dowels for thickness ≥11 in.
CoTE Minimum Thickness to Meet Performance Thresholds (in.)
South Coast Inland Valley High Mountain 3.0 8C 8C 10A 3.5 8C 9C 11C 4.0 9C 9C 11C 4.5 9C 9C 13A 5.0 9C 10C 14A 5.5 11C 12C 15A 6.0 12C 14C 16A 6.5 14C 15C 18A 7.0 14C 15C 20A,B 7.5 15C 16C N/A 8.0 15C 16C N/A
Minimum thickness to prevent: A-Failure of IRI limit (160 in/mi), B-Failure of mean joint faulting (0.10 in), C- Failure of transverse cracking (10%)
33

Conclusions The results from this study compare favorably with the results obtained by the University of California Pavement Research Center (UCPRC) in a report prepared for the Transportation Research Board. UCPRC used the testing method based on AASHTO TP-60. CoTE values obtained from 74 cores ranges from 4.5 to 6.7 microstrain/°F. Specimens from four Caltrans Districts were compared and it was concluded that concretes in the coastal region have lower CTE compared to concretes in the north, south, and valley areas. CTE values from contiguous pavement sections up to 6 miles long reveal a typical variability of approximately 0.5 microstrain/°F. The Caltrans study collected data from 312 cast specimens and drilled cores from 25 construction projects from 10 Districts. Six different testing laboratories were used including equipment at the Transportation Laboratory (TRANSLAB). Caltrans used the updated testing method based on AASHTO TP-336. The CoTE values range from 3.605 to 5.583 microstrain/°F. The overall average value for CoTE is 4.578 microstrain/°F with a variability of approximately 0.5 microstrain/°F. Based on the results of the testing: 1 – A CoTE of 5.5 is very achievable in California 2 - There is a loss of performance above 5.5 so allowing higher values would create added cost based on added thickness required when using higher CoTE. 3 - There is some variability in the test results which can be compensated for by testing mix several times and take average. The department is planning to conduct round robin testing to check variability of results from different testing laboratories using the same samples. Caltrans is pursuing the recommendation for using CoTE data to optimize pavement design. The department has decided against implementing CoTE as an acceptance criteria for field qualification of concrete mix designs.
34

Design Inputs
Age (year) Heavy Trucks (cumulative)
2006 (initial) 9,0002026 (20 years) 46,496,8002046 (40 years) 148,377,000
TrafficDesign Structure
Layer type Material Type Thickness (in.):PCC 11.0Stabilized 6.0NonStabilized 6.0Subgrade Semi-infinite
Joint Design:Joint spacing (ft) 12.5Dowel diameter (in.) 1.50Slab width (ft) 12.0
Distress TypeDistress @ Specified
Reliability Reliability (%) Criterion Satisfied?
Target Predicted Target AchievedTerminal IRI (in./mile) 160.00 117.09 90.00 99.70 Pass
Mean joint faulting (in.) 0.10 0.06 90.00 99.73 Pass
JPCP transverse cracking (percent slabs) 10.00 6.54 90.00 97.90 Pass
Distress Prediction Summary
Distress Charts
Jointed Plain Concrete Pavement (JPCP)
Design Type:40 yearsDesign Life:
October, 2006Traffic opening:Pavement construction: September, 2006
- Existing construction: Climate Data Sources (Lat/Lon)
32.572, -116.979
Design Outputs
JPCP South Coast CTE 5.5 Thk 11 JS 12.5File Name: D:\2013\PvD\SC_12.5\JPCP South Coast CTE 5.5 Thk 11 JS 12.5.dgpx
Report generated on: 10/15/2013 1:48 PM Page 1 of 15
by: on: 10/14/2013 12:00 AM on: 10/14/2013 12:00 AM
by: Created Approved

Traffic Volume Monthly Adjustment Factors
Class 4 Class 5 Class 6 Class 7 Class 8 Class 9 Class 10 Class 11 Class 12 Class 13
Graphical Representation of Traffic Inputs
Traffic Inputs
Operational speed (mph) 65.0
Percent of trucks in design direction (%): 50.095.02 Percent of trucks in design lane (%):Number of lanes in design direction:
9,000Initial two-way AADTT:
JPCP South Coast CTE 5.5 Thk 11 JS 12.5File Name: D:\2013\PvD\SC_12.5\JPCP South Coast CTE 5.5 Thk 11 JS 12.5.dgpx
Report generated on: 10/15/2013 1:48 PM Page 2 of 15
by: on: 10/14/2013 12:00 AM on: 10/14/2013 12:00 AM
by: Created Approved

Traffic WanderMean wheel location (in.)
Traffic wander standard deviation (in.)Design lane width (ft)
18
1012
Axle ConfigurationAverage axle width (ft) 8.5
Dual tire spacing (in.)Tire pressure (psi)
12120
Average Axle SpacingTandem axle spacing (in.)Tridem axle spacing (in.)Quad axle spacing (in.)
51.6
49.2
49.2
Wheelbase
ShortAxle Type
Value Type Medium Long
1512Average spacing of axles (ft) 18
Percent of Trucks (%) 33 3433
Number of Axles per Truck
Vehicle Class
Single Axle
Tandem Axle
Tridem Axle
Quad Axle
Class 4 1.62 0.39 0 0Class 5 2 0 0 0Class 6 1.02 0.99 0 0Class 7 1 0.26 0.83 0Class 8 2.38 0.67 0 0Class 9 1.13 1.93 0 0
Class 10 1.19 1.09 0.89 0Class 11 4.29 0.26 0.06 0Class 12 3.52 1.14 0.06 0Class 13 2.15 2.13 0.35 0
Axle Configuration
Volume Monthly Adjustment Factors Level 3: Default MAF
Month Vehicle Class4 5 6 7 8 9 10 11 12 13
January 1.0 1.0 1.0 1.0 1.0 1.0 1.0 1.0 1.0 1.0February 1.0 1.0 1.0 1.0 1.0 1.0 1.0 1.0 1.0 1.0March 1.0 1.0 1.0 1.0 1.0 1.0 1.0 1.0 1.0 1.0April 1.0 1.0 1.0 1.0 1.0 1.0 1.0 1.0 1.0 1.0May 1.0 1.0 1.0 1.0 1.0 1.0 1.0 1.0 1.0 1.0June 1.0 1.0 1.0 1.0 1.0 1.0 1.0 1.0 1.0 1.0July 1.0 1.0 1.0 1.0 1.0 1.0 1.0 1.0 1.0 1.0August 1.0 1.0 1.0 1.0 1.0 1.0 1.0 1.0 1.0 1.0September 1.0 1.0 1.0 1.0 1.0 1.0 1.0 1.0 1.0 1.0October 1.0 1.0 1.0 1.0 1.0 1.0 1.0 1.0 1.0 1.0November 1.0 1.0 1.0 1.0 1.0 1.0 1.0 1.0 1.0 1.0December 1.0 1.0 1.0 1.0 1.0 1.0 1.0 1.0 1.0 1.0
Distributions by Vehicle Class
Growth Factor
Rate (%) Function4% Compound4% Compound4% Compound4% Compound4% Compound4% Compound4% Compound4% Compound4% Compound4% Compound
Vehicle ClassAADTT
Distribution (%) (Level 3)
Class 4 1.8%Class 5 24.6%Class 6 7.6%Class 7 0.5%Class 8 5%Class 9 31.3%Class 10 9.8%Class 11 0.8%Class 12 3.3%Class 13 15.3%
Truck Distribution by Hour
Hour Distribution (%)
12 AM 2.3%1 AM 2.3%2 AM 2.3%3 AM 2.3%4 AM 2.3%5 AM 2.3%6 AM 5%7 AM 5%8 AM 5%9 AM 5%10 AM 5.9%11 AM 5.9%
Hour Distribution (%)
12 PM 5.9%1 PM 5.9%2 PM 5.9%3 PM 5.9%4 PM 4.6%5 PM 4.6%6 PM 4.6%7 PM 4.6%8 PM 3.1%9 PM 3.1%10 PM 3.1%11 PM 3.1%Total 100%
Tabular Representation of Traffic Inputs
JPCP South Coast CTE 5.5 Thk 11 JS 12.5File Name: D:\2013\PvD\SC_12.5\JPCP South Coast CTE 5.5 Thk 11 JS 12.5.dgpx
Report generated on: 10/15/2013 1:48 PM Page 3 of 15
by: on: 10/14/2013 12:00 AM on: 10/14/2013 12:00 AM
by: Created Approved

AADTT (Average Annual Daily Truck Traffic) Growth* Traffic cap is not enforced
JPCP South Coast CTE 5.5 Thk 11 JS 12.5File Name: D:\2013\PvD\SC_12.5\JPCP South Coast CTE 5.5 Thk 11 JS 12.5.dgpx
Report generated on: 10/15/2013 1:48 PM Page 4 of 15
by: on: 10/14/2013 12:00 AM on: 10/14/2013 12:00 AM
by: Created Approved

Climate Inputs
Climate Data Sources:
Climate Station Cities: Location (lat lon elevation(ft))32.57200 -116.97900 520SAN DIEGO, CA
Monthly Climate Summary:
Annual Statistics:
Mean annual air temperature (ºF) 60.75Mean annual precipitation (in.) 10.48Freezing index (ºF - days) 0.00Average annual number of freeze/thaw cycles: 0.00 Water table depth
(ft)20.00
JPCP South Coast CTE 5.5 Thk 11 JS 12.5File Name: D:\2013\PvD\SC_12.5\JPCP South Coast CTE 5.5 Thk 11 JS 12.5.dgpx
Report generated on: 10/15/2013 1:48 PM Page 5 of 15
by: on: 10/14/2013 12:00 AM on: 10/14/2013 12:00 AM
by: Created Approved

< -13º F
Hourly Air Temperature Distribution by Month:
-13º F to -4º F -4º F to 5º F 5º F to 14º F 14º F to 23º F 23º F to 32º F 32º F to 41º F 41º F to 50º F
59º F to 68º F50º F to 59º F 68º F to 77º F 77º F to 86º F 86º F to 95º F 95º F to 104º F 104º F to 113º F
> 113º F
JPCP South Coast CTE 5.5 Thk 11 JS 12.5File Name: D:\2013\PvD\SC_12.5\JPCP South Coast CTE 5.5 Thk 11 JS 12.5.dgpx
Report generated on: 10/15/2013 1:48 PM Page 6 of 15
by: on: 10/14/2013 12:00 AM on: 10/14/2013 12:00 AM
by: Created Approved

JPCP Design Properties
PCC-Base Contact FrictionPCC-Base full friction contact TrueMonths until friction loss 245.00
Structure - ICM PropertiesPCC surface shortwave absorptivity 0.85
Erodibility index 5
Widened SlabIs slab widened ? FalseSlab width (ft) 12.00
PCC joint spacing (ft)Is joint spacing random ? FalseJoint spacing (ft) 12.50
Sealant typeOther(Including No Sealant... Liquid... Silicone)
Doweled JointsIs joint doweled ? TrueDowel diameter (in.) 1.50Dowel spacing (in.) 12.00
Permanent curl/warp effective temperature difference (ºF) -10.00
Tied ShouldersTied shoulders TrueLoad transfer efficiency (%) 70.00
Design Properties
JPCP South Coast CTE 5.5 Thk 11 JS 12.5File Name: D:\2013\PvD\SC_12.5\JPCP South Coast CTE 5.5 Thk 11 JS 12.5.dgpx
Report generated on: 10/15/2013 1:48 PM Page 7 of 15
by: on: 10/14/2013 12:00 AM on: 10/14/2013 12:00 AM
by: Created Approved

Analysis Output Charts
JPCP South Coast CTE 5.5 Thk 11 JS 12.5File Name: D:\2013\PvD\SC_12.5\JPCP South Coast CTE 5.5 Thk 11 JS 12.5.dgpx
Report generated on: 10/15/2013 1:48 PM Page 8 of 15
by: on: 10/14/2013 12:00 AM on: 10/14/2013 12:00 AM
by: Created Approved

JPCP South Coast CTE 5.5 Thk 11 JS 12.5File Name: D:\2013\PvD\SC_12.5\JPCP South Coast CTE 5.5 Thk 11 JS 12.5.dgpx
Report generated on: 10/15/2013 1:48 PM Page 9 of 15
by: on: 10/14/2013 12:00 AM on: 10/14/2013 12:00 AM
by: Created Approved

JPCP South Coast CTE 5.5 Thk 11 JS 12.5File Name: D:\2013\PvD\SC_12.5\JPCP South Coast CTE 5.5 Thk 11 JS 12.5.dgpx
Report generated on: 10/15/2013 1:48 PM Page 10 of 15
by: on: 10/14/2013 12:00 AM on: 10/14/2013 12:00 AM
by: Created Approved
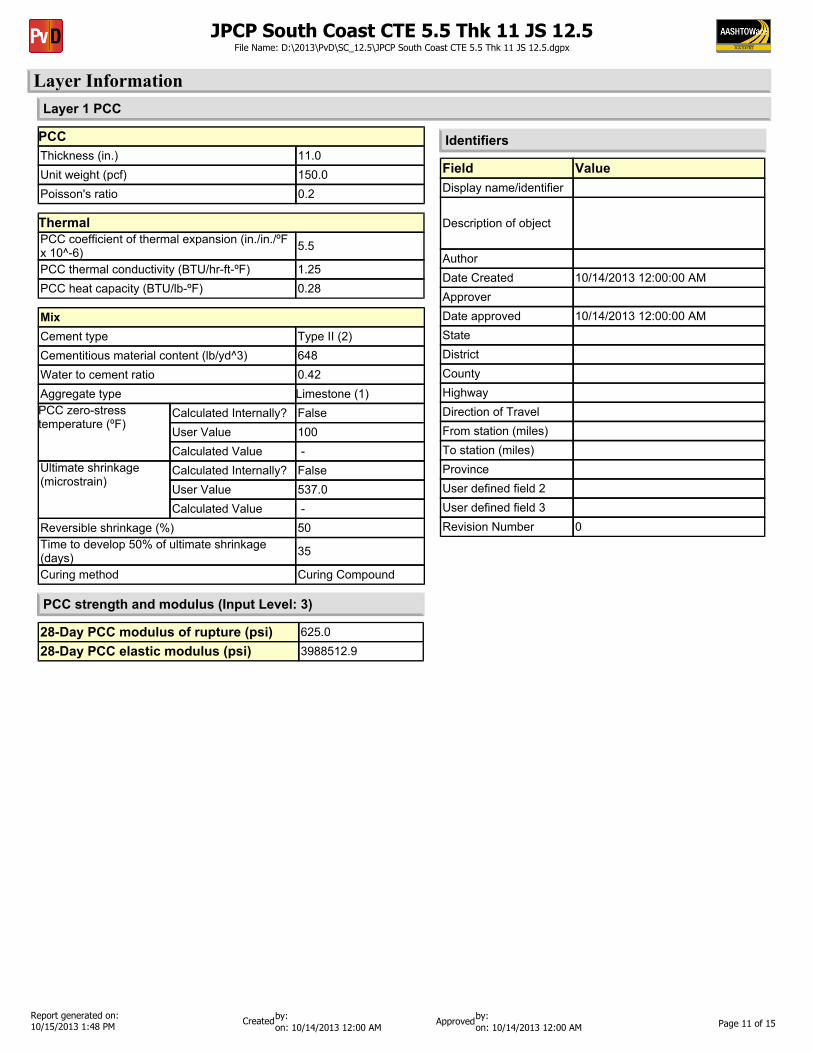
Layer InformationLayer 1 PCC
PCCThickness (in.) 11.0Unit weight (pcf) 150.0Poisson's ratio 0.2
MixCement type Type II (2)Cementitious material content (lb/yd^3) 648Water to cement ratio 0.42Aggregate type Limestone (1)PCC zero-stress temperature (ºF)
Calculated Internally? FalseUser Value 100Calculated Value -
Ultimate shrinkage (microstrain)
Calculated Internally? FalseUser Value 537.0Calculated Value -
Reversible shrinkage (%) 50Time to develop 50% of ultimate shrinkage (days) 35
Curing method Curing Compound
Field ValueDisplay name/identifier
Description of object
AuthorDate Created 10/14/2013 12:00:00 AMApproverDate approved 10/14/2013 12:00:00 AMStateDistrictCountyHighwayDirection of TravelFrom station (miles)To station (miles)ProvinceUser defined field 2User defined field 3Revision Number 0
Identifiers
28-Day PCC modulus of rupture (psi) 625.028-Day PCC elastic modulus (psi) 3988512.9
PCC strength and modulus (Input Level: 3)
ThermalPCC coefficient of thermal expansion (in./in./ºF x 10^-6) 5.5
PCC thermal conductivity (BTU/hr-ft-ºF) 1.25PCC heat capacity (BTU/lb-ºF) 0.28
JPCP South Coast CTE 5.5 Thk 11 JS 12.5File Name: D:\2013\PvD\SC_12.5\JPCP South Coast CTE 5.5 Thk 11 JS 12.5.dgpx
Report generated on: 10/15/2013 1:48 PM Page 11 of 15
by: on: 10/14/2013 12:00 AM on: 10/14/2013 12:00 AM
by: Created Approved

Layer 2 Sandwich/Fractured
Field ValueDisplay name/identifier
Description of object
AuthorDate Created 1/2/2013 12:00:00 AMApproverDate approved 1/2/2013 12:00:00 AMStateDistrictCountyHighwayDirection of TravelFrom station (miles)To station (miles)ProvinceUser defined field 2User defined field 3Revision Number 0
IdentifiersChemically StabilizedLayer thickness (in.) 6Poisson's ratio 0.2Unit weight (pcf) 150
StrengthElastic/resilient modulus (psi) 2000000
ThermalHeat capacity (BTU/lb-ºF). 0.28Thermal conductivity (BTU/hr-ft-ºF) 1.25
JPCP South Coast CTE 5.5 Thk 11 JS 12.5File Name: D:\2013\PvD\SC_12.5\JPCP South Coast CTE 5.5 Thk 11 JS 12.5.dgpx
Report generated on: 10/15/2013 1:48 PM Page 12 of 15
by: on: 10/14/2013 12:00 AM on: 10/14/2013 12:00 AM
by: Created Approved

Layer 3 Non-stabilized Base
Liquid LimitPlasticity Index 1.0
6.0
Sieve Size % Passing0.001mm0.002mm0.020mm#200 8.7#100#80 12.9#60#50#40 20.0#30#20#16#10 33.8#8#4 44.73/8-in. 57.21/2-in. 63.13/4-in. 72.71-in. 78.81 1/2-in. 85.82-in. 91.62 1/2-in.3-in.3 1/2-in. 97.6
Is User Defined? Falseaf 7.2555bf 1.3328cf 0.8242hr 117.4000
Sieve
Is User Defined? Value
Maximum dry unit weight (pcf) False 127.2
Saturated hydraulic conductivity (ft/hr) False 5.054e-02
Specific gravity of solids False 2.7Optimum gravimetric water content (%) False 7.4
User-defined Soil Water Characteristic Curve (SWCC)
FalseIs layer compacted?
UnboundLayer thickness (in.) 6.0Poisson's ratio 0.35Coefficient of lateral earth pressure (k0) 0.5
Resilient Modulus (psi)25000.0
Modulus (Input Level: 3)
Analysis Type: Modify input values by temperature/moisture
Method: Resilient Modulus (psi)
Use Correction factor for NDT modulus? - NDT Correction Factor: -
Field ValueDisplay name/identifier
Description of object
AuthorDate Created 1/2/2013 12:00:00 AMApproverDate approved 1/2/2013 12:00:00 AMStateDistrictCountyHighwayDirection of TravelFrom station (miles)To station (miles)ProvinceUser defined field 2User defined field 3Revision Number 0
Identifiers
JPCP South Coast CTE 5.5 Thk 11 JS 12.5File Name: D:\2013\PvD\SC_12.5\JPCP South Coast CTE 5.5 Thk 11 JS 12.5.dgpx
Report generated on: 10/15/2013 1:48 PM Page 13 of 15
by: on: 10/14/2013 12:00 AM on: 10/14/2013 12:00 AM
by: Created Approved

Layer 4 Subgrade
Liquid LimitPlasticity Index 29.0
50.0
Sieve Size % Passing0.001mm0.002mm0.020mm#200 27.4#100#80 32.0#60#50#40 37.1#30#20#16#10 47.6#8#4 55.43/8-in. 72.41/2-in. 78.13/4-in. 85.31-in. 89.11 1/2-in. 94.62-in. 97.02 1/2-in.3-in.3 1/2-in. 100.0
Is User Defined? Falseaf 100.4941bf 0.7343cf 0.2680hr 500.0000
Sieve
Is User Defined? Value
Maximum dry unit weight (pcf) False 120.8
Saturated hydraulic conductivity (ft/hr) False 6.832e-06
Specific gravity of solids False 2.7Optimum gravimetric water content (%) False 10.6
User-defined Soil Water Characteristic Curve (SWCC)
FalseIs layer compacted?
UnboundLayer thickness (in.) Semi-infinitePoisson's ratio 0.35Coefficient of lateral earth pressure (k0) 0.5
Resilient Modulus (psi)16000.0
Modulus (Input Level: 3)
Analysis Type: Modify input values by temperature/moisture
Method: Resilient Modulus (psi)
Use Correction factor for NDT modulus? - NDT Correction Factor: -
Field ValueDisplay name/identifier
Description of object
AuthorDate Created 1/2/2013 12:00:00 AMApproverDate approved 1/2/2013 12:00:00 AMStateDistrictCountyHighwayDirection of TravelFrom station (miles)To station (miles)ProvinceUser defined field 2User defined field 3Revision Number 0
Identifiers
JPCP South Coast CTE 5.5 Thk 11 JS 12.5File Name: D:\2013\PvD\SC_12.5\JPCP South Coast CTE 5.5 Thk 11 JS 12.5.dgpx
Report generated on: 10/15/2013 1:48 PM Page 14 of 15
by: on: 10/14/2013 12:00 AM on: 10/14/2013 12:00 AM
by: Created Approved

Calibration Coefficients
IRI-jpcpC1: 0.8203 C2: 0.4417C3: 1.4929 C4: 25.24
5.4
Reliability Standard Deviation
C1: 1.0184 C2: 0.91656
POW(0.0097*FAULT,0.5178)+0.014
PCC Faulting
C3: 0.0021848 C4: 0.000883739
C7: 1.83312C6: 0.4C5: 250 C8: 400PCC Reliability Faulting Standard Deviation
PCC CrackingCracking Coefficients
C1: 2 C2: 1.22 C5: -1.98C4: 1
POW(5.3116*CRACK,0.3903) + 2.99PCC Reliability Cracking Standard Deviation
Fatigue Coefficients
JPCP South Coast CTE 5.5 Thk 11 JS 12.5File Name: D:\2013\PvD\SC_12.5\JPCP South Coast CTE 5.5 Thk 11 JS 12.5.dgpx
Report generated on: 10/15/2013 1:48 PM Page 15 of 15
by: on: 10/14/2013 12:00 AM on: 10/14/2013 12:00 AM
by: Created Approved

Commentor Page comment Pavement's ResponseKen Darby General As previously discussed, the precision and bias of the CoTE test needs to be
established before design and specification limits are set (e.g. design CoTE requirement – precision and bias = max CoTE). FHWA is in the process of determining the precision and bias according to Pavements.
The precision and bias determination of the COTE test is beyond the scope of this report.
Ken Darby General The specifications should set required CoTE values and allow bidders/contractors to consider these in their bid.No mitigation measures (e.g. increased thickness, shorter slabs, etc.) should be allowed for materials not meeting required CoTE values. Though, perhaps a deductive percentage could be considered in the specification if the CoTE values were slightly over the requirement. This deductive percentage would need to be established based on a reduced design life/life cycle cost analysis.
The deduction or other measure can be established once the COTE requirement is adopted into the specification.
Ken Darby General ME design results for JPCP seem very dependent on CoTE values and indicate thicker slabs may be needed across the board. Prior to adopting the expensive option of increasing slab thicknesses, it may be money well spent to evaluate existing slab performance against CoTE samples to verify ME design results. Pavements has indicated that UPCRC(?) is available to perform such an analysis.
UCPRC may have a follow up study for COTE. The discussion for the contract is in progress.
Ken Darby 1 Within the “purpose” section it is stated that this study has shown that higher values of CoTE have a negative impact on long-term pavement performance. I do not believe this study has shown this definitively as the ME design results have not been verified with respect to CoTE variability. There may be other research to that effect, but it was not referenced.
This report show the negative impact of higher value of COTE using AASTHO-MEPDG and other parameter in constant value. It is difficult to predict any other type of research in the future and the result.
Ken Darby 29 Appears to be an error with regard to delta temperature 2 calculations. Not sure if this was a typo or used in subsequent calculations.
It does look an error from Twinning lab.
Ken Darby 31 ME design results for CRCP thickness as a function of CoTE and environmental location is not that sensitive. A 12” thickness requirement for CRCP regardless of environmental location would appear to resolve CoTE concerns based on CoTE evaluations to date and expected precision and bias amount.
Correct, the thicker section has less sensitivity but does cost more to construct.
Ken Darby 32 JPCP thickness does not appear to be greatly affected by joint spacing alone
Correct, other factor
Ken Darby JPCP thickness appears to be very sensitive to both CoTE values and environmental location via ME design results.
Correct
Ken Darby Given these tables and a design CoTE value of 6.0, high mountain regions should receive a 20” thickness, inland valley 16” thickness and south coast 15” thickness. These are considerably thicker JPCP sections in comparison to JPCP shown in the highway design manual (HDM). Seems appropriate to verify ME design results reflect pavement performance needs through a separate evaluation of CoTE sample results to known pavement performance.
The HDM thickness design data were based on the initial development of the ME-PDG, and various thickness of the base or other variables. This report is based on the latest Darwin-ME or AASTHO-MEPDG. Other than joint spacing, slab thickness, COTE number and climate region, all others variables have been kept constant including the base type and thickness. There for the thickness of the JPCP should not be compared between this report and HDM.
James Sagar The report states the average California aggregate CoTE value as 4.57 microstrain/degree F, and a max of 5.583; since the AASHTO recommended CoTE limit is 5.5, why is CoTE viewed as a relevant factor for California aggregates?
This report contain a maximum value of 5.62 (AASHTO T336) and there is evidence that we still have CoTE value up to 6.7 (AASHTO TP-60) study conducted by UCPRC in 2007.
James Sagar With California aggregates testing at low CoTE values, why not modify the spec to exclude CoTE requirements for all types of paving?
It is true the majority of the COTE value in the report do not show a high value of COTE, but it is not necessary 100% guaranteed that a high COTE value does not exist in California. For example, Quartzite aggregates has a high value of COTE between 5.6-6.7 and exist in a lot of places in California.
Concrete Coefficient of Thermal Expansion ReportComments and Response Table

Commentor Page comment Pavement's ResponseJames Sagar 1 in the first paragraph, there is reference to the “AASHTO recommended
CoTE value of 5.5”. Is documentation available that shows this recommendation? Would be helpful to cite a source here.
The paragraph is modified, reference is shown. The information is shown on the graph to the bottom.
James Sagar 33 Regarding Result #2 on Page 33, it is unclear from the data on Pages 31-32 how a critical value of 5.5 was determined. Seems to be a direct correlation between CoTE and Minimum Thickness for all values. More analysis may be needed here
The intent of the information on page 31-33 is not for the determination for the limit value of 5.5. The intent is to show the increament of the slab thickness when a higher COTE value is used.
James Sagar 33 Regarding Result #3, is the variability in the data a cause for concern? Is there a hypothesis as to the cause for this variability in the test results? May be best to include here, in case a test result is questioned during project delivery.
The variability of test data may create concern if it exceeding the confident level needed. There for taking average for several sample will reduce this issue. Currently there is no clear explanation the cause of this variabiltiy, another scoping document can be written for that matter.
James Sagar 33 Also, on Page 33, the final sentence indicates that “The Department has decided against implementing CoTE as an acceptance criteria”. It is recommended, based on the data presented in the report indicating that very few test results approached or exceeded the 5.5 value, that CoTE be eliminated from the specifications entirely if it is deemed unnecessary as a criteria for acceptance. It appears from the data that there is little evidence to show that CoTE is of significant concern Statewide.
The report shows the COTE test result from various project and location in California, and several run from the AASHTO-MEPDG showing the effect of COTE with various slab thicness or spacing.
Charley Rea The author(s) are to be complimented on the report. It fills a need and presents considerable test data that will be of great use to many designers.
Thank you, we are keep adding the data as they arrive.
Charley Rea I make no suggestions for pages 30 and 31 since I am not qualified to judge. OK
Charley Rea In the introduction it is noted that the UCPRC study used 74 cores and the Caltrans study “…304 cast specimens and from 24 construction sites…” For consistency the total number of specimens should be noted.
We do differentiate sample from cores or specimens.
Charley Rea Some of the statistics (e.g. mean values) are reported with values such as 5.123 microstrain per degree F. I think the data do not justify this “precision” (equivalent to stating 1 part in10 -9)
This is just a result of statistical value.
Charley Rea The CTE of aggregate (usually the biggest contributor to the total) depends upon its mineralogical constitution. . In Table 1 it would be helpful to have the “geological” description of the locations of the quarries (presumably also the location of the aggregates employed) augmented by noting (if possible) the mineralogical analysis (most quarries have at least some of this type of data) exemplified by the Table below o(from LTPP). Best of all to give both.
The data we can get from USGS is noted on the table. The USGS do not have any additional information. Any other detail data just indicate gravel and rock or others not significant.
Charley Rea CTE varies with mix. But I could not find any data on the “volumetrics” (pardon me for using a term from our “dark side”) of the concrete mixtures tested. If true, this means that the mixes cannot be compared on any quantitative basis. Am I missing something?
The detail of the concrete mix is not included in this report.
Charley Rea I do suggest a note that recognizes that the test value is not necessarily the value that will be exhibited in the field. The situation is similar to concrete compressive strength testing. The standard 28 day test gives a value that is useful for comparative and control purposes but it is known (though often forgotten) that the actual strength in the field is a function of many things and may be significantly different from f(28). The same is true here and designers need to note that a test value of 6 micro may in fact mean as much 9 micro in certain environments.
This test as anything else is the closest reference to what actually being built.
Charley Rea Since I have put in my two cents I should offer more. I think this report would make the basis for a very useful paper (especially I fit includes the data from LTPP). I would be happy to assist Amy in drafting such paper. Perhaps others on CalCIMA Tech would also offer? From a lab person’s point of view I would like to see future research make tests on cement pastes and for individual pieces of aggregate (the latter is a challenge, especially for fine aggs., but could be tackled).
Thank you for the offer.