concerted action -collusion -article 7 of ftl -oligopoly market -to restrict activity of enterprise
TRANSCRIPT

Concerted Action
-collusion
-Article 7 of FTL
-Oligopoly Market
-To Restrict activity of enterprise

Forms
• Contract (s)
• Agreement(s)
• Other mutual understanding between parties
• Communication of intent
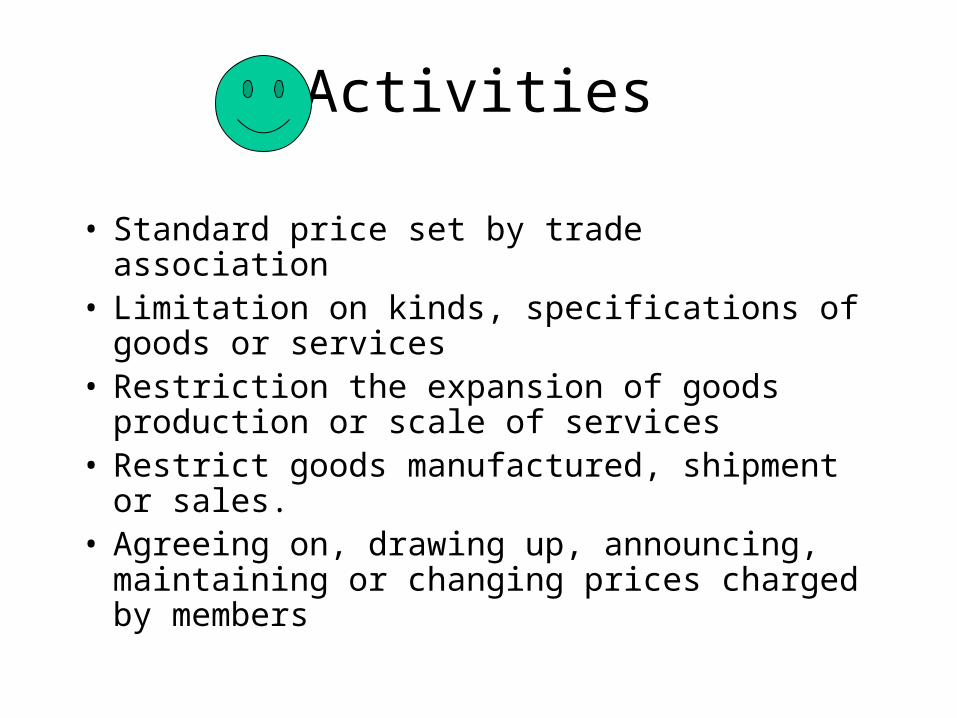
Activities
• Standard price set by trade association • Limitation on kinds, specifications of goods or
services• Restriction the expansion of goods production or
scale of services• Restrict goods manufactured, shipment or sales.• Agreeing on, drawing up, announcing,
maintaining or changing prices charged by members

Authorization or exemption ?
• FTL #14, sub 1-7• 1 .unify specification or model of goods• 2. Joint research and development on goods or
market• 3. Develop a separate and specialized area• 4. Agreement to promote exports• 5. Import of goods for trades• *6. Limit P& Q of products in economic downturn
• 7. Joint action of small and medium enterprises
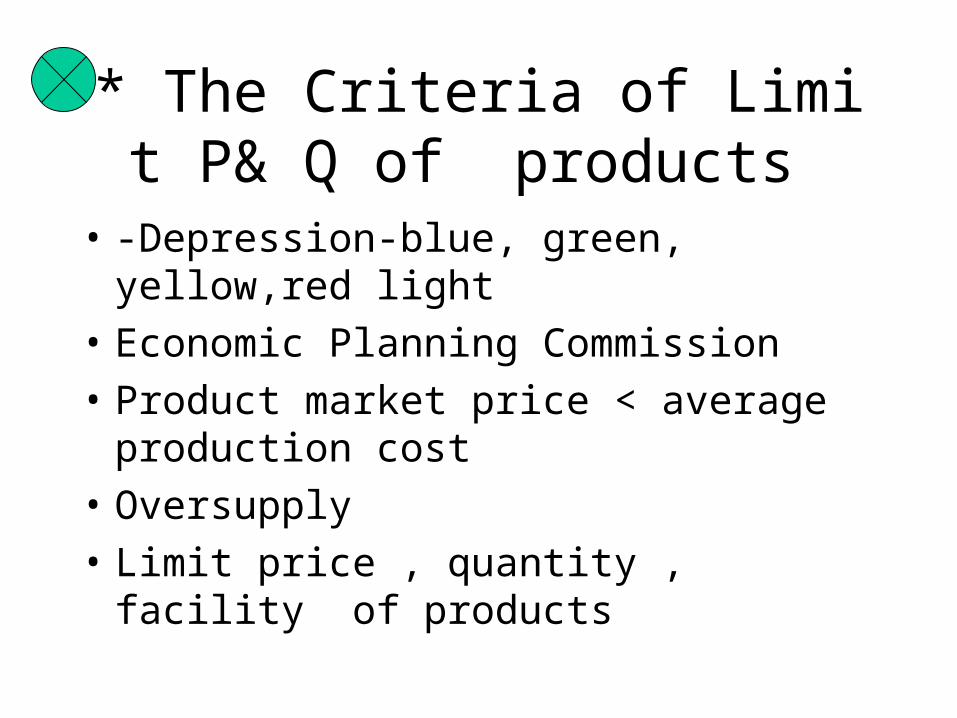
* The Criteria of Limit P& Q of products
• -Depression-blue, green, yellow,red light
• Economic Planning Commission
• Product market price < average production cost
• Oversupply
• Limit price , quantity , facility of products

Underlining promises
• 1. Problem recognition: a. b. c.
• 2. Information research : investigation
• 3. Alternative formulation : a. b. c.
• 4. Choose the alternative: a or b
• 5. Solve the problem

The process of investigation• FTL# 27 (TPA 155) • 1. Information providing• 2. Interviews• 3. Spot investigation• 4. Government institutions (central competant unit)• 5. Trade or industry association’s information• 6. Investigation bureau’s information or assistance
s• 7. Police department’s assistance • 8. Quasi-information comparison: a. go to 1• b. go to 2. C. go to 3.

Investigation Results• 1.Product’s price setting is unreasonable• 2.Price decided by the association• 3. Price suggested by upstream suppliers• 4. Demand and supply (raw material , commodity )• 5. Unfair trade practices• 6. Cut-throat competition by counterpart• 7. Restriction of operation territory• 8. Unreasonable transaction terms• 9. Counterfeiting• 10.Goodwill hit by other companies

case
• Industry:cement
• Parties :11 manufacturers, 10 silo holders or distributors
• Fine:210 million NTD(6.5 mUSD)
• Behavior: anti-competitive practices-jointly raising the prices of their products

Resources
• Invetigation duration: 4 years
• Frequency: 1000 investigators accumulated
• Data collection: 100 files, 20 thousand pages
• Expertise: TFTC task forces, formal public hearing process

Collusion analysis1. Manufacturers reached an agreement to set up a joint venture to acquire the
silo of harbor in order to prevent the international cement groups from establishing domestic marketing channels.
2. Resulting from oversupply of cement, cement manufacturers negotiated the retreat of some enterprises from the market.
3. The int’l cartel and local manufacturers reached an agreement to allocate the mktplace among themselves, to stay out of each other’s territories and make a compensation by using counterpart’s silo to keep foreign enterprises out of the mkt.
4. They reached an agreement to sell domestic cement to each other instead of importing from other countries at lower price for the purpose of restricting market competition and facilitating the joint hiking of cement price.
5. By reducing their production capacity and quantity supplied, shortening the effective term of order, and fixing their terminal selling price, cement suppliers have jointly hiked the price of cement substantially from 1300 to the present 2250 per metric ton.
6. Viewing that slag, the substitute product of cement, had severely affected the sales of cement, domestic cement enterprises have reached an agreement or arrived at an understanding with thel enterprises in Japan to reduce the annual exporting volume of slag to Taiwan.

89-92 年度國內水泥銷售市場平均占有率
34.60
26.21
8.59 7.214.88 4.65 4.51 3.37 2.29
0.00
5.00
10.00
15.00
20.00
25.00
30.00
35.00
(%)
台泥 亞泥 幸福 嘉泥 信大 東南 力霸 環球 欣欣
業者
89-92年度國內水泥銷售市場平均占有率
市場占有率

國內水泥製造廠分布圖
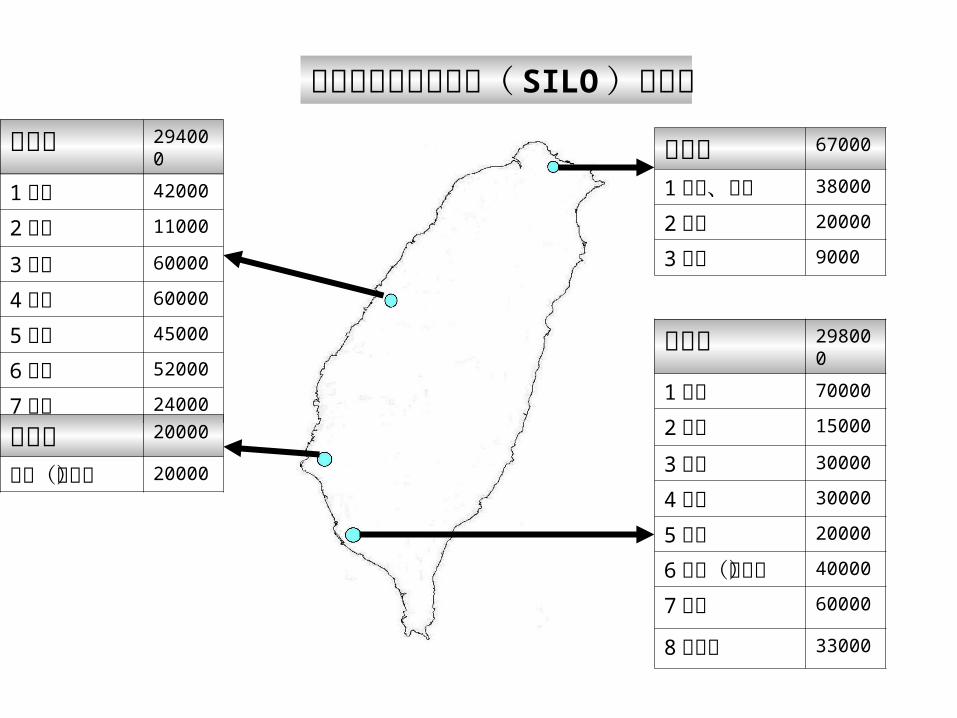
國內水泥倉儲發貨站( SILO )分布圖
基隆港 67000
1台泥、嘉新 38000
2亞泥 20000
3台宇 9000
臺中港 294000
1台泥 42000
2亞泥 11000
3台宇 60000
4東宇 60000
5嘉國 45000
6環中 52000
7幸福 24000
安平港 20000
萬青(台泥)
20000
高雄港 298000
1台泥 70000
2亞泥 15000
3台宇 30000
4國興 30000
5幸福 20000
6力華(力霸)
40000
7士新 60000
8嘉環東 33000
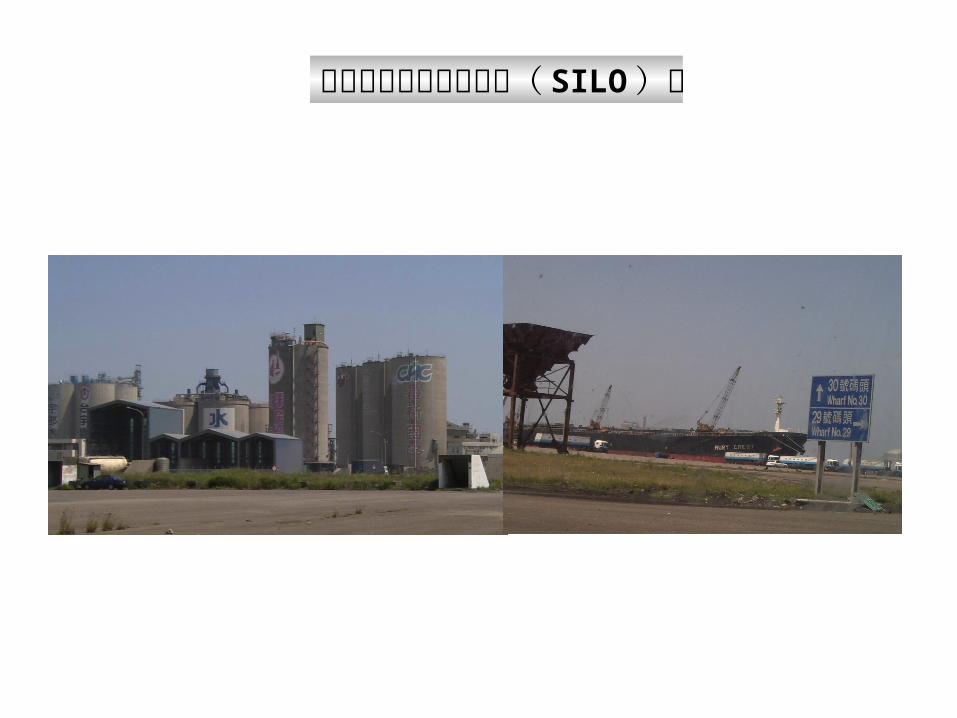
臺中港水泥倉儲發貨站( SILO )圖

東亞七國水泥生產消費出口數量資料 整理表 單位:千噸 數量國別
水泥產能 91產量 92產量 91進口 92進口 91消費 92消費 91出口 92出口
日 本 80,278 72,128 68,959 797 833 64,592 60,125 8,251 9,609
泰 國 46,830 33,932 30,807 0 0 22,192 23,455 16,592 12,158
印 尼 44,425 33,248 32,629 232 11 27,232 27,539 7,975 7,343
菲律賓 21,922 13,397 13,067 645 89 12,601 12,120 1,299 1,655
馬來西亞 17,800 14,010 17,176 1,293 1,198 11,954 15,241 2,873 2,543
韓 國 61,877 55,514 59,194 1,192 1,879 54,292 58,302 3,393 3,147
台 灣 28,237 19,363 18,474 2,053 1,699 17,586 14,848 3,937 5,035
總計(平均) 301,369 241,592 240,306 6,212 5,709 210,449 211,630 44,320 41,490
資料來源:整理自亞洲水泥生產者友好協會(ACPAC)工作小組會員國水泥資料統計
ACPAC東亞七國水泥出口國產銷資料(表一)
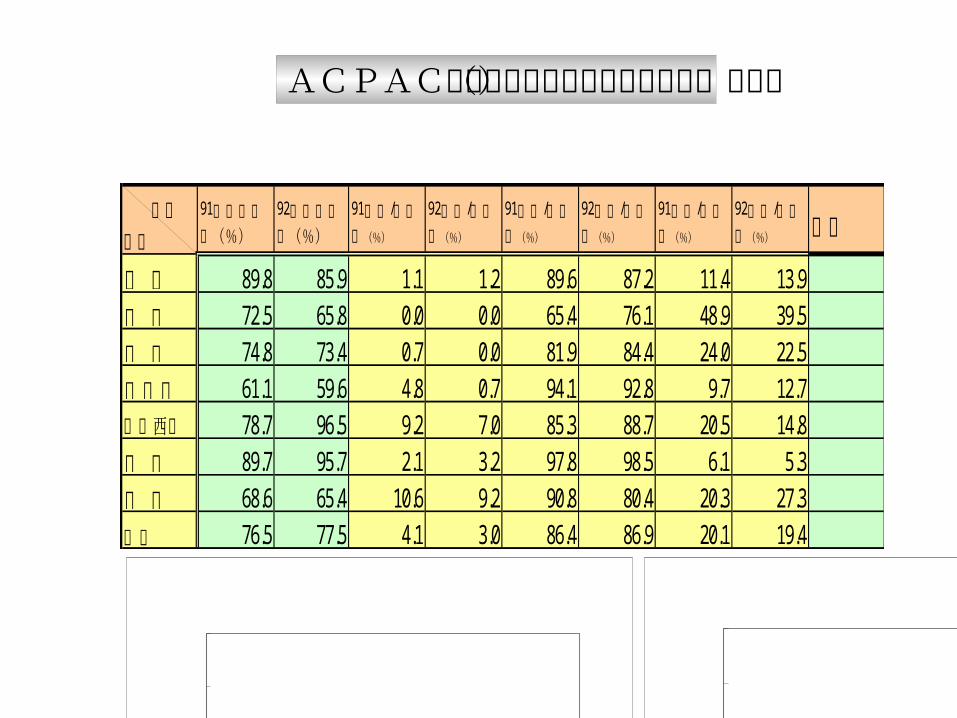
數量國別
91產能利用率(%)
92產能利用率(%)
91進口 /生產率(%)
92進口 /生產率(%)
91消費 /生產率(%)
92消費 /生產率(%)
91出口 /生產率(%)
92出口 /生產率(%) 備註
日 本 89.8 85.9 1.1 1.2 89.6 87.2 11.4 13.9
泰 國 72.5 65.8 0.0 0.0 65.4 76.1 48.9 39.5
印 尼 74.8 73.4 0.7 0.0 81.9 84.4 24.0 22.5
菲律賓 61.1 59.6 4.8 0.7 94.1 92.8 9.7 12.7
馬來西亞 78.7 96.5 9.2 7.0 85.3 88.7 20.5 14.8
韓 國 89.7 95.7 2.1 3.2 97.8 98.5 6.1 5.3
台 灣 68.6 65.4 10.6 9.2 90.8 80.4 20.3 27.3
平均 76.5 77.5 4.1 3.0 86.4 86.9 20.1 19.4
91-92年度各國水泥產能利用率
50
60
70
80
90
100
日 本 泰 國 印 尼 菲律賓 馬來西亞 韓 國 台 灣 平均
國別
%
91年度
92年度
91-92 /年度各國水泥消費生產率
50
60
70
80
90
100
日 本 泰 國 印 尼 菲律賓 馬來西亞 韓 國 台 灣 平均
國別
%
91年度
92年度
ACPAC東亞七國水泥出口國產銷資料(表二)
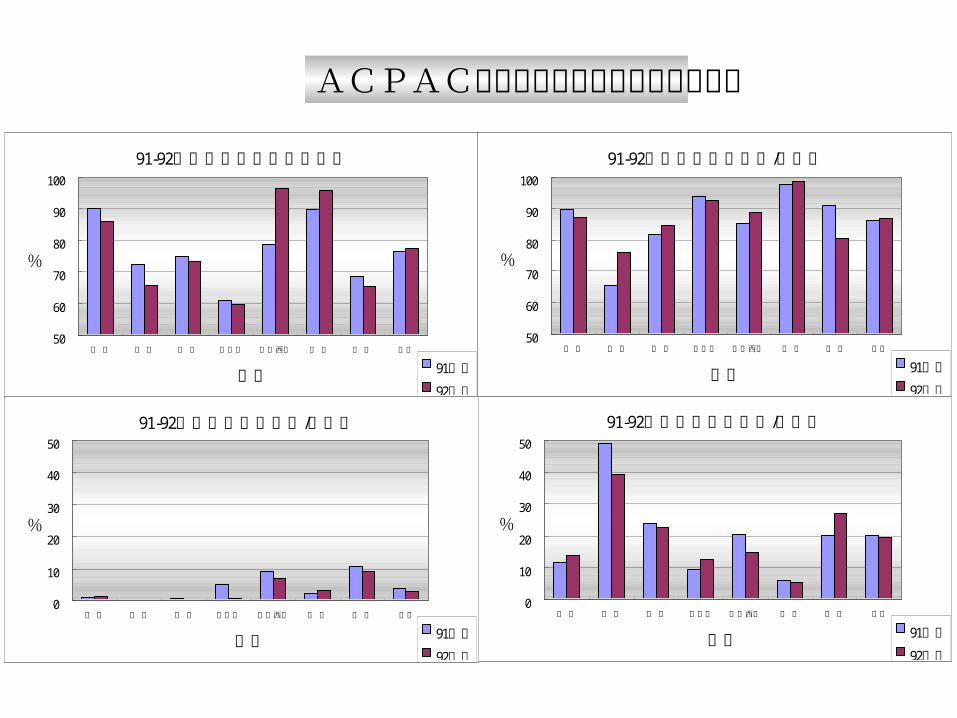
ACPAC東亞七國水泥出口國產銷資料圖
91-92年度各國水泥產能利用率
50
60
70
80
90
100
日 本 泰 國 印 尼 菲律賓 馬來西亞 韓 國 台 灣 平均
國別
%
91年度
92年度
91-92 /年度各國水泥消費生產率
50
60
70
80
90
100
日 本 泰 國 印 尼 菲律賓 馬來西亞 韓 國 台 灣 平均
國別
%
91年度
92年度
91-92 /年度各國水泥出口生產率
0
10
20
30
40
50
日 本 泰 國 印 尼 菲律賓 馬來西亞 韓 國 台 灣 平均
國別
%
91年度
92年度
91-92 /年度各國水泥進口生產率
0
10
20
30
40
50
日 本 泰 國 印 尼 菲律賓 馬來西亞 韓 國 台 灣 平均
國別
%
91年度
92年度

萬噸 MS% 萬噸 MS% 萬噸 MS% 萬噸 MS% 萬噸 MS% 萬噸 MS% 萬噸 MS%
泰國 4,080 100 1,160 28.3 520 12.7 1,680 41.0
菲律賓 1,930 100 710 36.5 550 28.2 460 23.6 1,720 88.3
馬來西亞 1,510 100 760 50.5 60 4.0 820 54.5
越南 1,150 100 150 13.1 150 13.1
小計 12,930 100 2,880 22.3 1,410 10.9 2,020 15.6 60 0.5 520 4.0 6,890 53.3
2,520 59.1印尼 4,260 100 860 20.3 100 2.3 1,560 36.5
生產能力 生產能力 生產能力 生產能力國名
生產能力 生產能力 生產能力
Heidelberg Italcement 五家合計 公司 Holcim Lafarge Cemex
世界前五大水泥集團 89年控制東南亞五國水泥產能狀況表
資料來源:國內水泥公會提供

嘉國
環球 東南 欣欣亞泥 幸福
華東
信大台泥
東宇國興
力霸
台宇
水泥業者整合前後態勢圖
士新 環中
控制
生產銷售業者
通路銷售業者
嘉新 建台
虛化
嘉環東 通發進中聯萬青
工具 工具 進口轉銷 退出進口 轉銷轉銷 虛化特殊水泥轉銷

各家水泥業者成本變動圖
89-93各家水泥業者 年水泥成本變動圖
1,1001,2001,3001,4001,5001,6001,7001,800
89 90 91 92 93 1-8( )
台泥
亞泥
信大
嘉泥
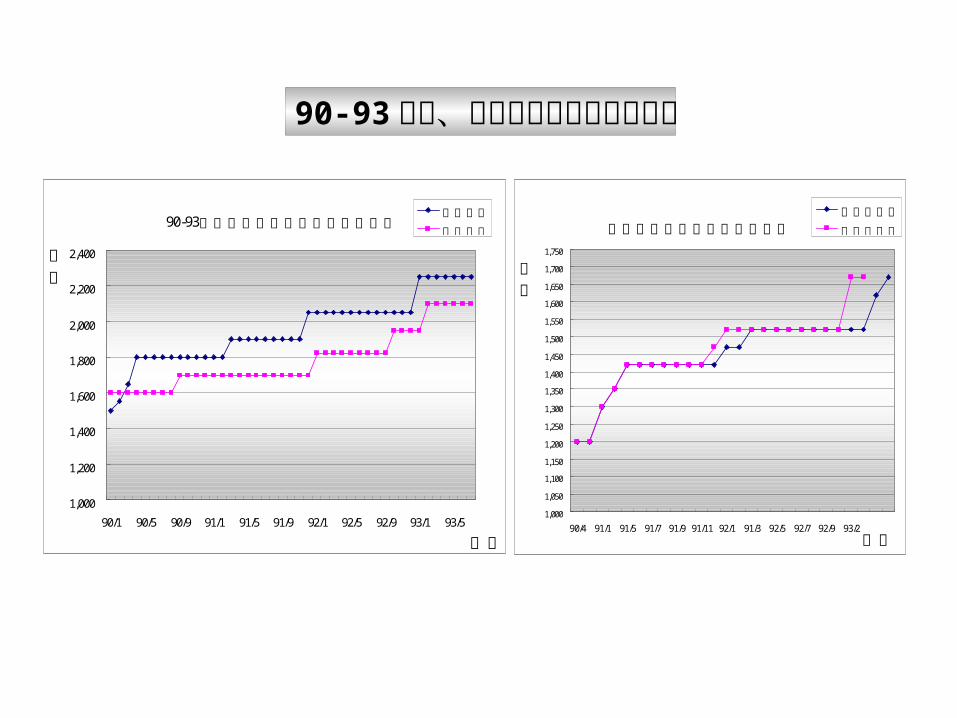
90-93年台泥亞泥台北地區牌價變化圖
1,000
1,200
1,400
1,600
1,800
2,000
2,200
2,400
90/1 90/5 90/9 91/1 91/5 91/9 92/1 92/5 92/9 93/1 93/5
時間
牌價
台泥牌價
亞泥牌價
90-93 年台、亞泥臺北地區牌價變化圖
台泥亞泥轉銷嘉新售價變化圖
1,000
1,050
1,100
1,150
1,200
1,250
1,300
1,350
1,400
1,450
1,500
1,550
1,600
1,650
1,700
1,750
90/4 91/1 91/5 91/7 91/9 91/11 92/1 91/3 92/5 92/7 92/9 93/2時間
售價
台泥轉銷價
亞泥轉銷價

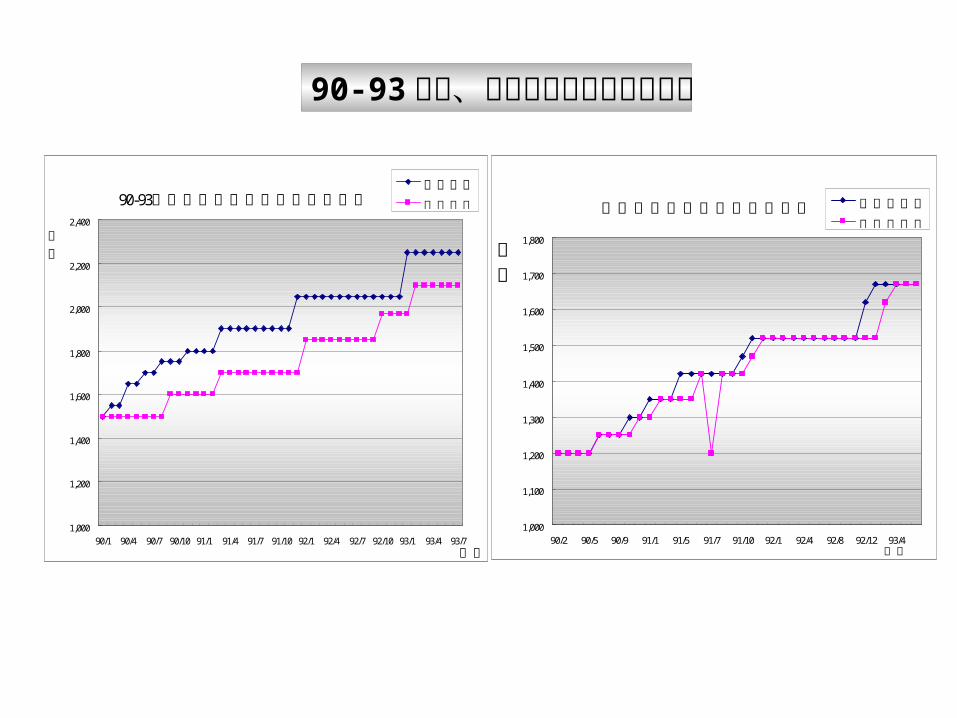
90-93年台泥亞泥台中地區牌價變化圖
1,000
1,200
1,400
1,600
1,800
2,000
2,200
2,400
90/1 90/6 90/11 91/4 91/9 91/2 92/7 92/12 93/5
時間
牌價
台泥牌價亞泥牌價
90-93 年台、亞泥臺中地區牌價變化圖
台泥轉銷環中售價變化圖
1,000
1,100
1,200
1,300
1,400
1,500
1,600
1,700
1,800
90/1 90/6 90/11 91/4 91/10 92/5 92/10 93/4
時間
售價
台泥轉銷價
90-93年台泥亞泥高雄地區牌價變化圖
1,000
1,200
1,400
1,600
1,800
2,000
2,200
2,400
90/1 90/4 90/7 90/10 91/1 91/4 91/7 91/10 92/1 92/4 92/7 92/10 93/1 93/4 93/7時間
牌價
台泥牌價
亞泥牌價
90-93 年台、亞泥高雄地區牌價變化圖
台泥亞泥轉銷士新售價變化圖
1,000
1,100
1,200
1,300
1,400
1,500
1,600
1,700
1,800
90/2 90/5 90/9 91/1 91/5 91/7 91/10 92/1 92/4 92/8 92/12 93/4時間
售價
台泥轉銷價
亞泥轉銷價

89-92 年度國內水泥消耗量變化率
幸福 信大 力霸 幸福 信大 力霸
89 18,500,880 1,383,036 839,744 672,314 1,461,217 849,561 672,314 18,588,878 -
90 16,692,277 953,091 671,778 643,976 1,251,180 691,335 754,104 17,120,051 -7.9091 17,586,109 1,148,749 867,705 693,886 1,521,220 881,265 922,808 18,201,062 6.3192 14,847,958 995,502 719,849 692,202 1,573,335 875,476 701,229 15,590,445 -14.34
年度公會會員申報銷售數量資料(B) 國內水泥消
耗變化比率(%)
本會修正後國內水泥消耗量(D=A-B+C)
會員實際銷售資料(C)國內水泥消耗量公會提供資料(A)
14,000,000
14,500,000
15,000,000
15,500,000
16,000,000
16,500,000
17,000,000
17,500,000
18,000,000
18,500,000
19,000,000
89 90 91 92
89-92年度國內水泥消耗量變化圖
國內水泥消耗量
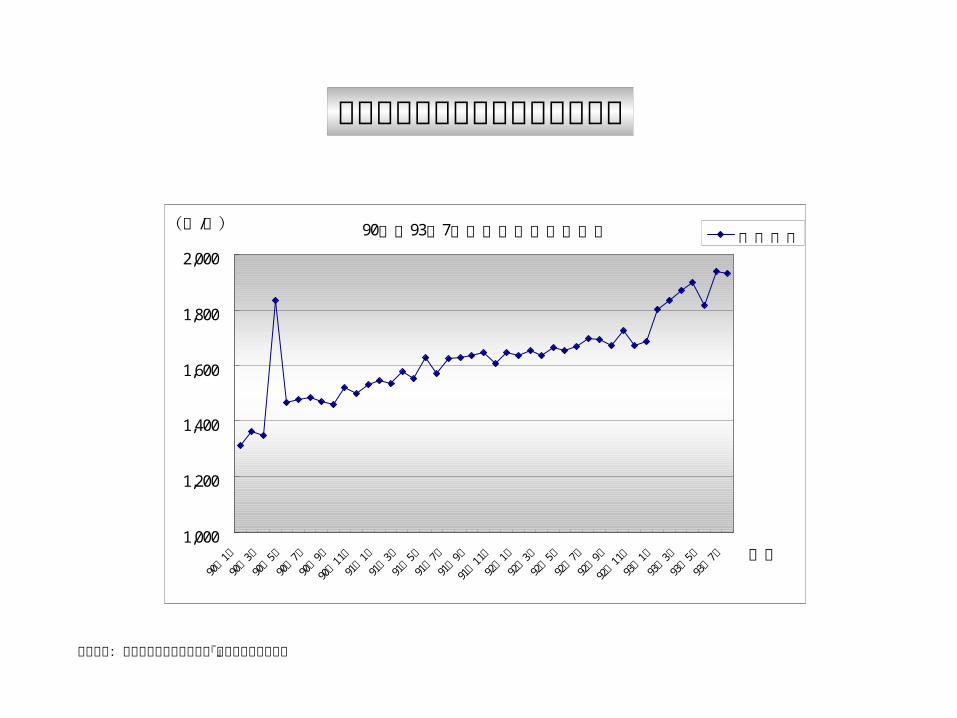
90年至93年7月國內水泥平均銷售價
1,000
1,200
1,400
1,600
1,800
2,000
901年月
903年月
905年月
907年月
909年月
9011年月
911年月
913年月
915年月
917年月
919年月
9111年月
921年月
923年月
925年月
927年月
929年月
9211年月
931年月
933年月
935年月
937年月 月份
/(元噸)水泥均價
國內水泥產品平均內銷單價變動圖
資料來源:本會整理自經濟部統計處『工業生產統計月報』