conceptual dissemination between the internet and … fileabstract conceptual dissemination between...
TRANSCRIPT
Available online at www.gyford.com/phil/uhcl/thesis/Email: [email protected]
CONCEPTUAL DISSEMINATION BETWEEN
THE INTERNET AND THE MAINSTREAM
by
Philip Gyford, B.A.
THESIS
Presented to the Faculty of
The University of Houston Clear Lake
in Partial Fulfilment of the Requirements
for the Degree of
MASTER OF SCIENCE
THE UNIVERSITY OF HOUSTON CLEAR LAKE
December, 2000

CONCEPTUAL DISSEMINATION BETWEEN
THE INTERNET AND THE MAINSTREAM
by
Philip Gyford
APPROVED BY
__________________________________________Peter Bishop, Ph.D., Chair
__________________________________________Jib Fowles, Ph. D., Committee Member
__________________________________________Howard Eisner, Ph. D., Associate Dean
__________________________________________Spencer McWilliams, Ph. D., Dean

ACKNOWLEDGEMENTS
I would like to thank my parents for their never-ending support. Thanks also to Peter
Bishop for his continuous assistance and enthusiasm regarding this project. Additionally,
many thanks to those who have taken time to contribute suggestions that have been
invaluable: Matt Jones, Chris Locke, Matt Locke, Anno Mitchell, Danny O’Brien,
Richard Sargeant, Clay Shirky and Nick Sweeney.

ABSTRACT
CONCEPTUAL DISSEMINATION BETWEEN
THE INTERNET AND THE MAINSTREAM
Philip Gyford, M.S.The University of Houston Clear Lake, 2000
Thesis Chair: Peter Bishop, Ph.D.
This study attempts to find patterns in the spread of ideas on both the Internet and in the
mainstream media. It looks first at the history of diffusion research and theories of the
spread of ideas from the media to grassroots and vice versa. Using a selection of terms it
examines the frequency of their occurrence over time on both Usenet and in the
newspapers indexed by Lexis-Nexis. The study asks if there are discernible patterns
between each domain as the terms become more frequently used, and whether it is
possible to predict usage in one domain by usage in the other.
CONTENTS
ACKNOWLEDGEMENTS...................................................................................iii
ABSTRACT...........................................................................................................iv
CONTENTS............................................................................................................v
TABLES.................................................................................................................vii
FIGURES..............................................................................................................viii
I. INTRODUCTION...............................................................................................1
II. BACKGROUND................................................................................................3
III. EXPECTATIONS...........................................................................................13
IV. METHOD........................................................................................................17
The Internet........................................................................................................20
Mainstream media..............................................................................................22
Time interval......................................................................................................23
Adjusting for size of source material..................................................................23
Weblogs process.................................................................................................27
V. RESULTS..........................................................................................................29
Frequency of word use.......................................................................................30
Cumulative frequency of word use....................................................................35
Weblog results....................................................................................................39
VI. CONCLUSION................................................................................................40
REFERENCES.......................................................................................................45
APPENDIX A – TRACKED WORDS.................................................................47

APPENDIX B – WEBLOGS.................................................................................81
APPENDIX C – LIST OF TRACKED WEBLOGS.............................................83

TABLES
Table 1. Frequency of use of words randomly chosen as baseline words.............25

FIGURES
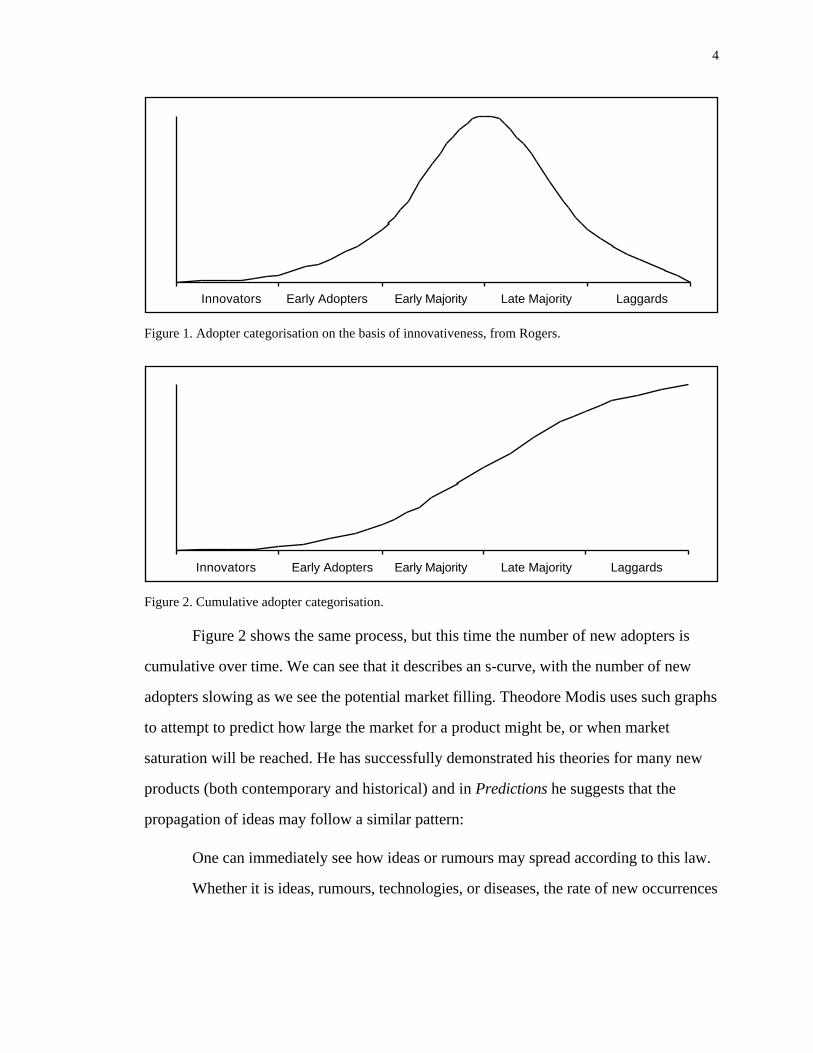
Figure 1. Adopter categorisation on the basis of innovativeness, from Rogers.......4
Figure 2. Cumulative adopter categorisation............................................................4
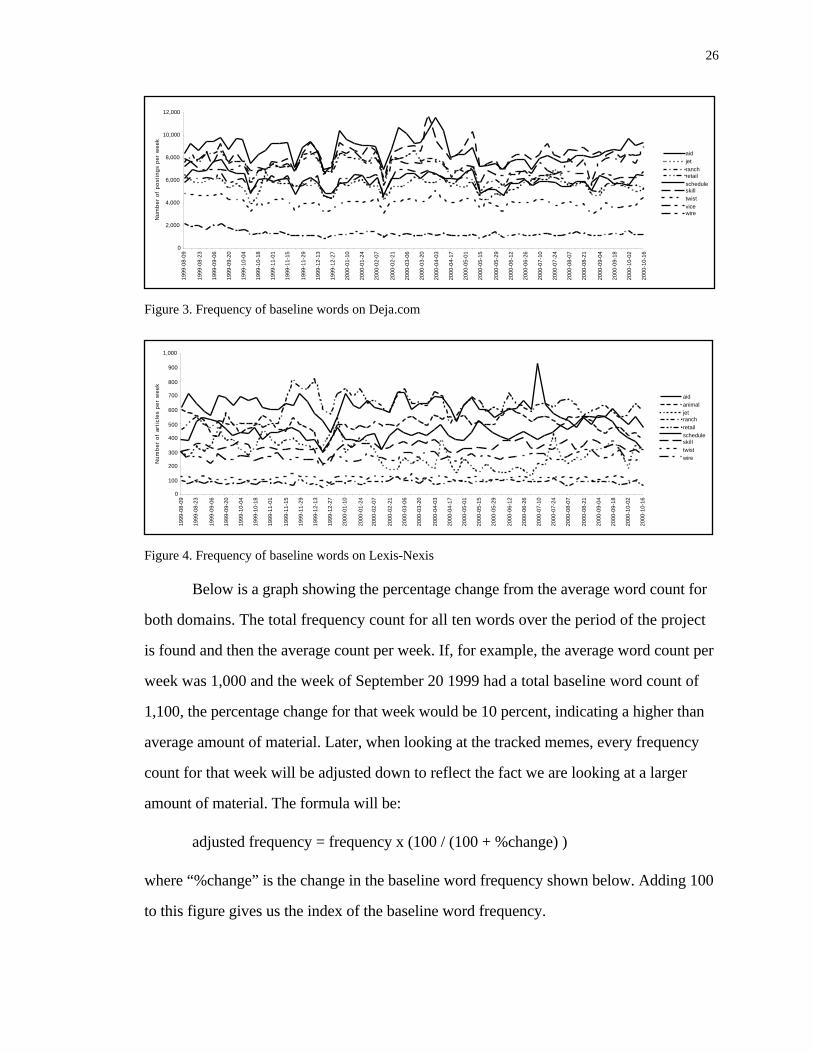
Figure 3. Frequency of baseline words on Deja.com..............................................26
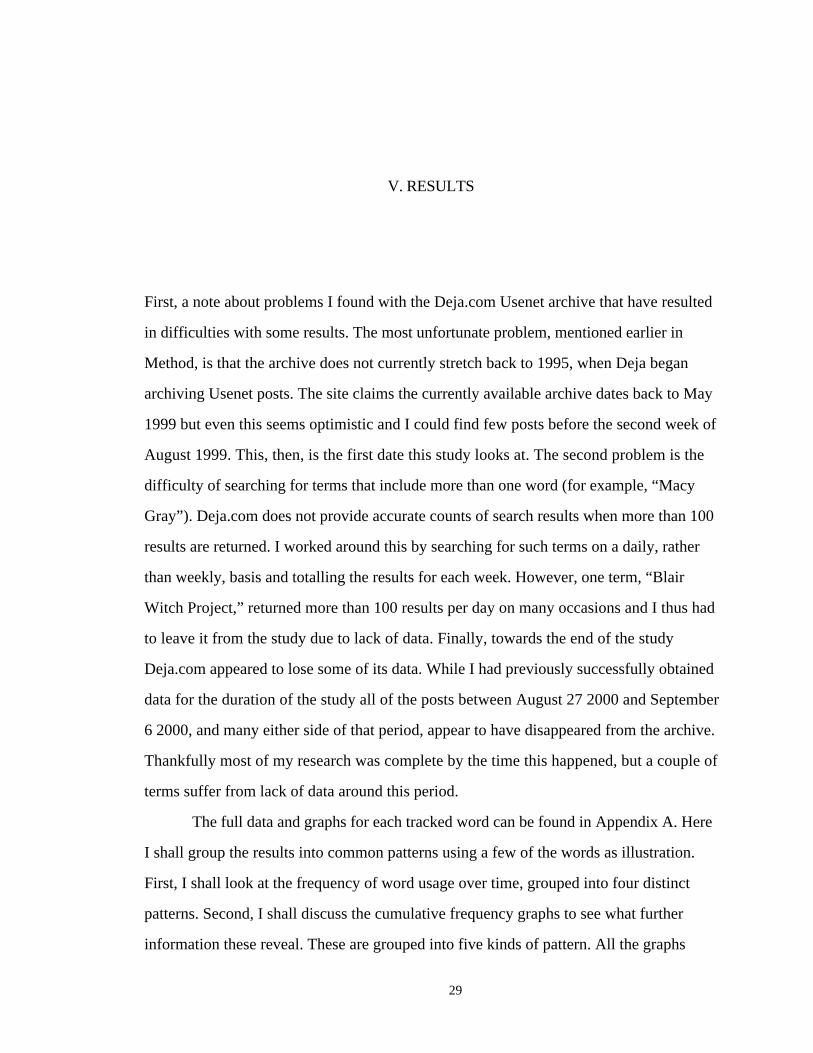
Figure 4. Frequency of baseline words on Lexis-Nexis..........................................26
Figure 5. Percentage change from average baseline word count..............................27
Figure 6. Frequency of who wants to be a millionaire...........................................31
Figure 7. Frequency of britney...............................................................................32
Figure 8. Frequency of napster..............................................................................32
Figure 9. Frequency of denial of service................................................................33
Figure 10. Frequency of daikatana........................................................................34
Figure 11. Frequency of napster............................................................................35
Figure 12. Cumulative count of wap......................................................................36
Figure 13. Cumulative count of genome.................................................................37
Figure 14. Cumulative count of pokemon..............................................................37
Figure 15. Cumulative count of macy gray............................................................38
Figure 16. Cumulative count of eazel.....................................................................39
Figure 17. Frequency of weblog.............................................................................41

1
I. INTRODUCTION
Technology has long allowed ideas to spread further at increasing speeds. Simple
technologies such as smoke signals and warning fires allowed the transmission of
information faster than the previous speed limit of a man on horseback. The invention of
writing systems made ideas more durable and cumulative, passing from one generation to
the next. Printing dramatically increased who could have access to information and gave
more people the ability to have their ideas heard. The telegraph allowed ideas to be
transmitted instantly around the world, suddenly making the world smaller. Telephone,
radio and television, along with the increasing availability and affordability of printed
matter, have radically changed the world in which we live. New ideas spread quickly
around the country and, increasingly, the world. Whether it’s Harry Potter or Who Wants
to Be a Millionaire?, new ideas are available to millions of people in different continents
almost instantaneously.
The Internet has, again, pushed this process further. It is now easier for
individuals to contact more people regardless of geographical distance. With the
reproduction and transmission of material adding little or no cost, it is a supremely fertile
environment for the propagation of ideas. Those who have received a chain letter or virus
or a familiar URL in their email realise how such things can multiply and potentially last
for years. Mini phenomena have emerged on the Internet such as Hampsterdance1 and
1 www.hampsterdance.com

2
Mahir Cagri2. Emails are passed on containing stories both real and fake that, once
unleashed, are unstoppable.
In the early-90s, as the Internet was transforming from an obscure technical
network to something ordinary people were using, these ideas were restricted to their
native environment. At a time when newspapers still had to explain that the Internet was
“the worldwide network of computers linked by telephone lines”3 it was only the very
biggest net news that made newspaper headlines. As the population of the Internet grew,
it became increasingly common for stories to make the break into the mainstream media.
However, many such stories are not sudden events, like a timed virus outbreak
bringing down networks around the world, but are things that have grown slowly online.
They may have been part of the daily lives of a slowly growing number of people before
reaching a level of popularity that brings them to the attention of the media. One recent
example is Napster, the file-sharing software. This became big news in mid-2000 when
court action by the recording industry made newspaper headlines. The program was
available, however, for almost a year before that, and by the end of 1999 there were tens
of thousands of users sharing music over Napster’s servers at any one moment.
This pattern has become more and more familiar – increasing occurrences of an
idea on websites or discussion groups until it becomes so widespread that it “breaks out”
of these more personal arenas and into the conventional media. This proposal is designed
to find out whether there is a measurable pattern here and, if so, whether it is possible to
predict which ideas will “break out” and when they will do so. By tracking the occurrence
of ideas online, is it possible to see when, or whether, they will become mainstream
news?
2 members.xoom.com/_XOOM/primall/mahir/index.html3 Lloyd, 1994.

3
II. BACKGROUND
The diffusion of new ideas or products among a society usually follows an oft-repeated
pattern. Initially, a small number of people will be using the product before anyone else is
aware of it. These are usually described as Innovators, as described in Rogers’s classic
The Diffusion of Innovation.4 The next group, the Early Adopters, notice the Innovators
using the product and take it up. They are more respected and more a part of mainstream
society, than the Innovators so their using the product encourages an even greater number
of people to take it up. The Early Majority are swayed by the Early Adopters while the
Late Majority are more sceptical, often finding themselves under pressure to take up the
new product because so many of their peers are now using it. Finally, the Laggards,
resistant to change, grudgingly accept the new product that has become almost ubiquitous
(this does not imply the entire society will adopt the innovation, the Laggards simply
being the last adopters before the market reaches saturation). This process of increasing
rates of acceptance which then level off can be plotted on a chart, as shown in Figure 1
adapted from Rogers5. This shows the number of people taking up the new product at
any point in time, with the rate starting slowly, then increasing rapidly until around half
the population are using it, then dropping until the market is saturated. It should be noted
that this does not mean the entire population of a society, but the potential market for the
product under consideration and some Laggards may never take up the innovation.
4 Rogers, 1995, p. 263.5 Rogers, 1995, p. 262.
4
Innovators Early Adopters Early Majority Late Majority Laggards
Figure 1. Adopter categorisation on the basis of innovativeness, from Rogers.
Innovators Early Adopters Early Majority Late Majority Laggards
Figure 2. Cumulative adopter categorisation.
Figure 2 shows the same process, but this time the number of new adopters is
cumulative over time. We can see that it describes an s-curve, with the number of new
adopters slowing as we see the potential market filling. Theodore Modis uses such graphs
to attempt to predict how large the market for a product might be, or when market
saturation will be reached. He has successfully demonstrated his theories for many new
products (both contemporary and historical) and in Predictions he suggests that the
propagation of ideas may follow a similar pattern:
One can immediately see how ideas or rumours may spread according to this law.
Whether it is ideas, rumours, technologies, or diseases, the rate of new occurrences
5
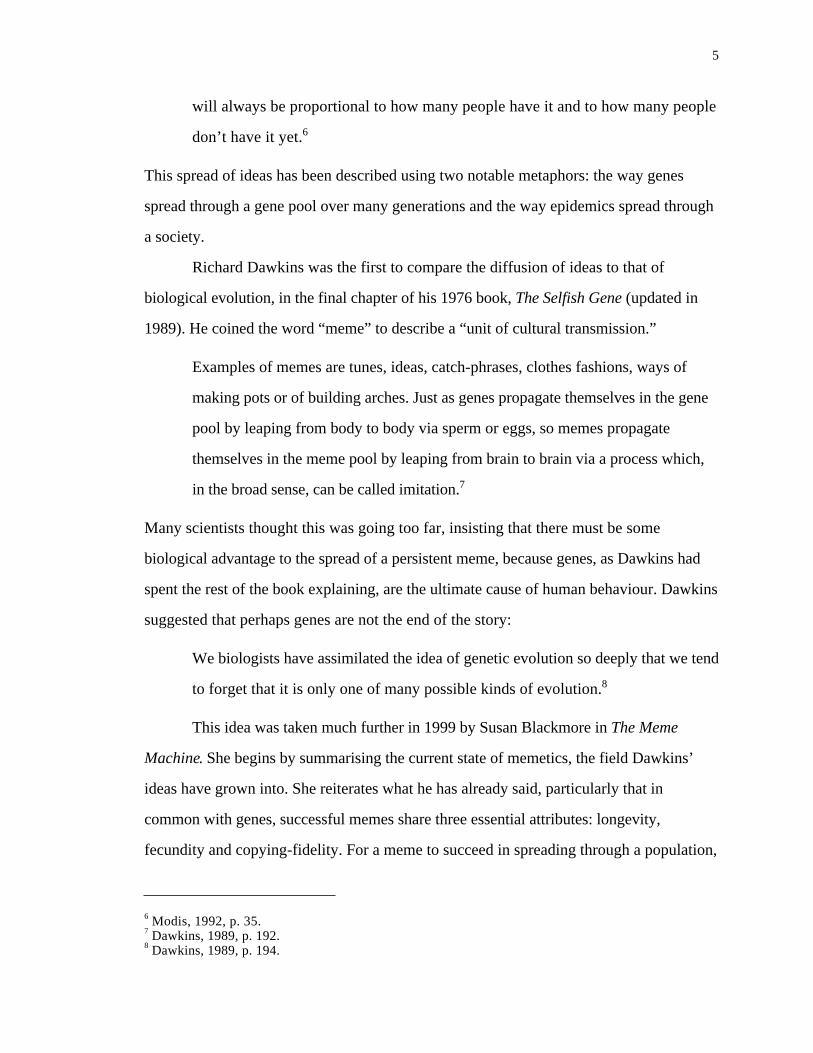
will always be proportional to how many people have it and to how many people
don’t have it yet.6
This spread of ideas has been described using two notable metaphors: the way genes
spread through a gene pool over many generations and the way epidemics spread through
a society.
Richard Dawkins was the first to compare the diffusion of ideas to that of
biological evolution, in the final chapter of his 1976 book, The Selfish Gene (updated in
1989). He coined the word “meme” to describe a “unit of cultural transmission.”
Examples of memes are tunes, ideas, catch-phrases, clothes fashions, ways of
making pots or of building arches. Just as genes propagate themselves in the gene
pool by leaping from body to body via sperm or eggs, so memes propagate
themselves in the meme pool by leaping from brain to brain via a process which,
in the broad sense, can be called imitation.7
Many scientists thought this was going too far, insisting that there must be some
biological advantage to the spread of a persistent meme, because genes, as Dawkins had
spent the rest of the book explaining, are the ultimate cause of human behaviour. Dawkins
suggested that perhaps genes are not the end of the story:
We biologists have assimilated the idea of genetic evolution so deeply that we tend
to forget that it is only one of many possible kinds of evolution.8
This idea was taken much further in 1999 by Susan Blackmore in The Meme
Machine. She begins by summarising the current state of memetics, the field Dawkins’
ideas have grown into. She reiterates what he has already said, particularly that in
common with genes, successful memes share three essential attributes: longevity,
fecundity and copying-fidelity. For a meme to succeed in spreading through a population,
6 Modis, 1992, p. 35.7 Dawkins, 1989, p. 192.8 Dawkins, 1989, p. 194.

6
it must last long enough to be copied, produce lots of copies and the copies must be
accurate. Blackmore suggests that the development of language allows memes to be
reproduced more accurately and more frequently than previously possible. She further
suggests that language evolved primarily so that memes could replicate; memes drove the
development of language. They also, she says, caused the evolution of larger, more
powerful, brains among our species.
Once imitation evolved, something like two and a half or three million years ago, a
second replicator [in addition to the gene], the meme, was born. As people began
to copy each other the highest-quality memes did the best – that is those with
high fidelity, fecundity, and longevity. A spoken grammatical language resulted
from the success of copyable sounds that were high in all three. The early
speakers of this language not only copied the best speakers in their society but
also mated with them, creating natural selection pressures on the genes to produce
brains that were ever better and better at spreading the new memes. In this way,
the memes and genes coevolved to produce just one species with the extraordinary
properties of a large brain and language.9
(When Blackmore uses the term “imitation,” she is using it broadly, to “include passing
on information by using language, reading, and instruction, as well as other complex skills
and behaviours.”10)
As well as this genetic model of ideas spreading, others have compared this
behaviour to the spread of viruses. Malcolm Gladwell’s The Tipping Point uses an
epidemiological metaphor to focus on what is essentially a small part of Rogers’
description of diffusion. While he also refers to it as a tipping point he prefers the term
critical mass, defining it as
9 Blackmore, 1999, p. 107.10 Blackmore, 1999, p. 43.

7
the point at which enough individuals have adopted an innovation so that the
innovation’s further rate of adoption becomes self-sustaining.11
At this point the rate of adoption suddenly rises, especially with what he calls
“interactive innovations,” items such as fax machines where the benefits of adoption
increase dramatically as the number of other adoptees rises (a phenomenon often referred
to as the “network effect”). Gladwell expands this to the realm of ideas and behaviours,
not just products, and his book is more about what makes something break out from the
Innovators and Early Adopters to the Early Majority. His less analytical but more
expansive discussion centres on the environments and the kinds of people that cause or
enable this tipping point. In discussing how a trend makes this move from the initial users
to the mainstream he quotes from Geoffrey Moore’s Crossing the Chasm:
Moore’s argument is that the attitude of the Early Adopters and the attitude of
the Early Majority are fundamentally incompatible. Innovations don’t just slide
effortlessly from one group to the next. There is a chasm between. All kinds of
high-tech products fail, never making it beyond the Early Adopters, because the
companies that make them can’t find a way to transform an idea that makes
perfect sense to an Early Adopter into one that makes perfect sense to a member
of the Early Majority.12
Part of the aim of this thesis is to look at which ideas become popular with groups
of individuals before they become widespread in the media and those which work in the
opposite direction – i.e., the media generating the discussion before any other group has
adopted it. In an earlier article entitled The Coolhunters, upon which some of The Tipping
Point is based, Gladwell suggests that idea epidemics are almost entirely word of mouth.
After describing a nationwide craze for Hush Puppies that began in small clubs and stores
in New York, he says
11 Rogers, 1995, p. 313.12 Gladwell, 2000, p. 198-9.
8
You can't convince the late majority that Hush Puppies are cool, because the late
majority makes its coolness decisions on the basis of what the early majority is
doing, and you can't convince the early majority, because the early majority is
looking at the early adopters, and you can't convince the early adopters, because
they take their cues from the innovators. The innovators do get their cool ideas
from people other than their peers, but the fact is that they are the last people
who can be convinced by a marketing campaign that a pair of suède shoes is cool.
These are, after all, the people who spent hours sifting through thrift-store bins.
And why did they do that? Because their definition of cool is doing something
that nobody else is doing. A company can intervene in the cool cycle. It can put
its shoes on really cool celebrities and on fashion runways and on MTV. It can
accelerate the transition from the innovator to the early adopter and on to the
early majority.13
Rogers describes a slightly different pattern, emphasising the role of the media
early on in the process. He describes the Bass model which
assumes that potential adopters of an innovation are influenced by two types of
communication channels: Mass media and interpersonal word-of-mouth channels.
Individuals adopting a new product because of a mass media message occur
continually throughout the diffusion process, but are concentrated in the relatively
early time periods.14
These ideas suggest that once a trend or innovation has been successfully kick-
started via media channels it can run wild in a society without the assistance of external
forces such as more media coverage. While this idea of an epidemic run wild is exciting, it
still places the media in a prime controlling position. However, there is more to the
Innovator than mere stooge of the media. The above quote from Gladwell’s article
13 Gladwell, 1997, pp. 83-4.14 Rogers, 1995, p. 81.

9
continues, “but [a company] can’t just manufacture cool out of thin air,” and this gets
more at the spirit of his writings. There are true Innovators out there, in all fields, who are
doing their own thing. If, as the Coolhunters attempt to do, you can spot what these
people are doing you may just be able to create the next big thing. Some people, in any
part of society, will be doing things differently from anyone else, and if you are able to
spot which behaviours have the potential to reach a wider audience you can speed and
encourage this process.
This idea is behind the lead user process developed by Eric von Hippel. The
technique is designed to be used by a company looking for new product developments,
and involves finding the Innovators in related areas. Through networking, the
development team members work their way to the leading edge of product use, to find
people who are creating their own solutions to problems in the target market and those
related to it. For example, a team at 3M were looking to expand their line of surgical
drapes, thin plastic films that are stuck to a patient’s skin at the point of incision prior to
surgery. The incisions are made through the drapes which isolate the area being operated
on from the external environment. They found alternative solutions being used in
developing countries where infections are more common and budgets are tighter.
Veterinarians also used alternative methods of controlling infection, and Hollywood
makeup artists used different ways of applying easily-removable materials to human
skin.15
Von Hippel also cites products such as the Apache web server as an example of
just how many innovative users there are today. Apache is a piece of software developed
by volunteers and is the most widely used web server.16 Software like Apache, Linux and
Napster are all “bottom-up” phenomena, developing from individual users rather than
companies that have spotted an unexploited market.
15 Von Hippel, Thomke, and Sonnack, 1999.16 www.netcraft.com/survey/

10
Obviously, there does not appear to be a simple model of how an innovation or
idea becomes widespread. In cases such as Napster, or the instant-messaging application
ICQ, any existing user will continue to notice new waves of media interest and new users.
More media coverage generates more users which in turn makes the product more
newsworthy. Initially, new users of ICQ could only have found out about it from friends
that were already using the software. As it became popular it became more noticeable and
worth covering in the media. Now users can find out about the product from users or by
reading about it.
Danny O’Brien, co-editor of the weekly Internet newsletter Need to Know,17
identified four waves in this media diffusion process:
The first wave was the discovery: when a small group of people do
something for the hell of it.
The second wave was the initial media discovery. A couple of journalists
write about it, because they are intrigued by it, involved in it, or are paid by evil
media organisations to track down promising new methods of maintaining the
tawdry allure of the capitalist conspiracy.
The third wave is journalists writing articles based on what they’d read in the
second wave articles. These journalists have no experience of the phenomenon.
They just read a lot.
The fourth wave is journalists writing articles in the absolute conviction that
they are first wave journalists because they have noticed that people are doing it
on the streets. These people are doing it because they’ve read the third wave
journalists.18
In our example of ICQ, the users are the first wave. The second wave might be
people who began using the program after hearing about it from friends and decide to
write about it for their online newsletters. After reading these articles journalists will
17 www.ntk.net

11
write about ICQ (and, by then, perhaps its imitators) for the feature sections of national
newspapers. The final wave may then involve a jokey piece on the local TV news about
this instant-messaging craze they’ve “discovered.” This process illustrates that just when
you think a topic has reached the point of total media saturation, another outlet will
“discover” it anew, giving it more momentum and leading to further spread of the idea
online. Illustrating this, I recently came across an article in the San Francisco Chronicle
introducing the instant-messaging craze that I’d assumed had been exhaustively covered
everywhere.19
Recently there has been an effort by many marketeers to avoid conventional media
and utilise the alternative channel: word-of-mouth. Steve Jurvetson and Tim Draper
coined the term “viral marketing” in a paper they wrote in 1998.20 As directors of the
venture capital firm Draper Fisher Jurvetson, they were early investors in Hotmail, the
web-based email application. Much of the product’s early marketing relied on tagging
each email sent by users with a link back to the website. Consequently the Hotmail meme
was spread to the friends and associates of every current user, implicitly showing the
support of the email’s sender. In this way the company acquired 12 million users in 18
months, spending only $500,000 on marketing, compared to Juno, a close competitor,
that spent $20 million on acquiring “a fraction” of this number of users.
This strategy, however, was almost faking word-of-mouth. Adding a link to
Hotmail to the end of all its outgoing emails was certainly successful, but it is less than
spontaneous endorsement by the users. Other viral marketing techniques rely
successfully on pure word-of-mouth. Virgin Net, an internet service provider in the UK,
staged just such a promotion as this email to the UK Net Marketing list21 demonstrates:
18 O’Brien, 1999.19 Kirby, 2000.20 Jurvetson and Draper, 1998.21 www.chinwag.com/uk-netmarketing/

12
Date: Tue, 22 Feb 2000 18:29:25 +0000From: Jo Peat <[email protected]>Organization: Virgin NetTo: [email protected]: Re: UKNM: benign viruses
We ran a very sucessful viral marketing campaign with the VirginNet cinema ticket giveaway.
We emailed just 25 opinion formers and all 20,000 tickets weresnapped up in less than three hours. At its peak we received 450emails a minute, demand outstipping reply by about 2 to 1.Requests even arrived 6 hours after the promotion ended.

13
III. EXPECTATIONS
Once I have obtained a useful amount of data on the frequency of use of a word in the
two domains, grassroots Internet and mainstream media, I will be able to plot the
frequency of each word over time in the two domains on the same graph in the form of
cumulative frequency. While the absolute count of usage will be different in each domain,
due to the amount of material in each of them, the relationship between the two lines of
usage should be instructive. I would imagine that the lines will describe s-curves, although
this depends on being able to track an idea from its initial use through to its peak. The
curves may include only parts of s-curves if the time period is not long enough for a
certain idea. In other words, we may begin tracking a word after it has already started to
spread.
While Theodore Modis suggests this neat s-curve model could apply to “ideas or
rumours” (as mentioned earlier), we should note a number of differences between what we
are examining and most of what he has looked at. An s-curve assumes there is a finite
“market place” for whatever is being tracked, that eventually a saturation point will be
reached and the frequency will gradually slow, approaching zero. Is this a pattern we
would expect from monitoring a word’s frequency in the press? I would imagine that
some fads would follow this pattern, but I’m not sure whether all new terms would.
Despite Modis’ belief I feel that usage of words will not always follow such a regular
pattern over a long period of time, particularly in the media; a flurry of interest when new
developments or crises occur, then slowing until the next newsworthy event. But maybe
over the long term this averages out to form one of Modis’ curves…
14
However, before beginning the study, I would imagine the s-curve (if it is an s-
curve) describing usage on the Internet will be positioned earlier on the graph than that
describing media usage. This would indicate that individual people are discussing these
ideas for some time before they are picked up by the media. It is only when they have
gained a certain momentum, when a certain number of people are talking about this idea,
that the press will deem it worth reporting. If this is the case, can we find a certain
common point at which the media began to take notice? Can we predict by extrapolation
when a new idea will breakout from individual discussion into being a widely-reported
concept?
Such a situation may indicate that individuals “make” some of what we read as
news, that the media are merely reporting what is happening. This conclusion would,
however, assume that all new ideas spring from individuals in the first place. This belief is
behind viral marketing whose aim is to build awareness of a new product by word-of-
mouth, rather than by a traditional media blitz (although the blitz may well follow an
initial viral marketing phase). The Blair Witch Project, for example, was seen as having
risen from an enthusiastic Internet fan base spreading word about the new low-budget
movie. However, some reports suggested that this fan base was actually low-budget

15
marketing that gave the movie a credible edge. The creators of one site that claimed to be
run by “very dedicated fans” turned out to have connections to the film.22
We may find, of course, that ideas do not reach a certain threshold of use online
before appearing in the media. If we consistently find that appearances of these memes in
the media precede growth in usage online, then perhaps the agenda is set purely by the
conventional media.
Of course, the world is not so simple that a one-way flow in either direction is a
realistic model. Within each domain there are many influences and interactions, and the
process of diffusion of a new idea within just one would be complex enough even if it
could be isolated from all external influences. I would not want to suggest that for a new
idea to “break out” of the world of mailing lists and newsgroups onto TV and into
newspapers is a simple case of discovery by one journalist which then opens the
floodgates to instant blanket coverage with no further reference to its source. If the meme
we are looking at is topical and important, then its speed and breadth of impact will be
larger. A computer virus that spreads into many large corporations in a single day will,
once reported in one major news outlet or feed, appear everywhere. Conversely, an
emerging computer program such as ICQ will only appear in the media gradually, as
discussed earlier.
Theodore Modis suggests that cumulative s-curves are so predictable we can use
them to forecast when a frequency will slow to a trickle. Will we be able to do this with
our tracked words, predicting when usage has reached its peak? Whether we can or not,
will there be other patterns? Will we find a big jump in usage in the media sparks debate
online, causing a similar jump there? Or will it be the reverse? So, in summary, the points
I wish to address are:
22 DiLucchio, 1999.

16
1. Are there any common patterns of diffusion?
2. Do all memes become popular in one of the domains before crossing to the other
or do some appear first in grassroots, some in the mainstream? Or is diffusion
concurrent in each domain?
3. Can we predict when a meme will break out from one domain to another?
17
IV. METHOD
The aim is to reliably track the frequency of appearance of certain ideas in both grassroots
Internet fora and in the mainstream media. By “grassroots” I mean areas where the
content is generated by individuals rather than companies in the form of email lists,
personal websites, discussion boards and Usenet. The definition of “mainstream media”
has become increasingly difficult as the old guard has scrambled to catch up with the Net.
For a while there was little on the Internet that could be regarded as mainstream,
especially if it wasn’t supported by part of old media. These days, however, the line is
becoming more and more blurred. Salon23, the online magazine, would have seemed like an
alternative to the mainstream when it began in 1995. Now, however, it is positioning itself
as a big player in the media world. Such matters become more complicated when
Slashdot24, a hugely popular technology news and discussion site, was bought by
Andover.net, a network of open source-oriented web sites. While its output has changed
little since the purchase, should it still be considered “grassroots” considering it is now a
subsidiary of a large company? There are obviously no hard and fast rules here, but in
most cases I will use mainstream to mean publishing that is funded by a company. There
are exceptions to the rule, and I would still regard both Slashdot and Jim Romenesko’s
MediaNews25 (bought by Poynter) as grassroots in both origin and the way in which they
are currently regarded by many people.
23 www.salon.com24 slashdot.org25 www.poynter.org/medianews/

18
Given the vast scale of both domains, the grassroots Internet and the media, the
tracking of ideas must somehow be automated. To achieve this, specific words and their
frequency of use will be used as indicators of certain memes. The words to be searched
for must be specific or highly correlated with the idea or meme. For instance, “Britney
Spears” would give a relatively accurate count of the appearances of the teen sensation
(aside from the slight possibility of anyone less famous sharing her name). Similarly,
terms such as “MP3,” “Linux,” or “Blair Witch Project” are specific to the ideas they
represent.
Other concepts unfortunately do not have unique terms and must be left from the
search. For example, an increasing number of computer programs utilise “skins” to allow
the creation of personalised front-ends – want your MP3 player to look like Britney
Spears? Then download one of the Britney skins26, created by adoring fans, and there she
is, complete with graphic equaliser. However, searching for the word “skins” would not
return results restricted to this concept of software personalisation. It would be possible
to search for, say, articles that referred to both “skins,” “WinAmp” and/or “Mozilla” but
this would be a subset of the entire concept. Therefore this research will track only those
memes that are associated with a unique term or terms so that this term does not refer to
other memes.
Searching large information sources for word patterns is not new, and a whole field
called “bibliometrics” has developed. Watts and Porter applied it to looking for emerging
technological trends and summarised the field thus:
Bibliometrics uses counts of publications, patents, or citations to measure and
interpret technological advances. Such analyses assume that counts of papers or
patents provide useful indications of R&D activity and of innovation, depending
on the sources examined. Another key tenet is that one can ascertain important
links by analysing which topics occur together, which organisations produce what
26 www.winamp-skins.com/dedicated_britney.html
19
papers and patents, and who cites what … Co-citation analysis identifies pairings
of articles jointly cited by later articles. From these, cognitive structure may be
inferred. Co-word analysis, dating mainly from the 1980s in Europe, looks for
words appearing together … Bibliometric limitations need to be noted. Counts do
not distinguish quality, and much technological development work is not reflected
in publications or patents, at least not in a timely manner. Publishing and
patenting practices vary considerably across fields and by institutions.27
Such analysis of patterns and co-occurrences would, I feel, be interesting if transferred
from the domain of patents to more grassroots discussions. Unfortunately, such complex
comparative procedures are beyond the scope of this project, requiring more resources
than are available.
The next decision concerns which sources the project should track. Basically,
there should be representative samples from both the user-oriented Internet domain and
the mainstream media. There should also be some kind of balance between the two sides:
tracking a small number of technology-oriented websites compared to the output of all
America’s newspapers, for example, would provide results that, while interesting in their
own right, would not serve our purpose. First, I shall outline the options for each side,
and then discuss the chosen ones.
27 Watts and Porter, 1997, p. 27.

20
The Internet
1. The immediately obvious sources, when it comes to searching the Internet, are
conventional search engines. Enter a search term and it will tell you how many
pages in its database match the term. While convenient, this is less than ideal.
First, one is not searching the Internet, but the search engine’s database; if the
database isn’t updated for several weeks then the results will not change. Second,
even when the database is updated frequently it can take weeks for the engine’s
“spider” to index all of the millions (or billions) of pages. There is, therefore, a
delay between what appears on the Internet and what is available to be searched.
Third, finding data for specific time periods is impossible: we cannot search the
Web as it was this time last year.
2. Usenet newsgroups provide, currently, around 28,000 discussion groups, each
devoted to a specific topic. The system was started in 1979 by three students at
Duke University and the University of North Carolina28, and it continues to grow.
It is possible to search newsgroups using Deja.com, a site that indexes all
newsgroup postings dating back to 1995 (although only those from the past 12
months are, at the time of writing, available via its website). Newsgroups provide
a huge array of conversations on any conceivable topic, and all searchable by time
on Deja.com.
3. Email lists provide an alternative to Usenet for discussing specific (or not so
specific) issues. They are popular not just for the convenience of having the posts
arrive in one’s email inbox, but also because they can be more private than
newsgroups. The “signal to noise ratio” is therefore much higher. With the growth
of sites such as eGroups.com, setting up mailing lists has become increasingly
easy. However, it is impossible to search the content of a large number of mailing
28 Castells, 1996, p. 353.

21
lists; if it was possible to search all of eGroups’ lists, this would be a useful
alternative to newsgroups.
4. Weblogs are a fairly recent phenomenon. A weblog is a website, usually
maintained by one person, that is usually updated on a daily basis listing news
stories and websites the owner finds interesting. While people have been doing
this for many years without a defining term, the idea has boomed in the past
couple of years, thanks in part to the advent of tools that make the process easier
(for more history and explanation of weblogs, see Appendix B). Tracking weblogs
would allow us to see what was on the minds of those that maintain them on a
daily basis. There is currently no way to search a large number of weblogs at once,
however, although a custom program could track a pre-defined list of weblogs on a
regular basis.
When it comes to grassroots Internet sources, Usenet stands out as the best
example. Conventional search engines are not as suitable for the task, and it is impossible
to search many mailing lists at once. With the aid of Deja.com it is also possible to search
old Usenet postings, which, would allow us to look for patterns retroactively. It would
then be possible to look retroactively for patterns in the propagation of memes that have
now become widespread.
At the same time, weblogs are intriguing. The people who run weblogs frequently
spend a large amount of time online and are always looking out for new and interesting
things. They receive kudos for finding something first – i.e., before any other weblog or
news source.29 They are the “natural scanners” of the Internet. It would be useful
therefore, in addition to tracking Usenet, to track a number of weblogs to see if there are
any patterns to be found. On the other hand, it would be prohibitive to track hundreds or
thousands of weblogs, but a manageable sample of at least a hundred of the most popular
weblogs may be interesting as a comparison to see if they really are ahead of the game.
29 There is even a page dedicated to tracking which weblogs and news sources are first to link to otherplaces on the web: pine.cs.yale.edu/blogs/scoops.html

22
Even a sample of this size may not provide useful data. Assuming the average
daily weblog entry is a handful of paragraphs on a variety of topics, the chances of there
being a representative number of “hits” for any chosen word seem slim at this stage, and a
good reason for not using weblogs as a primary data source. If the larger weblog-building
tools, such as Blogger,30 allowed time-based searching of all the weblogs on their system,
this would have been an extremely useful facility in terms of this project.
Mainstream media
Between TV, radio and printed material only the latter provides any way of searching for
frequency of use, so at the risk of instantly ignoring two of the past century’s biggest
forms of media, this research will look at print as the indicator for mainstream media.
There are a number of methods of searching the print-based media:
1. Lexis-Nexis is a traditional database of printed news and magazines from around
the world. It currently lists 58 sources with historical archives. While searchable it
is not possible to automate the searches. e.g., finding the number of times a word
was used each week over the past year requires fifty-two searches of the database.
2. Online news aggregators like Excite’s NewsTracker allow the user to search large
numbers of online news sources (currently around 300 on NewsTracker). 31 These
are mainly mainstream properties that have websites, with the addition a few
purely online operations. It would be possible to automate searches of
NewsTracker, saving much time, but there are two disadvantages: the archives
only date back a few days and the source articles may not last long on their own
sites which restricts the ability to examine the full text.
3. A custom-built program to search a set list of news websites. This program could
visit each site in turn, look at every current story and search them for occurrences
of the words to track. The benefit of this system is that the list of sources could
30 www.blogger.com31 nt.excite.com

23
be customised. However, like NewsTracker, it would be restricted to sources that
are on the web and would require a large amount of maintenance. For example,
every source that redesigned its website may cause the program to break, and
merely making sure it was performing correctly could be a major overhead.
None of the mainstream media sources are ideal, but Lexis-Nexis is the most suitable. The
disadvantage is the expense of accessing it outside the college environment since this
study will continue after graduation. However, a custom tracking program would not be
able to track a suitably large sample without a prohibitive amount of work and computing
resources anyway. I am also wary of relying on a site such as NewsTracker that, given
the Internet industry’s volatility, may drastically change its list of sources or its process,
or even cease to exist, with no notice.
Time interval
The next step is to decide on the time intervals. The ideal would be data each day to get a
fine-grained view of the changes over time. Some terms will change quickly from day-to-
day, and it would be interesting to track these changes. However, the inability to
automate the Lexis-Nexis search process means some compromises will have to be made.
While it is possible to return the number of times a word is used on any one day, it means
365 such manual searches will have to be made for every word to obtain just a year of
data. With a long list of words this will take a prohibitive amount of time and a time
interval of a week would be better. A week should be fine-grained enough to provide a
reasonably useful look at change over time.
Adjusting for size of source material
Having decided on searching for a list of definite words, a statistical factor needs to be
tackled: any increase in volume of the source will skew the results. e.g., if the amount of
text posted to Usenet grows, direct comparisons of the frequency of meme appearance
will not be useful; any growth may simply reflect the larger quantity of source material.

24
To combat this problem, the search will also include a set of “baseline” terms. These
terms will be words that are unlikely to change in their frequency of use over the lifetime
of this project. (Obviously, over long periods the use of language will change but there is
little that can be done to account for this.) These baseline words will effectively be an
indicator of the amount of content in the database, in the absence of a total word count.
The results of searches for the monitored words can then be adjusted by any changes in
the amount of baseline words to provide an adjusted total for each time period.
A number of factors need to be considered in selecting the baseline words. First,
the words should not be part of a common brand or product name, or something else
whose use is likely to change over a short period of time. Second, the words chosen
should have fairly similar frequency of use. If one is consistently used fifty times more
than any other, fluctuations in its use will disproportionately affect the baseline average.
Third, each word should be used frequently enough that an average over time will be
representative, but not so much that it appears more than a few hundred times per week
in Lexis-Nexis. This is a purely practical restriction; any search on Lexis-Nexis returning
more than 1,000 matches does not show the quantity.
I also imposed minimum-occurrence limits. If words are only used a couple of
times per week there is too much potential for drastic fluctuations in use. I therefore set
minimum limits of 100 uses per week in Lexis-Nexis and 1,000 on Usenet, the variance
due to the vastly different volume of material in each source. I decided that a pool of ten
words matching these requirements would provide a suitable baseline.
I used a systematic random sample of sixty words from the dictionary and found
the frequency of use of each of these for a week from the past year picked at random (the
week beginning 26th June 2000). I discarded the words that did not meet the minimum or
maximum frequency requirements, leaving twenty. To choose the pool of ten I ranked
these words by ratio of frequency on Usenet to Lexis-Nexis. This indicates words that
probably have the same usage patterns in the two domains. Table 1 shows the twenty
words, with the pool selected being the first ten.

25
Table 1. Frequency of use of words randomly chosen as baseline words.
Word Deja.com Lexis-Nexis Ratio
1 vice 6,214 706 9
2 aid 6,063 658 9
3 retail 6,969 603 12
4 ranch 1,180 102 12
5 schedule 7,798 429 18
6 skill 8,362 400 21
7 wire 6,728 276 24
8 animal 13,833 556 25
9 twist 4,049 127 32
10 jet 5,941 176 34
11 pearl 4,644 104 45
12 bus 11,091 248 45
13 previous 22,989 485 47
14 light 43,303 867 50
15 secure 8,757 173 51
16 signal 11,683 224 52
17 gun 19,329 364 53
18 direction 16,416 266 62
19 harm 7,086 114 62
20 tend 14,206 145 98
Having selected the ten words and gathered the full data for each one, it became
apparent that some frequencies showed much greater variance over time than others.
While the usage of most of these words tended to rise and fall approximately together,
indicating greater and lesser amounts of source data, a few showed wildly different
variations. As these words are intended to act purely as an indication of quantity of
source material I measured the variance of each word over the full time period and rejected
those whose variance was markedly greater than the rest of the sample. These were
‘animal’ on Deja.com and ‘vice’ on Lexis-Nexis.
Figures 3 and 4 show the frequencies of these ten words on Deja.com and Lexis-
Nexis (without the words rejected for excessive variance).
26
0
2,000
4,000
6,000
8,000
10,000
12,000
1999-0
8-0
9
1999-0
8-2
3
1999-0
9-0
6
1999-0
9-2
0
1999-1
0-0
4
1999-1
0-1
8
1999-1
1-0
1
1999-1
1-1
5
1999-1
1-2
9
1999-1
2-1
3
1999-1
2-2
7
2000-0
1-1
0
2000-0
1-2
4
2000-0
2-0
7
2000-0
2-2
1
2000-0
3-0
6
2000-0
3-2
0
2000-0
4-0
3
2000-0
4-1
7
2000-0
5-0
1
2000-0
5-1
5
2000-0
5-2
9
2000-0
6-1
2
2000-0
6-2
6
2000-0
7-1
0
2000-0
7-2
4
2000-0
8-0
7
2000-0
8-2
1
2000-0
9-0
4
2000-0
9-1
8
2000-1
0-0
2
2000-1
0-1
6
Num
ber
of
post
ings
per
wee
kaid
jet
ranchretail
scheduleskill
twist
vicewire
Figure 3. Frequency of baseline words on Deja.com
0
100
200
300
400
500
600
700
800
900
1,000
1999-0
8-0
9
1999-0
8-2
3
1999-0
9-0
6
1999-0
9-2
0
1999-1
0-0
4
1999-1
0-1
8
1999-1
1-0
1
1999-1
1-1
5
1999-1
1-2
9
1999-1
2-1
3
1999-1
2-2
7
2000-0
1-1
0
2000-0
1-2
4
2000-0
2-0
7
2000-0
2-2
1
2000-0
3-0
6
2000-0
3-2
0
2000-0
4-0
3
2000-0
4-1
7
2000-0
5-0
1
2000-0
5-1
5
2000-0
5-2
9
2000-0
6-1
2
2000-0
6-2
6
2000-0
7-1
0
2000-0
7-2
4
2000-0
8-0
7
2000-0
8-2
1
2000-0
9-0
4
2000-0
9-1
8
2000-1
0-0
2
2000-1
0-1
6
Num
ber
of
arti
cles
per
wee
k
aid
animal
jetranch
retail
scheduleskill
twist
wire
Figure 4. Frequency of baseline words on Lexis-Nexis
Below is a graph showing the percentage change from the average word count for
both domains. The total frequency count for all ten words over the period of the project
is found and then the average count per week. If, for example, the average word count per
week was 1,000 and the week of September 20 1999 had a total baseline word count of
1,100, the percentage change for that week would be 10 percent, indicating a higher than
average amount of material. Later, when looking at the tracked memes, every frequency
count for that week will be adjusted down to reflect the fact we are looking at a larger
amount of material. The formula will be:
adjusted frequency = frequency x (100 / (100 + %change) )
where “%change” is the change in the baseline word frequency shown below. Adding 100
to this figure gives us the index of the baseline word frequency.

27
-25.00
-20.00
-15.00
-10.00
-5.00
0.00
5.00
10.00
15.00
20.00
19
99
-08
-09
19
99
-08
-23
19
99
-09
-06
19
99
-09
-20
19
99
-10
-04
19
99
-10
-18
19
99
-11
-01
19
99
-11
-15
19
99
-11
-29
19
99
-12
-13
19
99
-12
-27
20
00
-01
-10
20
00
-01
-24
20
00
-02
-07
20
00
-02
-21
20
00
-03
-06
20
00
-03
-20
20
00
-04
-03
20
00
-04
-17
20
00
-05
-01
20
00
-05
-15
20
00
-05
-29
20
00
-06
-12
20
00
-06
-26
20
00
-07
-10
20
00
-07
-24
20
00
-08
-07
20
00
-08
-21
20
00
-09
-04
20
00
-09
-18
20
00
-10
-02
20
00
-10
-16
Lexis-Nexis Deja.com
Figure 5. Percentage change from average baseline word count.
Weblogs process
When it comes to tracking terms on weblogs, it will be possible, given the smaller size of
the sample, to obtain an accurate word count of the texts looked at, so there is no need for
baseline words as an indicator of sample size.
In order to select a list of weblogs, I wanted to use some reasonably objective
source, rather than simply pick some myself. Given that I am attempting to track the
diffusion of memes, selecting weblogs that are popular will provide a better indicator of
ideas that are spreading; if more people are reading them, the more these memes will
spread. Ideally, we should perhaps take into account the number of readers of each
weblog. We could then see approximately how many people have read the words we are
tracking. Finding out how many readers all the weblogs have is not possible
unfortunately, so it should be borne in mind that we are tracking the publishing of memes
rather than the reading of them. To construct the list of weblogs to track I settled on
combining two sources:
• Weblog Fan-Favourites (jim.roepcke.com/fan-faves). This page uses data from
Weblogs.com, a directory of weblogs. Members can build lists of their favourite
weblogs, and Fan-Favourites lists the top 100 weblogs by the number of times
they appear on these lists.

28
• Metalog Ratings (beebo.org/metalog/ratings/). A list of 400 weblogs is scanned
every day for links to other weblogs. Every weblog that is linked to gets a point.
The top 50 most-linked-to weblogs are listed here.
I combined these two lists, eliminating duplicates, a handful of non-English-language
weblogs, and a couple that are either conventional news sites (e.g., O’Reilly Network) or
don’t fit the common description of weblogs (e.g., Need to Know, a weekly newsletter).
This process left a list of just over 100 weblogs. Over time these charts change, partly
due to changing popularity, but also due to some ceasing publication, some changing their
domain and/or name, and some starting up. To keep the list up to date I will frequently
compare it to these two charts and add weblogs that are not currently on my list. As
weblogs die, they will be removed from the list. If they change their domain they will also
be removed (although their new form may appear on the charts, in which case they will be
added in their new guise). The full list of tracked weblogs, and those found on the above
sources that are not included, can be found in Appendix C.
I then wrote a program that visits each of these weblogs once per day and looks at
the current day’s entries. If the entry has changed since the previous day, i.e., it is
today’s entry, it is scanned for the number of times each of the tracked words is used
(including in URLs) and this information is stored in a database. A few sites do not split
entries up by day, so I estimated how many entries the site displays each day and this
many are used for the day’s entry (it is checked for new material before being examined
for memes). The total number of words in the entry is also added to the day’s total word
count. This will be used to adjust the tracked-word data in a similar fashion to the
frequency of baseline words in the Usenet/Lexis-Nexis tracking.
29
V. RESULTS
First, a note about problems I found with the Deja.com Usenet archive that have resulted
in difficulties with some results. The most unfortunate problem, mentioned earlier in
Method, is that the archive does not currently stretch back to 1995, when Deja began
archiving Usenet posts. The site claims the currently available archive dates back to May
1999 but even this seems optimistic and I could find few posts before the second week of
August 1999. This, then, is the first date this study looks at. The second problem is the
difficulty of searching for terms that include more than one word (for example, “Macy
Gray”). Deja.com does not provide accurate counts of search results when more than 100
results are returned. I worked around this by searching for such terms on a daily, rather
than weekly, basis and totalling the results for each week. However, one term, “Blair
Witch Project,” returned more than 100 results per day on many occasions and I thus had
to leave it from the study due to lack of data. Finally, towards the end of the study
Deja.com appeared to lose some of its data. While I had previously successfully obtained
data for the duration of the study all of the posts between August 27 2000 and September
6 2000, and many either side of that period, appear to have disappeared from the archive.
Thankfully most of my research was complete by the time this happened, but a couple of
terms suffer from lack of data around this period.
The full data and graphs for each tracked word can be found in Appendix A. Here
I shall group the results into common patterns using a few of the words as illustration.
First, I shall look at the frequency of word usage over time, grouped into four distinct
patterns. Second, I shall discuss the cumulative frequency graphs to see what further
information these reveal. These are grouped into five kinds of pattern. All the graphs

30
shown in this section display the word counts adjusted according to the volume of
material posted or published, as discussed in Method. Finally I will discuss the results
from the monitoring of weblogs.
Frequency of word use
The four pattern groups are: A general correlation of frequency between domains over the
length of the study; Correlation only on a few dates when frequency suddenly rose
dramatically and momentarily; No apparent correlation between domains; Those terms
whose first use falls within the duration of the study.
There are a few terms which barely registered a presence in the newspapers
archived by Lexis-Nexis. I have not included these within this comparison between the
two domains. These terms are: blog, blogger, eazel, kathryn williams, mozilla, ogg vorbis ,
sdmi, weblog.
1. General correlation
Of the 24 remaining search terms twelve showed a noticeable correlation between
domains over the duration of the study (figures after the term indicate the statistical
correlation between each domain, with 0 indicating no correlation and 1 being perfect
positive correlation): badly drawn boy (0.725), britney (0.614), genome (0.644), gnutella
(0.845), i-mode (0.375), institutionalised/institutionalized racism (0.296), macy gray
(0.664), napster (0.946), pokemon (0.823), reality tv (0.709), wap (0.821), and who wants
to be a millionaire (0.794). The increases and decreases in frequency on both Deja and
Lexis-Nexis follow similar patterns over time and not solely on a few extreme occasions.
Perhaps the best example of this is shown in Figure 6, who wants to be a millionaire, (the
sudden drop in Deja frequency towards the end of the period is due to the disappearance
of data mentioned above).

31
0
10
20
30
40
50
60
70
80
90
100
110
1999-0
8-0
9
1999-0
8-2
3
1999-0
9-0
6
1999-0
9-2
0
1999-1
0-0
4
1999-1
0-1
8
1999-1
1-0
1
1999-1
1-1
5
1999-1
1-2
9
1999-1
2-1
3
1999-1
2-2
7
2000-0
1-1
0
2000-0
1-2
4
2000-0
2-0
7
2000-0
2-2
1
2000-0
3-0
6
2000-0
3-2
0
2000-0
4-0
3
2000-0
4-1
7
2000-0
5-0
1
2000-0
5-1
5
2000-0
5-2
9
2000-0
6-1
2
2000-0
6-2
6
2000-0
7-1
0
2000-0
7-2
4
2000-0
8-0
7
2000-0
8-2
1
2000-0
9-0
4
2000-0
9-1
8
2000-1
0-0
2
2000-1
0-1
6
0
50
100
150
200
250
300
350
400
450
Lexis-Nexis Deja.com
Figure 6. Frequency of who wants to be a millionaire.
_ This graph shows an interesting phenomenon rarely seen elsewhere. The first two large
peaks (August 1999 and mid-November 1999) show discussion on Usenet peaking the
week before media interest reaches its high point for the period. This behaviour does not
extend to the rest of the data for this term. If Usenet was, say, one week ahead of the
press then lagging the Deja.com data by one week should show the correlation rising.
However, for the period from 16 August 1999 to 28 August 2000 (immediately prior to
the Deja.com data loss) the correlation drops from 0.820 to 0.726. So, while we can see
interest on Usenet occasionally peaks ahead of the newspapers this is not a consistent
occurrence. Such pre-empting of activity on Lexis-Nexis by Usenet is rarely found in any
other graphs with a substantial level of Lexis-Nexis frequency. The only exceptions being
one peak for britney and two for i-mode. Where there is some similarities between peaks
they are usually simultaneous in each domain.
The graphs of other terms are just as closely matched, e.g., britney (Figure 7) and
napster (Figure 8). Others are not but demonstrate a noticeable similarity between the
two domains over time. The graph for pokemon, for example, shows a large increase in
frequency in both domains over a period of around ten weeks, accompanied by a slight
drop in frequency towards the end of the study.

32
0
20
40
60
80
100
1999-0
8-0
9
1999-0
8-2
3
1999-0
9-0
6
1999-0
9-2
0
1999-1
0-0
4
1999-1
0-1
8
1999-1
1-0
1
1999-1
1-1
5
1999-1
1-2
9
1999-1
2-1
3
1999-1
2-2
7
2000-0
1-1
0
2000-0
1-2
4
2000-0
2-0
7
2000-0
2-2
1
2000-0
3-0
6
2000-0
3-2
0
2000-0
4-0
3
2000-0
4-1
7
2000-0
5-0
1
2000-0
5-1
5
2000-0
5-2
9
2000-0
6-1
2
2000-0
6-2
6
2000-0
7-1
0
2000-0
7-2
4
2000-0
8-0
7
2000-0
8-2
1
2000-0
9-0
4
2000-0
9-1
8
2000-1
0-0
2
2000-1
0-1
6
0
500
1000
1500
2000
2500
3000
3500
4000
4500
5000
Lexis-Nexis Deja.com
Figure 7. Frequency of britney.
0
20
40
60
80
100
120
140
160
180
200
1999-0
8-0
9
1999-0
8-2
3
1999-0
9-0
6
1999-0
9-2
0
1999-1
0-0
4
1999-1
0-1
8
1999-1
1-0
1
1999-1
1-1
5
1999-1
1-2
9
1999-1
2-1
3
1999-1
2-2
7
2000-0
1-1
0
2000-0
1-2
4
2000-0
2-0
7
2000-0
2-2
1
2000-0
3-0
6
2000-0
3-2
0
2000-0
4-0
3
2000-0
4-1
7
2000-0
5-0
1
2000-0
5-1
5
2000-0
5-2
9
2000-0
6-1
2
2000-0
6-2
6
2000-0
7-1
0
2000-0
7-2
4
2000-0
8-0
7
2000-0
8-2
1
2000-0
9-0
4
2000-0
9-1
8
2000-1
0-0
2
2000-1
0-1
6
0
2000
4000
6000
8000
10000
12000
14000
16000
Lexis-Nexis Deja.com
Figure 8. Frequency of napster.
One peculiarity with this list of terms is that of the six commercial, non-
computer-oriented terms in this study (either TV shows or pop stars), all but one are
included in this category. The only other such term in the entire survey (counting the 24
terms which had significant results on Lexis-Nexis) is david gray, the results of which are
rather skewed by the existence of more than one David Gray. If we include the three
computer-oriented brand names (daikatana, i-mode and napster), this list contains seven
of the nine such terms. This is a less easy to define distinction, however. These nine
terms do not include linux or sms , but do include i-mode.

33
2. Correlation on a few peaks only
It is impossible to definitively measure this category particularly with terms whose usage
fluctuates wildly; do those few matching peaks mean a correlation or, given the total
number of peaks, is it purely chance? However, I would definitely include in this category
the following terms: cybersquatting, denial of service, dna computing/er, docusoap and
weblog.
Denial of service, shown in Figure 9, demonstrates affinity between the two
domains on one occasion when many high-profile websites were affected by such attacks.
But there are no other similarities between the results from Usenet and the press.
0
5
10
15
20
25
30
1999-0
8-0
9
1999-0
8-2
3
1999-0
9-0
6
1999-0
9-2
0
1999-1
0-0
4
1999-1
0-1
8
1999-1
1-0
1
1999-1
1-1
5
1999-1
1-2
9
1999-1
2-1
3
1999-1
2-2
7
2000-0
1-1
0
2000-0
1-2
4
2000-0
2-0
7
2000-0
2-2
1
2000-0
3-0
6
2000-0
3-2
0
2000-0
4-0
3
2000-0
4-1
7
2000-0
5-0
1
2000-0
5-1
5
2000-0
5-2
9
2000-0
6-1
2
2000-0
6-2
6
2000-0
7-1
0
2000-0
7-2
4
2000-0
8-0
7
2000-0
8-2
1
2000-0
9-0
4
2000-0
9-1
8
2000-1
0-0
2
2000-1
0-1
6
0
50
100
150
200
250
300
350
400
450
500
Lexis-Nexis Deja.com
Figure 9. Frequency of denial of service.
3. No correlation
There are eight terms for whom it is impossible to recognise any correlation
between frequencies in the two domains: aimster, daikatana, david gray, digital rights
management, freenet, linux, mp3 and sms . Figure 10 shows the frequency of daikatana.
The peak in April on Deja.com is discussion of the demo version of the game being
released and that in May is the release of the final game. Reviews in the press only appear
in June and July, however.

34
0
1
2
3
4
5
1999-0
8-0
9
1999-0
8-2
3
1999-0
9-0
6
1999-0
9-2
0
1999-1
0-0
4
1999-1
0-1
8
1999-1
1-0
1
1999-1
1-1
5
1999-1
1-2
9
1999-1
2-1
3
1999-1
2-2
7
2000-0
1-1
0
2000-0
1-2
4
2000-0
2-0
7
2000-0
2-2
1
2000-0
3-0
6
2000-0
3-2
0
2000-0
4-0
3
2000-0
4-1
7
2000-0
5-0
1
2000-0
5-1
5
2000-0
5-2
9
2000-0
6-1
2
2000-0
6-2
6
2000-0
7-1
0
2000-0
7-2
4
2000-0
8-0
7
2000-0
8-2
1
2000-0
9-0
4
2000-0
9-1
8
2000-1
0-0
2
2000-1
0-1
6
0
100
200
300
400
500
600
700
800
900
Lexis-Nexis Deja.com
Figure 10. Frequency of daikatana.
4. First usage is visible
There are three terms that are included in the above three categories but are also distinct
because they first appeared during the research period: eazel, gnutella and napster.
Between these three there is little in the way of common patterns. Napster, as shown
below, is already present on Usenet at the start of the study, with just under 30 posts per
week. Apart from a single mention in December 1999 it doesn’t make a regular
appearance in newspapers until mid-January 2000. Gnutella, Napster’s file-sharing
cousin, on the other hand, appears almost simultaneously in both domains in March 2000
and follows a similar pattern on and offline thereafter. Eazel is somewhere between these
two. There are very occasional mentions on Usenet beginning in September 1999 but it is
only a couple of weeks before it hits the press in February 2000 that discussion becomes
more regular.

35
0
20
40
60
80
100
120
140
160
180
200
1999-0
8-0
9
1999-0
8-2
3
1999-0
9-0
6
1999-0
9-2
0
1999-1
0-0
4
1999-1
0-1
8
1999-1
1-0
1
1999-1
1-1
5
1999-1
1-2
9
1999-1
2-1
3
1999-1
2-2
7
2000-0
1-1
0
2000-0
1-2
4
2000-0
2-0
7
2000-0
2-2
1
2000-0
3-0
6
2000-0
3-2
0
2000-0
4-0
3
2000-0
4-1
7
2000-0
5-0
1
2000-0
5-1
5
2000-0
5-2
9
2000-0
6-1
2
2000-0
6-2
6
2000-0
7-1
0
2000-0
7-2
4
2000-0
8-0
7
2000-0
8-2
1
2000-0
9-0
4
2000-0
9-1
8
2000-1
0-0
2
2000-1
0-1
6
0
2000
4000
6000
8000
10000
12000
14000
16000
Lexis-Nexis Deja.com
Figure 11. Frequency of napster.
Cumulative frequency of word use
Looking at the cumulative count of word usage gives us some idea of whether something
is being talked about more or less often over time. The spikes invariably found on the
plain frequency graphs are smoothed out and we instead look at the slope of the
cumulative line. If it shows a linear increase then usage has remained at a steady rate, with
a similar total of word usage being added to the cumulative total every week. If the graph
shows the line becoming steeper then use of the word is becoming increasingly common.
Conversely, if the slope levels off then usage is less frequent than it once was.
I have divided these graphs into five groups: Graphs that show increasing usage
over time, those that show a steady rate of use, those that level off, those that show an s-
curve, and three that do not fit into the previous four groups. The divisions between these
groups are far from hard and fast. In some cases it is hard to distinguish between a line
showing a steady rate of use and one that might display a gradual increase in frequency
towards its end.
1. Increasing usage over time
Of the 32 terms, 11 show an increase in frequency of use over the duration of the study:
aimster, badly drawn boy, blogger, digital rights management, i-mode, napster, ogg

36
vorbis , reality tv, wap and weblog. The graph for wap, shown below, shows a noticeable
increase in frequency of use that is shown as a gradual curve on the Deja line and a sudden
change of direction for Lexis-Nexis around the end of January 2000. Thereafter the
frequency remains more or less steady for the remainder of the study.
0
200
400
600
800
1000
1200
1999-0
8-0
9
1999-0
8-2
3
1999-0
9-0
6
1999-0
9-2
0
1999-1
0-0
4
1999-1
0-1
8
1999-1
1-0
1
1999-1
1-1
5
1999-1
1-2
9
1999-1
2-1
3
1999-1
2-2
7
2000-0
1-1
0
2000-0
1-2
4
2000-0
2-0
7
2000-0
2-2
1
2000-0
3-0
6
2000-0
3-2
0
2000-0
4-0
3
2000-0
4-1
7
2000-0
5-0
1
2000-0
5-1
5
2000-0
5-2
9
2000-0
6-1
2
2000-0
6-2
6
2000-0
7-1
0
2000-0
7-2
4
2000-0
8-0
7
2000-0
8-2
1
2000-0
9-0
4
2000-0
9-1
8
2000-1
0-0
2
2000-1
0-1
6
0
10000
20000
30000
40000
50000
60000
Lexis-Nexis Deja.com
Figure 12. Cumulative count of wap.
2. Steady rate of use
Eleven of the 32 terms fall within this category of cumulative graphs: britney,
cybersquatting, dna computing/er, docusoap, freenet, genome,
institutionalised/institutionalized racism, linux, mp3, sdmi and sms . There are variations
within this however, and some could almost be interpreted as very slightly rising or
falling. An interesting example is the cumulative graph for genome, shown below. We can
ignore the first small jump in the Deja.com line as this is due to thousands of identical
messages sent to a single newsgroup. So, other than the jump in both lines around June
2000 we could see this graph showing a steady rate of use over time. Alternatively, the
Lexis-Nexis line could be interpreted differently, leaving aside the sudden jump: the early
part of the line actually shows a slight increase in frequency over time, with the line
trending upwards, while the latter part appears to show the rate dropping slightly. This
could almost be interpreted as a subtle s-curve!

37
0
200
400
600
800
1000
1200
1400
1600
1800
1999-0
8-0
9
1999-0
8-2
3
1999-0
9-0
6
1999-0
9-2
0
1999-1
0-0
4
1999-1
0-1
8
1999-1
1-0
1
1999-1
1-1
5
1999-1
1-2
9
1999-1
2-1
3
1999-1
2-2
7
2000-0
1-1
0
2000-0
1-2
4
2000-0
2-0
7
2000-0
2-2
1
2000-0
3-0
6
2000-0
3-2
0
2000-0
4-0
3
2000-0
4-1
7
2000-0
5-0
1
2000-0
5-1
5
2000-0
5-2
9
2000-0
6-1
2
2000-0
6-2
6
2000-0
7-1
0
2000-0
7-2
4
2000-0
8-0
7
2000-0
8-2
1
2000-0
9-0
4
2000-0
9-1
8
2000-1
0-0
2
2000-1
0-1
6
0
5000
10000
15000
20000
25000
30000
35000
40000
45000
50000
Lexis-Nexis Deja.com
Figure 13. Cumulative count of genome.
3. Decreasing usage over time
There are only two terms that clearly fall into this category: mozilla and pokemon. The
former has too few uses on Lexis-Nexis to generate a useful graph, but shows a sudden
drop in usage on Usenet around June 2000. The graph for pokemon, shown below, shows
a gradual decline in use on Usenet and a different pattern in the press resulting, after a
period of increased use, in a similar gradual decline. The Lexis-Nexis pattern is more of an
s-curve than a simple decline in use.
0
500
1000
1500
2000
2500
1999-0
8-0
9
1999-0
8-2
3
1999-0
9-0
6
1999-0
9-2
0
1999-1
0-0
4
1999-1
0-1
8
1999-1
1-0
1
1999-1
1-1
5
1999-1
1-2
9
1999-1
2-1
3
1999-1
2-2
7
2000-0
1-1
0
2000-0
1-2
4
2000-0
2-0
7
2000-0
2-2
1
2000-0
3-0
6
2000-0
3-2
0
2000-0
4-0
3
2000-0
4-1
7
2000-0
5-0
1
2000-0
5-1
5
2000-0
5-2
9
2000-0
6-1
2
2000-0
6-2
6
2000-0
7-1
0
2000-0
7-2
4
2000-0
8-0
7
2000-0
8-2
1
2000-0
9-0
4
2000-0
9-1
8
2000-1
0-0
2
2000-1
0-1
6
0
50000
100000
150000
200000
250000
Lexis-Nexis Deja.com
Figure 14. Cumulative count of pokemon.

38
4. Complete s-curves
Five terms have graphs that look like s-curves, although some are very close to straight
lines: daikatana, david gray, gnutella, macy gray, and who wants to be a millionaire. The
graph for macy gray, shown below, is the most distinct example of an s-curve with usage
in both domains following a similar pattern of increasing use followed by a decline
towards the end of the study.
0
50
100
150
200
250
300
350
400
450
500
1999-0
8-0
9
1999-0
8-2
3
1999-0
9-0
6
1999-0
9-2
0
1999-1
0-0
4
1999-1
0-1
8
1999-1
1-0
1
1999-1
1-1
5
1999-1
1-2
9
1999-1
2-1
3
1999-1
2-2
7
2000-0
1-1
0
2000-0
1-2
4
2000-0
2-0
7
2000-0
2-2
1
2000-0
3-0
6
2000-0
3-2
0
2000-0
4-0
3
2000-0
4-1
7
2000-0
5-0
1
2000-0
5-1
5
2000-0
5-2
9
2000-0
6-1
2
2000-0
6-2
6
2000-0
7-1
0
2000-0
7-2
4
2000-0
8-0
7
2000-0
8-2
1
2000-0
9-0
4
2000-0
9-1
8
2000-1
0-0
2
2000-1
0-1
6
0
1000
2000
3000
4000
5000
6000
Lexis-Nexis Deja.com
Figure 15. Cumulative count of macy gray.
5. Other patterns
Three terms do not fit easily into the previous four categories, displaying more erratic
patterns: denial of service, eazel and kathryn williams. The graph for eazel, shown below,
is a good example. The line for Deja.com shows a sudden large jump in February 2000
and although it settles down after this the rate of use is still far greater than it was prior to
the jump. Six months later another similar jump occurs, with usage then returning to the
intermediate level again. Given that there are only a total of six uses on Lexis-Nexis for the
entire duration of the study, I would normally be tempted to ignore the results. However,
it is interesting that even this small sample matches the pattern of use on Deja.com.

39
0
1
2
3
4
5
6
7
1999-0
8-0
9
1999-0
8-2
3
1999-0
9-0
6
1999-0
9-2
0
1999-1
0-0
4
1999-1
0-1
8
1999-1
1-0
1
1999-1
1-1
5
1999-1
1-2
9
1999-1
2-1
3
1999-1
2-2
7
2000-0
1-1
0
2000-0
1-2
4
2000-0
2-0
7
2000-0
2-2
1
2000-0
3-0
6
2000-0
3-2
0
2000-0
4-0
3
2000-0
4-1
7
2000-0
5-0
1
2000-0
5-1
5
2000-0
5-2
9
2000-0
6-1
2
2000-0
6-2
6
2000-0
7-1
0
2000-0
7-2
4
2000-0
8-0
7
2000-0
8-2
1
2000-0
9-0
4
2000-0
9-1
8
2000-1
0-0
2
2000-1
0-1
6
0
100
200
300
400
500
600
Lexis-Nexis Deja.com
Figure 16. Cumulative count of eazel.
Weblog results
Unfortunately, given that there is no way of retroactively searching posts to weblogs, we
have a limited amount of weblog-related data, only ten weeks. Given this short window of
time it is not possible to compare usage directly between weblogs, Usenet and the press.
However, by comparing graphs in Appendix A we can immediately see how some terms
are used far more frequently on weblogs than others. Many were never used during these
ten weeks, or only a small number of times. Others occurred as much as once per day per
weblog on average. Linux, for example, was used 1,282 times in ten weeks on just over
100 weblogs! I will return to this matter in the Conclusion.

40
VI. CONCLUSION
Before discussing the questions posed in Expectations, I would first like to cover some of
the problems found with the method.
While Deja.com’s Usenet archive is an invaluable research tool, I encountered
more problems with it than I expected. First, the current inability to search archived posts
prior to August 1999 restricted the historical data. I feel that any patterns in the data
would have been more apparent over a longer period of time. Second, Usenet is a far from
‘clean’ source. Data were skewed on a few occasions by single messages being posted
thousands of times over the course of one or more days. Another example is the number
of ‘cancel’ posts from Mozilla which skewed much of that term’s data before the posts
suddenly disappeared part-way through the study. Third, it is hugely time-consuming to
obtain accurate counts of search matches for recent weeks and impossible to obtain
accurate data for multi-word strings that appear in more than 100 posts per day.
There are other, less serious, peculiarities inherent to Usenet itself. These become
more apparent for terms that are of fairly low frequency. While a large jump in frequency
on Lexis-Nexis can be translated as almost simultaneous interest in a topic by a number of
alternative sources, the same does not hold for Usenet. If one person posts a message on a
topic this might result in a large number of follow-up posts that would not otherwise
have occurred. This is not a problem per se, but if the overall frequency is low it generates
the appearance of many people being independently interested in something which isn’t
quite true. The situation could be more serious, however, if the thread of discussion
moves wildly off the topic we are tracking but the posts still contain the word we’re
searching for, quoted in the original message.

41
The other Usenet-specific problem is that of signatures. The data for weblog, for
example, show a large spike in July 2000 that is solely the result of a couple of people
mentioning their own weblog in their email signatures. They were extremely frequent
posters for a short period of time, resulting in this discrepancy. This is not to say the
results are flawed; we are, after all, looking at the spread of memes and, as we saw earlier,
Hotmail found messages at the end of emails to be a hugely successful means of getting
the word out. We should bear in mind that, in this case, while we see a jump in the
visibility of the weblog meme (see Figure 17) it is not a result of people discussing
weblogs.
0
1
2
3
1999-0
8-0
9
1999-0
8-2
3
1999-0
9-0
6
1999-0
9-2
0
1999-1
0-0
4
1999-1
0-1
8
1999-1
1-0
1
1999-1
1-1
5
1999-1
1-2
9
1999-1
2-1
3
1999-1
2-2
7
2000-0
1-1
0
2000-0
1-2
4
2000-0
2-0
7
2000-0
2-2
1
2000-0
3-0
6
2000-0
3-2
0
2000-0
4-0
3
2000-0
4-1
7
2000-0
5-0
1
2000-0
5-1
5
2000-0
5-2
9
2000-0
6-1
2
2000-0
6-2
6
2000-0
7-1
0
2000-0
7-2
4
2000-0
8-0
7
2000-0
8-2
1
2000-0
9-0
4
2000-0
9-1
8
2000-1
0-0
2
2000-1
0-1
6
0
20
40
60
80
100
120
140
160
180
Lexis-Nexis Deja.com
Figure 17. Frequency of weblog.
Moving on from Usenet, there were a few problems with the search terms
themselves, namely the usage of the term to refer to entities other than those which I
intended to track. One example is the number of sportsmen called David Gray, skewing
the tracking of the singer of the same name. Another is the common usage of freenet long
before the particular Freenet I intended to track even existed. There is no way to avoid
such difficulties other than to avoid such terms altogether and concentrate on those that
are as unique as possible. Even so we may run into problems; the search for aimster
turned up someone on Usenet who used this as his nickname long before the file-sharing
program was thought of!
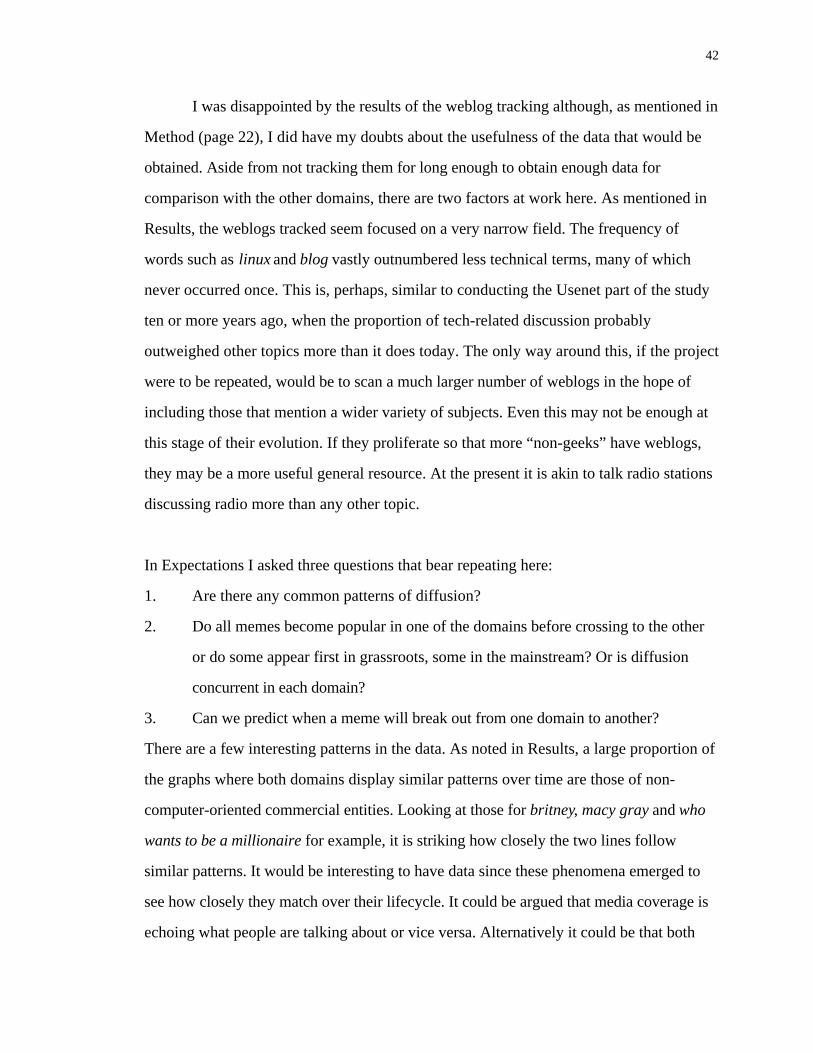
42
I was disappointed by the results of the weblog tracking although, as mentioned in
Method (page 22), I did have my doubts about the usefulness of the data that would be
obtained. Aside from not tracking them for long enough to obtain enough data for
comparison with the other domains, there are two factors at work here. As mentioned in
Results, the weblogs tracked seem focused on a very narrow field. The frequency of
words such as linux and blog vastly outnumbered less technical terms, many of which
never occurred once. This is, perhaps, similar to conducting the Usenet part of the study
ten or more years ago, when the proportion of tech-related discussion probably
outweighed other topics more than it does today. The only way around this, if the project
were to be repeated, would be to scan a much larger number of weblogs in the hope of
including those that mention a wider variety of subjects. Even this may not be enough at
this stage of their evolution. If they proliferate so that more “non-geeks” have weblogs,
they may be a more useful general resource. At the present it is akin to talk radio stations
discussing radio more than any other topic.
In Expectations I asked three questions that bear repeating here:
1. Are there any common patterns of diffusion?
2. Do all memes become popular in one of the domains before crossing to the other
or do some appear first in grassroots, some in the mainstream? Or is diffusion
concurrent in each domain?
3. Can we predict when a meme will break out from one domain to another?
There are a few interesting patterns in the data. As noted in Results, a large proportion of
the graphs where both domains display similar patterns over time are those of non-
computer-oriented commercial entities. Looking at those for britney, macy gray and who
wants to be a millionaire for example, it is striking how closely the two lines follow
similar patterns. It would be interesting to have data since these phenomena emerged to
see how closely they match over their lifecycle. It could be argued that media coverage is
echoing what people are talking about or vice versa. Alternatively it could be that both

43
domains are only responding to a third stimulus. For example, when Britney Spears is
about to release a new record resulting in increased use on Usenet and in the media one of
three things could be happening: a) People are discussing what they’ve read about in the
media, b) the media are reporting on what is a popular topic of discussion, or c) the
discussion and reporting are both simultaneously fuelled by record company publicity.
As indicated in Background, such patterns are not mutually exclusive and each affects the
other. I am skeptical, however, that discussion or reporting of commercial products could
be purely spontaneous.
Non-commercial terms generally seem to appear on Usenet before making the
newspapers but I feel much of this phenomenon could be explained purely by the
differences in amount of material. While it is possible to have an extremely low level of
discussion on Usenet, newspapers have a threshold of “newsworthiness” that holds them
back, resulting in a sporadic pattern of coverage, jumping up and down, for topics that are
“bubbling under.” It could well be that journalists’ knowledge of memes mirrors that of
posters to Usenet but this is not apparent from reading their newspapers, where memes
only appear once deemed of interest to a wider audience.
Predicting when a meme will, for example, break out from Usenet to the press
does not seem possible from these results. The differences between the form of each
domain confuse matters. So determining at what point a meme has broken out into the
mainstream, let alone predicting it, is not clear: is it when the first story appears, or when
x stories appear per week for y weeks continuously? A much larger study involving a
more extensive list of terms over a longer period may reveal more patterns leading to more
concrete conclusions on this point.
It would be interesting to test Modis’ s-curve theories but, again, the study’s
duration has not been long enough to obtain anything but the slight suggestion of s-curves
in the data. I must admit to being sceptical that the idea can be applied to the domains of
discussion or news, as opposed to the finite realms of the number of a composer’s
compositions or the amount of railroad track laid. This is not to say s-curves would not

44
be apparent, but I find it unlikely the frequency of many phenomena in the news, say,
could be described as single s-curves. The cumulative frequency graph for macy gray
shows a slight s-curve and I can imagine the cycles of album releases and publicity
creating a series of such curves over the lifetime of a performer.

45
REFERENCES
Blackmore, Susan. 1999. The Meme Machine. Oxford: Oxford University Press.
Castells, Manuel. 1996. The Rise of the Network Society. Oxford: Blackwell Publishers.
Dawkins, Richard. 1989. The Selfish Gene. Oxford: Oxford University Press.
DiLucchio, Patrizia. 1999. ‘Did “The Blair Witch Project” fake its online fan base?’
Salon, July 16.
www.salon.com/tech/feature/1999/07/16/blair_marketing/index.html
Gladwell, Malcolm, 1997. ‘The Coolhunt’ The New Yorker, March 17.
www.gladwell.com/1997_03_17_a_cool.htm
Gladwell, Malcolm. 2000. The Tipping Point: How Little Things Can Make a Big
Difference. Boston, New York, London: Little, Brown and Company.
Jurvetson, Steve and Draper, Tim. 1998. ‘Viral Marketing.’
www.drapervc.com/viralmarketing.html
Kirby, Carrie. 2000. ‘An Instant “Inner Circle” On the Net’ San Francisco Chronicle,
August 21. www.sfgate.com/cgi-
bin/article.cgi?file=/chronicle/archive/2000/08/21/BU96214.DTL
Lloyd, Christopher. 1994. ‘Are You Ready for the Future?’ The Times, November 20.

46
Modis, Theodore. 1992. Predictions. New York: Simon & Schuster.
O’Brien, Danny. 1999. ‘The Four Waves.’ www.spesh.com/danny/writing/fourwaves.html
Rogers, Everett M. 1995. Diffusion of Innovations. Fourth edition. New York: The Free
Press.
Von Hippel, Eric, Thomke, Stefan, and Sonnack, Mary. 1999. ‘Creating Breakthroughs at
3M’ Harvard Business Review, September-October, pp. 47-57.
Watts, Robert J. and Porter, Alan L. 1997. ‘Innovation Forecasting’ Technological
Forecasting and Social Change 56. Elsevier Science Inc.

47
APPENDIX A – TRACKED WORDS
The following pages show the graphs of results for each of the terms that was tracked.
There are three graphs for each term:
Frequency showing the number of times the Usenet posts or newspaper articles
that appeared each week containing the term. The graphs are based on figures adjusted for
the number of baseline words appearing per week (see page 26).
Cumulative count of the above frequency per week for both Deja.com and Lexis-
Nexis.
Weblog frequency showing the number of times the term was used on the
monitored weblogs each week (data is only available for a few weeks).

48
Aimster
A file-sharing application based on Gnutella technology, using AOL Internet Messenger.
The large August 2000 peak is just after the 9th August launch; earlier occurrences appear
to be coincidences, e.g. people using Aimster as a nickname on Usenet.
Frequency of "aimster"
0
1
2
1999-0
8-0
9
1999-0
8-2
3
1999-0
9-0
6
1999-0
9-2
0
1999-1
0-0
4
1999-1
0-1
8
1999-1
1-0
1
1999-1
1-1
5
1999-1
1-2
9
1999-1
2-1
3
1999-1
2-2
7
2000-0
1-1
0
2000-0
1-2
4
2000-0
2-0
7
2000-0
2-2
1
2000-0
3-0
6
2000-0
3-2
0
2000-0
4-0
3
2000-0
4-1
7
2000-0
5-0
1
2000-0
5-1
5
2000-0
5-2
9
2000-0
6-1
2
2000-0
6-2
6
2000-0
7-1
0
2000-0
7-2
4
2000-0
8-0
7
2000-0
8-2
1
2000-0
9-0
4
2000-0
9-1
8
2000-1
0-0
2
2000-1
0-1
6
0
5
10
15
20
25
30
35
Lexis-Nexis Deja.com
Cumulative count of "aimster"
0
1
2
3
1999-0
8-0
9
1999-0
8-2
3
1999-0
9-0
6
1999-0
9-2
0
1999-1
0-0
4
1999-1
0-1
8
1999-1
1-0
1
1999-1
1-1
5
1999-1
1-2
9
1999-1
2-1
3
1999-1
2-2
7
2000-0
1-1
0
2000-0
1-2
4
2000-0
2-0
7
2000-0
2-2
1
2000-0
3-0
6
2000-0
3-2
0
2000-0
4-0
3
2000-0
4-1
7
2000-0
5-0
1
2000-0
5-1
5
2000-0
5-2
9
2000-0
6-1
2
2000-0
6-2
6
2000-0
7-1
0
2000-0
7-2
4
2000-0
8-0
7
2000-0
8-2
1
2000-0
9-0
4
2000-0
9-1
8
2000-1
0-0
2
2000-1
0-1
6
0
50
100
150
200
250
Lexis-Nexis Deja.com
Frequency of "aimster" on weblogs
0
1
2
3
2000-0
8-2
1
2000-0
9-0
4
2000-0
9-1
8
2000-1
0-0
2
2000-1
0-1
6

49
Badly Drawn Boy
A British musician who won the country’s Mercury Music Prize in September 2000,
coinciding with the largest peak on the graph.
Frequency of "badly drawn boy"
0
1
2
3
4
5
6
7
8
9
10
11
12
13
1999-0
8-0
9
1999-0
8-2
3
1999-0
9-0
6
1999-0
9-2
0
1999-1
0-0
4
1999-1
0-1
8
1999-1
1-0
1
1999-1
1-1
5
1999-1
1-2
9
1999-1
2-1
3
1999-1
2-2
7
2000-0
1-1
0
2000-0
1-2
4
2000-0
2-0
7
2000-0
2-2
1
2000-0
3-0
6
2000-0
3-2
0
2000-0
4-0
3
2000-0
4-1
7
2000-0
5-0
1
2000-0
5-1
5
2000-0
5-2
9
2000-0
6-1
2
2000-0
6-2
6
2000-0
7-1
0
2000-0
7-2
4
2000-0
8-0
7
2000-0
8-2
1
2000-0
9-0
4
2000-0
9-1
8
2000-1
0-0
2
2000-1
0-1
6
0
10
20
30
40
50
60
Lexis-Nexis Deja.com
Cumulative count of "badly drawn boy"
0
5
10
15
20
25
30
35
40
45
50
55
60
65
1999-0
8-0
9
1999-0
8-2
3
1999-0
9-0
6
1999-0
9-2
0
1999-1
0-0
4
1999-1
0-1
8
1999-1
1-0
1
1999-1
1-1
5
1999-1
1-2
9
1999-1
2-1
3
1999-1
2-2
7
2000-0
1-1
0
2000-0
1-2
4
2000-0
2-0
7
2000-0
2-2
1
2000-0
3-0
6
2000-0
3-2
0
2000-0
4-0
3
2000-0
4-1
7
2000-0
5-0
1
2000-0
5-1
5
2000-0
5-2
9
2000-0
6-1
2
2000-0
6-2
6
2000-0
7-1
0
2000-0
7-2
4
2000-0
8-0
7
2000-0
8-2
1
2000-0
9-0
4
2000-0
9-1
8
2000-1
0-0
2
2000-1
0-1
6
0
100
200
300
400
500
600
700
Lexis-Nexis Deja.com
Frequency of "badly drawn boy" on weblogs
0
1
2000-0
8-2
1
2000-0
9-0
4
2000-0
9-1
8
2000-1
0-0
2
2000-1
0-1
6

50
Blog
An abbreviation of “weblog.” Many of the recent Usenet occurrences are a result of
posters mentioning their own blog in their email signature. It’s not discussion, but it’s
certainly another method of spreading a meme.
Frequency of "blog"
0
1
1999-0
8-0
9
1999-0
8-2
3
1999-0
9-0
6
1999-0
9-2
0
1999-1
0-0
4
1999-1
0-1
8
1999-1
1-0
1
1999-1
1-1
5
1999-1
1-2
9
1999-1
2-1
3
1999-1
2-2
7
2000-0
1-1
0
2000-0
1-2
4
2000-0
2-0
7
2000-0
2-2
1
2000-0
3-0
6
2000-0
3-2
0
2000-0
4-0
3
2000-0
4-1
7
2000-0
5-0
1
2000-0
5-1
5
2000-0
5-2
9
2000-0
6-1
2
2000-0
6-2
6
2000-0
7-1
0
2000-0
7-2
4
2000-0
8-0
7
2000-0
8-2
1
2000-0
9-0
4
2000-0
9-1
8
2000-1
0-0
2
2000-1
0-1
6
0
20
40
60
80
100
120
140
160
Lexis-Nexis Deja.com
Cumulative count of "blog"
0
1
2
3
4
1999-0
8-0
9
1999-0
8-2
3
1999-0
9-0
6
1999-0
9-2
0
1999-1
0-0
4
1999-1
0-1
8
1999-1
1-0
1
1999-1
1-1
5
1999-1
1-2
9
1999-1
2-1
3
1999-1
2-2
7
2000-0
1-1
0
2000-0
1-2
4
2000-0
2-0
7
2000-0
2-2
1
2000-0
3-0
6
2000-0
3-2
0
2000-0
4-0
3
2000-0
4-1
7
2000-0
5-0
1
2000-0
5-1
5
2000-0
5-2
9
2000-0
6-1
2
2000-0
6-2
6
2000-0
7-1
0
2000-0
7-2
4
2000-0
8-0
7
2000-0
8-2
1
2000-0
9-0
4
2000-0
9-1
8
2000-1
0-0
2
2000-1
0-1
6
0
100
200
300
400
500
600
700
800
900
1000
1100
1200
1300
1400
1500
1600
1700
Lexis-Nexis Deja.com
Frequency of "blog" on weblogs
0
20
40
60
80
100
120
140
160
2000-0
8-2
1
2000-0
9-0
4
2000-0
9-1
8
2000-1
0-0
2
2000-1
0-1
6

51
Blogger
The most popular weblog-building tool, and also used to refer to the owner of a (we)blog.
However, the Deja.com peaks of July 2000 are solely due to the postings of one person
who describes himself as a blogger in his signature.
Frequency of "blogger"
0
1
1999-0
8-0
9
1999-0
8-2
3
1999-0
9-0
6
1999-0
9-2
0
1999-1
0-0
4
1999-1
0-1
8
1999-1
1-0
1
1999-1
1-1
5
1999-1
1-2
9
1999-1
2-1
3
1999-1
2-2
7
2000-0
1-1
0
2000-0
1-2
4
2000-0
2-0
7
2000-0
2-2
1
2000-0
3-0
6
2000-0
3-2
0
2000-0
4-0
3
2000-0
4-1
7
2000-0
5-0
1
2000-0
5-1
5
2000-0
5-2
9
2000-0
6-1
2
2000-0
6-2
6
2000-0
7-1
0
2000-0
7-2
4
2000-0
8-0
7
2000-0
8-2
1
2000-0
9-0
4
2000-0
9-1
8
2000-1
0-0
2
2000-1
0-1
6
0
5
10
15
20
25
30
35
Lexis-Nexis Deja.com
Cumulative count of "blogger"
0
1
2
3
1999-0
8-0
9
1999-0
8-2
3
1999-0
9-0
6
1999-0
9-2
0
1999-1
0-0
4
1999-1
0-1
8
1999-1
1-0
1
1999-1
1-1
5
1999-1
1-2
9
1999-1
2-1
3
1999-1
2-2
7
2000-0
1-1
0
2000-0
1-2
4
2000-0
2-0
7
2000-0
2-2
1
2000-0
3-0
6
2000-0
3-2
0
2000-0
4-0
3
2000-0
4-1
7
2000-0
5-0
1
2000-0
5-1
5
2000-0
5-2
9
2000-0
6-1
2
2000-0
6-2
6
2000-0
7-1
0
2000-0
7-2
4
2000-0
8-0
7
2000-0
8-2
1
2000-0
9-0
4
2000-0
9-1
8
2000-1
0-0
2
2000-1
0-1
6
0
20
40
60
80
100
120
140
160
180
Lexis-Nexis Deja.com
Frequency of "blogger" on weblogs
0
20
40
60
80
100
120
140
160
180
2000-0
8-2
1
2000-0
9-0
4
2000-0
9-1
8
2000-1
0-0
2
2000-1
0-1
6

52
Britney
This may match occurrences of other people also called Britney, but we need to match
just Spears’ first name, as fans are more likely to use that alone. The peaks in February
coincide with her nomination (but not win) at the Grammys and the announcement of
tour dates. In May her new album was the second fastest selling ever in the US.
Frequency of "britney"
0
20
40
60
80
100
1999-0
8-0
9
1999-0
8-2
3
1999-0
9-0
6
1999-0
9-2
0
1999-1
0-0
4
1999-1
0-1
8
1999-1
1-0
1
1999-1
1-1
5
1999-1
1-2
9
1999-1
2-1
3
1999-1
2-2
7
2000-0
1-1
0
2000-0
1-2
4
2000-0
2-0
7
2000-0
2-2
1
2000-0
3-0
6
2000-0
3-2
0
2000-0
4-0
3
2000-0
4-1
7
2000-0
5-0
1
2000-0
5-1
5
2000-0
5-2
9
2000-0
6-1
2
2000-0
6-2
6
2000-0
7-1
0
2000-0
7-2
4
2000-0
8-0
7
2000-0
8-2
1
2000-0
9-0
4
2000-0
9-1
8
2000-1
0-0
2
2000-1
0-1
6
0
500
1000
1500
2000
2500
3000
3500
4000
4500
5000
Lexis-Nexis Deja.com
Cumulative count of "britney"
0
200
400
600
800
1000
1200
1400
1600
1800
2000
2200
1999-0
8-0
9
1999-0
8-2
3
1999-0
9-0
6
1999-0
9-2
0
1999-1
0-0
4
1999-1
0-1
8
1999-1
1-0
1
1999-1
1-1
5
1999-1
1-2
9
1999-1
2-1
3
1999-1
2-2
7
2000-0
1-1
0
2000-0
1-2
4
2000-0
2-0
7
2000-0
2-2
1
2000-0
3-0
6
2000-0
3-2
0
2000-0
4-0
3
2000-0
4-1
7
2000-0
5-0
1
2000-0
5-1
5
2000-0
5-2
9
2000-0
6-1
2
2000-0
6-2
6
2000-0
7-1
0
2000-0
7-2
4
2000-0
8-0
7
2000-0
8-2
1
2000-0
9-0
4
2000-0
9-1
8
2000-1
0-0
2
2000-1
0-1
6
0
20000
40000
60000
80000
100000
120000
140000
160000
Lexis-Nexis Deja.com
Frequency of "britney" on weblogs
0
5
10
15
20
25
2000-0
8-2
1
2000-0
9-0
4
2000-0
9-1
8
2000-1
0-0
2
2000-1
0-1
6
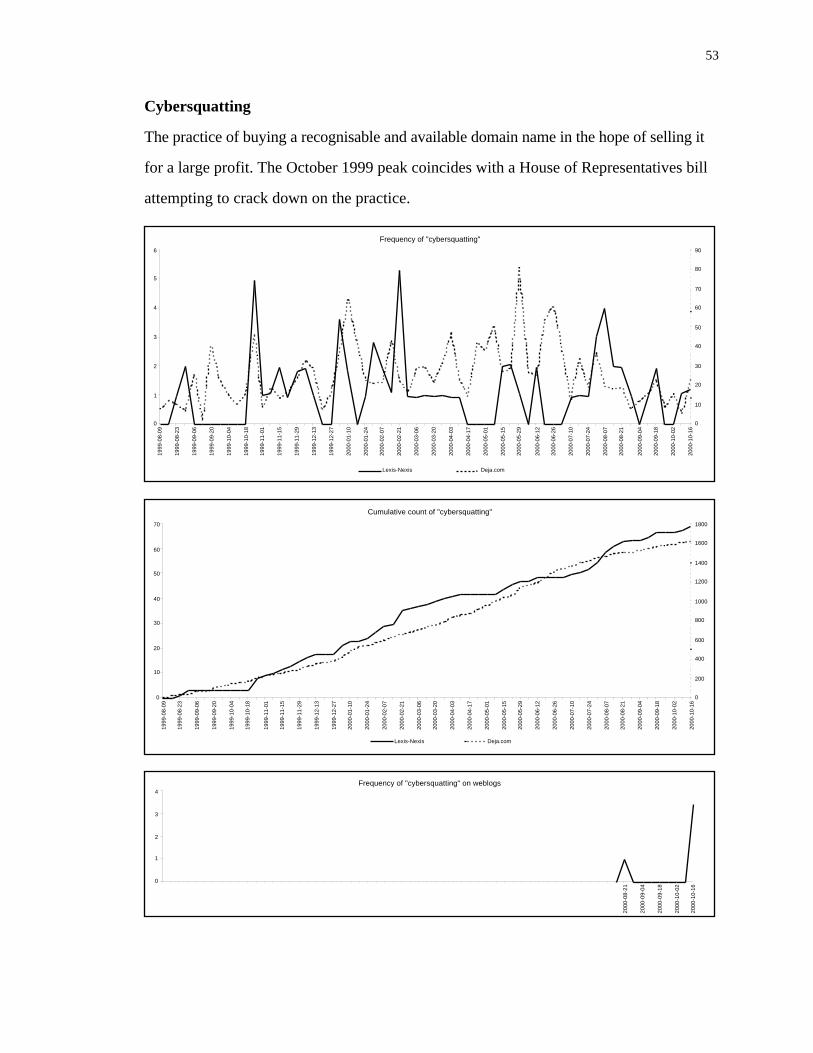
53
Cybersquatting
The practice of buying a recognisable and available domain name in the hope of selling it
for a large profit. The October 1999 peak coincides with a House of Representatives bill
attempting to crack down on the practice.
Frequency of "cybersquatting"
0
1
2
3
4
5
6
1999-0
8-0
9
1999-0
8-2
3
1999-0
9-0
6
1999-0
9-2
0
1999-1
0-0
4
1999-1
0-1
8
1999-1
1-0
1
1999-1
1-1
5
1999-1
1-2
9
1999-1
2-1
3
1999-1
2-2
7
2000-0
1-1
0
2000-0
1-2
4
2000-0
2-0
7
2000-0
2-2
1
2000-0
3-0
6
2000-0
3-2
0
2000-0
4-0
3
2000-0
4-1
7
2000-0
5-0
1
2000-0
5-1
5
2000-0
5-2
9
2000-0
6-1
2
2000-0
6-2
6
2000-0
7-1
0
2000-0
7-2
4
2000-0
8-0
7
2000-0
8-2
1
2000-0
9-0
4
2000-0
9-1
8
2000-1
0-0
2
2000-1
0-1
6
0
10
20
30
40
50
60
70
80
90
Lexis-Nexis Deja.com
Cumulative count of "cybersquatting"
0
10
20
30
40
50
60
70
1999-0
8-0
9
1999-0
8-2
3
1999-0
9-0
6
1999-0
9-2
0
1999-1
0-0
4
1999-1
0-1
8
1999-1
1-0
1
1999-1
1-1
5
1999-1
1-2
9
1999-1
2-1
3
1999-1
2-2
7
2000-0
1-1
0
2000-0
1-2
4
2000-0
2-0
7
2000-0
2-2
1
2000-0
3-0
6
2000-0
3-2
0
2000-0
4-0
3
2000-0
4-1
7
2000-0
5-0
1
2000-0
5-1
5
2000-0
5-2
9
2000-0
6-1
2
2000-0
6-2
6
2000-0
7-1
0
2000-0
7-2
4
2000-0
8-0
7
2000-0
8-2
1
2000-0
9-0
4
2000-0
9-1
8
2000-1
0-0
2
2000-1
0-1
60
200
400
600
800
1000
1200
1400
1600
1800
Lexis-Nexis Deja.com
Frequency of "cybersquatting" on weblogs
0
1
2
3
4
2000-0
8-2
1
2000-0
9-0
4
2000-0
9-1
8
2000-1
0-0
2
2000-1
0-1
6

54
Daikatana
A long-delayed computer game from John Romero, designer of Doom and Quake. The
April Deja.com peak is discussion of the demo version and the May peak with the release
of the final game. Reviews in the press only appear in June and July however.
Frequency of "daikatana"
0
1
2
3
4
5
1999-0
8-0
9
1999-0
8-2
3
1999-0
9-0
6
1999-0
9-2
0
1999-1
0-0
4
1999-1
0-1
8
1999-1
1-0
1
1999-1
1-1
5
1999-1
1-2
9
1999-1
2-1
3
1999-1
2-2
7
2000-0
1-1
0
2000-0
1-2
4
2000-0
2-0
7
2000-0
2-2
1
2000-0
3-0
6
2000-0
3-2
0
2000-0
4-0
3
2000-0
4-1
7
2000-0
5-0
1
2000-0
5-1
5
2000-0
5-2
9
2000-0
6-1
2
2000-0
6-2
6
2000-0
7-1
0
2000-0
7-2
4
2000-0
8-0
7
2000-0
8-2
1
2000-0
9-0
4
2000-0
9-1
8
2000-1
0-0
2
2000-1
0-1
6
0
100
200
300
400
500
600
700
800
900
Lexis-Nexis Deja.com
Cumulative count of "daikatana"
0
5
10
15
20
25
1999-0
8-0
9
1999-0
8-2
3
1999-0
9-0
6
1999-0
9-2
0
1999-1
0-0
4
1999-1
0-1
8
1999-1
1-0
1
1999-1
1-1
5
1999-1
1-2
9
1999-1
2-1
3
1999-1
2-2
7
2000-0
1-1
0
2000-0
1-2
4
2000-0
2-0
7
2000-0
2-2
1
2000-0
3-0
6
2000-0
3-2
0
2000-0
4-0
3
2000-0
4-1
7
2000-0
5-0
1
2000-0
5-1
5
2000-0
5-2
9
2000-0
6-1
2
2000-0
6-2
6
2000-0
7-1
0
2000-0
7-2
4
2000-0
8-0
7
2000-0
8-2
1
2000-0
9-0
4
2000-0
9-1
8
2000-1
0-0
2
2000-1
0-1
60
1000
2000
3000
4000
5000
6000
7000
8000
9000
Lexis-Nexis Deja.com
Frequency of "daikatana" on weblogs
0
1
2
2000-0
8-2
1
2000-0
9-0
4
2000-0
9-1
8
2000-1
0-0
2
2000-1
0-1
6

55
David Gray
A singer. The April Lexis-Nexis spike coincides with the re-issue of his album White
Ladder. Unfortunately the presence of other David Grays (there is at least a snooker
player and a jockey) skews the other results.
Frequency of "david gray"
0
2
4
6
8
10
12
14
16
18
20
1999-0
8-0
9
1999-0
8-2
3
1999-0
9-0
6
1999-0
9-2
0
1999-1
0-0
4
1999-1
0-1
8
1999-1
1-0
1
1999-1
1-1
5
1999-1
1-2
9
1999-1
2-1
3
1999-1
2-2
7
2000-0
1-1
0
2000-0
1-2
4
2000-0
2-0
7
2000-0
2-2
1
2000-0
3-0
6
2000-0
3-2
0
2000-0
4-0
3
2000-0
4-1
7
2000-0
5-0
1
2000-0
5-1
5
2000-0
5-2
9
2000-0
6-1
2
2000-0
6-2
6
2000-0
7-1
0
2000-0
7-2
4
2000-0
8-0
7
2000-0
8-2
1
2000-0
9-0
4
2000-0
9-1
8
2000-1
0-0
2
2000-1
0-1
6
0
20
40
60
80
100
120
Lexis-Nexis Deja.com
Cumulative count of "david gray"
0
20
40
60
80
100
120
140
160
180
1999-0
8-0
9
1999-0
8-2
3
1999-0
9-0
6
1999-0
9-2
0
1999-1
0-0
4
1999-1
0-1
8
1999-1
1-0
1
1999-1
1-1
5
1999-1
1-2
9
1999-1
2-1
3
1999-1
2-2
7
2000-0
1-1
0
2000-0
1-2
4
2000-0
2-0
7
2000-0
2-2
1
2000-0
3-0
6
2000-0
3-2
0
2000-0
4-0
3
2000-0
4-1
7
2000-0
5-0
1
2000-0
5-1
5
2000-0
5-2
9
2000-0
6-1
2
2000-0
6-2
6
2000-0
7-1
0
2000-0
7-2
4
2000-0
8-0
7
2000-0
8-2
1
2000-0
9-0
4
2000-0
9-1
8
2000-1
0-0
2
2000-1
0-1
6
0
200
400
600
800
1000
1200
1400
1600
1800
2000
Lexis-Nexis Deja.com
Frequency of "david gray" on weblogs
0
1
2000-0
8-2
1
2000-0
9-0
4
2000-0
9-1
8
2000-1
0-0
2
2000-1
0-1
6
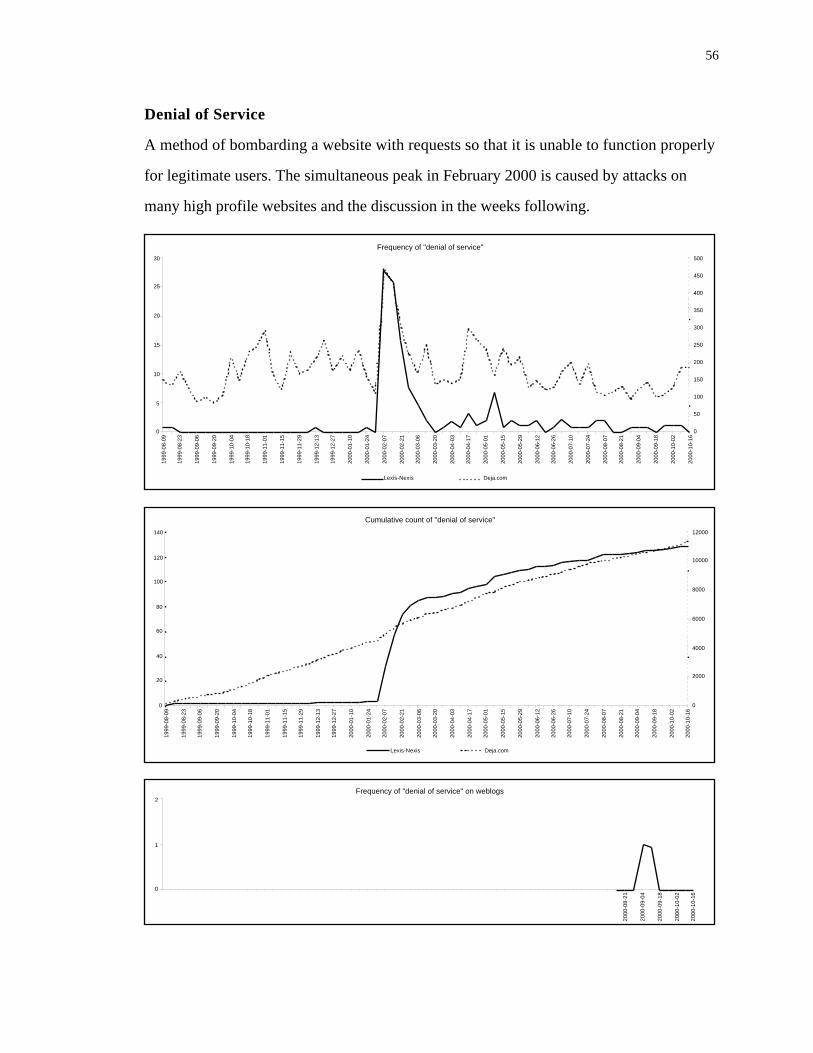
56
Denial of Service
A method of bombarding a website with requests so that it is unable to function properly
for legitimate users. The simultaneous peak in February 2000 is caused by attacks on
many high profile websites and the discussion in the weeks following.
Frequency of "denial of service"
0
5
10
15
20
25
30
1999-0
8-0
9
1999-0
8-2
3
1999-0
9-0
6
1999-0
9-2
0
1999-1
0-0
4
1999-1
0-1
8
1999-1
1-0
1
1999-1
1-1
5
1999-1
1-2
9
1999-1
2-1
3
1999-1
2-2
7
2000-0
1-1
0
2000-0
1-2
4
2000-0
2-0
7
2000-0
2-2
1
2000-0
3-0
6
2000-0
3-2
0
2000-0
4-0
3
2000-0
4-1
7
2000-0
5-0
1
2000-0
5-1
5
2000-0
5-2
9
2000-0
6-1
2
2000-0
6-2
6
2000-0
7-1
0
2000-0
7-2
4
2000-0
8-0
7
2000-0
8-2
1
2000-0
9-0
4
2000-0
9-1
8
2000-1
0-0
2
2000-1
0-1
6
0
50
100
150
200
250
300
350
400
450
500
Lexis-Nexis Deja.com
Cumulative count of "denial of service"
0
20
40
60
80
100
120
140
1999-0
8-0
9
1999-0
8-2
3
1999-0
9-0
6
1999-0
9-2
0
1999-1
0-0
4
1999-1
0-1
8
1999-1
1-0
1
1999-1
1-1
5
1999-1
1-2
9
1999-1
2-1
3
1999-1
2-2
7
2000-0
1-1
0
2000-0
1-2
4
2000-0
2-0
7
2000-0
2-2
1
2000-0
3-0
6
2000-0
3-2
0
2000-0
4-0
3
2000-0
4-1
7
2000-0
5-0
1
2000-0
5-1
5
2000-0
5-2
9
2000-0
6-1
2
2000-0
6-2
6
2000-0
7-1
0
2000-0
7-2
4
2000-0
8-0
7
2000-0
8-2
1
2000-0
9-0
4
2000-0
9-1
8
2000-1
0-0
2
2000-1
0-1
6
0
2000
4000
6000
8000
10000
12000
Lexis-Nexis Deja.com
Frequency of "denial of service" on weblogs
0
1
2
2000-0
8-2
1
2000-0
9-0
4
2000-0
9-1
8
2000-1
0-0
2
2000-1
0-1
6

57
Digital Rights Management
A term used to describe methods of protecting copyrightable products such as music.
Frequency of "digital rights management"
0
1
2
3
4
5
1999-0
8-0
9
1999-0
8-2
3
1999-0
9-0
6
1999-0
9-2
0
1999-1
0-0
4
1999-1
0-1
8
1999-1
1-0
1
1999-1
1-1
5
1999-1
1-2
9
1999-1
2-1
3
1999-1
2-2
7
2000-0
1-1
0
2000-0
1-2
4
2000-0
2-0
7
2000-0
2-2
1
2000-0
3-0
6
2000-0
3-2
0
2000-0
4-0
3
2000-0
4-1
7
2000-0
5-0
1
2000-0
5-1
5
2000-0
5-2
9
2000-0
6-1
2
2000-0
6-2
6
2000-0
7-1
0
2000-0
7-2
4
2000-0
8-0
7
2000-0
8-2
1
2000-0
9-0
4
2000-0
9-1
8
2000-1
0-0
2
2000-1
0-1
6
0
5
10
15
20
25
Lexis-Nexis Deja.com
Cumulative count of "digital rights management"
0
5
10
15
20
25
30
1999-0
8-0
9
1999-0
8-2
3
1999-0
9-0
6
1999-0
9-2
0
1999-1
0-0
4
1999-1
0-1
8
1999-1
1-0
1
1999-1
1-1
5
1999-1
1-2
9
1999-1
2-1
3
1999-1
2-2
7
2000-0
1-1
0
2000-0
1-2
4
2000-0
2-0
7
2000-0
2-2
1
2000-0
3-0
6
2000-0
3-2
0
2000-0
4-0
3
2000-0
4-1
7
2000-0
5-0
1
2000-0
5-1
5
2000-0
5-2
9
2000-0
6-1
2
2000-0
6-2
6
2000-0
7-1
0
2000-0
7-2
4
2000-0
8-0
7
2000-0
8-2
1
2000-0
9-0
4
2000-0
9-1
8
2000-1
0-0
2
2000-1
0-1
6
0
100
200
300
400
500
600
Lexis-Nexis Deja.com
Frequency of "digital rights management" on weblogs
0
1
2
2000-0
8-2
1
2000-0
9-0
4
2000-0
9-1
8
2000-1
0-0
2
2000-1
0-1
6
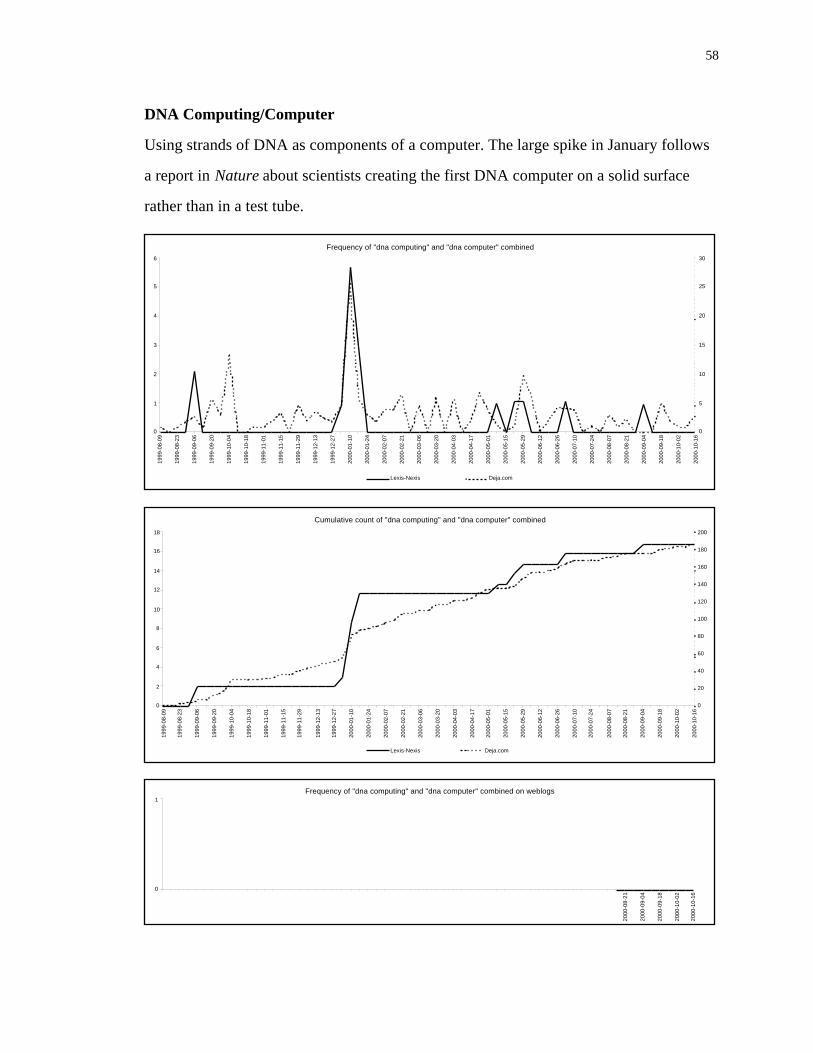
58
DNA Computing/Computer
Using strands of DNA as components of a computer. The large spike in January follows
a report in Nature about scientists creating the first DNA computer on a solid surface
rather than in a test tube.
Frequency of "dna computing" and "dna computer" combined
0
1
2
3
4
5
6
1999-0
8-0
9
1999-0
8-2
3
1999-0
9-0
6
1999-0
9-2
0
1999-1
0-0
4
1999-1
0-1
8
1999-1
1-0
1
1999-1
1-1
5
1999-1
1-2
9
1999-1
2-1
3
1999-1
2-2
7
2000-0
1-1
0
2000-0
1-2
4
2000-0
2-0
7
2000-0
2-2
1
2000-0
3-0
6
2000-0
3-2
0
2000-0
4-0
3
2000-0
4-1
7
2000-0
5-0
1
2000-0
5-1
5
2000-0
5-2
9
2000-0
6-1
2
2000-0
6-2
6
2000-0
7-1
0
2000-0
7-2
4
2000-0
8-0
7
2000-0
8-2
1
2000-0
9-0
4
2000-0
9-1
8
2000-1
0-0
2
2000-1
0-1
6
0
5
10
15
20
25
30
Lexis-Nexis Deja.com
Cumulative count of "dna computing" and "dna computer" combined
0
2
4
6
8
10
12
14
16
18
1999-0
8-0
9
1999-0
8-2
3
1999-0
9-0
6
1999-0
9-2
0
1999-1
0-0
4
1999-1
0-1
8
1999-1
1-0
1
1999-1
1-1
5
1999-1
1-2
9
1999-1
2-1
3
1999-1
2-2
7
2000-0
1-1
0
2000-0
1-2
4
2000-0
2-0
7
2000-0
2-2
1
2000-0
3-0
6
2000-0
3-2
0
2000-0
4-0
3
2000-0
4-1
7
2000-0
5-0
1
2000-0
5-1
5
2000-0
5-2
9
2000-0
6-1
2
2000-0
6-2
6
2000-0
7-1
0
2000-0
7-2
4
2000-0
8-0
7
2000-0
8-2
1
2000-0
9-0
4
2000-0
9-1
8
2000-1
0-0
2
2000-1
0-1
6
0
20
40
60
80
100
120
140
160
180
200
Lexis-Nexis Deja.com
Frequency of "dna computing" and "dna computer" combined on weblogs
0
1
2000-0
8-2
1
2000-0
9-0
4
2000-0
9-1
8
2000-1
0-0
2
2000-1
0-1
6
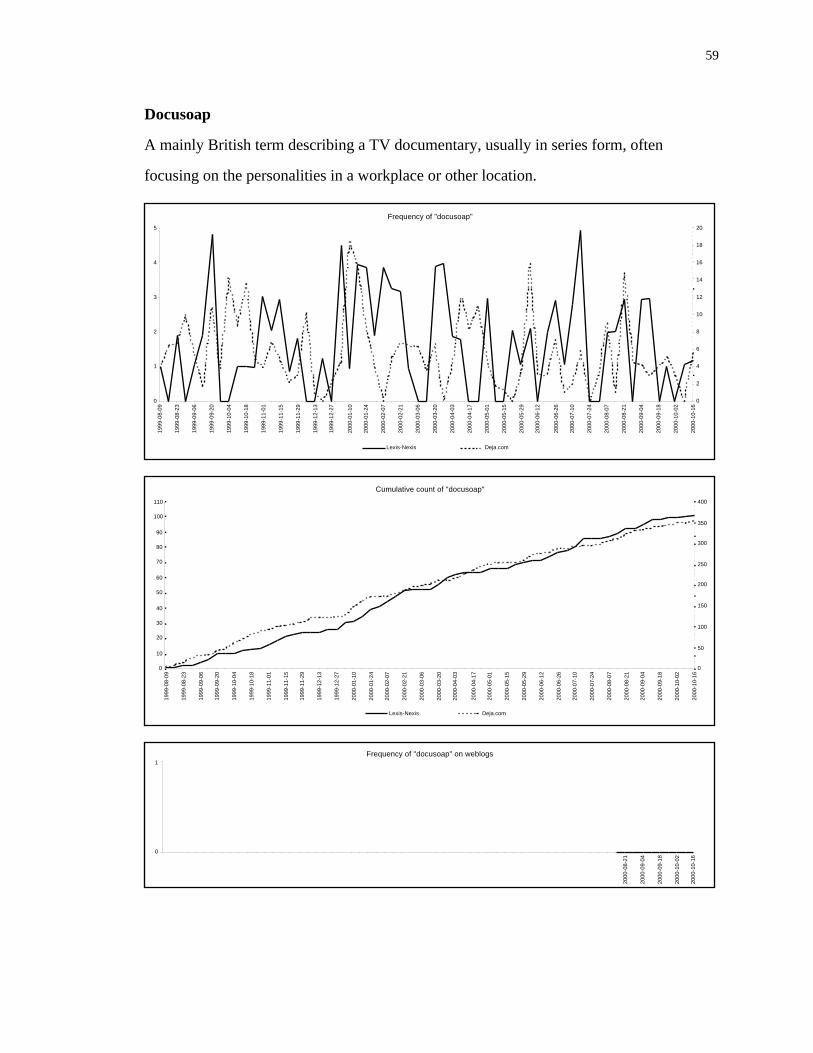
59
Docusoap
A mainly British term describing a TV documentary, usually in series form, often
focusing on the personalities in a workplace or other location.
Frequency of "docusoap"
0
1
2
3
4
5
1999-0
8-0
9
1999-0
8-2
3
1999-0
9-0
6
1999-0
9-2
0
1999-1
0-0
4
1999-1
0-1
8
1999-1
1-0
1
1999-1
1-1
5
1999-1
1-2
9
1999-1
2-1
3
1999-1
2-2
7
2000-0
1-1
0
2000-0
1-2
4
2000-0
2-0
7
2000-0
2-2
1
2000-0
3-0
6
2000-0
3-2
0
2000-0
4-0
3
2000-0
4-1
7
2000-0
5-0
1
2000-0
5-1
5
2000-0
5-2
9
2000-0
6-1
2
2000-0
6-2
6
2000-0
7-1
0
2000-0
7-2
4
2000-0
8-0
7
2000-0
8-2
1
2000-0
9-0
4
2000-0
9-1
8
2000-1
0-0
2
2000-1
0-1
6
0
2
4
6
8
10
12
14
16
18
20
Lexis-Nexis Deja.com
Cumulative count of "docusoap"
0
10
20
30
40
50
60
70
80
90
100
110
1999-0
8-0
9
1999-0
8-2
3
1999-0
9-0
6
1999-0
9-2
0
1999-1
0-0
4
1999-1
0-1
8
1999-1
1-0
1
1999-1
1-1
5
1999-1
1-2
9
1999-1
2-1
3
1999-1
2-2
7
2000-0
1-1
0
2000-0
1-2
4
2000-0
2-0
7
2000-0
2-2
1
2000-0
3-0
6
2000-0
3-2
0
2000-0
4-0
3
2000-0
4-1
7
2000-0
5-0
1
2000-0
5-1
5
2000-0
5-2
9
2000-0
6-1
2
2000-0
6-2
6
2000-0
7-1
0
2000-0
7-2
4
2000-0
8-0
7
2000-0
8-2
1
2000-0
9-0
4
2000-0
9-1
8
2000-1
0-0
2
2000-1
0-1
6
0
50
100
150
200
250
300
350
400
Lexis-Nexis Deja.com
Frequency of "docusoap" on weblogs
0
1
2000-0
8-2
1
2000-0
9-0
4
2000-0
9-1
8
2000-1
0-0
2
2000-1
0-1
6

60
Eazel
A company producing a user-friendly front-end to the Linux operating system.
Frequency of "eazel"
0
1
2
3
1999-0
8-0
9
1999-0
8-2
3
1999-0
9-0
6
1999-0
9-2
0
1999-1
0-0
4
1999-1
0-1
8
1999-1
1-0
1
1999-1
1-1
5
1999-1
1-2
9
1999-1
2-1
3
1999-1
2-2
7
2000-0
1-1
0
2000-0
1-2
4
2000-0
2-0
7
2000-0
2-2
1
2000-0
3-0
6
2000-0
3-2
0
2000-0
4-0
3
2000-0
4-1
7
2000-0
5-0
1
2000-0
5-1
5
2000-0
5-2
9
2000-0
6-1
2
2000-0
6-2
6
2000-0
7-1
0
2000-0
7-2
4
2000-0
8-0
7
2000-0
8-2
1
2000-0
9-0
4
2000-0
9-1
8
2000-1
0-0
2
2000-1
0-1
6
0
10
20
30
40
50
60
70
80
90
100
Lexis-Nexis Deja.com
Cumulative count of "eazel"
0
1
2
3
4
5
6
7
1999-0
8-0
9
1999-0
8-2
3
1999-0
9-0
6
1999-0
9-2
0
1999-1
0-0
4
1999-1
0-1
8
1999-1
1-0
1
1999-1
1-1
5
1999-1
1-2
9
1999-1
2-1
3
1999-1
2-2
7
2000-0
1-1
0
2000-0
1-2
4
2000-0
2-0
7
2000-0
2-2
1
2000-0
3-0
6
2000-0
3-2
0
2000-0
4-0
3
2000-0
4-1
7
2000-0
5-0
1
2000-0
5-1
5
2000-0
5-2
9
2000-0
6-1
2
2000-0
6-2
6
2000-0
7-1
0
2000-0
7-2
4
2000-0
8-0
7
2000-0
8-2
1
2000-0
9-0
4
2000-0
9-1
8
2000-1
0-0
2
2000-1
0-1
6
0
100
200
300
400
500
600
Lexis-Nexis Deja.com
Frequency of "eazel" on weblogs
0
2
4
6
8
10
12
2000-0
8-2
1
2000-0
9-0
4
2000-0
9-1
8
2000-1
0-0
2
2000-1
0-1
6

61
Freenet
A network for the distribution of files across the Internet. It is, however, a name that’s
been used for many things online so it is impossible to pick out details relating to this
Freenet from the background noise.
Frequency of "freenet"
0
1
2
3
4
5
6
7
1999-0
8-0
9
1999-0
8-2
3
1999-0
9-0
6
1999-0
9-2
0
1999-1
0-0
4
1999-1
0-1
8
1999-1
1-0
1
1999-1
1-1
5
1999-1
1-2
9
1999-1
2-1
3
1999-1
2-2
7
2000-0
1-1
0
2000-0
1-2
4
2000-0
2-0
7
2000-0
2-2
1
2000-0
3-0
6
2000-0
3-2
0
2000-0
4-0
3
2000-0
4-1
7
2000-0
5-0
1
2000-0
5-1
5
2000-0
5-2
9
2000-0
6-1
2
2000-0
6-2
6
2000-0
7-1
0
2000-0
7-2
4
2000-0
8-0
7
2000-0
8-2
1
2000-0
9-0
4
2000-0
9-1
8
2000-1
0-0
2
2000-1
0-1
6
0
500
1000
1500
2000
2500
3000
Lexis-Nexis Deja.com
Cumulative count of "freenet"
0
10
20
30
40
50
60
70
80
1999-0
8-0
9
1999-0
8-2
3
1999-0
9-0
6
1999-0
9-2
0
1999-1
0-0
4
1999-1
0-1
8
1999-1
1-0
1
1999-1
1-1
5
1999-1
1-2
9
1999-1
2-1
3
1999-1
2-2
7
2000-0
1-1
0
2000-0
1-2
4
2000-0
2-0
7
2000-0
2-2
1
2000-0
3-0
6
2000-0
3-2
0
2000-0
4-0
3
2000-0
4-1
7
2000-0
5-0
1
2000-0
5-1
5
2000-0
5-2
9
2000-0
6-1
2
2000-0
6-2
6
2000-0
7-1
0
2000-0
7-2
4
2000-0
8-0
7
2000-0
8-2
1
2000-0
9-0
4
2000-0
9-1
8
2000-1
0-0
2
2000-1
0-1
6
0
20000
40000
60000
80000
100000
120000
140000
Lexis-Nexis Deja.com
Frequency of "freenet" on weblogs
0
1
2
3
4
5
6
2000-0
8-2
1
2000-0
9-0
4
2000-0
9-1
8
2000-1
0-0
2
2000-1
0-1
6

62
Genome
The spike at the end of June 2000 is a result of Celera announcing their complete map of
the human genome. The peak on Usenet in November 1999 is due to a single message
posted hundreds of times to one newsgroup.
Frequency of "genome"
0
50
100
150
200
250
300
350
400
450
1999-0
8-0
9
1999-0
8-2
3
1999-0
9-0
6
1999-0
9-2
0
1999-1
0-0
4
1999-1
0-1
8
1999-1
1-0
1
1999-1
1-1
5
1999-1
1-2
9
1999-1
2-1
3
1999-1
2-2
7
2000-0
1-1
0
2000-0
1-2
4
2000-0
2-0
7
2000-0
2-2
1
2000-0
3-0
6
2000-0
3-2
0
2000-0
4-0
3
2000-0
4-1
7
2000-0
5-0
1
2000-0
5-1
5
2000-0
5-2
9
2000-0
6-1
2
2000-0
6-2
6
2000-0
7-1
0
2000-0
7-2
4
2000-0
8-0
7
2000-0
8-2
1
2000-0
9-0
4
2000-0
9-1
8
2000-1
0-0
2
2000-1
0-1
6
0
500
1000
1500
2000
2500
3000
Lexis-Nexis Deja.com
Cumulative count of "genome"
0
200
400
600
800
1000
1200
1400
1600
1800
1999-0
8-0
9
1999-0
8-2
3
1999-0
9-0
6
1999-0
9-2
0
1999-1
0-0
4
1999-1
0-1
8
1999-1
1-0
1
1999-1
1-1
5
1999-1
1-2
9
1999-1
2-1
3
1999-1
2-2
7
2000-0
1-1
0
2000-0
1-2
4
2000-0
2-0
7
2000-0
2-2
1
2000-0
3-0
6
2000-0
3-2
0
2000-0
4-0
3
2000-0
4-1
7
2000-0
5-0
1
2000-0
5-1
5
2000-0
5-2
9
2000-0
6-1
2
2000-0
6-2
6
2000-0
7-1
0
2000-0
7-2
4
2000-0
8-0
7
2000-0
8-2
1
2000-0
9-0
4
2000-0
9-1
8
2000-1
0-0
2
2000-1
0-1
6
0
5000
10000
15000
20000
25000
30000
35000
40000
45000
50000
Lexis-Nexis Deja.com
Frequency of "genome" on weblogs
0
1
2
3
4
5
6
7
8
2000-0
8-2
1
2000-0
9-0
4
2000-0
9-1
8
2000-1
0-0
2
2000-1
0-1
6
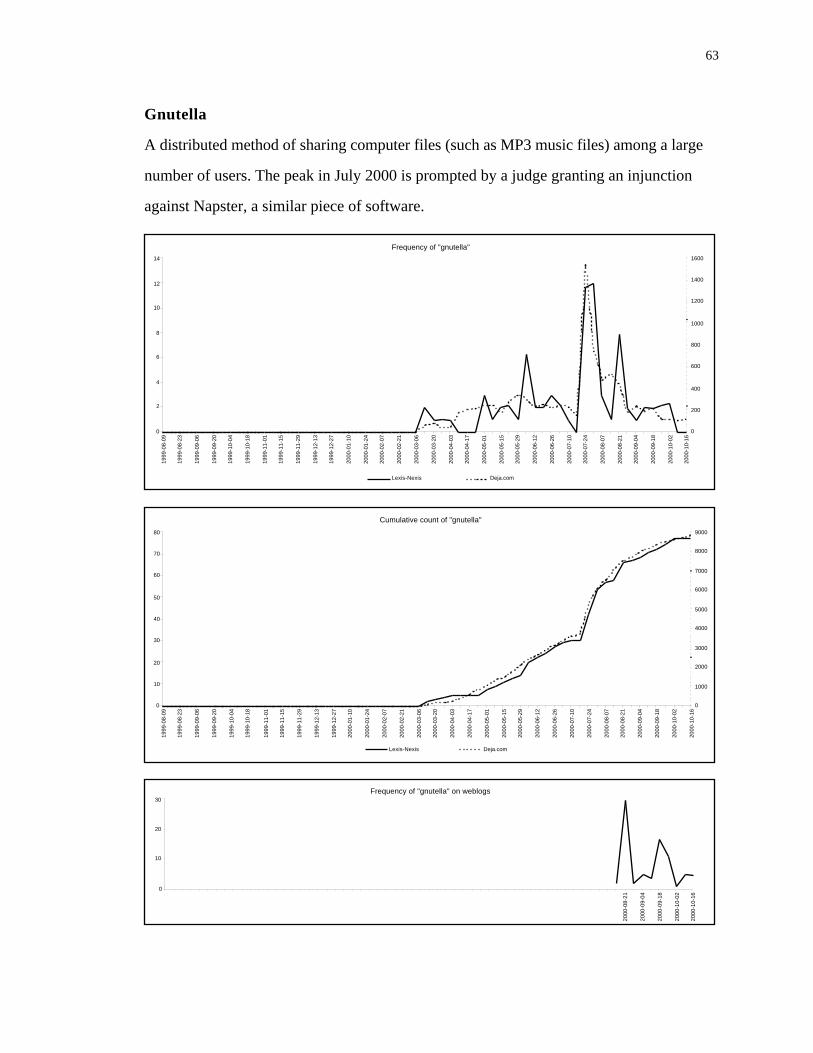
63
Gnutella
A distributed method of sharing computer files (such as MP3 music files) among a large
number of users. The peak in July 2000 is prompted by a judge granting an injunction
against Napster, a similar piece of software.
Frequency of "gnutella"
0
2
4
6
8
10
12
14
1999-0
8-0
9
1999-0
8-2
3
1999-0
9-0
6
1999-0
9-2
0
1999-1
0-0
4
1999-1
0-1
8
1999-1
1-0
1
1999-1
1-1
5
1999-1
1-2
9
1999-1
2-1
3
1999-1
2-2
7
2000-0
1-1
0
2000-0
1-2
4
2000-0
2-0
7
2000-0
2-2
1
2000-0
3-0
6
2000-0
3-2
0
2000-0
4-0
3
2000-0
4-1
7
2000-0
5-0
1
2000-0
5-1
5
2000-0
5-2
9
2000-0
6-1
2
2000-0
6-2
6
2000-0
7-1
0
2000-0
7-2
4
2000-0
8-0
7
2000-0
8-2
1
2000-0
9-0
4
2000-0
9-1
8
2000-1
0-0
2
2000-1
0-1
6
0
200
400
600
800
1000
1200
1400
1600
Lexis-Nexis Deja.com
Cumulative count of "gnutella"
0
10
20
30
40
50
60
70
80
1999-0
8-0
9
1999-0
8-2
3
1999-0
9-0
6
1999-0
9-2
0
1999-1
0-0
4
1999-1
0-1
8
1999-1
1-0
1
1999-1
1-1
5
1999-1
1-2
9
1999-1
2-1
3
1999-1
2-2
7
2000-0
1-1
0
2000-0
1-2
4
2000-0
2-0
7
2000-0
2-2
1
2000-0
3-0
6
2000-0
3-2
0
2000-0
4-0
3
2000-0
4-1
7
2000-0
5-0
1
2000-0
5-1
5
2000-0
5-2
9
2000-0
6-1
2
2000-0
6-2
6
2000-0
7-1
0
2000-0
7-2
4
2000-0
8-0
7
2000-0
8-2
1
2000-0
9-0
4
2000-0
9-1
8
2000-1
0-0
2
2000-1
0-1
6
0
1000
2000
3000
4000
5000
6000
7000
8000
9000
Lexis-Nexis Deja.com
Frequency of "gnutella" on weblogs
0
10
20
30
2000-0
8-2
1
2000-0
9-0
4
2000-0
9-1
8
2000-1
0-0
2
2000-1
0-1
6

64
I-mode
A means of using the Internet with cellular phones in Japan, developed by the company
DoCoMo. The large Lexis-Nexis peak in August 2000 is caused by reports of the i-mode
system breaking down for five hours.
Frequency of "i-mode"
0
1
2
3
4
5
6
7
8
9
10
1999-0
8-0
9
1999-0
8-2
3
1999-0
9-0
6
1999-0
9-2
0
1999-1
0-0
4
1999-1
0-1
8
1999-1
1-0
1
1999-1
1-1
5
1999-1
1-2
9
1999-1
2-1
3
1999-1
2-2
7
2000-0
1-1
0
2000-0
1-2
4
2000-0
2-0
7
2000-0
2-2
1
2000-0
3-0
6
2000-0
3-2
0
2000-0
4-0
3
2000-0
4-1
7
2000-0
5-0
1
2000-0
5-1
5
2000-0
5-2
9
2000-0
6-1
2
2000-0
6-2
6
2000-0
7-1
0
2000-0
7-2
4
2000-0
8-0
7
2000-0
8-2
1
2000-0
9-0
4
2000-0
9-1
8
2000-1
0-0
2
2000-1
0-1
6
0
5
10
15
20
25
30
35
40
45
Lexis-Nexis Deja.com
Cumulative count of "i-mode"
0
10
20
30
40
50
60
70
80
90
100
1999-0
8-0
9
1999-0
8-2
3
1999-0
9-0
6
1999-0
9-2
0
1999-1
0-0
4
1999-1
0-1
8
1999-1
1-0
1
1999-1
1-1
5
1999-1
1-2
9
1999-1
2-1
3
1999-1
2-2
7
2000-0
1-1
0
2000-0
1-2
4
2000-0
2-0
7
2000-0
2-2
1
2000-0
3-0
6
2000-0
3-2
0
2000-0
4-0
3
2000-0
4-1
7
2000-0
5-0
1
2000-0
5-1
5
2000-0
5-2
9
2000-0
6-1
2
2000-0
6-2
6
2000-0
7-1
0
2000-0
7-2
4
2000-0
8-0
7
2000-0
8-2
1
2000-0
9-0
4
2000-0
9-1
8
2000-1
0-0
2
2000-1
0-1
6
0
100
200
300
400
500
600
700
Lexis-Nexis Deja.com
Frequency of "i-mode" on weblogs
0
1
2
3
4
5
6
2000-0
8-2
1
2000-0
9-0
4
2000-0
9-1
8
2000-1
0-0
2
2000-1
0-1
6

65
Institutionalised/Institutionalized Racism
A term seemingly becoming more common to describe racism embedded in an
organisation.
Frequency of "insitutionalised racism" and "institutionalized racism" combined
0
1
2
3
4
1999-0
8-0
9
1999-0
8-2
3
1999-0
9-0
6
1999-0
9-2
0
1999-1
0-0
4
1999-1
0-1
8
1999-1
1-0
1
1999-1
1-1
5
1999-1
1-2
9
1999-1
2-1
3
1999-1
2-2
7
2000-0
1-1
0
2000-0
1-2
4
2000-0
2-0
7
2000-0
2-2
1
2000-0
3-0
6
2000-0
3-2
0
2000-0
4-0
3
2000-0
4-1
7
2000-0
5-0
1
2000-0
5-1
5
2000-0
5-2
9
2000-0
6-1
2
2000-0
6-2
6
2000-0
7-1
0
2000-0
7-2
4
2000-0
8-0
7
2000-0
8-2
1
2000-0
9-0
4
2000-0
9-1
8
2000-1
0-0
2
2000-1
0-1
6
0
5
10
15
20
25
30
35
40
45
Lexis-Nexis Deja.com
Cumulative count of "insitutionalised racism" and "institutionalized racism" combined
0
5
10
15
20
25
30
35
40
45
1999-0
8-0
9
1999-0
8-2
3
1999-0
9-0
6
1999-0
9-2
0
1999-1
0-0
4
1999-1
0-1
8
1999-1
1-0
1
1999-1
1-1
5
1999-1
1-2
9
1999-1
2-1
3
1999-1
2-2
7
2000-0
1-1
0
2000-0
1-2
4
2000-0
2-0
7
2000-0
2-2
1
2000-0
3-0
6
2000-0
3-2
0
2000-0
4-0
3
2000-0
4-1
7
2000-0
5-0
1
2000-0
5-1
5
2000-0
5-2
9
2000-0
6-1
2
2000-0
6-2
6
2000-0
7-1
0
2000-0
7-2
4
2000-0
8-0
7
2000-0
8-2
1
2000-0
9-0
4
2000-0
9-1
8
2000-1
0-0
2
2000-1
0-1
6
0
200
400
600
800
1000
1200
Lexis-Nexis Deja.com
Frequency of "institutionalised racism" and "institutionalized racism" combined on weblogs
0
1
2000-0
8-2
1
2000-0
9-0
4
2000-0
9-1
8
2000-1
0-0
2
2000-1
0-1
6

66
Kathryn Williams
A singer, although other Kathryn Williams occurred occasionally in the news. In June she
released her Little Black Numbers album and in July she was announced as one of the
Mercury Music Prize nominees
Frequency of "kathryn williams"
0
1
2
3
4
5
6
7
1999-0
8-0
9
1999-0
8-2
3
1999-0
9-0
6
1999-0
9-2
0
1999-1
0-0
4
1999-1
0-1
8
1999-1
1-0
1
1999-1
1-1
5
1999-1
1-2
9
1999-1
2-1
3
1999-1
2-2
7
2000-0
1-1
0
2000-0
1-2
4
2000-0
2-0
7
2000-0
2-2
1
2000-0
3-0
6
2000-0
3-2
0
2000-0
4-0
3
2000-0
4-1
7
2000-0
5-0
1
2000-0
5-1
5
2000-0
5-2
9
2000-0
6-1
2
2000-0
6-2
6
2000-0
7-1
0
2000-0
7-2
4
2000-0
8-0
7
2000-0
8-2
1
2000-0
9-0
4
2000-0
9-1
8
2000-1
0-0
2
2000-1
0-1
6
0
1
2
3
4
5
6
7
8
9
Lexis-Nexis Deja.com
Cumulative count of "kathryn williams"
0
5
10
15
20
25
30
1999-0
8-0
9
1999-0
8-2
3
1999-0
9-0
6
1999-0
9-2
0
1999-1
0-0
4
1999-1
0-1
8
1999-1
1-0
1
1999-1
1-1
5
1999-1
1-2
9
1999-1
2-1
3
1999-1
2-2
7
2000-0
1-1
0
2000-0
1-2
4
2000-0
2-0
7
2000-0
2-2
1
2000-0
3-0
6
2000-0
3-2
0
2000-0
4-0
3
2000-0
4-1
7
2000-0
5-0
1
2000-0
5-1
5
2000-0
5-2
9
2000-0
6-1
2
2000-0
6-2
6
2000-0
7-1
0
2000-0
7-2
4
2000-0
8-0
7
2000-0
8-2
1
2000-0
9-0
4
2000-0
9-1
8
2000-1
0-0
2
2000-1
0-1
6
0
10
20
30
40
50
60
70
Lexis-Nexis Deja.com
Frequency of "kathryn williams" on weblogs
0
1
2000-0
8-2
1
2000-0
9-0
4
2000-0
9-1
8
2000-1
0-0
2
2000-1
0-1
6

67
Linux
The open-source computer operating system. The Lexis-Nexis spike in December is due
to a variety of business news such as the shares of VA Linux peaking at more than ten
times the offering price on launch day. The March Deja.com spike is due to a series of
messages posted thousands of times to one newsgroup by a single person.
Frequency of "linux"
0
10
20
30
40
50
60
70
80
1999-0
8-0
9
1999-0
8-2
3
1999-0
9-0
6
1999-0
9-2
0
1999-1
0-0
4
1999-1
0-1
8
1999-1
1-0
1
1999-1
1-1
5
1999-1
1-2
9
1999-1
2-1
3
1999-1
2-2
7
2000-0
1-1
0
2000-0
1-2
4
2000-0
2-0
7
2000-0
2-2
1
2000-0
3-0
6
2000-0
3-2
0
2000-0
4-0
3
2000-0
4-1
7
2000-0
5-0
1
2000-0
5-1
5
2000-0
5-2
9
2000-0
6-1
2
2000-0
6-2
6
2000-0
7-1
0
2000-0
7-2
4
2000-0
8-0
7
2000-0
8-2
1
2000-0
9-0
4
2000-0
9-1
8
2000-1
0-0
2
2000-1
0-1
6
0
10000
20000
30000
40000
50000
60000
70000
80000
Lexis-Nexis Deja.com
Cumulative count of "linux"
0
200
400
600
800
1000
1200
1999-0
8-0
9
1999-0
8-2
3
1999-0
9-0
6
1999-0
9-2
0
1999-1
0-0
4
1999-1
0-1
8
1999-1
1-0
1
1999-1
1-1
5
1999-1
1-2
9
1999-1
2-1
3
1999-1
2-2
7
2000-0
1-1
0
2000-0
1-2
4
2000-0
2-0
7
2000-0
2-2
1
2000-0
3-0
6
2000-0
3-2
0
2000-0
4-0
3
2000-0
4-1
7
2000-0
5-0
1
2000-0
5-1
5
2000-0
5-2
9
2000-0
6-1
2
2000-0
6-2
6
2000-0
7-1
0
2000-0
7-2
4
2000-0
8-0
7
2000-0
8-2
1
2000-0
9-0
4
2000-0
9-1
8
2000-1
0-0
2
2000-1
0-1
6
0
200000
400000
600000
800000
1000000
1200000
1400000
1600000
1800000
2000000
Lexis-Nexis Deja.com
Frequency of "linux" on weblogs
0
20
40
60
80
100
120
140
160
180
2000-0
8-2
1
2000-0
9-0
4
2000-0
9-1
8
2000-1
0-0
2
2000-1
0-1
6

68
Macy Gray
The singer. The large peak in February seems largely due to her nomination for a
Grammy, although she didn’t win anything.
Frequency of "macy gray"
0
5
10
15
20
25
30
35
1999-0
8-0
9
1999-0
8-2
3
1999-0
9-0
6
1999-0
9-2
0
1999-1
0-0
4
1999-1
0-1
8
1999-1
1-0
1
1999-1
1-1
5
1999-1
1-2
9
1999-1
2-1
3
1999-1
2-2
7
2000-0
1-1
0
2000-0
1-2
4
2000-0
2-0
7
2000-0
2-2
1
2000-0
3-0
6
2000-0
3-2
0
2000-0
4-0
3
2000-0
4-1
7
2000-0
5-0
1
2000-0
5-1
5
2000-0
5-2
9
2000-0
6-1
2
2000-0
6-2
6
2000-0
7-1
0
2000-0
7-2
4
2000-0
8-0
7
2000-0
8-2
1
2000-0
9-0
4
2000-0
9-1
8
2000-1
0-0
2
2000-1
0-1
6
0
50
100
150
200
250
300
350
Lexis-Nexis Deja.com
Cumulative count of "macy gray"
0
50
100
150
200
250
300
350
400
450
500
1999-0
8-0
9
1999-0
8-2
3
1999-0
9-0
6
1999-0
9-2
0
1999-1
0-0
4
1999-1
0-1
8
1999-1
1-0
1
1999-1
1-1
5
1999-1
1-2
9
1999-1
2-1
3
1999-1
2-2
7
2000-0
1-1
0
2000-0
1-2
4
2000-0
2-0
7
2000-0
2-2
1
2000-0
3-0
6
2000-0
3-2
0
2000-0
4-0
3
2000-0
4-1
7
2000-0
5-0
1
2000-0
5-1
5
2000-0
5-2
9
2000-0
6-1
2
2000-0
6-2
6
2000-0
7-1
0
2000-0
7-2
4
2000-0
8-0
7
2000-0
8-2
1
2000-0
9-0
4
2000-0
9-1
8
2000-1
0-0
2
2000-1
0-1
6
0
1000
2000
3000
4000
5000
6000
Lexis-Nexis Deja.com
Frequency of "macy gray" on weblogs
0
1
2
2000-0
8-2
1
2000-0
9-0
4
2000-0
9-1
8
2000-1
0-0
2
2000-1
0-1
6
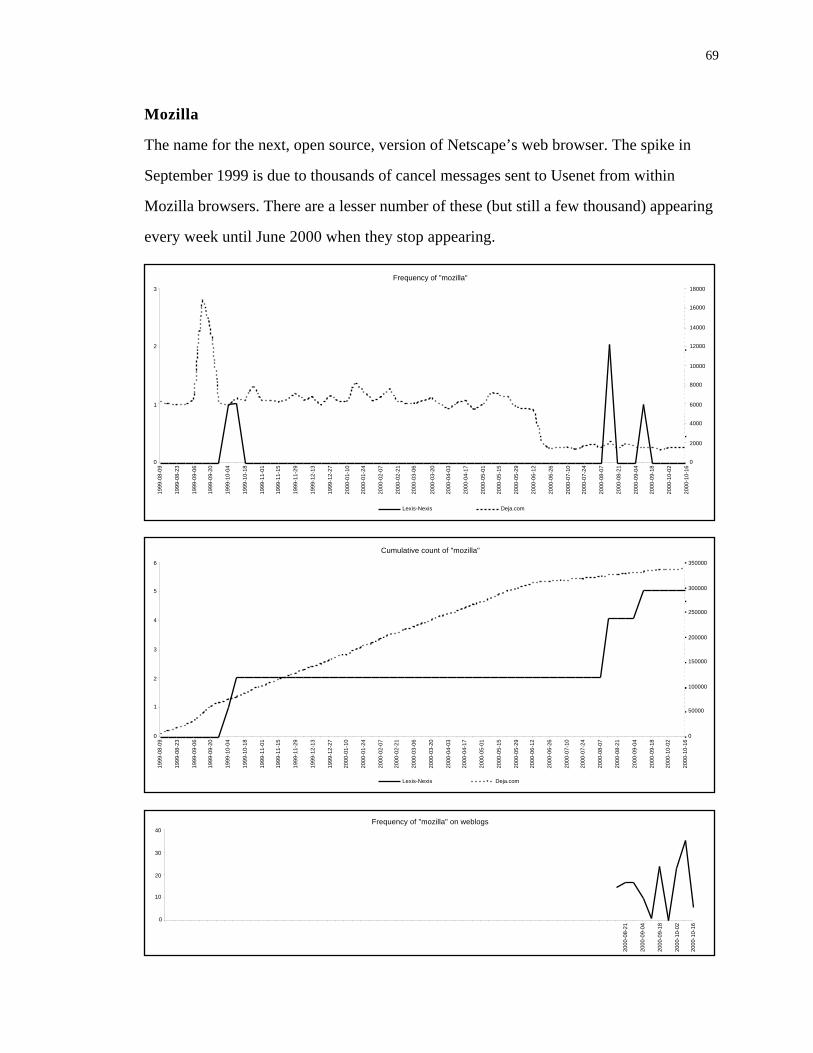
69
Mozilla
The name for the next, open source, version of Netscape’s web browser. The spike in
September 1999 is due to thousands of cancel messages sent to Usenet from within
Mozilla browsers. There are a lesser number of these (but still a few thousand) appearing
every week until June 2000 when they stop appearing.
Frequency of "mozilla"
0
1
2
3
1999-0
8-0
9
1999-0
8-2
3
1999-0
9-0
6
1999-0
9-2
0
1999-1
0-0
4
1999-1
0-1
8
1999-1
1-0
1
1999-1
1-1
5
1999-1
1-2
9
1999-1
2-1
3
1999-1
2-2
7
2000-0
1-1
0
2000-0
1-2
4
2000-0
2-0
7
2000-0
2-2
1
2000-0
3-0
6
2000-0
3-2
0
2000-0
4-0
3
2000-0
4-1
7
2000-0
5-0
1
2000-0
5-1
5
2000-0
5-2
9
2000-0
6-1
2
2000-0
6-2
6
2000-0
7-1
0
2000-0
7-2
4
2000-0
8-0
7
2000-0
8-2
1
2000-0
9-0
4
2000-0
9-1
8
2000-1
0-0
2
2000-1
0-1
6
0
2000
4000
6000
8000
10000
12000
14000
16000
18000
Lexis-Nexis Deja.com
Cumulative count of "mozilla"
0
1
2
3
4
5
6
1999-0
8-0
9
1999-0
8-2
3
1999-0
9-0
6
1999-0
9-2
0
1999-1
0-0
4
1999-1
0-1
8
1999-1
1-0
1
1999-1
1-1
5
1999-1
1-2
9
1999-1
2-1
3
1999-1
2-2
7
2000-0
1-1
0
2000-0
1-2
4
2000-0
2-0
7
2000-0
2-2
1
2000-0
3-0
6
2000-0
3-2
0
2000-0
4-0
3
2000-0
4-1
7
2000-0
5-0
1
2000-0
5-1
5
2000-0
5-2
9
2000-0
6-1
2
2000-0
6-2
6
2000-0
7-1
0
2000-0
7-2
4
2000-0
8-0
7
2000-0
8-2
1
2000-0
9-0
4
2000-0
9-1
8
2000-1
0-0
2
2000-1
0-1
6
0
50000
100000
150000
200000
250000
300000
350000
Lexis-Nexis Deja.com
Frequency of "mozilla" on weblogs
0
10
20
30
40
2000-0
8-2
1
2000-0
9-0
4
2000-0
9-1
8
2000-1
0-0
2
2000-1
0-1
6

70
MP3
A digital music format. The Lexis-Nexis peak in September 2000 is prompted by a judge
fining MP3.com for copyright infringement.
Frequency of "mp3"
0
10
20
30
40
50
60
70
1999-0
8-0
9
1999-0
8-2
3
1999-0
9-0
6
1999-0
9-2
0
1999-1
0-0
4
1999-1
0-1
8
1999-1
1-0
1
1999-1
1-1
5
1999-1
1-2
9
1999-1
2-1
3
1999-1
2-2
7
2000-0
1-1
0
2000-0
1-2
4
2000-0
2-0
7
2000-0
2-2
1
2000-0
3-0
6
2000-0
3-2
0
2000-0
4-0
3
2000-0
4-1
7
2000-0
5-0
1
2000-0
5-1
5
2000-0
5-2
9
2000-0
6-1
2
2000-0
6-2
6
2000-0
7-1
0
2000-0
7-2
4
2000-0
8-0
7
2000-0
8-2
1
2000-0
9-0
4
2000-0
9-1
8
2000-1
0-0
2
2000-1
0-1
6
0
2000
4000
6000
8000
10000
12000
14000
Lexis-Nexis Deja.com
Cumulative count of "mp3"
0
200
400
600
800
1000
1200
1400
1999-0
8-0
9
1999-0
8-2
3
1999-0
9-0
6
1999-0
9-2
0
1999-1
0-0
4
1999-1
0-1
8
1999-1
1-0
1
1999-1
1-1
5
1999-1
1-2
9
1999-1
2-1
3
1999-1
2-2
7
2000-0
1-1
0
2000-0
1-2
4
2000-0
2-0
7
2000-0
2-2
1
2000-0
3-0
6
2000-0
3-2
0
2000-0
4-0
3
2000-0
4-1
7
2000-0
5-0
1
2000-0
5-1
5
2000-0
5-2
9
2000-0
6-1
2
2000-0
6-2
6
2000-0
7-1
0
2000-0
7-2
4
2000-0
8-0
7
2000-0
8-2
1
2000-0
9-0
4
2000-0
9-1
8
2000-1
0-0
2
2000-1
0-1
6
0
100000
200000
300000
400000
500000
600000
Lexis-Nexis Deja.com
Frequency of "mp3" on weblogs
0
20
40
60
80
2000-0
8-2
1
2000-0
9-0
4
2000-0
9-1
8
2000-1
0-0
2
2000-1
0-1
6

71
Napster
An application used for sharing MP3 music files over the Internet. At the end of July
2000 the Recording Industry Association of America was given an injunction against
Napster, which was then relieved temporarily.
Frequency of "napster"
0
20
40
60
80
100
120
140
160
180
200
1999-0
8-0
9
1999-0
8-2
3
1999-0
9-0
6
1999-0
9-2
0
1999-1
0-0
4
1999-1
0-1
8
1999-1
1-0
1
1999-1
1-1
5
1999-1
1-2
9
1999-1
2-1
3
1999-1
2-2
7
2000-0
1-1
0
2000-0
1-2
4
2000-0
2-0
7
2000-0
2-2
1
2000-0
3-0
6
2000-0
3-2
0
2000-0
4-0
3
2000-0
4-1
7
2000-0
5-0
1
2000-0
5-1
5
2000-0
5-2
9
2000-0
6-1
2
2000-0
6-2
6
2000-0
7-1
0
2000-0
7-2
4
2000-0
8-0
7
2000-0
8-2
1
2000-0
9-0
4
2000-0
9-1
8
2000-1
0-0
2
2000-1
0-1
6
0
2000
4000
6000
8000
10000
12000
14000
16000
Lexis-Nexis Deja.com
Cumulative count of "napster"
0
200
400
600
800
1000
1200
1400
1999-0
8-0
9
1999-0
8-2
3
1999-0
9-0
6
1999-0
9-2
0
1999-1
0-0
4
1999-1
0-1
8
1999-1
1-0
1
1999-1
1-1
5
1999-1
1-2
9
1999-1
2-1
3
1999-1
2-2
7
2000-0
1-1
0
2000-0
1-2
4
2000-0
2-0
7
2000-0
2-2
1
2000-0
3-0
6
2000-0
3-2
0
2000-0
4-0
3
2000-0
4-1
7
2000-0
5-0
1
2000-0
5-1
5
2000-0
5-2
9
2000-0
6-1
2
2000-0
6-2
6
2000-0
7-1
0
2000-0
7-2
4
2000-0
8-0
7
2000-0
8-2
1
2000-0
9-0
4
2000-0
9-1
8
2000-1
0-0
2
2000-1
0-1
6
0
20000
40000
60000
80000
100000
120000
140000
160000
Lexis-Nexis Deja.com
Frequency of "napster" on weblogs
0
20
40
60
80
2000-0
8-2
1
2000-0
9-0
4
2000-0
9-1
8
2000-1
0-0
2
2000-1
0-1
6

72
Ogg Vorbis
An open-source digital music format, an alternative to MP3.
Frequency of "ogg vorbis"
0
1
1999-0
8-0
9
1999-0
8-2
3
1999-0
9-0
6
1999-0
9-2
0
1999-1
0-0
4
1999-1
0-1
8
1999-1
1-0
1
1999-1
1-1
5
1999-1
1-2
9
1999-1
2-1
3
1999-1
2-2
7
2000-0
1-1
0
2000-0
1-2
4
2000-0
2-0
7
2000-0
2-2
1
2000-0
3-0
6
2000-0
3-2
0
2000-0
4-0
3
2000-0
4-1
7
2000-0
5-0
1
2000-0
5-1
5
2000-0
5-2
9
2000-0
6-1
2
2000-0
6-2
6
2000-0
7-1
0
2000-0
7-2
4
2000-0
8-0
7
2000-0
8-2
1
2000-0
9-0
4
2000-0
9-1
8
2000-1
0-0
2
2000-1
0-1
6
0
5
10
15
20
25
Lexis-Nexis Deja.com
Cumulative count of "ogg vorbis"
0
1
1999-0
8-0
9
1999-0
8-2
3
1999-0
9-0
6
1999-0
9-2
0
1999-1
0-0
4
1999-1
0-1
8
1999-1
1-0
1
1999-1
1-1
5
1999-1
1-2
9
1999-1
2-1
3
1999-1
2-2
7
2000-0
1-1
0
2000-0
1-2
4
2000-0
2-0
7
2000-0
2-2
1
2000-0
3-0
6
2000-0
3-2
0
2000-0
4-0
3
2000-0
4-1
7
2000-0
5-0
1
2000-0
5-1
5
2000-0
5-2
9
2000-0
6-1
2
2000-0
6-2
6
2000-0
7-1
0
2000-0
7-2
4
2000-0
8-0
7
2000-0
8-2
1
2000-0
9-0
4
2000-0
9-1
8
2000-1
0-0
2
2000-1
0-1
6
0
20
40
60
80
100
120
140
160
Lexis-Nexis Deja.com
Frequency of "ogg vorbis" on weblogs
0
1
2
2000-0
8-2
1
2000-0
9-0
4
2000-0
9-1
8
2000-1
0-0
2
2000-1
0-1
6

73
Pokemon
The cartoon/movie/toys/etc. In November 1999 Pokemon The First Movie opened in
America.
Frequency of "pokemon"
0
20
40
60
80
100
120
140
160
180
1999-0
8-0
9
1999-0
8-2
3
1999-0
9-0
6
1999-0
9-2
0
1999-1
0-0
4
1999-1
0-1
8
1999-1
1-0
1
1999-1
1-1
5
1999-1
1-2
9
1999-1
2-1
3
1999-1
2-2
7
2000-0
1-1
0
2000-0
1-2
4
2000-0
2-0
7
2000-0
2-2
1
2000-0
3-0
6
2000-0
3-2
0
2000-0
4-0
3
2000-0
4-1
7
2000-0
5-0
1
2000-0
5-1
5
2000-0
5-2
9
2000-0
6-1
2
2000-0
6-2
6
2000-0
7-1
0
2000-0
7-2
4
2000-0
8-0
7
2000-0
8-2
1
2000-0
9-0
4
2000-0
9-1
8
2000-1
0-0
2
2000-1
0-1
6
0
1000
2000
3000
4000
5000
6000
Lexis-Nexis Deja.com
Cumulative count of "pokemon"
0
500
1000
1500
2000
2500
1999-0
8-0
9
1999-0
8-2
3
1999-0
9-0
6
1999-0
9-2
0
1999-1
0-0
4
1999-1
0-1
8
1999-1
1-0
1
1999-1
1-1
5
1999-1
1-2
9
1999-1
2-1
3
1999-1
2-2
7
2000-0
1-1
0
2000-0
1-2
4
2000-0
2-0
7
2000-0
2-2
1
2000-0
3-0
6
2000-0
3-2
0
2000-0
4-0
3
2000-0
4-1
7
2000-0
5-0
1
2000-0
5-1
5
2000-0
5-2
9
2000-0
6-1
2
2000-0
6-2
6
2000-0
7-1
0
2000-0
7-2
4
2000-0
8-0
7
2000-0
8-2
1
2000-0
9-0
4
2000-0
9-1
8
2000-1
0-0
2
2000-1
0-1
6
0
50000
100000
150000
200000
250000
Lexis-Nexis Deja.com
Frequency of "pokemon" on weblogs
0
1
2
3
4
5
2000-0
8-2
1
2000-0
9-0
4
2000-0
9-1
8
2000-1
0-0
2
2000-1
0-1
6

74
Reality TV
A generic term for TV shows based around real people, often put in artificially controlled
conditions, such as Survivor and The 1900 House. At the beginning of July Big Brother
begins in the US. At the end of August 2000 Survivor reaches its climax. There is a gap in
Deja.com’s archive around August/September 2000 so no data is available.
Frequency of "reality tv"
0
10
20
30
40
50
60
70
1999-0
8-0
9
1999-0
8-2
3
1999-0
9-0
6
1999-0
9-2
0
1999-1
0-0
4
1999-1
0-1
8
1999-1
1-0
1
1999-1
1-1
5
1999-1
1-2
9
1999-1
2-1
3
1999-1
2-2
7
2000-0
1-1
0
2000-0
1-2
4
2000-0
2-0
7
2000-0
2-2
1
2000-0
3-0
6
2000-0
3-2
0
2000-0
4-0
3
2000-0
4-1
7
2000-0
5-0
1
2000-0
5-1
5
2000-0
5-2
9
2000-0
6-1
2
2000-0
6-2
6
2000-0
7-1
0
2000-0
7-2
4
2000-0
8-0
7
2000-0
8-2
1
2000-0
9-0
4
2000-0
9-1
8
2000-1
0-0
2
2000-1
0-1
6
0
10
20
30
40
50
60
70
80
Lexis-Nexis Deja.com
Cumulative count of "reality tv"
0
100
200
300
400
500
600
1999-0
8-0
9
1999-0
8-2
3
1999-0
9-0
6
1999-0
9-2
0
1999-1
0-0
4
1999-1
0-1
8
1999-1
1-0
1
1999-1
1-1
5
1999-1
1-2
9
1999-1
2-1
3
1999-1
2-2
7
2000-0
1-1
0
2000-0
1-2
4
2000-0
2-0
7
2000-0
2-2
1
2000-0
3-0
6
2000-0
3-2
0
2000-0
4-0
3
2000-0
4-1
7
2000-0
5-0
1
2000-0
5-1
5
2000-0
5-2
9
2000-0
6-1
2
2000-0
6-2
6
2000-0
7-1
0
2000-0
7-2
4
2000-0
8-0
7
2000-0
8-2
1
2000-0
9-0
4
2000-0
9-1
8
2000-1
0-0
2
2000-1
0-1
6
0
200
400
600
800
1000
1200
Lexis-Nexis Deja.com
Frequency of "reality tv" on weblogs
0
1
2
3
4
2000-0
8-2
1
2000-0
9-0
4
2000-0
9-1
8
2000-1
0-0
2
2000-1
0-1
6

75
SDMI
The Recording Industry Association of America’s Secure Digital Music Initiative. The
Usenet peak in September 2000 is caused by a competition opened to crack the SDMI
security. This is followed three weeks later by an announcement that it has been cracked.
Frequency of "sdmi"
0
1
2
3
1999-0
8-0
9
1999-0
8-2
3
1999-0
9-0
6
1999-0
9-2
0
1999-1
0-0
4
1999-1
0-1
8
1999-1
1-0
1
1999-1
1-1
5
1999-1
1-2
9
1999-1
2-1
3
1999-1
2-2
7
2000-0
1-1
0
2000-0
1-2
4
2000-0
2-0
7
2000-0
2-2
1
2000-0
3-0
6
2000-0
3-2
0
2000-0
4-0
3
2000-0
4-1
7
2000-0
5-0
1
2000-0
5-1
5
2000-0
5-2
9
2000-0
6-1
2
2000-0
6-2
6
2000-0
7-1
0
2000-0
7-2
4
2000-0
8-0
7
2000-0
8-2
1
2000-0
9-0
4
2000-0
9-1
8
2000-1
0-0
2
2000-1
0-1
6
0
10
20
30
40
50
60
70
80
Lexis-Nexis Deja.com
Cumulative count of "sdmi"
0
1
2
3
4
5
6
7
1999-0
8-0
9
1999-0
8-2
3
1999-0
9-0
6
1999-0
9-2
0
1999-1
0-0
4
1999-1
0-1
8
1999-1
1-0
1
1999-1
1-1
5
1999-1
1-2
9
1999-1
2-1
3
1999-1
2-2
7
2000-0
1-1
0
2000-0
1-2
4
2000-0
2-0
7
2000-0
2-2
1
2000-0
3-0
6
2000-0
3-2
0
2000-0
4-0
3
2000-0
4-1
7
2000-0
5-0
1
2000-0
5-1
5
2000-0
5-2
9
2000-0
6-1
2
2000-0
6-2
6
2000-0
7-1
0
2000-0
7-2
4
2000-0
8-0
7
2000-0
8-2
1
2000-0
9-0
4
2000-0
9-1
8
2000-1
0-0
2
2000-1
0-1
60
200
400
600
800
1000
1200
Lexis-Nexis Deja.com
Frequency of "sdmi" on weblogs
0
5
10
15
20
2000-0
8-2
1
2000-0
9-0
4
2000-0
9-1
8
2000-1
0-0
2
2000-1
0-1
6

76
SMS
Short Message Service, a method of sending text messages between cellular phones. One
problem is highlighted by the May 2000 Lexis-Nexis peak which is largely a result of
Siemens buying Shared Medical Systems Corp. (or, SMS).
Frequency of "sms"
0
2
4
6
8
10
12
1999-0
8-0
9
1999-0
8-2
3
1999-0
9-0
6
1999-0
9-2
0
1999-1
0-0
4
1999-1
0-1
8
1999-1
1-0
1
1999-1
1-1
5
1999-1
1-2
9
1999-1
2-1
3
1999-1
2-2
7
2000-0
1-1
0
2000-0
1-2
4
2000-0
2-0
7
2000-0
2-2
1
2000-0
3-0
6
2000-0
3-2
0
2000-0
4-0
3
2000-0
4-1
7
2000-0
5-0
1
2000-0
5-1
5
2000-0
5-2
9
2000-0
6-1
2
2000-0
6-2
6
2000-0
7-1
0
2000-0
7-2
4
2000-0
8-0
7
2000-0
8-2
1
2000-0
9-0
4
2000-0
9-1
8
2000-1
0-0
2
2000-1
0-1
6
0
500
1000
1500
2000
2500
3000
3500
4000
Lexis-Nexis Deja.com
Cumulative count of "sms"
0
20
40
60
80
100
120
140
160
180
1999-0
8-0
9
1999-0
8-2
3
1999-0
9-0
6
1999-0
9-2
0
1999-1
0-0
4
1999-1
0-1
8
1999-1
1-0
1
1999-1
1-1
5
1999-1
1-2
9
1999-1
2-1
3
1999-1
2-2
7
2000-0
1-1
0
2000-0
1-2
4
2000-0
2-0
7
2000-0
2-2
1
2000-0
3-0
6
2000-0
3-2
0
2000-0
4-0
3
2000-0
4-1
7
2000-0
5-0
1
2000-0
5-1
5
2000-0
5-2
9
2000-0
6-1
2
2000-0
6-2
6
2000-0
7-1
0
2000-0
7-2
4
2000-0
8-0
7
2000-0
8-2
1
2000-0
9-0
4
2000-0
9-1
8
2000-1
0-0
2
2000-1
0-1
6
0
20000
40000
60000
80000
100000
120000
140000
160000
180000
Lexis-Nexis Deja.com
Frequency of "sms" on weblogs
0
1
2
3
4
5
2000-0
8-2
1
2000-0
9-0
4
2000-0
9-1
8
2000-1
0-0
2
2000-1
0-1
6

77
WAP
Wireless Application Protocol, a means of accessing portions of the Internet with cellular
phones. The two Lexis-Nexis spikes in June/July 2000 are not prompted by any one
news story.
Frequency of "wap"
0
10
20
30
40
50
60
1999-0
8-0
9
1999-0
8-2
3
1999-0
9-0
6
1999-0
9-2
0
1999-1
0-0
4
1999-1
0-1
8
1999-1
1-0
1
1999-1
1-1
5
1999-1
1-2
9
1999-1
2-1
3
1999-1
2-2
7
2000-0
1-1
0
2000-0
1-2
4
2000-0
2-0
7
2000-0
2-2
1
2000-0
3-0
6
2000-0
3-2
0
2000-0
4-0
3
2000-0
4-1
7
2000-0
5-0
1
2000-0
5-1
5
2000-0
5-2
9
2000-0
6-1
2
2000-0
6-2
6
2000-0
7-1
0
2000-0
7-2
4
2000-0
8-0
7
2000-0
8-2
1
2000-0
9-0
4
2000-0
9-1
8
2000-1
0-0
2
2000-1
0-1
6
0
200
400
600
800
1000
1200
1400
1600
1800
Lexis-Nexis Deja.com
Cumulative count of "wap"
0
200
400
600
800
1000
1200
1999-0
8-0
9
1999-0
8-2
3
1999-0
9-0
6
1999-0
9-2
0
1999-1
0-0
4
1999-1
0-1
8
1999-1
1-0
1
1999-1
1-1
5
1999-1
1-2
9
1999-1
2-1
3
1999-1
2-2
7
2000-0
1-1
0
2000-0
1-2
4
2000-0
2-0
7
2000-0
2-2
1
2000-0
3-0
6
2000-0
3-2
0
2000-0
4-0
3
2000-0
4-1
7
2000-0
5-0
1
2000-0
5-1
5
2000-0
5-2
9
2000-0
6-1
2
2000-0
6-2
6
2000-0
7-1
0
2000-0
7-2
4
2000-0
8-0
7
2000-0
8-2
1
2000-0
9-0
4
2000-0
9-1
8
2000-1
0-0
2
2000-1
0-1
6
0
10000
20000
30000
40000
50000
60000
Lexis-Nexis Deja.com
Frequency of "wap" on weblogs
0
10
20
30
2000-0
8-2
1
2000-0
9-0
4
2000-0
9-1
8
2000-1
0-0
2
2000-1
0-1
6
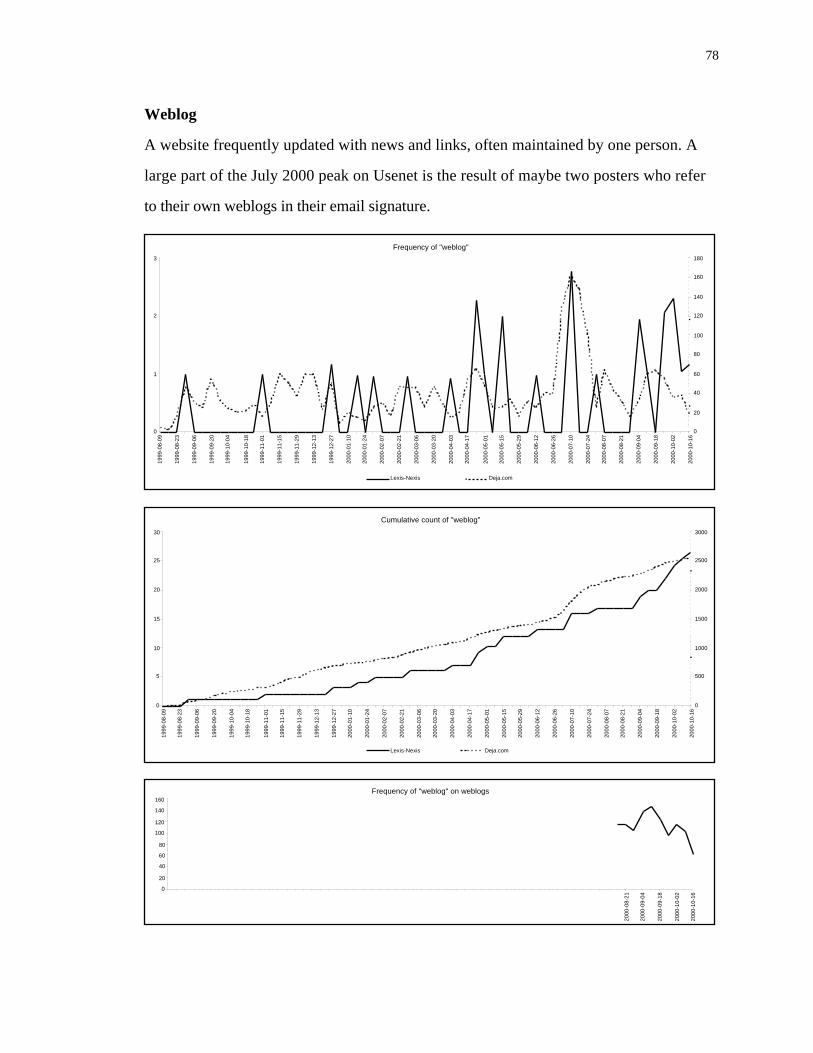
78
Weblog
A website frequently updated with news and links, often maintained by one person. A
large part of the July 2000 peak on Usenet is the result of maybe two posters who refer
to their own weblogs in their email signature.
Frequency of "weblog"
0
1
2
3
1999-0
8-0
9
1999-0
8-2
3
1999-0
9-0
6
1999-0
9-2
0
1999-1
0-0
4
1999-1
0-1
8
1999-1
1-0
1
1999-1
1-1
5
1999-1
1-2
9
1999-1
2-1
3
1999-1
2-2
7
2000-0
1-1
0
2000-0
1-2
4
2000-0
2-0
7
2000-0
2-2
1
2000-0
3-0
6
2000-0
3-2
0
2000-0
4-0
3
2000-0
4-1
7
2000-0
5-0
1
2000-0
5-1
5
2000-0
5-2
9
2000-0
6-1
2
2000-0
6-2
6
2000-0
7-1
0
2000-0
7-2
4
2000-0
8-0
7
2000-0
8-2
1
2000-0
9-0
4
2000-0
9-1
8
2000-1
0-0
2
2000-1
0-1
6
0
20
40
60
80
100
120
140
160
180
Lexis-Nexis Deja.com
Cumulative count of "weblog"
0
5
10
15
20
25
30
1999-0
8-0
9
1999-0
8-2
3
1999-0
9-0
6
1999-0
9-2
0
1999-1
0-0
4
1999-1
0-1
8
1999-1
1-0
1
1999-1
1-1
5
1999-1
1-2
9
1999-1
2-1
3
1999-1
2-2
7
2000-0
1-1
0
2000-0
1-2
4
2000-0
2-0
7
2000-0
2-2
1
2000-0
3-0
6
2000-0
3-2
0
2000-0
4-0
3
2000-0
4-1
7
2000-0
5-0
1
2000-0
5-1
5
2000-0
5-2
9
2000-0
6-1
2
2000-0
6-2
6
2000-0
7-1
0
2000-0
7-2
4
2000-0
8-0
7
2000-0
8-2
1
2000-0
9-0
4
2000-0
9-1
8
2000-1
0-0
2
2000-1
0-1
6
0
500
1000
1500
2000
2500
3000
Lexis-Nexis Deja.com
Frequency of "weblog" on weblogs
0
20
40
60
80
100
120
140
160
2000-0
8-2
1
2000-0
9-0
4
2000-0
9-1
8
2000-1
0-0
2
2000-1
0-1
6

79
Who Wants to Be a Millionaire?
The TV game show. The show finished in August/September 1999 and there were a
variety of copycat programmes preparing for broadcast. In November 1999 the show
does well in the sweeps and a man wins $1 million. The show is on air in February and
May 2000, the latter time including a celebrity edition. There is a gap in Deja.com’s data
around August/September 2000.
Frequency of "who wants to be a millionaire"
0
10
20
30
40
50
60
70
80
90
100
110
1999-0
8-0
9
1999-0
8-2
3
1999-0
9-0
6
1999-0
9-2
0
1999-1
0-0
4
1999-1
0-1
8
1999-1
1-0
1
1999-1
1-1
5
1999-1
1-2
9
1999-1
2-1
3
1999-1
2-2
7
2000-0
1-1
0
2000-0
1-2
4
2000-0
2-0
7
2000-0
2-2
1
2000-0
3-0
6
2000-0
3-2
0
2000-0
4-0
3
2000-0
4-1
7
2000-0
5-0
1
2000-0
5-1
5
2000-0
5-2
9
2000-0
6-1
2
2000-0
6-2
6
2000-0
7-1
0
2000-0
7-2
4
2000-0
8-0
7
2000-0
8-2
1
2000-0
9-0
4
2000-0
9-1
8
2000-1
0-0
2
2000-1
0-1
6
0
50
100
150
200
250
300
350
400
450
Lexis-Nexis Deja.com
Cumulative count of "who wants to be a millionaire"
0
500
1000
1500
2000
2500
3000
1999-0
8-0
9
1999-0
8-2
3
1999-0
9-0
6
1999-0
9-2
0
1999-1
0-0
4
1999-1
0-1
8
1999-1
1-0
1
1999-1
1-1
5
1999-1
1-2
9
1999-1
2-1
3
1999-1
2-2
7
2000-0
1-1
0
2000-0
1-2
4
2000-0
2-0
7
2000-0
2-2
1
2000-0
3-0
6
2000-0
3-2
0
2000-0
4-0
3
2000-0
4-1
7
2000-0
5-0
1
2000-0
5-1
5
2000-0
5-2
9
2000-0
6-1
2
2000-0
6-2
6
2000-0
7-1
0
2000-0
7-2
4
2000-0
8-0
7
2000-0
8-2
1
2000-0
9-0
4
2000-0
9-1
8
2000-1
0-0
2
2000-1
0-1
6
0
2000
4000
6000
8000
10000
12000
Lexis-Nexis Deja.com

80
Frequency of "who wants to be a millionaire" on weblogs
0
1
2
2000-0
8-2
1
2000-0
9-0
4
2000-0
9-1
8
2000-1
0-0
2
2000-1
0-1
6

81
APPENDIX B – WEBLOGS
There has been more discussion about how to define a weblog than is probably healthy. A
basic description that most people would probably agree with is “a website or page that
is updated frequently (often daily) with short pieces of copy, usually links to other sites
with commentary, or more personal material about the author.” The biggest arguments are
whether a weblog is purely a daily(ish) list of links to other places or whether it should or
could include personal information along the lines of usually more lengthy journals found
online.
Weblogs (or “blogs,” as they are often called) are based around links to other sites,
pages or news stories, often with comments by the weblogger. In this case the weblogger
is acting more like an editor than an author, picking out things he/she thinks is worth
visiting. Some feature more thoughtful and longer pieces. Some are updated many times a
day with small snippets of the weblogger’s daily life. It is a fairly incestuous world, in
which one weblog will often link to others (some go as far as to actively court reciprocal
links back).
Weblogs have been around in form, if not name, for years with pages such as
Mosaic’s ‘What’s New’32 dating from 1993. Justin Hall’s ‘Links from the
Underground’33 was perhaps the first such page that reflected an individual’s personality,
as most weblogs do today. Or the first that anyone remembers. In 1997 Dave Winer’s
company, Userland, released a version of their Frontier software that made it easier to
32 www.ncsa.uiuc.edu/SDG/Software/Mosaic/Docs/old-whats-new/33 The story of ‘Links from the Underground’ can be found here: www.links.net/vita/web/story.html

82
quickly update such pages, as demonstrated by Winer’s own Scripting News.34 Later that
year Jorn Barger was the first to use the term “weblog” to describe the front page of his
site, Robot Wisdom.35
The number of weblogs increased exponentially in 1999, a year in which other
weblog-building tools were released, such as Pitas, Blogger and EditThisPage. Suddenly
there were hundreds and then thousands, as more people began realising how easy it was
to create a website that people might want to visit frequently. Articles began to appear in
online magazines and news websites, and in many print publications. At the time of
writing, this process of writing articles about this “new” phenomenon shows no sign of
slowing.
While weblogs have grown out of personal enthusiasm, there are an increasing
number of professional weblogs providing a quick way to get a grip on the mammoth
daily flow of new material available online. As mentioned earlier, Jim Romenesko’s
MediaNews was bought by Poynter, and other publications such as The Guardian have
started their own weblogs.36
This brief background to weblogs has drawn on material by Jorn Barger37 and
Rebecca Blood.38
34 www.scripting.com35 www.robotwisdom.com36 www.guardianunlimited.co.uk/weblogindex/37 www.robotwisdom.com/weblogs/38 www.rebeccablood.net/essays/weblog_history.html

83
APPENDIX C – LIST OF TRACKED WEBLOGS
The weblogs that have been tracked for at least some of the duration of the project. A few
ceased publication part-way through, and some were added as the project progressed,
when they appeared on the two source websites.
/usr/bin/girl www.stormwerks.com/linked/2020 Hindsight 2020Hindsight.editthispage.com/Andrea's Weblog andrea.editthispage.com/ Anita's LOL anitar.pitas.com/ Apathy electrobacon.com/apathy/ AppleSurf www.myapplemenu.com/applesurf/ Array array.editthispage.com/ Backup Brain www.backupbrain.com/ Barbelith www.barbelith.com/ Bifurcated Rivets catless.ncl.ac.uk/Lindsay/weblog/latest.htmlBird on a wire students.washington.edu/lwinn/bird/ BirdBrain's Nest brdbrain.editthispage.com/ Blackholebrain blackholebrain.editthispage.com/ Bling www.davidgagne.net/ Bluishorange www.bluishorange.com/ BookNotes News booknotes.weblogs.com/ Bovine Inverse Experience, The bovineinversus.com/Bradlands, The www.bradlands.com/ Bump www.bump.net/ Calamondin www.calamondin.com/ Camworld www.camworld.com/ Cardhouse Weblog www.cardhouse.com/links/weblog.htm Catherine's Pita catwoman.pitas.com/ Cocky Bastard www.prehensile.com/cocky.htm Ctrl-alt-ego www.ctrl-alt-ego.com/blog.html Curmudgeon Teaches Statistics, A cuwu.editthispage.com/ Dack.com dack.com/ Daily Report www.zeldman.com/coming.html

84
Dandot.com/today www.dandot.com/today/Eatonweb weblog.mercurycenter.com/ejournal/ Ethel the Blog stommel.tamu.edu/~baum/ethel/blogger.html Evhead www.evhead.com/ Flutterby www.flutterby.com/ Geegaw.com www.geegaw.com/ Genehack genehack.org/ Ghost in the Machine www.geocities.com/kevincmurphy/weblog.html GirlHacker's Random Log www.girlhacker.com/log.html GmtPlus9 www.bekkoame.ne.jp/~aabb/plus9.html Good Morning Silicon Valley www.mercurycenter.com/svtech/reports/gmsv/ Hack the Planet wmf.editthispage.com/ Haddock Directory www.haddock.org/ Harrumph! www.harrumph.com/ Have Browser, Will Travel jim.roepcke.com/Highindustrial highindustrial.com/Hit-or-miss.org www.hit-or-miss.org/ Inessential.com inessential.com/ Jeff's Weblog ican.editthispage.com/ Joel on Software joel.editthispage.com/Keithbrowndotcom www.keithbrown.com/ Kitschbitch www.kitschbitch.com/ Kottke.org kottke.org/ Lake Effect www.wwa.com/~dhartung/weblog/ Looka! www.gumbopages.com/looka/ MacInTouch www.macintouch.com/Malapropism wondergurl.com/malaprop/Manila Newbies weblogs.userland.com/manilaNewbies/ Mattl.com www.mattl.com/ Medley www.uncorked.org/medley/Megnut www.megnut.com/ Memepool www.memepool.com/ MetaFilter www.metafilter.com/ Metajohn metajohn.com/ Metascene members.tripod.com/amused_2/weblog.html Mike's Weblog www.larkfarm.com/weblog.aspMore Like This www.whump.com/moreLikeThis/index.php3 Mr. Pants www.misterpants.com/01/ MrBarrett.com www.mrbarrett.com/ NetDyslexia netdyslexia.editthispage.com/ No London nolondon.qwe.as/ Obscure Store www.obscurestore.com/ Onfocus www.onfocus.com/

85
Ooine.com www.ooine.com/ Peterme.com www.peterme.com/ Philly Future phillyfuture.editthispage.com/Pith and Vinegar www.pocketgeek.com/pith/ Pop Culture Junk Mail www.popculturejunkmail.com/ Prolific prolific.org/ Q Daily News q.queso.com/QubeQuorner qube.weblogs.com/RC3.org Daily rc3.org/Re-run www.bryanjbusch.com/lately/ Rebecca's Pocket www.rebeccablood.net/ Riothero www.riothero.com/ Robot Wisdom www.robotwisdom.com/ Saturn.org saturn.org/ Scripting News www.scripting.com/ Sheila's Web Site sheila.inessential.com/ Slashdot slashdot.org/ Spicy Noodles spicynoodles.com/ Strange Brew 50cups.com/strange/default.asp Stuffed Dog, The www.stuffeddog.com/ Swallowing Tacks www.swallowingtacks.com/TBTF Log tbtf.com/blog/ Tomalak's Realm www.tomalak.org/ Traumwind traumwind.editthispage.com/ Twernt twernt.com/weblog/ View from an Iowa Homestead vfih.editthispage.com/ View From the Heart viewfromtheheart.editthispage.com/ Web Queeries www.hit-or-miss.org/queeries/ Weblog Shmeblog www.jish.nu/ Weblog Wannabe www.wannabegirl.org/ Webloglog trenchant.org/webloglog/ Wetlog www.wrongwaygoback.com/ Whim and Vinegar gooddeed.net/blog/ Xblog www.xplane.com/xblog/ Zope Newbies News weblogs.userland.com/zopeNewbies/
The following sites are not included as they are either professional sites or do not fit my
definition of a weblog:
Arts & Letters Daily cybereditions.com/aldaily/Blogger www.blogger.com/Discuss.Userland.com discuss.userland.com/

86
Dr. Dobb's Web Site (news page) www.ddj.com/news/Linkwatcher Metalog www.linkwatcher.com/metalog/Monkeyfist Collective monkeyfist.com/Need to Know www.ntk.net/O'Reilly Network www.oreillynet.com/Onlinejournalism.com ojr.usc.edu/content/ojc/SalonHerringWiredFool.com www.salonherringwiredfool.com/XML.com www.xml.com/pub/
The following sites are not included as they were not being updated when the project
began:
Blogging, Italian Style www.ouch.vms1.com/OneSwellFoop www.oneswellfoop.com/index.htmlRunning Tally www.nullmeansnull.com/tally/
The following site is not included as it is not in English:
Alt0169 www.alt0169.com/