conceptual design report usg interiors puyallup site
TRANSCRIPT

Conceptual Design Report USG Interiors Puyallup Site
Puyallup, Washington
Prepared for: USG Corporation 550 West Adams Street Chicago, Illinois 60661-3676
April 16, 2020


A Report Prepared for:
USG Corporation 550 West Adams Street Chicago, Illinois 60661-3676
CONCEPTUAL DESIGN REPORT USG INTERIORS PUYALLUP SITE PUYALLUP, WASHINGTON
April 16, 2020
Meredith L. Passaro Geotechnical Engineer
Pamela Morrill, LHG, PMP Project Manager
Prepared by: 14432 SE Eastgate Way, Suite 100 Bellevue, Washington 98007 425/519-8300
CDM Smith Project No. 19921.246239

This page intentionally left blank.

i
Table of Contents
Section 1 Introduction ..................................................................................................... 1-1 1.1 Site History and Background ............................................................................................................................... 1-1 1.2 Remedial Investigation and Feasibility Study .............................................................................................. 1-2 1.3 Summary of the CAP and Subsequent Investigations ............................................................................... 1-3 1.4 Objective and Scope of Work ............................................................................................................................... 1-3 1.5 Report Organization ................................................................................................................................................ 1-4
Section 2 Conceptual Site Model ...................................................................................... 2-1 2.1 Geology and Hydrogeology ................................................................................................................................... 2-1
2.1.1 Geology ............................................................................................................................................................ 2-1 2.1.2 Hydrogeology................................................................................................................................................ 2-2 2.1.3 Surface Water ............................................................................................................................................... 2-3 2.1.4 Groundwater/Surface Water Interaction ......................................................................................... 2-3
2.2 Nature and Extent of Contamination ................................................................................................................ 2-3 2.2.1 Soil ..................................................................................................................................................................... 2-3 2.2.2 Groundwater ................................................................................................................................................. 2-4 2.2.3 Sediment ......................................................................................................................................................... 2-4
2.3 Contaminant Fate and Transport....................................................................................................................... 2-4 2.4 Leapfrog Model .......................................................................................................................................................... 2-6
Section 3 Summary of CAP Modifications and Conceptual Design ..................................... 3-1 3.1 Summary of CAP Modifications .......................................................................................................................... 3-1 3.2 Proposed Conceptual Design ............................................................................................................................... 3-2
Section 4 Data Gap Evaluation ......................................................................................... 4-1 4.1 Summary of Design Data Needs ......................................................................................................................... 4-1 4.2 Summary of Existing Data ..................................................................................................................................... 4-2 4.3 Summary of Data Review ...................................................................................................................................... 4-4 4.4 Pre-Design Geotechnical Data Needs for Puyallup ..................................................................................... 4-5 4.5 Proposed Geotechnical Investigation and Data Gathering ..................................................................... 4-5
Section 5 Conceptual Schedule ........................................................................................ 5-1 5.1 Conceptual Design Report..................................................................................................................................... 5-1 5.2 Data Gap Field Investigation ................................................................................................................................ 5-1 5.3 Pilot Study .................................................................................................................................................................... 5-1 5.4 Design and Construction ....................................................................................................................................... 5-2
Section 6 References ....................................................................................................... 6-1

Table of Contents
ii
List of Figures Figure 1 Vicinity Map Figure 2 Site Plan Figure 3 Geologic Cross Section A – A’ Figure 4 Groundwater Elevation Contours Figure 5 Extents of Arsenic in Soil – Plan View Figure 6 Extents of Arsenic in Soil – Cross Section B-B’ Figure 7 Proposed Extents of ISS Remediation Figure 8 Proposed Extents of ISS Remediation – Cross-Section B-B’ Figure 9 USG Hwy 99 – Puyallup Joint Conceptual Schedule
List of Tables Table 3-1 Summary of Proposed ISS Treatment Areas and Volumes .............................................................. 3-2 Table 3-2 Summary of Impacted Soil Treatment for Arsenic Concentrations >90 mg/kg ..................... 3-3 Table 4-1 Puyallup Preliminary Remedial Design Elements and Data Needs ............................................. 4-5

1-1
Section 1 Introduction
This report presents the proposed conceptual design and modifications to the cleanup actions at the USG Interiors, LLC (USG) Puyallup property located in Puyallup, Washington (referred to herein as the property or site). The site location is shown on Figure 1. CDM Smith Inc. (CDM Smith) has completed this work on behalf of USG in support of the Cleanup Action Plan (CAP) issued by the Washington State Department of Ecology (Ecology) on April 1, 2019. This work is being performed in accordance with Agreed Order No. DE 11098 (current Order) between Ecology and USG under the Model Toxics Control Act (MTCA), Chapter 70.105D RCW. The work presented in this report was completed as a follow-up to the Conceptual Design presentation held with Ecology and USG on December 20, 2019.
1.1 Site History and Background The USG Puyallup site consists of 1.58 acres located adjacent to the Puyallup River, as shown on Figure 2. The southern (paved) portion of the property was formally occupied by several buildings but is currently vacant. The northern portion of the property is unpaved and prone to seasonal overbank flooding of the Puyallup River. A paved bike path extends beside the south bank of the Puyallup River.
The historical description that follows is based on CDM Smith’s interpretation of historical aerial photographs and information provided to Ecology by USG.
Exactly when commercial activity began at the property is not documented, but aerial photographs show commercial activities on the property by 1961. What appears to have been a used car sales business occupied the southern portion of the property. The northern portion at that time contained junk cars. Site use appeared to be consistent throughout the remainder of the 1960s.
A February 1971 aerial photograph clearly showed fill being placed on the northern portion of the site. The source of this fill is unknown. Aerial photographs taken in the mid-1970s show that the northern portion of the property continued to be used as a junk car lot following the filling of the property that occurred circa 1971.
A 1979 aerial photograph showed a fence around most of the northern portion of the property; the area inside the fence was filled with junk cars. This fence arrangement is identical to that shown on an April 1982 topographic map of the property. An aerial photograph dated August 1982 shows the northern portion of the property still being used as a junk car lot, but there were noticeably fewer cars than seen in the 1979 aerial photograph.
Sometime prior to 1971 through the early 1970s industrial waste from USG’s Tacoma, Washington plant was used to fill the site. Because exact dates of these activities are not documented, their association with fill operations observed in the February 1971 aerial photograph cannot be determined.

Section 1 • Introduction
1-2
It is known that from about 1959 to 1973, the USG Tacoma plant used ASARCO slag as a raw material for mineral fiber production. In the early 1980s, USG became aware of the association between ASARCO slag and arsenic contamination. Accordingly, USG purchased the Puyallup property in October 1982 to facilitate its cleanup. That same year, USG voluntarily approached Ecology to negotiate an administrative process to govern the removal of industrial waste fill from the site. USG conducted an assessment in 1983 to characterize site geology and groundwater conditions.
Soil and groundwater cleanup standards had not been established in Washington State at this time. Agreed Order No. DE 84-506 established arsenic cleanup standards of 5 milligrams per liter (mg/L) by the EP Toxicity (leaching) method for soil and 0.5 mg/L for groundwater. Although detailed records have not been located, a March 1985 aerial photograph indicated cleanup occurred in the spring of 1985. This photograph shows all the junk cars had been removed and the unpaved (northern) portion of the site appears to have been graded. According to information submitted by USG to Ecology, 25,536 tons of industrial waste fill and underlying soil were removed from the site for off-site disposal. Of this total, approximately 3,500 tons of native soil was removed from the northwest corner of the property because verification soil samples did not achieve the cleanup standard. The cleanup standard was not attained in the over excavation area because caving conditions were encountered during excavation. An August 1985 aerial photograph shows that the site had undergone final grading.
The 1984 Order also required USG to conduct post-cleanup groundwater monitoring. To this end, USG installed three clusters (P1, P2, and P3) of three monitoring wells each (P1-1, P1-2, P1-3, etc.) in May 1985 to assess the lateral and vertical extent of arsenic in groundwater. Groundwater samples were collected from these wells on a monthly basis.
On April 22, 1987 Ecology issued Consent Order No. 86-S130, which required long-term groundwater sampling. The groundwater cleanup level listed in this Order was 500 micrograms per liter (μg/L). Groundwater sampling continued on a monthly basis for the P2 and P3 well clusters but was dropped for the P1 well cluster.
1.2 Remedial Investigation and Feasibility Study MTCA was enacted and went into effect in March 1989. MTCA governs state-led environmental cleanups in Washington State. In 1991, Ecology established MTCA Method A arsenic cleanup levels of 20 mg/kg for soil and 5 μg/L for groundwater. These MTCA cleanup standards for arsenic were not considered applicable at the Puyallup site due to the cleanup levels established under Order No. 86-S130.
Long-term groundwater sampling performed by USG under Order 86-S130 continued until early 2006. In the last monitoring round conducted in April 2006, arsenic was detected at a concentration of 5,960 μg/L at groundwater monitoring well P3-1.
In 2006, Ecology determined that the MTCA Method A groundwater cleanup level would not be attained in a reasonable timeframe by natural attenuation and required USG conduct an additional soil and groundwater assessment for arsenic. This assessment showed that arsenic in soil and groundwater exceeded MTCA Method A cleanup standards in the contaminant source
Section 1 • Introduction
1-3
area. On March 30, 2007, Ecology sent USG a letter naming USG as a potentially liable party for the release of arsenic at the site and issued Order DE 5489, which required USG to perform a Remedial Investigation/Feasibility Study (RI/FS) and Cleanup Action Plan (CAP).
RI fieldwork was conducted between 2009 and 2010 and characterized the nature and extent of arsenic in soil, sediment, groundwater, and surface water. The FS screened remedial technologies for the various impacted media and developed remedial action alternatives.
A Bench-Scale Treatability Study was performed in 2012 and a Supplemental Bench-Scale Treatability Study was performed in 2013 (CDM Smith, 2012; CDM Smith 2013a). Results from the study indicated that cement-based solidification/stabilization mixtures containing Portland cement (13%), bentonite (2%), and a 5:1 iron (FeII) to arsenic mass ratio were most effective in reducing arsenic mobility in soil.
1.3 Summary of the CAP and Subsequent Investigations The CAP, issued on April 1, 2019 (Ecology, 2019) for the Puyallup site presented the preferred alternative (Remedial Action Alternative 2A) and included the following components:
1. In-situ solidification and stabilization (ISS) of the vadose zone fill/soils exceeding 90 milligrams per kilogram (mg/kg) by injection of a reagent via auger mixing.
2. Groundwater treatment by in situ chemical oxidation (ISCO), install a stormwater infiltration gallery, and re-install the monitoring well network.
3. Excavation and offsite disposal of impacted sediment in Puyallup River. While the sediment data are summarized in this document, no modification of the sediment cleanup is presently proposed.
The CAP included the need for the following studies prior to full scale implementation:
1. Conduct bench scale and pilot testing to assess soil oxidant demand, select the best oxidant, and determine the delivery system for groundwater treatment with ISCO
On April 11, 2019, Ecology issued Agreed Order DE 11098, which required planning and completion of an ISCO pilot study through implementation of the remedial action as outlined in the CAP. In January through March 2019 an ISCO pilot study was performed at USG’s Highway 99 site, which has a similar history and is undergoing cleanup actions on a parallel path as USG’s Puyallup site. The pilot study found ISCO to be highly complicated to implement and did not reduce arsenic in groundwater to the levels desired. Based on this, CDM Smith undertook consideration of an alternative approach to the cleanup actions for both the Puyallup and Highway 99 sites that would be less reliant on ISCO. This included modifying the area for in situ solidification, particularly targeting high arsenic concentration soils in the saturated zone.
1.4 Objective and Scope of Work The purpose of this report is to present the proposed CAP modifications, conceptual design, and to identify data needs for future remedial implementation at the Puyallup site. The specific objectives of this report for the Puyallup site are presented below.

Section 1 • Introduction
1-4
1. Provide a summary of the conceptual site model and introduce the 3-D visualization software used to develop modifications to the CAP;
2. Provide a summary of the proposed CAP Modifications and updated Conceptual Design, which includes conducting ISS to a greater depth in an effort to treat residual source material;
3. Provide a data gap assessment and identify data needs for the proposed Conceptual Design. The data gap assessment will also identify common elements between the USG Puyallup and Highway 99 sites that may be conducted as a joint effort; and
4. Provide an updated schedule for implementation of the proposed Conceptual Design.
As was noted above, similar site work is ongoing at USG’s nearby Highway 99 site. Due to proximity and commonality of the Puyallup site with the Highway 99 site, portions of the future data gathering needs may be conducted as a joint effort. This joint effort will be further discussed within Section 4 of this report.
1.5 Report Organization The Conceptual Design report is organized into 5 sections, as summarized below:
• Section 1: Introduction – Presents a description of the site and background and presents the proposed changes to the CAP.
• Section 2: Conceptual Site Model – Presents a description of the site geology and hydrogeology, nature and extent of contamination in site soil and groundwater, and fate and transport mechanisms. A description of the Leapfrog model used to develop the conceptual model of arsenic concentrations in soil is provided. The results of the model are presented by including printouts of 3D representations of the affected area and selected cross sections to show the total extent of the affected area.
• Section 3: Conceptual Design - A recommended conceptual design of the ISS treatment areas is provided. The proposed areas of treatment are overlain on the modeled arsenic plume provided by the Leapfrog model. Similarly, the plan views and representative cross sections are presented in the report.
• Section 4: Data Gap Evaluation - Assesses the data gaps and provides an overview of future data gathering needs to be fulfilled prior to initiating work on the final design.
• Section 5: Conceptual Design Schedule - Presents a conceptual design schedule that incorporates the proposed changes to the CAP.

2-1
Section 2 Conceptual Site Model
A brief description of the site-specific conceptual site model including the geology and hydrogeology, nature and extent of contamination in site soil and groundwater, fate and transport mechanisms, and Leapfrog Model overview is provided herein.
2.1 Geology and Hydrogeology Information relevant to site geology and hydrogeology is presented in the following sub-sections.
2.1.1 Geology The site is located on the south bank of the lower Puyallup River within the Puyallup River valley. Soils in the Puyallup River valley consist of alluvium derived from the Puyallup River, underlain by glacial deposits. The Puyallup River alluvial deposits are consistent with alluvial deposits found worldwide and consist of three major types: overbank flood deposits, slack water deposits, and bar accretion deposits. It is important to note that these depositional processes are currently active.
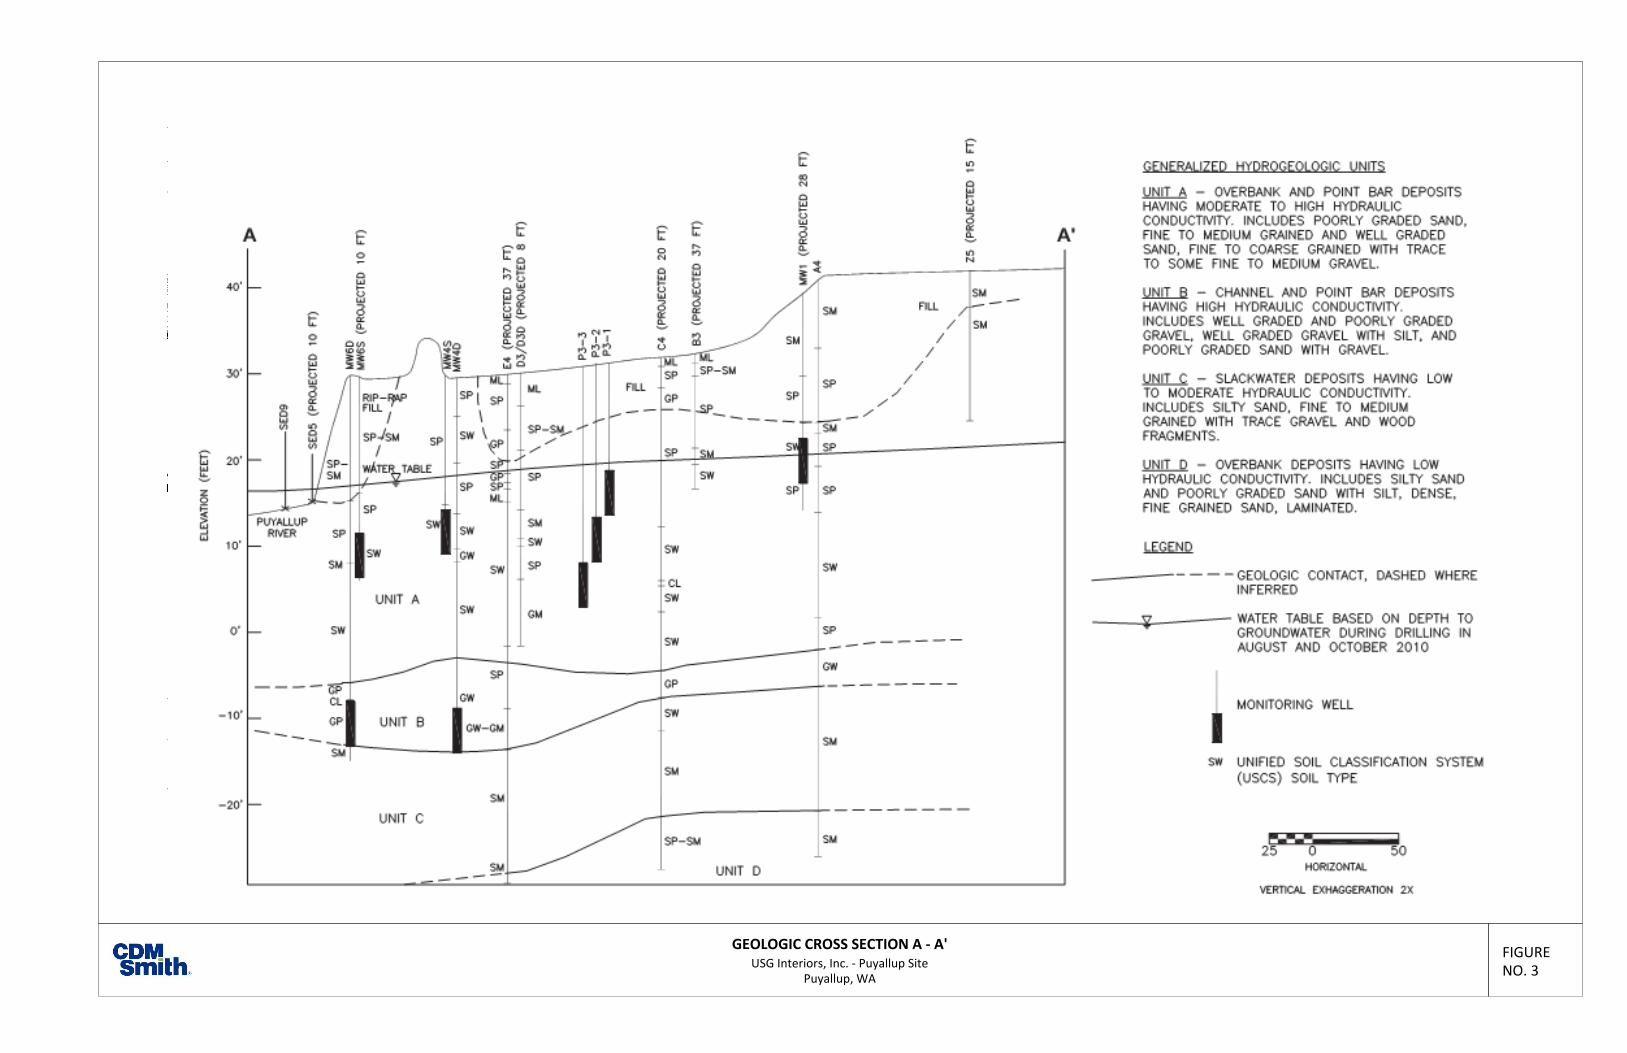
The specific site geology is summarized in geologic cross-section A-A’, which is identified on Figure 2 and presented on Figure 3. Generalized stratigraphy consists of fill overlying alluvium associated with the Puyallup River.
The fill includes backfill material associated with the former remedial excavation and fill associated with early site development, likely prior to commercial use of the site. The fill extends to depths ranging from 2 to 16 feet below ground surface (bgs) and soil types include poorly graded sand with silt and gravel (SP-SM), poorly graded sand with gravel (SP), and poorly graded gravel (GP). Traces of man-made debris are present within the fill (paper, wood, plastic, metal, brick, and concrete fragments).
The fill is differentiated from alluvium by the presence of man-made debris and angular to subangular gravel. Minor quantities of recently deposited overbank flood deposits (poorly graded sand and silt) overlie fill in the northern portion of the site. This material was deposited during flood events that occurred after the 1985 source removal action. As shown in the geologic cross-section on Figure 3, alluvium underlies the fill to the total depth explored. The alluvium is subdivided into four units based on depositional environment, including:
Unit A – Overbank and point bar deposits
Unit B – Channel and point bar deposits
Unit C – Slack water deposits
Unit D – Overbank deposits
Section 2• Conceptual Site Model
2-2
Each of these units is described in more detail below.
Unit A – Overbank and Point Bar Deposits This unit extends from the ground surface, or bottom of fill, to an approximate depth of 40 feet bgs. Unit A includes interlayered, fine-grained, poorly graded sand (SP) and well-graded sand (SW) with minor clay (CL) interbeds up to 6 inches thick. The soils were deposited by the Puyallup River and are exposed in the banks and bed of the river. Unit B – Channel and Point Bar Deposits This unit consists of gravel (GP, GW, and GW-GM), which represents higher energy deposition in an active river channel. This unit is less than 5 feet thick and underlines Unit A at a depth of approximately 40 ft bgs. Unit C – Slack Water Deposits This unit consists of a sequence of silty sand (SM) containing wood fragments and organic matter. The presence of increased silt and organic matter indicated deposition in a lower energy slack water environment. The unit is approximately 15 feet thick and extends to total depths ranging from 54 to 61 feet bgs. Unit D – Overbank Deposits This unit consists of dense, fine-grained silty sand (SM) and poorly graded sand with silt (SP_SM). The soil contains minor sub-horizontal laminations. The fine-grained sand and higher silt content indicate deposition in a lower energy environment such as overbank deposits distal to an active river channel. Unit D underlies Unit C and the total depth is not known.
2.1.2 Hydrogeology
Groundwater occurs under semi-confined conditions at this site. The sands and gravels of Units A and B form the primary aquifer at this site and the lower permeability soils of Units C and D may act as a local aquitard, limiting downward vertical flow. During RI drilling, groundwater was first encountered at depths ranging from 10 to 18 ft bgs.
A groundwater elevation contour map for the shallow aquifer, based on November 10, 2009 depth to groundwater measurements, is shown on Figure 4. The groundwater elevation contours indicate groundwater flows to the north. The horizontal hydraulic gradient ranges from 0.006 foot/foot in the south and central part of the site (between monitoring wells RRN and P3-1), flattening to approximately 0.004 foot/foot in the northern part of the site between well P3-1 and the bank of the Puyallup River. The hydraulic conductivity of the shallow aquifer (Unit A) ranges from 80 to 120 feet/day (0.028 to 0.042 centimeters/second [cm/s]), based on an estimate using the Hazen (1911) method and the grain size distribution results for a representative soil sample collected from this aquifer.
Vertical hydraulic gradients were calculated at the P2-1 to P2-3, P3-1 to P3-3, MW4S to MW4D, and MW6S to MW6D well clusters. The vertical gradients were calculated by dividing the head differential between the shallow and deeper well by the vertical distance between screen midpoints. The results indicate an upward vertical hydraulic gradient of 0.005 foot/foot between wells MW4S and MW4D and 0.0006 foot/foot between MW6S and MW6D, indicating upward

Section 2 • Conceptual Site Model
2-3
groundwater flow from the deeper portion of the aquifer (Unit B) toward the shallow portion of the aquifer near the discharge point at the Puyallup River. A slight downward vertical gradient in the uppermost portion of the aquifer (Unit A) was calculated at the P2-1 and P3-1 well clusters.
The average linear velocity of groundwater flow in the shallow aquifer is estimated to range from 1 to 2 feet/day (0.00035 to 0.00071 cm/s) based on the range of hydraulic conductivities and horizontal hydraulic gradients determined for the site. An effective porosity of 0.32 was assumed for the velocity measurement.
2.1.3 Surface Water The Puyallup River extends 54 miles, flowing in a northwest direction from its glacial source on the southwestern slopes of Mt. Rainier and discharges into Commencement Bay adjacent to the City of Tacoma. The river and its tributaries drain an area of about 1,000 square miles in Pierce County and southern King County. The portion of the river adjacent to the site and near the city of Puyallup, approximately 8 miles upstream from Commencement Bay, is characterized by water flows that average 6,926 cubic feet per second (ft3/s) and range from 597 to 40,700 ft3/s; the median discharge is just under 3,000 ft3/s (USGS, 2008). Three dams built in the early to mid-1990s are located upstream of the site, and discharge at the reach of the river adjacent to the site is largely controlled by the operation of these dams. The site falls within the lower Puyallup River valley and the 500-year Lower Puyallup floodplain as determined by the Federal Emergency Management Agency in 2007. Despite flood control levees located along the bank of the Puyallup River; occasional overbank flooding occurs during the winter months.
2.1.4 Groundwater/Surface Water Interaction Under normal hydraulic conditions, the Puyallup River is a gaining stream, meaning groundwater from the site discharges to the river. This relationship is reversed during periods of overbank flooding (which occurs occasionally in the winter), but this condition is transitory.
2.2 Nature and Extent of Contamination 2.2.1 Soil The distribution of residual arsenic in soil was investigated during the 2006 subsurface assessment and the RI conducted in 2009 through 2010. Arsenic concentrations are generally low – typically less than 20 mg/kg – across the site at ground surface and in the vicinity of the P3 well cluster in the shallow subsurface (up to 4 feet bgs or 32 to 28 feet mean sea level [MSL]). This likely represents low arsenic concentrations in fill imported and placed over a broad area after the 1985 remedial action, and recent (post-1985) deposition from overbank flooding. However, arsenic was detected at concentrations exceeding the MTCA Method A cleanup level of 20 mg/kg in surface soil around boring location A-6. Concentrations of arsenic exceeding the MTCA Method A cleanup level also occur to the south and west of the P3 well cluster in the shallow subsurface (i.e. 4 to 10 feet bgs) in areas assumed to be on the fringe of the 1985 remedial excavation.
In general, arsenic concentrations range from 3 to 2,100 mg/kg in the vadose zone and are highest at approximately 10 feet bgs (in the 24 to 20 feet MSL elevation interval) in the intermittently saturated zone near the P3 well cluster. Variability is observed in arsenic concentrations in the vadose zone across the site. This indicates that soil excavation in 1985 was

Section 2• Conceptual Site Model
2-4
focused on the northwest corner of the property and it reached approximately 8 to 10 feet below the current grade at its deepest but did not address the entire extent of the arsenic in the vadose zone at the site.
Arsenic concentrations in the saturated zone range up to 2,900 mg/kg. The greatest arsenic concentrations in saturated soil (as compared to the vadose zone soils) shift to the north of the P3 well cluster a depths of approximately 12 to 14 feet bgs (20 feet MSL), likely representing transport of dissolved arsenic by groundwater and subsequent adsorption or precipitation of this arsenic.
2.2.2 Groundwater The highest arsenic concentrations were detected in the area focused around the P3 well cluster. A maximum dissolved arsenic concentration of 6,100 μg/L was detected in monitoring well P3-1, the shallowest well in the P3 well cluster.
Arsenic concentrations attenuate by nearly an order of magnitude between P3-1 and downgradient well MW-6S (a distance of 135 feet), adjacent to the Puyallup River. Arsenic concentrations also attenuate with depth. This is illustrated in the P3 well cluster where arsenic was detected at 6,100 μg/L in shallow well P3-1, at 420 μg/L in mid-level well P3-2, and 2 μg/L in P3-3, the deepest well in the P3 cluster. The vertical distance between the P3-1 and P3-3 screened intervals is approximately 10 feet.
2.2.3 Sediment A bathymetric survey of the Puyallup River and topographic survey of the adjacent bank were completed in 2009. Elevation contours are shown in Figure 2. These surveys were performed to define the geometry of the zone where site groundwater discharges to the Puyallup River and assist in selecting sediment sample locations.
Nine sediment samples (SED1 through SED9) were collected from the riverbank or river bottom of the Puyallup River as part of the RI. Sediment samples locations are shown in Figure 2. Arsenic concentrations in two of the nine sediment samples (SED3 and SED5) exceeded the Sediment Management Standards (WAC Chapter 173-204) freshwater sediment cleanup screening level of 120 mg/kg. The sediment cleanup screening level is the level established for minor adverse effects to the benthic community. Arsenic concentrations in three of the nine sediment samples (SED3, SED4, and SED5) exceeded the Sediment Management Standards freshwater sediment cleanup objective of 14 mg/kg, which is the no adverse effects level for the benthic community. These three samples are located along the riverbank.
2.3 Contaminant Fate and Transport Industrial waste fill that served as the original source of arsenic at the site was removed in 1985, along with some of the impacted native soil in the contaminated source area. However, RI soil data indicates that not all of the arsenic-impacted soil in the vadose zone was removed in 1985, and this impacted soil serves as an ongoing source of groundwater contamination at the site, driven by precipitation infiltrating through this arsenic-impacted soil.
Section 2 • Conceptual Site Model
2-5
Elevated arsenic concentrations occur in soil in areas at ground surface and to depths of approximately 34 feet bgs. The base elevation vadose zone (i.e., top of the water table) varies seasonally. For purposes of this conceptual design, the base of the vadose zone in the contaminant source area during the dry season is at 20 feet MSL (approximately 12 to 14 feet bgs). Elevated arsenic concentrations in soil in the saturated zone (i.e., below elevations 20 feet MSL) extend to the north of the contaminant source area. Arsenic contamination in soil within the saturated zone is interpreted to have leached out of the overlying material, particularly the source material prior to the 1985 removal action, transported downgradient by groundwater flow, and then adsorbed to soil or precipitated out of solution. This is evidence by a “plume-like” distribution of elevated arsenic concentrations in soil hydraulically downgradient of the contaminant source area.
The fate and transport of arsenic at the Puyallup site was developed from an understanding of the environmental history of the site, data collected during the RI, arsenic geochemistry, bench-scale testing, and geochemical modeling performed using site-specific data. The results of geochemical modeling are presented in the RI (CDM Smith, 2011), while the bench-scale study results are presents in a supplemental bench-scale treatability report (CDM Smith, 2013a).
Our understanding of arsenic fate and transport at the site are summarized below:
Arsenic in the contaminated source area (P3-1, P3-2, MW2) is found predominately in the oxidized arsenate (As V) form.
Elsewhere in the plume, arsenic exists predominately in the reduced arsenite (As III) form. Over time, arsenite is predicted to oxidize to the less mobile arsenate form.
Iron and arsenic concentrations in groundwater at the site are likely controlled geochemically by ferric oxyhydroxides, the mineral scorodite, and green rust phases. This interpretation is based on electron microprobe analyses and site-specific geochemical modeling performed for the RI and supplemental bench-scale treatability study.
Redox conditions at the site are not in equilibrium with arsenic, dissolved oxygen, or total organic carbon (TOC) due to the presence of a redox gradient.
Arsenic transport in groundwater is significantly slower than the groundwater velocity, resulting in long travel times for arsenic to migrate downgradient from the contaminant source area. This is a result of adsorption of arsenic to the surfaces of iron-bearing minerals and coprecipitation with iron oxyhydroxides, which retards the transport of arsenic relative to groundwater.
Arsenic is elevated in Puyallup River sediment downgradient of the contaminant source. This indicates that dissolved arsenic is transported to the river by groundwater flow. Dissolved arsenic then precipitates onto sediment upon coming in contact with the oxygenated surface water.

Section 2• Conceptual Site Model
2-6
2.4 Leapfrog Model A three-dimensional model of the site was created using Leapfrog Works® (Leapfrog) software version 3.0.1. The Leapfrog conceptual site model (CSM) incorporated the following datasets: environmental borings, well screen intervals, depth to water data, arsenic analytical results of soil samples, topographic data, an aerial photo, historical plan view figures, and historical cross-sections.
The arsenic soil analytical data was interpolated using Leapfrog’s radial basis function (mathematically equivalent to kriging) to create iso-value surfaces of the arsenic impacted soils. These interpolated volumes were used to develop the conceptual design and will be further discussed in the following sections. The plan and section of the interpolated plume is presented on Figures 5 and 6. Please note that the Leapfrog software is limited in presenting three-dimensional plume data for two-dimensional visualization. Colors associated with the plume concentrations in Figure 5 may not directly reflect those identified in the legend due to overlying data. For the most accurate correlation between the plume colors and the legend colors, please refer to the cross-section Figure 6.

3-1
Section 3 Summary of CAP Modifications and Conceptual Design
As discussed in Section 1, the objectives of this report are to present the proposed modifications to the CAP and the resulting conceptual design for the site. A summary of proposed CAP modifications and conceptual design is presented here:
3.1 Summary of CAP Modifications The CAP, issued on April 1, 2019 (Ecology, 2019) for the Puyallup site included implementation of the cleanup objectives as follows:
1. Soil Solidification – Implement ISS of fill/soils exceeding 90 ppm by injection of a cement-bentonite-iron solidification reagent via auger mixing from 3 to 12 feet bgs (vadose soils) to treat approximately 11,460 cubic yards (cy) of soil,
2. Remediate Arsenic in the Groundwater – Treat site groundwater using in-situ application of ferrous iron and an oxidant (ISCO) via introduction trenches and injections wells.
3. Remediate Sediment in the Puyallup River – Sediment will be remediated by excavation and offsite disposal. This cleanup objective and approach is unchanged.
4. Long-term Compliance Monitoring – compliance monitoring to be conducted in accordance with the requirements of WAC 173-340-410 and will include protection, performance, and confirmational monitoring. This cleanup objective and approach is unchanged.
Based on the unfavorable results from the ISCO pilot study conducted at the Highway 99 site, CDM Smith is proposing modifications to the remedial approach for the Puyallup site to achieve the cleanup objectives. The proposed modifications include conducting ISS to greater depths to treat high arsenic concentrations in soils within the saturated zone. CDM Smith determined that targeting high arsenic concentrations in soils within the saturated zone would not only be cost effective but would also provide a much greater level of treatment in the groundwater, reducing and potentially even eliminating the need for treatment by ISCO. Section 3.2 presents the extents and volume of the proposed ISS treatment.
Groundwater monitoring after implementation of the ISS will be used to evaluate the effectiveness of the ISS on the groundwater contaminant plume. When sufficient groundwater data has been obtained to evaluate the effectiveness of the ISS, the need for implementation of ISCO or other groundwater treatment methods around the ISS treatment zone will be evaluated.

Section 3• Summary of CAP Modifications and Conceptual Design
3-2
3.2 Proposed Conceptual Design Based on the proposed modifications to the CAP, this section presents the updated conceptual design for the site remediation, which includes deepening the area for ISS to target soils highly impacted by arsenic in the saturated zone.
To develop the proposed extents and volume of ISS treatment, CDM Smith used the three dimensional “Leapfrog” model. The data input into this model included site survey, groundwater, and soil arsenic concentrations. Using this model CDM Smith evaluated various soil volumes required for ISS treatment based on different arsenic concentration limits (e.g., 90 mg/kg, 250 mg/kg, 500 mg/kg). The proposed ISS treatment area encompasses all of the impacted soils (saturated and unsaturated) with concentrations of arsenic greater than 500 mg/kg and the majority of impacted soils with concentrations greater than 250 mg/kg. The extents of the proposed ISS treatment areas are presented on Figures 7 and 8.
The proposed ISS treatment area was split up into seven sub-areas (B1-0, B1-1, B2-0, B2-1, B2-1, B2-2, B3, and B4; Figure 7) to optimize the depths and extents of treatment. Table 3-1 presents the physical data for each treatment area including volume, top and bottom of treatment zone, and treatment zone thickness. Of the 10,733 cy of the proposed ISS volume, approximately 4,966 cy is in the vadose zone and 5,767 cy is in the saturated zone. Since impacted soils are present throughout the proposed ISS areas within 5 ft bgs, it is recommended that there will not be any material excavated prior to conducting ISS.
Table 3-1 Summary of Proposed ISS Treatment Areas and Volumes
Area ID Volume (CY)
Average Ground Surface
Elevation (ft)1
Groundwater Top of Treatment Zone
Bottom of Treatment Zone Treated Area
Thickness (ft) (ft bgs) (EL.) (ft bgs) (EL.) (ft bgs) (EL.)
Site Location - Puyallup B1-0 1,977 31.6 11.4 20.2 11.6 20 25.1 6.5 13.5
B1-1 52 33 12.8 20.2 8.5 24.5 15 18 6.5
B2-0 1,876 31.6 11.4 20.2 3.3 28.3 28.6 3 25.3 B2-1 825 30.8 10.6 20.2 10.8 20 27.8 3 17
B2-2 707 31.6 11.4 20.2 3.3 28.3 15.8 15.8 12.5
B3 4,689 32.7 12.5 20.2 2.4 30.3 16.9 15.8 14.5
B4 607 38.3 17.5 20.8 10 28.3 16.8 21.5 6.8 Total 10,733 -- -- -- -- -- -- -- --
Notes: 1. Elevations referenced are based on the North American Vertical Datum of 1988 (NAVD 88).
A summary of the total volume treated in the proposed ISS treatment area for site soils exceeding 90 mg/kg, 250 mg/kg, and 500 mg/kg is presented in Table 3-2. Based on the proposed extents of ISS, approximately 99.9 percent of site soils exceeding 500 mg/kg of arsenic and 96.8 percent of site soils exceeding 250 mg/kg will be treated. It is acknowledged that the target treatment concentrations (250 mg/kg and 500 mg/kg) exceeds the site cleanup goal of 90 mg/kg. The target treatment area includes both soils within the vadose zone and saturated zone. Treatment of soil

Section 3 • Summary of CAP Modifications and Conceptual Design
3-3
in the saturated zone using ISS was not part of the CAP, but due to the high concentrations present in the saturated zone, focus for ISS was made on higher concentration soils. CDM Smith proposes to treat the highly impacted soils (>250 mg/kg) in the vadose and saturated zones with continued groundwater monitoring to monitor impacts to the site groundwater after ISS implementation. If groundwater concentrations do not improve over time the implementation of groundwater treatment or additional soil stabilization will be recommended.
Table 3-2 Summary of Impacted Soil Treatment for Arsenic Concentrations >90 mg/kg
Arsenic Exceedance Criteria (mg/kg) Impacted Soil Volume (CY) Proposed Treated Soil Volume
Volume (CY) % Treated
>90 to <250 10557 3399 32.2%
>250 to <500 3753 3634 96.8% >500 1848 1848 99.9%
Total Impacted Soil >90 16158 8881 54.9% Notes: Volume of impacted soils are interpreted based on available analytical data and 3D interpolated volumes.

This page intentionally left blank.
3-4
Section 3• Summary of CAP Modifications and Conceptual Design

4-1
Section 4 Data Gap Evaluation
One of the objectives of this document is to perform a review of the existing site data and identify outstanding data needs for implementation of the proposed conceptual design. The remedy for the Puyallup site is expected to include ISS for the target areas discussed in Section 3. The purpose of this section is to summarize the existing data, data gaps, and proposed additional data needs required to successfully implement the conceptual design. As indicated in Section 1.4, data gathering needs identified within this section may be conducted as a joint effort with the nearby Highway 99 site and will be discussed in further detail herein.
4.1 Summary of Design Data Needs Prior to the remedial design phase at the Puyallup site, specific data are required for the proposed conceptual design to further support the preparation of the Design Package. A list is presented below identifying each of the design data needs and why they are important to the overall design:
Site Survey – The site survey provides the vertical and horizontal reference datum for the project and is used in design to establish site topography, provide a reference datum for the site lithology and groundwater levels, and is used to estimate the volume of soil removal.
Existing site obstructions and utilities – Information on existing site obstructions and utilities will help to identify areas that could potentially impact the subsurface investigation and future ISS implementation. This information will be beneficial to the future contractor.
Subsurface Conditions – Characterization of the subsurface conditions includes a subsurface soil profile, physical characterization of site soils, analytical characterization of site soils and groundwater, existing groundwater elevations, and hydrogeologic profile within the remedial footprint. Physical characterization of site soils should include Standard Penetration Testing (SPT) and geotechnical index testing. The SPT will identify soil stiffness/density, which will help to assess the means and methods for conducting the ISS. Geotechnical index testing will be helpful for planning the construction sequencing and the ISS approach.
Bench Scale Study – A bench scale study should be performed in the laboratory to evaluate effectiveness of the mix design on representative soil samples from within the proposed ISS extents. Soils used in the bench scale study should be analytically and physically characterized. Physical characterization should be conducted with geotechnical index testing for moisture content, grain size, specific gravity, bulk density, and organic content. Physical and analytical characteristics of the in-situ soils and site groundwater greatly influence the effectiveness of ISS. The mix design

Section 4 • Data Gap Evaluation
4-2
generated from the bench scale study will be used to develop a full-scale pilot study and to develop aspects of the design, such as the ISS specification and future site redevelopment goals. A bench scale study will be performed for both the Puyallup and Highway 99 sites to confirm similarity in site conditions, prior to development of the pilot study.
Pilot Study – A pilot study should be performed in the field to determine if the proposed conceptual design is feasible and compatible with site conditions. Pilot studies are used to “scale up” results from the bench scale tests and to understand how implementation affects construction aspects such as auger diameter, rate of mixing, number of passes, column overlaps, etc. This is required to develop appropriate quality assurance procedures to assess compliance with project performance specifications. Depending upon the physical and analytical characterization of soils at the Highway 99 and Puyallup sites, only one pilot study may be performed if similar site conditions are confirmed from the geotechnical investigation.
4.2 Summary of Existing Data A series of investigations were conducted at the Puyallup site between 1985 and 2013. CDM Smith has reviewed the following reports to identify available subsurface information, data gaps, and evaluate if any supplemental geotechnical data are needed for this project:
1. Groundwater Monitoring Program, USG, 1985 – 2006.
2. Remedial Investigation Report, CDM Smith, June 13, 2011.
3. Bench-Scale Treatability Study, CDM Smith, April 11, 2012.
4. Supplemental Bench-Scale Treatability Study, CDM Smith, July 11, 2013.
5. Feasibility Study, CDM Smith, December 4, 2013.
6. Field Pilot Study Work Plan, CDM Smith, July 25, 2018.
7. Cleanup Action Plan, Washington State Department of Ecology Toxics Cleanup Program, Southwest Regional Office. April 1, 2019.
USG Groundwater Monitoring Program (1985-2006) USG implemented a groundwater monitoring program following completion of the 1985 source removal action to comply with the original Order. Groundwater was monitored on a monthly basis between 1985 through 2006. Six existing groundwater monitoring wells (P2-1, P2-2, P2-3, P3-1, P3-2, and P3-3) were monitored from 1985 to 2006. During the monitoring program, groundwater samples were analyzed for dissolved arsenic. Boring logs from the installation of these monitoring wells were not available for review.
Section 4 • Data Gap Evaluation
4-3
Remedial Investigation Report (CDM Smith, 2011) The RI Report presents the results of a site reconnaissance, surface and subsurface sediment and surface and groundwater testing. The site reconnaissance included identifying all site businesses currently operating, as shown in Figure 2. The surface and subsurface sediment samples were analyzed for total arsenic by field portable x-ray fluorescence (XRF) and laboratory methods. Forty five (45) surface samples were collected. Twenty six (26) soil borings were advanced to depths ranging from 16 feet to 68 feet bgs. Five (5) Subsurface soil samples were classified according to the Unified Soil Classification System (USCS). Six (6) new groundwater monitoring wells were installed: four shallow wells and two deep wells. Surface water and groundwater was analyzed for arsenic. Nine (9) sediment samples collected from Puyallup River were analyzed for total arsenic by field XRF and laboratory methods. Soil borings were installed by direct push methods and did not include the Standard Penetration Test (SPT) or collection of physical samples for geotechnical testing. The monitoring well MW7S was installed using truck mounted direct push equipment. The remaining 5 monitoring wells were installed using a Model DB320 track-mounted sonic drill rig.
Bench Scale Treatability Study (CDM Smith, 2012): CDM Smith evaluated the effectiveness of soil solidification/stabilization (S/S) using multiple reagents. The soil samples for this study were collected from soil borings using direct push methods and did not include SPT or collection of physical samples for geotechnical testing. The bench scale testing was conducted based on analytical characterization of site soils and did not include physical characterization of site soils. Of the three reagents tested, only one showed promise for further testing. CDM Smith recommended additional bench-scale studies be performed to verify the results from the one successful reagent and conduct leaching tests on untreated site soils to determine the site-specific arsenic partition coefficient.
Supplemental Bench Scale Treatability Study (CDM Smith, 2013a): The Supplemental Bench Scale Treatability Study evaluated the effectiveness of soil S/S with additional reagents, combined with a monitored natural attenuation (MNA) remedy. Soil used for this testing was collected during the original Bench Scale Treatability Study. It was determined that the best solidification mix design was a formulation consisting of 13% cement, 2% bentonite, and an iron addition five times the amount of arsenic in the soil (on a molar basis).
Feasibility Study (FS) (CDM Smith, 2013b): The FS presents remedial action objectives (RAO) to achieve cleanup of the site and provides remedial action alternatives that address all of the RAOs. Alternative 2a, as outlined in Section 1.3, was recommended.
Cleanup Action Plan (Ecology, 2019): The CAP, issued on April 1, 2019 (Ecology, 2019) for the Puyallup site presented the preferred alternative (Remedial Action Alternative 2a) and included the components discussed in Section 1.3. As part of the implementation plan, the CAP required bench scale and pilot study testing for ISCO.
Section 4 • Data Gap Evaluation
4-4
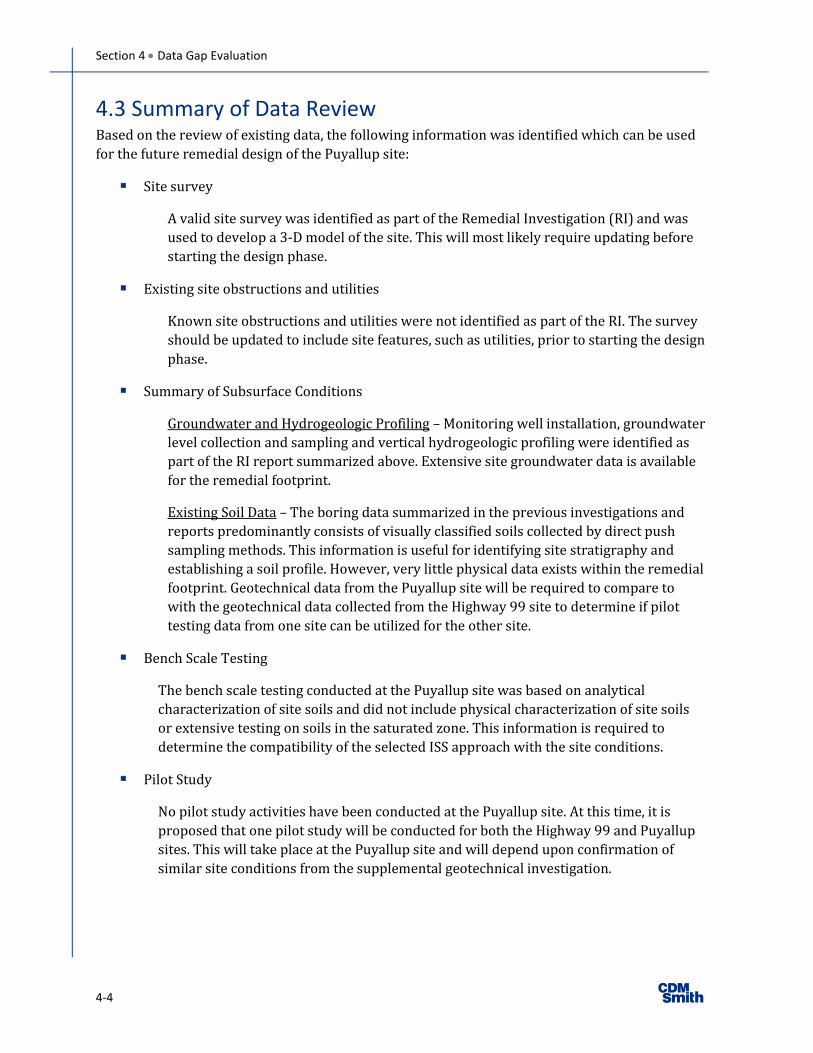
4.3 Summary of Data Review Based on the review of existing data, the following information was identified which can be used for the future remedial design of the Puyallup site:
Site survey
A valid site survey was identified as part of the Remedial Investigation (RI) and was used to develop a 3-D model of the site. This will most likely require updating before starting the design phase.
Existing site obstructions and utilities
Known site obstructions and utilities were not identified as part of the RI. The survey should be updated to include site features, such as utilities, prior to starting the design phase.
Summary of Subsurface Conditions
Groundwater and Hydrogeologic Profiling – Monitoring well installation, groundwater level collection and sampling and vertical hydrogeologic profiling were identified as part of the RI report summarized above. Extensive site groundwater data is available for the remedial footprint.
Existing Soil Data – The boring data summarized in the previous investigations and reports predominantly consists of visually classified soils collected by direct push sampling methods. This information is useful for identifying site stratigraphy and establishing a soil profile. However, very little physical data exists within the remedial footprint. Geotechnical data from the Puyallup site will be required to compare to with the geotechnical data collected from the Highway 99 site to determine if pilot testing data from one site can be utilized for the other site.
Bench Scale Testing
The bench scale testing conducted at the Puyallup site was based on analytical characterization of site soils and did not include physical characterization of site soils or extensive testing on soils in the saturated zone. This information is required to determine the compatibility of the selected ISS approach with the site conditions.
Pilot Study
No pilot study activities have been conducted at the Puyallup site. At this time, it is proposed that one pilot study will be conducted for both the Highway 99 and Puyallup sites. This will take place at the Puyallup site and will depend upon confirmation of similar site conditions from the supplemental geotechnical investigation.

Section 4 • Data Gap Evaluation
4-5
4.4 Pre-Design Geotechnical Data Needs for Puyallup As discussed above, additional geotechnical data will need to be collected prior to implementation of the proposed conceptual design for ISS. Table 4-1 presents a summary of pre-remedial design data needs. Data needs are presented for each element of the proposed conceptual design.
Table 4-1: Puyallup Preliminary Remedial Design Elements and Data Needs for ISS
Data Need
Why is this needed? Known Obstruction/Utility Identification Existing Obstructions/Utilities need to be identified to confirm the
feasibility of the proposed ISS implementation method.
Standard Penetration Testing The SPT will identify soil stiffness/density, which will help to assess the means and methods of ISS and provide physical characterization before the bench scale study.
Physical Soil Classification by conducting Geotechnical Index Testing
Geotechnical index testing will be required for proper design of the bench scale testing and for future planning of ISS implementation methodology.
Bench Scale Testing Testing needs to be conducted based on physical and analytical site soil characterization and using site groundwater to determine the trial mix design. This mix design will be scaled up to use for the future pilot study.
Pilot Study A pilot study needs to be conducted to evaluate feasibility and compatibility with the site for the selected remedy. This will be conducted at the Puyallup site after confirmation of similar site conditions at Highway 99 and Puyallup.
4.5 Proposed Geotechnical Investigation and Data Gathering A work plan will be developed to perform a geotechnical investigation, ISS bench scale study, and ISS pilot study. Work plans will be developed for both the Highway 99 and Puyallup sites concurrently and two separate work plans will be prepared; one for the field investigation/ bench scale testing and a second for the pilot study. Pending confirmation of similarity in site conditions between the Highway 99 and Puyallup facilities, only one pilot study will be conducted, which will occur at the Puyallup site.
The geotechnical investigation will consist of test borings with continuous sampling using SPT procedures (ASTM D1586) to a specified termination depth that extends a minimum of 10-feet below the proposed depth of ISS treatment. Soil samples collected for geotechnical characterization will be screened by XRF to measure arsenic concentrations. In addition to the test borings, one to two test pits may be conducted to evaluate potential subsurface obstructions and gather bulk sample material. The bulk soil samples and site groundwater will be collected as part of the geotechnical investigation for the ISS bench scale study. Geotechnical laboratory

Section 4 • Data Gap Evaluation
4-6
testing will be conducted to establish the index engineering properties, which will include, but not be limited to:
Unified Soil Classification System (USCS), Visual Soil Classification (ASTM 2488);
Grain Size Analysis with Hydrometer (ASTM D6913);
Organic Content (ASTM 2974);
Atterberg Limits (ASTM 4318);
Moisture Content (ASTM D2216);
Specific Gravity (ASTM D854); and
Bulk Density (ASTM D7263)
The physical data collected as part of the geotechnical investigation will be used to complete the bench scale studies and develop the work plan for the pilot testing. As indicated above, bench scale studies will be performed for both the Highway 99 and Puyallup sites and, pending confirmation of similar site conditions, only one pilot study will be conducted at the Puyallup site.

5-1
Section 5 Conceptual Schedule
Based on the data needs identified in Section 4, the project schedule has been modified to include the proposed geotechnical field investigation and subsequent design tasks. The schedule includes the allowances for joint efforts between the Highway 99 and Puyallup sites. The modified project schedule is presented as Figure 9. The major milestones and schedule assumptions are summarized in the following subsections.
5.1 Conceptual Design Report Two separate conceptual design reports will be prepared for both Highway 99 and the Puyallup sites. The conceptual reports for each site will be submitted to Ecology for review and approval prior to completion of the data gap field investigation work plans. The date for the anticipated completion of the conceptual design report task for the Puyallup site is presented below:
Puyallup Conceptual Design Puyallup Report April 3, 2020
5.2 Data Gap Field Investigation The data gap field investigation will include development of the work plan, completion of the field investigation, and completion of the data gap analysis. One work plan will be developed to satisfy the data needs for both the Highway 99 and Puyallup sites and that the field investigations at both sites will be conducted within the same subcontractor mobilization. The work plan will include the scope of work for the field investigation and bench scale studies at each site. The date for the anticipated completion of the joint data gap field investigation task is presented below:
Data Gap Field Investigation August 24, 2020
5.3 Bench Scale Study The bench scale study will include the execution of the bench scale study and development of a memorandum. The bench scale study will take place between June 29 and July 31 following the field investigation. The date for the anticipated completion of the bench scale study task for the Puyallup site is presented below: Bench Scale Study August 24, 2020
5.4 Pilot Study The pilot study will include development of the pilot study work plan, contractor procurement, pilot study implementation, and reporting. Only one pilot study will be conducted and will occur at the Puyallup site. This will be dependent upon completion of the data gap field investigation and bench scale studies to confirm similarity in site conditions. The date for the anticipated completion of the pilot study task is presented below:
Pilot Study February 4, 2021

Section 5 • Conceptual Design Schedule
5-2
5.5 Design and Construction The design and construction task will include development of the engineering design report, permit acquisition, contractor procurement, remedy implementation, and certification. This will be two separate tasks for the Highway 99 and Puyallup sites with one mobilization by the contractor. The date for the anticipated completion of the design and construction task for the Puyallup site is presented below:
Design and Construction November 26, 2021

6-1
Section 6 References
CDM Smith Inc. 2018. Field Pilot Study Work Plan, USG Interiors Highway 99 Site, 7110 Pacific Highway East, Milton, Washington, 98354. July 25, 2018.
CDM Smith Inc. 2013a. Supplemental Bench-Scale Treatability Testing, USG Interiors Site, Puyallup, Washington. July 11, 2013.
CDM Smith Inc. 2013b. Feasibility Study, USG Interiors Puyallup Site, Puyallup, Washington, December 4, 2013.
CDM Smith Inc. 2012. Bench-Scale Treatability Study, USG Interiors Puyallup Site, 925 River Road, Puyallup, WA. April 11, 2012.
CDM Smith Inc. 2011. Remedial Investigation Report, USG Interiors Puyallup Site, Puyallup, Washington. June 13, 2011.
Hazen. 1911. Discussion – Dams on sand foundations. Transactions, American Society of Civil Engineers, v. 73, p. 199.
U.S. Geological Survey (USGS). 2008. Streamflow Measurements Reported by the U.S. Geological Survey for Gauge Station Maintained by the City of Puyallup (gauge station #12101500) based on data collected between 1937 and 2008.
Washington Department of Ecology (Ecology). 2019. Final Cleanup Action Plan, USG Interiors Puyallup Site, Puyallup, Washington. Issued by Washington State Department of Ecology Toxics Cleanup Program, Southwest Regional Office, Olympia, Washington. April 1, 2019.

This page intentionally left blank.
Section 6 • References
6-2

7-1
Distribution
1 Hard Copy USG Corporation 1 Electronic Copy 500 West Adams Street, Department 176
Chicago, Illinois 60661-3676
Attention: Ms. Jennifer Brennan
2 Hard Copies Washington Department of Ecology 1 Electronic Copy Toxics Cleanup Program
Post Office Box 47775 Olympia, Washington 98504-47775
Attention: Mr. Mohsen Kourehdar
Quality Assurance Review by:
________________________________________ Jagrut Jathal Principal Geotechnical Engineer

Distribution
7-2
This page intentionally left blank for double sided printing.

F-1
Figures

F-1

VICINITY MAPUSG Interiors, Inc. - Puyallup Site
Puyallup, WA
FIGURENO. 1

Discount RV
SITE PLANUSG Interiors, Inc. - Puyallup Site
Puyallup, WA
FIGURENO. 2
CORE REMEDIATION AREA LOCATEDWITHIN FENCE LINE OF DISCOUNT RVPROPERTY
Discount RV
GEOLOGIC CROSS SECTION A - A'USG Interiors, Inc. - Puyallup Site
Puyallup, WA
FIGURENO. 3
CORE REMEDIATION AREA LOCATEDWITHIN FENCE LINE OF DISCOUNT RVPROPERTY

Discount RV
Groundwater Elevation ContoursUSG Interiors, Inc. - Puyallup Site
Puyallup, WA
FIGURENO. 4
CORE REMEDIATION AREA LOCATEDWITHIN FENCE LINE OF DISCOUNT RVPROPERTY
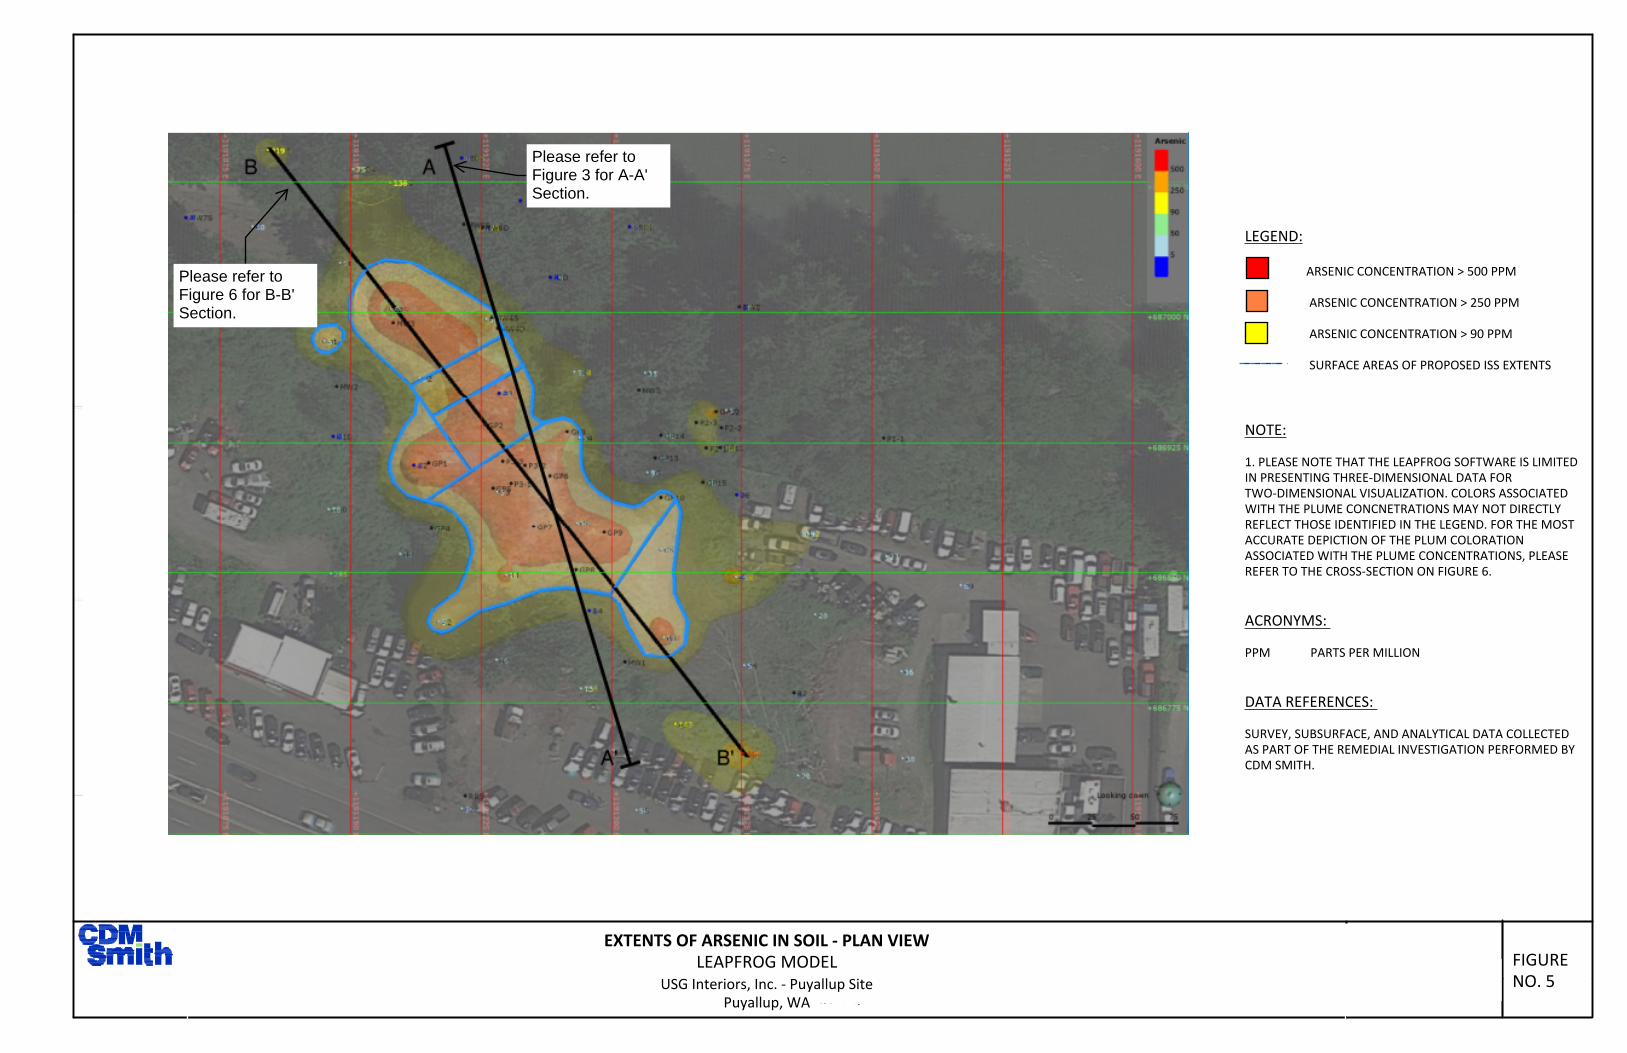
FIGURE-2.DWG
GRPH and PCE - Plan Vi
USG Interiors Inc./ Highway 99
Seattle, WA
FIGURENO. 5
LEGEND:
ARSENIC CONCENTRATION > 500 PPM
ARSENIC CONCENTRATION > 250 PPM
ARSENIC CONCENTRATION > 90 PPM SURFACE AREAS OF PROPOSED ISS EXTENTS
NOTE:
1. PLEASE NOTE THAT THE LEAPFROG SOFTWARE IS LIMITEDIN PRESENTING THREE-DIMENSIONAL DATA FORTWO-DIMENSIONAL VISUALIZATION. COLORS ASSOCIATEDWITH THE PLUME CONCNETRATIONS MAY NOT DIRECTLYREFLECT THOSE IDENTIFIED IN THE LEGEND. FOR THE MOSTACCURATE DEPICTION OF THE PLUM COLORATIONASSOCIATED WITH THE PLUME CONCENTRATIONS, PLEASEREFER TO THE CROSS-SECTION ON FIGURE 6.
ACRONYMS:
PPM PARTS PER MILLION
DATA REFERENCES:
SURVEY, SUBSURFACE, AND ANALYTICAL DATA COLLECTEDAS PART OF THE REMEDIAL INVESTIGATION PERFORMED BYCDM SMITH.
Please refer toFigure 6 for B-B'Section.
Please refer toFigure 3 for A-A'Section.
EXTENTS OF ARSENIC IN SOIL - PLAN VIEWLEAPFROG MODEL
USG Interiors, Inc. - Puyallup SitePuyallup, WA

FIGURE-2.DWG
GRPH and PCE - Plan Vi
USG Interiors Inc./ Highway 99
Seattle, WA
DATE: MARCH 2020
FIGURENO. 6
LEGEND:
ARSENIC CONCENTRATION > 500 PPM
ARSENIC CONCENTRATION > 250 PPM
ARSENIC CONCENTRATION > 90 PPM
ACRONYMS:
PPM PARTS PER MILLION
DATA REFERENCES:
SURVEY, SUBSURFACE, AND ANALYTICAL DATA COLLECTEDAS PART OF THE REMEDIAL INVESTIGATION PERFORMED BYCDM SMITH.
B B'
EXTENTS OF ARSENIC IN SOIL - CROSS-SECTION B-B'LEAPFROG MODEL
USG Interiors, Inc. - Puyallup SitePuyallup, WA
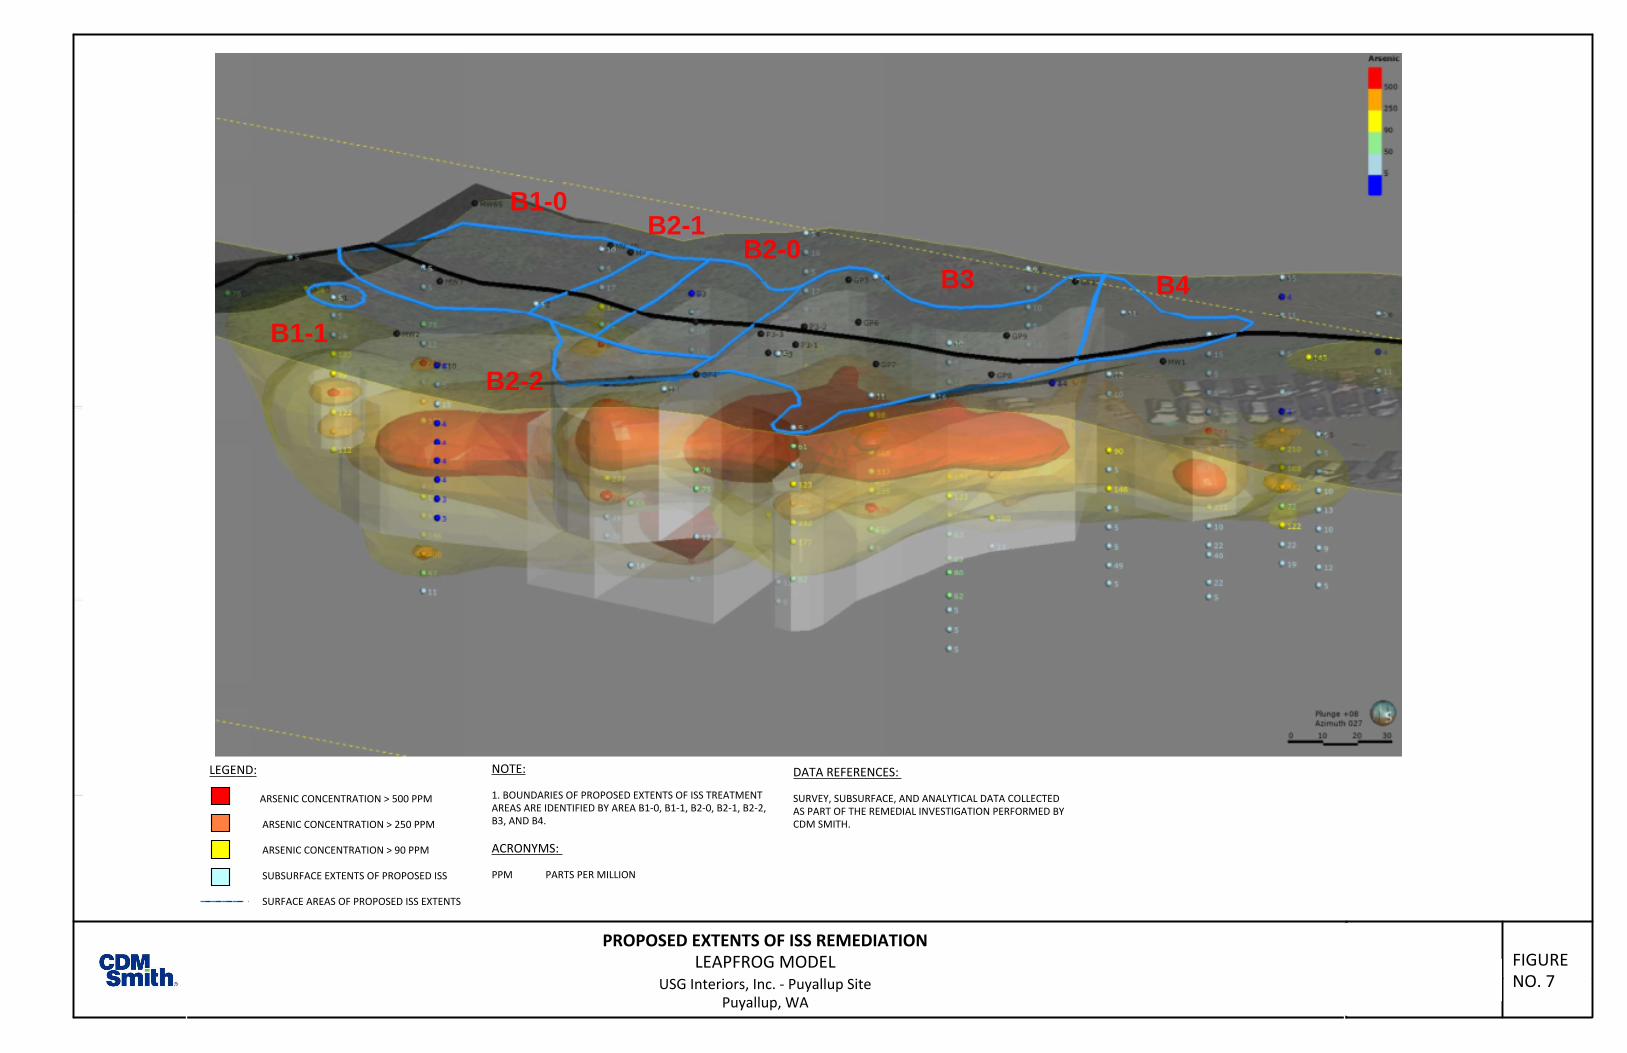
FIGURE-2.DWG
GRPH and PCE - Plan Vi
USG Interiors Inc./ Highway 99
Seattle, WA
DATE: MARCH 2020
FIGURENO. 7
LEGEND:
ARSENIC CONCENTRATION > 500 PPM
ARSENIC CONCENTRATION > 250 PPM
ARSENIC CONCENTRATION > 90 PPM
SUBSURFACE EXTENTS OF PROPOSED ISS
SURFACE AREAS OF PROPOSED ISS EXTENTS
DATA REFERENCES:
SURVEY, SUBSURFACE, AND ANALYTICAL DATA COLLECTEDAS PART OF THE REMEDIAL INVESTIGATION PERFORMED BYCDM SMITH.
B3 B4
B1-0
B1-1
B2-1B2-0
B2-2
NOTE:
1. BOUNDARIES OF PROPOSED EXTENTS OF ISS TREATMENTAREAS ARE IDENTIFIED BY AREA B1-0, B1-1, B2-0, B2-1, B2-2,B3, AND B4.
ACRONYMS:
PPM PARTS PER MILLION
PROPOSED EXTENTS OF ISS REMEDIATIONLEAPFROG MODEL
USG Interiors, Inc. - Puyallup SitePuyallup, WA

FIGURE-2.DWG
GRPH and PCE - Plan Vi
USG Interiors Inc./ Highway 99
Seattle, WA
Feet
Fee
t
B B'
FIGURENO. 8
LEGEND:
ARSENIC CONCENTRATION > 500 PPM
ARSENIC CONCENTRATION > 250 PPM
ARSENIC CONCENTRATION > 90 PPM
BOUNDARY LINE FOR PROPOSED ISS TREATMENT AREAS
NOTE:
1. BOUNDARIES OF PROPOSED EXTENTS OF ISS TREATMENTAREAS ARE IDENTIFIED BY AREAS B1-0, B1-1, B2-0, B2-1,B2-2, B3, AND B4.
ACRONYMS:
PPM PARTS PER MILLION
DATA REFERENCES:
SURVEY, SUBSURFACE, AND ANALYTICAL DATA COLLECTEDAS PART OF THE REMEDIAL INVESTIGATION PERFORMED BYCDM SMITH.
PROPOSED EXTENTS OF ISS REMEDIATION - CROSS-SECTION B-B'LEAPFROG MODEL
USG Interiors, Inc. - Puyallup SitePuyallup, WA

Task Name Duration Start Finish
Access Agreements - HWY 99 190 days Mon 9/2/19 Fri 5/22/20
Obtain Access Agreements from the County and
adjacent property owners
190 days Mon 9/2/19 Fri 5/22/20
Access Agreements Recorded 0 days Fri 5/22/20 Fri 5/22/20
Access Agreements - Puyallup 190 days Mon 9/2/19 Fri 5/22/20
Obtain Access Agreements from the County and
adjacent property owners
190 days Mon 9/2/19 Fri 5/22/20
Access Agreements Recorded 0 days Fri 5/22/20 Fri 5/22/20
Conceptual Design - HWY 99 205 days Mon 6/3/19 Sat 3/14/20
Conceptual Design Development for ISS 181 days Mon 6/3/19 Mon 2/10/20
Ecology Review 24 days Tue 2/11/20 Fri 3/13/20
Ecology Approval of Conceptual Design 0 days Sat 3/14/20 Sat 3/14/20
Conceptual Design - Puyallup 219 days Mon 6/3/19 Fri 4/3/20
Conceptual Design Development for ISS 195 days Mon 6/3/19 Fri 2/28/20
Ecology Review 24 days Mon 3/2/20 Thu 4/2/20
Ecology Approval of Conceptual Design 0 days Fri 4/3/20 Fri 4/3/20
Data Gaps Field Investigation - Joint 167 days Thu 1/2/20 Mon 8/24/20
Develop Work Plan for Field Investigation 52 days Thu 1/2/20 Fri 3/13/20
Ecology Review 21 days Mon 3/16/20 Mon 4/13/20
Ecology Approval of Work Plan 1 day Mon 4/13/20 Mon 4/13/20
Land Clearing 14 days Tue 4/14/20 Fri 5/1/20
Field Investigation 15 days Mon 6/15/20 Fri 7/3/20
Data Gap Analysis 35 days Mon 7/6/20 Fri 8/21/20
Submit Data Gap Analysis to Ecology 0 days Mon 8/24/20 Mon 8/24/20
Pilot Study - Joint 234 days Fri 3/13/20 Thu 2/4/21
Pilot Study Work Plan and Develop RFP for Pilot Study 110 days Fri 3/13/20 Thu 8/13/20
Contractor Procurement for Pilot Study 57 days Thu 6/4/20 Fri 8/21/20
Implement Pilot Study 54 days Mon 8/24/20 Thu 11/5/20
Report of Pilot Study Findings 30 days Fri 11/6/20 Thu 12/17/20
Submit Pilot Study Findings to Ecology 0 days Fri 12/18/20 Fri 12/18/20
Ecology Review 34 days Fri 12/18/20 Wed 2/3/21
Ecology Response 0 days Thu 2/4/21 Thu 2/4/21
Design and Construction - HWY 99 185 days Mon 12/21/20Fri 9/3/21
Engineering Design Report (drawings/specs) 65 days Mon 12/21/20Fri 3/19/21
Ecology Review 21 days Mon 3/22/21 Mon 4/19/21
Ecology Approval 0 days Tue 4/20/21 Tue 4/20/21
Contractor Procurement 28 days Tue 4/20/21 Thu 5/27/21
Establish Contract with Contractor 0 days Fri 5/28/21 Fri 5/28/21
Permitting 116 days Mon 12/21/20Mon 5/31/21
Land Clearing 9 days Tue 6/1/21 Fri 6/11/21
5/22
5/22
3/14
4/3
8/24
12/18
2/4
4/20
5/28
May Jun Jul Aug Sep Oct Nov Dec Jan Feb Mar Apr May Jun Jul Aug Sep Oct Nov Dec Jan Feb Mar Apr May Jun Jul Aug Sep Oct Nov Dec Jan
Qtr 2, 2019 Qtr 3, 2019 Qtr 4, 2019 Qtr 1, 2020 Qtr 2, 2020 Qtr 3, 2020 Qtr 4, 2020 Qtr 1, 2021 Qtr 2, 2021 Qtr 3, 2021 Qtr 4, 2021 Qtr 1, 2022
Summary Task Milestone
Page 1
Project: USG HWY 99 - Puyallup Joint Conceptual Schedule
Date: Fri 2/7/20

Task Name Duration Start Finish
ISS Construction 60 days Mon 6/14/21 Fri 9/3/21
Construction Complete 0 days Fri 9/3/21 Fri 9/3/21
Design and Construction - Puyallup 245 days Mon 12/21/20Fri 11/26/21
Engineering Design Report (drawings/specs) 65 days Mon 12/21/20Fri 3/19/21
Ecology Review 21 days Mon 3/22/21 Mon 4/19/21
Ecology Approval 0 days Tue 4/20/21 Tue 4/20/21
Contractor Procurement 28 days Tue 4/20/21 Thu 5/27/21
Establish Contract with Contractor 0 days Fri 5/28/21 Fri 5/28/21
Permitting 116 days Mon 12/21/20Mon 5/31/21
Land Clearing 10 days Mon 8/23/21 Fri 9/3/21
ISS Construction 60 days Mon 9/6/21 Fri 11/26/21
Construction Complete 0 days Fri 11/26/21 Fri 11/26/21
9/3
4/20
5/28
11/26
May Jun Jul Aug Sep Oct Nov Dec Jan Feb Mar Apr May Jun Jul Aug Sep Oct Nov Dec Jan Feb Mar Apr May Jun Jul Aug Sep Oct Nov Dec Jan
Qtr 2, 2019 Qtr 3, 2019 Qtr 4, 2019 Qtr 1, 2020 Qtr 2, 2020 Qtr 3, 2020 Qtr 4, 2020 Qtr 1, 2021 Qtr 2, 2021 Qtr 3, 2021 Qtr 4, 2021 Qtr 1, 2022
Summary Task Milestone
Page 2
Project: USG HWY 99 - Puyallup Joint Conceptual Schedule
Date: Fri 2/7/20
