concentrations and size distributions of bacteria
TRANSCRIPT
City University of New York (CUNY) City University of New York (CUNY)
CUNY Academic Works CUNY Academic Works
Publications and Research City College of New York
2017
Concentrations and Size Distributions of Bacteria-Containing Concentrations and Size Distributions of Bacteria-Containing
Particles over Oceans from China to the Arctic Ocean Particles over Oceans from China to the Arctic Ocean
Ming Li University of Science and Technology of China
Xiawei Yu University of Science and Technology of China
Hui Kang University of Science and Technology of China
Zhouqing Xie University of Science and Technology of China
Pengfei Zhang CUNY City College
How does access to this work benefit you? Let us know!
More information about this work at: https://academicworks.cuny.edu/cc_pubs/433
Discover additional works at: https://academicworks.cuny.edu
This work is made publicly available by the City University of New York (CUNY). Contact: [email protected]
atmosphere
Article
Concentrations and Size Distributions ofBacteria-Containing Particles over Oceans fromChina to the Arctic Ocean
Ming Li 1,2, Xiawei Yu 1, Hui Kang 1, Zhouqing Xie 1,* and Pengfei Zhang 3
1 Anhui Province Key Laboratory of Polar Environment and Global Change, School of Earth and SpaceSciences, University of Science and Technology of China, Hefei 230026, China; [email protected] (M.L.);[email protected] (X.Y.); [email protected] (H.K.)
2 State Key Laboratory of Loess and Quaternary Geology, Institute of Earth Environment,Chinese Academy of Sciences, Xi’an 710075, China
3 Department of Earth and Atmospheric Sciences, City College of New York, New York, NY 10031, USA;[email protected]
* Correspondence: [email protected]; Tel./Fax: +86-551-6360-1415
Academic Editors: Józef S. Pastuszka, Ewa Bragoszewska and Anna MainkaReceived: 15 February 2017; Accepted: 24 April 2017; Published: 2 May 2017
Abstract: During the third China Arctic Research Expedition (July–September 2008), size-resolvedmeasurements of bacteria-containing particles (BCPs) in the marine boundary layer (MBL) air wereconducted during a cruise through the East China Sea, the Yellow Sea, the Japan Sea, the OkhotskSea, the Bering Sea, the Chukchi Sea, and the Arctic Ocean. The concentrations of total airborne BCPs(TBCPs), non-salt tolerant airborne BCPs (NSBCPs), and salt tolerant airborne BCPs (SBCPs) variedfrom 29 to 955 CFU m−3 (CFU = Colony Forming Unit), 16 to 919 CFU m−3, and 4 to 276 CFU m−3,with an average value of 275, 182, and 92 CFU m−3, respectively. Although the SBCP concentrationswere less than the NSBCP concentrations when averaged over all measurements, there are severalcases where the reverse is true (e.g., in the high Arctic Ocean). During the cruise, the TBCP sizeswere dominated by the diameter >4.7 µm fraction (accounted for 46.3% on average), while the finefraction (diameter <2.1 µm) accounted for 27.8%. For NSBCPs and SBCPs, the coarse fraction alsowas the dominant fraction over most regions. The influence of local meteorological conditions onthe abundance, size distributions, and species of airborne bacteria is discussed. Notably, in theatmosphere over the Arctic Ocean the abundance of airborne bacteria was apparently related to thedistribution of sea ice. As cultivation based methodologies may underestimate the environmentalbacterial communities, it is expected that the abundance of bacteria in the ambient air would behigher than that observed in this study. In order to distinguish different species of bacteria, molecularbiological techniques (e.g., 16S rDNA analysis) are required for identification in future investigations.
Keywords: airborne bacteria; abundance; size distribution; marine boundary layer; the Arctic Ocean;sea ice
1. Introduction
Airborne bacteria are ubiquitous and play an important role in public health [1,2]. Moreover,airborne bacteria may potentially influence the formation of clouds and precipitation by serving asbiogenic nuclei of water droplets and ice crystals [2–5]. At present, however, the concentrations andsize distributions of airborne bacteria in different regions of the Earth are not well characterized [2].Most studies on the concentrations of airborne bacteria have been carried out in continental areas, witha handful in coastal regions [6–11]. There are only a few studies measuring bacterial concentrations inmarine air, and even fewer over polar waters [12,13].
Atmosphere 2017, 8, 82; doi:10.3390/atmos8050082 www.mdpi.com/journal/atmosphere
Atmosphere 2017, 8, 82 2 of 13
In recent decades, several studies [8,14] have been carried out to characterize the abundanceof airborne bacteria at continental sites of various landscape types (mostly in short measurementcampaigns of up to a few weeks in duration). For example, mean spring concentrations in aerosolswere found to be 1.1 × 10⁴ CFU m−3 (CFU = Colony Forming Unit) [7] and 1.6 × 10⁴ CFU m−3 [15] atrural sites in Austria and England, respectively. Lighthart and Shaffer [16] reported a mean cultivablebacteria concentration of 609 CFU m−3 at a forest site. In some urban sites, the concentrations ofairborne bacteria ranged from 0 to 7220 CFU m−3 [17,18].
Background concentrations of airborne bacteria in clean continental air observed at Mt. Rex,Austria were about 1.1 × 10⁴ CFU m−3 [7]. However, the concentrations of atmospheric bacteriaof some coastal regions were lower than the concentrations over land atmosphere. For example,concentrations of atmospheric bacteria collected from marine air arriving at a coastal, cliff-top site inBarbados were about 2–3 orders of magnitude lower than those over land [19]. Concentrations of totalbioaerosols ranged from 8.5 × 10⁴ to 1.7 × 10⁵ cells m−3 in the Qingdao coastal region [10] and from580 to 778 CFU m−3in an embayment adjacent to the East River in western Long Island Sound [11].Bacterial concentrations in the marine atmosphere are even lower, e.g., a few to ~100 CFU m−3 overthe open Baltic Sea [20].
As to the sources of bacteria in marine air, it has been suggested that bacteria and other primarybiological particles can be released into the atmosphere from the sea-surface micro-layer (SML) bythe bursting of bubbles in breaking waves, a process that occurs both during wave-breaking at thecoasts, and in whitecaps on wind-driven waves in the open ocean [3,21]. Bacterial concentrationsin sea spray aerosols can be significantly enriched relative to concentrations in the SML, which inturn are enriched relative to concentrations in the bulk water. Such enrichment has been observedboth in laboratory-generated aerosols [3] and in marine aerosols relative to underlying waters [22].Some studies have shown indirect evidence that some bacteria collected in marine air may originatefrom a marine source, for instance by demonstrating genetic similarity between some strains ofmarine bacteria and airborne bacteria [23–25]. In addition, atmospheric turbulence can lead to thetransmission of biological aerosols between different regions [26,27], so airborne bacteria over oceansmay be derived from other sources and carried to the environment through long-range transportprocesses. Burrows et al. [2,28] simulated large-scale atmospheric transport of 1µm particles emittedfrom different ecosystems including coastal, deserts, forests, urban, seas, grasslands, and so on.The results demonstrated that bacteria from other ecosystems could also contribute significantly to theconcentrations of bacteria over oceans.
The measurement of airborne bacterial concentrations is in general conducted in two steps: aerosolcollection in the field and analysis in the laboratory. Filtration and impaction are the two most widelyused collection methods, which are followed by cultivation techniques or epi-fluorescence microscopyto determine the concentrations of bacteria-containing particles [2].
During the third China Arctic Research Expedition (July–September 2008), bacteria-containingparticles (BCPs) were investigated using a six-stage air sampler with cultivation. The cruise pathcovered many regions including the Eastern China Sea, the Yellow Sea, the Japan Sea, the Okhotsk Sea,the Bering Sea, and the Arctic Ocean (38◦36′ N to 85◦25′ N). The project provides an opportunity tounderstand the sources and changes in concentrations of airborne BCPs in the marine boundary layerfrom low to high latitudes. Here we report the abundance and size distributions of BCPs measuredduring the expedition. The potential impacts of meteorological variables on the spatial distribution ofairborne bacteria are also discussed.
2. Experimental Methods
2.1. Sampling Data
Samples were collected in the marine boundary layer along a cruise path from Shanghai, Chinato the Arctic Ocean during the third China Arctic Research Expedition (11 July–24 September 2008).

Atmosphere 2017, 8, 82 3 of 13
The sampling details are given in Table 1. The procedure for sample collection and bacteria cultivationwas based on the method described by a previous report [10]. Briefly, the bioaerosol samples werecollected using a six-stage cultivable microorganism FA-1 multi-orifice cascade impactor (AppliedTechnical Institute of Liaoyang, Liaoyang, China) with a flow rate of 28.3 L min−1. No cyclone inletwas installed, thus total suspended particles were collected and separated according to their individualsizes on the different stages of the sampler. The particle sizes were fractionated into six size ranges:>7.0 µm (stage 1), 4.7–7.0 µm (stage 2), 3.3–4.7 µm (stage 3), 2.1–3.3 µm (stage 4), 1.1–2.1 µm (stage 5),0.65–1.1 µm (stage 6). Two samplers with a 50-cm Teflon inlet each were installed on the front deck ofthe ship 0.5 m away from each other and about 30 m above sea level to avoid ship contamination. Thecultivable microorganism samples were collected on 9.0-cmPetri dishes containing an agar medium.The collection duration for each sample ranged from 10 min to 20 min (Table 1). Two groups of sampleswere collected at each of the 20 sites. As the sampler has six stages, the total number of samples ineach group was 120. To control the collection process in both sampling devices blanks were takenroutinely at every site. Agar plates were mounted into the sampler and removed directly withoutturning the pump on. Blanks were made and treated as the real samples. Since the FA-1 cascadeimpactor collects the airborne particles, the individual colonies formed on the culture medium maybe formed by the presence of multiple bacteria contained in the particle, so in this study we use thenumber of bacteria-containing particles instead of cultivable bacteria.
2.2. Bacterial Cultivation
As soon as the sample was collected on the culture medium, it was immediately carried to thelaboratory on the ship and cultivated. As in the previous research [10], two different kinds of agarwere used for the cultivation of bacteria: beef extract-peptone medium (3 g beef extract, 10 g peptone,5 g NaCl, 16 g agar, 1 L distilled H2O, pH 7.2–7.6) and 2216E medium (5 g peptone, 1 g yeast extract,0.1 g FePO4, 15 g agar, 400 mL distilled H2O, and 600 mL aging seawater, pH 7.2–7.6). Both agarshad 50 mg/L cycloheximide to suppress fungal growth. In addition, 2216E medium yielded 3.2%NaCl to reflect the salty environment in oceans [29–31]. The difference between these two mediais that the bacteria cultured on the 2216E medium are more resistant to salt, as the 2216E mediumis usually used to culture marine bacteria [10,32]. The 2216E medium was used here because themarine atmosphere may contain more salt-tolerant bacteria. Here, the bacteria incubated on thebeef extract-peptone medium are named non-salt tolerant airborne BCPs (NSBCPs), and the bacteriacultivate on the 2216E medium are named salt tolerant airborne BCPs (SBCPs). The incubation timefor both media was 48 h and was chosen in a way that the bacterial colonies could grow large enoughto be visible. The incubation temperature, however, was different between the two media. The NSBCPsamples were incubated at 37 ◦C, as suggested by the literature, whereas the SBCP samples wereincubated at RT (Room Temperature, approximately 28 ◦C) [10]. As the room had air conditioning, thetemperature did not vary much during the cruise.
2.3. Ancillary Data
The meteorological data were recorded simultaneously, including information on the temperature,relative humidity, atmospheric pressure, wind direction, and wind speed. Ice data were obtainedfrom the NASA (National Aeronautics and Space Administration) Earth Observations website (https://neo.sci.gsfc.nasa.gov/view.php?datasetId=NISE_D).
Atmosphere 2017, 8, 82 4 of 13
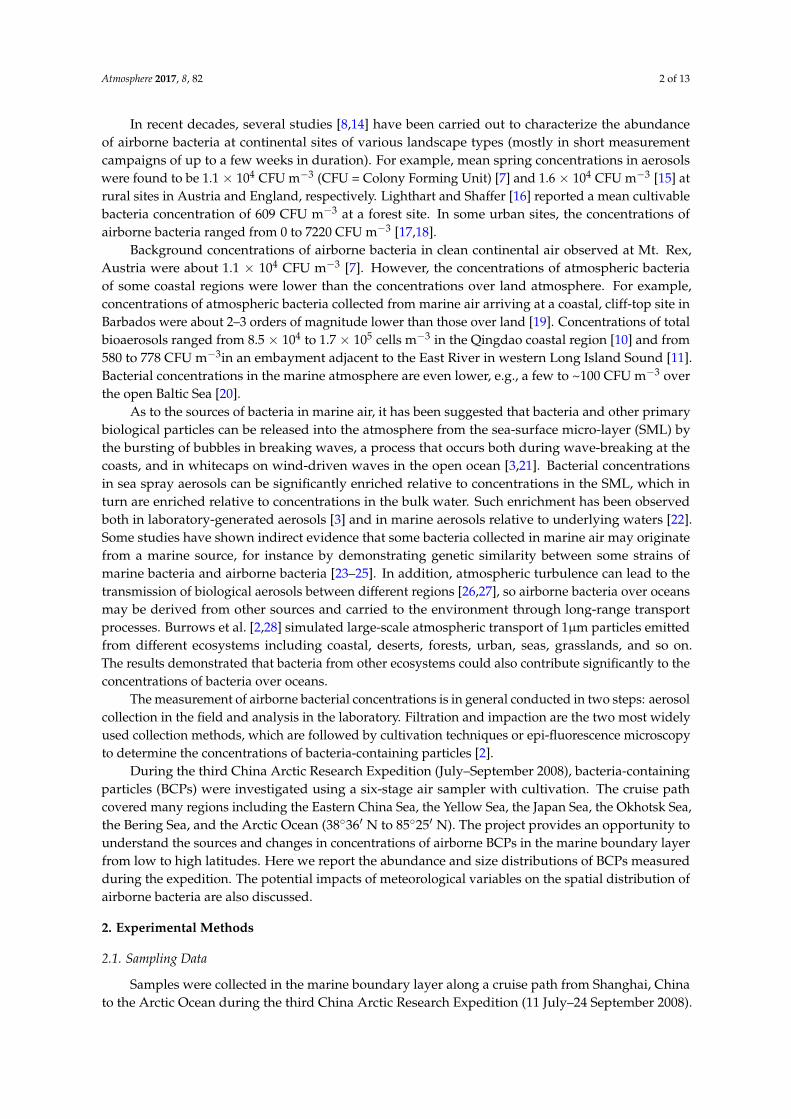
Table 1. Sampling location, date, and meteorological conditions during the third China Arctic Research Expedition, 2008.
Site Date UTC Time Sampling Duration (min) Coordinate Location Wind Speed (m/s) Wind Direction (◦) RH (%) T (◦C)
1 14 July 1:40 10 133◦ E 38◦ N East China Sea 13 36 89 22.72 17 July 23:30 10 139◦ E 45◦ N Sea of Japan 11.3 66 99 17.53 22 July 22:30 15 161◦ E 51◦ N North Pacific Ocean 4 195 99 11.24 25 July 22:30 15 179◦ E 59◦ N North Pacific Ocean 14 282 90 75 31 July 1:00 15 169◦ W 62◦ N Bering Sea 15.1 131 86 5.56 2 August 23:00 15 165◦ W 64◦ N Bering Sea 5.6 237 100 1.27 5 August 21:30 18 168◦ W 72◦ N Chukchi Sea 7.8 128 99 08 8 August 21:30 18 157◦ W 73◦ N Chukchi Sea 3.3 245 94 3.59 11 August 21:30 20 152◦ W 75◦ N Arctic Ocean 10.1 7 89 0.2
10 14 August 21:30 20 147◦ W 76◦ N Beaufort Sea 18.4 298 100 0.811 17 August 21:30 20 147◦ W 81◦ N Arctic Ocean 9 329 92 0.212 21 August 22:00 20 144◦ W 84◦ N Arctic Ocean 1 176 99 0.613 26 August 22:00 20 147◦ W 85◦ N Arctic Ocean 14.4 28 98 −0.514 27 August 22:40 20 102◦ W 85◦ N Arctic Ocean 11.6 125 100 −1.715 31 August 21:40 20 148◦ W 84◦ N Arctic Ocean 0.9 203 100 −3.616 2 September 21:40 20 170◦ W 80◦ N Arctic Ocean 2 47 100 −4.717 6 September 21:50 20 169◦ W 73◦ N Chukchi Sea 15.5 131 97 1.718 9 September 22:10 20 165◦ W 64◦ N Bering Sea 6.3 47 63 1519 12 September 22:00 20 170◦ E 59◦ N North Pacific Ocean 9.9 216 91 12.520 15 September 23:10 20 151◦ E 44◦ N Sea of Okhotsk 4 222 92 12.8
UTC: Coordinated Universal Time; RH: Relative humidity.

Atmosphere 2017, 8, 82 5 of 13
3. Results and Discussion
3.1. Concentrations of Bacteria-Containing Particles
The atmospheric concentrations of bacteria-containing particles (BCPs) can be calculated from thecolony counts and the total volume of air sampled. The concentrations of BCPs for each sampling siteare shown in Figure 1. All controls were negative.
Atmosphere 2017, 8, 82 5 of 12
3. Results and Discussion
3.1. Concentrations of Bacteria-Containing Particles
The atmospheric concentrations of bacteria-containing particles (BCPs) can be calculated from the colony counts and the total volume of air sampled. The concentrations of BCPs for each sampling site are shown in Figure 1. All controls were negative.
During the entire sampling period, the total BCP (TBCP) concentrations (including all six stages, non-salt tolerance and salt tolerance) ranged from 29 CFU m−3 (site 7) to 955 CFU m−3 (site 1), with an average concentration of 275 CFU m−3 and coefficient of variation of 76.7%. Most of the high TBCP concentrations were found near coast areas (e.g., site 1, 2, 4, 18). The concentrations of NSBCPs of all six stages ranged from 16 CFU m−3 (site 7) to 919 CFU m−3 (site 1), with a mean of 182 CFU m−3 and coefficient of variation of 112.0%. Many of the high concentrations were found in the coast regions, e.g., site 1 (919 CFU m−3, 133° E 38° N), site 4 (445 CFU m−3, 179° E 59° N) and site 18 (346 CFU m−3, 165° W 64° N), but some high concentrations were also observed in the Arctic Ocean (site 9, 10, and 15). The large number of NSBCPs in the marine boundary layer may be influenced by the continental bacteria. As latitude increases, the concentrations of NSBCPs decreased (R = −0.473, p < 0.05). The concentrations of SBCPs varied considerably, ranging from 4 CFU m−3 (site 5, 165° W 64° N) to 276 CFU m−3 (site 15, 148° W 84° N) with an average value of 92 CFU m−3 and coefficient of variation of 80.3%. Although the SBCP concentration on average was lower than that of NSBCPs (92 vs. 182 CFU m−3), the former could be occasionally higher than the latter, e.g., in the high Arctic Ocean. This was consistent with earlier observations [33,34]and model predictions [2] that bacteria are abundant in marine air in this region, where continental outflow contributes significantly to the atmospheric aerosols.
Figure 1. Bacterial concentrations along the cruise path for the R/V Xuelong during the third China Arctic Research Expedition. The concentrations of airborne non-salt tolerant bacteria-containing particles (NSBCPs) and airborne salt tolerant bacteria-containing particles (SBCPs) are shown by red and blue columns, respectively (unit: CFU m−3). The blue shaded area represents sea ice.
Figure 1. Bacterial concentrations along the cruise path for the R/V Xuelong during the third ChinaArctic Research Expedition. The concentrations of airborne non-salt tolerant bacteria-containingparticles (NSBCPs) and airborne salt tolerant bacteria-containing particles (SBCPs) are shown by redand blue columns, respectively (unit: CFU m−3). The blue shaded area represents sea ice.
During the entire sampling period, the total BCP (TBCP) concentrations (including all six stages,non-salt tolerance and salt tolerance) ranged from 29 CFU m−3 (site 7) to 955 CFU m−3 (site 1), with anaverage concentration of 275 CFU m−3 and coefficient of variation of 76.7%. Most of the high TBCPconcentrations were found near coast areas (e.g., site 1, 2, 4, 18). The concentrations of NSBCPs ofall six stages ranged from 16 CFU m−3 (site 7) to 919 CFU m−3 (site 1), with a mean of 182 CFU m−3
and coefficient of variation of 112.0%. Many of the high concentrations were found in the coastregions, e.g., site 1 (919 CFU m−3, 133◦ E 38◦ N), site 4 (445 CFU m−3, 179◦ E 59◦ N) and site 18(346 CFU m−3, 165◦ W 64◦ N), but some high concentrations were also observed in the Arctic Ocean(site 9, 10, and 15). The large number of NSBCPs in the marine boundary layer may be influenced bythe continental bacteria. As latitude increases, the concentrations of NSBCPs decreased (R = −0.473,p < 0.05). The concentrations of SBCPs varied considerably, ranging from 4 CFU m−3 (site 5, 165◦ W64◦ N) to 276 CFU m−3 (site 15, 148◦ W 84◦ N) with an average value of 92 CFU m−3 and coefficientof variation of 80.3%. Although the SBCP concentration on average was lower than that of NSBCPs(92 vs. 182 CFU m−3), the former could be occasionally higher than the latter, e.g., in the high ArcticOcean. This was consistent with earlier observations [33,34] and model predictions [2] that bacteria
Atmosphere 2017, 8, 82 6 of 13
are abundant in marine air in this region, where continental outflow contributes significantly to theatmospheric aerosols.
Sampling locations were separated into three geographic groups for further analysis: Group I: theEast China Sea, the Japan Sea, and the Northwest Pacific (sites 1–4, 19, 20); Group II: the Bering Sea andthe Chukchi Sea (sites 5–8, 17, 18); Group III: the western Arctic Ocean (sites 9–16). Geographically, theconcentrations of TBCPs ranged from 89 to 955 CFU m−3 with an average of 401± 317 CFU m−3, 29–412with an average of 177 ± 132 CFU m−3, and 104–478 CFU m−3 with an average of 253 ± 117 CFU m−3
in Group I, Group II, and Group III, respectively. The average concentrations of NSBCPs varied from298 CFU m−3 in Group I (coefficient of variation 112.6%), 133 CFU m−3 in Group III (coefficient ofvariation 86.1%), to 133 CFU m−3 in Group II (coefficient of variation 63.3%). The spatial distribution ofSBCPs appeared to differ from that of NSBCPs: observed concentrations of SBCPs were 103 CFU m−3
in Group I (coefficient of variation 66.4%), 44 CFU m−3 in Group II (coefficient of variation 95.3%), and120 CFU m−3 in Group III (coefficient of variation 71.1%). In the Group I area, the ratios of NSBCPsand SBCPs to TBCPs were 61% and 39%, respectively. In Group II and Group III areas, NSBCPs andSBCPs accounted for 72% and 28%, and 51% and 49% of TBCPs, respectively. The results showed thatthere are more salt tolerant bacteria in the Arctic Ocean.
3.2. Size Distributions
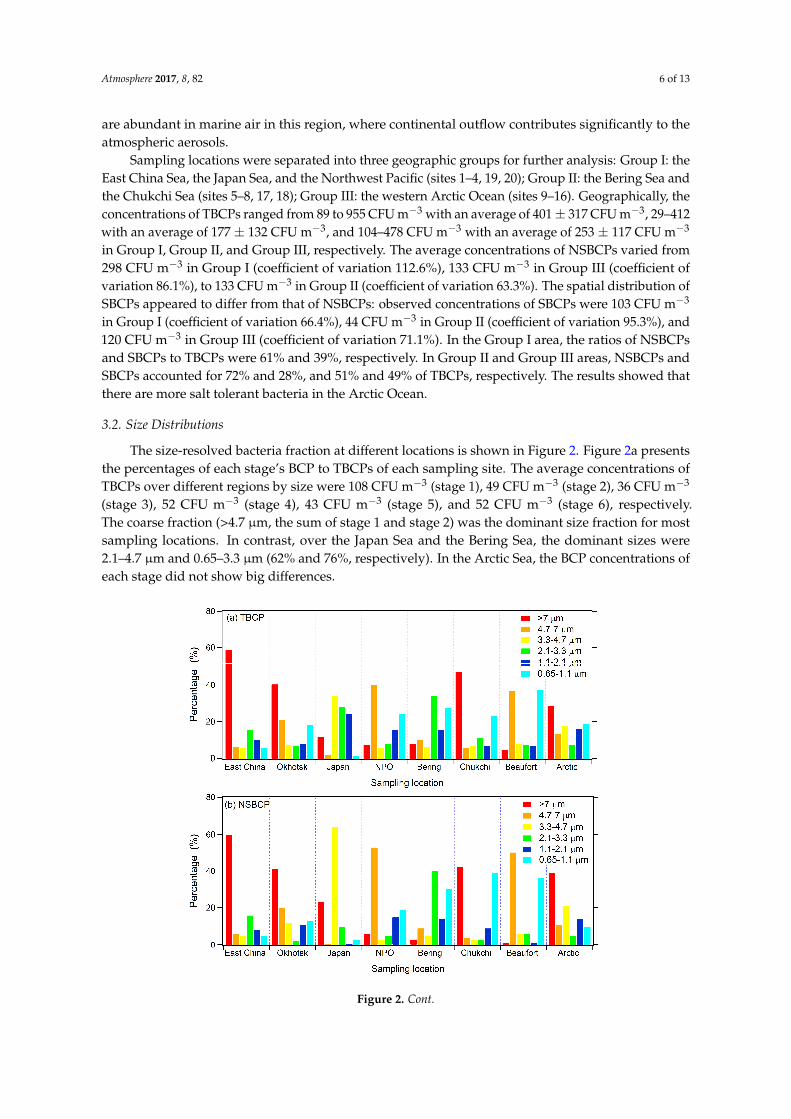
The size-resolved bacteria fraction at different locations is shown in Figure 2. Figure 2a presentsthe percentages of each stage’s BCP to TBCPs of each sampling site. The average concentrations ofTBCPs over different regions by size were 108 CFU m−3 (stage 1), 49 CFU m−3 (stage 2), 36 CFU m−3
(stage 3), 52 CFU m−3 (stage 4), 43 CFU m−3 (stage 5), and 52 CFU m−3 (stage 6), respectively.The coarse fraction (>4.7 µm, the sum of stage 1 and stage 2) was the dominant size fraction for mostsampling locations. In contrast, over the Japan Sea and the Bering Sea, the dominant sizes were2.1–4.7 µm and 0.65–3.3 µm (62% and 76%, respectively). In the Arctic Sea, the BCP concentrations ofeach stage did not show big differences.
Atmosphere 2017, 8, 82 6 of 12
Sampling locations were separated into three geographic groups for further analysis: Group I: the East China Sea, the Japan Sea, and the Northwest Pacific (sites 1–4, 19, 20); Group II: the Bering Sea and the Chukchi Sea (sites 5–8, 17, 18); Group III: the western Arctic Ocean (sites 9–16). Geographically, the concentrations of TBCPs ranged from 89 to 955 CFU m−3 with an average of 401 ± 317 CFU m−3, 29–412 with an average of 177 ± 132 CFU m−3, and 104–478 CFU m−3 with an average of 253 ± 117 CFU m−3 in Group I, Group II, and Group III, respectively. The average concentrations of NSBCPs varied from 298 CFU m−3 in Group I (coefficient of variation 112.6%), 133 CFU m−3 in Group III (coefficient of variation 86.1%), to 133 CFU m−3 in Group II (coefficient of variation 63.3%). The spatial distribution of SBCPs appeared to differ from that of NSBCPs: observed concentrations of SBCPs were 103 CFU m−3 in Group I (coefficient of variation 66.4%), 44 CFU m−3 in Group II (coefficient of variation 95.3%), and 120 CFU m−3 in Group III (coefficient of variation 71.1%). In the Group I area, the ratios of NSBCPs and SBCPs to TBCPs were 61% and 39%, respectively. In Group II and Group III areas, NSBCPs and SBCPs accounted for 72% and 28%, and 51% and 49% of TBCPs, respectively. The results showed that there are more salt tolerant bacteria in the Arctic Ocean.
3.2. Size Distributions
The size-resolved bacteria fraction at different locations is shown in Figure 2. Figure 2a presents the percentages of each stage’s BCP to TBCPs of each sampling site. The average concentrations of TBCPs over different regions by size were 108 CFU m−3 (stage 1), 49 CFU m−3 (stage 2), 36 CFU m−3 (stage 3), 52 CFU m−3 (stage 4), 43 CFU m−3 (stage 5), and 52 CFU m−3 (stage 6), respectively. The coarse fraction (>4.7 μm, the sum of stage 1 and stage 2) was the dominant size fraction for most sampling locations. In contrast, over the Japan Sea and the Bering Sea, the dominant sizes were 2.1–4.7 μm and 0.65–3.3 μm (62% and 76%, respectively). In the Arctic Sea, the BCP concentrations of each stage did not show big differences.
Figure 2. Cont.
Atmosphere 2017, 8, 82 7 of 13Atmosphere 2017, 8, 82 7 of 12
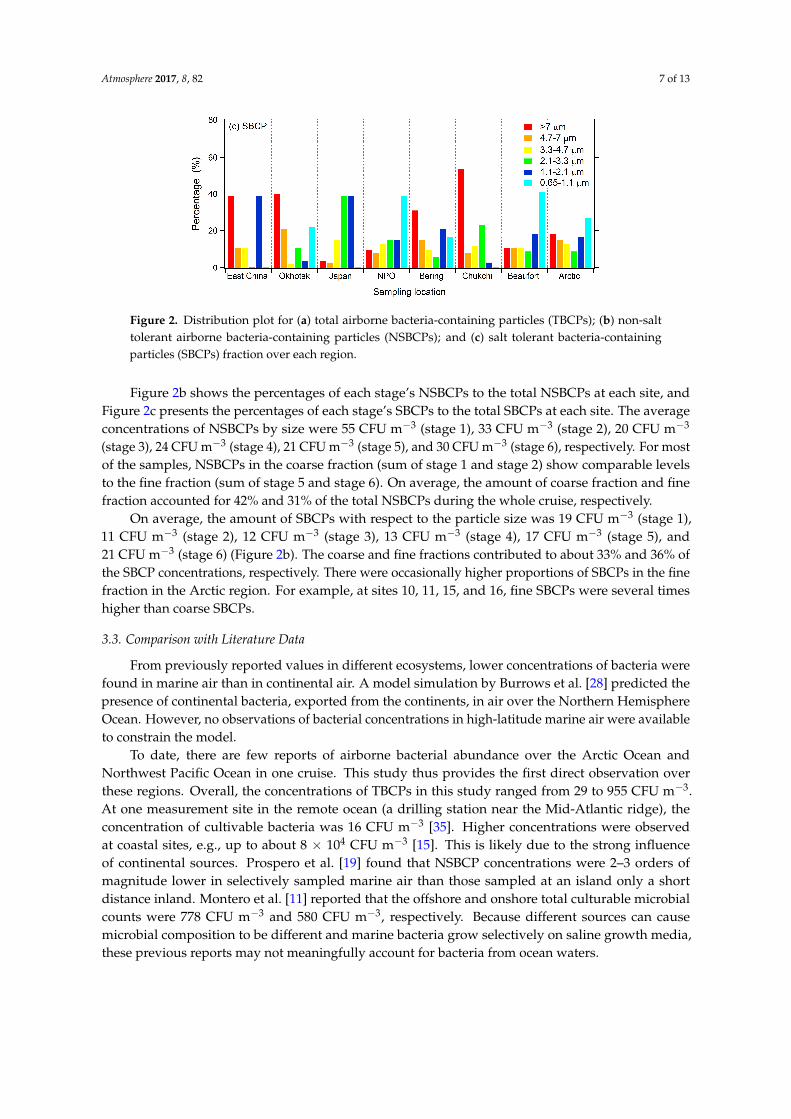
Figure 2.Distribution plot for (a) total airborne bacteria-containing particles (TBCPs); (b) non-salt tolerant airborne bacteria-containing particles (NSBCPs); and (c) salt tolerant bacteria-containing particles (SBCPs) fraction over each region.
Figure 2b shows the percentages of each stage’s NSBCPs to the total NSBCPs at each site, and Figure 2c presents the percentages of each stage’s SBCPs to the total SBCPs at each site. The average concentrations of NSBCPs by size were 55 CFU m−3 (stage 1), 33 CFU m−3 (stage 2), 20 CFU m−3 (stage 3), 24 CFU m−3 (stage 4), 21 CFU m−3 (stage 5), and 30 CFU m−3 (stage 6), respectively. For most of the samples, NSBCPs in the coarse fraction (sum of stage 1 and stage 2) show comparable levels to the fine fraction (sum of stage 5 and stage 6). On average, the amount of coarse fraction and fine fraction accounted for 42% and 31% of the total NSBCPs during the whole cruise, respectively.
On average, the amount of SBCPs with respect to the particle size was 19 CFU m−3 (stage 1), 11 CFU m−3 (stage 2), 12 CFU m−3 (stage 3), 13 CFU m−3 (stage 4), 17 CFU m−3 (stage 5), and 21 CFU m−3 (stage 6) (Figure 2b). The coarse and fine fractions contributed to about 33% and 36% of the SBCP concentrations, respectively. There were occasionally higher proportions of SBCPs in the fine fraction in the Arctic region. For example, at sites 10, 11, 15, and 16, fine SBCPs were several times higher than coarse SBCPs.
3.3. Comparison with Literature Data
From previously reported values in different ecosystems, lower concentrations of bacteria were found in marine air than in continental air. A model simulation by Burrows et al. [28] predicted the presence of continental bacteria, exported from the continents, in air over the Northern Hemisphere Ocean. However, no observations of bacterial concentrations in high-latitude marine air were available to constrain the model.
To date, there are few reports of airborne bacterial abundance over the Arctic Ocean and Northwest Pacific Ocean in one cruise. This study thus provides the first direct observation over these regions. Overall, the concentrations of TBCPs in this study ranged from 29 to 955 CFU m−3. At one measurement site in the remote ocean (a drilling station near the Mid-Atlantic ridge), the concentration of cultivable bacteria was 16 CFU m−3 [35]. Higher concentrations were observed at coastal sites, e.g., up to about 8 × 10⁴ CFU m−3 [15]. This is likely due to the strong influence of continental sources. Prospero et al. [19] found that NSBCP concentrations were 2–3 orders of magnitude lower in selectively sampled marine air than those sampled at an island only a short distance inland. Montero et al. [11] reported that the offshore and onshore total culturable microbial counts were 778 CFU m−3 and 580 CFU m−3, respectively. Because different sources can cause microbial composition to be different and marine bacteria grow selectively on saline growth media, these previous reports may not meaningfully account for bacteria from ocean waters.
Figure 2. Distribution plot for (a) total airborne bacteria-containing particles (TBCPs); (b) non-salttolerant airborne bacteria-containing particles (NSBCPs); and (c) salt tolerant bacteria-containingparticles (SBCPs) fraction over each region.
Figure 2b shows the percentages of each stage’s NSBCPs to the total NSBCPs at each site, andFigure 2c presents the percentages of each stage’s SBCPs to the total SBCPs at each site. The averageconcentrations of NSBCPs by size were 55 CFU m−3 (stage 1), 33 CFU m−3 (stage 2), 20 CFU m−3
(stage 3), 24 CFU m−3 (stage 4), 21 CFU m−3 (stage 5), and 30 CFU m−3 (stage 6), respectively. For mostof the samples, NSBCPs in the coarse fraction (sum of stage 1 and stage 2) show comparable levelsto the fine fraction (sum of stage 5 and stage 6). On average, the amount of coarse fraction and finefraction accounted for 42% and 31% of the total NSBCPs during the whole cruise, respectively.
On average, the amount of SBCPs with respect to the particle size was 19 CFU m−3 (stage 1),11 CFU m−3 (stage 2), 12 CFU m−3 (stage 3), 13 CFU m−3 (stage 4), 17 CFU m−3 (stage 5), and21 CFU m−3 (stage 6) (Figure 2b). The coarse and fine fractions contributed to about 33% and 36% ofthe SBCP concentrations, respectively. There were occasionally higher proportions of SBCPs in the finefraction in the Arctic region. For example, at sites 10, 11, 15, and 16, fine SBCPs were several timeshigher than coarse SBCPs.
3.3. Comparison with Literature Data
From previously reported values in different ecosystems, lower concentrations of bacteria werefound in marine air than in continental air. A model simulation by Burrows et al. [28] predicted thepresence of continental bacteria, exported from the continents, in air over the Northern HemisphereOcean. However, no observations of bacterial concentrations in high-latitude marine air were availableto constrain the model.
To date, there are few reports of airborne bacterial abundance over the Arctic Ocean andNorthwest Pacific Ocean in one cruise. This study thus provides the first direct observation overthese regions. Overall, the concentrations of TBCPs in this study ranged from 29 to 955 CFU m−3.At one measurement site in the remote ocean (a drilling station near the Mid-Atlantic ridge), theconcentration of cultivable bacteria was 16 CFU m−3 [35]. Higher concentrations were observedat coastal sites, e.g., up to about 8 × 10⁴ CFU m−3 [15]. This is likely due to the strong influenceof continental sources. Prospero et al. [19] found that NSBCP concentrations were 2–3 orders ofmagnitude lower in selectively sampled marine air than those sampled at an island only a shortdistance inland. Montero et al. [11] reported that the offshore and onshore total culturable microbialcounts were 778 CFU m−3 and 580 CFU m−3, respectively. Because different sources can causemicrobial composition to be different and marine bacteria grow selectively on saline growth media,these previous reports may not meaningfully account for bacteria from ocean waters.
Atmosphere 2017, 8, 82 8 of 13
3.4. Potential Meteorological Factors Influencing the Variation of Concentrations of Airborne Bacteria
3.4.1. Temperature
Some previous studies have observed a correlation between ambient air temperature andthe concentrations of continental cultivable airborne bacteria [36]. Likewise, in observations overthe Northwestern Pacific Ocean, airborne microorganism concentrations were also found to becorrelated with air temperature [37]. Temperature directly affects the rate of bacterial metabolismand reproduction, as well as cultivability [2]. Temperature is also correlated with a number of otherimportant meteorological and climatological variables that may affect bacterial concentrations in air,such as boundary layer turbulence, time of day, and season. In this study, the sampling cruise coveredthe regions from Shanghai through the mid-latitudes to the Arctic Ocean, and the temperature rangedfrom 22.7 ◦C to −4.7 ◦C. The average temperature of Group I, Group II, and Group III was 13.95 ◦C,4.48 ◦C, and −1.09 ◦C, respectively. As latitude increases, the temperature decreases (R = −0.95,p < 0.01). The abundance of TBCPs was significantly correlated with ambient air temperature at thetime of sampling (R = 0.516, p < 0.05). The correlation was even stronger for the subset of six samplescollected over the Group II area (Chukchi Sea and Bering Sea, R = 0.878, p < 0.05). Over this region,the temperature ranged from 0 to 5.5 ◦C during the sampling period. The same correlation withtemperature was also found for NSBCPs during the whole cruise (R = 0.564, p < 0.01) and over theGroup II area (R = 0.980, p < 0.01). There was no correlation found between SBCP concentrationsand temperature.
3.4.2. Relative Humidity and Precipitation
Although some studies have shown positive correlations between relative humidity (RH) andambient bacterial concentrations [38], this study found negative correlations between TBCPs and RHas well as NSBCPs with RH over the Group II area (Table 2). No correlation was found between SBCPconcentrations and RH.
Table 2. Correlation of bacteria-containing particles (BCPs) with wind speed (WS), relative humidity(RH), and temperature (T).
SpeciesWhole Cruise Group I Group II Group III
WS RH T WS RH T WS RH T WS RH T
TBCP
PearsonCorrelation 296 −291 516 * −063 −171 −365 101 −858 * 878 * 028 236 −242
Sig. (2-tailed) 205 214 020 906 746 477 848 029 022 947 574 563N 20 20 20 6 6 6 6 6 6 8 8 8
NSBCP
PearsonCorrelation 312 −414 564 ** 112 −322 −212 006 −965 ** 976 ** 216 −240 −099
Sig. (2-tailed) 180 069 010 832 534 686 991 002 001 607 568 816N 20 20 20 6 6 6 6 6 6 8 8 8
SBCP
PearsonCorrelation −019 316 −087 −180 −653 −660 302 −083 115 −174 559 −234
Sig. (2-tailed) 937 175 714 732 160 153 561 875 829 680 150 577N 20 20 20 6 6 6 6 6 6 8 8 8
** Correlation is significant at the 0.01 level (2-tailed); * Correlation is significant at the 0.05 level (2-tailed).TBCP:total airborne bacteria-containing particles; NSBCP: non-salt tolerant airborne bacteria-containing particles; SBCP:salt tolerant airborne bacteria-containing particles.
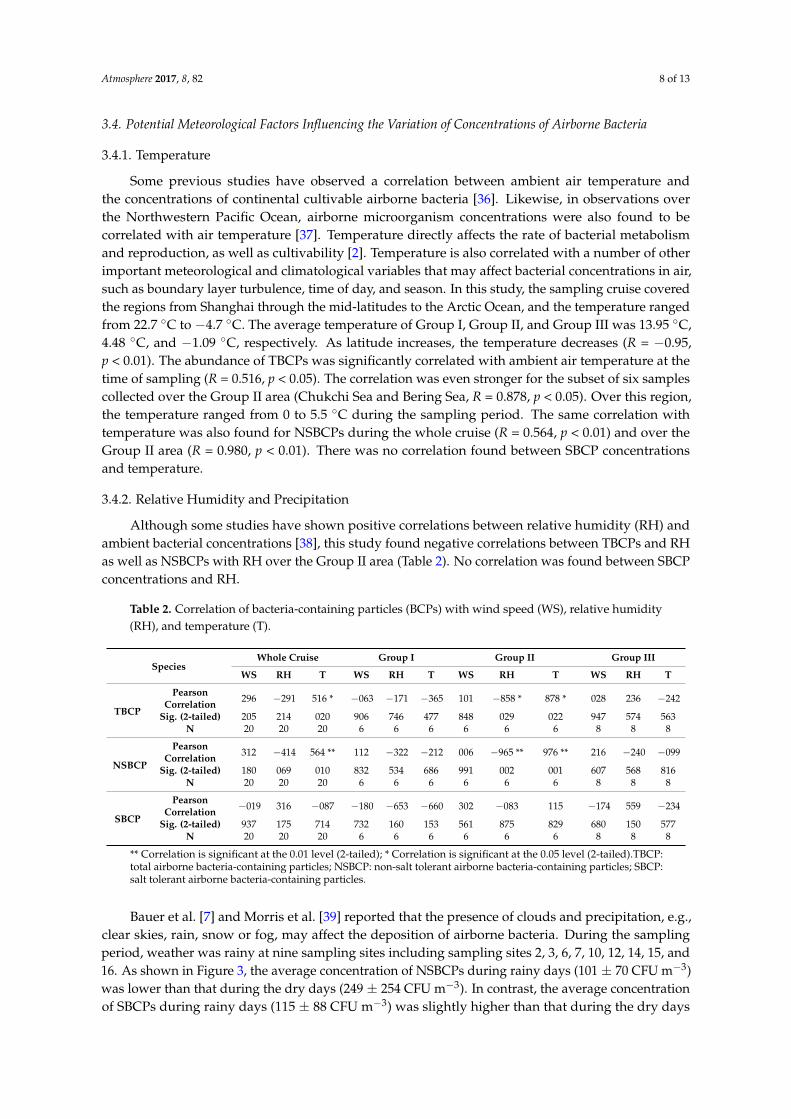
Bauer et al. [7] and Morris et al. [39] reported that the presence of clouds and precipitation, e.g.,clear skies, rain, snow or fog, may affect the deposition of airborne bacteria. During the samplingperiod, weather was rainy at nine sampling sites including sampling sites 2, 3, 6, 7, 10, 12, 14, 15, and16. As shown in Figure 3, the average concentration of NSBCPs during rainy days (101 ± 70 CFU m−3)was lower than that during the dry days (249 ± 254 CFU m−3). In contrast, the average concentrationof SBCPs during rainy days (115 ± 88 CFU m−3) was slightly higher than that during the dry days
Atmosphere 2017, 8, 82 9 of 13
(73 ± 58 CFU m−3), albeit the difference is not statistically different. It might be that some airbornebacteria deposit as cloud condensation nucleus by rain in rainy days, and the precipitation caused thesplashing of more sea water, bringing the bacteria into the atmosphere. As such, the concentration ofNSBCPs looks higher in rainy days more than in dry days but there is no difference for SBCPs.
Atmosphere 2017, 8, 82 9 of 12
16. As shown in Figure 3, the average concentration of NSBCPs during rainy days (101 ± 70 CFU m−3) was lower than that during the dry days (249 ± 254 CFU m−3). In contrast, the average concentration of SBCPs during rainy days (115 ± 88 CFU m−3) was slightly higher than that during the dry days (73 ± 58 CFU m−3), albeit the difference is not statistically different. It might be that some airborne bacteria deposit as cloud condensation nucleus by rain in rainy days, and the precipitation caused the splashing of more sea water, bringing the bacteria into the atmosphere. As such, the concentration of NSBCPs looks higher in rainy days more than in dry days but there is no difference for SBCPs.
Figure 3. The concentration of NSBCPs and SBCPs during rainy days and dry days.
3.4.3. Wind Speed
Many previous studies have found relationships between the concentrations of airborne cultivable or microscopically observed bacteria and wind speed [40–43]. While particle sources from the surface are typically stronger under windier conditions, stronger winds are also associated with greater boundary-layer turbulence and dilution, leading to a reduction in boundary-layer concentrations. For these reasons, we measured wind speed (Table 1) concurrently with particle sampling, however, no relationship between wind speed and bacteria concentrations was found in the data collected in this study (as shown Table 2).
3.5. The Role of Sea Ice in the Arctic Ocean
Bacteria have been found to live and metabolize in sea ice and snow [44]. At the South Pole, Carpenter et al. [45] found a population of about 200 to 5000 cells per mL of melted surface snow. Elevated concentrations of SBCPs were observed in the Arctic Ocean in the presence of seasonal ice. During the sampling time, ice concentrations ranged from 0 to 20% and 0 to 91% over Group II and Group III, respectively. In the Bering Sea and the Chukchi Sea where average sea ice concentration was 3.3% during the cruise (almost open water during the cruise), the average concentrations of TBCPs, SBCPs, and NSBCPs were 176, 44, and 133 CFU m−3, respectively. In the area of 75° N to 85° N, the so-called “floating sea ice region” covered by seasonal ice [46] with an average ice concentration of 57.4% during the cruise, the average TBCP, SBCP, and NSBCP concentrations of the Arctic Ocean were 253, 120, and 133 CFU m−3, respectively. The result showed that the concentrations of TBCPs and SBCPs over the floating sea ice region were higher than those found over the open sea areas. Moreover, there is a positive correlation between ice concentration and SBCPs (R = 0.612, p < 0.05),indicating a potential relationship between the presence of seasonal sea ice and the source of SBCPs[47]. In contrast, the NSBCPs showed no difference between these two areas.
Figure 3. The concentration of NSBCPs and SBCPs during rainy days and dry days.
3.4.3. Wind Speed
Many previous studies have found relationships between the concentrations of airborne cultivableor microscopically observed bacteria and wind speed [40–43]. While particle sources from the surfaceare typically stronger under windier conditions, stronger winds are also associated with greaterboundary-layer turbulence and dilution, leading to a reduction in boundary-layer concentrations.For these reasons, we measured wind speed (Table 1) concurrently with particle sampling, however,no relationship between wind speed and bacteria concentrations was found in the data collected inthis study (as shown Table 2).
3.5. The Role of Sea Ice in the Arctic Ocean
Bacteria have been found to live and metabolize in sea ice and snow [44]. At the South Pole,Carpenter et al. [45] found a population of about 200 to 5000 cells per mL of melted surface snow.Elevated concentrations of SBCPs were observed in the Arctic Ocean in the presence of seasonal ice.During the sampling time, ice concentrations ranged from 0 to 20% and 0 to 91% over Group II andGroup III, respectively. In the Bering Sea and the Chukchi Sea where average sea ice concentration was3.3% during the cruise (almost open water during the cruise), the average concentrations of TBCPs,SBCPs, and NSBCPs were 176, 44, and 133 CFU m−3, respectively. In the area of 75◦ N to 85◦ N, theso-called “floating sea ice region” covered by seasonal ice [46] with an average ice concentration of57.4% during the cruise, the average TBCP, SBCP, and NSBCP concentrations of the Arctic Ocean were253, 120, and 133 CFU m−3, respectively. The result showed that the concentrations of TBCPs andSBCPs over the floating sea ice region were higher than those found over the open sea areas. Moreover,there is a positive correlation between ice concentration and SBCPs (R = 0.612, p < 0.05),indicating apotential relationship between the presence of seasonal sea ice and the source of SBCPs [47]. In contrast,the NSBCPs showed no difference between these two areas.

Atmosphere 2017, 8, 82 10 of 13
It is known that precipitation in the form of snow results in the accumulation of airbornebacteria in the seasonal snowpack and sea ice (50 to over 40,000 cells mL−1) [48,49]. Resuspensionof snow containing accumulated bacteria may thus be one potential source. According to the dataof the National Snow and Ice Data Center (NSIDC), the monthly ice extent in August 2008 was thesecond-lowest recorded during the period from 1979 to 2008.
Another possible explanation is that bacteria could collect on the ice in “frost flowers”, and thenbe aerosolized [50]. Also, there area lot of biological activities around the sea ice, which containsnutrients. During summer, ice melt lead increases can cause increases in biological activities [12].Leck and Bigg [51] suggested that spray production from leads may be an important source of bacteriato the Arctic atmosphere. In summer, marine gel also plays an important role in the cloud condensationnuclei in the high Arctic (north of 80◦ N) [13]. Therefore, in the high Arctic region, marine sourcebacteria probably are a big contribution to atmospheric aerosols.
4. Conclusions
The abundance and size distributions of airborne bacteria in the marine boundary layer wereinvestigated during the third China Arctic Research Expedition (July–September, 2008). To ourknowledge, this is the first quantitative study of airborne bacterial concentrations in the Arctic.The concentrations of NSBCPs and SBCPs varied considerably over the whole sampling period(NSBCPs 16–919 CFU m−3; SBCPs 4–276 CFU m−3). These concentrations are much higher thanthose reported earlier using non-saline agar at a mid-Atlantic marine site and in marine backgroundair at Barbados. NSBCPs were also observed in the high Arctic Ocean. The NSBCPs and SBCPspresented in both the coarse and fine aerosols. Concentrations of TBCPs and NSBCPs correlated withair temperature. Changes in sea ice in the Arctic Ocean were also found to influence the distributionof bacteria. Higher concentrations of SBCPs were observed in the presence of seasonal Arctic sea ice,suggesting a possible sea-ice related source, probably from biological activities in the leads, re-blowingof snow, or frost flower formation on the seasonal ice pack.
Since culture methods may underestimate the environmental bacterial communities, it is expectedthat the abundance in the ambient air would be even higher than those observed in this study. Futureinvestigations should apply molecular biological techniques (e.g., 16S rDNA analysis) to distinguishspecies between different bacteria.
Acknowledgments: This research was supported by grants from the National Natural Science Foundation ofChina (Project No. 41676173), the Chinese Arctic and Antarctic Administration (Projects No. CHINARE2012-2017and IC201202), and the External Cooperation Program of BIC, CAS (Project No.211134KYSB20130012). We thankHang Su and Susannah Burrows for their valuable contributions to study related discussions.
Author Contributions: Z.Q.X. conceived and designed the experiments; L.M. and H.K. performed theexperiments; L.M., X.W.Y., Z.Q.X. and P. Z. analyzed the data; L.M., X.W.Y. and Z.Q.X. wrote the paper. All of theauthors contributed to the discussion and revise the manuscript.
Conflicts of Interest: The authors declare no conflict of interest.
References
1. Després, V.R.; Huffman, J.A.; Burrows, S.M.; Hoose, C.; Safatov, A.S.; Buryak, G.; Fröhlich-Nowoisky, J.;Elbert, W.; Andreae, M.O.; Pöschl, U.; et al. Primary biological aerosol particles in the atmosphere: A review.Tullus B 2012, 64, 15598. [CrossRef]
2. Burrows, S.M.; Butler, T.; Jöckel, P.; Tost, H.; Kerkweg, A.; Pöschl, U.; Lawrence, M.G. Bacteria in the globalatmosphere—Part 2: Modeling of emissions and transport between different ecosystems. Atmos. Chem. Phys.2009, 9, 9281–9297. [CrossRef]
3. Blanchard, D.C. The ejection of drops from the sea and their enrichment with bacteria and other materials:A review. Estuaries 1989, 12, 127–137. [CrossRef]
4. Christner, B.C.; Morris, C.E.; Foreman, C.M.; Cai, R.; Sands, D.C. Ubiquity of biological ice nucleators insnowfall. Science 2008, 319, 1214. [CrossRef] [PubMed]
Atmosphere 2017, 8, 82 11 of 13
5. Pöschl, U.; Martin, S.; Sinha, B.; Chen, Q.; Gunthe, S.; Huffman, J.; Borrmann, S.; Farmer, D.; Garland, R.;Helas, G. Rainforest aerosols as biogenic nuclei of clouds and precipitation in the amazon. Science 2010, 329,1513–1516. [CrossRef] [PubMed]
6. Lighthart, B. The ecology of bacteria in the alfresco atmosphere. FEMS Microbiol. Ecol. 1997, 23, 263–274.[CrossRef]
7. Bauer, H.; Kasper-Giebl, A.; Löflund, M.; Giebl, H.; Hitzenberger, R.; Zibuschka, F.; Puxbaum, H.The contribution of bacteria and fungal spores to the organic carbon content of cloud water, precipitationand aerosols. Atmos. Res. 2002, 64, 109–119. [CrossRef]
8. Amato, P.; Ménager, M.; Sancelme, M.; Laj, P.; Mailhot, G.; Delort, A.-M. Microbial population in cloudwater at the puy de dôme: Implications for the chemistry of clouds. Atmos. Environ. 2005, 39, 4143–4153.[CrossRef]
9. Dueker, M.E.; Weathers, K.C.; O’Mullan, G.D.; Juhl, A.R.; Uriarte, M. Environmental controls on coastalcoarse aerosols: Implications for microbial content and deposition in the near-shore environment. Environ.Sci. Technol. 2011, 45, 3386–3392. [CrossRef] [PubMed]
10. Li, M.; Qi, J.; Zhang, H.; Huang, S.; Li, L.; Gao, D. Concentration and size distribution of bioaerosols in anoutdoor environment in the qingdao coastal region. Sci. Total Environ. 2011, 409, 3812–3819. [CrossRef][PubMed]
11. Montero, A.; Dueker, M.E.; O’Mullan, G.D. Culturable bioaerosols along an urban waterfront are primarilyassociated with coarse particles. PeerJ 2016, 4, e2827. [CrossRef] [PubMed]
12. Matrai, P.A.; Tranvik, L.; Leck, C.; Knulst, J.C. Are high arctic surface microlayers a potential source ofaerosol organic precursors? Mar. Chem. 2008, 108, 109–122. [CrossRef]
13. Orellana, M.V.; Matrai, P.A.; Leck, C.; Rauschenberg, C.D.; Lee, A.M.; Coz, E. Marine microgels as a source ofcloud condensation nuclei in the high arctic. PNAS 2011, 108, 13612–13617. [CrossRef] [PubMed]
14. Zuraimi, M.S.; Fang, L.; Tan, T.K.; Chew, F.T.; Tham, K.W. Airborne fungi in low and high allergic prevalencechild care centers. Atmos. Environ. 2009, 43, 2391–2400. [CrossRef]
15. Harrison, R.M.; Jones, A.M.; Biggins, P.D.E.; Pomeroy, N.; Cox, C.S.; Kidd, S.P.; Hobman, J.L.; Brown, N.L.;Beswick, A. Climate factors influencing bacterial count in background air samples. Int. J. Biometeorol. 2005,49, 167–178. [CrossRef] [PubMed]
16. Shaffer, B.T.; Lighthart, B. Survey of culturable airborne bacteria at four diverse locations in oregon: Urban,rural, forest, and coastal. Microb. Ecol. 1997, 34, 167–177. [CrossRef] [PubMed]
17. Vladavets, V.; Mats, L. The influence of meteorological factors on the microflora. Microbiologya 1958, 59,539–544.
18. Kelly, C.D.; Pady, S.M. Microbiological studies of air masses over montreal during 1950 and 1951. Can. J. Bot.1954, 32, 591–600. [CrossRef]
19. Prospero, J.M.; Blades, E.; Mathison, G.; Naidu, R. Interhemispheric transport of viable fungi and bacteriafrom africa to the caribbean with soil dust. Aerobiologia 2005, 21, 1–19. [CrossRef]
20. Marks, R.; Kruczalak, K.; Jankowska, K.; Michalska, M. Bacteria and fungi in air over the gulf of gdansk andbaltic sea. J. Aerosol Sci. 2001, 32, 237–250. [CrossRef]
21. Baylor, E.; Baylor, M.; Blanchard, D.; Syzdek, L.; Appel, C. Virus transfer from surf to wind. Science 1977, 198,575–580. [CrossRef] [PubMed]
22. Aller, J.Y.; Kuznetsova, M.R.; Jahns, C.J.; Kemp, P.F. The sea surface microlayer as a source of viral andbacterial enrichment in marine aerosols. J. Aerosol Sci. 2005, 36, 801–812. [CrossRef]
23. Cho, B.C.; Hwang, C.Y. Prokaryotic abundance and 16s rrna gene sequences detected in marine aerosols onthe east sea (Korea). FEMS Microbiol. Ecol. 2011, 76, 327–341. [CrossRef] [PubMed]
24. Dueker, M.E.; O‘Mullan, G.D.; Weathers, K.C.; Juhl, A.R.; Uriarte, M. Coupling of fog and marine microbialcontent in the near-shore coastal environment. Biogeosciences 2012, 9, 803–813. [CrossRef]
25. Urbano, R.; Palenik, B.; Gaston, C.; Prather, K. Detection and phylogenetic analysis of coastal bioaerosolsusing culture dependent and independent techniques. Biogeosciences 2011, 8, 301. [CrossRef]
26. Griffin, D.W. Atmospheric movement of microorganisms in clouds of desert dust and implications for humanhealth. Clin. Microbiol. Rev. 2007, 20, 459–477. [CrossRef] [PubMed]
27. Hallar, A.; Chirokova, G.; McCubbin, I.; Painter, T.H.; Wiedinmyer, C.; Dodson, C. Atmospheric bioaerosolstransported via dust storms in the western united states. Geophys. Res. Lett. 2011. [CrossRef]

Atmosphere 2017, 8, 82 12 of 13
28. Burrows, S.M.; Elbert, W.; Lawrence, M.G.; Pöschl, U. Bacteria in the global atmosphere—Part 1: Review andsynthesis of literature data for different ecosystems. Atmos. Chem. Phys. 2009, 9, 9263–9280. [CrossRef]
29. Clark, S.; Rylander, R.; Larsson, L. Airborne bacteria, endotoxin and fungi in dust in poultry and swineconfinement buildings. Am. Ind. Hyg. Assoc. J. 1983, 44, 537–541. [CrossRef] [PubMed]
30. Liu, Y.; Han, J.-X.; Huang, H.-Y.; Zhu, B. Development and evaluation of 16s rdna microarray for detectingbacterial pathogens in cerebrospinal fluid. Exp. Biol. Med. 2005, 230, 587–591. [CrossRef]
31. Slabova, O.I.; Nikitin, D.I. Influence of the incubation temperature on the reaction of oligotrophic bacteria tostress. Microbiology 2004, 73, 650–653. [CrossRef]
32. Li, E.; Wu, J.; Wang, P.; Zhang, D. D-Phenylalanine inhibits biofilm development of a marine microbe,Pseudoalteromonas sp. SC2014. FEMS Microbiol. Lett. 2016, 363, fnw198. [CrossRef] [PubMed]
33. Boreson, J.; Dillner, A.M.; Peccia, J. Correlating bioaerosol load with PM2.5 and PM10cf concentrations:A comparison between natural desert and urban-fringe aerosols. Atmos. Environ. 2004, 38, 6029–6041.[CrossRef]
34. Kuske, C.R.; Barns, S.M.; Grow, C.C.; Merrill, L.; Dunbar, J. Environmental survey for four pathogenicbacteria and closely related species using phylogenetic and functional genes. J. Forensic Sci. 2006, 51, 548–558.[CrossRef] [PubMed]
35. Griffin, D.W.; Westphal, D.L.; Gray, M.A. Airborne microorganisms in the african desert dust corridor overthe mid-atlantic ridge, Ocean Drilling Program, Leg 209. Aerobiologia 2006, 22, 211–226. [CrossRef]
36. Sobek, A.; Olli, K.; Gustafsson, Ö. On the relative significance of bacteria for the distribution ofpolychlorinated biphenyls in arctic ocean surface waters. Environ. Sci. Technol. 2006, 40, 2586–2593.[CrossRef] [PubMed]
37. Deguillaume, L.; Leriche, M.; Amato, P.; Ariya, P.A.; Delort, A.M.; Pöschl, U.; Chaumerliac, N.; Bauer, H.;Flossmann, A.I.; Morris, C.E. Microbiology and atmospheric processes: Chemical interactions of primarybiological aerosols. Biogeosciences 2008, 5, 1073–1084. [CrossRef]
38. Lighthart, B.; Shaffer, B.T. Bacterial flux from chaparral into the atmosphere in mid-summer at a high desertlocation. Atmos. Environ. 1994, 28, 1267–1274. [CrossRef]
39. Morris, C.; Georgakopoulos, D.; Sands, D. Ice nucleation active bacteria and their potential role inprecipitation. J. Phys. 2004, 121, 87–103. [CrossRef]
40. Jones, A.M.; Harrison, R.M. The effects of meteorological factors on atmospheric bioaerosolconcentrations—A review. Sci. Total Environ. 2004, 326, 151–180. [CrossRef] [PubMed]
41. Lindemann, J.; Upper, C.D. Aerial dispersal of epiphytic bacteria over bean plants. Appl. Environ. Microbiol.1985, 50, 1229–1232. [PubMed]
42. Mouli, P.; Mohan, S.; Reddy, S. Assessment of microbial(bacteria) concentrations of ambient air at semi-aridurban region: Influence of meteorological factors. Appl. Ecol. Environ. Res. 2005, 3, 139–149. [CrossRef]
43. Tong, Y.; Lighthart, B. Diurnal distribution of total and culturable atmospheric bacteria at a rural site. AerosolSci. Technol. 1999, 30, 246–254. [CrossRef]
44. Arrigo, K.R.; Thomas, D.N. Large scale importance of sea ice biology in the southern ocean. Antarct. Sci.2004, 16, 471–486. [CrossRef]
45. Carpenter, E.J.; Lin, S.; Capone, D.G. Bacterial activity in south pole snow. Appl. Environ. Microbiol. 2000, 66,4514–4517. [CrossRef] [PubMed]
46. Lu, P.; Li, Z.; Cheng, B.; Lei, R.; Zhang, R. Sea ice surface features in arctic summer 2008: Aerial observations.Remote Sens. Environ. 2010, 114, 693–699. [CrossRef]
47. Harding, T.; Jungblut, A.D.; Lovejoy, C.; Vincent, W.F. Microbes in high arctic snow and implications for thecold biosphere. Appl. Environ. Microbiol. 2011, 77, 3234–3243. [CrossRef] [PubMed]
48. Ariya, P.A.; Domine, F.; Kos, G.; Amyot, M.; Côté, V.; Vali, H.; Lauzier, T.; Kuhs, W.F.; Techmer, K.;Heinrichs, T.; et al. Snow–A photobiochemical exchange platform for volatile and semi-volatile organiccompounds with the atmosphere. Environ. Chem. 2011, 8, 62–73. [CrossRef]
49. Møller, A.K.; Barkay, T.; Al-Soud, W.A.; Sorensen, S.J.; Skov, H.; Kroer, N. Diversity and characterization ofmercury-resistant bacteria in snow, freshwater and sea-ice brine from the high arctic. FEMS Microbiol. Ecol.2011, 75, 390–401. [CrossRef] [PubMed]

Atmosphere 2017, 8, 82 13 of 13
50. Bowman, J.; Deming, J. Elevated bacterial abundance and exopolymers in saline frost flowers andimplications for atmospheric chemistry and microbial dispersal. Geophys. Res. Lett. 2010. [CrossRef]
51. Leck, C.; Bigg, E.K. Biogenic particles in the surface microlayer and overlaying atmosphere in the centralarctic ocean during summer. Tellus B 2005, 57, 305–316. [CrossRef]
© 2017 by the authors. Licensee MDPI, Basel, Switzerland. This article is an open accessarticle distributed under the terms and conditions of the Creative Commons Attribution(CC BY) license (http://creativecommons.org/licenses/by/4.0/).