con edison rpp program evaluation 2017 · 2.1 con edison program logic model the con edison rpp...
TRANSCRIPT

June 15th, 2018
Presented To: Presented By:
Paul Romano
Section Manager, Energy Efficiency &
Demand Management EM&V
Con Edison
4 Irving Place
New York, NY 10003
Brett Close, PhD
Managing Research Consultant
EMI Consulting
83 Columbia St. Suite 400
Seattle, WA 98104
F I N A L R E P O R T
Con Edison
Retail Products Platform (RPP) Evaluation
2017

TABLE OF CONTENTS
i
TABLE OF CONTENTS
1. INTRODUCTION .................................................................................................................................... 2
1.1 National RPP Program Context .................................................................................................. 2 1.2 Con Edison RPP Program Pilot Overview................................................................................... 3 1.3 Research Objectives .................................................................................................................... 4
2. OVERVIEW OF RESEARCH ACTIVITIES ................................................................................................. 6
2.1 Con Edison Program Logic Model .............................................................................................. 6 2.2 In-depth Interviews ..................................................................................................................... 8 2.3 Shelf Assortment Data Analysis ................................................................................................. 8 2.4 Short-term Savings Analysis ....................................................................................................... 9
3. FINDINGS .............................................................................................................................................. 12
3.1 Short-term Program Impacts are Detectable in Three Product Categories ........................... 12 3.1.1 Refrigerators, Freezers, and Dryers Exhibit Short-term Impacts ................................ 12 3.1.2 Room Air Conditioners, Air Cleaners, Soundbars, and Washers Did Not Show Short-term Impacts ............................................................................................................................ 15
3.2 Con Edison’s Program is Operating Consistent with Theory .................................................. 18 3.2.1 Logic Model Activities and Outputs Are Occurring..................................................... 20 3.2.2 Several Short-term Outcomes Are Occurring .............................................................. 21
4. Summary and CONCLUSIONS ............................................................................................................ 24
LIST OF TABLES
Table 1-1. Con Edison RPP Program Pilot Qualifying Specifications and Incentive Levels ....................... 4 Table 1-2. Mapping of Research Objectives to Research Activities ........................................................... 5 Table 3-1. Estimated Changes in Qualified Product Sales (from pre-program period to program period) ......................................................................................................................................................... 12 Table 3-2. Model Comparison Showing Robustness of Results ............................................................... 13 Table 3-3. Product Energy Savings ............................................................................................................ 14 Table 3-4. Estimated Changes in Qualified Product Sales (from pre-program period to program period) ........................................................................................................................................................ 16 Table 3-5. Summary of Evidence: Logic Model Outputs G Through M .................................................... 21 Table 3-6. Comparison of Total Percent Change in Assortment and Estimated Sales ........................... 22 Table 3-7. Summary of Program Impacts .................................................................................................. 22 Table 3-8. Assessment of Logic Model Outcomes Q Through S a ........................................................... 23
LIST OF FIGURES
Figure 2-1. Con Edison RPP Pilot Program Logic Model (Updated December 21, 2017) ........................... 7 Figure 3-1. Average Modeled Sales for Products with Estimated Sales Increases: Pre- and Post-Periods ..................................................................................................................................................................... 13

Con Edison RPP Program Evaluation 2017
ii
Figure 3-2. Shelf Assortment Surveys: Products Showing Increases in Estimated Sales ........................ 15 Figure 3-3. Average Modeled Sales for Products Without Estimated Sales Increases: Pre- and Post-Periods ........................................................................................................................................................ 16 Figure 3-4. Shelf Assortment Surveys: Products Not Showing Increases in Estimated Sales a .............. 17 Figure 3-5. Logic Model Depicting Progress Along Paths of Influence ................................................... 19
APPENDICES
Appendix A: Detailed Logic Model Description ...................................................................................... A-1 Appendix B: Detailed Methods ................................................................................................................ B-1 Appendix C: Detailed Findings .................................................................................................................. C-1

(this page left intentionally blank)


EXECUTIVE SUMMARY
ES-1
EXECUTIVE SUMMARY
<PLACEHOLDER>
Con Edison RPP Program Evaluation 2017
2
1. INTRODUCTION
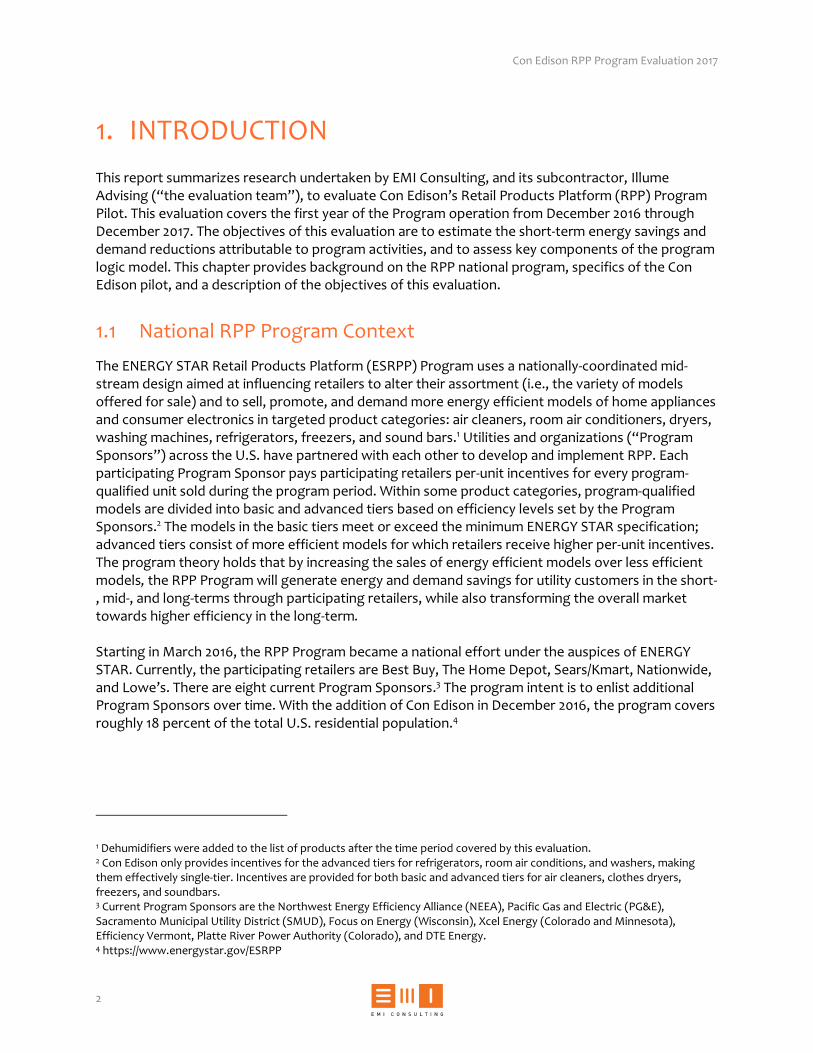
This report summarizes research undertaken by EMI Consulting, and its subcontractor, Illume Advising (“the evaluation team”), to evaluate Con Edison’s Retail Products Platform (RPP) Program Pilot. This evaluation covers the first year of the Program operation from December 2016 through December 2017. The objectives of this evaluation are to estimate the short-term energy savings and demand reductions attributable to program activities, and to assess key components of the program logic model. This chapter provides background on the RPP national program, specifics of the Con Edison pilot, and a description of the objectives of this evaluation.
1.1 National RPP Program Context
The ENERGY STAR Retail Products Platform (ESRPP) Program uses a nationally-coordinated mid-stream design aimed at influencing retailers to alter their assortment (i.e., the variety of models offered for sale) and to sell, promote, and demand more energy efficient models of home appliances and consumer electronics in targeted product categories: air cleaners, room air conditioners, dryers, washing machines, refrigerators, freezers, and sound bars.1 Utilities and organizations (“Program Sponsors”) across the U.S. have partnered with each other to develop and implement RPP. Each participating Program Sponsor pays participating retailers per-unit incentives for every program-qualified unit sold during the program period. Within some product categories, program-qualified models are divided into basic and advanced tiers based on efficiency levels set by the Program Sponsors.2 The models in the basic tiers meet or exceed the minimum ENERGY STAR specification; advanced tiers consist of more efficient models for which retailers receive higher per-unit incentives. The program theory holds that by increasing the sales of energy efficient models over less efficient models, the RPP Program will generate energy and demand savings for utility customers in the short-, mid-, and long-terms through participating retailers, while also transforming the overall market towards higher efficiency in the long-term. Starting in March 2016, the RPP Program became a national effort under the auspices of ENERGY STAR. Currently, the participating retailers are Best Buy, The Home Depot, Sears/Kmart, Nationwide, and Lowe’s. There are eight current Program Sponsors.3 The program intent is to enlist additional Program Sponsors over time. With the addition of Con Edison in December 2016, the program covers roughly 18 percent of the total U.S. residential population.4
1 Dehumidifiers were added to the list of products after the time period covered by this evaluation. 2 Con Edison only provides incentives for the advanced tiers for refrigerators, room air conditions, and washers, making them effectively single-tier. Incentives are provided for both basic and advanced tiers for air cleaners, clothes dryers, freezers, and soundbars. 3 Current Program Sponsors are the Northwest Energy Efficiency Alliance (NEEA), Pacific Gas and Electric (PG&E), Sacramento Municipal Utility District (SMUD), Focus on Energy (Wisconsin), Xcel Energy (Colorado and Minnesota), Efficiency Vermont, Platte River Power Authority (Colorado), and DTE Energy. 4 https://www.energystar.gov/ESRPP
Chapter 1 INTRODUCTION
3
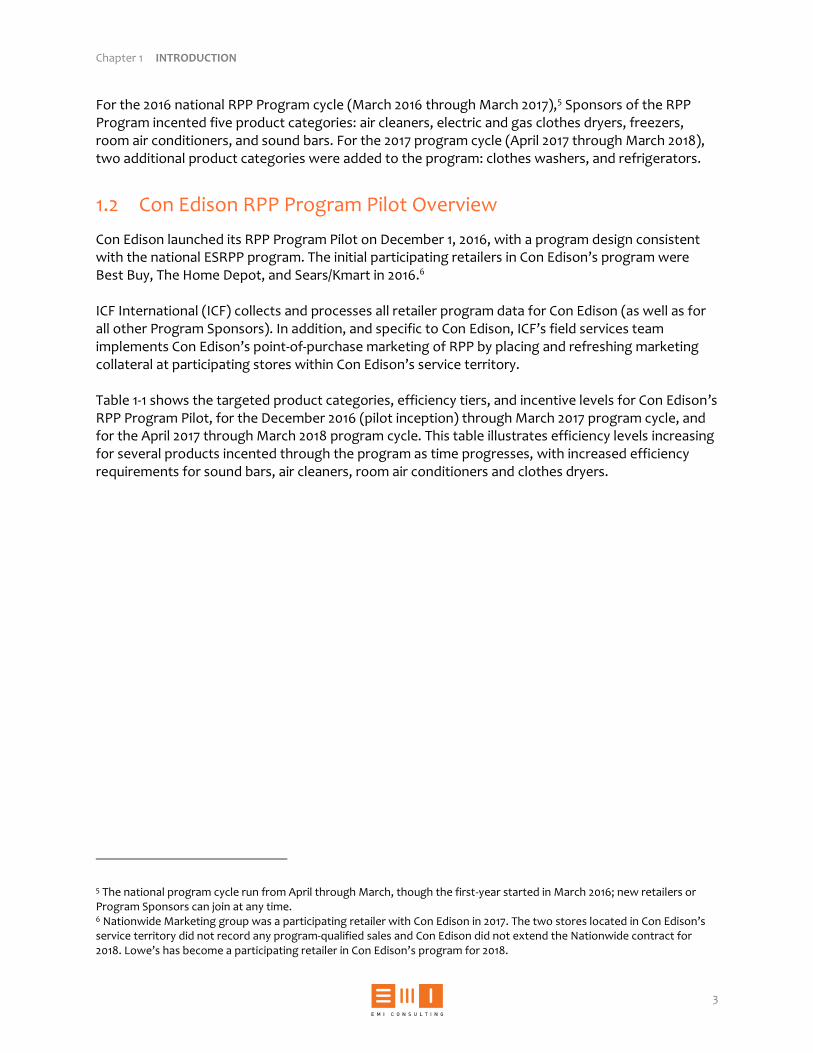
For the 2016 national RPP Program cycle (March 2016 through March 2017),5 Sponsors of the RPP Program incented five product categories: air cleaners, electric and gas clothes dryers, freezers, room air conditioners, and sound bars. For the 2017 program cycle (April 2017 through March 2018), two additional product categories were added to the program: clothes washers, and refrigerators.
1.2 Con Edison RPP Program Pilot Overview
Con Edison launched its RPP Program Pilot on December 1, 2016, with a program design consistent with the national ESRPP program. The initial participating retailers in Con Edison’s program were Best Buy, The Home Depot, and Sears/Kmart in 2016.6 ICF International (ICF) collects and processes all retailer program data for Con Edison (as well as for all other Program Sponsors). In addition, and specific to Con Edison, ICF’s field services team implements Con Edison’s point-of-purchase marketing of RPP by placing and refreshing marketing collateral at participating stores within Con Edison’s service territory. Table 1-1 shows the targeted product categories, efficiency tiers, and incentive levels for Con Edison’s RPP Program Pilot, for the December 2016 (pilot inception) through March 2017 program cycle, and for the April 2017 through March 2018 program cycle. This table illustrates efficiency levels increasing for several products incented through the program as time progresses, with increased efficiency requirements for sound bars, air cleaners, room air conditioners and clothes dryers.
5 The national program cycle run from April through March, though the first-year started in March 2016; new retailers or Program Sponsors can join at any time. 6 Nationwide Marketing group was a participating retailer with Con Edison in 2017. The two stores located in Con Edison’s service territory did not record any program-qualified sales and Con Edison did not extend the Nationwide contract for 2018. Lowe’s has become a participating retailer in Con Edison’s program for 2018.

Con Edison RPP Program Evaluation 2017
4
Table 1-1. Con Edison RPP Program Pilot Qualifying Specifications and Incentive Levels
Qualifying
Product
2016–2017 2017–2018
ENERGY STAR Specification Unit
Incentive ENERGY STAR Specification
Unit
Incentive
Sound Bars v3 +15% $5 - -
v3 +50% $10 v3 +50% $5
Air Cleaners v1.2 $5 v1.2 +30% $5
v.2 +30% $10 v1.2 +50% $10
Freezers v5 $10 v5 $10
v5 +5% $20 v5 +5% $20
Clothes Dryers v1 $25 v1 $15
2015 (ENERGY STAR Heat Pump) $50 Most Efficient 2017 $50
Room ACs v4 $30 v4 + connectivity $20
Clothes Washers - - Most Efficient 2017 +5% $20
Refrigerators - - Most Efficient 2017 $50
1.3 Research Objectives
This evaluation was designed to meet two main objectives: Objective 1: Estimate short-term energy and demand savings attributable to program activities.
Evaluation approach: To quantify these key program impacts, the evaluation team analyzed trends in sales data and shelf-assortment data over time. To account for program attribution, we used metrics that reflect the influence of the RPP program, such as: (1) increase in program-qualified sales (above a non-program baseline), and (2) proportion of program-qualified models in a retailer’s shelf stock.
Objective 2: Assess key components of the program logic model.
Evaluation approach: We assessed key components of the logic model to document the extent to which the program activities were successfully conducted and whether the expected outputs and outcomes occurred.
Table 1-2 shows how the research activities we conducted for this evaluation inform these two research objectives. The remainder of this report includes chapters containing an overview of the research activities employed in this evaluation (Chapter 2), findings (Chapter 3), and finally, a chapter that includes overall conclusions stemming from this evaluation (Chapter 4).

Chapter 1 INTRODUCTION
5
Table 1-2. Mapping of Research Objectives to Research Activities
Research Activity Specific Research Needs/Analyses
Research Objective
Estimate short-term energy
and demand savings
attributable to program
activities
Assess key components of
the program logic model
Document Review
(includes review of Con Edison program
documentation, contracts with regional
retailers, other Program Sponsor
reports, retailer implementation plans,
etc.)
Understand and document program activities.
Learn from other programs and their evaluations, including
evaluation methodology.
Determine possible influence of retailer promotions.
Conduct Interviews
(includes Con Edison program staff and
the ICF field services staff who place in-
store marketing materials)
Document program activities and highlight areas for
potential process improvements.
Understand influence of the pilot on promotion and
stocking behavior of any regional retailers.
Review National Retailer Interviews Understand how the program is impacting retailer
decision-making.
Shelf Assortment Data Analysis
Determine proportion of stocked qualified models by
product category and retailer.
Assess changes in assortment over time.
Sales Data Analysis
Document incentives paid.
Determine program-qualified sales by product category.
Develop baseline and estimate changes from baseline.
Estimate energy and demand savings due to RPP.

Con Edison RPP Program Evaluation 2017
6
2. OVERVIEW OF RESEARCH ACTIVITIES
This section provides an overview of the research activities EMI Consulting undertook to evaluate the Con Edison RPP program pilot. These activities included the development of a Con Edison-specific RPP logic model, a review of interviews with national retailer staff and Con Edison program staff, an analysis of shelf assortment survey data, and forecasting program lift using sales data. In the following sections, we briefly describe each of these research activities in more detail.
2.1 Con Edison Program Logic Model
The Con Edison RPP program is aimed at market transformation in the State of New York and beyond through a mid-stream intervention strategy. The evaluation team created a Con Edison RPP logic model (presented below as Figure 2-1) to help guide subsequent research activities and frame the overall evaluation using the program theory. According to the Con Edison program logic model, outcomes of the program are expected to evolve as the program increases in size and maturity:
In the short-term (1-2 years), the program should gain sufficient scale to influence participating retailers’ stocking and marketing, leading to increased sales of program-qualified models in participating store locations. At the same time, program delivery will be improved through the use of sales data and other information being tracked by program staff.
In the mid-term (3-6 years), participating retailers should increase the proportion of qualified products in their assortment, begin to require more qualifying models from manufacturers, and favor program-qualified models in their marketing efforts. Program theory also suggests that energy efficiency criteria for qualifying products will increase, resulting in specification updates to the New York Technical Resource Manual.
In the long-term (7-10 years), manufacturers should increase the number and variety of energy efficient models in targeted product categories, leading to a permanent increase in the availability of these models in retail stores, an increase in national market share for these models, and lastly, more stringent federal standards for these product categories.
Validating the activities, outputs, outcomes, and linkages in this logic model allows us to assess the performance and efficacy of the program. Ultimately, this approach also allows us to make plausible estimates of attribution. In Chapter 3, we provide a detailed assessment of the portion of the logic model for which evidence is available and present supporting evidence organized by each element in the model. A more detailed description of the nodes and linkages in this logic model is provided in Appendix A.

Chapter 2 OVERVIEW OF RESEARCH ACTIVITIES
7
Figure 2-1. Con Edison RPP Pilot Program Logic Model (Updated December 21, 2017)
Con Edison RPP Program Evaluation 2017
8
2.2 In-depth Interviews
2.2.1 Program and Subcontractor Interviews
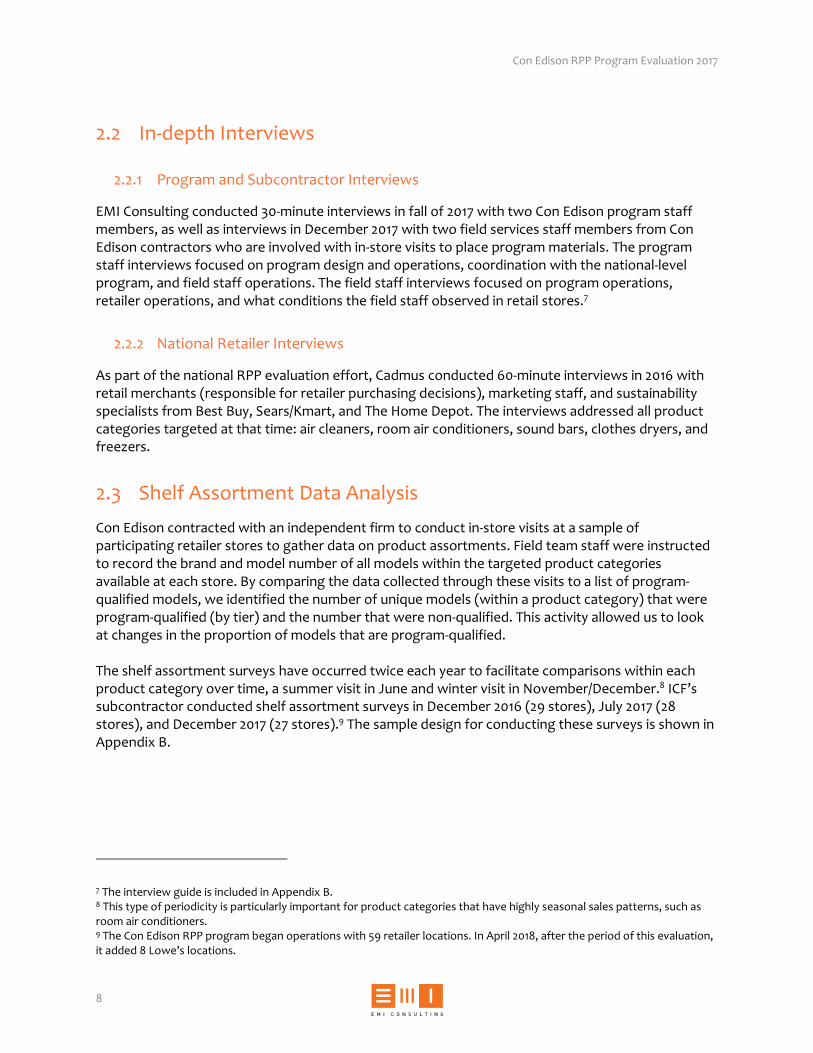
EMI Consulting conducted 30-minute interviews in fall of 2017 with two Con Edison program staff members, as well as interviews in December 2017 with two field services staff members from Con Edison contractors who are involved with in-store visits to place program materials. The program staff interviews focused on program design and operations, coordination with the national-level program, and field staff operations. The field staff interviews focused on program operations, retailer operations, and what conditions the field staff observed in retail stores.7
2.2.2 National Retailer Interviews
As part of the national RPP evaluation effort, Cadmus conducted 60-minute interviews in 2016 with retail merchants (responsible for retailer purchasing decisions), marketing staff, and sustainability specialists from Best Buy, Sears/Kmart, and The Home Depot. The interviews addressed all product categories targeted at that time: air cleaners, room air conditioners, sound bars, clothes dryers, and freezers.
2.3 Shelf Assortment Data Analysis
Con Edison contracted with an independent firm to conduct in-store visits at a sample of participating retailer stores to gather data on product assortments. Field team staff were instructed to record the brand and model number of all models within the targeted product categories available at each store. By comparing the data collected through these visits to a list of program-qualified models, we identified the number of unique models (within a product category) that were program-qualified (by tier) and the number that were non-qualified. This activity allowed us to look at changes in the proportion of models that are program-qualified. The shelf assortment surveys have occurred twice each year to facilitate comparisons within each product category over time, a summer visit in June and winter visit in November/December.8 ICF’s subcontractor conducted shelf assortment surveys in December 2016 (29 stores), July 2017 (28 stores), and December 2017 (27 stores).9 The sample design for conducting these surveys is shown in Appendix B.
7 The interview guide is included in Appendix B. 8 This type of periodicity is particularly important for product categories that have highly seasonal sales patterns, such as room air conditioners. 9 The Con Edison RPP program began operations with 59 retailer locations. In April 2018, after the period of this evaluation, it added 8 Lowe’s locations.

Chapter 2 OVERVIEW OF RESEARCH ACTIVITIES
9
2.4 Short-term Savings Analysis
EMI Consulting estimated short-term energy savings in two parts: the increases in sales attributable to the program, and average savings for qualified products by product group. We first used a model-averaging approach that combined estimates from three models to account for uncertainty in the true market behavior to robustly estimate changes in sales of qualified products. Next, we estimated per-unit energy savings for each product group based on the average energy savings of qualified products in the program period. This section outlines the methods we used to calculate the final savings estimates.10
2.4.1 Changes in RPP Product Sales
EMI Consulting estimated changes in unit sales for RPP product groups by modeling sales in the pre-program period, using this model to predict sales during the program period, and then comparing the predictions to the observed sales. EMI Consulting developed three statistical models of baseline sales behavior that incorporate different assumptions about how the program affects qualified product sales and how the baseline sales behavior changes. Each of these models allow for “naturally occurring” pre-program trends in sales or market share and is evaluated on the pre-program sales data.
Sales Model: This model uses monthly sales values, assuming that the effect of the program is to increase the sales of program-qualified products. This model explicitly allows qualified and non-qualified sales to vary separately.
Market Share Model: This model uses monthly penetration rates, assuming that the effect of the program is to increase the market share. This model combines the qualified and non-qualified model sales and relies on changes in the ratio over time.
Probit Model: This model uses a transformation of market share used in the Market Share Model. It is based on an assumption that the effect of the program would have a smaller absolute impact on the market share if it is extreme (either very small or very large), but a larger absolute impact if the market share is modest.
For each product group, we used each of the three models to predict sales levels during the program period.
Model Averaging Model: This model combines the three models above based on how well the models predicted actual sales for the pre-program period to develop a predicted sales value for each program group. This allows the model to incorporate the different assumptions in the three previous models to be combined in a way that fits the data best.
The weights for combining the models are based on a statistical measure called the leave-one-out cross validation criterion, which is a measure of how well the model fits each observation if it does
10 Con Edison also provides incentives for some appliances through downstream rebate programs. As the data received by EMI Consulting did not include any downstream rebates for products found to have statistically significant sales changes, the sales increase values have not been adjusted for the downstream rebate program activity.

Con Edison RPP Program Evaluation 2017
10
not include that observation in the data it uses.11 We estimated increases in qualified product sales as the difference between the observed sales and the predicted sales. If observed sales were larger than predicted sales, then that constituted an increase in the qualified product sales level during the program period. We then determined if the predicted increases were statistically significant with at least 90 percent confidence. Because the increase is relative to the baseline market behavior before the program started, we consider the increase attributable to the program. To validate the findings from the prediction models, we conducted a treatment effects panel estimation of the program impact.
Panel Validation Model: This model relies on observed monthly sales values for different manufacturers in the pre-program period and the program period to estimate the overall level of change.
Panel models use repeated observations of the same entity (in this case brand) over time to control for (1) unobserved characteristics that do not change, and (2) unobserved characteristics of each time period that are the same across entities but do change over time. The panel treatment effects model thus estimates the impact of the program being in effect. The treatment effects panel model does not rely on predicted values, but instead uses observed sales values to estimate the quantitative contribution from the program. Our model used variation in sales levels by month for models from different brands to control for seasonality and then estimated the overall difference in sales between the pre-program period and the program period. With so few observations, these models lack precision but provide a “reality check” to ensure that the results are not due solely to modeling assumptions.
2.4.2 Estimating Per-Unit Energy Savings
To calculate energy savings, EMI Consulting relied on the per-model savings estimates in the ICF data portal.12 For each product category we calculated the weighted average of the electric unit energy savings (kWh), electric unit demand reduction (kW), and gas unit energy savings (therms). We then took the weighted average savings for all qualified products sold in the program period and multiplied this average value by the sales increase to determine overall savings for that product group. The total energy savings and demand reductions are the product of the sales increase and the unit energy savings or demand reduction. We treated unit energy savings and unit demand reduction values as fixed, rather than uncertain, so that the uncertainty in the final savings estimates is based on the uncertainty in the program induced sales increase, and not the uncertainty in the energy savings values.
2.4.3 Challenges and Limitations
The primary challenge of estimating sales increase is lack of data in the pre-program period. Because product groups have between 14 and 18 months of pre-program sales data, adjustments for seasonality and pre-existing trends in qualified product sales require making assumptions about the underlying seasonality and trend behavior, albeit based on the observable patterns in the data. For
11 This method of model averaging is a simplified version of Hansen-Racine Jackknife Model Averaging: Hanse, Bruce E. and Jeffrey S. Racine. “Jackknife model averaging.” Journal of Econometrics, 167 (2012) pp. 38-46. 12 Con Edison conducted a detailed verification of these values to assure they were consistent with the New York TRM.

Chapter 2 OVERVIEW OF RESEARCH ACTIVITIES
11
example, if there is only one observation from the month of June and that observation is high, we assume that is a June seasonal effect and not a random fluctuation or due to some other cause. And because no comparison group data are available, the only comparison we can make is based on using the pre-program period to inform what we think would happen to sales in the absence of the program intervention. The approaches taken by EMI Consulting are described briefly below and in more detail in Appendix B. An additional challenge was the data quality. Earlier iterations of the data portal included instances of the same model being “qualified” in some months but “non-qualified” in other months not related to changes in program qualification criteria, or different energy savings values being assigned to the same model over time. EMI Consulting conducted an initial quality assurance/quality control (QA/QC) review of the data provided by ICF and posed questions to ICF, where applicable. Following these discussions, EMI Consulting operated under the assumption that the sales data downloaded from the ICF portal were correct in terms of sales numbers, program-qualified status, and energy savings.13 A broader challenge likely to affect future RPP evaluations is that the program design is based only on in-store sales and does not consider the effects of online sales of models in program-eligible product categories. Online sales will become increasingly important over time (at least for some product categories), as more customers make purchases online. It will be important for staff to understand how the program is affected by this mechanism.
13 Because these data processing errors affect not only Con Edison, but all of the Program Sponsors, there is an opportunity for program sponsors to coordinate to address this risk. We have found that many errors can be detected by conducting a series of consistency checks to ensure that program criteria are being applied correctly to products throughout time. We recommend that Con Edison coordinate with other ESRPP Program Sponsors to develop a set of data QA/QC criteria that ICF could demonstrate that the portal data meet. This should include classification checks (to make sure values are being assigned correctly in the first place – for instance, are models being assigned the correct energy savings values?) as well as consistency checks over time (e.g., is a given model assigned to same bin over time?). Such a process could be implemented with each updated data set, or each portal update, but no less frequently than on an annual basis to ensure any mistakes are identified and corrected before too much time has passed. Coordinating this QA/QC process with other Program Sponsors would provide some efficiencies.

Con Edison RPP Program Evaluation 2017
12
3. FINDINGS
The evaluation team found that the Con Edison RPP program increased sales for program-qualified models leading to short-term savings in three product categories: refrigerators, freezers, and dryers. For the other four categories (room air conditioners, air cleaners, soundbars, and clothes washers), we did not estimate any statistically significant change in program-qualified sales. More broadly, evaluation results show that the Con Edison RPP program is operating in line with program theory, though it is still too early to assess many of the mid- and long-term outcomes included in the logic model. In the following section, we discuss results organized by research objective: (1) short-term program impacts, and (2) an assessment of the program logic model.
3.1 Short-term Program Impacts are Detectable in Three Product Categories
Of the seven product categories incented in Con Edison’s RPP program, three product categories (refrigerators, freezers, and dryers) showed statistically significant increases in program-qualified sales. Statistically significant estimated changes in qualifying product sales for each product ranged from +15.1% for refrigerators to +9.9% for dryers.
3.1.1 Refrigerators, Freezers, and Dryers Exhibit Short-term Impacts
Short-term impacts attributable to the Con Edison RPP program are detectable in three product categories: refrigerators, freezers, and dryers. Comparing the pre-program period to the program period, the evaluation team found statistically-significant increases in qualified sales for refrigerators (+15.1%), freezers (+10.8%), and dryers (+9.9%, Table 3-1). The estimated sales increases and percent increases show the 90% confidence bounds, based on the calculated standard errors and the critical values of the t-distribution. The overall sales volume of program-qualified refrigerators and dryers was large, as was the estimated increase in program-qualified sales, leading to a large sales lift. For freezers, the overall program-qualified sales volume and sales increase were small, again leading to a sizeable percentage lift, although the absolute increase was small.
Table 3-1. Estimated Changes in Qualified Product Sales (from pre-program period to program period)
Product Total PQ Sales Increased PQ Sales Percent Increase
Refrigerators 4,540 686
(+/- 377)
15.1%
(+/- 8.3%)
Freezers 873 94
(+/- 79)
10.8%
(+/- 9.0%)
Dryers 6,980 688
(+/- 162)
9.9%
(+/- 2.3%)
Chapter 3 FINDINGS
13
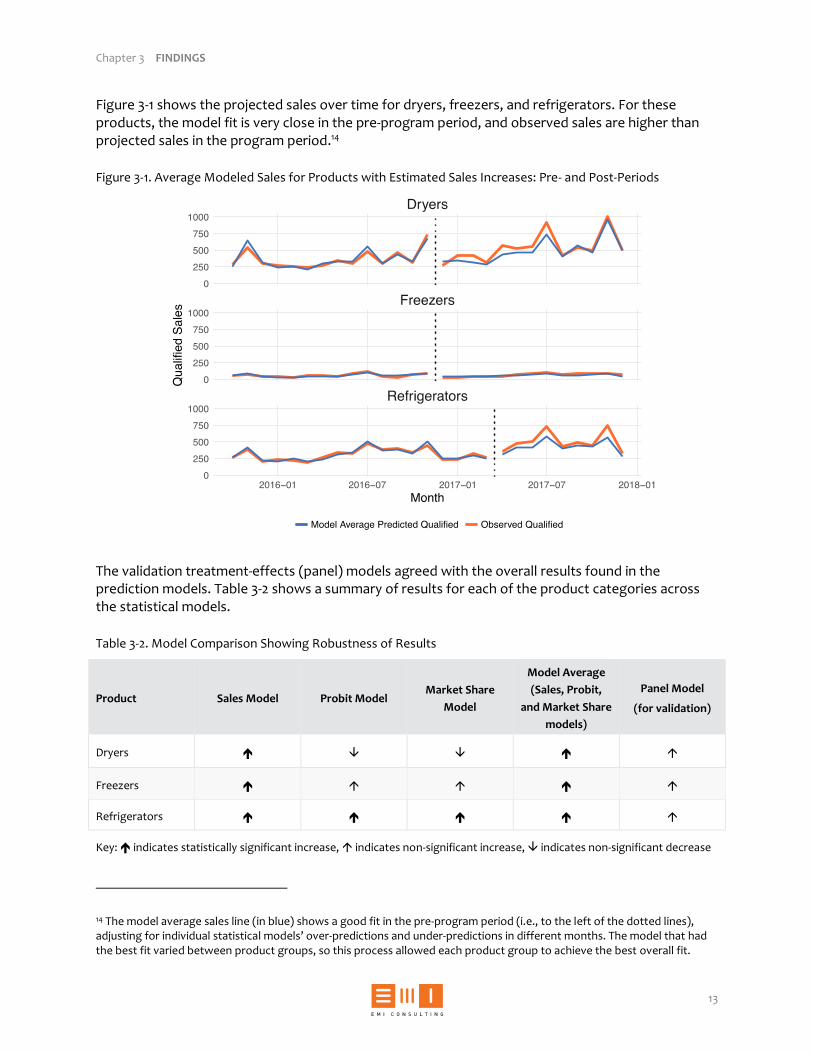
Figure 3-1 shows the projected sales over time for dryers, freezers, and refrigerators. For these products, the model fit is very close in the pre-program period, and observed sales are higher than projected sales in the program period.14
Figure 3-1. Average Modeled Sales for Products with Estimated Sales Increases: Pre- and Post-Periods
The validation treatment-effects (panel) models agreed with the overall results found in the prediction models. Table 3-2 shows a summary of results for each of the product categories across the statistical models.
Table 3-2. Model Comparison Showing Robustness of Results
Product Sales Model Probit Model Market Share
Model
Model Average
(Sales, Probit,
and Market Share
models)
Panel Model
(for validation)
Dryers
Freezers
Refrigerators
Key: indicates statistically significant increase, indicates non-significant increase, indicates non-significant decrease
14 The model average sales line (in blue) shows a good fit in the pre-program period (i.e., to the left of the dotted lines), adjusting for individual statistical models’ over-predictions and under-predictions in different months. The model that had the best fit varied between product groups, so this process allowed each product group to achieve the best overall fit.
Con Edison RPP Program Evaluation 2017
14
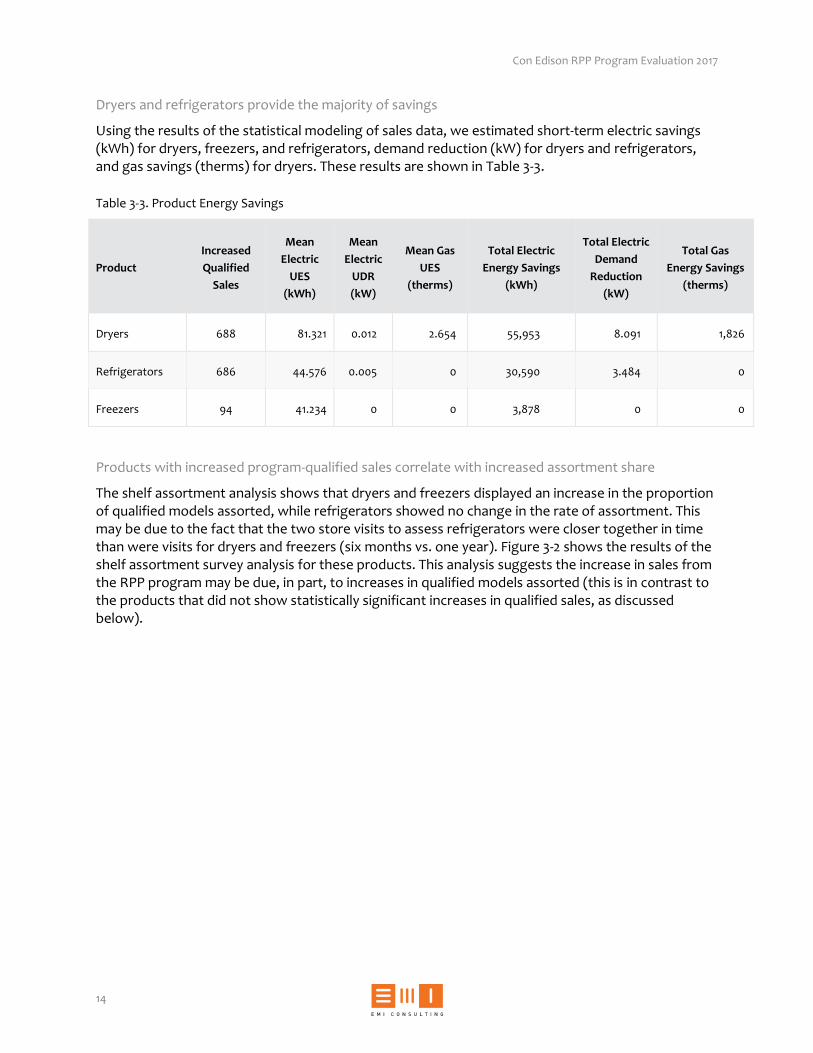
Dryers and refrigerators provide the majority of savings
Using the results of the statistical modeling of sales data, we estimated short-term electric savings (kWh) for dryers, freezers, and refrigerators, demand reduction (kW) for dryers and refrigerators, and gas savings (therms) for dryers. These results are shown in Table 3-3.
Table 3-3. Product Energy Savings
Product
Increased
Qualified
Sales
Mean
Electric
UES
(kWh)
Mean
Electric
UDR
(kW)
Mean Gas
UES
(therms)
Total Electric
Energy Savings
(kWh)
Total Electric
Demand
Reduction
(kW)
Total Gas
Energy Savings
(therms)
Dryers 688 81.321 0.012 2.654 55,953 8.091 1,826
Refrigerators 686 44.576 0.005 0 30,590 3.484 0
Freezers 94 41.234 0 0 3,878 0 0
Products with increased program-qualified sales correlate with increased assortment share
The shelf assortment analysis shows that dryers and freezers displayed an increase in the proportion of qualified models assorted, while refrigerators showed no change in the rate of assortment. This may be due to the fact that the two store visits to assess refrigerators were closer together in time than were visits for dryers and freezers (six months vs. one year). Figure 3-2 shows the results of the shelf assortment survey analysis for these products. This analysis suggests the increase in sales from the RPP program may be due, in part, to increases in qualified models assorted (this is in contrast to the products that did not show statistically significant increases in qualified sales, as discussed below).

Chapter 3 FINDINGS
15
Figure 3-2. Shelf Assortment Surveys: Products Showing Increases in Estimated Sales
a We did not include a third data point for clothes dryers, as it only included a very small number of models and we did not believe this to representative of the product’s trajectory as a whole.
3.1.2 Room Air Conditioners, Air Cleaners, Soundbars, and Washers Did Not Show Short-term Impacts
Comparing the pre-program-period sales to the program-period sales, the evaluation team did not detect statistically-significant changes in program-qualified sales for room air conditioners, air cleaners, sound bars, or washers, and thus we estimate no short-term savings for these product categories. More specifically, modeling results for room air conditioners, air cleaners, sound bars, and washers were not precise enough to rule out not changing with 90% confidence. While the point estimate for room air conditioners was positive, the lack of statistical significance was likely due to having so little meaningful pre-period data because sales are so concentrated in a few summer months. These results are shown in Table 3-4. The estimated increases and percent increases also show the 90% confidence bounds, based on the calculated standard errors and the critical values of the t-distribution.
36%40%
544 454 19%
25%
77
53 4% 4%
1,054 625
Dryers Freezers Refrigerators
Visit #1 Visit #2 Visit #1 Visit #2 Visit #1 Visit #2
0%
25%
50%
75%
100%
Visit
Pe
rce
nta
ge
of (E
ver)
Qu
alif
yin
g M
od
els
in
Asso
rtm
en
t
Percentage of
distinct qualified
models
(number of models
in sample)

Con Edison RPP Program Evaluation 2017
16
Table 3-4. Estimated Changes in Qualified Product Sales (from pre-program period to program period)
Product Total PQ Sales Increased PQ Sales Percent Change
Room Air
Conditioners 19,796
727
(+/- 2,361)
3.7%
(+/- 11.9%)
Air Cleaners 6,222 -786
(+/- 884)
-12.6%
(+/- 14.2%)
Sound Bars 3,306 -518
(+/- 614)
-15.7
(+/- 18.6%)
Washers 5,892 -2,522
(+/- 2,709)
-42.8%
(+/- 46.0%)
For the product categories that do not show increases in program-qualified sales, Figure 3-3 shows that the statistical model average fit (the blue line) is very good in the pre-program period, as it was for the products that do show increases in program-qualified sales. But here, the observed sales are not higher than predicted sales in the program period, except for room air conditioners, for which the increase is not statistically significant.
Figure 3-3. Average Modeled Sales for Products Without Estimated Sales Increases: Pre- and Post-Periods
Product assortment data correlate with data findings
The products for which we did not estimate a statistically significant change in sales also did not show increases in the program-qualified model assortment over time, as shown in Figure 3-4. This aligns with the findings for products where we did estimate an increase in sales. Specifically, the shelf assortment analysis shows that:

Chapter 3 FINDINGS
17
Air cleaners, sound bars, and washers had a net decrease in the proportion of qualified models in the shelf assortment.
Room Air conditioners were only assessed during one visit; thus, no longitudinal analysis was possible for this category.
Figure 3-4. Shelf Assortment Surveys: Products Not Showing Increases in Estimated Sales a
a Room air conditioners were not included in this graphic because there was only store visit, and thus no longitudinal analysis was possible.
Overall, there was alignment across data sources about short-term increases in program-qualified sales. For products where we observed increases in program-qualified sales, we also observed an increased or equal percentage of qualified products assorted. For products where we did not observe an increase in program-qualified sales, we observed decreases in the percentage of qualified products assorted.
86%
59%
147
123
19%13%
262
226
26% 24%
592474
Air Cleaners Soundbars Washers
Visit #1 Visit #2 Visit #1 Visit #2 Visit #1 Visit #2
0%
25%
50%
75%
100%
Pe
rcen
tag
e o
f (E
ve
r) Q
ua
lifyin
g
Mod
els
in
Asso
rtm
en
t
Percentage of
distinct qualified
models
(total number of
distinct models in
sample)
Con Edison RPP Program Evaluation 2017
18
3.2 Con Edison’s Program is Operating Consistent with Theory
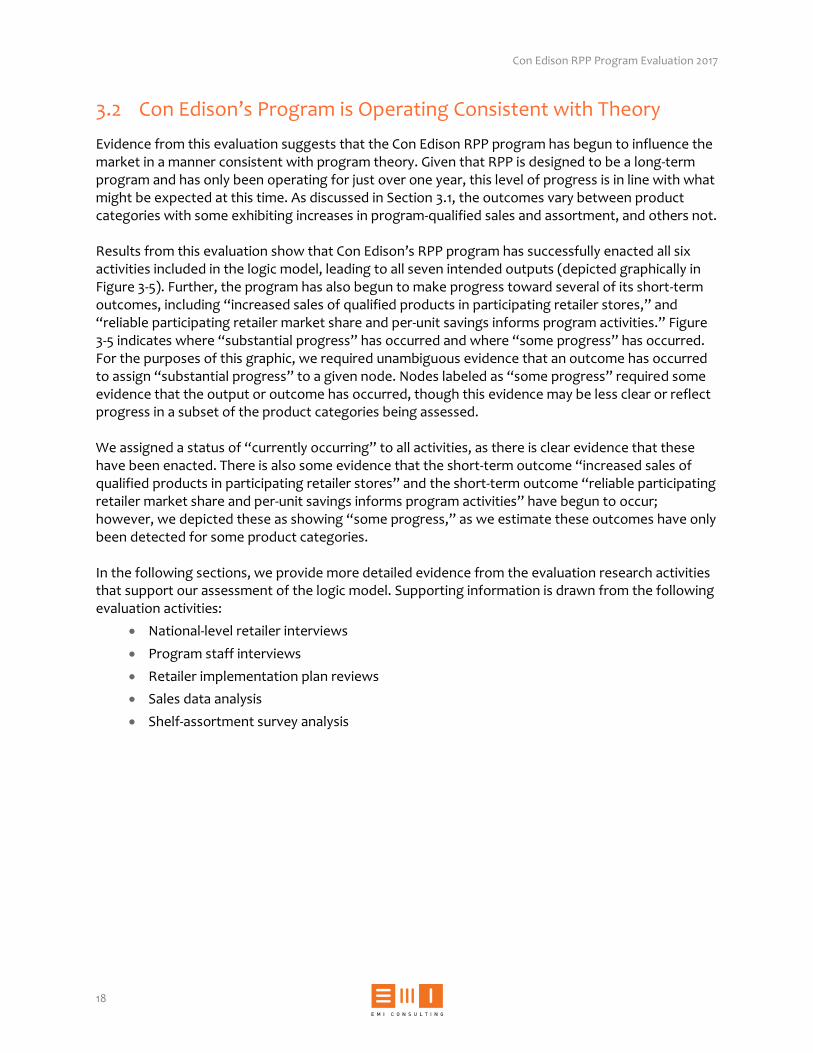
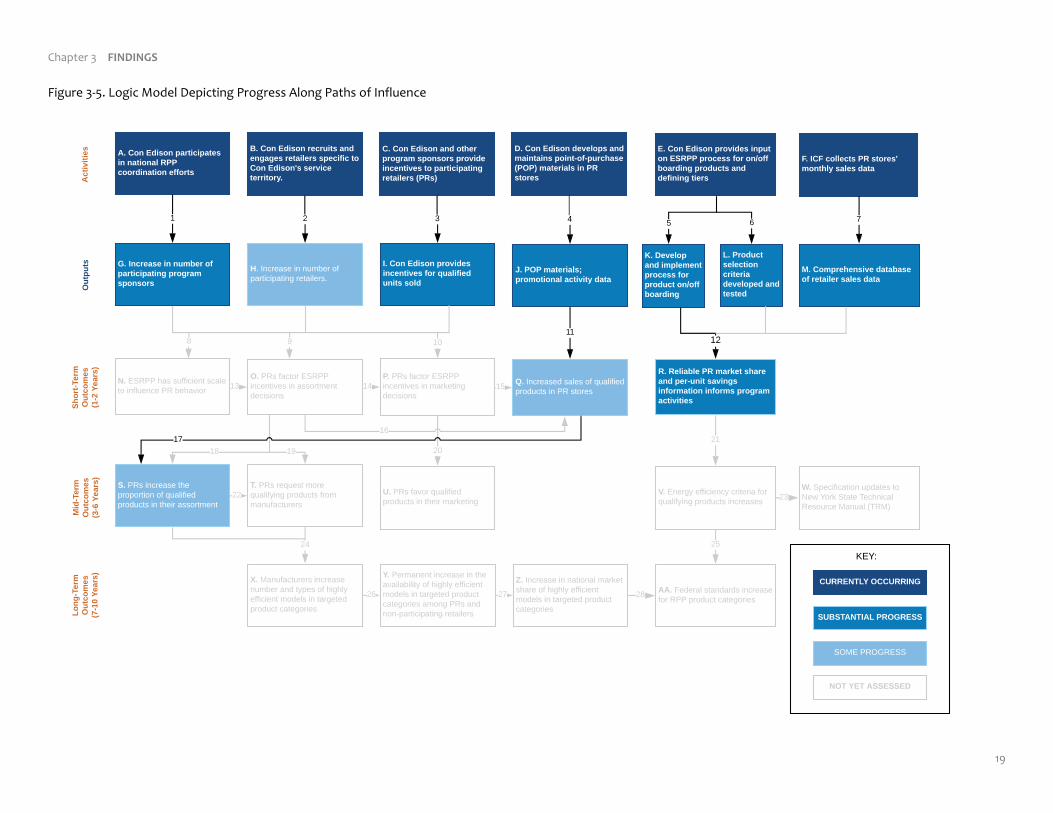
Evidence from this evaluation suggests that the Con Edison RPP program has begun to influence the market in a manner consistent with program theory. Given that RPP is designed to be a long-term program and has only been operating for just over one year, this level of progress is in line with what might be expected at this time. As discussed in Section 3.1, the outcomes vary between product categories with some exhibiting increases in program-qualified sales and assortment, and others not. Results from this evaluation show that Con Edison’s RPP program has successfully enacted all six activities included in the logic model, leading to all seven intended outputs (depicted graphically in Figure 3-5). Further, the program has also begun to make progress toward several of its short-term outcomes, including “increased sales of qualified products in participating retailer stores,” and “reliable participating retailer market share and per-unit savings informs program activities.” Figure 3-5 indicates where “substantial progress” has occurred and where “some progress” has occurred. For the purposes of this graphic, we required unambiguous evidence that an outcome has occurred to assign “substantial progress” to a given node. Nodes labeled as “some progress” required some evidence that the output or outcome has occurred, though this evidence may be less clear or reflect progress in a subset of the product categories being assessed. We assigned a status of “currently occurring” to all activities, as there is clear evidence that these have been enacted. There is also some evidence that the short-term outcome “increased sales of qualified products in participating retailer stores” and the short-term outcome “reliable participating retailer market share and per-unit savings informs program activities” have begun to occur; however, we depicted these as showing “some progress,” as we estimate these outcomes have only been detected for some product categories. In the following sections, we provide more detailed evidence from the evaluation research activities that support our assessment of the logic model. Supporting information is drawn from the following evaluation activities:
National-level retailer interviews
Program staff interviews
Retailer implementation plan reviews
Sales data analysis
Shelf-assortment survey analysis
Chapter 3 FINDINGS
19
Figure 3-5. Logic Model Depicting Progress Along Paths of Influence

Con Edison RPP Program Evaluation 2017
20
3.2.1 Logic Model Activities and Outputs Are Occurring
Evaluation results show that the activities and outputs documented in the Con Edison RPP logic model are occurring as expected under program theory. The supporting evidence for this finding comes mainly from program staff interviews, as well as from EMI Consulting’s review of sales data and POP verification activities. Additional evidence comes from EMI Consulting’s attendance on national ESRPP coordination conference calls.
All logic model activities are currently occurring
The program logic includes coordination among program sponsors to recruit new program sponsors and to determine product qualification guidelines. Evidence for Activity A (“Con Edison participates in national RPP coordination efforts”) occurring comes from program staff interviews and EMI Consulting’s attendance of national RPP meetings. From these, we know that Con Edison is actively participating in ESRPP coordination efforts on an ongoing basis. Con Edison program staff have been involved with decisions about product qualification criteria and the setting of product tiers (Activity E: “Con Edison provides input on ESRPP process for on/off boarding products and defining tiers”) and report being satisfied with that process and its outcomes with respect to product qualification. In particularly, the flexibility to set incentive levels allows Con Edison to tailor some elements of the national program to its specific needs. One element of program logic in Con Edison’s direct purview is the recruitment of regional retailers. Con Edison program staff successfully coordinated with national Program sponsor to enroll the national retailer Lowe’s in the program. Con Edison program staff also report communicating with a regional retailer (P.C. Richard and Son) about joining the RPP program (Activity B: “Con Edison recruits and engages retailers specific to Con Edison's service territory”). Con Edison is paying incentives to participating retailers for the sales of program-qualified units (Activity C), as reported by program and implementer staff involved with this effort. From our analysis of sales data, we know these incentives are tracked in the data portal administered by ICF International (Activity F: “ICF collects PR stores’ monthly sales data”). Program staff reported no major problems with the incentive payment mechanism. Activity D (“Con Edison develops and maintains point-of-purchase (POP) materials in PR stores”) was confirmed by in-store visits that were conducted to track the existence and extent of POP materials and promotional activities taking place. However, program staff reported that retailer in-store operations do not fully align with RPP long-term goals:
In-store field staff reported only one case of retailer marketing targeted at RPP.
They also reported that many sales staff with whom they interacted often lacked engagement in the program, motivation to promote it, or information about it. In-store field staff reported cases of POP materials being removed by store managers, but that those problems were remedied quickly.
All program outputs show progress
All of the outputs in the program logic model are currently being produced at least to some extent. Table 3-5 summarizes the supporting information for outputs G through M.

Chapter 3 FINDINGS
21
Table 3-5. Summary of Evidence: Logic Model Outputs G Through M
Logic Model Component Findings
G. Increase in number of participating program sponsors
National ESRPP program increased from three to eight sponsors from 2016 to in
2018.
H. Increase in number of participating retailers
National ESRPP increased two national retailers from three (Best Buy, The
Home Depot, Sears/Kmart) to five, (adding Nationwide and Lowe’s) between
2016 to 2018. a
Con Edison has not recruited any regional retailers into the program.
I. Con Edison provides incentives for qualified units sold
Through April 2018, Con Edison has paid $669,395 in incentives to retailers in
their service territory.
J. POP materials; promotional activity data
CE subcontractors are placing POP promotional materials on qualifying products
in retailer locations.
K. Develop and implement process for product on/off boarding
Con Edison staff have coordinated with national efforts to bring new products
into the program using an on-boarding process based on discussions between
Program Sponsors.
L. Product selection criteria developed and tested
Con Edison staff have worked to bring new products into the program using
selection criteria in conjunction with national ESRPP efforts based on
discussions between Program Sponsors.
M. Comprehensive database of retailer sales data
This database contains information from retailers on monthly sales data for
each model in RPP product categories. Con Edison has access to this database
via an online portal. Program staff reported that having access to these data is
helpful for program planning purposes.
a In 2018, after the evaluation period ended, Con Edison began working with Lowe’s and stopped working with Nationwide.
3.2.2 Several Short-term Outcomes Are Occurring
Although the program has only been operating for a relatively short period of time, there are some promising early indications from our analysis that short-term outcomes are occurring in some product categories. These include increases in the proportion of program-qualified models in shelf assortment for clothes dryers and freezers, and estimated increases in the sales of program-qualified models for clothes dryers, freezers, and refrigerators. Additionally, program staff interviewed report that the sales data are being used to inform program decisions and activities. Results from the shelf assortment survey analysis and the sales data analyses are in alignment, with the program-qualified sales increases being in the same categories where we observe increased assortment of program-qualified models.
Analysis of shelf assortment data shows estimated increases in assortment for two categories (dryers and freezers). At the same time, we estimate no change in assortment for refrigerators, and estimate decreases for air cleaners, sound bars, and washing machines. Room air conditioners have only one data point and therefore cannot be assessed.
From our analysis of sales data, we estimate statistically significant program-induced increases in sales for three categories (dryers, freezers, and refrigerators).

Con Edison RPP Program Evaluation 2017
22
To tie these two analyses together, Table 3-6 shows a comparison of the estimated sales increases by product, as well as the percentage of sales in the program period from models that had no sales in the pre-program period. With the exception of sound bars, which is a much newer and more quickly changing product category, the product groups that had estimated sales increases also had increases in assortment of qualified models and had the highest proportion of their program sales coming from models not sold during the pre-program period.
Table 3-6. Comparison of Total Percent Change in Assortment and Estimated Sales
Estimated Savings?
Product Percent Change of QP Models in Assortment
Estimated Percent Change in QP Sales
Percent QP Sales from New Models in
Program Period
Yes
Refrigerators 0% 15.1% 13.3%
Freezers +6% 10.8% 14.8%
Dryers +4% 9.9% 23.2%
No
Air Cleaners -27% -12.6% 7.0%
Room Air Conditioners (insufficient data) 3.7% 12.2%
Sound Bars -6% -15.7% 36.0%
Washers -2% -42.8% 7.5%
There is consistency among the different impact analyses (shown below in Table 3-7). A comparison of shelf assortment analysis results and sales data analysis results shows consistency across all product categories, with the exception of refrigerators, for which there was no change in the share of program-qualified models in the shelf assortment data (which is not inconsistent with the estimated increase in program-qualified sales for that category).
Table 3-7. Summary of Program Impacts
Product Category
Increase in Proportion of
Program Qualified Models
(Assortment Data)?
Increased Sales of Program
Qualified Models Due to
Program
(Sales Data)?
Consistent Findings
Between Assortment Data
and Sales Data?
Clothes Dryers
Freezers
Refrigerators (no change)
Air Cleaners x x
Room Air Conditioners x x
Sound bars x x
Clothes Washers x x
Key: = Yes = Partial x = No
Chapter 3 FINDINGS
23
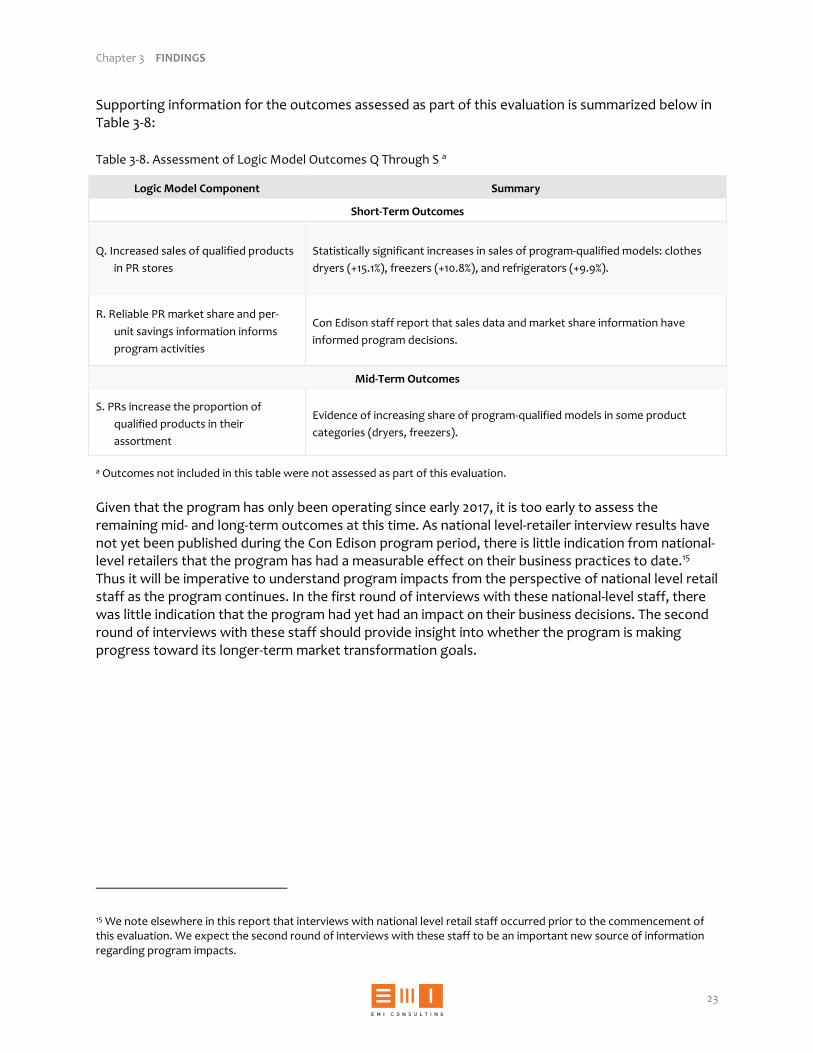
Supporting information for the outcomes assessed as part of this evaluation is summarized below in Table 3-8:
Table 3-8. Assessment of Logic Model Outcomes Q Through S a
Logic Model Component Summary
Short-Term Outcomes
Q. Increased sales of qualified products
in PR stores
Statistically significant increases in sales of program-qualified models: clothes
dryers (+15.1%), freezers (+10.8%), and refrigerators (+9.9%).
R. Reliable PR market share and per-
unit savings information informs
program activities
Con Edison staff report that sales data and market share information have
informed program decisions.
Mid-Term Outcomes
S. PRs increase the proportion of
qualified products in their
assortment
Evidence of increasing share of program-qualified models in some product
categories (dryers, freezers).
a Outcomes not included in this table were not assessed as part of this evaluation.
Given that the program has only been operating since early 2017, it is too early to assess the remaining mid- and long-term outcomes at this time. As national level-retailer interview results have not yet been published during the Con Edison program period, there is little indication from national-level retailers that the program has had a measurable effect on their business practices to date.15 Thus it will be imperative to understand program impacts from the perspective of national level retail staff as the program continues. In the first round of interviews with these national-level staff, there was little indication that the program had yet had an impact on their business decisions. The second round of interviews with these staff should provide insight into whether the program is making progress toward its longer-term market transformation goals.
15 We note elsewhere in this report that interviews with national level retail staff occurred prior to the commencement of this evaluation. We expect the second round of interviews with these staff to be an important new source of information regarding program impacts.

Con Edison RPP Program Evaluation 2017
24
4. SUMMARY AND CONCLUSIONS
In this section, we summarize the findings from this evaluation work and discuss overarching conclusions. The Con Edison RPP pilot program operated in a manner consistent with program theory in its first year of operation. Short and mid-term program activities are occurring as outlined in the program logic model, leading to the expected outputs and several short-term outcomes in some but not all product categories. As the program is designed to be a long-term market transformation program, these results are better than might be expected in such a short timeframe and leave open the possibility that future impacts will be detected in other product categories. The Con Edison RPP program is beginning to influence the market, leading to increases in sales and assortment of program-qualified models for refrigerators, freezers, and dryers. Collectively, these program-induced increases in sales for refrigerators, freezers, and dryers yield a total annual savings of 90,421 kWh and 11.58 kW in 2017. Sales and assortment data do not yet show these effects for other product categories, though this may be because it is too early for the impacts to be detected. As the program continues to operate, the program staff should use updated information from these analyses to understand which products show evidence of program impacts over time and which products may need additional support from program promotional activities. Sales data are an important information source but should not be the only source of information guiding these decisions. Data processing errors threaten the integrity of the sales and savings data in the data portal. The RPP program and evaluations rely on the data portal to identify qualifying products and their sales. Because these data must be matched in complicated ways—and because both incentive payments and evaluation rely heavily on the sales data—problems with these data could lead to incorrect incentive payments and hamper the ability to detect sales trends attributable to the program. Potential problems include incorrect qualification status (e.g. a non-qualified model being treated as qualified), insufficient information for specific models (e.g., unknown efficiency ratings or operating characteristics) and matching inconsistencies (e.g., the same model being assigned to two different bins in different months). Over time, it is likely that additional mistakes will arise as new models enter the data and other changes occur (for example, program requirements change). Because these data processing errors affect not only Con Edison, but all of the Program Sponsors, we recommend Con Edison coordinate with other program sponsors to develop a common set of data QA/QC criteria to facilitate accurate incentive payments and sales trend detection (as described in more detail in Chapter 2). The RPP evaluation requires triangulating multiple data sources to understand the factors and the magnitude of their influence on the market. A key data source for evaluating this program will be the updated national retailer interviews. Results from the second round of interviews with national-level retail staff will be critically important to understand if there is evidence of program impacts at a high level of decision-making, but these results are not yet available. Our analysis of sales data, shelf-assortment data, and other activities is useful in quantifying changes in the market and establishing regional effects of the RPP program. But it is also important to consider any possible effects that are related to decision-making at the national level and to be able to understand the impact of changes

Chapter 4 SUMMARY AND CONCLUSIONS
25
in decision-makes on changes in assortment and sales. Having this information will provide a fuller set of evidence for use in future evaluation.