con charalambou, mark dunford & jake bradley
TRANSCRIPT

AUSTRALIAN EXPSOURE INFORMATION PLATFORM ENHANCEMENT PROJECT
Con Charalambou, Mark Dunford & Jake Bradley
Geoscience Australia

AUSTRALIAN EXPSOURE INFORMATION PLATFORM ENHANCEMENT PROJECT | REPORT NO. 682.2021
1
Version Release history Date
1.0 Initial release of document 14/07/2021
© Bushfire and Natural Hazards CRC 2021
All material in this document, except as identified below, is licensed under the Creative Commons Attribution-Non-Commercial 4.0 International Licence.
Material not licensed under the Creative Commons licence: • Department of Industry, Science, Energy and Resources logo • Cooperative Research Centres Programme logo • Bushfire and Natural Hazards CRC logo • Any other logos • All photographs, graphics and figures
All content not licenced under the Creative Commons licence is all rights reserved. Permission must be sought from the copyright owner to use this material.
Disclaimer: Geoscience Australia and the Bushfire and Natural Hazards CRC advise that the information contained in this publication comprises general statements based on scientific research. The reader is advised and needs to be aware that such information may be incomplete or unable to be used in any specific situation. No reliance or actions must therefore be made on that information without seeking prior expert professional, scientific and technical advice. To the extent permitted by law, Geoscience Australia and the Bushfire and Natural Hazards CRC (including its employees and consultants) exclude all liability to any person for any consequences, including but not limited to all losses, damages, costs, expenses and any other compensation, arising directly or indirectly from using this publication (in part or in whole) and any information or material contained in it.
Publisher: Bushfire and Natural Hazards CRC
July 2021
Citation: Charalambou C, Dunford M & Bradley J (2021) Australian Exposure Information Platform enhancement project, Bushfire and Natural Hazards CRC, Melbourne.
Cover: AEIP landing page.

AUSTRALIAN EXPSOURE INFORMATION PLATFORM ENHANCEMENT PROJECT | REPORT NO. 682.2021
3
TABLE OF CONTENTS
ACKNOWLEDGMENTS 4
EXECUTIVE SUMMARY 5 Context 5 Method 5 Research findings 6 Utilisation 7
END-USER PROJECT IMPACT STATEMENT 8
PRODUCT USER TESTIMONIALS 9
INTRODUCTION 10
BACKGROUND 12
RESEARCH APPROACH 14 Introduction 14 Web map enhancement strategy 14 Dynamic Exposure Dashboard (DED) strategy 15 Stakeholder engagement strategy 16
FINDINGS 17 Stakeholder engagement findings 17 Engagement process 17 Direct feedback regarding the WMA and Exposure Reports 18 Direct feedback regarding the DED 20 Technical findings 21
KEY MILESTONES 24
UTILISATION AND IMPACT 25 Summary 25 Dynamic exposure dashboard utilisation 25 Web Mapping Application utilisation 26
CONCLUSION 29 Next steps 29
PUBLICATIONS LIST 31
TEAM MEMBERS 32 Research team 32 End-Users 32
REFERENCES 35

AUSTRALIAN EXPSOURE INFORMATION PLATFORM ENHANCEMENT PROJECT | REPORT NO. 682.2021
4
ACKNOWLEDGMENTS Geoscience Australia (GA) would like to acknowledge the ongoing support from the Bushfire & Natural Hazards Cooperative Research Centre (CRC) in relation to the Australian Exposure Information Platform (AEIP). Without this support many of the enhancements and opportunities to improve AEIP services and products would not have occurred.
GA also acknowledge the contributions of the agencies and stakeholders who provided information and feedback with respect to the AEIP. Without these contributions and insights the content and relevance of AEIP information would not evolve.
AUSTRALIAN EXPSOURE INFORMATION PLATFORM ENHANCEMENT PROJECT | REPORT NO. 682.2021
5
EXECUTIVE SUMMARY
CONTEXT
The Australian Exposure Information Platform (AEIP) has been utilised for purposes of disaster preparedness, response and recovery since its release in 2018. The AEIP is currently the only service of its kind that can provide the Emergency Management (EM) sector with nationally consistent exposure information, 24/7.
GA and end-users have documented several areas in which the AEIP web mapping application (WMA) can be improved upon. Firstly, the user interface and functionality were improved through the addition of tools allowing users to create Exposure Reports for known geographies (e.g., Local Government Areas), thus allowing persons without spatial expertise greater flexibility when using the WMA.
Secondly, Exposure Reports could initially only be obtained through individual requests and there was limited functionality embedded within the WMA to give end-users the ability to submit multiple reports. Users can now request up to five different exposure report requests in one submission.
Furthermore, while the WMA excels in supplying nationally consistent exposure information, in the form of an exposure report, user’s feedback suggests that there is a need to understand what is exposed in more of a dynamic way to keep paces with evolving and changing information requirements. Hence a complimentary service, accessing the same data, via a Dynamic Exposure Dashboard (DED) for emergency management situational awareness was devleoped.
The AEIP Enhancement Project’s objectives are threefold:
1) Enhance the AEIP WMA to increase accessibility and usability
2) Develop an AEIP DED to provide Emergency responders with a situational awareness tool.
3) Engage stakeholders to understand their use of AEIP information and to guide the enhancements suggested for the WMA, and the features and functionality of the DED
METHOD
GA’s Landscape Information Section (LIS) have approached the issues within AEIP in three interconnected strategies: (1) Web Map Enhancement Strategy, (2) DED Strategy, and (3) Stakeholder Engagement Strategy.
The Web Map Enhancement Strategy involved the project team engaging GA’s Digital Science and Information Section (DiSI) to outline the proposed changes to the existing web mapping functionality. DiSI created the changes in a non-production environment where they could be tested without affecting the current production environment. The non-production environment underwent iterative user testing within GA to ensure any changes are fit for production. DiSI then implement the changes to the production environment. Throughout the

AUSTRALIAN EXPSOURE INFORMATION PLATFORM ENHANCEMENT PROJECT | REPORT NO. 682.2021
6
process, key stakeholders were engaged as part of a feedback cycle into the Stakeholder Engagement Strategy.
The DED Strategy was broken down into numerous technical tasks. Firstly, GA’s enterprise Geographic Information Systems (eGIS) team set up the appropriate environment within the organisations ArcGIS Online Account (AGOL). Secondly, the project team developed a project management plan (PMP) to ensure that all the metadata requirements were met and that all project information was maintained and recorded within GA's electronic catalog system (eCat) Thirdly, the project team iteratively develop the DED and liaised with stakeholders through to the beta product release in June 2021.
The Stakeholder Engagement Strategy iteratively looped back into the aforementioned strategies to ensure that the project teams’ actions were the result of stakeholder input. Firstly, the project team defined the stakeholders through sampling AEIPs current user base. Secondly, stakeholders were engaged through a mixture of qualitative (video conferencing and in-person meetings/showcases) and quantitative (on-line survey) methods. Thirdly, feedback and responses were implemented into the development of either Web Map Enhancement Strategy or DED Strategy. Lastly, stakeholders were reengaged through qualitative means to assess the project team’s development actions.
RESEARCH FINDINGS
The project team had mixed responses surrounding the engagement of AEIP stakeholders. Qualitative means of engagement gave a higher response rate with more actionable feedback. Engagements through quantitative methods, such as the online survey proved less effective, with 13 responses from a potential 700-person audience. Many or the respondents are members of the Emergency Management Spatial Information Network (EMSINA) or work in state emergency services – primarily agencies that already use AEIP products and understand the value it adds to their business or operational needs. A key finding amongst stakeholders was that the AEIP data is not used uniformly; the range of uses include planning purposes, at-a-glance information during hazard events, comparative analysis, integration into other products/documents, estimates, and recovery and planning. Consistent across many of the stakeholders was the predilection to use on the ground information relayed from first responders over AEIP data, and that Emergency Service Agencies (ESA) are also hesitant in using AEIP data as they preferred, and were more familiar with, data within their own and often-bespoke platforms. Research findings also suggest that a significant barrier to ESAs using AEIP services is lack of awareness of the product, rather than the product not being fit for purpose. Other findings from stakeholders surrounding the WMA and Exposure Report are that health-related data would be a worthwhile inclusion (such as the number of beds in hospitals, rooms in respite centres, the number of general practitioners, chemists, and other medical related information). This largely a response to the need for infrastructure information in relation to COVID-19.

AUSTRALIAN EXPSOURE INFORMATION PLATFORM ENHANCEMENT PROJECT | REPORT NO. 682.2021
7
Research findings showed that ESAs primarily view the DED as a situational awareness tool for use in situation and planning rooms. As a result, stakeholders value the ability to add their own spatial data to the DED, include the DED within their own (ESRI based) portals and hubs, and the ability to access the data behind the DED for use in their own applications. Further findings from engagements with stakeholders indicated that concerns over data accuracy and currency exist. As this finding largely relates to AEIP data, it reemphasises the need for stakeholders to be made aware of AEIP, its data and capabilities.
UTILISATION
Since its launch in 2018 usage of the AEIP WMA has been steadily increasing month on month. Most uses come from state-based agencies using Application Program Interface (API) keys which allow AEIP information to be integrated into their applications. Usage peaks during both short-term events (Tropical Cyclone Seroja, 2021) and medium-term events (Black Summer), where the service has proven reliable and stable. Usage outside of events is primarily for preparedness and planning purposes.
In May of 2021, the federal government announced the Australian Climate Service (ACS), a collaboration between the Bureau of Meteorology, the CSIRO, ABS and Geoscience Australia to help better anticipate, manage and adapt to climate impacts now and in the future. NEXIS and the AEIP have been identified as important components of the ACS and the next steps for the AEIP will be aimed at integrating revised data into all AEIP services; WMA, DED and GA’s data download services.
Providing DED users the ability to add their own data into the mapping pane of the DED is also an important next step as this would provide a richer user experience and increase the capability of the DED as a situational awareness tool during disasters.
Positioning the AEIP in the landscape of emergency management tools and products is an on-going task. Investigating options to integrate the WMA and DED into a single user-experience that can be accessed from the same application, preferably via on online hub or portal, is seen as an important step in marketing and maintaining the longevity of the AEIP in the emergency management sector.

AUSTRALIAN EXPSOURE INFORMATION PLATFORM ENHANCEMENT PROJECT | REPORT NO. 682.2021
8
END-USER PROJECT IMPACT STATEMENT
Steve Gray, Hazard Intelligence and Risk Department, Department of Fire and Emergency Services, WA
During Cyclone Veronica (March 2019), we were able to use AEIP to understand exposures in the towns in the Pilbara that were under threat. This enabled us to determine vulnerabilities in structures and populations. It enabled recovery coordination to have an appreciation of the reconstruction values if Cyclone Veronica had impacted any of these coastal communities. It has also been very useful with conducting risks assessment for multiple hazards and assisting with long-term capability analysis. Our Community Preparedness Branch now uses AEIP for identifying vulnerable communities and to consider broader demographics towards tailoring the type of community engagement they apply.

AUSTRALIAN EXPSOURE INFORMATION PLATFORM ENHANCEMENT PROJECT | REPORT NO. 682.2021
9
PRODUCT USER TESTIMONIALS
Meaghan Jenkins, Predictive Services, New South Wales Rural Fire Service, NSW
The Australian Fire Danger Rating System (AFDRS) Program aims to design, develop and implement a national system to better describe the overall fire danger and risk to the community, and assist preparedness and decision making of fire and land management agencies. The initial focus of the AFDRS program was to improve the accuracy and utility of fire danger ratings based on fire behaviour modelling. The current phase of the Program has moved to the operational build of the Fire Behaviour Index (FBI), and expanded its scope to include additional indices:
• Ignition index: likelihood and ease of ignition from natural and human sources,
• Suppression index: likelihood of initial attack success and resource capacity being exceeded,
• Impact index: likelihood of impact on assets, focusing on loss of life and the built environment.
The impact index will assess the likelihood that a fire with the potential to impact on values such as lives, property, critical infrastructure, industry and agriculture, the environment and cultural values may occur. Over the 2020/21 fire season the AFDRS ISI project team at NSW Rural Fire Service (RFS) would like to test the inclusion of selected variables from the National Exposure Information System (NEXIS) in the impact index modelling for the AFDRS. NEXIS data will be provided at a 1.5km grid cells, (3.8 million) across Australia. By gaining access to the NEXIS data, NSW RFS will be able to develop models that support fire and land management in the fuel types and climates of each state and territory. Assuming the models meet end-user requirements, Geoscience Australia, the AFDRS program, and NSW RFS will work together to explore how to best integrate NEXIS data and the AFDRS to provide a sustainable national product.

AUSTRALIAN EXPSOURE INFORMATION PLATFORM ENHANCEMENT PROJECT | REPORT NO. 682.2021
10
INTRODUCTION
The AEIP Enhancement Project can be broadly categorised into three primary objectives. Firstly, improvements to the existing Australian Exposure Information Platform (AEIP) web mapping application (WMA) through enhancements to the user experience and existing functionality, and second, development of an ‘Dynamic Exposure Dashboard’(DED).
The above objectives are technical outputs, both underpinned by the third objective which is targeted engagement with representatives from commonwealth and state governments and the private sector to inform the methods used to both improve the existing functionality of the AEIP and underpin the form and function of the DED. The engagement tasks will involve dialog with participating agencies and virtual interaction with the products part way through their respective developments, to gauge response, to outline change and product alignment to provide the best possible outcome for end-users.
The initial engagement will be focused on bringing targeted state and territories Emergency Management (EM) stakeholders up to a consistent understanding of NEXIS and AEIP. Engagement will provide:
• Initial engagement (showcase/roadshow) o a brief demonstration on the AEIP current capability, including
enhancement implemented after the initial release, o an understanding of the proposed enhancements o present use case examples
• Targeted engagement o Strengthen existing relationships, WA, NSW RFS – Cerberus:
Ensemble Fire Simulator o New use cases (ADRFS) o Expand AEIP user base o Data supply chains o Emerging end-user requirements o National emergency management planning and recovery
The intent of engagement with respect to improving the existing AEIP functionality includes:
• identify improvements and changes than can be made to the WMA, • identify methods allowing users to create and receive reports, for known
geographic boundaries, in a seamless manner, • Identify and discuss new data sets that would provide more context for
emergency management preparedness and response, • Implement the functional changes by the end of the 2020-21 fiscal year.
The intent of engagement with respect to the DED is to create a beta version and demonstrate it to stakeholders to:
• gauge the potential for the DED and its future worth (i.e., is it a desirable product? Is it worth developing/investing in?),

AUSTRALIAN EXPSOURE INFORMATION PLATFORM ENHANCEMENT PROJECT | REPORT NO. 682.2021
11
• determine the types of settings and use cases where the DED may have impact,
• determine the functionality of the product, • understand user requirements that eventually would move from Beta to
production, • demonstrate the linkages between the AEIP, the static nature of data
available via the current GA Exposure Reports and the dynamic nature of data available via the DED.

AUSTRALIAN EXPSOURE INFORMATION PLATFORM ENHANCEMENT PROJECT | REPORT NO. 682.2021
12
BACKGROUND
In 2002, Geoscience Australia (GA) began the development of the National Exposure Information System (NEXIS) project, in response to the Council of Australian Governments reform commitment on Australia’s ability to manage natural disasters and other emergencies. NEXIS provides comprehensive and nationally consistent exposure information to enable users to understand the elements at risk. Exposure information is produced by sourcing the best publicly available information, including statistics, spatial and survey data, such as demographics, building, business, agriculture, institutions, infrastructure, and environmental elements.
Since 2012, GA has been providing support and advice to the insurance sector, as well as local, state and government agencies, industries, and universities. In 2013, GA led a three-year research project in collaboration with the University of Melbourne and the University of Canberra, supported by the Bushfire and Natural Hazard Cooperative Research Centre (CRC), to create guidelines for nationally consistent and comprehensive information for an Australian Natural Hazard Exposure Information Framework. The objective was to identify and fully describe the collective views of data managers, researchers, and end-users on the exposure information element to meet the needs of the emergency management sector.
It has been over ten years since GA published the first residential buildings exposure dataset. Maintaining this dataset and expanding to meet end-user requirements such as agriculture, business and environmental exposure was achieved by centralising data for processing and product creation on an annual production cycle. This approach incurred an increasing and unsustainable level of technical debt inhibiting further development to meet the ongoing needs of stakeholders, most importantly - accessibility. In response, GA redesigned the processing and delivery of the NEXIS to develop the AEIP 'self-service' platform, increasing flexibility and broadening user access.
With support from the CRC in 2018, GA began development of a publicly assessable delivery platform to access nationally consistent exposure information – one that provided easy access to a robust, reliable, and operational system. The platform needed to be easily accessed and simple to use for disaster preparedness, planning, response, and recovery, at all levels of government, industry, and research to customise and meet individual area of interest requirements. In October 2018, GA launched the Australian Exposure Information Platform (AEIP), Beta release, providing access to nationally consistent exposure information to support decision makers in understanding who or what is exposed, to any hazard, anywhere across the country.
The success of the AEIP is demonstrated by the substantial number of on-demand user-generated exposure reports over the 2019/20 Black Summer period, when compared with previous year’s requests. The AEIP is a significant milestone in GA's efforts to deliver exposure information to stakeholders. It not only sets the foundation to access exposure information, but it also provides the platform to collaboratively improve the content and quality into the future. The benefits of

AUSTRALIAN EXPSOURE INFORMATION PLATFORM ENHANCEMENT PROJECT | REPORT NO. 682.2021
13
this approach are many and will lead to a better understanding of our evolving exposure to future natural hazards and a changing climate.
AEIP has been in use for over two years, over this time, through regular feedback from end-users several enhancements have been identified that can be made to the AEIP user experience. With support from the CRC in 2020, GA will be extending the functionality of the existing web mapping interface to include new features and functionality, in addition to developing a dynamic exposure dashboard concept.
AUSTRALIAN EXPSOURE INFORMATION PLATFORM ENHANCEMENT PROJECT | REPORT NO. 682.2021
14
RESEARCH APPROACH
INTRODUCTION
The strategic direction of the AEIP Enhancement Project is focused on the technical products of the project, which based on stakeholder engagement and feedback, aim to provide increased flexibility for AEIP end-users and assist emergency managers, planners, and other professionals to make better informed decisions. Input and feedback from stakeholders will also have a specific strategy, feeding into the project’s final products.
The over-arching strategy is twofold, defined by the major technical projects; enhancements to the existing WMA and creation of the DED. Each is a separate technical activity and will be undertaken by different sections within GA. Overall coordination of the two projects will be managed by the Landscape Information Section (LIS).
WEB MAP ENHANCEMENT STRATEGY
With the AEIP exposure platform web mapping capability has now been in service for over two years, GA has already received lots of stakeholder feedback indicating improvements that could be made. Additionally, GA has also discussed (in-house) functionality improvements for future versions of the product. A primary suggestion in all feedback has been the ability to submit requests for multiple exposure reports in batch format (i.e., submit numerous requests in one action rather than one request only). The strategy to implement the batching functionality is outlined below.
The project team engaged GA’s Digital Science and Information Section (DiSI) to outline the proposed changes to the existing web mapping functionality. The project team submitted ideas (via discussion, written text and illustrations) to DiSI, to visually outline the required changes, and created a document formalising the proposed changes.
DiSI created the changes in a non-production environment where they could be tested without affecting the current production environment. The non-production environment underwent iterative user testing within GA until bugs and functionality issues were resolved. Where possible, the proposed changes were demonstrated to key stakeholders during online meetings. If the changes cannot be visually demonstrated this will be substituted by discussions outlining the changes.
DiSI will then implement the changes to the production environment, which is an almost instantaneous process.
Production environment updates were communicated to key stakeholders via email, through presentations, the end-user workshop and via notifications in the AEIP User Forum.

AUSTRALIAN EXPSOURE INFORMATION PLATFORM ENHANCEMENT PROJECT | REPORT NO. 682.2021
15
DYNAMIC EXPOSURE DASHBOARD (DED) STRATEGY
The strategy for the DED can be broken up into numerous technical tasks and the task of stakeholder consultation. Outlining the numerous technical tasks in detail is beyond the scope of this document however the phases of work, described at high level, are summarised in the paragraphs below.
Phase One
• The first phase of the DED strategy was to establish outwardly facing ArcGIS Online Account (AGOL) within GA. This required coordination with the enterprise Geographic Information Systems (eGIS) team and several other sections within GA. The AGOL account enabled:
• individuals and agencies outside of GA to be able to view the DED via controlled user groups,
• project members to work in a centralised environment, • a centrally managed repository of data and associated files, and, • various AGOL products to be created, examined, tested and
managed.
eGIS, with the assistance of ESRI, coordinated the primary task of establishing the outward facing AGOL account by seeking feedback from the various sections within GA and developing use cases to establish the best practice for GA. This included:
• establishing the software and a governance model for use within GA,
• creating internal AEIP user groups to manage the DED data store, web maps, web mapping applications and dashboards created during the testing and development phase,
• testing of data uploads from the GA network and establishing a best practice for data maintenance and curation.
Phase Two
The second phase of the strategy was to create a GA project management plan which encompassed all products created. This required liaising with GA's projects and data section to ensure that all metadata requirements were met and that all project information was maintained and recorded within GA's electronic catalog system (eCat).
Phase Three
The third phase of the strategy was for the project team to create one or more AGOL products, explore functionality and limitations, which underwent iterations until ready to be demonstrated to stakeholders. The products included various functions and represent different approaches to the representation of exposure data (outlining the aspects of the work is irrelevant in the scope of the overarching strategy documentation because the work was highly detailed and

AUSTRALIAN EXPSOURE INFORMATION PLATFORM ENHANCEMENT PROJECT | REPORT NO. 682.2021
16
technical). This phase ensured that all GA permission for the release of products is in place and were approved by the appropriate internal GA delegates.
Phase Four
The fourth phase of this strategy was to engage internal GA stakeholders to determine if the DEDs met requirements, what functionality was preferred and even whether there was a need for the DED capability in the first instance. This included demonstrating the DEDs during meetings and allowing the internal stakeholders to use the DEDs firsthand via the Internet. This enabled the Landscape Information Section to further refine the DEDs presentation and functionality before inviting external stakeholders to comment.
Phase Five
The fifth phase of this strategy was to engage external stakeholders via online conferencing, over the phone and face to face where possible. External stakeholders were engaged on a sector-by-sector basis. Feedback was used to iteratively refine the DED options, presentation and functionality of the final product.
The final phase was to publicly release the beta version of the DED. Timelines for the beta release was scheduled for the 30 June 2021.
STAKEHOLDER ENGAGEMENT STRATEGY
This strategy commenced with a brainstorming session amongst the project members. The session identified key users (derived from the AEIP user monthly reports) of AEIP by sector and type of reports generated. The session also involved creating numerous queries to ask of key users; the queries were broken into categories based on user experience, business needs, report usage, data/information usage, perceived improvements and other categories which may arise during the session. The queries were categorised into groups based on whether they could be used during telephone conversations, online survey, online virtual meetings or face-to-face.
The user reports to date indicate that the private sector uses AEIP less than government agencies. The smaller number of users makes was a good base from which to begin demonstrating the DED and seeking feedback. This enabled the team to identify strengths and weaknesses within the type of questions posed to the respondents that then were applied to the government users.
The next phase of engagement targeted the heaviest users of AEIP, primarily state and federal government agencies that potentially use AEIP in real-time, such as state emergency centres. Engagement occurred via scheduled online meetings.
The feedback collated from all stakeholders was used to guide and improve the desired functionality in the DED. The project team applied changes to the DED in an evolving and progressive manner.

AUSTRALIAN EXPSOURE INFORMATION PLATFORM ENHANCEMENT PROJECT | REPORT NO. 682.2021
17
FINDINGS
STAKEHOLDER ENGAGEMENT FINDINGS
Of the agencies and individuals contacted the invitation was usually accepted by those that have previously engaged directly (telephone, email, face to face) with the project team members. Many or the respondents are members of the Emergency Management Spatial Information Network (EMSINA) or work in state emergency services – primarily agencies that already use AEIP products and understand the value it adds to their business or operational needs.
Several state agencies whom regularly used the AEIP since its launch in 2018 (based on user statistics) were contacted to participate in engagement activities however the acceptance was limited. This, in addition to the low survey response rate (13 responses from a potential 700-person audience) indicates that many AEIP users are content with the information they have access to.
Another reason for the lack of engagement is due to the centralisation of services within agencies; individuals feel it is somebody else’s responsibility to deal with AEIP matters. For example, rather than individuals creating Exposure Reports several state agencies connect to the AEIP via an Application Program Interface (API) Key and disseminate AEIP information throughout the agency via emails. In examples like this, people bypass the opportunity to engage the project team because of the over-arching controls within the agency leading them to believe it is not their role or position to engage the project team.
ENGAGEMENT PROCESS
Stakeholder engagement was primarily conducted via:
• The project team engaging agencies via online video conferencing while: • demonstrating development versions of the DED, and, • discussing the proposed changes to the WMA and gathering
information on what other data features would be of value, • An online user survey , • Internal engagement between the project team and GA’s
Communications team surrounding user experience and corporate branding of the DED, and,
• Several face-to-face demonstrations of the DED, primarily to members of the Australia Geospatial-Intelligence Organisation visiting GA.
The initial stage of each engagement focused on understanding how stakeholders use AEIP information: under what circumstances, how and when, and which parts of the Exposure Report were most valuable. The second part focused on outlining the proposed changes to the WMA (batch processing and automated report creation for known geographies) and gathering feedback on which geographies would be of most value.
AUSTRALIAN EXPSOURE INFORMATION PLATFORM ENHANCEMENT PROJECT | REPORT NO. 682.2021
18
The latter part of consultations focused on demonstrating development versions of the DED: explaining to stakeholders what the service would be offering, gathering feedback on functionality, inclusions, layout, and presentation.
What follows are the primary findings from those consultations.
DIRECT FEEDBACK REGARDING THE WMA AND EXPOSURE REPORTS
Exposure Report usage
A key finding amongst stakeholders was that Exposure Reports are used as a reference tool in several ways and no two agencies appear to use Exposure Reports for identical purposes. The range of uses include:
• planning purposes - using the information to assist in deciding where to place emergency services infrastructure (these are based on studies and include a wealth of additional data and modelling methods, not just AEIP data)
• at-a-glance information during hazard events – identifying the range of assets and infrastructure, persons and dwellings that could be affected and in turn helping to inform decision makers about what should be protected and the type of resources that may be required for the protection/safety of the aforementioned,
• comparatives – several agencies produce data and reports to inform planning and resourcing exercises that contain similar information to the Exposure Report; they use the Exposure Reports to validate their findings and identify topics or themes for gap analysis,
• Integration into other products/documents – some agencies cut and paste the Exposure Report into other documents which are subsequently circulated within their agencies. This occurs both during hazard events and in times of relative quiet,
• estimates – insurance agencies use the building and dwelling information to gather intelligence on reconstruction values, not as benchmark values but to gauge values in each area or scenario,
• hazard events - used in an operational sense for the high-level understanding of the environment/factors surrounding a disaster, with some in house coordination based on the understanding of the situation and potential risk to the greater community should the event escalate in size or duration.
• recovery and planning - to assist with the evaluation of disaster relief funding.
Another important finding was what Exposure Reports are not used for. Among emergency services agencies there was a strong consensus that during emergency situations consistency in data across their platforms is a key reason for using in-house applications as opposed to AEIP data. It means that all the agency is referring to and using the same information. This does not mean that AEIP is not trusted – but that their in-house applications and communications are well established and follow standard operating procedures (SOPs).

AUSTRALIAN EXPSOURE INFORMATION PLATFORM ENHANCEMENT PROJECT | REPORT NO. 682.2021
19
During the consultations, several other findings were consistent amongst stakeholders:
• AEIP data is compared to other available data, partly for comparative verification purposes (i.e., if the results from several sources indicate a feature exists then there is greater confidence that the feature or asset does exist)
• AEIP is used because other information sources have clear gaps or do not provide the same level and breadth of information,
• Even where AEIP data is more comprehensive than data available within an agency there is still a higher (operational) reliance on in-agency data primarily because that data can be integrated with their operational systems,
• During an event, agencies will prefer on-the-ground information relayed from first-responders or well trusted local sources, over AEIP information,
• Agencies are unaware how other agencies within their state, or equivalent interstate agencies use AEIP information,
• Many are still unfamiliar with the AEIP Product Description, • A worthwhile inclusion would be to create a Health subheading in the
Exposure Report showing the number of beds in hospitals, rooms in respite centres, the number of general practitioners, chemists, and other medical related information, and,
• Inclusion of seasonal population estimates (e.g., holiday periods) that could be used to help inform the coordination and planning associated with evacuation events.
Web Mapping Application use
Most stakeholders indicated that the WMA was easy to use and was very stable. Of note was that the map window is not flooded with spatial layers (as opposed to other applications) and that the drawing tools are easy to use. The existing functionality within the WMA was considered sufficient.
Conversation relating to the addition of pick list and the automated selection of known geographies confirmed that most considered that Local Government Areas, Postcode and Suburbs would be most valuable and relevant. The primary drivers behind this core selection of data sets were that they aligned with the reporting needs of the various jurisdictions.
For state emergency service agencies, the inclusion of Statistical Area 1 (SA1) and Statistical Area 2 (SA2) boundaries were not perceived as a priority. Contrastingly agencies that used Exposure Reports for long-term analysis and research purposes indicated SA1 and SA2 boundaries held more importance.
Discussion with CRC representatives also lead to the inclusion of River Catchments boundaries to the pick lists and given GA’s history of creating reports annually for the EMA’s Crisis Coordination Centre, Fire Forecast Districts were also included in the pick lists.
One of the more interesting findings was that Queensland Fire and Emergency Services (QFES) wanted the ability to extract historical AEIP data to assist them

AUSTRALIAN EXPSOURE INFORMATION PLATFORM ENHANCEMENT PROJECT | REPORT NO. 682.2021
20
with longitudinal analysis of temporally changing exposure information. Broadly, this relates to the planning of fire and emergency services infrastructure and how temporally changing exposure translates to current vulnerability. While this made for an interesting discussion, it would involve considerable overhead and would not be possible given the current AEIP data and WMA.
DIRECT FEEDBACK REGARDING THE DED
Stakeholder consultations throughout the development phase of the DED indicated that the DED would be useful tool alongside the existing WMA. Both federal and state government stakeholders indicated the DED would be a useful situation awareness tool. In terms of using the DED clear divisions arose between federal agencies primarily responsible for planning, financial recovery and relief, and state agencies engaged in operations during a hazard.
For federal agencies, the DED would be used as a planning and information resource, as a single point of truth across numerous agencies to coordinate and consult simultaneously while understand the magnitude of dwellings, businesses and persons that could be affected by a hazard.
Consultations with stakeholders from state emergency services primarily involved with on-ground response and planning efforts indicated the DED would be a useful addition to planning rooms and ‘situation’ rooms, but unlikely to replace existing platforms or software as they are incumbent in their current operations.
Of considerable note and a repetitive message recurring in all consultations was the:
• Level of trust that stakeholders could put into the DED: these conservations indicated that for the DED to be a valuable and reliable resource during events, the DED would need to be operational 24/7 and available to all levels of government as opposed to select users within an organisation. These concerns have been met by making the DED publicly available via the Internet.
• Consistency with state data and or existing AEIP data: the latter point is covered in that the WMA and the DED use the same (NEXIS) source data, albeit modified to meet the requirements of each application. Because NEXIS is based on nationally consistent data, a data set which exist in one state only is deemed unacceptable for use in NEXIS. Stakeholders were informed that consistency with state data is an ongoing issue for all parties but in the coming years the Foundation Data Project (FDP) within GA will aim to collate and synthesise data from all states. The outputs of the FDP will flow into NEXIS meaning that most of the data either visible or used in AEIP products will (eventually) be consistent with state data.
• Ease of use: stakeholders indicated that the DED must be simple to use for non-spatial professionals, but also simple in terms of its navigation, legible and provide relevant information. Based on feedback the project team made numerous revisions throughout the development process to improve all aspects of the DED, with

AUSTRALIAN EXPSOURE INFORMATION PLATFORM ENHANCEMENT PROJECT | REPORT NO. 682.2021
21
considerable emphasis on legibility, acknowledging aspects such as colour blindness, text sizes and font types.
• The ability to access or use data available in the DED: many stakeholders questioned whether the data used in the DED would be available to them, for use in their own systems. While the data cannot be directly downloaded or exported from within the DED, these conversations led to the creation of an ‘About & Metadata’ section in the DED that outlines the available data sources, including links to the metadata, the data itself and the overarching AEIP Product Description which outlines how values in the DED, and Exposure Reports are calculated.
• The ability to add their own spatial data to the DED and view exposure information relative to their data: all stakeholders indicated that this was a desirable functionality that would have great benefits during hazard events. The DED however was designed to replicate the information in the WMA but present it in a different manner - stakeholders were advised that such functionality would be coming in future if the beta DED proved successful. Stakeholders were also informed that the beta release would be used to gather feedback and make this functionality available in a manner that was easy to use/include, capable of supporting the requirements from a broad user base, not just emergency management users.
• Inclusion in their own (ESRI based) portals and hubs: in the emergency management sector the ability of all levels of government to intertwine applications is becoming easier with the advent of ESRI Hubs. The DED however is in its infancy and stakeholders recognised this. While the question of integration was posed there was also trepidation associated with using a new service, one that did not align with internal operational requirements or was not yet trusted. Regardless, the DED will be publicly available and if agencies wished to include it in their portals or hubs, it can be accessed via hyperlinks.
TECHNICAL FINDINGS
Software limitations During the formative stages, the project team experimented with the creation of dashboards using both AGOL Dashboards and AGOL Web Mapping Applications. This included understanding the end-to-end data workflows (required to update, maintain, display, access and visualise data), dashboard visualisations, tool usage, ease of use, user interaction and reporting or export functions (or lack thereof).
The Web Mapping Application was initially favored because it includes a ‘Situational Awareness’ widget that permits users to draw an area of interest and return information related to the area. Unfortunately, the reporting tools associated with the widget are cumbersome; users must scroll through numerous

AUSTRALIAN EXPSOURE INFORMATION PLATFORM ENHANCEMENT PROJECT | REPORT NO. 682.2021
22
small menus and tabs to view information rather than see at-a-glance information (vital in emergency situations). Secondly, the Web Mapping Application allowed users to directly download/export data which, due to licensing restrictions, should not be accessible. The reporting functions associated with the Web Mapping Application are not easily customised for end-users, and the project team could not modify or create reporting templates that would be consistent with other AEIP products (e.g., the Exposure Report).
Although the AGOL Dashboard functions do not include a reporting/export function, or the inclusion of a situational awareness widget, the AGOL Dashboard option emerged as the preferred option because it could be modified to behave and return information that users could plainly see and understand. It was also found to be scalable, both in terms of behind the scenes editing and adding or removing components in response to (future) user needs.
Data issues The data associated with the AEIP leading to the creation of Exposure Reports includes approximately 20million individual records and numerous unrelated or unmatched schemas. Clearly and easily displaying all this data in a digital map is exceedingly difficult and creates a large maintenance overhead. Due to the volume of data being queried in the project team found that preliminary dashboards were slow and or unresponsive.
Most of this could be attributed to having included all data schemas. Revisions to the data were undertaken to include only the schema and attributes required to populate the information components of the DED but despite this performance continued to be slow which prompted further investigations and tests.
Through iterative processes the project team found that merging numerous data sets into a single data set, and in the case of the NEXIS building data splitting it into “data themes”, provided the best user experience. Additionally, the schemas were stripped to the bare minimum. The negative side of this performance improvement is the creation of yet more AEIP related data sets (accessing the exact same source data as the WMA is not possible due to software and data format incompatibility).
Exposure theme exclusions AGOL Dashboards permit the selection of map features both from within the map itself and from menus or list displaying data, for example a list of Local Government Areas. In relation to polygonal features like Suburbs or Local Government Areas, the in-built AGOL selection method returns all the features within the polygon in addition to features that either intersect or touch the outside of the polygon. There is no function with AGOL Dashboards to change or override this selection behaviour.
This posed a problem because the length of lineal features (e.g., roads, railway) and the area associated with polygonal features (e.g., Agriculture or Environment) were grossly over estimated. The methods used to derive calculations in the DED and the WMA web differ because of the query methods

AUSTRALIAN EXPSOURE INFORMATION PLATFORM ENHANCEMENT PROJECT | REPORT NO. 682.2021
23
available within the respective software. In the WMA linear features are clipped to the area of interest and summed to reveal the full length of all (like) features within the area. The DED performs an intersect function resulting in lines within the area of interest and those touching the outside of the area of interest to be included in the summed result. As such the lengths of linear infrastructure reported in the DED will be greater than the WMA. Within the DED linear features have been segmented into 200m lengths to limit over estimations of linear infrastructure.
For similar reasons outlined above (clipping versus intersection methods) all attempts to replicate the outputs of the WMA resulted in gross over-estimations of agricultural and environmental exposure, both in terms of dollar values and land area calculations.
Based on the misleading results a decision was made to exclude the Environment and Agriculture themes from the DED.
e Agricultural E

AUSTRALIAN EXPSOURE INFORMATION PLATFORM ENHANCEMENT PROJECT | REPORT NO. 682.2021
24
KEY MILESTONES The key milestones for the enhancement project are outlined in Table1. The milestones align with the quarterly reporting schedule and financial payment schedule. These are considered the broad milestones and during the product creation and stakeholder engagement processes there were many small tasks that acted as markers for the project team.
Milestone Deliverable Due date
2020-21 Quarter 1 (Jun-Sep)
1.1.1 Detailed project plan 30-Sep-20
1.1.2 Detailed use cases and engagement opportunities expanded in project plan. 30-Sep-20
1.1.3 Quarterly report 30-Sep-20
2020-21 Quarter 2 (Oct-Dec)
1.2.1 Draft report – outlining existing and new use cases, opportunities, and actions. 31-Dec-20
1.2.2 Quarterly report 31-Dec-20
2021-22 Quarter 3 (Jan-Mar)
1.3.1 Dynamic Exposure Dashboard (Beta) presented and piloted by targeted uses to gain feedback. 31-Mar-21
1.3.2 Select AOI from existing geographies (Beta) presented and piloted by targeted uses to gain feedback. 31-Mar-21
1.3.3 Quarterly report 31-Mar-21
2021-22 Quarter 4 (Apr-Jun)
1.4.1 CRC Hazard Note
1.4.2 Utilisation project poster (AFAC 2021)
1.4.3 Dynamic Exposure Dashboard available via the AEIP landing page, assessable to all users. 30-Jun-21
1.4.4 Select AOI from existing geographies functionally and batching. 30-Jun-21
1.4.5 End-user workshop demonstrating new Exposure Dashboard and new AEIP functionality. 30-Jun-21
1.4.6 Quarterly report. 30-Jun-21
TABLE 1. PROJECT SCHEDULE

AUSTRALIAN EXPSOURE INFORMATION PLATFORM ENHANCEMENT PROJECT | REPORT NO. 682.2021
25
UTILISATION AND IMPACT
SUMMARY
Since its launch in 2018 the AEIP web mapping application has had a positive impact on the emergency management sector through the provision of exposure data. Usage has continued to grow, generally peaking during large scale hazard events as demonstrated during the Black Summer, the floods in early 2021 and Tropical Cyclone Seroja (refer below for examples).
In contrast the DED is a new service which is yet to be widely adopted or used and therefore it’s not possible to demonstrate usage. The potential for the DED and its impact on the emergency management and other sectors is speculative.
DYNAMIC EXPOSURE DASHBOARD UTILISATION
Output description
The DED is an output of this project and a new product. As such it’s not possible to describe and understand the utilisation. The DED will be monitored by GA via usage statistics. Presently it’s only possible to view the number of users but not retrieve information on who the users are and how long they spent interacting with the DED. This situation may change in future if the DED is moved to an online hub environment or other platform that permits a broader range of analytics to be applied.
Extent of use
• Currently unknown due to the infancy of the service.
Utilisation potential
• The DED has the potential to be widely used at all levels of government. From a research and information perspective it can be used immediately.
• The greatest potential use will come during the next large hazard event. As per the web mapping application, the DED is a tool which comes to the forefront during a crisis and GA expect usage to increase.
• Utilisation potential is expected to increase if the 2021-22 bushfire boundaries are added as a data source and if uses can add their own data.
• The Australia Geospatial-Intelligence Organisation showed particular interest in the DED because it provided them access to valuable information that could be used during emergency situations. The DED opened discussions as to how else NEXIS/AEIP data could potentially be used in their agency. This may lead to additional use cases, additional services or data offering and more co-operation between AGO and GA.

AUSTRALIAN EXPSOURE INFORMATION PLATFORM ENHANCEMENT PROJECT | REPORT NO. 682.2021
26
Utilisation impact
• Currently unknown due to the infancy of the service.
Utilisation and impact evidence
• Currently unavailable due to the infancy of the service.
• The AEIP and NEXIS was a key component during the Climate and Resilience Services Australia (CaRSA) trial (October 2020 – March 2021). AEIP data was made available as a data download service at several geographic levels and Exposure Report outputs were modified to include a GEOJSON file that can be integrated into other applications for reporting purposes. The creation fo the Australian Climate Service has the potential to increase usage because the AEIP is now seen as provid
Utilisation impact
• Currently unknown due to the infancy of the service.
WEB MAPPING APPLICATION UTILISATION
Output description
Usage statistics of the WMA have been in place since the service was launched. The statistics capture eight key parameters which are used to produce monthly usage reports, annual usage reports or usage reports for discrete date periods.
Extent of use
• When an Exposure Report request is submitted one of the captured parameters is an email address containing the email domain which typically reflects the business or organisation name and allows loose identification of the sector or field a user is from. Via this parameter it is evident that the WMA is used by academics, researchers, planners, the insurance sector, and numerous federal and state government agencies.
• The web mapping application has been used by persons in all Australian states and territories. The highest number of uses has been from state agencies in NSW, Qld and WA, primarily associated with API keys. The lowest usage has been in states (Tasmania, Victoria) that have similar products and tend to rely on those services.
Utilisation potential
• During the stakeholder consultations numerous participants were informed of how other agencies were automating Exposure Report creation via API keys. As a result, a further six API keys were created and provided to existing stakeholders between January and June 2021. This indicates that potential use in the coming years will increase through automations.

AUSTRALIAN EXPSOURE INFORMATION PLATFORM ENHANCEMENT PROJECT | REPORT NO. 682.2021
27
• The AEIP and NEXIS was a key component during the Climate and Resilience Services Australia (CaRSA) trial (October 2020 – March 2021). AEIP data was made available as a data download service at several geographic levels and Exposure Report outputs were modified to include a GEOJSON file that can be integrated into other applications for reporting purposes. The creation of the Australian Climate Service has the potential to increase usage because the AEIP is now seen (within ACS) as providing critical information for the federal government during crises.
• In addition to the WMA, GA offer an alternative batch processing method (not publicly available) that appends AEIP data to many geographies and is provided to stakeholders in database format (as opposed to receiving single Exposure Reports). This delivery option is becoming increasingly popular when large amounts of information are required in a short time. In the 20-21 fiscal year GA produced the equivalent of 3.8 million exposure reports using this process. There is potential for this service to become publicly available however it requires a large investment in time and cloud-based infrastructure and processes.
• Presently the usage statistics indicate that the WMA is heavily used/associated with bush fire events. There is potential for greater usage related to other events (flood, heatwaves, severe storms) through marketing and promotion of the AEIP to researchers and industry.
• The same functionality that creates Exposure Repots via the AEIP WMA is also available within GA’s Exploring For The Future (EFTF) Portal. Within GA efforts have begun to narrow down EFTF users and identify reasons why they create Exposure Reports and what could be changed or included to meet the needs of this users group.
• The recently released National Hazards Impact and Risk Service (NHIRS) now automatically creates and disseminates an Exposure Report to its users. This service has the potential to bring new users to the AEIP. Similarly, a private firm known as ‘Floodmapp’ (www.floodmapp.com) have connected to the AEIP via an API key and plan to integrate AEIP data into their product suite.
Utilisation impact
The use of AEIP data in the ACS priority work has influenced those in the federal government operating in the emergency management sector to start a dialogue regarding the accuracy, timeliness, currency and longevity of the NEXIS/AEIP data. Linkages between NEXIS and the Foundation Spatial Data Framework (FSDF)1 are being promoted as means for NEXIS to continue well into the future and provide relevance to all levels of government.
1 The Foundation Spatial Data Framework is a supplementary program, working to deliver national coverages of the best available, most current, authoritative foundation data which is standardised and quality controlled.

AUSTRALIAN EXPSOURE INFORMATION PLATFORM ENHANCEMENT PROJECT | REPORT NO. 682.2021
28
Utilisation and impact evidence
The graph below demonstrates the impact and usage of the AEIP during the Black Summer. In the period between November 2019 and February 2020 nearly 14,000 Exposure Reports were created in response to bush fire events. This represents more than a 10-fold increase for the same period in the previous year.

AUSTRALIAN EXPSOURE INFORMATION PLATFORM ENHANCEMENT PROJECT | REPORT NO. 682.2021
29
CONCLUSION
The changes to the WMA and construction of the DED indicate the evolving nature of AEIP in response to end-user needs. The stakeholder engagement process has proven that further targeted consultations, and working closer with various agencies, will yield better results than online surveys or cold calling persons who use the AEIP infrequently.
Building long-term business relationships and understanding end-user business needs will be the primary drivers behind the future direction of the AEIP and any future data inclusions or changes to Exposure Reports. Meeting the needs of federal and state governments needs to be well balanced and there is the potential to investigate having two tiers of data and information for the respective levels of government, and tailoring AEIP products for end-users at each level of government. It is possible this process may occur in the next few years with the creation of the Australian Climate Services.
NEXT STEPS
In May of 2021, the federal government announced the Australian Climate Service, a collaboration between the Bureau of Meteorology, the CSIRO, ABS and Geoscience Australia to help better anticipate, manage and adapt to climate impacts now and in the future. NEXIS and the AEIP have been identified as important components in this service and as part of the governments need to centralise services.
AEIP ongoing focus is aimed at:
• improving the AEIP data; the AEIP project team will be focused on updating the data sets by improving the currency of some data sets and producing the next version (Version 12) of the NEXIS building data for use within the AEIP and GA’s Tropical Cyclone Risk Modelling (TCRM) and Earthquake Risk Modelling (EQRM).
• Investigating the data and requirements surrounding the addition of a ‘Health’ theme within the NEXIS/AEIP data, output data and reports.
• Replacing the current list of geographies in the WMA drop down lists with newer versions of data. The ABS will be releasing new SA1, SA2, Suburb and Postcode (Postal Areas) geographies in the latter half of 2021.
• Producing revised national AEIP data sets (based on the new geographies outlined above) at the LGA, SA1 and SA2 geographies and making them publicly available via GA’s data download facilities.
• Addition of the 2021-22 bushfire feeds to the DED; while technically possible now, this will depend heavily on federal and state agencies reaching data sharing agreements and the data being publicly available.
• Addition of ‘Community Data’ to the DED: given sufficient interest and usage in the DED there is an option to allow users to draw and upload their own boundaries into the DED to view exposure information. This

AUSTRALIAN EXPSOURE INFORMATION PLATFORM ENHANCEMENT PROJECT | REPORT NO. 682.2021
30
functionality is not currently in-built within the software however the project team have various ideas as how to achieve this. It would require considerable time and testing and possibly external funding.
• Investigating options to integrate the WMA and DED into a single user-experience that can be accessed from the same application. This would require considerable time, dedicated resources, planning, coordination between the Landscape Information Team and DiSI, and external funding.
• Blue sky thinking on the existing AEIP Portal, WMA and DED – bringing them together into a single point of entry (e.g., an online hub or portal) from where users can effortlessly access either application and all the data and resources associated with the AEIP (and possibly NEXIS).

AUSTRALIAN EXPSOURE INFORMATION PLATFORM ENHANCEMENT PROJECT | REPORT NO. 682.2021
31
PUBLICATIONS LIST
There are no publications stemming from this project.
The programming code associated with the WMA user interface is developed by GA and not publicly available. The underlying programming code which facilitates inclusion of the web map, HTML and mobile access components are available at the following resources:
• https://angular.io/
• https://openlayers.org
• https://github.com/twbs/bootstrap
The DED uses AGOL software which is not open-source. The DED can be accessed at this location:
• https://experience.arcgis.com/experience/fc9af57ae5ab479e91ee033165f24ca8/

AUSTRALIAN EXPSOURE INFORMATION PLATFORM ENHANCEMENT PROJECT | REPORT NO. 682.2021
32
TEAM MEMBERS
RESEARCH TEAM
Bushfire and Natural Hazards CRC: Mathhew Hayne, Andrew Yin.
GA Landscape Information Section: Graham Hammond, Mark Dunford, Kane Orr, Katherine Fontaine, Jake Bradley, Con Charalambou.
GA Enterprise Geographical Information Systems Section: Nerida Wilson, Larissa Taylor.
GA Digital Science Information and Innovations Branch: Bill Farmakis, Callum McKenna, Deepika Mani, Lee Davidson, Abhi Sunketa.
END-USERS
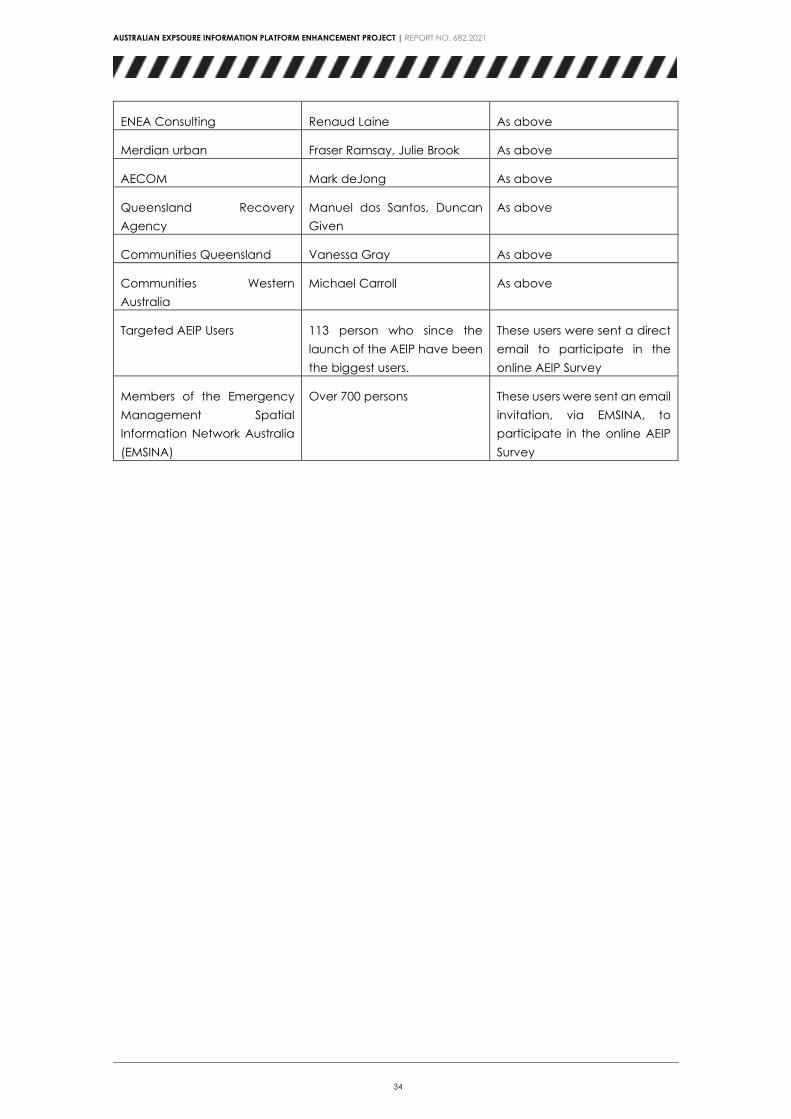
This table represents a list of end-users targeted for consultation. The list of users was developed by analysing AEIP usage (August 2018 to January 2021) and identifying agencies and individuals within those agencies with the highest usage.
Note that due to COVID-19 most of the stakeholder engagement occurred via online meetings (Skype, Zoom or MS Teams).
End-user organisation End-user representative Extent of engagement (Describe type of engagement)
Watertech Emmanuel Bina and three others
Online meeting discussing AEIP in general, data requirements and needs, functionality and proposed changes to the web mapping application and demonstration of the DED.
Bushfire Recovery Agency Jodie Mewett As above
Department of Prime Minster and Cabinet
Christine Atyeo As above
Queensland Fire and Emergency Services, Risk Assessment Section
Jody Rossner, Peter Russell, Courtney Russell
As above
Queensland Fire and Emergency Services, Futures Section
Tess Pham As above

AUSTRALIAN EXPSOURE INFORMATION PLATFORM ENHANCEMENT PROJECT | REPORT NO. 682.2021
33
New South Wales State Emergency Services
Melissa Daley As above
New South Wales Rural Fire Services
Stuart Matthews, Natalie Hill, David Field, Meaghan Jenkins, Jurgen Achilles, Melissa O’Halloran, Jacqueline Murphy, Josh Whittaker
As above
Department of Home Affairs Leanne Carter, Matt, Sebastian
As above
South Australian State Emergency Services
Sara Pulford As above
South Australia Country Fire Services
Bryce Touchstone, Martijn Van Der Merwe
As above
South Australia Department of Environment and Natural Resources
Nick Severin As above
Department of Home Affairs, Emergency Management Australia and the Crsis Coordination Centre
Brian Foo, Roger Lye, Dan Payne, Marcin Pius
Face to face meeting discussing AEIP in general, data requirements and needs, functionality and proposed changes to the web mapping application and demonstration of the DED.
Australian Geospatial Intelligence Organisation
LTCOL Keiran Vidal, CPL Joanna Armstrong, CPL Jack Salmon, LTCOL Lawson, MAJ Marchant, LTCOL Bush, CPL Smithers, CPL Johannessen, WO1 Arnold, WO2 Langely, Rowan Wase, Robert Pearson, MAJ Allday, SGT Grantham, Adrian Candsell, WO1 Palfrey, 5 COY (Group), GEW (Group)
As above (but both face to face meetings and via online meeting)
Department of Fire and Emergency Services, Western Australia
Mark Williams, Adrian Kotowski, Sophie Edgar, Dustin Bridges, Justin Whitney, Stephen Gray
Invited to engage with project team but did not respond or declined the invitation.
Australian Bureau of Meteorology
Matt Beaty As above
Jacobs Consulting Darcy Bulach As above
Western Power David Capon, Peter Wright As above
AUSTRALIAN EXPSOURE INFORMATION PLATFORM ENHANCEMENT PROJECT | REPORT NO. 682.2021
34
ENEA Consulting Renaud Laine As above
Merdian urban Fraser Ramsay, Julie Brook As above
AECOM Mark deJong As above
Queensland Recovery Agency
Manuel dos Santos, Duncan Given
As above
Communities Queensland Vanessa Gray As above
Communities Western Australia
Michael Carroll As above
Targeted AEIP Users 113 person who since the launch of the AEIP have been the biggest users.
These users were sent a direct email to participate in the online AEIP Survey
Members of the Emergency Management Spatial Information Network Australia (EMSINA)
Over 700 persons These users were sent an email invitation, via EMSINA, to participate in the online AEIP Survey

AUSTRALIAN EXPSOURE INFORMATION PLATFORM ENHANCEMENT PROJECT | REPORT NO. 682.2021
35
REFERENCES 1. ESRI https://www.esri.com/en-us/arcgis/products/arcgis-online/resources 2. Fu, P. Getting To Know Web GIS, Third Edition. 2018 3. https://stackoverflow.com/