computerized interstate check posts of gujarat...
TRANSCRIPT

Page 1 of 42
Computerized Interstate Check Postsof
Gujarat State, India
A Cost Benefit Evaluation Study
Centre for Electronic GovernanceIndian Institute of Management
Ahmedabad
November 2002

Page 2 of 42
TABLE OF CONTENTS
1.0 Introduction..................................................................................................................................................... 4
1.1. Scope .............................................................................................................................................................. 5
1.2. Methodology ................................................................................................................................................ 6
2.0 Exploratory Study .......................................................................................................................................... 6
2.1. Project Objectives ...................................................................................................................................... 7
2.2. Observations ................................................................................................................................................ 7
3.0 Detailed Study.................................................................................................................................................. 8
3.1 Survey and Data Collection..................................................................................................................... 9
3.2 Truck Driver Responses ........................................................................................................................... 93.2.1 Check Post Services.............................................................................................................................9
a. Processes at Check post............................................................................................................................10i. Weighing...................................................................................................................................................10ii. Document Checking...............................................................................................................................11iii. Document Depositing...........................................................................................................................11iv. Official receipt .......................................................................................................................................11v. Payment....................................................................................................................................................11vi. Document Collection ............................................................................................................................12
b. Process Efficiencies ....................................................................................................................................12i. Waiting ......................................................................................................................................................12ii. Weighing..................................................................................................................................................13iii. Payments.................................................................................................................................................13
c. Corruption and Transparency ...................................................................................................................13i. Unaccounted Collections........................................................................................................................14ii. Check post By-passing..........................................................................................................................15iii. Transparency..........................................................................................................................................15
3.2.2 Check Post Amenities........................................................................................................................15a. Waiting Lanes ..............................................................................................................................................16b. Parking Space ..............................................................................................................................................16
3.2.3 Inspector Behavior.............................................................................................................................16a. Politeness......................................................................................................................................................16b. Efficiency .....................................................................................................................................................16c. Fairness.........................................................................................................................................................17
3.2.4 Transporter Preparedness .................................................................................................................17a. Overloading..................................................................................................................................................17b. Documentation ............................................................................................................................................18c. Road Tax Payments ....................................................................................................................................18d. License Plate Standard Compliance.........................................................................................................18e. Providing Adequate Cash to Drivers .......................................................................................................18
3.2.5. Overloading and Over Dimensioning Patterns .............................................................................18

Page 3 of 42
3.3 Government Official Responses ...........................................................................................................193.3.1 Transport Commissioner...................................................................................................................19
a. Project Motivation.......................................................................................................................................19b. Project Execution ........................................................................................................................................19
3.3.2 RTO Inspectors ..................................................................................................................................20a. Perceptions ...................................................................................................................................................20
i. Impact on Processing..............................................................................................................................20ii. Impact on drivers ....................................................................................................................................21iii. Coping with Change .............................................................................................................................21
3.4 Responses from Clients of Transport Companies ...........................................................................223.4.1 Perceptions..........................................................................................................................................22
3.5 Transporter Responses ...........................................................................................................................223.5.1 Perceptions..........................................................................................................................................23
a. Weighing.......................................................................................................................................................23b. Payment System..........................................................................................................................................23
3.5.2. Problems and Suggestions...............................................................................................................23
3.6 Total Solution Provider Responses .....................................................................................................243.6.1 Project Contract..................................................................................................................................243.6.2 Problems ..............................................................................................................................................243.6.3 Suggestions .........................................................................................................................................24
4.0 Financial Costs and Benefits .....................................................................................................................25
4.1. CICP Costs .................................................................................................................................................25
4.2. CICP Revenues .........................................................................................................................................26
5.0 Summary and Conclusions ........................................................................................................................27
6.0 Recommendations ........................................................................................................................................29
Annexures ....................................................................................................................................................................31
Annexure 1: Map of Gujarat with Check Posts ................................................................................................32
Annexure 2: Functions of a Check Post...............................................................................................................33
Annexure 3: Traditional Check Post....................................................................................................................34
Annexure 4: Computerized Interstate Check Post...........................................................................................35
Annexure 5: Survey Instrument A: Questionnaire for Truck Drivers .......................................................37
Annexure 6: Survey Instrument B: Questionnaire for Inspectors...............................................................40
Annexure 7: Technology Status at CICP.............................................................................................................42

Page 4 of 42
An Evaluation ofComputerized Inter-State Check Posts in Gujarat
1.0 Introduction
Gujarat, situated in the western corner of India, is one of the most developed states in India. Ithas an extensive, well-laid out and maintained road network, which carries a large volume ofcommercial traffic. Major highway systems link Delhi (the capital of India) to Mumbai (thefinancial capital of India) and provide the principal link to the Kandla seaport on Gujarat's west -coast.
The Gujarat Motor Vehicles Department (GMVD) controls the road transport activity in Gujarat.While the broad policies are laid down by India's central government in the Indian MotorVehicles Act, state governments are empowered to determine the penalties for infractions andprocedures for enforcement. The transport companies, with an intention to maximize theirrevenue per truck, tend to load their trucks beyond permissible axle load, creating a serioussafety hazard. It is estimated that about 70% of the commercial vehicles crossing the stateborders are overloaded.
Check posts have been set up on the state borders by the state government to check if vehiclespassing through these borders have paid all the road taxes, carry proper documents, and conformto the loading and dimensioning norms. The Regional Transport Offices (RTO) of the state'sTransport Department manage these check-posts. The state of Gujarat has set up10 check postspositioned at the border with three neighboring Indian states. The locations of check posts aremarked on the map of Gujarat in Annexure-1. Nearly 25,000 transport vehicles pass these checkposts on a daily basis.
The RTO Inspectors are authorized to check the weight of goods being carried and verify thecorrectness of the documents carried with the vehicle. They also impose penalties on thetransporters for offences like broken or damaged headlights and non-standard license plates, etc.The drivers of the vehicles must present proper documents (Registration Book, Driver's license,Permit to enter the state or the National Permit, PUC: Pollution Under Control Certificate,insurance documents and delivery documents) and pay the penalty amount, if any, beforeleaving the check post. The main functions of a check post are given in Annexure-2.
The process of verification of documents, estimation of penalty amount and its collection at anytraditional check post is manual, judgmental and time consuming. A schematic diagram of thetraditional check post system, along with time spent in each task is presented in Annexure 3.Due to these lengthy and cumbersome procedures, the state governments have not been effectiveat reducing the number of overloaded vehicles. With the manual system, the inspection of 100%of commercial vehicles is impossible thus resulting in slippage and heavy revenue losses to thestate. Due to manual intervention, it is perceived that truck drivers are harassed at the checkposts, held up for several hours, and arbitrary penalty charges and speed money are collectedfrom most of them.
In late 1999, to improve the situation at check posts, the transport department of Gujaratredesigned the processes at its check posts. Large yards were created at the check posts and
Page 5 of 42
processes of inspection and estimation were mechanized by deploying electronic weighbridges,video cameras and computers. Such modernized check posts called the ComputerizedInterstate Check Posts (CICP) were created at all the10-interstate sites.
CICP is expected to improve the processes of identification of vehicles and estimation ofpenalties using electronic weighbridges and computers thereby minimizing the inconvenience tothe transporters. Above all, this technology is expected to plug the leakage and significantlyincrease revenues from the check post for the state government. A schematic diagram and theverification and penalty collection processes at the computerized check post are presented inAnnexure 4.
The Governance Knowledge Sharing Program (GKSP) initiative of the World Bankcommissioned the Centre for Electronic Governance at the Indian Institute of Management(CEG-IIMA) to carry out a cost-benefit evaluation study of the Computerized Interstate CheckPosts (CICP) in Gujarat.
The objectives of the study are:
- Evaluating the benefits of CICP to the intended stakeholders.
- Assessing the impact of CICP on transparency, accountability and corruption at the checkposts of Gujarat.
- Identifying the strengths and weaknesses of the implementation and providing suggestionsfor sustainability of such projects.
This report presents the details and findings of the CICP evaluation study carried out by CEG-IIMA in June-July 2002.
1.1. Scope
CEG-IIMA collected background details of CICP from the following sources:
• Interviews and discussions with the project champion, the erstwhile TransportCommissioner, state government of Gujarat, India.
• Data collected by CEG-IIMA in 2000-2001, for a case study, on CICP.• Articles and papers published on the World Wide Web, newspapers, journals and
magazines.
Based on the information collected, the stakeholders of CICP were identified as:
1. Truck drivers who regularly cross and re-cross the interstate check posts in Gujarat.
2. Government officials at CICP, who examine vehicles passing though the check post, identifydefaulters, levy penalties for non-compliance of rules, and collect the penalty for the stategovernment.
3. The trucking companies or transporters, who are in the business of ferrying goods from onelocation to another for their clients (manufacturing, trading or export-oriented companies).

Page 6 of 42
4. The manufacturing or trading or other organizations which transport their goods with helpfrom Transporters.
5. The Total Solution Provider, a private sector organization, that has developed, installed,implemented and is operating the system at all the 10 locations.
These 5 categories of people/organizations constitute the major players of the interstatetransportation system. CICS is expected to benefit these parties and therefore they are consideredas the focus group of the study.
6. The study team wanted to use as control group a non-computerized check post. However, asa non-computerized check post does not exist in Gujarat, truck drivers at the non-computerizedcheck post in Rajasthan (a neighboring state of Gujarat) were included in the study and treated asthe control group of the study.
1.2. Methodology
The study was carried out in two stages namely:
a) Exploratory study of the check post at Shamlajee, located about 150 kms from Ahmedabad,on the Rajasthan-Gujarat border.
b) Detailed Study of 4 check posts (Bhilad, Shyamalajee, and Shamkhiali in Gujarat andRatanpur in Rajasthan).
The purpose of the exploratory study was to get a reasonable understanding of the system at thecheck post and the stakeholders' perceptions of the system. It was also used to test the initialversions of the survey instruments.
The detailed study consisted of a large-sample survey of the stakeholders through refined surveyinstruments.
2.0 Exploratory Study
A team consisting of two faculty members and two research staff from CEG-IIMA conductedthe exploratory study. In May 2002, they visited the check post of Shamlajee, located about 150kilometers from Ahmedabad, on the Gujarat-Rajasthan border.
At the check post, the CEG-IIMA team held discussions with:
a. The erstwhile Transport Commissioner of Gujarat , who is the visionary and champion ofthe project.
b. The Total Solution Provider (TSP) of the project who is operating the system at all the checkposts of Gujarat.
c. The RTO Inspectors who have contributed to the development of CICP.
These discussions provided useful insights on the current status and future plans of the project.The study team observed the various processes at the check post and interviewed the inspectorsand computer operators at the check post. A few truck drivers, selected randomly, were spokento, about their views and perceptions of the system, during the exploratory study.
Page 7 of 42
The study team also recorded the time taken for filling up a questionnaire and the answeringpatterns of respondents with a view of fine-tuning the survey instruments for the detailed study.
2.1. Project Objectives
The erstwhile Transport Commissioner shared the envisaged objectives of the CICP project withthe study team from CEG-IIMA. These objectives are stated as under:
a. To check 100% of vehicles passing through check post for overloading.
b. The checking of vehicles by RTO Inspectors should not cause any sort ofharassment for the transporter or driver. It should be for their convenience astransporters are the 'customers' for the check posts.
c. To prevent unnecessary detention of vehicle at the check post. In the manualsystem, often, a driver was detained at the check post, maybe at the whim of theInspector or for some unexplained cause. The drivers fear governmentauthorities, and hence were helpless in the situation. In CICP, the lanes aresupervised from the Control Room and any non-routine activity can be spottedand questioned.
d. Reduce processing time at the check post. With the help of sophisticatedtechnology and re-engineering of certain processes, transaction times can besignificantly shortened, proving to be quite convenient for the driver.
e. As per conservative estimates, transporters overload 60 to 70% of vehicles. Inaddition, technology is enabling 100% checking of vehicles. Thus, collection ofoverload penalty can be a major source of revenue for the government. Theobjective is to steadily increase incomes from the check post, reaching about500 crores within 5 years of implementation of CICP.
2.2. Observations
The interaction with the RTO team at the check-post gave an optimistic view of the effectivenessof CICP, which appeared to be a well-conceived system, developed and executed with the totalcooperation of the RTO staff amidst tight deadlines.
The various technology components of the computerized system such as electronic weighbridge,video camera, video server, computer hardware, etc. appear to have been seamlessly integratedto fulfill the objectives of the project. Financial reports presented to the study team reveal thatthe revenue from the check posts has increased significantly within a year of implementation.
It is to the credit of the erstwhile Transport Commissioner that the project could be smoothlyimplemented. He ensured that all the government officials, who may have viewed CICP as apotential threat, were made parties to the implementation of the project right from its conception.They were given training on computers and some of them were involved in developingprogramming modules of the software. This process inculcated a sense of ownership of thecomputerized system in the RTO officials.

Page 8 of 42
At the time of conducting the study (May 2002), the computer-based operations at the checkpost were running into a rough weather. After operating the system at the 10 check posts formore than a year, the TSP (total solution provider) withdrew its computer operators due tonon-receipt of contractual dues from the state government. In addition, the contract to operatethe check posts for the subsequent period was also awaited from the government. In themeantime, the operations at the Control Room at the main RTO in Ahmedabad were alsoaffected. Consequently, the database (vehicle database) at the control room server could notbe accessed and monitoring of lanes by the RTO control room in Ahmedabad has since beendisabled. Thus the computers at the check-post counter were working only in stand-alonemode. The video camera was also inoperative and the computer at the check-post counter justregistered the weight of the vehicle from the electronic weighbridge. The rest of thetransaction was completed through manual data entry.
The drivers interviewed gave mixed responses on the impact of CICP. Most of them expressedsatisfaction over the electronic weighbridge, which has become an integral part of check postoperations. In the earlier system, often they had either to accept the estimates of the RTO staff orin case of a dispute, had to go to a nearby private weighbridge. The drivers found that thewaiting lanes and parking lanes are spacious and comfortable now.
During the exploratory study, it was observed that a transaction (the process of weighing,penalty calculation and document checking) took about 2 to 3 minutes, which is much lesscompared to what it takes at a manual check post.
3.0 Detailed Study
Based on the exploratory study, it was decided to collect data (through the refinedquestionnaires) from 3 computerized check posts in Gujarat and 1 non-computerized check postin the neighboring state of Rajasthan for the purpose of evaluation.
Bhilad, located on the Gujarat-Maharashtra border (known as the 'Golden Corridor', as bothstates are among the most progressive Indian states), is the biggest check post of Gujarat, both interms of traffic density and revenue collection. Hence, Bhilad was chosen as one of the sites inthe sampling plan.
Shamkhiyali is the only interstate check post in Gujarat, not situated on the state border. Thischeck post is strategically located, as all the dispatches from and to Kandla (the biggest seaportof Gujarat) have to go through it. Thus, this check post was included in the sampling plan.
Shyamalajee is the closest check post to Ahmedabad. It ranks second, in Gujarat, in terms ofrevenue collections at the check post. Data was collected from this place during the exploratoryphase.
Ratanpur is the non-computerized check post situated in Rajasthan, the closest neighbor ofGujarat. This check post is just about 2 kilometers away from the Shamlajee check post, whichwas visited during the exploratory study. Collecting data from the stakeholders at this check post(which is nearest neighbor of the focus group, yet having a totally different system and set ofrules) would help analyze the comparative costs and benefits of the system.
It was decided to collect the data during the peak hours, that is, from 8pm to 2am, to get astatistically relevant representation of the truck drivers, the main users of the system. The driverswould be randomly selected as vehicles generally pass non-stop, during this time period.

Page 9 of 42
As it takes about 10-15 minutes to fill up a questionnaire, it was decided to either interview thedriver, while he was in the lane, waiting for his turn, or after he cleared the check post, when hemay stop for a break.
All the government officials (RTO Inspectors) present at the check post, at the time of datacollection, would be administered the questionnaire. Typically, about 2 to 3 Inspectors arepresent at the check post during the peak hours.
3.1 Survey and Data Collection
In June 2002, a 4-member team, comprising of 3 research staff from IIMA and one independentdata collector, visited the check posts at Bhilad and Shamkhiyali and collected data from thetruck drivers and RTO inspectors at those locations. In all, 126 truck drivers and 5 RTOInspectors were administered the questionnaires. In addition, a 2-member team from CEG-IIMAvisited the check post at Ratanpur (a non-computerized check post in the neighboring state ofRajasthan), and interviewed 16 truck drivers and 2 RTO inspectors there, recording theirresponses.
The check post wise break-up of the respondents is given in the table below:
Location No. of Drivers No. of InspectorsBhilad 85 3Shamkyali 36 2Shamlaji 5 1Ratanpur 16 1Total 142 7
The next section, Section 3.1, presents the analysis of the data collected through the surveyinstruments (Annexure-5 for truck drivers; Annexure-6 for Inspectors) and the telephonicinterviews conducted with transport companies and client organizations. The data includesresponses to quantitative as well as open-ended questions.
3.2 Truck Driver Responses
The survey instrument presented in Annexure-5 has been used for collecting responses from thetruck drivers. The section below provides the respondent profile, their perceptions in terms ofawareness, convenience, corruption, amenities, and attitude of transporters and inspectors.
Almost 90% of the drivers interviewed are below 40 years of age. Out of the 142 drivers spokento, 50% have a driving experience of 5 to 15 years. All of them are literate, with 60% havingattended secondary school.
50% of all the drivers interviewed were not aware that the check posts are computerized. Thisincludes 12 of the 16 drivers spoken to, at the non-computerized check post in Ratanpur,Rajasthan.
3.2.1 Check Post Services

Page 10 of 42
The truck drivers were asked to state the average time taken for crossing the check post, andevaluate the different components in transaction processing (weighing, document checking,computation of penalty, obtaining receipts, payment of cash, etc), before and aftercomputerization. An analysis of responses from the drivers reveals the following:
a. Processes at Check post
Drivers were asked to score their perceptions on each of the process parameters (presented in thequestionnaire) on a 1 to 5 scale. The difference in the score of each process parameter aftercomputerization and before computerization is computed for each respondent. A positive value ofsuch difference conveys an improvement and a negative value conveys deterioration /dissatisfaction of the process parameter with reference to the respondent. These values areaveraged over all the respondents to obtain the overall impact of computerization on each processparameter. The following table summarizes the analysis of observations. Sections below presentan analysis of the results of each process parameter.
Process ParametersPerceptions Weighing Payment
HandlingOfficialReceipt
DocumentChecking
DocumentDepositing
DocumentCollection
Number of Respondents 110 86 73 64 59 58Average SL Before CICP 2.33 3.00 2.67 2.70 2.73 2.71% perceiving deterioration 21% 34% 5% 13% 10% 9%Average SL deterioration (1.52) (2.10) (2.50) (2.38) (2.50) (2.40)% perceiving no difference 24% 40% 64% 61% 61% 62%% perceiving improvement 55% 27% 30% 27% 29% 29%Average SL Improvement 2.77 2.45 2.91 3.00 3.00 3.00Average SL After CICP 3.54 3.00 3.49 3.25 3.42 3.46Overall Impact 1.22 -0.05 0.74 0.50 0.61 0.67Control group Respondents 9 8 10 9 8 9Average SL : control group 3.11 3.38 3.50 3.56 3.38 3.56Note: SL refers to Satisfaction Level, which is measured over a scale of 1-5.
CICP refers to Computerized Inter State Check PostParentheses refer to negative value of the figures given.
As an example, the weighing process parameter (column) is explained below:
In the process parameter of weighing, the number of respondents is 110. They gave an averagesatisfaction level score of 2.33 to the manual system (before CICP). Thus, 21% of 110 respondentsperceive deterioration in the weighing process. The average deterioration in satisfaction level is anegative score of 1.52.(Subtracting the average score of before and after CICP). 24% have perceived nodifference in the weighing process, after computerization. 55% have perceived improvement in the processand the average satisfaction level score given to this process is 2.77 (on a scale of 1 to 5) The actualaverage score provided by the respondents is 3.54. Hence the overall impact of the weighing process afterCICP is a positive figure of 1.22. The number of control group respondents totaled 9 and their averagesatisfaction level is 3.11 (on a scale of 1 to 5).
Based on these readings, the analysis for each process parameter is provided in the following sections.
i. Weighing
All the drivers were unanimous is stating that they were quite satisfied with the weighbridgeprovided at the check post. This is perhaps the only component in the system, which is perceivedas adding maximum value for the stakeholders. In the absence of a weighbridge, drivers oftenhave to go to a privately owned weighbridge, which was both cumbersome and time consuming.Only 20% of the drivers at the non-computerized check post felt the need of a weighbridge.
Page 11 of 42
It may be noticed that 55% of 110 drivers, who responded, perceive an improvement of 2.77 inthe weighing process at CICP. 21% of the drivers expressed dissatisfaction over weighingprocess after computerization, while the balance 24% noticed no difference. The weighingprocedure is clearly perceived as an improvement in the new system (an average score of 3.54)by the drivers, with an overall impact of 1.22. This compares favorably with the control grouprespondents, who have given an average score of 3.11 to the weighing process at the non-computerized check post.
Display of weight
The electronic display board meant for the drivers to know the overloaded weight and thepenalty due is always switched off. This complaint has been voiced by 50% of driversinterviewed. The receipt given to them also does not carry the overloaded weight of the truck.The drivers opine that the receipt bearing the overloaded weight can be produced as an officialdocument at check posts in other states, as well.
ii. Document Checking
61% of drivers have noticed no change in the checking of documents in CICP, while 13%perceive a deterioration of 2.38. 27% of the responses indicate that there is a benefit to thedrivers to the extent of 3.00, resulting in an overall average positive impact of 0.5. The controlgroup respondents perceive an average score of 3.56, which is superior to the CICP average of3.25. Most of the truck drivers in the control group possess a pre paid card (Gold Card System),and hence document checking may not be needed.
iii. Document Depositing
In case a driver is short of money, he goes to his nearest office after depositing the vehicledocuments with the check post Inspector, and collecting the receipt. 61% of respondents find nochange in the document depositing process at CICP. 29% of the drivers found an averageimprovement of 3.0, leading to an average positive impact of 0.61. The control group's averagescores are 3.38, a bit lower than CICP score of 3.42.
iv. Official receipt
64% drivers have found no difference in the issuance of official receipts in CICP. A marginalgroup of 5% of respondents perceive deterioration while 30% have noticed an averageimprovement of 2.91.The overall impact is 0.74. Control group respondents have given anaverage score of 3.5, which is very close to the average score at CICP (3.49). Thus thisparameter is not effected, either way, due to CICP and there is no difference with the controlgroup, either.
v. Payment
It may be noticed that 40% of the 86 drivers, who responded, perceive no impact of CICP onpayment mode at the check post. 34% perceive an average deterioration of 2.10 in the paymentprocess in CICP. The overall perceived benefit is a small negative value of 0.05. The controlgroup is more satisfied with the manual system giving an average score of 3.38, which is slightlyabove the average score of 3.00 of CCIP.

Page 12 of 42
70% of drivers perceive that the Gold Card system in Rajasthan is a hassle-free method ofcollection of overload penalty. In the gold card system, the transporter pays a certain sum ofmoney (Rs. 3000 to Rs. 5000) at the local Road Transport Office (RTO) and is issued a GoldCard. This card is affixed on the truck and the driver cruises through the check post, withouthalting even for a minute, as the card is visible on the truck itself. This card allows the vehicle tocarry a certain overload for the validity period of the Gold Card. There are no mechanisms tocheck whether the vehicle is carrying the permissible overload or more, at the check post and istrust-based.
The Gold card system was introduced in Gujarat during 1998 and the check post revenues wentup by 80% (from Rs. 30 crores to 55 crores). Although this system minimizes the harassment ofthe drivers, the government felt that it would not plug the leakage completely and thus it decidedto introduce 100% checking through computerized electronic weighbridges. However the currentpayment system at CICP needs significant improvement, to enhance the customer convenience,perhaps through electronic payment systems.
vi. Document Collection
62% of drivers find that collection of documents is the same in the new system. 29% perceive animprovement of 3.00 and an overall positive impact is 0.67. The control group's average scorestands at 3.56, which is slightly better than the CICP average of 3.46.
b. Process Efficiencies
Drivers were asked to specify the amount of time spent for the check post transactions beforecomputerization and after computerization. The difference in this duration for each type oftransaction after computerization and before computerization is computed for each respondent. Anegative value of such difference conveys an improvement and a positive value conveysdeterioration according to the respondent. These values are averaged over all the respondents toobtain the total impact of computerization on each parameter. The following table summarizes theanalysis of observations. Sections below present an analysis of the results of type of transaction.
Transaction Processing DurationPerceptions Waiting Weighing PaymentNumber of Respondents 76 61 59Average WT: Before CICP 46.6 minutes 38.8 minutes 22.4 minutes% perceiving deterioration 42% 13% 36%Average increase in WT (54) minutes (38.6) minutes (28.1) minutes% perceiving no difference 20% 7% 41%% perceiving improvement 38% 80% 24%Average reduction in WT 60.7 minutes 42.2 minutes 35.2 minutesAverage WT after CICP 42.7 minutes 9.5 minutes 26.4 minutesOverall Improvement in WT 0.4 minutes 28.8 minutes (1.6) minutesControl group Respondents 13 6 7Average WT for control group 45.8 minutes 24.2 minutes 15.7 minutes
Note: WT: is Waiting Time’ CICP is Computerized Inter state Check Post
i. Waiting
38% of drivers find that the waiting period has reduced significantly by an average of 60.7minutes, while 42% perceive that they have to wait more (by 54 minutes) in the new system.20% perceive no change in the waiting time at the check post. The overall improvement inwaiting time is a marginal 0.4 minutes with the introduction of CICP. The drivers perceive that

Page 13 of 42
they have to wait an average of 42.7 minutes with CICP. This is slightly better than the averagewaiting time at the non-computerized check post of 45.8 minutes.
To the open-ended questions, 75% of drivers have stated that only one lane is operational, evenduring the peak hours at night. This increases the congestion and queue length. While moving upthe queue, often, the truck gets accidentally into a minor collision, which leads to brokenheadlights. Lack of properly functioning headlights is an offence and the drivers have to pay thispenalty also, as a result of being in the queue for a longer time. As all the check posts provide afacility of at least 4 lanes, the drivers feel that other lanes should also be made operational toreduce the waiting time and queue length.
10% of drivers perceive that the operations are done more speedily at Gujarat, than in otherstates.
ii. Weighing
80% of drivers perceive that the time taken to weigh the vehicle has gone down significantly by42.2 minutes, over the earlier system. At CICP, it now takes 9.5 minutes on the average. 13% ofdrivers find that it takes longer by 38.6 minutes and 7% perceive no difference with CICP. Theaverage waiting time for the control group is 24.2 minutes. Thus the waiting time for weighing issignificantly reduced in CICP (9.5 minutes), in comparison to the control group as well as theold system.
iii. Payments
36% of drivers perceive a decline in the time taken to process payments by 28.1 minutes. 41%perceive no change, while 24% have noticed an improvement in the processing time by 35.2minutes. At the non-computerized check post, the Gold Card facility is available, which leads tolower waiting time (15.7 minutes) that is significantly lower than the CICP figure of 26.4minutes.
c. Corruption and Transparency
Drivers were asked to score their perceptions on each of the corruption and transparencyparameters (unaccounted collections, check post bypassing and transparency) on a 1 to 5 scale.The following table summarizes the analysis of observations. Sections below present an analysisof the results of each process parameter.
Perceptions Corruption and Transparency ParametersUnaccountedCollections
Check postBypassing
Transparency
Number of Respondents 85 49 59Average SL Before CICP 2.87 2.73 2.46% perceiving deterioration 14% 4% 10%Average SL deterioration (2.17) (3.00) (1.50)% perceiving no difference 61% 73% 56%% perceiving improvement 25% 22% 34%Average SL Improvement 2.81 3.27 3.20Average SL After CICP 3.25 3.38 3.44Overall Impact 0.39 0.61 0.93Control group Respondents 9 6 6Average SL : control group 3.33 3.00 3.33
Note: SL refers to Satisfaction Level, which is measured over a scale of 1-5.CICP is Computerized Inter state Check Post
Page 14 of 42
i. Unaccounted Collections
61% of drivers have responded that payment of 'additional' money to RTO staff continues to bethe same, post CICP. 14% have responded that they have to pay more money now giving anaverage decline of 2.17, while 25% opine that CICP has resulted in an improvement by giving apositive impact of 2.81. Overall, there is a positive shift of 0.39 in this dimension of processingat the check post. The control group average works out to 3.33, which is slightly better than theCICP average of 3.25. Possibly the drivers in the control group may be paying lesser additionalmoney, as compared to drivers passing through CICP – in the absence of accurate estimation ofweight of the trucks and other control procedures.
Almost all the drivers interviewed told the study team that an unofficial 'entry fee' of Rs. 20 toRs. 50 has to be paid by them irrespective of the weight of the goods being carried by them.Once the Inspector does the weighing and penalty estimation process, the driver is given anoption to pay the 'official' or 'unofficial' sum of money (the former goes to the Governmenttreasuries and the latter gets unaccounted).
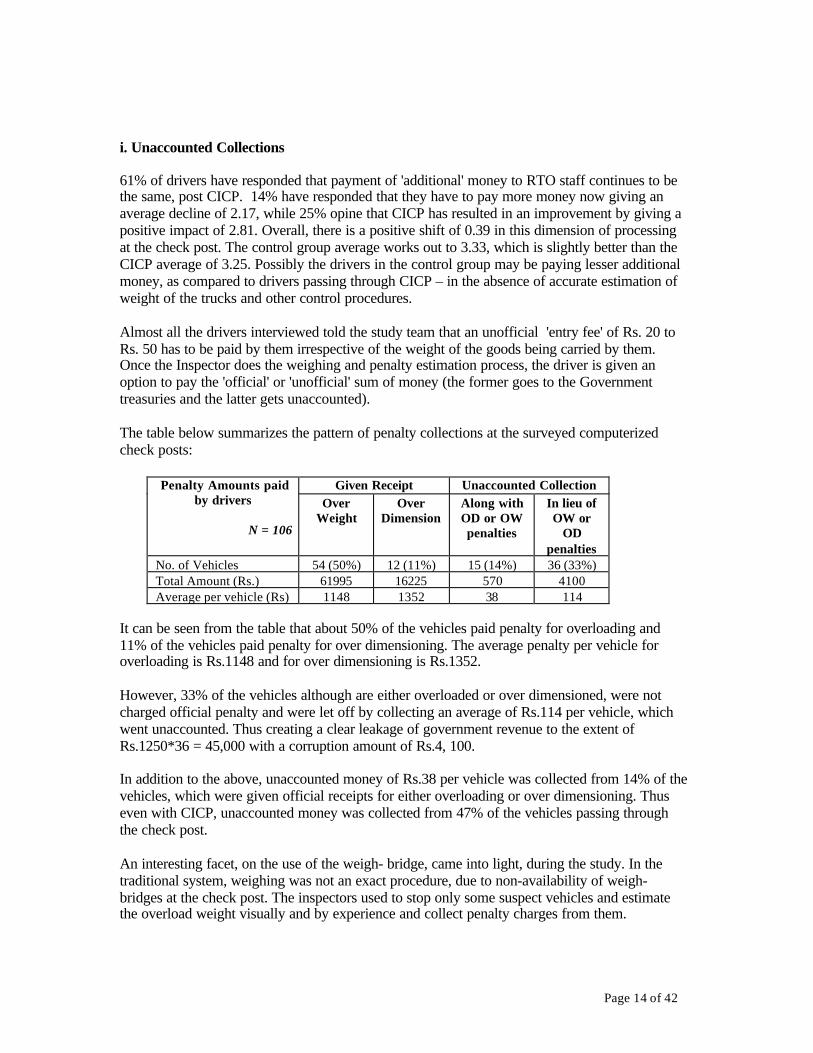
The table below summarizes the pattern of penalty collections at the surveyed computerizedcheck posts:
Given Receipt Unaccounted CollectionPenalty Amounts paidby drivers
N = 106
OverWeight
OverDimension
Along withOD or OWpenalties
In lieu ofOW or
ODpenalties
No. of Vehicles 54 (50%) 12 (11%) 15 (14%) 36 (33%)Total Amount (Rs.) 61995 16225 570 4100Average per vehicle (Rs) 1148 1352 38 114
It can be seen from the table that about 50% of the vehicles paid penalty for overloading and11% of the vehicles paid penalty for over dimensioning. The average penalty per vehicle foroverloading is Rs.1148 and for over dimensioning is Rs.1352.
However, 33% of the vehicles although are either overloaded or over dimensioned, were notcharged official penalty and were let off by collecting an average of Rs.114 per vehicle, whichwent unaccounted. Thus creating a clear leakage of government revenue to the extent ofRs.1250*36 = 45,000 with a corruption amount of Rs.4, 100.
In addition to the above, unaccounted money of Rs.38 per vehicle was collected from 14% of thevehicles, which were given official receipts for either overloading or over dimensioning. Thuseven with CICP, unaccounted money was collected from 47% of the vehicles passing throughthe check post.
An interesting facet, on the use of the weigh- bridge, came into light, during the study. In thetraditional system, weighing was not an exact procedure, due to non-availability of weigh-bridges at the check post. The inspectors used to stop only some suspect vehicles and estimatethe overload weight visually and by experience and collect penalty charges from them.

Page 15 of 42
With the introduction of the weighbridge, the exact weight is known for all vehicles. Neitherthere is a locking mechanism (where once a vehicle gets weighed through the electronic weigh-bridge, the system logs the transaction and does not permit non-payments for over loading)existing nor is the monitoring mechanism in place. Thus, CICP has offered a greater opportunityfor 'leakage'. Inspectors now randomly bypass the system and collect a smaller 'unofficial'amount in lieu of the large official penalty charges. Unwittingly, technology has become a usefuland perfect tool in the hands of the corrupt.
Possibly, introduction of suitable locking mechanisms and elimination of cash collection (byusing electronic means of payment like debit cards, etc.) at check posts may improve thesituation.
70% of the drivers complained that Inspectors habitually harass them (in spite of paying the dueamounts), sometimes even going to the extent of manhandling them.
ii. Check post By-passing
At times, for some reasons, truck drivers may not want to go through the check post. They maychose some other route, which would by-pass the check post. This practice was quite common inthe manual system, though the introduction of mobile checking squads has controlled thispractice to a large extent.
73% of drivers have responded that there is no impact of the new system on the trend of driversbypassing check posts. 4% of them see degradation to the extent of 3.0 in the new system, while22% perceive an improvement to the extent of 3.27. The overall positive impact is 0.61. Thecontrol group average is 3.00, which compares unfavorably with CICP average of 3.38. Thus,the infrastructure at CICP must have contributed to preventing trucks from bypassing thesystem.
iii. Transparency
56% of drivers perceive no difference in the transparency levels of both the old and new system.10% perceive a decline of 1.50, while 34% of drivers have noticed an average improvement by3.2. The overall positive impact is 0.93. The control group score is 3.33, which is a bit higherthan the CICP score of 3.44. Thus the drivers perceive the computerized check post to besomewhat more transparent in its processes.
3.2.2 Check Post Amenities
The drivers were asked to score their perceptions on the amenities at the check post (presented inthe questionnaire) on a 1 to 5 scale. The drivers have responded to the questions related to onlytwo amenities namely waiting lanes and parking facilities. The following table summarizes theanalysis of observations and the sections below present an analysis of the results of eachamenity.
Amenities at the Check PostsPerceptions Waiting ParkingNumber of Respondents 83 83Average SL: Before CICP 1.66 1.66% perceiving deterioration 4% 0Average SL: deterioration (1.67) -% perceiving no difference 23% 8%% perceiving improvement 73% 92%

Page 16 of 42
Average SL: Improvement 2.92 2.86Average SL after CICP 3.94 4.33Overall Impact 2.08 2.61Control group Respondents 16 16Average SL : control group 1.31 1.31
a. Waiting Lanes
73% of drivers find the convenience of having a well laid out waiting lane quite significant, ascore of 2.92 out of 5. Hence, the overall average positive shift works out to 2.08, with 23%finding no difference and with only 4% of the 83 responses being negative. The respondents ofthe control group perceive this amenity as not satisfactory, giving an average score of 1.31. Thusthis amenity is significantly enhanced both after computerization and in comparison with thecontrol group.
b. Parking Space
92% of drivers are satisfied and perceive a major shift in the parking amenities. Only 8% opinethat there is no change and there are no negative answers. Hence this factor has the highestpositive shift of 2.61, and can be clearly considered a significant by-product of CICP, providinga much-needed amenity to the weary driver. Control group respondents are not satisfied with theparking amenity and the average score works out to 1.31.
3.2.3 Inspector Behavior
Drivers were asked to score their perceptions on the RTO inspector’s behavior (politeness,fairness and efficiency) at the check post on a 1 to 5 scale. The following table summarizes theanalysis of observations. Sections below present an analysis of the results.
Attitude of InspectorsPerceptions Politeness Efficiency FairnessNumber of Respondents 106 106 99Average score before CICP 2.14 2.29 2.34% perceiving deterioration 5% 8% 6%Average deterioration (1.60) (1.88) (1.17)% perceiving no difference 82% 67% 77%% perceiving improvement 13% 25% 17%Average Improvement 2.14 2.41 2.88Average score after CICP 2.44 2.84 2.89Overall Impact 0.21 0.47 0.42Control group Respondents 11 10 11Average score for control group 3.09 2.70 2.64
a. Politeness
82% of drivers perceive no change in the behavior of inspectors. The status quo is maintained.5% of drivers perceive deterioration in this parameter and 13% find an improvement amountingto an average of 2.14. The overall impact is marginally positive (0.21). The average score for thecontrol group is 3.09 and that for CICP is 2.44. Thus, respondents at the non-computerizedcheck post find the inspectors more polite, although there is a small improvement at CICP, preand post computerization.
b. Efficiency

Page 17 of 42
67% of drivers have opined that there is no significant change in efficiency levels of Inspectors.25% of the respondents have stated some improvement (average score of 2.84), which leads toan overall positive shift of 0.47. The control group perceives that the inspectors at the non-computerized check post are marginally less efficient, with an average score of 2.7 as against theCICP score of 2.84. Thus, CICP has slightly enhanced the efficiency levels of inspectors.
c. Fairness
77% drivers perceive no change in the inspectors, with respect to fairness in dealings. 17% haveperceived improvement of 2.88, which reads into an overall positive shift of 0.42. The averagescore for the control group is 2.64 and that of CICP is 2.89. Thus the inspectors at CICP areperceived to be more fair and transparent, both in comparison to before computerization andwith a non-computerized check post.
3.2.4 Transporter Preparedness
The drivers were asked to score their perceptions of transporters on a 1 to 5 scale. The differencein the score of each parameter (overloading, documentation, tax compliance, license platecompliance, providing adequate cash) after computerization and before computerization iscomputed for each respondent. A positive value of such difference conveys an improvement andthe negative value conveys deterioration / dissatisfaction on the attitude parameter with referenceto the respondent. These values are averaged over all the respondents to obtain the overallimpact of computerization on the attitudes of the transporters. The following table summarizesthe analysis of observations. Sections below present an analysis of the results of each attitudeparameter.
Transporter PreparednessPerceptions Overloading Documentation Road Tax
PaymentsLicense
PlateAdequate
MoneyNumber of Respondents 106 96 97 92 100Average score before CICP 2.79 3.16 3.46 3.45 3.49% perceiving deterioration 7% 1% 0% 0% 2%Average deterioration (2.00) (2.00) - - (1.00)% perceiving no difference 71% 91% 99% 99% 92%% perceiving improvement 23% 8% 1% 1% 6%Average Improvement 2.22 2.75 4.00 1.00 2.17Average score after CICP 3.09 3.35 3.48 3.43 3.53Overall Impact 0.33 0.21 0.04 0.01 0.11Control group Respondents 8 8 8 8 8Average score for control group 3.25 4.00 4.00 4.00 4.00
a. Overloading
71% of the drivers perceive that there is no change in the pattern or routine of overloading bytransporters, post-computerization. 23% of drivers perceive some improvement and only 7%perceive deterioration (by a score of 2.00). Overall shift is positive at 0.33. The average score forthe control group is 3.25, higher than the CICP score of 3.09. Thus the attitude of transporterstowards overloading post computerization has improved marginally. An improvement heresignifies that transporters are more careful now and do not overload their vehiclesindiscriminately. The presence of accurate weighing mechanisms at the check post has madethem more cautious. However, at the non-computerized check post transporters are perceived asmore careful in overloading of goods.

Page 18 of 42
b. Documentation
91% of respondents perceive no difference in the documentation provided by transporters tothem. 8% have perceived an average improvement of 2.75, with an overall positive shift of 0.21.The average score for the control group works out to 4 which is far higher than 3.35 of CICP.This is possibly due to simple document checking procedures at non-computerized check post asthe drivers carry Gold Cards, and Inspectors know they would only be provided the cards if theirdocuments were in order and up-to-date.
c. Road Tax Payments
99% of drivers perceive no difference in payment compliance of road taxes aftercomputerization. The average score for the CICP works out to 3.48, which is less than 4.00 ofthe control group. This is again possibly due to simple document checking procedures at non-computerized check post.
d. License Plate Standard Compliance
99% of drivers have perceived no difference in the attitude of transporters towards compliance tolicense plate norms. None of the respondents have found any deterioration in the new systemeither. The average score for the CICP works out to 3.43, which is less than 4.00 of the controlgroup. This is also possibly due to simple checking procedures at non-computerized check post.The computerized check posts insist on standardization as they are expected to capture thelicense plate information through video cameras.
e. Providing Adequate Cash to Drivers
92% of drivers have perceived no difference in the attitude of transporters in terms of equippingthem with adequate cash. 2% perceive deterioration with an average deterioration of 1.0. 6% ofdrivers perceive an average improvement of 2.17. The average score for the CICP works out to3.53, which is less than 4.00 of the control group. This is possibly due to minimum cashrequirement at the non-computerized check post (due to gold card system).
3.2.5. Overloading and Over Dimensioning Patterns
The goods carried by the truck drivers have been classified into 7 main types as given in thetable below. A vehicle normally carries more than one type of consignment. Therefore the 126drivers interviewed carried 205 consignments. The average overloading and over dimensioningfigures of each type of goods is given in the table below:
Type of Goods No ofConsign-
ments
%Overloaded
AverageOverload
(Tons)
Nos. OverDimensioned
1. Chemicals, fertilizers, petrol, diesel, explosives, CP Oil 39(2) 51 (50) 4.55(2.0) 02. Perishables, food grains, edible oils, mutton, animals 23 (2) 43 (0) 2.22 (0) 03. Engineering goods, metal, industrial goods, lignite 57 (8) 68 (50) 3.85 (9.0) 34. Clothes, wood, thread, cotton, plastic, paper 38 (3) 58 (0) 3.64 (0) 35. Glassware, TV glass 7 (0) 43 (0) 3.33 (0) 16. Vehicles, tyres 5 (1) 0 (0) 0.00 (0) 3 (1)7. Mixed consignments, containers 36 (7) 33 (14) 4.17 (1.0) 2
Total 205 (23) 12 Note: The figures in brackets indicate the values for the control group

Page 19 of 42
A large number of consignments (68%) having engineering goods, metal, industrial goods,lignite (type3) are overloaded to the tune of 3.85 tons per consignment. The consignmentshaving type 4 goods (Clothes, wood, thread, cotton, plastic, paper) rank the second with 58% ofconsignments over loaded by an average of 3.64 tons per consignment. The consignmentscarrying chemicals, fertilizers, petrol, diesel are also overloaded (51% of consignments with anaverage of 4.55 tons per consignment). However, the consignment having vehicles and tyres arenever overloaded.
The type 1 and type 2 goods are not over dimensioned. All other types of goods are overdimensioned.
The overloading and over dimensioning pattern is same for the control group.
3.3 Government Official Responses
The study team of CEG-IIMA team interacted with the former transport commissioner (whoconceived and executed the CICP project) and other RTO officials to get their perceptions aboutthe computerized interstate check posts. The following sections give an analysis of the datacollected.
3.3.1 Transport Commissioner
When the transport commissioner took over his position in 1998, on a random observation of thecheck post operations recognized the need for improvement in the estimation and collectionsystems at the check posts in order to plug leakage of government revenues.
To start with, the commissioner introduced the Pre-paid Card System in 1998, allowing atransporter to voluntarily pay Rs. 1200 per month for overloading. This scheme allowed thevehicle to overload up to 20% of the permissible weight. This scheme proved to be quite popularand revenues jumped by 82% in that year (from Rs. 31 crores to 56 crores – see the table below).
a. Project Motivation
There were no mechanisms to check 100% of vehicles passing the check post for over loading.Typically it takes about 30 minutes for a RTO Inspector to manually examine and determineoverload penalty. Hence in a shift of 8 hours, he can check a maximum of 20 vehicles. Thenumber of RTO Inspectors has remained the same over the past decade and has in fact reduced,over the years. Hence, the Transport Commissioner was convinced that immense potential existsat the check post for revenue collection, provided there is a mechanism in place to check all thevehicles passing the check posts.
b. Project Execution
Computerization along with development of necessary infrastructure at check post locations(waiting lanes and parking zones, electronic weigh- bridges etc.) was all conceived and executedin period of 9 months. An amount of Rs19 crores for the equipment and software and an amountof Rs. 44 crores on the infrastructure development were spent, in total. It is to the credit ofgovernment of Gujarat and Transport Commissioner that the project was smoothly implemented.

Page 20 of 42
The government approved the project and gave all clearances in record time. The commissionerensured that all the RTO officials, who may have viewed CICP as a potential threat, were madeparties to the implementation of project from the conception itself. They were given training oncomputers and some of them were involved in developing programming modules of thesoftware. This process inculcated a sense of ownership of the computerized system in the RTOofficials.
The penalty charge in the traditional system was Rs. 2000 per ton. This was significantlyreduced to Rs. 250 for the first ton of overload and Rs. 150 from the 2nd ton onwards.
The study team has observed that after the smooth implementation and running for about a year,the Transport Commissioner was transferred within one year of the execution of the project.Though installed, monitoring mechanisms are not being utilized. Maintenance and servicecontracts were not cleared even after a period of one year due to which the service providerwithdrew his people. This provided an opportunity for the RTO staff to misuse the system (seesection 3.2.6 above).
3.3.2 RTO Inspectors
7 RTO Inspectors from 3 computerized check posts were interviewed during the data collectionphase. All the Inspectors are over 40 years of age. 6 of them are diploma holders in AutomobileEngineering and one in Mechanical Engineering. None of them have been at the check post formore than 3 years.
a. Perceptions
The RTO Inspectors opine that there are shorter queues after computerization and much time issaved. The inspectors perceive that 25 to 30% of vehicles are overloaded and there is no shift inthis pattern even after computerization.
Due to transparency introduced by the system, Incidents of conflicts with the drivers have alsoreduced considerably. They perceive a reduction in their workload, after the introduction of thecomputerized system.
The Inspectors were asked to grade the processes before and after computerization, on a scale of1 to 5 (1 being the lowest grade).
i. Impact on Processing
The Inspectors perceive that there is a significant shift (from 2 to 4 on the 5 point scale) in all thecomponents in processing, post computerization. That is, weighing and computing, collection offine, issuing receipts, transparency, workload, and overall effectiveness has all improved to agreat extent. However, 2 of the inspectors have stated that workload has remained the same orincreased with the introduction of the computerized system.
Activities Average perceived difference(After-Before)
Weighing & Computing Bill +2.0Collection of Penalty Amounts +2.5Issuing Receipts +2.0

Page 21 of 42
Checking Documents +1.5Transparency +3.0Workload +1.0 (range from –4 to +2)Overall effectiveness +3.0
About 700-800 vehicles are checked in a span of 8 hours, at each check post. In the manualsystem the inspectors were able to check only about 15 to 20 vehicles in a shift of 8 hours.
The average time taken for weighing of vehicles, bill preparation, and checking of documentswas about 1.5 to 2 hours, on an average, in the traditional system. In CICP, as per the feedbackfrom RTO Inspectors, it takes about 5 to 10 minutes to accomplish the same tasks.
Average Duration Before (minutes) After (minutes) Improved by(minutes)
Weighing 35 2.6 32.4Receipt preparation 15 3.6 11.4Document checking 6 4 2Daily accounts closing* 60 10 50
* At the end of the day, daily ledgers are prepared which took more than an hour earlier but takes onlyabout 10 minutes now at the Syamalajee check post only. However, at Bhilad and Samkhiyalicheck posts, the closure of accounts is still a manual process and hence, does not offer any benefiton closure of accounts.
ii. Impact on drivers
The inspectors perceive that the impact on drivers is also quite favorable. The confidence ofdrivers in the system rose from 1 or 2 to 4 or 5 (on a scale of 1 to 5) in the new system. OneInspector has stated that preparedness (payment, etc) of drivers has come down somewhat, in thenew system.
Impact on DriversAverage perceiveddifference (After-Before)
Confidence on system +2.0Compliance to rules +2.0Preparedness +1.0 (range from –2 to +4)
iii. Coping with Change
The 3 inspectors interviewed at Bhilad feel that the targets set for them are higher than what isachievable.
The Inspectors at Shamkhiyali have complained that though the system (the weighbridge iscompletely destroyed) was badly damaged in the earthquake of January 2001, the repairs are yetto be done. This check post was established after computerization, and is the only check post inthe interior of the state (the remaining 9 are on the border of Gujarat). This check post is quiteinhospitable as it is in the middle of thick under-growth, yet there were no amenities constructed
Page 22 of 42
at the check post there, by the government. The Inspectors put in their own funds to construct acabin at the check post.
That the maintenance of the infrastructure at the site is quite poor, is the opinion of all theInspectors. The weighbridge develops 5-6 serious problems in a year. There has been nomaintenance of the equipment in the past 1 year.
70% of the trucks, which pass through this check post, are over loaded. The inspectorsexperience that when the traffic density is high, 3-4 lanes are made operational and during suchperiods, having only one cashier is turning out to be a severe bottleneck.
It may be noted that there is considerable discrepancy between the perception of the drivers andinspectors, as brought out by this study. While a natural difference is expected, the significantdiscrepancy that emerges here is important. This may be attributed to the tendency on the part ofInspectors to exaggerate the positive elements of the system while ignoring the customers' (truckdrivers) viewpoint. At times the truck drivers may also be quite critical of the system, especiallyif they have experienced inconveniences at CICP.
3.4 Responses from Clients of Transport Companies
The manufacturers, traders or other companies, which have to dispatch their goods (inter-state)were interviewed, telephonically, for their views and perceptions on the CICP. In all 8companies shared their views with the study team, with 3 organizations declining to participatein this process.
The composition of the organizations that shared their views is as under:
Textiles(1), Chemicals (3), Pharmaceuticals (1), Milk marketing and distribution (1), HeavyEngineering (1), Electronics (1).
All of them are medium to large sized companies. They all dispatch 4 to 10 truckloads ofmaterial each day, on an average.
Each company has a transporter allocated to a particular route.
3.4.1 Perceptions
All the companies interviewed, except one, said that they were not aware of the computerizedcheck posts or the overloading penalties. They opined that the transporter does not overload thevehicle at their premises, so they do not know about such occurrences.
Only one medium sized chemical exporter opined that the transporter is more vigilant now andhas become a stickler for rules. His perception is that the tendency to overload the vehicle hasreduced now.
3.5 Transporter Responses
An important category of stakeholders in CICP is the transporters. The transporters decide theoverload to be carried and through their powerful state level association are able to influence thegovernment on determining the penalty charges for overloading.

Page 23 of 42
When the project was conceived, the erstwhile Transport Commissioner had sought and obtainedfull participation from the transporters. They were kept abreast of the project at all stages and thetransporters participated in the installation of the system at all the check posts.
During the survey, transporters were interviewed telephonically. In all, about 7 transporters werespoken to. Out of these, 2 are large national level transport companies, 4 are medium sized andthe remaining 3 are small transport companies.
At the beginning of the telephonic interviews, transporters were hesitant to talk aboutoverloading and payment of penalties. They did not wish to be perceived as lawbreakers orcreate any sort of controversies, as they perceived this survey as government sponsored.
The big transport companies have stated that they do not need to overload their vehicles. Theyhave their regular customers (large industrial houses), who supply them with regular business. Itis economically infeasible for them to overload their vehicles.
The medium and small sized transport companies tend to overload their vehicles. The primary(and probably the only) cause of overloading is the severe competition amongst them. Theirrationale for overloading is that a vehicle can carry larger consignments and hence, they canoffer competitive prices to their clients. Ultimately, it is the client who has to bear the penaltyamount.
3.5.1 Perceptions
a. Weighing
The transporters have found the weigh- bridge to be quite useful. It helps in accurate weighing ofthe vehicle, thereby avoiding ugly confrontations between the drivers and check post officials.50% of transporters stated that they are more careful in weighing the consignments whileloading the truck. The practice of making 2 lading bills, has also stopped now, as they know thatweighing will be accurate at the check post.
b. Payment System
The transporters interviewed were somewhat dissatisfied with the payment system at the checkposts. Over and above the official penalty amount, their drivers have to pay up additionalmoney. Since it is unaccounted, they are not sure about the exact money paid and have toreimburse the driver whatever money he claims to have paid.
All transporters are unanimous in their strong desire for smart cards to be deployed for paymentprocedures, to prevent malpractice and for their convenience.
3.5.2. Problems and Suggestions
Transporters have stated that corruption and harassment at the check post are going on as before.In particular, they opine that paying additional money does not hurt as much as the harassmentcaused to the drivers at the check post.
The transporters are quite satisfied with the computerized system and take pride in thetechnological advancement. However, they are unanimous in suggesting that the whole system

Page 24 of 42
can be modified so that human interface is minimized and all stakeholders are benefitedsignificantly. 4 transporters suggested that a Card System may be re-introduced, wherebytransporters pay a lump sum amount periodically and are issued a Card, which can be shown bythe driver at the check post. This amount can be paid on the basis of overload normally carriedby them.
3.6 Total Solution Provider Responses
The study team interviewed the primary functionary of the Total Solution Provider (TSP)organization for their feedback on their contractual participation in the project, problems faced inthe implementation and day-to-day operations, and learning.
The TSP started development of the system in September 1999. The work entailed seamlessintegration of the various technology components at all the 10 check posts (totaling to 58 lanes)and development of the software application for the computers at the check post and the ControlRoom.
Implementation at the first check post was completed in March 2000 and by July 2000 theremaining 9 check posts were commissioned
3.6.1 Project Contract
A ‘build and maintain’ contract was drawn up for 1 + 15 years. That is, one year of warrantyperiod of equipment and 15 years of maintenance by TSP. The exact maintenance charge wasnot specified in the contract.
Although it was not specified in the contract, the TSP also undertook the system operations at allthe check posts, for more than a year, to keep the project running successfully.
In the meantime, an independent authority, which was engaged to estimate the maintenancecharges for the systems, has pegged the maintenance cost at 8% of the total system cost, whichworks out to Rs.1.5crores. This was accepted by the TSP. Yet, the contract was not executed.
3.6.2 Problems
Procedural delays (where the files were moving back and forth between departments) have heldup the signing of an operating and maintenance contract between the TSP and state government.This is compounded by the fact that the Transport Commissioner has changed 4 times duringthis period of eighteen months. In spite of these delays, the TSP operated the systems for morethan a year and subsequently withdrew his operating staff. Thus, operations at the check post areaffected (as observed by the study team and mentioned earlier in the report) and most of theequipment remained unutilized at all the check posts. Even 1 year and 4 months after expiry ofwarranty period the contract has not been finalized, for operations and maintenance of the CICP,thus demonstrating lack of ownership and seriousness on the part of the state government.
3.6.3 Suggestions
Based on the experiences of operating a large and technologically sophisticated e-governanceproject, the TSP strongly opines that the following factors must be taken into consideration indeveloping e-governance projects:

Page 25 of 42
a. The contract between a private TSP and the government should be for a minimum of 4 years(1 year of warranty and 3 years of annual maintenance contract). The percentages andamounts should be worked out at the beginning itself. The contract should also take care ofupgrading of technology as usually the equipment gets obsolete after 4-5 years.
b. The manpower operating the check posts should be drawn from the government departmentsand trained adequately.
c. Independent bodies should carry out regular Technical Audits of such projects to ensureproper utilization of systems, check the misuses (like using weighbridge to collectunaccounted money) and assess the impact and sustainability.
d. Creation of databases must be carried out on a war footing and in parallel to the developmentof the project. Lack of appropriate and complete databases hinders the day-to-day running ofthe system, as data entry operators may register inaccurate data, deliberately or as a genuinemistake.
e. The government departments should take ownership of the project and monitor its workingand performance on a consistent basis. This is perhaps one of the most important elements toensure sustainability.
4.0 Financial Costs and Benefits
The financial costs at the check post can be attributed to two main components - technologyequipment and infrastructure build-up. Technology equipment includes the weigh- bridges,computers, printers, video cameras, video servers, database servers and other such hardware.Infrastructure refers to the development of lanes, construction of small cabins and installation oftraffic and flood- lights at the check post.
4.1. CICP Costs
CostPer lane
Total Cost Remarks
ElectronicEquipment at CP(58 lanes in 10check posts)
Rs. 38 lacs Rs. 19 crores Includes Rs. 78 lacs spent on control Room atAhmedabad : Rs. 38 lacs for construction ofControl Room Building and Rs. 40 lacs forhardware procurement at the Control Room.
Civil works(Widening ofhighway, etc.)
Rs. 75 lacs Rs. 44 crores. Does not include cost of acquiring land.
Page 26 of 42
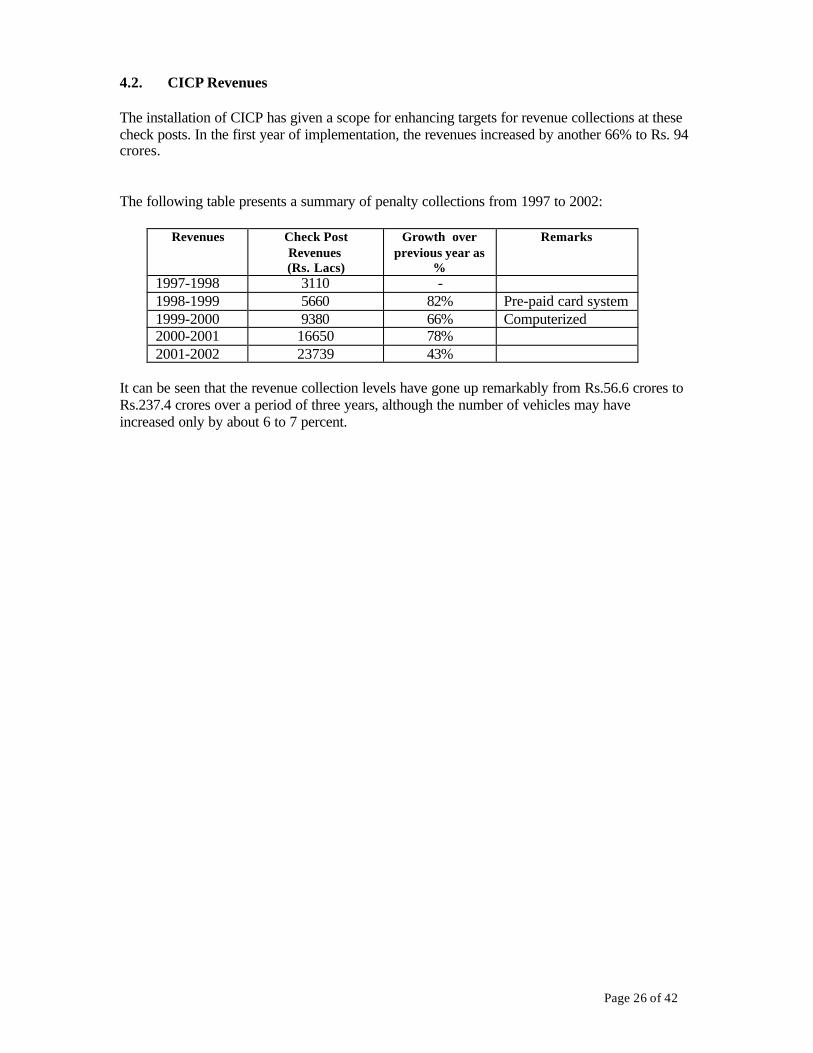
4.2. CICP Revenues
The installation of CICP has given a scope for enhancing targets for revenue collections at thesecheck posts. In the first year of implementation, the revenues increased by another 66% to Rs. 94crores.
The following table presents a summary of penalty collections from 1997 to 2002:
Revenues Check PostRevenues(Rs. Lacs)
Growth overprevious year as
%
Remarks
1997-1998 3110 -1998-1999 5660 82% Pre-paid card system1999-2000 9380 66% Computerized2000-2001 16650 78%2001-2002 23739 43%
It can be seen that the revenue collection levels have gone up remarkably from Rs.56.6 crores toRs.237.4 crores over a period of three years, although the number of vehicles may haveincreased only by about 6 to 7 percent.

Page 27 of 42
5.0 Summary and Conclusions
This section summarizes the analysis of the study.
1. The government of Gujarat, specifically the erstwhile chief minister deservescommendation for the political will demonstrated through the speedy approval of theproject. This is perhaps the most crucial element for any governmental project to gainacceptability. This project was conceived at a time (98-99) in the state when e-governance was yet to take off. However, the same degree of seriousness was notexhibited subsequently during the maintenance phase of the project to ensure itssustenance. Signs of decline due to this apathy are already and clearly visible.
2. The project champion, the erstwhile Transport Commissioner, deserves commendationfor conceiving and executing such a complex project in a period of nine months.Obtaining the various government clearances, developing the road and buildinginfrastructure, importing equipment, getting the software developed, and involving andtraining the internal staff have all been accomplished remarkably well.
3. The Total Solution Provider has efficiently configured the system, integrated the variouscomponents and executed the project on time. In spite of not having a formal contract,the company has extended operations support to the project for a year. This ensured thestabilization of operations at all check posts in the initial period of implementation.
4. Computerized Interstate Check Posts were created with multiple objectives of enhancinggovernment revenues by improving efficiency of check post operations, pluggingrevenue leakage and minimizing harassment of transporters. Surprisingly, the projectobjectives did not include remedial measures to minimize overloading/over-dimensioning trends and improve safety of the truck traffic. The system design did notinclude the database creation or alert mechanisms for habitual violators of norms.
5. The main stakeholder of the system, the state government, has benefited quitesignificantly from the project. The technology at CICP has enabled 100% checking ofvehicles and remarkably enhanced the revenue collections from Rs.56 crores to Rs.237crores in three years, although the number of vehicles seems to have gone up only by7%. Thus, it can be said that one of the main objectives of the system is wellaccomplished. However, the government did not seem to have plans to invest thesecollections for corrective actions or improvement of the amenities for the drivers /transporters.
6. While the revenues from each check post have shot up, the leakage has apparently notbeen plugged totally. Unaccounted money is still collected from check posts from about36% of vehicles by collecting less than 10% of official penalty charges. This indicatespoor monitoring and misuse of technology.
7. Harassment of truck drivers continues. Around 11% of the drivers who paid the officialcharges for overloading / over dimensioning, were also made to pay some (Rs.38 onaverage per vehicle) unaccounted money. Most of the drivers mentioned that thispercent is much more. The display panel showing the weight and penalty details of thevehicles to the drivers is always switched off, there by not letting the driver to see themeasured value.

Page 28 of 42
8. While a majority of truck drivers feel that the overall attitude of the inspectors continuesto be negative even after computerization, a few perceive that the fairness of treatmentgiven to them at check posts has improved slightly.
9. Drivers find the electronic weigh- bridge at the check post a major value addition.Disputes over weight have been taken care of and transporters are careful at the loadingpoint itself, to indicate the accurate weight. Thus, the weigh- bridge is a useful piece ofequipment. However, the total time taken to cross a check post remained the same or hasincreased slightly.
10. The truck drivers find that the two amenities at the check posts namely waiting lanes andparking sites are quite comfortable and a value addition in the new system.
11. The RTO inspectors are able to check all 100% vehicles at CICP. They however feelshortage of cashiers during peak hours. They take pride in the computerized system.They concerned about lack of maintenance of systems.
12. The transporters are happy with the integrated electronic weighbridge at the check posts.They are however uncomfortable with the payment system at CICP. They still feel thatcorrupt practices and driver harassment exist at CICP. Most of them prefer electronicpayment systems to avoid money leakage. There is some perceived improvement in thedocumentation by the transporters. Since the weight of the vehicle will be accuratelychecked by the weighing system at the check post, the transporter are now careful andrecord genuine weight figures in their documents before dispatching the consignments.
13. The bigger clients of transporters do not perceive any difference to the transportationprocesses or costs due to computerization at check posts. The medium and smallindustries have experienced some improvements in the practices of transporters. Somefeel that double documentation is now eliminated and transporters are now careful aboutoverloading the vehicles. Some others complained that the costs have gone up withcomputerization as they perceive that the transporters are using the computerization asan excuse to charge extra by about 5 to 10%
14. The government has failed in ensuring the sustenance of the project. The projectmanager, the Transport commissioner was transferred with in a year of thecommissioning of the project. With in a subsequent period of 18 months, fourcommissioners were posted and transferred. The maintenance and operations contractswere not renewed on time. Monitoring mechanisms to ensure that the technology is notmisused were not put in place. These lapses have resulted in defeating the objectives.The study team has observed the bypassing of technology by RTO staff at all the threecheck posts surveyed. The databases are not fully created and maintained at the controlroom. Video cameras are switched off at the check post preventing monitoring fromcontrol room.
15. The technology deployed is not fully utilized in this system. The total computerizedoperations should be re-started at every check post. Towards this, the contractingprocess at the state government level should be expedited. A comprehensive contractshould be drawn up, for a minimum of 3 years, to operate and maintain the equipment atthe check posts. The Control Room should be re-activated, as it is the nerve centre ofCICP, allowing monitoring and supervision of the activities at the check posts. This is a

Page 29 of 42
crucial factor, without which CICP cannot be totally successful. Electronic paymentsystem should be introduced in CICP. This will streamline the payment process andremove redundancies and inefficiencies of payment process (waiting at the cashierwindow, unaccounted collections etc.).
6.0 Recommendations
Based on the lessons learnt from the Computerized Interstate Check post project in Gujarat,India, the study team has the following recommendations for future e-Governance projects:
1. The model of project conceptualization and execution through private public participation(PPP) adopted in this project by Gujarat Government is desirable for projects of thiscomplexity. This model has fetched good results in a remarkable time frame and perhaps at alow cost in case of the check post project.
2. The project objectives must be much broader than minimizing leakage and increasing thegovernment revenue. They must address the main problem of the tendencies on the part oftransporters to violate the norms on permissible truckloads. Since 100% checking ispossible with technology, development of databases and alert systems must be given equalimportance in improving the loading practices, there by improving the safety of the trucktraffic.
3. It is important to invest certain percentage of revenue collections in improving the amenitiesfor the stakeholders of the system. This would demonstrate the government’s interest in thewell being of the stakeholders.
4. The design of projects that are aimed at preventing corruption or plugging leakage must bereviewed thoroughly before implementation, to examine the mechanisms through whichcurrent corrupt processes are detected and controlled through the new system. Such reviewmust also examine the possibilities of misuse of the new system and how the system isdesigned to be tamper-proof. Without such reviews, the technology would not succeed inreducing or eliminating corruption. Instead, it might help bring in new methods ofcorruption, while reducing old practices only partially.
5. The project design must include tight monitoring mechanisms of the computerizedprocesses. They must be sound (difficult to bypass) and put in place right from the cut-offdate. Lack of flawless monitoring systems and political will to enforce them strictly wouldplace the powerful technology in the hands of vested interests for misuse and exploitation asin this case.
6. The process of change over (from builder to operators) must be well defined and wellmanaged. If the system has to be managed in house, environment must be created for thebuilder to transfer control to internal staff. Staff must be well trained to own the system. Allcontrol systems must be in place to ensure that the systems are neither bypassed normisused.
7. Contracts for maintenance / operations must be executed on time to ensure that the serviceproviders can plan their activities and staff. A longer period of indecision demoralizes theservice providers and threatens the sustainability of the project. Implementing projects atlightening speed without seriously incorporating maintenance and operating arrangementswould hurt their sustainability.
Page 30 of 42
8. Since technology is changing rapidly, the project must plan to benefit from the adoption oflatest technological components from time to time. The project plan must include upgrade oftechnology periodically (every 2 to 3 years).

Page 31 of 42
Annexures
Annexure No. Topic Page No.
1. Map of Gujarat with Check Posts 30
2. Functions of a Check Post 31
3. Traditional Check Post 32
4. Computerized Interstate Check Post 33
5. Questionnaire for Truck Drivers 35
6. Questionnaire for Government Officials 38
7. Technology Status at CICP 40

Page 32 of 42
Annexure 1: Map of Gujarat with Check Posts
1
234 5
6
7
8
9
10
Check Post Number of Yearly BorderingLocation Lanes Traffic * State
1. Shamlaji 12 7,70,000 Rajasthan2. Palanpur 6 4,38,000 Rajasthan3. Deesa 6 3,46,000 Rajasthan4. Tharad 2 40,100 Rajasthan5. Ambaji 2 36,500 Rajasthan6. Shamakhilai 6 5,56,000 Inland (Port)7. Bhilad 12 8,03,000 Maharastra8. Songadh 6 5,11,000 Maharastra9. Dahod 6 4,01,000 Madhya Pradesh10. Zalod 2 73,000 Madhya Pradesh
* As captured by the computerized system from August 2000 to July 2001

Page 33 of 42
Annexure 2: Functions of a Check Post
Inter state check posts exist in all states of India. Their functions are almost the same
everywhere.
The primary function of a check post is to stop a vehicle and check whether road tax has been
paid for the particular vehicle. The taxes are computed on the tonnage capacity of the vehicle.
They can be paid at the local Regional Transport Office or at the check post itself.
The secondary function of a check post is to check vehicles for overloading, and accordingly
compute the penalties.
The RTO Inspectors stationed at the check post are authorized to check the weight of goods
being carried and also examine the vehicle documents. They can also penalize for offences like
broken or damaged headlights and non-standard license plates. Inspection of the value or type of
goods is not in their scope of duties.

Page 34 of 42
Annexure 3: Traditional Check Post
_______________________________________________________________________
_
Each box in the diagram represents a process or set of processes carried out at the check post. The averagetime period taken for the process is also provided in the box. A brief explanation of each process isprovided below:
1: A suspect vehicle is flagged to a stop and stands in queue at the check post (CP).
2: By visually inspecting the truck, the Inspector determines the probable overload. For better weightestimation (in case of doubt/dispute), vehicle sent to a privately owned weighbridge, close by.
3: RTO Inspector assesses over dimensional vehicles, also and the over weight carried by the vehicle.
4: The RTO Inspector checks the documents of the vehicle (Registration book, national permit, anddriver's license).
5: The penalty is computed on the basis of charge per ton of over weight carried. Overload is determinedby subtracting the permissible weight from the actual (over loaded) weight of the vehicle.
6: A Penalty receipt is issued to the driver, which shows the amount of penalty to be paid.
7: The driver pays the money (by cash) at the Cash Collection Counter.
8: After completing all the formalities the vehicle exits from the check post.
7. CashCollectionCounter at CP
2. Private WeighBridge
(In the vicinity) (Average wait of38.8 minutes)
3. RTO Inspector - OL/OD Assessment4. Manual checking of RC documents5. Computation of Penalty Charges6. Issuance of Penalty Receipts(Average wait of 22.4 minutes)
1. Vehicles waiting in queue to enter CP(Average wait of 46.6 minutes) 8. Vehicles exit from CP

Page 35 of 42
Annexure 4: Computerized Interstate Check Post
Each box in the diagram represents a process or set of processes carried out at the check post. The averagetime period taken for the process is also provided in the box. A brief explanation of each process isprovided below:
1: All vehicles come to a stop at the check post and wait in queue for their turn.
2: The vehicle is weighed on the weigh- bridge. The weight is transmitted to the computer in he cabinlocated at the CP.
3: The license plate number of the vehicle is captured by the video camera located at the check post. Thisis transmitted to the Video Server.
4: In the Video Server Room located at the CP, the license plate number is converted from image to textform and transmitted to the Control Room at Ahmedabad, via dedicated telephone lines.
5: In the computerized process, all the check posts in Gujarat are monitored from a central location at theRegional Transport Office in Ahmedabad. This central location is called the Control Room. Details ofthe vehicle are accessed from the central database stored in the Control Room's server, with the help ofthe license plate number.
6: The License Plate Tracking System is the software application which converts the video images intotext, for accessing the database of vehicles stored on the server in the Control Room at Ahmedabad.
1
11. Cash Collection Counter
3. Video Camera; Check Post Cabin with computer & printer8. RC details retrieved from RTO (Vehicle Database)9. Compute OL Penalty Charges10. Display on Electronic Panel(Average wait of 26.4 minutes)
2.WeighBridge (9.5 m.)
Parking Lane: waiting -non-availability -cash, documents..
4. VideoServerRoom
5. Server at State RTO
Control Room
3
7. Database of Vehicles
6. License PlateTracking System
111.Vehicles waiting in Queue(42 m.) 12. Vehicles exit from CP

Page 36 of 42
7: The database of vehicles is stored in the Database Server located in the Control Room. Database of alltransport vehicles registered in Gujarat has already been created. Online addition of additional vehiclesis also possible directly from the check post. In case of any default in payment of taxes, the databasedisplays an appropriate message on the check post computer, for the vehicle being processed.
8: The vehicle details are accessed from the vehicle database and displayed on the computer at the checkpost. The permissible weight allowed for the particular vehicle type is also displayed.
9: The software computes the overload penalty based on the permissible weight, actual weight beingcarried and the charges per ton of overload. The computer generates a receipt, which is handed over tothe driver
10: To enable transparency in the process, the overload weight, the permissible weight and the penaltyamount are displayed on an Electronic Display Board, positioned outside the computer cabin. This isquite beneficial to the driver, as he knows the exact overload status of his vehicle. If the driver is notcarrying sufficient cash or does not have all the documents of the vehicle, he parks the vehicle in theparking lane and goes to the nearest office of the transporter to collect the money. In the meantime, hedeposits the vehicle documents at the Check Post. At times, it may even take 2 to 3 days for clearanceof the truck, as the office of the transporter may not be situted close by.
11: The overload penalty charges are paid by the driver based on the amount given in the computer-generated receipt, at the cash collection counter.
12: The vehicle exits the check post after completing all the formalities at the check post.
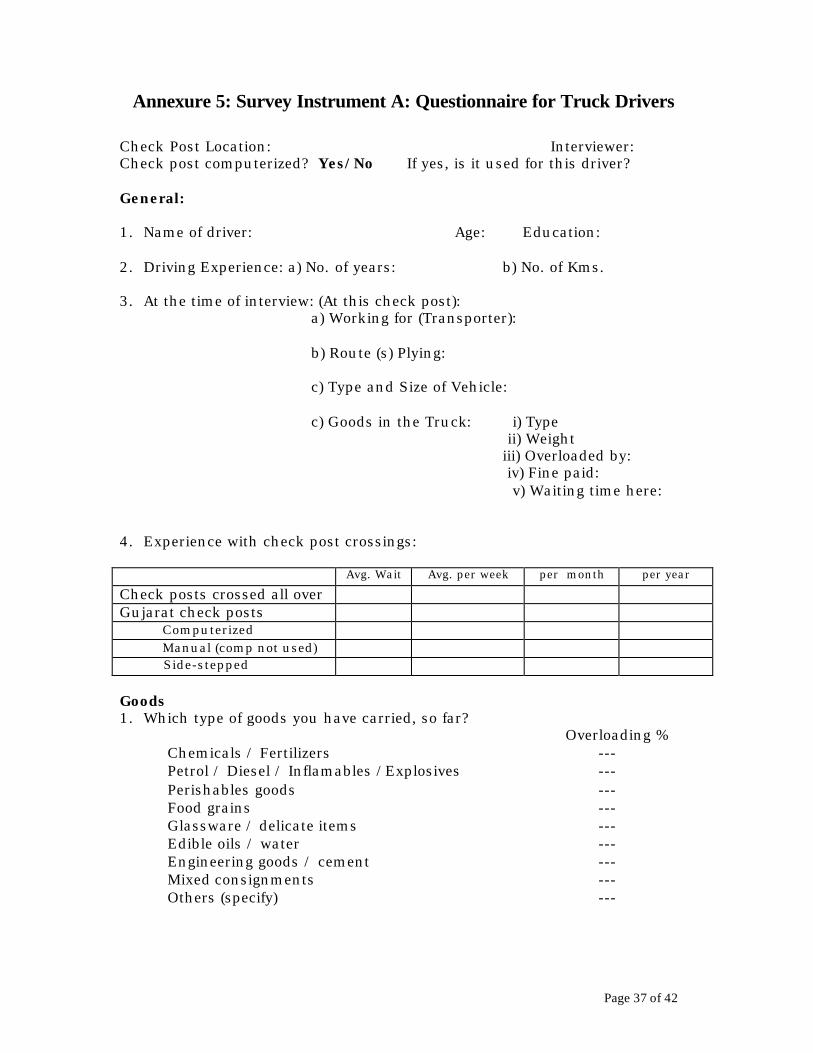
Page 37 of 42
Annexure 5: Survey Instrument A: Questionnaire for Truck Drivers
Check Post Location: Interviewer:Check post computerized? Yes/No If yes, is it used for this driver?
General:
1. Name of driver: Age: Education:
2. Driving Experience: a) No. of years: b) No. of Kms.
3. At the time of interview: (At this check post):a) Working for (Transporter):
b) Route (s) Plying:
c) Type and Size of Vehicle:
c) Goods in the Truck: i) Type ii) Weightiii) Overloaded by: iv) Fine paid: v) Waiting time here:
4. Experience with check post crossings:
Avg. Wait Avg. per week per month per year
Check posts crossed all overGujarat check posts Computerized Manual (comp not used) Side-stepped
Goods1. Which type of goods you have carried, so far?
Overloading %� Chemicals / Fertilizers ---� Petrol / Diesel / Inflamables /Explosives ---� Perishables goods ---� Food grains ---� Glassware / delicate items ---� Edible oils / water ---� Engineering goods / cement ---� Mixed consignments ---� Others (specify) ---
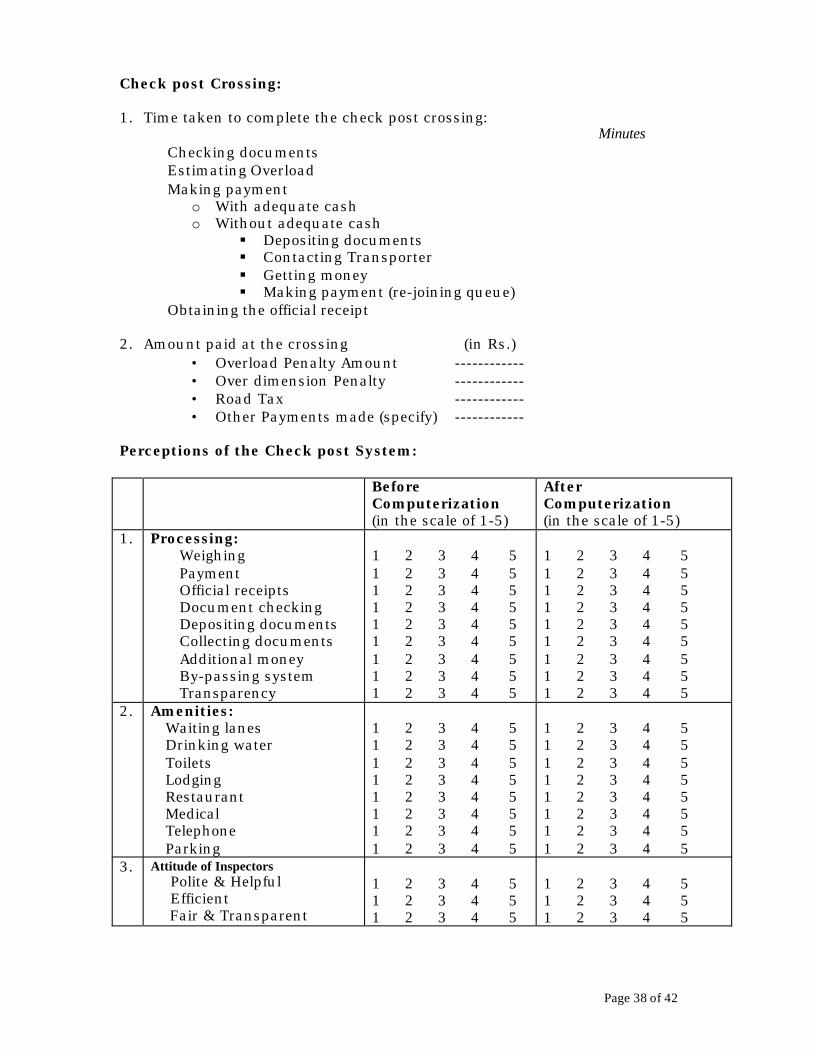
Page 38 of 42
Check post Crossing:
1. Time taken to complete the check post crossing:Minutes
� Checking documents� Estimating Overload� Making payment
o With adequate casho Without adequate cash
§ Depositing documents§ Contacting Transporter§ Getting money§ Making payment (re-joining queue)
� Obtaining the official receipt
2. Amount paid at the crossing (in Rs.)• Overload Penalty Amount ------------• Over dimension Penalty ------------• Road Tax ------------• Other Payments made (specify) ------------
Perceptions of the Check post System:
BeforeComputerization(in the scale of 1-5)
AfterComputerization(in the scale of 1-5)
1. Processing: Weighing Payment Official receipts Document checking Depositing documents Collecting documents Additional money By-passing system Transparency
1 2 3 4 51 2 3 4 51 2 3 4 51 2 3 4 51 2 3 4 51 2 3 4 51 2 3 4 51 2 3 4 51 2 3 4 5
1 2 3 4 51 2 3 4 51 2 3 4 51 2 3 4 51 2 3 4 51 2 3 4 51 2 3 4 51 2 3 4 51 2 3 4 5
2. Amenities: Waiting lanes Drinking water Toilets Lodging Restaurant Medical Telephone Parking
1 2 3 4 51 2 3 4 51 2 3 4 51 2 3 4 51 2 3 4 51 2 3 4 51 2 3 4 51 2 3 4 5
1 2 3 4 51 2 3 4 51 2 3 4 51 2 3 4 51 2 3 4 51 2 3 4 51 2 3 4 51 2 3 4 5
3. Attitude of Inspectors Polite & Helpful Efficient Fair & Transparent
1 2 3 4 51 2 3 4 51 2 3 4 5
1 2 3 4 51 2 3 4 51 2 3 4 5
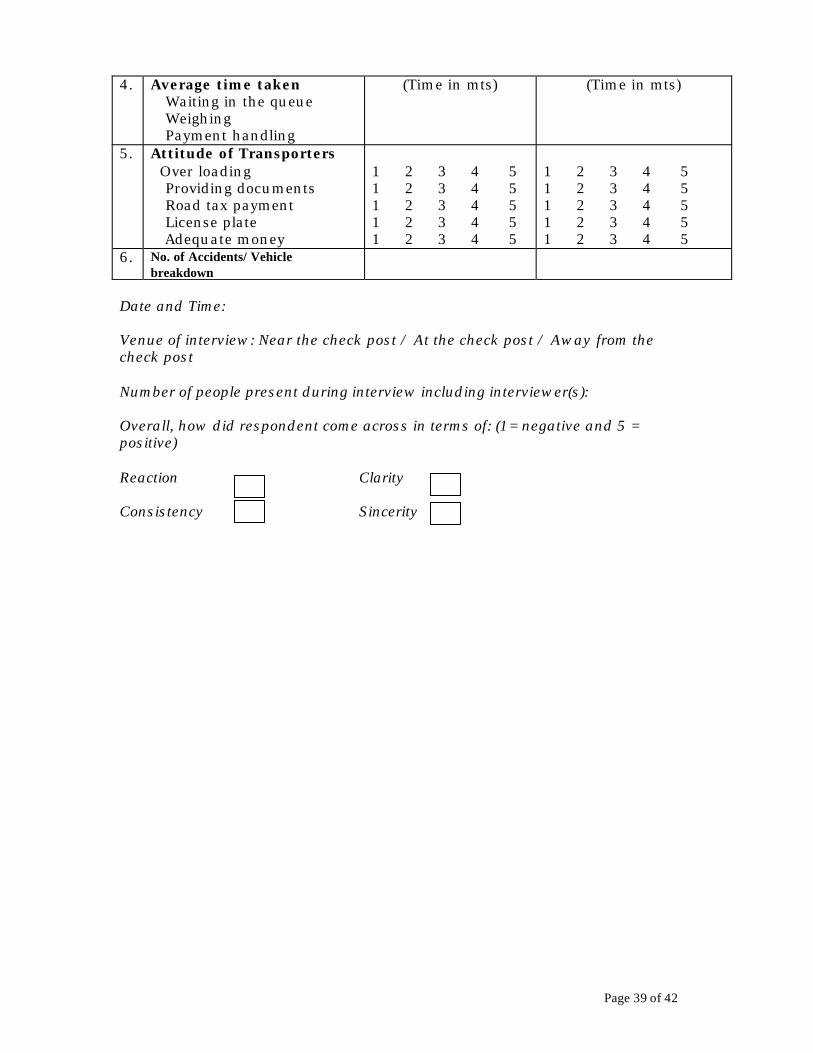
Page 39 of 42
4. Average time taken Waiting in the queue Weighing Payment handling
(Time in mts) (Time in mts)
5. Attitude of Transporters Over loading Providing documents Road tax payment License plate Adequate money
1 2 3 4 51 2 3 4 51 2 3 4 51 2 3 4 51 2 3 4 5
1 2 3 4 51 2 3 4 51 2 3 4 51 2 3 4 51 2 3 4 5
6. No. of Accidents/ Vehiclebreakdown
Date and Time:
Venue of interview: Near the check post / At the check post / Away from thecheck post
Number of people present during interview including interviewer(s):
Overall, how did respondent come across in terms of: (1= negative and 5 =positive)
Reaction Clarity
Consistency Sincerity

Page 40 of 42
Annexure 6: Survey Instrument B: Questionnaire for Inspectors
Check Post Location: Interviewer:Check post computerized? Yes/No If yes, is it used currently?
Name: Age: Education:
1. Duration of posting at this check post:
2. Total experience as inspector at check post (in years):
Inspector's perceptions
BeforeComputerization(in the scale of 1-5)
AfterComputerization(in the scale of 1-5)
1. Processing: Weighing & computing Collection of fine Issuing receipts Checking documents Collecting documents Returning documents Transparency Work load Office Ambience Overall effectiveness
1 2 3 4 51 2 3 4 51 2 3 4 51 2 3 4 51 2 3 4 51 2 3 4 51 2 3 4 51 2 3 4 51 2 3 4 51 2 3 4 5
1 2 3 4 51 2 3 4 51 2 3 4 51 2 3 4 51 2 3 4 51 2 3 4 51 2 3 4 51 2 3 4 51 2 3 4 51 2 3 4 5
7. Impact on Drivers Confidence on system Compliance to rules Preparedness
1 2 3 4 51 2 3 4 51 2 3 4 5
1 2 3 4 51 2 3 4 51 2 3 4 5
8. Average time taken Weighing Bill preparation Document checking Document collection Returning documents Closing of daily accounts Others (specify)
(Time in mts) (Time in mts)
9. Vehicle Statistics (daily) Nos. checked by inspector Nos. over loaded Overload fine collection Road tax collection Any other collectionsTotal inspector’s targetTarget achieved so far
(Rs.)(Rs.)(Rs.)(Rs. pa)(Rs. pa)
(Rs.)(Rs.)(Rs.)(Rs. pa)(Rs. pa)

Page 41 of 42
Problems Faced:
Frequency (Number of times)This month This quarter Year-to-date
Nature of Problem
No. ATR No. ATR No. ATRPower Supply breakdownConnectivity breakdownSlow response timeComputer HW failureWeigh bridge failureElectronic display boardSoftware failure
ATR: Average time to rectify (in hrs)
Date and Time:
Venue of interview: Near the check post / At the check post / Away from thecheck post
Number of people present during interview including interviewer(s):
Overall, how did respondent come across in terms of: (1= negative and 5 =positive)
Reaction Clarity
Consistency Sincerity

Page 42 of 42
Annexure 7: Technology Status at CICP
Status at check postTechnologyComponent
PurposeBhilad Shamlajee Shamkhiyali
Video Camera,Video Server,License PlateTracking System(Located at CP)
Capture images of lanes,license plates –Transmit to ControlRoom via leased linesconnected to the VideoServer and using theLicense Plate Trackingsystem software.
Implemented and usedfor a year.Currently not in use.
Implemented and usedfor more than a year.Currently not in use.
Components notphysically seen.
Central DatabaseServer, and theDatabase(Located atControl Room inAhmedabad)
Retrieve vehicle detailsfrom database using thelicense number.To be transmitted vialeased lines.
Implemented at RTO,Ahmedabad.
Used initially formonitoring lanes of allCPs and creatingdatabases of vehicles.Currently alloperations at theControl Room havebeen shut down.
Used initially formonitoring lanes of allCPs and creatingdatabases of vehicles.Currently alloperations at theControl Room havebeen shut down.
Not implemented
Electronic DisplayPanel (Located at theCP)
Displays the permissibleweight, overload weightand penalty amount forthe driver's convenience
Installed and usedregularly for more thana year. Currently usageis seldom.
Installed and used formore than a year. Notbeing used currently.
Physically presentbut notoperational.
ElectronicWeighbridge(Located at CP)
Weighs the vehiclestanding atop. Theweight is captured bythe computer forchecking overloading
Installed and in useregularly almost all thetime.
Installed and in useregularly almost all thetime.
Installed and usedinitially.Currently is badlydamaged duringearthquake andnot used.
Computers &Printers(Located at eachlane of the CP)
Receives the vehicledetails from centralserver, weight fromweighbridge andcomputes penalty, ifany, for non-payment oftax and overload.Penalty receipt isprepared and printed atthe end of processing.
Installed andoperational. Usedregularly for a year.Used sparingly now.
Installed andoperational for a year.Not used currently.
All computers arestored in a room.Not used at all.
Sensor controlledbarriers
Allows exit of vehicleafter completion ofcheck post transaction
Installed but neverused.
Installed but neverused.
Have not beeninstalled.