computer weather forecasts for wind energy plants khanh t. tran ami environmental 206 black eagle...
TRANSCRIPT
Computer Weather Forecasts forComputer Weather Forecasts forWind Energy PlantsWind Energy Plants
Khanh T. TranKhanh T. TranAMI EnvironmentalAMI Environmental
206 Black Eagle Ave, Henderson, NV 89015
(702)564-9186(702)564-9186http://www.amiace.comhttp://www.amiace.com
Wind Energy ForecastsWind Energy Forecasts
Growing Wind Energy DevelopmentGrowing Wind Energy Development Wind Energy is IntermittentWind Energy is Intermittent Reliable Forecasts needed for Load Reliable Forecasts needed for Load
SchedulingScheduling Forecasts of 48-Hour and LongerForecasts of 48-Hour and Longer Forecasts Updated Twice DailyForecasts Updated Twice Daily Facility located in Complex TerrainFacility located in Complex Terrain
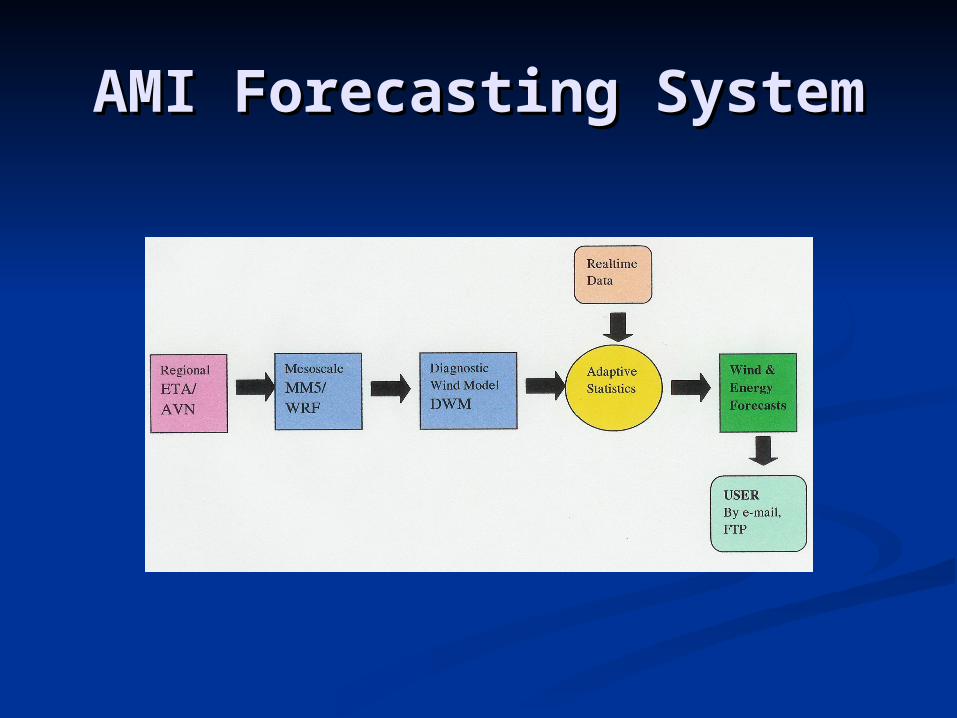
AMI Forecasting SystemAMI Forecasting System
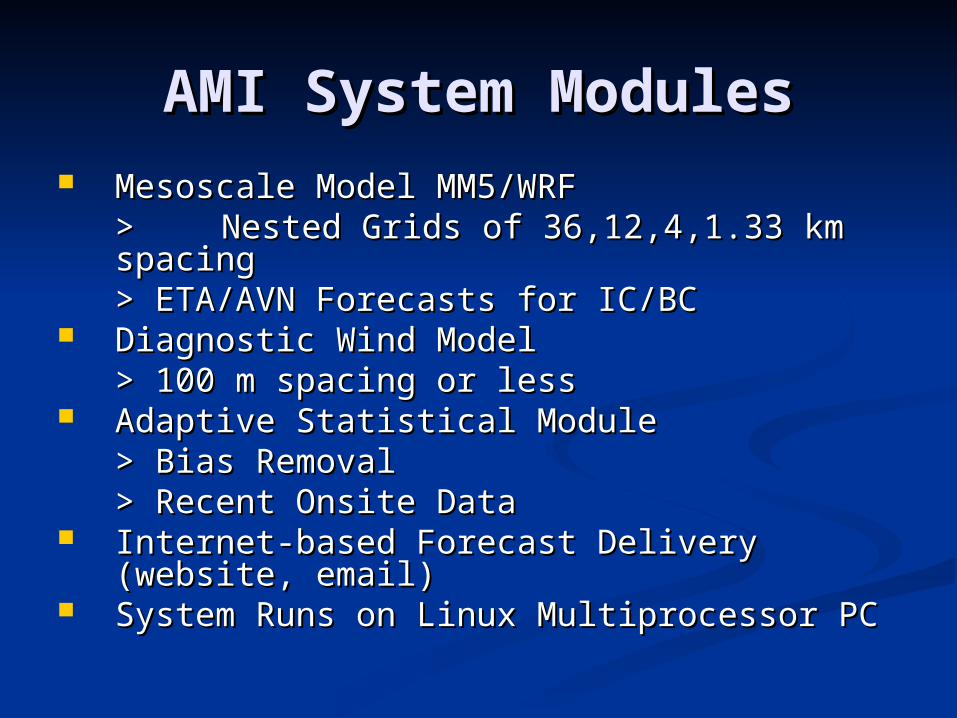
AMI System ModulesAMI System Modules Mesoscale Model MM5/WRF Mesoscale Model MM5/WRF
>> Nested Grids of 36,12,4,1.33 km Nested Grids of 36,12,4,1.33 km spacingspacing> ETA/AVN Forecasts for IC/BC> ETA/AVN Forecasts for IC/BC
Diagnostic Wind Model Diagnostic Wind Model > 100 m spacing or less> 100 m spacing or less
Adaptive Statistical Module Adaptive Statistical Module > Bias Removal> Bias Removal> Recent Onsite Data> Recent Onsite Data
Internet-based Forecast Delivery (website, Internet-based Forecast Delivery (website, email)email)
System Runs on Linux Multiprocessor PC System Runs on Linux Multiprocessor PC
System TestingSystem Testing
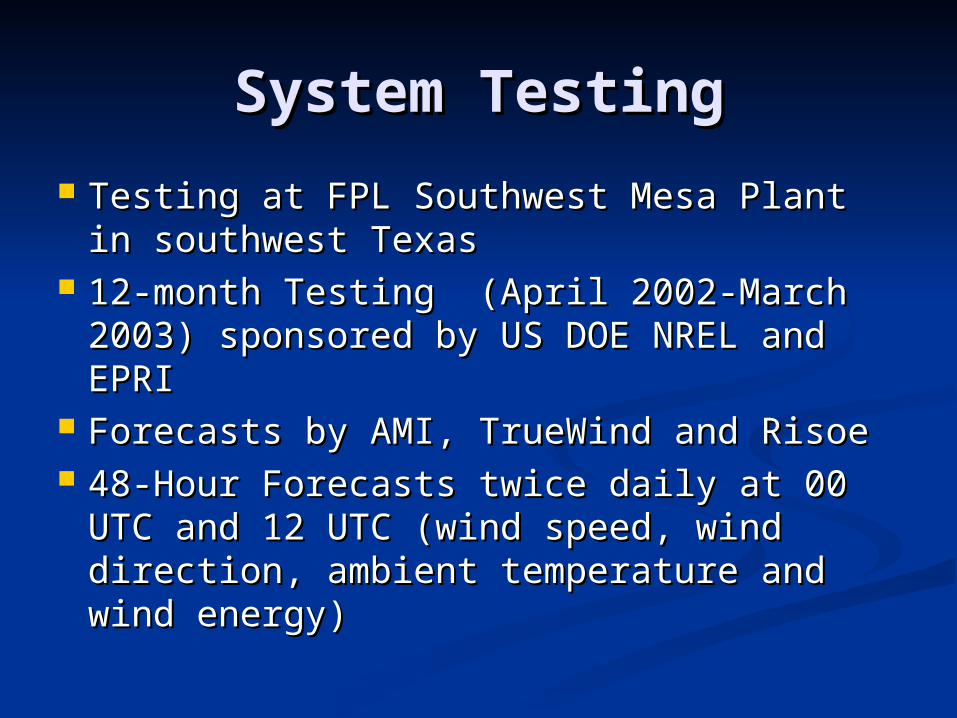
Testing at FPL Southwest Mesa Plant in Testing at FPL Southwest Mesa Plant in southwest Texassouthwest Texas
12-month Testing (April 2002-March 12-month Testing (April 2002-March 2003) sponsored by US DOE NREL and 2003) sponsored by US DOE NREL and EPRIEPRI
Forecasts by AMI, TrueWind and Risoe Forecasts by AMI, TrueWind and Risoe 48-Hour Forecasts twice daily at 00 UTC 48-Hour Forecasts twice daily at 00 UTC
and 12 UTC (wind speed, wind direction, and 12 UTC (wind speed, wind direction, ambient temperature and wind energy)ambient temperature and wind energy)
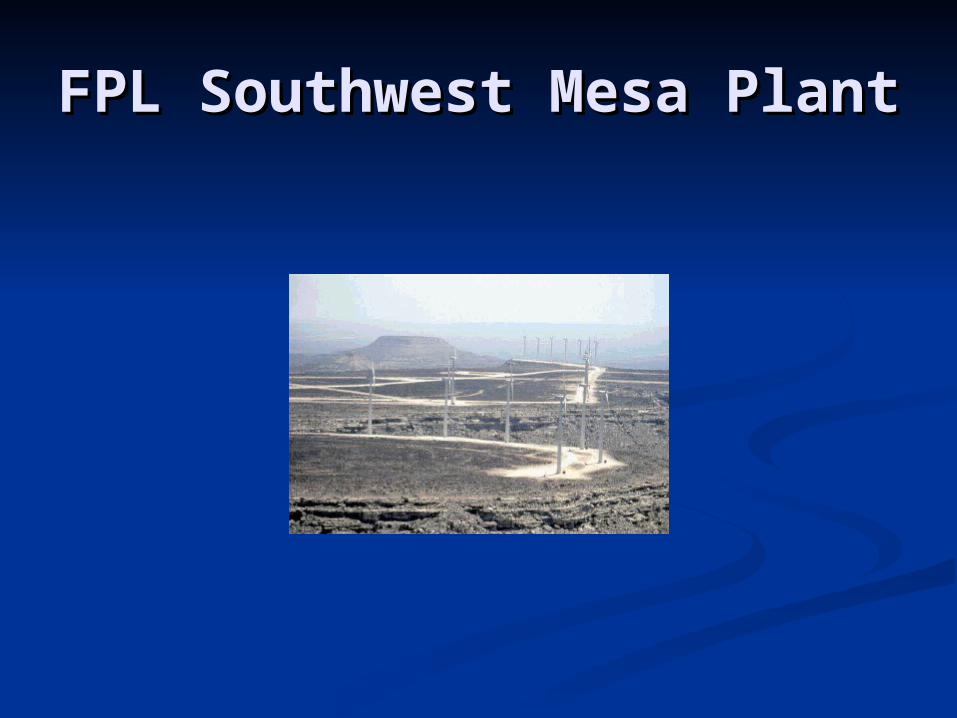
FPL Southwest Mesa FPL Southwest Mesa PlantPlant
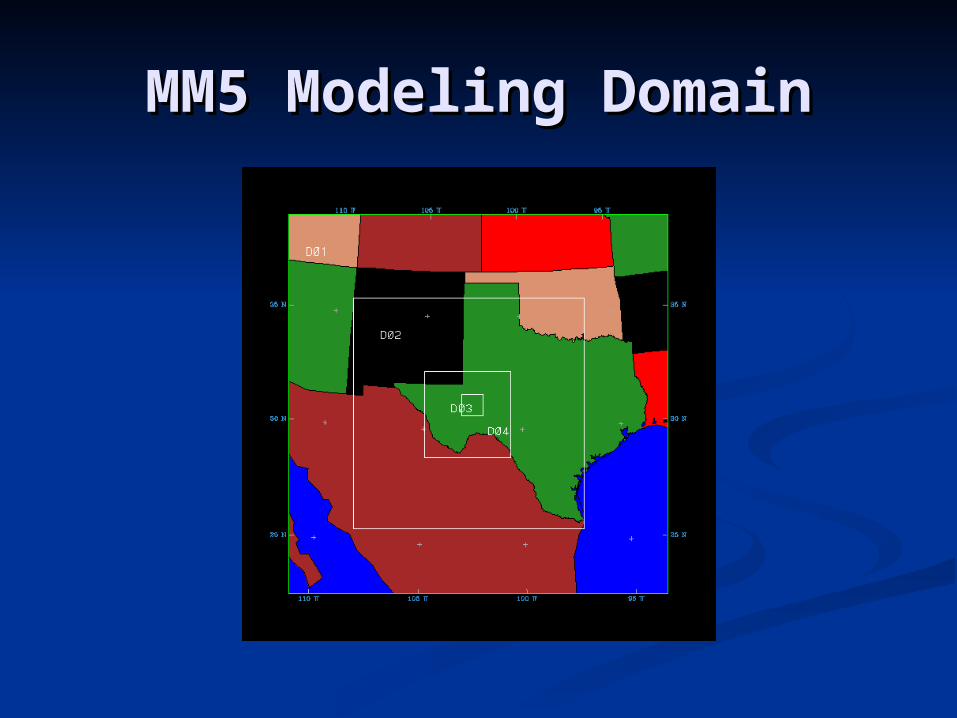
MM5 Modeling DomainMM5 Modeling Domain

Domain TopographyDomain Topography

System Performance System Performance EvaluationEvaluation
Forecasts compared against actual Forecasts compared against actual observations (wind speed and observations (wind speed and energy)energy)
Forecasts compared against Forecasts compared against persistence and climatological persistence and climatological forecastsforecasts
Statistical measures (mean error Statistical measures (mean error ME, mean absolute error MAE, skill ME, mean absolute error MAE, skill score) score)
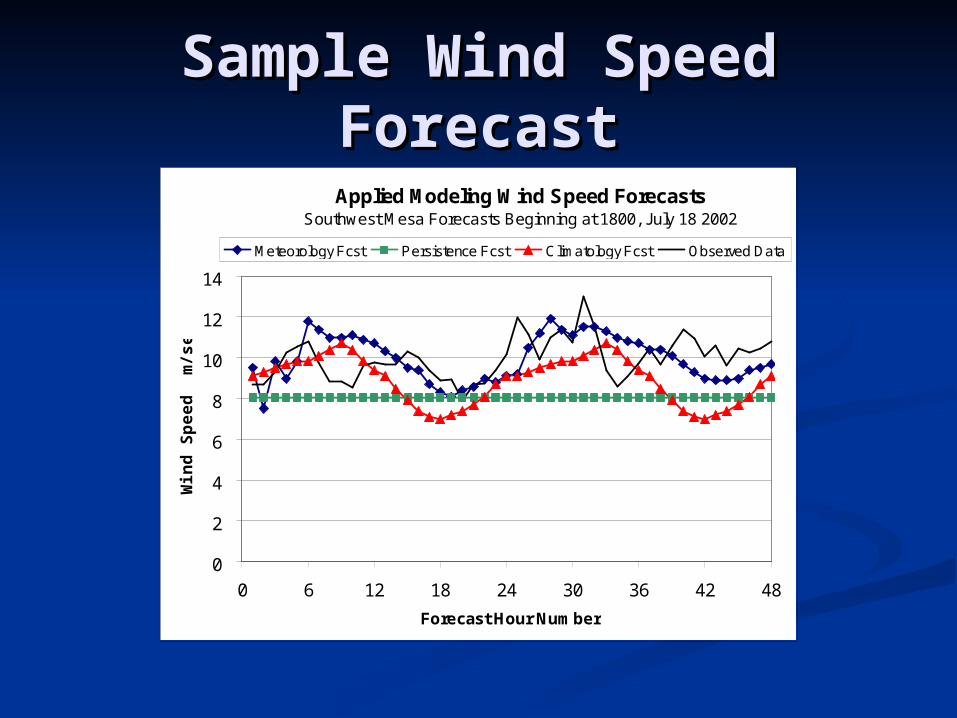
Sample Wind Speed Sample Wind Speed ForecastForecastApplied Modeling Wind Speed Forecasts
Southwest Mesa Forecasts Beginning at 1800, July 18 2002
0
2
4
6
8
10
12
14
0 6 12 18 24 30 36 42 48
Forecast Hour Number
Win
d S
pee
d m
/sec
Meteorology Fcst Persistence Fcst Climatology Fcst Observed Data
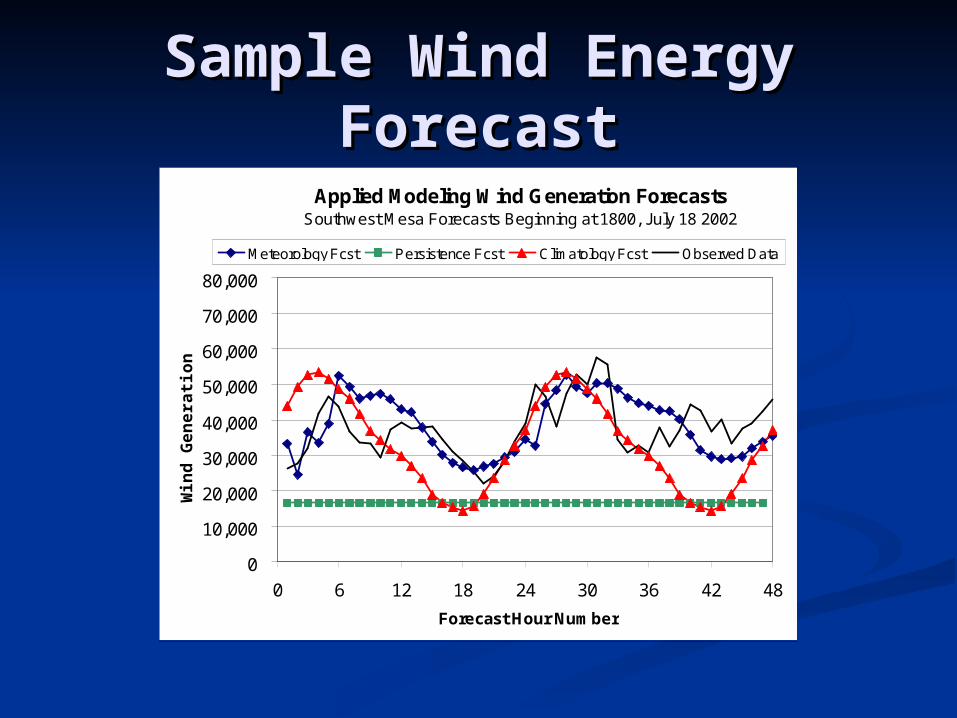
Sample Wind Energy Sample Wind Energy ForecastForecast
Applied Modeling Wind Generation ForecastsSouthwest Mesa Forecasts Beginning at 1800, July 18 2002
0
10,000
20,000
30,000
40,000
50,000
60,000
70,000
80,000
0 6 12 18 24 30 36 42 48
Forecast Hour Number
Win
d G
ener
atio
n k
W
Meteorology Fcst Persistence Fcst Climatology Fcst Observed Data
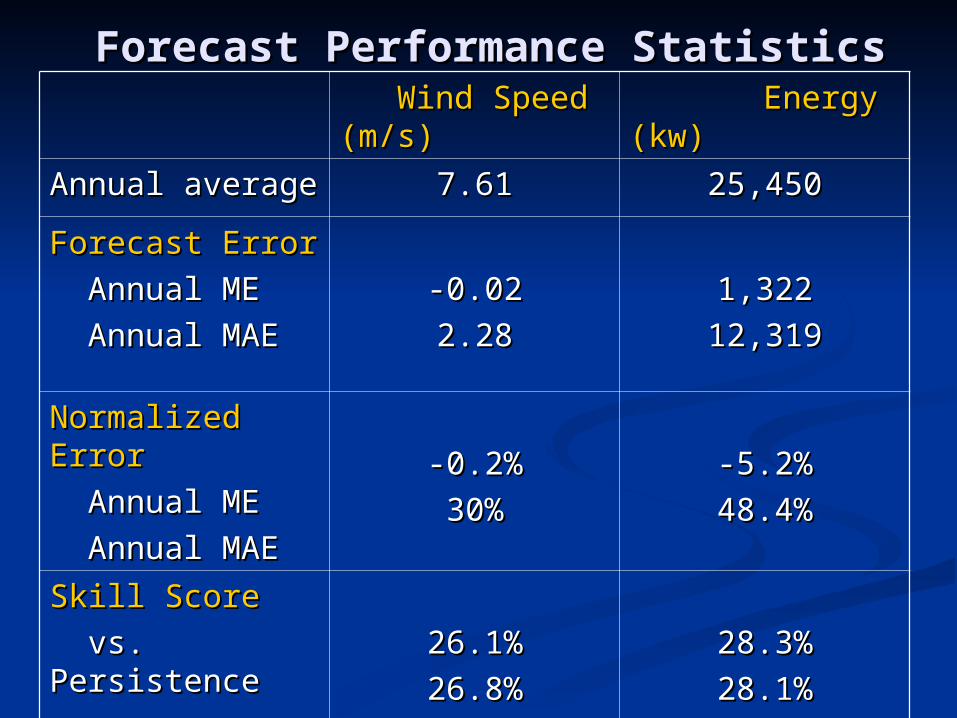
Forecast Performance StatisticsForecast Performance Statistics Wind Speed Wind Speed (m/s) (m/s)
Energy (kw)Energy (kw)
Annual averageAnnual average 7.617.61 25,45025,450
Forecast ErrorForecast Error
Annual MEAnnual ME
Annual MAEAnnual MAE-0.02-0.02
2.282.281,3221,322
12,31912,319
Normalized Normalized ErrorError
Annual MEAnnual ME
Annual MAEAnnual MAE
-0.2%-0.2%
30%30%-5.2%-5.2%
48.4%48.4%
Skill ScoreSkill Score
vs. Persistencevs. Persistence
vs. Climatologyvs. Climatology26.1%26.1%
26.8%26.8%28.3%28.3%
28.1%28.1%

Normalized MAE for Normalized MAE for Wind SpeedWind Speed
Normalized Mean Absolute Errors for Applied Modeling Wind Speed Forecasts
Southwest Mesa FPL Energy, April 1, 2002 - March 31, 2003
0%
10%
20%
30%
40%
50%
60%
0 6 12 18 24 30 36 42 48
Forecast Hour Number
No
rma
lize
d M
ea
n A
bs
. Err
or
Meteorology Persistence Climatology
12-Month Average Wind Speed = 7.61 m/sec

Normalized MAE for Wind Normalized MAE for Wind EnergyEnergy
Normalized Mean Absolute Errors for Applied Modeling Wind Generation ForecastsSouthwest Mesa FPL Energy, April 1, 2002 - March 31, 2003
0%
20%
40%
60%
80%
100%
0 6 12 18 24 30 36 42 48
Forecast Hour Number
No
rma
lize
d M
ea
n A
bs
. Err
or
Meteorology Persistence Climatology
12-Month Average Wind Generation = 25,450 kW

Normalized Monthly MAE Normalized Monthly MAE for WSfor WS
Normalized Monthly Mean Absolute Errors for AMI Wind Speed Forecasts
Southwest Mesa FPL Energy, April 1, 2002 - March 31, 2003
0%
10%
20%
30%
40%
50%
60%
70%
Apr
il 200
2 M
ay Ju
ne Ju
ly
Aug
ust
Sep
tem
ber
Octo
ber
Nov
embe
r
Dec
embe
r
Janu
ary 2
003
Feb
ruar
y
Mar
ch
Month
No
rma
lize
d M
ea
n A
bs
. Err
or
Climatology Meteorology Persistence
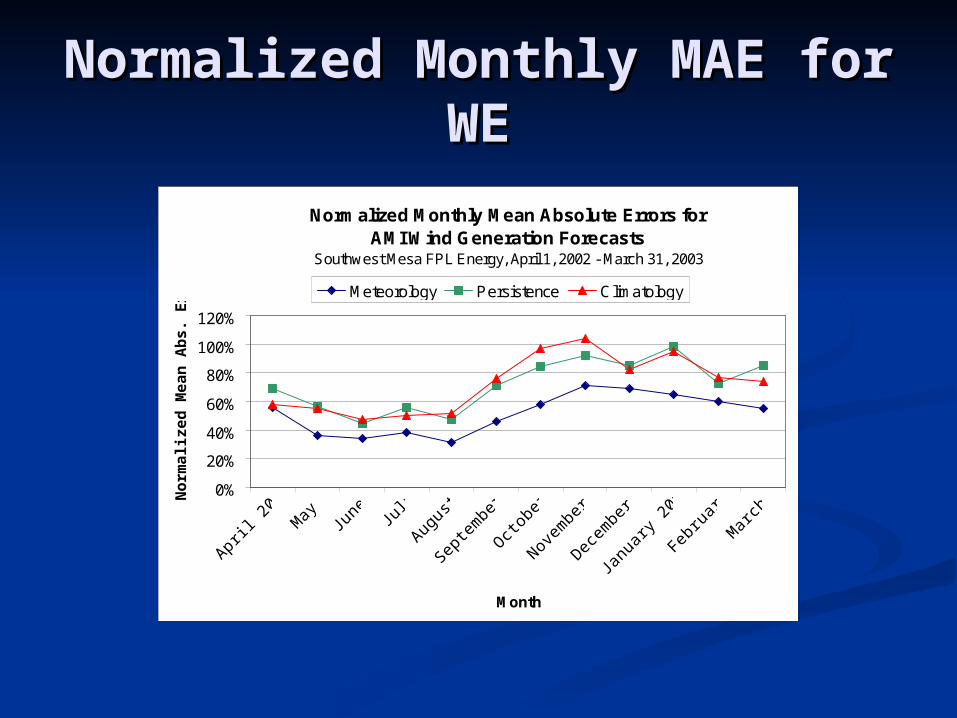
Normalized Monthly MAE Normalized Monthly MAE for WEfor WE
Normalized Monthly Mean Absolute Errors for AMI Wind Generation Forecasts
Southwest Mesa FPL Energy, April 1, 2002 - March 31, 2003
0%
20%
40%
60%
80%
100%
120%
Apr
il 200
2 M
ay Ju
ne Ju
ly
Aug
ust
Sep
tem
ber
Octo
ber
Nov
embe
r
Dec
embe
r
Janu
ary 2
003
Feb
ruar
y
Mar
ch
Month
No
rmal
ized
Mea
n A
bs.
Err
or
Meteorology Persistence Climatology

Comparison of Forecast Comparison of Forecast SystemsSystems
Annual Mean Absolute Errors of Wind Speed and Energy Forecasts
0%
10%
20%
30%
40%
50%
60%
Wind Speed Wind Energy
No
rma
lize
d M
ea
n A
bs
. Err
or
Risoe TrueWind AMI
Southwest Mesa FPL Energy, April 1, 2002 to March 31, 2003

ConclusionsConclusions
AMI Forecast System based on AMI Forecast System based on advanced models advanced models
AMI system tested for 12-month in AMI system tested for 12-month in southwest Texas southwest Texas
AMI system provides accurate wind AMI system provides accurate wind speed and energy forecastsspeed and energy forecasts
AMI system is more accurate than AMI system is more accurate than other systemsother systems
AMI system runs on Linux PC and can AMI system runs on Linux PC and can be easily adapted to other sites.be easily adapted to other sites.