computer vision profiling of neurite outgrowth dynamics...
TRANSCRIPT

JCB: Article
JCB
JCB: Tools
91
The Rockefeller University Press $30.00J. Cell Biol. Vol. 212 No. 1 91–111www.jcb.org/cgi/doi/10.1083/jcb.201506018
Introduction
Neurite outgrowth is a prerequisite step to produce the axons and dendrites that wire the adult brain. Neuronal cell migra-tion is crucial for brain morphogenesis. In cell culture, neurite outgrowth is highly dynamic and involves a series of dynamic morphogenetic processes (MPs) such as neurite initiation, elongation, branching, growth cone motility, and collapse (da Silva and Dotti, 2002). Cultured neuronal cells are also highly motile, which might reflect the process of neuronal migration
(Nadarajah and Parnavelas, 2002). Specific spatiotemporal signaling networks control the cytoskeletal, trafficking, and adhesion dynamics required for each MP to occur. Because neurite outgrowth and cell migration use overlapping cellular machineries, it is conceivable that some molecular components might regulate both processes. These MPs fluctuate on length and time scales of tens of microns and minutes to hours, which have been missed in steady-state neurite outgrowth measure-ments, most often at a late differentiation stage. Identification of MP-specific signaling networks thus requires the quantifica-tion their morphodynamics.
Rho GTPases are key regulators of the cytoskeletal dy-namics that regulate neuronal cell morphogenesis (da Silva and Dotti, 2002). Their activity is tightly controlled in time and space by guanine nucleotide-exchange factors (GEFs; Rossman et al., 2005) and GTPase-activating proteins (GAPs; Moon and Zheng, 2003) that activate and deactivate GTPases, respectively. This regulation, as well as coupling of Rho GTPases to specific downstream effectors, dictates their cytoskeletal output at any given subcellular localization (Pertz, 2010). Current models
Rho guanosine triphosphatases (GTPases) control the cytoskeletal dynamics that power neurite outgrowth. This process consists of dynamic neurite initiation, elongation, retraction, and branching cycles that are likely to be regulated by specific spatiotemporal signaling networks, which cannot be resolved with static, steady-state assays. We present Neu-riteTracker, a computer-vision approach to automatically segment and track neuronal morphodynamics in time-lapse datasets. Feature extraction then quantifies dynamic neurite outgrowth phenotypes. We identify a set of stereotypic neurite outgrowth morphodynamic behaviors in a cultured neuronal cell system. Systematic RNA interference perturba-tion of a Rho GTPase interactome consisting of 219 proteins reveals a limited set of morphodynamic phenotypes. As proof of concept, we show that loss of function of two distinct RhoA-specific GTPase-activating proteins (GAPs) leads to opposite neurite outgrowth phenotypes. Imaging of RhoA activation dynamics indicates that both GAPs regulate differ-ent spatiotemporal Rho GTPase pools, with distinct functions. Our results provide a starting point to dissect spatiotempo-ral Rho GTPase signaling networks that regulate neurite outgrowth.
Computer vision profiling of neurite outgrowth dynamics reveals spatiotemporal modularity of Rho GTPase signaling
Ludovico Fusco,1* Riwal Lefort,2* Kevin Smith,3* Fethallah Benmansour,3 German Gonzalez,3 Caterina Barillari,4 Bernd Rinn,4 Francois Fleuret,2 Pascal Fua,3 and Olivier Pertz1
1Department of Biomedicine, University of Basel, 4058 Basel, Switzerland2Institut Dalla Molle d'Intelligence Artificielle Perceptive (IDI AP Research Institute), 1920 Martigny, Switzerland3Computer Vision Laboratory, École Polytechnique Fédérale de Lausanne, 1015 Lausanne, Switzerland4Department of Biosystems Science and Engineering, Eidgenössische Technische Hochschule, 4058 Basel, Switzerland
© 2016 Fusco et al. This article is distributed under the terms of an Attribution–Noncommercial–Share Alike–No Mirror Sites license for the first six months after the publication date (see http ://www .rupress .org /terms). After six months it is available under a Creative Commons License (Attribution–Noncommercial–Share Alike 3.0 Unported license, as described at http ://creativecommons .org /licenses /by -nc -sa /3 .0 /).
*L. Fusco, R. Lefort, and K. Smith contributed equally to this paper.Correspondence to Olivier Pertz: [email protected]. Lefort’s present address is Lab-STI CC (UMR CNRS 6285), ENS TA Bretagne (Universite Europeenne de Bretagne), 29806 Brest Cedex 9, France.K. Smith’s present address is SciLifeLab/KTH Royal Institute of Technology School of Computer Science and Communication, 114 28 Stockholm, Sweden.F. Benmansour’s present address is F. Hoffmann-La Roche AG, 4070 Basel, Switzerland.G. Gonzalez’s present address is Dept. of Radiology, Brigham and Women’s Hospital, Boston, MA 02115.O. Pertz’s present address is Institute of Cell Biology, University of Bern, 3012 Bern, Switzerland.Abbreviations used in this paper: CV, computer vision; FRET, Förster resonance energy transfer; GAP, GTPase-activating protein; GEF, guanine nucleotide-ex-change factor; HDS, hierarchical data structure; HS, high stringency; KD, knock-down; LS, low stringency; MDS, morphodynamic signature; MLCK, myosin light chain kinase; MP, morphogenetic process; MRCK, myotonin-related dystrophyn kinase myosin light chain kinase; pMLC, myosin light chain phosphorylation.
TH
EJ
OU
RN
AL
OF
CE
LL
BIO
LO
GY
on January 6, 2016jcb.rupress.org
Dow
nloaded from
Published January 4, 2016
http://jcb.rupress.org/content/suppl/2015/12/31/jcb.201506018.DC1.html Supplemental Material can be found at:
on January 6, 2016jcb.rupress.org
Dow
nloaded from
Published January 4, 2016 on January 6, 2016
jcb.rupress.orgD
ownloaded from
Published January 4, 2016
on January 6, 2016jcb.rupress.org
Dow
nloaded from
Published January 4, 2016 on January 6, 2016
jcb.rupress.orgD
ownloaded from
Published January 4, 2016
on January 6, 2016jcb.rupress.org
Dow
nloaded from
Published January 4, 2016 on January 6, 2016
jcb.rupress.orgD
ownloaded from
Published January 4, 2016
on January 6, 2016jcb.rupress.org
Dow
nloaded from
Published January 4, 2016 on January 6, 2016
jcb.rupress.orgD
ownloaded from
Published January 4, 2016
on January 6, 2016jcb.rupress.org
Dow
nloaded from
Published January 4, 2016 on January 6, 2016
jcb.rupress.orgD
ownloaded from
Published January 4, 2016
on January 6, 2016jcb.rupress.org
Dow
nloaded from
Published January 4, 2016 on January 6, 2016
jcb.rupress.orgD
ownloaded from
Published January 4, 2016
on January 6, 2016jcb.rupress.org
Dow
nloaded from
Published January 4, 2016 on January 6, 2016
jcb.rupress.orgD
ownloaded from
Published January 4, 2016
on January 6, 2016jcb.rupress.org
Dow
nloaded from
Published January 4, 2016 on January 6, 2016
jcb.rupress.orgD
ownloaded from
Published January 4, 2016
on January 6, 2016jcb.rupress.org
Dow
nloaded from
Published January 4, 2016 on January 6, 2016
jcb.rupress.orgD
ownloaded from
Published January 4, 2016
on January 6, 2016jcb.rupress.org
Dow
nloaded from
Published January 4, 2016 on January 6, 2016
jcb.rupress.orgD
ownloaded from
Published January 4, 2016
on January 6, 2016jcb.rupress.org
Dow
nloaded from
Published January 4, 2016 on January 6, 2016
jcb.rupress.orgD
ownloaded from
Published January 4, 2016
on January 6, 2016jcb.rupress.org
Dow
nloaded from
Published January 4, 2016 on January 6, 2016
jcb.rupress.orgD
ownloaded from
Published January 4, 2016
on January 6, 2016jcb.rupress.org
Dow
nloaded from
Published January 4, 2016 on January 6, 2016
jcb.rupress.orgD
ownloaded from
Published January 4, 2016

JCB • Volume 212 • NumBer 1 • 201692
state that Rac1 and Cdc42 regulate neurite outgrowth, whereas RhoA controls neurite collapse (da Silva and Dotti, 2002). However, multiple GEFs, GAPs, and effectors are ubiquitously expressed by cells and outnumber their cognate Rho GTPases (Moon and Zheng, 2003; Rossman et al., 2005). This raises the question of the significance of this signaling complexity.
We present NeuriteTracker, a computer vision (CV) plat-form to track neuronal morphodynamics from high-content time-lapse imaging datasets. Automatic extraction of a large set of morphological and morphodynamic features, coupled with adequate statistical analysis, can then quantify the dynamics of neuronal morphogenesis. Our pipeline identifies distinct, ste-reotyped morphodynamic phases during neuronal cell morpho-genesis and quantifies a set of morphodynamic phenotypes in a siRNA screen targeting a candidate Rho GTPase interactome. This provides insight into the spatiotemporal Rho GTPase sig-naling networks regulating distinct MPs. As proof of concept for our screen, we show that two RhoA-specific GAPs regulate two distinct spatiotemporal RhoA signaling networks controlling different cytoskeletal outputs. Our data provide an initial re-source to study the complex spatiotemporal Rho GTPase sig-naling networks that regulate neuronal cell morphogenesis.
Results
High-content live-cell imaging pipelineTo study neuronal dynamics, we used neuronal-like mouse N1E-115 neuroblastoma cells. To visualize cell morphology, we used a bicistronic vector that expresses Lifeact-GFP, a fu-sion of GFP with the F-actin binding peptide Lifeact (Riedl et al., 2008), and a nuclear localization NLS-mCherry fusion, which labels the nucleus for cell detection (Fig. 1 a). This con-struct can be expressed at a high level without affecting neurite outgrowth (Fig. S1, a and b) and provides homogeneous high contrast on neurites and somata for imaging with air objectives (Fig. 1 b and Video 1). An additional benefit of our reporter is that it labels F-actin–containing branches not apparent using the classic microtubule staining used in neurite outgrowth assays. To perturb different signaling molecules, we cotransfected our reporter plasmid with siRNAs in nondifferentiated cells. These cells were subsequently differentiated by serum starvation, re-plated on laminin-coated coverslips, and allowed to extend neu-rites for 19.6 h (Fig. S1 c). As proof of concept, we evaluated knockdown (KD) of previously characterized proteins. MKK7 KD leads to highly unstable, short neurites owing to loss of microtubule bundling in the neurite shaft (Feltrin et al., 2012). RhoA KD leads to increased neurite outgrowth (Hirose et al., 1998) through loss of growth cone collapse controlled by RhoA (Fritz et al., 2013). SrGAP2 KD leads to stabilization of the growth cone and soma lamellipodial veils, increasing neurite outgrowth and branching, as well as cell spreading and migra-tion (Pertz et al., 2008). Our protocol enabled efficient KD of these proteins, which recapitulated the expected phenotypes (Fig. S1, d–f). We also identified a nontargeting siRNA that did not affect neurite outgrowth (Fig. S1 g). To perform high-con-tent live-cell imaging, we optimized our microscope setup for fast, two-color imaging of multiple wells. Time-lapse analysis started 3 h postplating, a time point at which initial neurites already protruded, rendering cells resistant to phototoxicity. An automated image analysis routine was then used to identify 10 fields of view per well containing an adequate number of cells
exhibiting a specific range in fluorescence intensities and cell areas (Fig. S1, h–j). We then time-lapsed neurite outgrowth dy-namics in 10 fields of view per well across a 24-well plate with 12-min time resolution for a total of 19.6 h.
NeuriteTracker pipeline to quantify neuronal dynamicsTo analyze the time-lapse datasets, we engineered Neur-iteTracker, an automated CV pipeline to segment and track soma and neurite morphodynamics described in Materials and methods (Fig. 1, b and c; and Video 2). First, mCherry-NLS– labeled nuclei and their associated somata were identified using maximally stable extremal regions and a fast marching region growing step (Fig. 1 c, steps 1 and 2). Second, a graph- association tracking method was applied over the time-lapse data to provide a unique label for each tracked cell over time (Fig. 1 c, steps 3 and 4). Neurites were extracted for each cell by applying a calibrated Hessian-based filter, computing a geo-desic distance combining intensity and geometric distance, and applying a threshold (Fig. 1 c, steps 5–7). Candidate ter-minals were identified, and neurite filaments were detected by backtracing and reconstruction with a minimal spanning tree (Fig. 1 c, step 8). Again applying the graph association to the neurites yielded automatic segmentation and tracking of indi-vidual cell nuclei, soma, and neurites (Fig. 2 a and Video 2). Our pipeline provided robust results across a wide variety of fluorescence intensities that result from transient transfection and was evaluated against human annotated ground-truth data-sets (Fig. S2 and Videos 3 and 4).
To describe the segmented cells, we defined a series of pa-rameters that describe nucleus, soma, and neurite morphology, the neurite being modeled as a tree arborescence (Figs. 2 b and S3; also see Materials and methods, Definition of nuclei and soma parameters and Definition of neurite parameters). These data were then organized in a hierarchical data structure (HDS) that models the neurite, as well as the nucleus and soma geom-etries, at a given time point (Fig. 2 c). A graph representation of this HDS can then be rendered (Fig. 1 c, step 9). Finally, we used these parameters and the HDS to extract an as-compre-hensive-as-possible set of features that describe nuclei, soma, and neurite morphology and morphodynamics. For each cell, 28 “static” features that provide measurements relevant to cell morphology at one specific time point were extracted from the HDS and stored in a feature vector as described in Materials and methods (Definition of static features). The dynamic evolution of some of these features is shown in Fig. 2 d. Furthermore, we computed five layers of dynamic features, which provide sum-maries of the temporal evolution of static features on a per-cell basis (described in Materials and methods, Definition of dy-namic features). These include the mean value of static features through time (1), the time a feature expands/contracts (2/3), the number of inflection points during feature evolution (4), and the frequency of the expansion of a feature (5). This provides a comprehensive description of neurite and soma morphodynam-ics. Importantly, these different layers of dynamic features are to some extent redundant, and a selection of a specific set of fea-tures can be required to avoid redundancy during their analysis.
We also used our CV pipeline to track and segment neuronal morphodynamics of Lifeact-GFP/NLS-mCherry– transfected Pheochromocytoma PC-12 cells plated on collagen and stimulated with nerve growth factor. The raw images, their superimposed HDS graph representations, and the temporal
on January 6, 2016jcb.rupress.org
Dow
nloaded from
Published January 4, 2016

rho GTPase signaling complexity in neurite outgrowth • Fusco et al. 93
evolution of some extracted features are shown in Fig. S4 (a–c) and indicate that our CV pipeline is sufficiently versatile to be applied to different neuronal-like cell types.
We provide access to the MAT LAB code of NeuriteTracker through the Github platform at https ://github .com /sgbasel /neuritetracker. Analysis of different neuronal morphologies requires the tuning of a small set of parameters, which can be conveniently performed using a graphical user interface. Ultimately, NeuriteTracker provides both the extracted features in the HDS format in a CSV file, as well as a graph representation of the HDS. A test time-lapse dataset and manual are also provided.
Functional analysis of a Rho GTPase signaling networkAs a proof of concept to validate NeuriteTracker, we performed an siRNA screen targeting a potential Rho GTPase interac-tome. We used a bioinformatics approach to mine a proteom-ics dataset of purified neurite and soma fractions of N1E-115 cells (Pertz et al., 2008) to identify GEFs, GAPs, effectors, and their interacting proteins that potentially interact with a panel of Rho GTPases (Fig. 3 a; described in Materials and meth-ods). This revealed a complex interactome consisting of 219,
mostly neurite-enriched, proteins. Gene ontology analysis re-vealed a large coverage of cellular processes relevant to adhe-sion and cytoskeletal dynamics and axonal guidance (Fig. 3 b). We used three distinct siRNAs per gene, leading to a total of 657 perturbations (siRNA sequences are described in Table S1). These were distributed among 32 experiments, with each 24-well plate containing one negative, nontargeting and one positive, MKK7-targeting siRNA control. For each of these 721 wells (657 perturbations + 64 controls), we acquired 10 fields of view, therefore accounting for a total of 7,210 time-lapse movies. We then developed a statistical analysis pipeline to analyze this dataset.
Morphodynamic signature extractionTo quantify the effect of perturbations on neuronal dynamics, we considered 28 static features measured on the whole-cell population at all the different time points of a time-lapse data-set. This provides the distribution of feature values throughout the whole lifetime of the cell population (Fig. 4 a, popula-tion-level features). We also considered the “frequency expan-sion” feature set that consists of 18 features that summarize the dynamics of single cells throughout the movie (Fig. 4 a, dy-namic cell-level features).
Figure 1. Tracking and segmentation of neuronal morphodynamics. (a) Schematics of Lifeact-GFP/NLS-mCherry expression vector. (b) Raw NLS-mCherry channel (left), raw Lifeact-GFP channel (middle), and Lifeact-GFP channel (right) with superimposed nucleus, soma, and neurite segmentations color-coded according to cell identity. Bar, 100 µm. Fluorescent images are shown in inverted black-and-white contrast. (c) Different segmentation steps highlighted in magnification from inset 1 from panel b.
on January 6, 2016jcb.rupress.org
Dow
nloaded from
Published January 4, 2016

JCB • Volume 212 • NumBer 1 • 201694
For each feature, we used a z-test to compare feature value distributions of control and siRNA-transfected cells (Fig. 4 b). The z-score polarity indicates if a specific feature value aug-ments or decreases when control and KD cells are compared. All the details relevant to our data analysis pipeline are explained in Materials and methods. To mitigate any potential off-target effects, we computed mean z-scores from the three siRNAs, according to the rule that if at least two of three siRNAs pro-duce the same phenotype for a given feature (Echeverri et al., 2006), then this phenotype is on target (Fig. 4 c). This approach provides a mean z-score vector that indicates penetrance and polarity for each feature in response to a siRNA perturbation (Lefort et al., 2015). We refer to this z-score vector as the mor-phodynamic signature (MDS) of the target gene.
We then reduced the feature space by two successive steps. First, we evaluated the feature robustness at different stringency levels by comparing the MDS of the MKK7-KD positive control phenotype across the 32 independent performed experiments. Specifically, we selected features that exhibited a statistically relevant z-score with identical polarity in at least 65% (low stringency [LS]) or 90% (high stringency [HS]) of the 32 MKK7 KD control experiments. Second, we selected features that have
high information content; we retained features that exhibit a statistically significant z-score in at least 40% of the 219 genes across the siRNA screen. This especially affected “dynamic” features, because those require integration of a large number of measurements over time, leading to a lower measurement sam-ple size than static features. This reduced the feature space to 32%/78% (LS feature set) and 75%/95% (HS feature set) static/dynamic features, providing robust feature sets that are highly informative about neuronal morphology and dynamics.
We evaluated the validity of our pipeline by extracting MDSs associated with our previously characterized SrGAP2, MKK7, and RhoA KD phenotypes (Figs. 4 d and S1 e). This revealed that our approach successfully captures morphologi-cal and morphodynamic phenotypes (Fig. 4, e and f). SrGAP2 KD led to increased neurite number, length, and branching, as well as increased soma migration, which further correlate with increased cell and nucleus eccentricity. As expected, MKK7 KD led to reduced frequency of neurite extension events, short neurites, and low soma motility. RhoA KD led to reduced collapse frequency, producing longer neurites, with reduced branching. Some of these features can be easily assessed by visual inspection of static images (neurite length/branching)
Figure 2. Feature extraction from time-lapse datasets. (a) Example of segmentation of two cells from a time-lapse dataset (from insets 2 and 3 in Fig. 1 b). Nucleus, soma, and neurite segmentations are color-coded for cell identity. Time, h:min. Bar, 50 µm. (b) Schematics describing neuronal cell morphology, and how different neuronal parameters are extracted for definition of neuronal arborescence. (c) Example of the HDS that models the schematic cell in b. (d) Temporal evolution of a set of features for the two cells shown in panel a.
on January 6, 2016jcb.rupress.org
Dow
nloaded from
Published January 4, 2016

rho GTPase signaling complexity in neurite outgrowth • Fusco et al. 95
Figure 3. Identification of a candidate Rho GTPase signaling network. (a) Rho GTPase protein interaction network as determined by the strategy de-scribed in Materials and methods. Different families of proteins known to interact with six expressed Rho GTPases are shown. Proteins are named by their official gene symbol according to Entrez Gene. Relative neurite protein enrichment is color-coded according to the color scale bar at the bottom of the figure. Plain lines represent direct protein–protein interaction. Icons are color-coded according to the color scale bar. (b) Gene Ontology analysis of the most significant canonical pathways present in the protein network shown in panel a. Dotted line represents significance threshold as measured by Fisher’s exact test (P < 0.05).
on January 6, 2016jcb.rupress.org
Dow
nloaded from
Published January 4, 2016

JCB • Volume 212 • NumBer 1 • 201696
or time-lapse datasets (soma speed). Others, such as soma cir-cularity, are more subtle and can be detected only by our CV approach. Plotting feature distribution in the different perturbed states indicates the cellular heterogeneity associated with our cell system (Fig. 4 g).
siRNA screen analysisA set of quality-control metrics showed that a similar number of cells per field of view and NLS-mCherry fluorescence in-tensities occurred in the different experimental plates (Fig. 5, a and b). Quantification of off-target effects across the features, throughout the screen, revealed that 43% of the measurements led to identical z-score polarities for all three siRNAs; 52% of the measurements had two of three siRNAs yielding iden-tical z-score polarities, whereas in only 5% of the cases, one siRNA led to a statistically nonsignificant z-score and the two other yielded two distinct polarities. Further, this low level of
off-target effect was not biased to a specific set of experimental plates (Fig. 5 c). Finally, the positive MKK7-KD control asso-ciated with each plate yielded a stable MDS across the differ-ent experimental plates (Fig. 5 d), indicating the stability of our pipeline. Each siRNA perturbation led to a quantifiable MDS with a mean z-score of 1.2 ± 1.9 for the least penetrant and 40.9 ± 21.6 for the most penetrant phenotype. Even in the least penetrant phenotypes, a subset of features displayed statisti-cally relevant z-scores.
To identify sets of gene perturbations that lead to common MDSs, we binarized z-score vectors to give equal weight to all features and performed bottom-up, hierarchical clustering. Sim-ilar clustering results were observed whether z-score matrices were binarized or not (e.g., the z-score value was taken into account). Iterative evaluation of different dendrogram thresh-olds was performed by visual inspection of the quality of the clusters (Fig. 5, e–h), using HDS representations to evaluate
Figure 4. Morphodynamic signature extraction. (a) Schematics of two distinct feature analysis levels. Static population-level and dynamic cell-level features are considered. (b) Feature extraction procedure. z-score vector defines statistical significance, penetrance, and polarity of measured feature distributions of control compared with siRNA-treated cells. (c) Deconvolution of RNAi OFF-target effects. For each given feature: (1) if the three siRNA perturbations lead to a z-score with identical polarity, the mean z-score is computed; (2) if two of three siRNA perturbations lead to a z-score with identical polarity, the mean z-score for the two features with the same polarity is computed; (3) if the three siRNA perturbations yield three different z-score polarities, then the z feature score is set to 0. (d) Raw image (left, inverted black-and-white contrast), HDS graph representation (middle), and cell migration tracks (right) for SrGAP2, MKK7, and RhoA siRNA perturbations are shown. Bar, 50 µm. (e and f) Gene-associated MDSs represented by a color map. (e) LS feature set; (f) HS feature set. z-score scale is also shown. (g) Normalized histograms of representative feature distribution profiles. The data were normalized dividing each histogram value by the histogram area. Vertical bars represent the mean. The z-score associated with each feature is also shown.
on January 6, 2016jcb.rupress.org
Dow
nloaded from
Published January 4, 2016
rho GTPase signaling complexity in neurite outgrowth • Fusco et al. 97
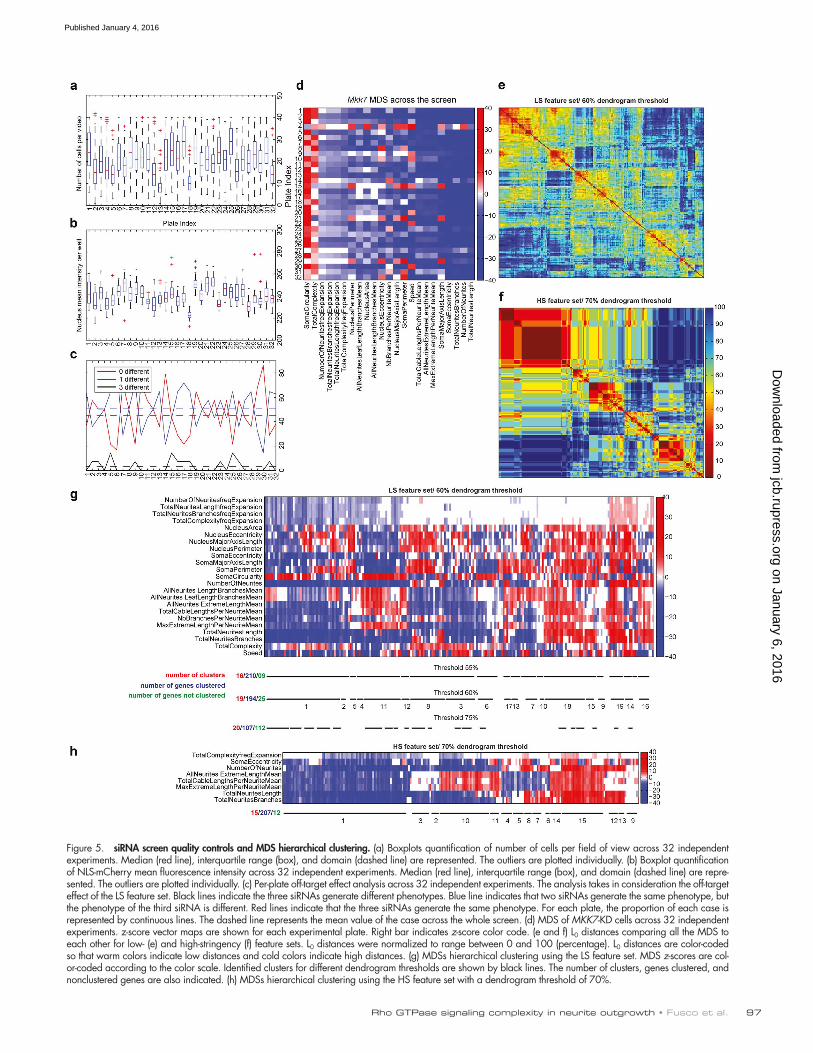
Figure 5. siRNA screen quality controls and MDS hierarchical clustering. (a) Boxplots quantification of number of cells per field of view across 32 independent experiments. Median (red line), interquartile range (box), and domain (dashed line) are represented. The outliers are plotted individually. (b) Boxplot quantification of NLS-mCherry mean fluorescence intensity across 32 independent experiments. Median (red line), interquartile range (box), and domain (dashed line) are repre-sented. The outliers are plotted individually. (c) Per-plate off-target effect analysis across 32 independent experiments. The analysis takes in consideration the off-target effect of the LS feature set. Black lines indicate the three siRNAs generate different phenotypes. Blue line indicates that two siRNAs generate the same phenotype, but the phenotype of the third siRNA is different. Red lines indicate that the three siRNAs generate the same phenotype. For each plate, the proportion of each case is represented by continuous lines. The dashed line represents the mean value of the case across the whole screen. (d) MDS of MKK7-KD cells across 32 independent experiments. z-score vector maps are shown for each experimental plate. Right bar indicates z-score color code. (e and f) L0 distances comparing all the MDS to each other for low- (e) and high-stringency (f) feature sets. L0 distances were normalized to range between 0 and 100 (percentage). L0 distances are color-coded so that warm colors indicate low distances and cold colors indicate high distances. (g) MDSs hierarchical clustering using the LS feature set. MDS z-scores are col-or-coded according to the color scale. Identified clusters for different dendrogram thresholds are shown by black lines. The number of clusters, genes clustered, and nonclustered genes are also indicated. (h) MDSs hierarchical clustering using the HS feature set with a dendrogram threshold of 70%.
on January 6, 2016jcb.rupress.org
Dow
nloaded from
Published January 4, 2016

JCB • Volume 212 • NumBer 1 • 201698
the similarity of penetrant phenotypes for different gene per-turbations within a cluster. The rationale to identify cells with penetrant phenotypes is mentioned in the next paragraph. For the LS feature set, a good compromise was obtained with a 60% dendrogram threshold, meaning that 60% of the features of the MDSs within a cluster have the same polarity. This led to the identification of 19 phenoclusters that comprise 194 of 219 genes (Fig. 5, e and g). Using the HS feature set led to the identification of 15 clusters that comprise 207 of the 219 genes with a 70% dendrogram threshold (Fig. 5, f and h). Any of the nonclustered genes also led to phenotypes, but these have to be inspected on a case-by-case basis.
For intuitive display, we manually sorted phenoclusters according to the overall polarity of their MDSs (Figs. 6 and S4 d). We then described the phenoclusters at different complexity levels and focused first on static, then on dynamic phenotypes. Phenotypes that can be explained by static features led us to group the different clusters in five large phenotypic categories: short neurites (group 1: C1–C7), spread soma multiple and/or branched short neurites (group 2: C8), normal neurites with soma phenotypes (group 3: C9–C10), long/unbranched neurites (group 4: C11–C13), and long/branched neurites (group 5: C14–C19). To provide a visual representation of these phenotypic categories at the static level, we used a mathematical model that selects specific cells with a highly penetrant phenotype according to three visually intuitive features (number of neurites, number of branches, and maximum extreme length per neurite mean). These are then represented using HDS-modeled graph representations, providing a representative example of the phenotype (Fig. 6, Fig. S4 d, and Video 5). Within these static-level phenotype groups, the different subclusters are characterized by additional static features that are mostly relevant to nucleus and soma morphology and that are less visually evident. Dynamic features such as cell migration (speed) and features relevant to neurite outgrowth dynamics (total neurite length frequency expansion, etc.) then discriminate further clusters. Representative dynamic phenotypes were selected using our mathematical model using the same three features set but additionally including the total neurite length frequency expansion feature (Videos 6 and 7). Phenoclusters computed using LS and HS feature sets were similar, except for some sensitive phenotypes observed within cluster 8 (LS feature set; Figs. 6 and S4 d). The lower amount of clusters when the HS feature set is used can mostly be explained by the loss of the cell migration feature. Schematics and statistics of the whole workflow of our pipeline are described in Fig. S5. A web application based on the openBIS data management platform (Bauch et al., 2011) illustrates the static and dynamic phenotypes associated to each siRNA perturbation using the LS feature set (https ://mat -openbis .dbm .unibas .ch :8443 /openbis /webapp /sinergia /). This platform provides access to the z-score vector associated with each siRNA perturbation, as well as to the mean MDS. 10 representative images, as well as 10 representative time-lapse datasets of penetrant phenotypes (selected using the approach described at the beginning of this paragraph), and their matched experimental controls are also provided.
Characterization of stage-specific neuronal dynamicsNeuronal differentiation involves multiple temporal episodes with distinct morphodynamic behaviors that have until now been described only qualitatively (da Silva and Dotti, 2002).
To get quantitative insight into neuronal morphodynamics as-sociated with different temporal episodes, we took advantage of the large control and MKK7-KD dataset from our siRNA screen dataset. We studied MDSs associated with sequential 1-h episodes from our 20-h time-lapse datasets in control cells. For scale-free representation, we plotted the temporal evolution of the coefficient of variation of a panel of features. Because only a fraction of the cell population extends robust neurites, we considered the whole population but also gated on the 10% of cells with the most robust neurite outgrowth (“all neurites extreme length mean feature”). At the whole-cell population level (Fig. 7 a), robust initiation of multiple short and branched neurites is observed at the onset of differentiation and then de-creases during a first phase that lasts 7 h. This period is also associated with a low soma motility state. After 7 h, a small cell population extends a lower number of long unbranched neurites (Fig. 7 c), and soma motility steadily increases during the remaining period studied. We used a mathematical model to identify cells that represent the mean static phenotypes rele-vant to select temporal bins of the 10% cells with longest neu-rites (Fig. 7 c). These results quantitatively define two distinct phases with different morphodynamic behaviors during the neurite outgrowth process.
We then applied the same approach to study the short, unstable neurites MKK7-KD phenotype (Fig. 7, b and d). Al-though short neurites were observed in phase 2, temporal anal-ysis surprisingly revealed a burst of neurite outgrowth in phase 1 compared with control cells, which previously had eluded our visual inspection of time-lapse movies. Other parameters such as neurite and branch numbers, as well as cell migration speed, were not affected. These results suggest that MKK7 regulates two distinct functions, one occurring at an early and the other at a late phase during neurite outgrowth. Feature distribution plots again represent the heterogeneous, but statistically significant, behavior of cell populations (Fig. 7 e).
Spatiotemporal regulation of RhoA activation by two RhoA-specific different GAPsAs a proof of concept for the validity of our siRNA screen, we sought to explore some relevant neurite outgrowth pheno-types with respect to spatiotemporal Rho GTPase activation dynamics. We focused on an apparently paradoxical result of our screen that is centered around RhoA and two RhoA-specific GAPs: ARH GAP5 (p190RhoGAP; Ridley et al., 1993; Arthur and Burridge, 2001) and DLC1 (deleted in liver cancer; Kim et al., 2009; Braun and Olayioye, 2015). Consistently with the classic model (Hirose et al., 1998), we observed that RhoA KD led to longer neurites, which results in decreased neurite col-lapse events (Fig. 6, cluster 11). Furthermore, as expected, ARH GAP5 KD, which is expected to augment RhoA activity, led to short neurites owing to increased neurite collapse (Fig. 6, clus-ter 3). In marked contrast, DLC1 KD, which is also expected to augment RhoA activity, surprisingly led to an increase in neur-ite outgrowth (Fig. 6, cluster 15). As we had previously shown (Fritz et al., 2013), two distinct spatiotemporal RhoA activation pools, most likely involving different signaling complexes, are associated with growth cone advance and collapse in N1E-115 cells. We therefore hypothesized that each GAP regulates one of the specific RhoA signaling complexes. During growth cone advance, RhoA activity localizes to the tip of filopodial F-actin bundles (Fig. 8, a and c; and Video 8). In contrast, RhoA is
on January 6, 2016jcb.rupress.org
Dow
nloaded from
Published January 4, 2016

rho GTPase signaling complexity in neurite outgrowth • Fusco et al. 99
on January 6, 2016jcb.rupress.org
Dow
nloaded from
Published January 4, 2016

JCB • Volume 212 • NumBer 1 • 2016100
activated in retraction fibers at the tip of spontaneously collaps-ing growth cones (Fig. 8, b and d; and Video 8). Importantly, RhoA activity correlates only with its downstream cytoskele-tal output, myosin light chain phosphorylation (pMLC) during growth cone collapse (Fig. 8 e), suggesting that this specific process is regulated by Rho kinase. In contrast, low pMLC signal was observed during growth cone advance, suggest-ing that RhoA regulates a distinct effector pathway involved in filopodium formation.
To explore the possibility that DLC1 and ARH GAP5 reg-ulate two distinct spatiotemporal pools of RhoA activity, we performed a series of experiments in which we knocked down DLC1, ARH GAP5, or both. For these experiments, we selected the single siRNAs of which the feature vector most resembled the mean MDS. Quantitative PCR indicated potent reduction of DLC1 and ARH GAP5 messages in both single and double KD (Fig. 9 a). Quantification of steady-state neurite outgrowth levels recapitulated the results observed using our CV approach: DLC1 KD led to increased whereas ARH GAP5 KD led to reduced neu-rite outgrowth (Fig. 9, b and c). Combined DLC1/ARH GAP5 KD led to reduced neurite outgrowth, indicating that, at this specific length scale, ARH GAP5 loss of function is dominant over DLC1 loss of function. Because RhoA spatiotemporal signaling pat-terns are evident only when the growth cone is examined (see Fig. 8 and Fritz et al., 2013), we zoomed in on the cytoskeletal and spatiotemporal RhoA activation phenotypes at this specific length scale (Fig. 9, d–f). DLC1 KD cells exhibited longer filo-podia that extended out of the growth cone veil (Fig. 9 d). Rather than being focused at the tip of filopodial F-actin bundles, RhoA was activated throughout the filopodium (Fig. 9, e and f). This suggests that DLC1 functions by locally deactivating RhoA to shape its focused activity pattern at the tip of F-actin bundles. In DLC1 KD cells, the aberrant RhoA activation pattern then leads to longer and more stable filopodia, which favor steady growth cone motility (Video 9). Ultimately, this can explain the increased neurite outgrowth phenotype observed at the length scale of a whole cell. ARH GAP5 KD cells did not display a specific filopo-dium phenotype as with DLC1 KD (Fig. 9 d). Instead, rather than being confined to filopodia, aberrant RhoA activity was potently upregulated not only throughout filopodia structures but also within the growth cone (Fig. 9, e and f). Furthermore, ARH GAP5 KD growth cone filopodia exhibited “frozen” morphodynamics, suggestive of excessive actomyosin contractility (Video 9). This aberrant cytoskeletal state then most likely is highly permissive for the increased growth cone collapse frequency observed at larger time scales. Double KD of ARH GAP5 and DLC1 revealed a hybrid phenotype (Fig. 9, d–f). Long filopodia, with activated RhoA throughout the filopodium, were observed as for the DLC1 KD phenotype. Additional RhoA activity throughout the growth cone body was observed as for the ARH GAP5 phenotype. The latter pool of aberrant RhoA activity might then lead to excessive contractility that favors growth cone collapse, ultimately leading to short neurites in double-KD cells (Fig. 9, b and c). These results strongly suggest that DLC1 and ARH GAP5 respectively regulate filopodia formation and growth cone advance, versus actomyosin contractility and growth cone collapse.
Discussion
We present NeuriteTracker, a robust CV pipeline to track mor-phodynamics of neurons transfected with a genetically en-coded, nonperturbing, fluorescent morphology reporter that can be time-lapsed for hours using air objectives in different neuronal-like cell types (Fig. S4, a–c). Automatic identification of multiparametric MDSs provides the throughput to analyze large time-lapse datasets and detects complex dynamic pheno-types that are difficult to discern by human visual inspection. The benefit of using dynamic features is demonstrated by the finding that they stratify phenotypes in additional clusters when only static features are considered during the analysis of our siRNA screen. Transiently occurring phenotypes can also be identified when specific temporal episodes are taken into ac-count (Fig. 7, c and d), at the expense, however, that larger datasets are required to obtain adequate statistical power. Our approach identified two discrete neuronal differentiation epi-sodes with specific morphodynamic states in an unbiased fash-ion (Fig. 7, a and b). Furthermore, we analyzed a Rho GTPase interactome that provides substantial coverage of the cytoskel-eton regulating machinery controlling neurite outgrowth, with all candidates yielding a quantifiable phenotype. Our unbiased approach that uses unsupervised clustering of the MDSs uncov-ers a relatively small phenotypic space that is already visible using a small feature set (LS feature set, 19 clusters; HS feature set, 15 clusters). The benefit of using a larger feature set is then simply that it provides more information about the phenotypes. Our results are consistent with the recent finding of a similarly small phenotypic space in a perturbation screen targeting cell morphology in Drosophila melanogaster hemocytes (Yin et al., 2013). Importantly, cell migration was also impacted by many gene perturbations, revealing that the cytoskeletal regulation machinery regulating neurite outgrowth and cell migration is to a large extent shared.
Current models of Rho GTPase function in neurite out-growth posit that Rac1/Cdc42 regulate neurite extension, whereas RhoA controls neurite retraction (Hirose et al., 1998; da Silva and Dotti, 2002; Govek et al., 2005). However, such simple models are not consistent with the apparent complexity of Rho GTPase signaling in which GEFs (Rossman et al., 2005), GAPs (Moon and Zheng, 2003), and effectors (Pertz, 2010) outnumber their cognate Rho GTPases. The rationale behind our screen was to explore the significance of the large potential Rho GTPase interactome we had previously unveiled using a proteomics approach (Pertz et al., 2008; Fig. 3). Indeed, our screen revealed that the different proteins of this potential Rho GTPase interactome are all important for the neurite outgrowth process. Thus, our results suggest a complex scenario in which multiple spatiotemporal Rho GTPase signaling networks, most likely consisting of GEFs, GAPs, GTPases, effectors, and their associated proteins, fine-tune different MPs.
Our proof-of-concept study in which we perturbed two RhoA-specific GAPs, which surprisingly led to two distinct global neurite outgrowth phenotypes, illustrates how this spa-tiotemporal signaling complexity will have to be tackled in the
Figure 6. Hierarchical clustering identifies MDS phenoclusters. Hierarchical clustering of MDSs using the LS feature set. Phenotypic clusters were manually sorted by the overall polarity of their MDSs. Representative images of major phenotype classes comprising multiple clusters were identified by a mathe-matical model described in Materials and methods section Identification of phenocluster representative cells. These representative images do not take into account any dynamic feature.
on January 6, 2016jcb.rupress.org
Dow
nloaded from
Published January 4, 2016

rho GTPase signaling complexity in neurite outgrowth • Fusco et al. 101
future. Our data suggest that the two RhoA-specific GAPs regu-late two distinct spatiotemporal RhoA signaling complexes, one involved in regulation of filopodium formation during growth cone advance and the other involved in the generation of con-tractility necessary for growth cone collapse. Our data suggest that ARH GAP5 is involved in the regulation of growth cone collapse because its perturbation leads to aberrant RhoA activ-ity not only within unprotrusive filopodia but also within the body of the growth cone, which further correlates with frozen growth cone morphodynamics and ultimately with short neur-ites. This conceptually fits well with the function of RhoA in growth cone collapse, as exemplified by decreased instance of neurite retraction leading to longer neurites in the RhoA KD phenotype. Given the different global neurite outgrowth phe-notype induced by DLC1 KD, we propose that DLC1 regulates a RhoA-dependent function distinct from that of ARH GAP5.
Our data strongly suggest that DLC1 is involved in the fine spa-tial regulation of the focused RhoA activation pool at the tip of F-actin bundles, which most likely involves reaction–diffusion systems as previously documented for RhoA (Bement and von Dassow, 2014). This specific spatiotemporal RhoA activity pool might serve to locally position the formin mDia1 to polymerize F-actin to enable filopodia extension (Goh et al., 2012). DLC1 loss of function might then compromise RhoA deactivation, leading to widening of the RhoA activation domain. This in turn might lead to aberrant formin regulation and longer and more stable filopodia that favor growth cone advance, ultimately leading to increased neurite outgrowth. Our ARH AGP5/DLC1 double-KD data clearly show a hybrid phenotype with charac-teristic features from both single KDs, strongly suggesting that that both GAPs specifically regulate the two distinct cytoskele-tal processes of growth cone advance and collapse.
Figure 7. Temporal analysis of neuronal dynamics in control and MKK7-KD cells. (a–d) Control and MKK7-KD time-lapse sequences from multiple experi-mental plates were divided in 19 1-h bins. Coefficient of variation of selected features for each temporal bin for control (a and c) and MKK7 KD (b and d) cells. Measurements for the whole-cell population (a and b) and the 10% of cells with the highest neurite extreme length (c and d) are shown. Representative HDS graph representations of cells from the tenth percentile at the 1-, 5-, 10-, 15-, and 20-h time points have been identified using a mathematical model (Materials and methods; c and d). (e) Feature distributions at the two different time point intervals (1–6 h and 14–20 h). Vertical bars display distribution means.
on January 6, 2016jcb.rupress.org
Dow
nloaded from
Published January 4, 2016

JCB • Volume 212 • NumBer 1 • 2016102
These observations have important consequences for the interpretation of our global neurite outgrowth phenotypes. Many of the neurite outgrowth phenotypes observed in our siRNA screen might emerge from aberrant spatiotemporal Rho GTPase signaling patterns occurring at the micrometer-length scale at which the growth cone functions, which might then propagate at the whole-cell scale. The information-rich, multi-parametric phenotypic signatures extracted by our CV pipeline therefore do not allow to unambiguously decipher the spatio-temporal complexity of Rho GTPase signaling. Deconvolving this molecular complexity of Rho GTPase signaling will there-fore require evaluation of molecular perturbations at multiple time and length scales.
Finally, we nonexhaustively discuss some potential Rho GTPase signaling networks suggested by our screen (Fig. 10). The apparently conflictual phenotypes caused by DLC1 and
ARH GAP5 KD, which can be understood from the experiments performed in Fig. 9, are illustrated in Fig. 10 a. Our approach detects a continuum of similar phenotypes for KD of members of a well-known Rac1 effector pathway, consisting of the effectors Wave2 (WASF2) and N-WASP (WASL), as well as additional interactors known to regulate the Arp2/3 complex (Machesky et al., 1999; Banzai et al., 2000; Bradley and Koleske, 2009; Tahirovic et al., 2010), of which loss of function leads to short neurites (Fig. 10 b). Surprisingly, the Rac1 “short neurites” KD phenotype (group 1: clusters 1 and 3) is also phenocopied by multiple Rac1-specific GEFs: KD of GEFs such as ARH GEF7 (ten Klooster et al., 2006; β-PIX), DOCK7 (Pinheiro and Gertler, 2006), or Trio (Fig. 10 c; Bellanger et al., 2000). This suggests the existence of multiple complex spatiotemporal Rac1 pathways that regulate neurite protrusion. Consistently with the classic model in which RhoA regulates myosin contractility to enable
Figure 8. Dynamics of RhoA activation in advancing and collapsing growth cones. (a and b) Time series showing RhoA activation in advancing and col-lapsing growth cones from differentiated N1E-115 cells cotransfected with the RhoA2G FRET probe and pLenti-Lifeact-mCherry. (top) Ratio (RhoA activation) images. (bottom) Lifeact-mCherry (F-actin) images. Time scale, min:s. Bar, 10 µm. (c and d, top left and right) High-magnification images of advancing and collapsing growth cones outlined in the top rows of panels a and b. Red arrowheads point to the RhoA activity zone. (bottom left) Overlay of the time series frames showed in the top rows of panels a and b. Red arrows indicate the advance or collapse direction. (bottom right) Overlay images of the top-left and right panels of c and d highlight the RhoA activity zone (red) over the filopodia F-actin bundles (green). Red arrowheads point to the RhoA activity zone. Bar, 2 µm. (e) High-resolution images of advancing and collapsing growth cones from differentiated N1E-115 cells stained for phalloidin and pMLC are shown. Bar, 10 µm.
on January 6, 2016jcb.rupress.org
Dow
nloaded from
Published January 4, 2016

rho GTPase signaling complexity in neurite outgrowth • Fusco et al. 103
collapse (Hirose et al., 1998), ROCK2 KD, a RhoA-effector pro-tein regulating myosin light chain kinase (MLCK; Amano et al., 1996; Matsui et al., 1996; Borisoff et al., 2003; Govek et al.,
2005), phenocopies RhoA KD. This is also true for Ect2 KD, a GEF that can activate RhoA (Fig. 10 d; Schmidt and Hall, 2002; Tsuji et al., 2011), suggesting that Ect2, RhoA, and ROCK2
Figure 9. Characterization of DLC1, ARH GAP5, and double-KD phenotypes. (a) Quantitative RT-PCR of DLC1, ARH GAP5, and double DLC1 and ARH GAP5 KD efficiencies in N1E-115 cells. Mean ± standard deviations from four replicates are shown. (b and c) Quantification of global neurite outgrowth phenotypes of the three perturbations. (b) Representative images of α-tubulin–stained N1E-115 KD cells. Inverted black-and-white contrast. (c) Quantifica-tion of total neurite outgrowth. Images were segmented and quantified using the Metamorph neurite outgrowth plugin. The single siRNAs that produced the z-score vector with lowest distance to the mean MDS were used for KD. Population mean ± standard deviations are shown for the whole-cell population (n = 150 cells). One-way ANO VA with Bonferroni’s multiple comparison test was used. ***, P < 0.0001. (d) High-resolution growth cone images of phalloi-din-stained, control, and KD growth cones. All experiments were performed and stained simultaneously and acquired with identical acquisition settings. (e) Spatiotemporal RhoA activation patterns in response to the three perturbations. Ratio (RhoA activation), Lifeact-mCherry (F-actin), and overlay representative images of both signals are shown. Cells were cotransfected with the RhoA2G FRET probe, a Lifeact-mCherry construct, and the indicated siRNA. Ratio and F-actin images are color-coded for signal intensity. Ratio images have been scaled identically across experiments. Overlay images highlight the RhoA activ-ity zone (red) over the filopodia F-actin bundles (green). (f) Quantification of RhoA activation in the three perturbed states. The RhoA activity zone was calcu-lated as the pixel percentage of the growth cone RhoA activity area over the growth cone p-domain area. Population mean ± standard deviation are shown for n = 5 cells/sample. One-way ANO VA with Bonferroni's multiple comparison test was used. ***, P < 0.0001. Bars: (b) 100 µm; (d) 10 µm; (e) 10 µm.
on January 6, 2016jcb.rupress.org
Dow
nloaded from
Published January 4, 2016

JCB • Volume 212 • NumBer 1 • 2016104
might function together to promote neurite collapse. However, this is not phenocopied by KD of other RhoA-specific GEFs (ARH GEF3: C3; TRIO: C1; ARH GEF11 and ARH GEF18: C18; and ARH GEF2: C19), suggesting additional mechanisms of spa-tiotemporal RhoA activation. Another novel finding was that KD of Cdc42, DOCK9 (a Cdc42-specific GEF; Lin et al., 2006) and Cdc42BPB (a Cdc42 effector also called myotonin-related dys-trophyn kinase [MRCK]; Leung et al., 1998; Chen et al., 1999) phenocopy RhoA KD (Fig. 10 d). Because MRCK also regulates MLCK and contractility, a DOCK9, Cdc42, and MRCK signal-ing network might therefore also regulate growth cone collapse. It has been shown that the simultaneous phosphorylation of MLC, induced by RhoA and Cdc42 via ROCK and MRCK, is crucial to promote actomyosin contractility and guarantee proper migration (Wilkinson et al., 2005). However, this cooperative mechanism between these two GTPases has never been shown in neuronal cells. These results suggest that RhoA and Cdc42 may cooperate to regulate actomyosin contractility to control growth cone collapse and neurite retraction. Our CV approach provides a first estimate of the complexity of a spatiotemporal Rho GT-Pase signaling network during neuronal morphodynamics. This provides an initial resource that will allow researchers to gate on relevant morphodynamics processes to dissect these complex spatiotemporal networks at multiple time and length scales.
Materials and methods
Overview of wetlab experimentsDNA constructions. For simultaneous expression of Lifeact-GFP and NLS-mCherry, we created a bicistronic expression vector consisting of Lifeact-GFP, an IRES sequence (derived from a pIRES vector; Clontech), and NLS-mCherry (Fig. 1 a). This construct was built using InFusion technology (Clontech) and was cloned in a pcDNA3.1(+) eu-karyotic expression vector (Invitrogen).
Accession numbers. The accession number for the pcDNA Life-act-GFP/NLS-mCherry construct is Addgene 69058.
Cell culture and transfection. N1E-115 neuroblastoma cells (American Tissue Culture Collection) were cultured in DMEM sup-plemented with 10% FBS, 1% l-glutamine, and 1% penicillin/strep-tomycin. For differentiation, N1E-115 cells were starved for 24 h in serum-free Neurobasal medium (Invitrogen) supplemented with 1% l-glutamine and 1% penicillin/streptomycin. For the double siR-NA-mediated KD and plasmid transfection, cells were transfected as previously described (Chong et al., 2006), using 400 ng of the plasmid pcDNA-Lifeact-GFP-IRES-NLS-mCherry and 20 pmol Stealth Select siRNAs (Invitrogen). 1 µl of Transfectin (Bio-Rad) was used as trans-fection reagent. 48 h posttransfection, cells were starved in Neurobasal medium. 72 h posttransfection, cells were detached with Puck’s saline and replated on a glass-bottom 24-multiwell plate (MatTek) coated with 10 µg/ml laminin (Millipore). Approximately 3 h after seeding, cells were immediately used for time-lapse imaging. For transfection of both siRNAs and plasmids, cells were transfected as previously de-scribed (Feltrin et al., 2012). PC12 Neuroscreen-1 subclone cells (Chen et al., 2012) were cultured in DMEM with 1% l-glutamine, supple-mented with 10% horse serum, 5% FBS, and 1% penicillin/streptomy-cin. Cells were culture on 50 µg/ml collagen solution from bovine skin (Sigma-Aldrich). For differentiation, PC12 Neuroscreen-1 cells were starved for 24 h in DMEM with 1% l-glutamine supplemented with 1% glucose, 1% penicillin/streptomycin, and 1% horse serum; 50 ng/ml NGF was added to the medium to induce differentiation. For PC12 transfection, cells were transfected as previously described (Chong et al., 2006), using 400 ng of the plasmid pcDNA-Lifeact-GFP-IRES-NLS-mCherry. 0.8 µl of Transfectin (Bio-Rad) was used as transfection reagent. 24 h posttransfection, cells were starved in DMEM medium. 72 h posttransfection, cells were gently detached using a cell scraper and replated on a glass-bottom 24-multiwell plate (MatTek) coated with 50 µg/ml collagen solution from bovine skin (Sigma-Aldrich).
Immunofluorescence. N1E-115 cells were washed in PBS, fixed in PBS containing 4% PFA (Sigma-Aldrich) for 10 min, and permeabilized
Figure 10. Selected potential Rho GTPase functional networks identified in the RNAi screen. Potential Rho GTPase signaling net-works were identified using Ingenuity Path-way Analysis based on high-confidence protein–protein interactions or literature-based knowledge. Representative static phenotypes corresponding to the RNAi perturbations are shown. Each solid line represents a direct pro-tein–protein interaction. A legend identifies the functions of the proteins in the network. (a) Multiple functions for distinct RhoA-spe-cific GAPs. (b) Rac1-dependent effector path-way controlling the Arp2/3 complex. KD of these proteins all lead to a “short neurites” phenotype (group 1: clusters 1, 3, and 4). (c) Potential regulation of Rac1 by multiple Rac1-specific GEFs. (d) Potential Rho GTPase signaling networks regulating myosin light chain. All phenotypes correspond to a “long and unbranched neurites” phenotype (group 4 clusters 11 or 12).
on January 6, 2016jcb.rupress.org
Dow
nloaded from
Published January 4, 2016

rho GTPase signaling complexity in neurite outgrowth • Fusco et al. 105
in PBS containing 1% Triton X-100 for 2 min. Coverslips were washed in PBS for 20 min and blocked in 2% BSA and 0.1% Triton X-100 in PBS for 15 min. Cells were stained with primary antibodies for 1 h (Alpha Tubulin Clone DM1A; Sigma-Aldrich), phospho–myosin light chain 2 (Cell Signaling Technology), and then with secondary antibod-ies for 30 min (Alexa Fluor 555–labeled phalloidin, Alexa Fluor 546 secondary antibody, and DAPI for 30 min; Invitrogen).
Microscopy and image acquisition. All experiments were im-aged using an inverted Eclipse Timicroscope (Nikon) controlled by Metamorph software (Universal Imaging). Laser-based autofocus, a CFI Plan Apo Lambda 10× (NA 0.45; Nikon) objective, and a Cool-Snap HQ2 camera (Roper Scientific) were used throughout. For live-cell imaging experiments, rapid switching between the GFP and mCherry channels was performed using two independent LED lamps with excitation at 470 and 585 nm (Cool LED) with a multiband-pass EGFP/mCherry filter cube (Chroma Technology Corporation). All experiments were performed in serum-free Neurobasal medium (Invitrogen) supplemented with 1% l-glutamine and 1% penicillin/streptomycin. For measurements of neurite outgrowth at steady state, differentiated, siRNA-transfected cells were replated on 18-mm glass coverslips coated with 10 µg/ml laminin. 24 h after plating, the cells were fixed and stained with DAPI and an antitubulin antibody. DAPI and tubulin images were acquired in a 5 × 5 matrix of fields of view. Image analysis was performed using the Metamorph neurite outgrowth plugin (Universal Imaging). Selected fields of view were then acquired using a CFI Plan Apo Lambda 10× (NA 0.45) objective (Nikon).
For time-lapse imaging of neurite outgrowth dynamics in cells expressing Lifeact-GFP and NLS-mCherry, 25,000 transfected N1E-115 cells were replated on a glass-bottom, 24-well plate (MatTek) coated with 10 µg/ml laminin. 4 h after plating, 10 selected fields of view per well were imaged in Neurobasal medium (Invitrogen) in a heated closed chamber using a CFI Plan Apo Lambda 10× (NA 0.45) objective (Nikon). Selection of fields of view was performed using Metamorph software. For that purpose, the GFP channel was acquired in a 7 × 7 matrix of fields of view for each of the 24 wells. A macro was then used postacquisition to select 10 fields of view containing an adequate number of cells exhibiting a specific range in fluorescence intensities and cell areas. This ensured that each field of view displayed a similar number of cells and fluorescence intensities and excluded fields of view with cellular debris. The selected fields of view were automatically translated in a stage position list, which was used for the time-lapse experiment. This resulted in acquisition of 240 fields of view in GFP and mCherry channels throughout the 24-well plate every 12 min for a total of 19.6 h.
For imaging of F-actin and/or RhoA activation dynamics, N1E-115 cells were imaged using a Plan Apo VC 60× (NA 1.4) objective (Nikon) in Neurobasal medium (Invitrogen). Förster resonance energy transfer (FRET) imaging was performed as described before (Fritz et al., 2013). Ratio imaging analysis was performed with Biosensor Processing Software 2.1 (http ://lccb .hms .harvard .edu /software .html). Images were thresholded on each channel; shade, background, and photobleach corrected; masked; and registered before ratios were calculated. Ratio images are color-coded so that warm and cold colors represent high and low biosensor activity, respectively.
For time-lapse imaging of neurite outgrowth dynamics in PC-12 Neuroscreen-1 cells, 80,000 transfected Neuroscreen-1 cells were re-plated on a glass-bottom, 24-well plate (MatTek) coated with 50 µg/ml collagen solution from bovine skin (Sigma-Aldrich). 30 min after seeding, 50 ng/ml NGF was added to the medium to induce differentia-tion. After 6 h, selected fields of view per well were imaged in DMEM medium (Invitrogen) plus NGF in a heated closed chamber using a CFI Plan Apo Lambda 10× (NA 0.45) objective (Nikon).
Identification of a Rho GTPase signaling network. To identify a Rho GTPase signaling network, we took advantage of our recent pro-teomic analysis of purified neurite and soma fractions of N1E-115 cells (Pertz et al., 2008). This dataset provides spatial information about the subcellular localization (neurite/soma) for 4,855 proteins through the measurement of relative protein enrichment in purified neurite and soma fractions. Using Ingenuity Pathways Analysis (IPA) software, we first identified Rho GTPases expressed in our cell system (Rac1, Cdc42, RhoA, RhoB, RhoC, and RhoG). We then used these as “bait” to identify proteins that are documented to interact directly with these Rho GTPases by interrogating the Ingenuity Pathways Knowledge Base, which is a systemwide database of biological pathways created from multiple relationships of proteins, genes, and diseases. Only con-sidering proteins identified in our proteomics screen to be neurite en-riched or equally distributed in neurite and soma fractions, we then manually sorted these proteins in GEFs, GAPs, RhoA effectors, Rac1 and Cdc42 effectors, and additional interacting proteins. In a second round, we then used these different protein groups as baits to identify additional interactors that might work upstream of GEFs and GAPs or downstream of effectors. This yielded a Rho GTPase signaling net-work of 219 proteins (Fig. 3 a), in which most proteins are significantly enriched in the neurite. We used Ingenuity analysis pathway software to perform a Gene Ontology analysis of the protein ensemble in this signaling network (Fig. 3 b). As expected, we observed enrichment of Rho GTPase, adhesion, cytoskeleton, and axonal Gene Ontology terms. Our approach reveals the existence of a neurite-enriched, Rho GTPase signaling network of unanticipated complexity.
Overview of CV analysisWe developed a CV pipeline to segment and track somata and neurites in time-lapse datasets. It extracts and stores representative models for each cell over time. The pipeline is summarized in Fig. 1 c. From these models, we extract features that are used to characterize the morpho-dynamic phenotype of the cell. The resulting data are stored in an HDS representing the cell (Fig. 2 b). For a cell detected at a specific time point, the top of the hierarchy represents the detected cell, with subcel-lular components nucleus, soma, and one or more neurite nodes (Fig. S3). The neurite is the trunk attached to the soma (Fig. 2 b, blue seg-ment), and this can be followed by a tree structure of branches, which are any intersection points between neurite elements (Fig. 2 b, green segments), and leaf nodes, which are branches situated at the extremity of the neurite arborescence (Fig. 2 b, red segments). The CV algorithm first segments the nucleus and soma of each cell. Detected cells in each frame of the movie are linked using a graph-based tracking algorithm to identify individual cells over time. Next, neurites arbors are extracted for each detection by segmenting the full cell body and reconstructing tree structures corresponding to the neurites. Finally, detected neur-ites are tracked over time using a similar method as for the somata, and the tracked cell is stored in the HDS data structure. Validation of soma and neurite segmentation and tracking against human annotated ground truth is also shown.
Nucleus segmentation. We extracted a set of nucleus detections {d1,...,dk} from the NLS-mCherry channel of every image (Fig. 1 c) using the MSER (Maximally Stable Extremal Regions) feature detector (Matas et al., 2004) from the VLFeat library followed by a morpholog-ical filling operation. The MSER detector is a robust method to find regions that are stable over a wide range of thresholds while remaining insensitive to contrast change. The minimum and maximum size pa-rameters were fixed at 70 and 170; all other parameters used default settings.
Soma region growing. Using the segmented nuclei as seed re-gions, somata segmentation is accomplished using a region growing
on January 6, 2016jcb.rupress.org
Dow
nloaded from
Published January 4, 2016

JCB • Volume 212 • NumBer 1 • 2016106
and competition algorithm on the Lifeact-GFP channel (Fig. 1 c). For every pixel in the image, we compute the geodesic distance to each nucleus, combining the local intensity differences and the Euclidean distance. For each detected nucleus dk, we defined a potential:
P k ( x ) = 1 _______________ A exp ( −
( I ( x ) − μ k ) 2 _ 2 β 2 σ k 2
) + 1 ,
where μ k and σ k are the mean and standard deviation of the intensities of the pixels describing dk, respectively, and β is a multiplicative factor of σ k representing a tolerance of variation between the local soma in-tensity and the local background. The geodesic distance Uk associated with nucleus dk is defined such that it increases with geometric or inten-sity distance from the nucleus, as the solution of the Eikonal equation ‖ ∇ U k ‖ = P k such that U k ( d k ) = 0 . A distance map to all detected nu-clei is given by U ( x ) = min k=1,…,K U k ( x ) , which we approximate by com-puting the solution of ‖ ∇ U ‖ = P such that U ( d k ) = 0 ; for all k where
P ( x ) = 1 _______________ A exp ( −
( I ( x ) − μ k ) 2 _ 2 β 2 σ k 2
) + 1
and the index of the closest region k is decided during the propagation of a variant of the Fast Marching algorithm. The main advantage of this approach over the original (Benmansour and Cohen, 2009) is that the potential values are decided during the propagation. The somata segmentations sk are obtained by thresholding s k = R k ∩ { U < T g } ∩ { D < T e } , where {Rk} is the Voronoi tessellation associated with U the set of nuclei {dk}, the Euclidean distance to the set of nuclei is denoted D, and the geodesic and Euclidean thresholds are denoted Tg and Te, respectively. For all our experiments, we set parameter values A = 1e7, β = 1.5, Tg = 2e − 6, and Te = 7.
Detection filtering. Cell detections c t i = ( d t i , s t i ) are filtered before tracking is performed to retain the most reliable detections. Detections too close to the image boundary are ignored (distance from nucleus centroid <10 pixels). The minimum tolerated nuclei circularity is 0.2, and the maximum is 0.85.
Cell tracking and identification. For each time-lapse sequence, an algorithm searches through the full set of cell detections c t i = ( d t i , s t i ) and iteratively associates the most similar cells to track them over time (Fig. 1 c). We construct a graph G = (C,E), where each node c t k ∈ C corresponds to a detection. For each cell c t k in time step t, edges e ∈ E are formed between c t k and all past and future detections within a time window W. A weight we measuring the similarity between each pair of cell detections is assigned to each edge. The weight takes into account spatial distance, temporal distance, and differences in shape between the two cells. The weight is given by w e = α ‖ c t1 k − c t2 l ‖ + β | t1 − t2 | + γf ( v t1 k , v t2 l ) , where e k,l connects c t k and c t l , and v k is a shape feature vector containing c t k ’s area, perimeter, mean intensity, and major and minor axis lengths of a fitted ellipse. f evaluates differences between a feature a extracted from c t k and c t l as
f ( a k , a l ) = | a k − a l _ a k + a l | . According to this formulation, the tracking solution corresponds to the set of edges E’⊂ E that minimizes the cost Σ e∈E’ w e .To perform the minimization, we use a graph association tracking algorithm that iter-atively selects an edge with minimum cost and adds it to the tracking set until a cost threshold is reached (see below). The output of this algorithm is a set of lists of cell detections corresponding to the instan-taneous location of each neuron over time. Using these lists, we assign identities to the detections belonging to each neuron.
Neurite segmentation and association. Neurites are detected for each neuron using a three-step process. First, the image is partitioned into regions, one assigned to each tracked cell. The probability of a pixel u being assigned a label Jt(u) corresponding to neuron i is de-duced using Bayes’ rule:
P ( J t ( u ) = i | C t , I t ) = P ( C t , I t | J t ( u ) = i )
_________________ ∑ η=1 m P ( C t , I t | J t ( u ) = η ) ,
where It is the image at time t, Ct = { c t l … c t m } is the set of cells present in it, and P(Jt(u)) is a uniform distribution. The numerator is modeled as the probability of the path L that connects maximally the pixel u to the cell
c t i , P ( C t , I t | J t ( u ) = i ) = | max L:u→ c t i ∏ { l r } ∈L P ( I t ( r ) | l r ) ,
where lr are indicator variables for the locations forming the path L. Optimal maxima can be found by minimizing the negative likeli-hood using geodesic shortest path, which produces a partitioning of the image into connected components assigned to each cell. Next, a tubu-larity measurement is computed for each pixel (Sethian et al., 1999) to identify likely neurites. Cells that were detected but not tracked have a suppressed tubularity value to avoid false positives on the cell bound-ary. A sigmoid function is fitted to the tubularity score using maximum likelihood to obtain a potential Pt. A front propagation Fast Marching algorithm is simultaneously launched from all cells (Benmansour and Cohen, 2009), which solves the Eikonal equation ‖ ∇ U t ‖ = P t and ‖ ∇ L t ‖ = 1 . This yields a geodesic distance map Ut which serves as the cell body likelihood for each neuron (Fig. 1 c), the associated tessellation Vt, and the map of the Euclidian lengths L of the geode-sics. The geodesic distance map is thresholded with a soft threshold Ts, yielding cell bodies for each neuron (Fig. 1 c). Candidate terminal points for the neurites are identified as the local maxima of Lt in each thresholded region. Candidate neurite tracings are found by back-prop-agating the geodesic distance Ut from the local maxima. Only those points for which Ut > Th is above a hard threshold Th are retained. The idea is that even if the candidate endpoints detected in the previous step are not necessarily all correct, they will quickly converge to interesting elongated structures during the back propagation. Finally, a graph rep-resenting a each full neurite tree is constructed as a Minimum Spanning Tree of all back-propagated points, starting from a root touching the soma (Fig. 1 c). Neurites less than 30 pixels in length are removed.
Neurite tracking. Neurites are tracked using the same graph- association algorithm used to track cells. Instead of nucleus centroids, the positions of the centroids of the neurite trees are tracked. Edges connect neurites that emanate from the same cell. The weight we of an edge connecting two neurites N t i and N t’ i is assigned according to spatial distance and a shape measure:
w e = w TCL f ( TotalCableLength( N t i ) ; TotalCableLength( N t’ i ) ) +
w Centroid ‖ Centroid ( N t i ) − Centroid ( N t’ i ) ‖ + w SomaContact ‖ SomaContract ( N t i ) − SomaContract ( N t’ i ) ‖ ,
where wTCL, wCentroid, and wSomaContract are the weights, TotalCa-bleLength(N) is the total cable length of a neurite N, Centroid(N) is its centroid, SomaContact(N) is its contact point with the soma, and
f ( a k , a l ) = | a k − a l _ a k + a l | . Unlike the weights used for cell tracking, the neurite weights ig-nore temporal distance because each neurite is already associated to a tracked cell body.
on January 6, 2016jcb.rupress.org
Dow
nloaded from
Published January 4, 2016

rho GTPase signaling complexity in neurite outgrowth • Fusco et al. 107
Graph association tracking. We construct a graph G = (C,E) where each node c t k ∈ C corresponds to a detection. For each cell c t k in time step t, edges e ∈ E are formed between c t k and all past and future detections within a time window W. A weight we is assigned to each edge according to spatial and temporal distances, and a shape measure w e = α ‖ c t1 k − c t2 k ‖ + β | t1 − t2 | + γf( v t1 k , v t2 l ) where e k,l connects c t k and c t l , and v k is a shape feature vector containing c t k ’s area, perimeter, mean intensity, and major and minor axis lengths of a fitted ellipse. f evalu-ates differences between a feature a extracted from c t k and c t l as
f ( a k , a l ) = | a k , a l _ a k + a l | . To minimize this cost function, we adopt a greedy selection al-
gorithm that iteratively selects an edge with minimum cost w ^ e and adds it to the set E′, removing future and past connections from the detections e k,l connects. The algorithm iterates until the minimum cost w ^ e is greater than a threshold T. The track for neuron i is ex-tracted from E′ by traversing the graph (C, E′) and appending linked nucleus detections to Xi.
Algorithm 1. Greedy tracking association. Start with an empty set E′. (1) Repeat. Find edge e ^
k,l with minimum cost w ^ e . Add e ^
k,l to E′,
linking detections d t1 k and d t2 l . Remove e ^ k,l
from E. (2) If t1 < t2, then: remove edges between d t1 k and future detec-
tions (where t > t1) from E. Remove edges between d t2 l and past detec-tions (where t < t2) from E.
(3) Else, remove edges between d t1 k and past detections (where t < t1) from E. Remove edges between d t2 l and future detec-tions (where t > t2) from E.
(4) End if, until w ^ e > T .Soma segmentation validation. The ability of our method to seg-
ment nuclei and somata from static images was evaluated using a set of three hand-annotated movies selected randomly from the screen. The data were annotated according to the following protocol. First, anno-tators should label only cells that appear in the video for a sufficient amount of time (five frames). Second, they should label only cells with good fluorescent reporter expression. Finally, annotators should care-fully trace the nucleus and soma of cells that fit this criterion. We then used our software to automatically segment the same cells that were annotated by experts. For the quality control analysis, the annotation and automatic segmentation areas in each frame are divided into re-gions and assigned a label from the following list: (a) OK: the nucleus/soma is correctly segmented; (b) FP (false positive): area of nucleus/soma segmentation that does not exist in the annotation; (c) FN (false negative): area of the nucleus/soma annotation that is not recovered by the segmentation.
The results of the validation can be found in Fig. S2 and Video 3. In total, 790 annotations outlining the nucleus and somata were collected from the movies and evaluated.
The automatic nucleus segmentation correctly recovered 94.5% of the area annotated as nuclei by the experts. 35.2% of the area of the segmentation fell outside of the annotation and was considered to be false positive. 5.5% of the area of the annotation was not recovered by the segmentation and was considered false negative. In general, the nucleus segmentation was very accurate but tuned to be slightly larger than the annotation, which explains the difference between the false-positive and false-negative rates.
The automatic soma segmentation correctly recovered 81.1% of the area annotated as soma by the experts. 19.1% of the segmentation area fell outside of the annotation, and was considered to be false pos-itive. 18.9% of the area of the annotation was not recovered by the segmentation and was considered false negative.
Cell-tracking validation. To evaluate the ability of our method to track cells over time, we annotated 20 videos chosen randomly from the screen data. The data were annotated according to the following protocol. Any cell that our software attempted to track for more than five frames was labeled and added to the ground truth. Labeling a cell consisted of placing a bounding box around the soma for every frame in which the cell is present in the video. We compared these annotations to the soma segmentations recovered by our method using a standard tracking evaluation procedure (Smith et al., 2008). In each frame, every cell is assigned one or more states from the following list: (a) OK: the cell is correctly tracked; (b) FP (false positive): a cell was detected that does not exist in the annotation; FN (false negative): a cell appear-ing in the annotation was not detected; (c) MT (multiple tracker): the area of cell in the annotation was shared among multiple tracked cells; MO (multiple objects): the area of a tracked cell covered more than one annotated cells; (d) FI (false identification): an error was made in maintaining the identity of a cell over time (e.g., a detected cell label switched from one annotated cell to another).
A correct detection occurs if a labeled detection sufficiently overlaps the correct corresponding annotation. To establish correspon-dences between detections and annotations, we use the coverage test which checks the F1-measure of the overlap between the area of the detection and the annotation:
F1 = 2 * | d | ∩ | a | ______ d * | d | ∩ | a | ______ a
_______________ | d | ∩ | a | ______ d + | d | ∩ | a | ______ a
,
where | d | ∩ | a | is the intersection of the detection d with the annota-tion a, and | ∩ | is the cardinality operation. If the overlap is greater than a threshold F1 > 0.33, an association is made between the detec-tion and the annotation.
The results of the validation can be found in Fig. S2 and Video 4. In total, 58,064 total cell detections were evaluated. The au-tomatic tracking was correct in more than 90% of the cases. The most common errors were false detections (6.8%), followed by false identifi-cations (2.6%). The remaining errors all occurred with <1% frequency.
Neurite validation. To evaluate the ability of our method to re-cover neurites, we compared automatic neurite detections against 128 hand-annotated cells selected randomly from the screen. Each annota-tion was performed using the TrackEM2 plugin for ImageJ (Schnei-der et al., 2012). The protocol for the evaluation is a slightly modified version of the TRE ES protocol (Cuntz et al., 2010), where a hard de-cision is made as to whether a pixel belonging to a neurite is correctly detected instead of a soft matching score. Each detected neurite pixel must fall within a specified distance (σ = 4.5 pixels) of an annotated neurite pixel to be counted as correct. If it is outside of this range, it is considered a false detection. If no neurite detection falls within the specified distance of an annotation, the annotation is considered a missed detection. The results of our evaluation show that the neurite missed detection rate is just below 30% (Fig. S2 m). The false detection rate is ∼27%. The disagreement between the automatic method and the annotator might seem high, but it is in line with the disagreement between annotators (Fig. S2 n).
Overview of the statistical analysisFeatures are extracted from the HDSs representing tracked cells and stored in a matrix format. Next, a feature profile is created for each siRNA, and the profiles for siRNAs corresponding to the same gene are combined to mitigate off-target effects and build a phenotypic signature for that gene. A robust subset of the complete set of collected features is selected and used for phenotypic clustering. A mathematical model
on January 6, 2016jcb.rupress.org
Dow
nloaded from
Published January 4, 2016

JCB • Volume 212 • NumBer 1 • 2016108
allows automatic selection of representative cells as prototypical ex-amples of each phenocluster. Finally, we perform a temporal anal-ysis comparing the evolution of various features characterizing cell behavior over time.
Definition of features describing soma and neurite morphody-namics. To generate a list of features that describe cell morphology and morphodynamics, we first defined a series of parameters that describe cell components, such as the nucleus, soma and neurite, at a given time point (see the following paragraphs). In a second step, these parameters are then used to compute static and dynamic features.
Definition of nuclei and soma parameters. Area: area of a nu-cleus or a soma. Perimeter: perimeter of a nucleus or a soma. Major axis length and minor axis length: an ellipse is fitted through the nu-cleus and the soma. Major axis A and a minor axis B of the ellipse are measured. Orientation: orientation of the major axis length A of the fitted ellipse (radians). Eccentricity: eccentricity of the fitted ellipse: √ _______
( a 2 − b 2 ) . Circularity: distance measured between a pure circle and the real shape of the nucleus or the soma.
Definition of neurite parameters. We modeled the neurite arbo-rescence using different elements. A neurite is considered as the trunk of a tree. We define a tree root as the attachment point between the neurite and the soma, a branch point as any intersection point between neurite elements, and the extreme point as the extremities of the arbo-rescence. The root is the neurite segment between the tree root and the first branch point, a branch is any elementary part of the tree, and a leaf is a branch situated at the extremity of the neurite arborescence. Using this notation, we extracted a series of parameters that describe the dif-ferent components of a neurite, and that are shown below. A schematic representation of these parameters is shown in Fig. S3.
Extreme length: distances between the tree root and the ex-treme points. Total cable length: sum of the lengths of the root and the branches. Complexity: number of branches in the tree divided by the total cable length of the tree. Number of neurites/branches: num-ber of roots or branches belonging to a cell. Branches length: total length of the branches of a cell. Leaf branches length: total length of the leaves of a cell.
Definition of static features. Using the nuclei, soma, and neur-ite parameters, we created a set of static features, which are described below. Nucleus area: nucleus area of the cell per frame, in pixels. Nu-cleus eccentricity: nucleus eccentricity of the cell per frame. Nucleus major axis length: nucleus major axis length of the cell per frame. Nucleus minor axis length: nucleus minor axis length of the cell per frame. Nucleus orientation: nucleus orientation of the cell per frame. Nucleus perimeter: nucleus perimeter of the cell per frame. Nucleus circularity: nucleus circularity of the cell per frame. Soma area: soma area of the cell per frame. Soma eccentricity: soma eccentricity of the cell per frame. Soma major axis length: soma major axis length of the cell per frame. Soma minor axis length: soma minor axis length of the cell per frame. Soma orientation: soma orientation of the cell per frame. Soma perimeter: soma perimeter of the cell per frame. Soma circular-ity: soma circularity of the cell per frame. Number of neurites: number of roots of the cell per frame. All neurites length branches mean: mean branch length of the cell per frame. All neurites leaf length branches mean: mean leaf length of the cell per frame. All neurites extreme length mean: mean extreme length of the cell per frame. Total cable lengths per neurite mean: mean neurite total cable length of the cell per frame. Complexity per neurite mean: mean neurite complexity of the cell per frame. Number of branches per neurite mean: mean number of branches per neurite of the cell per frame. Max extreme length per neurite mean: mean maximum extreme length per neurite of the cell per frame. Total neurites length: sum of the total cable length of each neurite of the cell per frame. Total neurites branches: sum of the num-
ber of branches of each neurite of the cell per frame. Total complexity: “total neurites branches” divided by “total neurites length” per frame. Distance traveled: distance traveled by the soma of the cell between two consecutive frames. Speed: instantaneous speed of the cell between two consecutive frames. Acceleration: instantaneous acceleration of the cell between two consecutive frames.
Definition of dynamic features. For the dynamic cell features, starting from the initial set of static features, we created five layers of dynamic cell features such as mean value of the feature through time, time a feature expands/contracts, number of inflection points in the feature evolution, and frequency of expansion (freq expansion) of a feature. Please note that to avoid redundancy, only a subset of dynamic features (freq expansion) was taken in account during the analysis of our siRNA screen.
Next, we provide the description of the four layers of dy-namic cell features. Note that in the example we only listed the freq expansion features; however, the same set of features is also valid for the other four layers.
Let F(t) be the feature value at time t and let ΔF(t) = F(t) − F(t − 1) be the feature difference between the two consecu-tive frames t − 1 and t.
Mean: The mean value of the feature through the entire movie. This gives rise to the following features. Time expanding: the number of times where ΔF(t) is positive, which is the number of times where the feature changes positively. Time contracting: number of times where ΔF(t) is negative which is the number of times where the feature changes negatively. Number inflection points: number of times where ΔF(t) switches from a positive value to a negative value and from a negative value to a positive value. Freq expansion: number of times where ΔF(t) is positive divided by the number of frames where the cell appears. This is the number of times per second where the fea-ture changes positively.
This gives rise to the following features. Nucleus area freq ex-pansion: number of times per second where the nucleus area of the cell changes positively. Nucleus eccentricity freq expansion: number of times per second where the nucleus eccentricity of the cell changes positively. Nucleus major axis length freq expansion: number of times per second where the nucleus major axis length neurites of the cell changes positively. Nucleus minor axis length freq expansion: number of times per second where the nucleus minor axis length neurites of the cell changes positively. Nucleus orientation freq expansion: number of times per second where the nucleus orientation neurites of the cell changes positively. Nucleus perimeter freq expansion: number of times per second where the nucleus perimeter of the cell changes positively. Nucleus Circularity Freq Expansion: Number of times per second where the nucleus circularity of the cell changes positively. Soma area freq expansion: number of times per second where the soma area of the cell changes positively. Soma eccentricity freq expansion: number of times per second where the soma eccentricity of the cell changes positively. Soma major axis length freq expansion: number of times per second where the soma major axis length of the cell changes positively. Soma minor axis length freq expansion: number of times per second where the soma minor axis length of the cell changes positively. Soma orientation freq expansion: number of times per second where the soma orientation of the cell changes positively. Soma perimeter freq expan-sion: number of times per second where the soma perimeter of the cell changes positively. Soma circularity freq expansion: number of times per second where the soma circularity of the cell changes positively. Number of neurites freq expansion: number of times per second where the number of neurites of the cell changes positively. Total neurites length freq expansion: number of times per second where the total neurites length of the cell changes positively. Total neurites branches
on January 6, 2016jcb.rupress.org
Dow
nloaded from
Published January 4, 2016

rho GTPase signaling complexity in neurite outgrowth • Fusco et al. 109
freq expansion: number of times per second where the total neurites branches of the cell changes positively. Total complexity freq expan-sion: number of times per second where the total complexity of the cell changes positively.
Data formatting. Data extracted by the segmentation and tracking steps are stored in a nonvectorial form, which must be converted into a matrix for statistical analysis. The analysis is performed on two groups of features: “population” features, which provide instantaneous char-acterizations of a cell or groups of cells; and “dynamic cell” features, which characterize a particular cell over time (Fig. 4 a). The popula-tion features account for several static shape measurements. The pop-ulation tracking data structure takes the form movie(m).cell(c).time(t).feature(f), where m ∈ { 1, … , M } is the movie index, c ∈ { 1, … , C m } is the cell index, t ∈ { 1, … , T } is the time index, and f ∈ { 1, … , F } is the feature index. For analysis, it is aggregated and converted to a matrix with T ∑
m=1
M ∑
c=1
C m ⋅ rows and F columns; i.e., one row per movie/cell/
frame and one column per feature. The dynamic cell features capture both shape and c):feature(f) is aggregated and organized into a matrix with T ∑
m=1
M ∑
c=1
C m ⋅ rows and F columns; i.e., one row per movie/cell and one
column per feature.Single siRNA profiles. To characterize the phenotype associated
with a perturbation, we create a profile for each siRNA using mea-surements extracted from the movies. Each siRNA profile measures whether the siRNA perturbation increased or decreased various mea-surements with respect to the control (Fig. 4 b). A siRNA profile r = { r 1 , … , r F } is a vector of same dimension as the feature vector described above, where r f ∈ ℝ and F denotes the number of features. It is constructed by performing a z -test with 5% significance, comparing for each feature the perturbation population against the control population. If the statistical test indicates that a significant difference exists, the siRNA profile entry for that feature takes the value of the z-score. If the difference is insignificant, the profile takes a value of zero. More spe-cifically, for a feature f the z-score is given by z f ∈ ℝ and h f ∈ { 0, 1 } is the result of the statistical test. If the mean of the two distributions are significantly different the result is h f = 1 , otherwise h f = 0 . The siRNA profile is given by ∀ f = 1, … , F, r f = h f z f , where rf denotes a signed distance measure between the distribution of the control and the perturbed feature. If rf > 0, the polarity is positive and the mean feature value is higher for the siRNA than for the control. If rf < 0, the polarity is negative and the mean feature value is lower for the siRNA than for the control. If rf = 0, the polarity is null and the mean feature value is the same for the siRNA and the control.
Morphodynamic signatures. To mitigate siRNA off-target ef-fects, we create a gene-specific MDS by “averaging” the profiles of the three siRNAs targeting that gene according to the rules described below (Fig. 4 c). As previously proposed (Echeverri et al., 2006), if at least two of three siRNAs produce the same phenotype, this phenotype can be considered on target. We applied this rule to each independent feature, if the feature had the same polarity for two of three siRNAs (positive, negative, or null), it was considered on target. If all three siRNA polarities agree, the MDS score is the mean of the z -scores. If two of three siRNA polarities agree, the MDS is the mean z value of the two siRNAs profiles with the same polarity. In all other cases, we
set the z MDS score to zero. Formally, let r i = { r 1 i , … , r F i } be a siRNA profile, where F denotes the number of features, and i indexes the three siRNAs i ∈ { 1, 2, 3 } . Let ϵ ∈ { − 1, +1 } be a binary value and N(ϵ ) =
| { i s . t . ϵ r f i > 0 } | be the number of siRNA perturbations resulting in a positive polarity (ϵ = 1 ) or negative polarity (ϵ = − 1 ) . The MDS g = { g 1 , … , g F } is given by the mean siRNA profile of those that have the same polarity:
∀ f = 1, … , F, g F = {
1 _ N( ϵ * ) ∑
i s.t. ϵ * r f i >0 r f i if N( ϵ * ) > 1
0 otherwise
,
where
ϵ * = arg max ϵ N(ϵ ) .
For instance, for a given feature, if two siRNAs yield signifi-cantly positive z-scores and if the third siRNA molecule yields a neg-ative z-score, then the feature f value of the gene profile is the mean z-score of the two first RNA molecules. In Table 1, we provide an ex-ample of how the MDS is computed from three siRNA feature profiles.
To determine whether a feature is robust, we checked whether the z-score of a feature for the positive MKK7 KN control is consistent across at least 65% (LS features) or 90% (HS features) for the 32 ex-perimental plates (compared with the negative, nontargeting control). Formally, let F be the full set of collected features. We reduce this to a subset F ^ = { f ̂ 1 , … , f ̂ F ^ } ⊂ F such that f ∈ F ^ if, and only if:
max { | { p s.t. r f p > 0 } | , | { p s.t. r f p < 0 } | , | { p s.t. r f p = 0 } | } > PS,
where P is the number of plates, r f p is the siRNA profile of the MKK7 control in the plate p, and S ∈ [ 0, 1 ] is a threshold value. By setting S = 0.65 (LS) and 0.9 (HS), we reduce the size of the feature space to 23 (LS) and 8 (HS) features.
Phenocluster identification. We used bottom-up hierarchical clustering (Bakal et al., 2007; Yin et al., 2013) to identify sets of genes that share common MDSs. To accomplish this, we first defined a dis-tance metric D(i,j) allowing us to compare pairs of MDSs gi and gj. We used a straightforward method based on the MDS polarity. The pro-posed distance depends on the signed distance between the gene pro-files: D(i,j) = D(sign(gi),sign(gj)), where sign ( g i ) = { sign ( g 1 i ) , … , sign ( g F i ) g } , sign ( g f i ) = 0 if g f i = 0, sign ( g f i ) = 1 if g f i > 0, and sign ( g f i
) = − 1 if g f i < 0 . In other words, two genes have a similar phenotype if their features have the same polarity. This can be computed by using the L0 distance:
D(i, j ) = 1 __ F | { f s . t . sign( g f i ) ≠ ( g f j ) } | = 1 __ F ‖ sign( g f i ) − ( g f j ) ‖ ο ,
which gives a percentage of features that are matching between two genes. Evaluation of the distance between two clusters was performed by comput-ing the L0 distance between the two mean points of the clusters. We set the minimum number of genes per cluster to three, with the consequence that if a cluster is composed of fewer than three genes, we consider these genes as unclustered. The number of clusters also depends on the dendrogram
Table 1. An example of how the MDS is computed from three siRNA feature profiles
Profiles 1 2 3 4 5 6 7 8 9 10
siRNA1 0 0 0 0 0 −15 10 0 2 −12siRNA2 0 0 0 5 8 8 8 −6 −11 −10siRNA3 0 10 −5 −8 10 4 6 −4 −15 −8MDS 0 0 0 0 9 6 8 −5 −13 −10
on January 6, 2016jcb.rupress.org
Dow
nloaded from
Published January 4, 2016
JCB • Volume 212 • NumBer 1 • 2016110
threshold, which gives the minimum percentage of matching features in each cluster. This percentage is directly connected to the L0 distance. If this threshold is too high, there are few clusters; if the threshold is too low, the clusters are too noisy. We came to a compromise by iteratively testing dif-ferent threshold values, visually evaluating the quality of both the clusters and the identified phenotypes by inspection of HDS graph representations of cells identified using a mathematical model to select penetrant pheno-types. The mathematical model is described below. We then chose the 60% (LS feature set) and 70% (HS feature set) threshold, implying that 60% or 70% of the features match in a given cluster.
Identification of phenocluster representative cells. For each phe-nocluster, we identified representative cells with a highly penetrant phenotype. We then provide static or time-lapse datasets using graph representations of the HDS extracted for these cells (Video 5). For that purpose, we first identified the single siRNA profile that has the high-est similarity with the mean MDS. We then selected the single siRNA profile with the highest number of on-target features. We then selected cells with a highly penetrant phenotype. More specifically, for a given gene i, we looked for a cell x n ^ i ∈ { x 1 i , … , x N i } , where x n i ∈ { x n,1 i , … , x n,F i } , such that this cell has features strongly consistent with the cen-troid x ¯ . The optimization formulation is:
n ^ = arg max n Σ f=1 F sign( g f i ) x f,n i − x ¯ f __________ σ f ,
where σ f is the standard deviation of the feature f (computed from all the data), x ¯ f is the centroid value of the feature f for the control, sign [ g f i ] = 1 if the gene profile g f i is positive, and sign [ g f i ] = − 1 otherwise. For this analysis, we focused on a subset of features that are easily visually interpretable. Specifically, we used the follow-ing features: number of neurites, total cable length per neurite mean, and number of branches.
Temporal analysis of neurite outgrowth dynamics. We used our large amount of time-lapse datasets of control and MKK7-KD cells (320 movies each acquired in 32 independent experiments) to analyze the morphodynamic behavior associated with specific temporal epi-sodes during the neurite outgrowth process. For this, we divided each time-lapse series (of ∼20 h) into 20 temporal bins and computed the mean of the feature value in each bin. To compare the temporal evolu-tion of a feature, we normalized the feature value by its variance. Let A = { x 1 , … , x N } , where x n ∈ ℝ , be the values of a feature for all the cells of a control. We denote by μ and σ2 the mean and variance of A, respectively. Let A b = { x 1 b , … , x N b } , where x n b ∈ ℝ is a subset A b ⊂ A such that x n b is restricted in the temporal bin b. Similarly, we denote by μb and σ b 2 the mean and variance of Ab, respectively. We normalized the data as follows:
x n b ← x n b − μ ____ σ .
Additionally, we illustrated this temporal analysis by selecting repre-sentative cells in Fig. 5 (A and B). Each cell is automatically selected from a model. Let X = { X 1 , … , X F } be a model for a targeted cell, where X f ∈ ℝ is chosen regarding the variation of μb in the analysis of Fig. 5 (A and B). The method consists of selecting the cell x n ^ ∈ { x 1 , … , x N } , where x n ∈ ℝ F , such that n ^ = arg min n ‖ x n − X ‖ 2 . To filter the cells without neurite, we gated on the 10% cells with longest neurites.
Online supplemental materialFig. S1 shows high-content live-cell imaging platform and RNAi pipeline. Fig. S2 shows an evaluation of the automatic soma and
neurite segmentation and soma tracking. Fig. S3 shows the definition of parameters for feature extraction. Fig. S4 shows PC-12 cell neuronal differentiation tracking and segmentation and hierarchical clustering of MDSs using the HS feature sets. Fig. S5 shows a summary of workflow and statistics of the RNAi screen. Video 1 is raw movies of Lifeact-GFP/NLS-mCherry channels in N1E-115 cells. Video 2 shows dynamic visualization of different steps in the computer vision pipeline. Video 3 shows nuclei and soma segmentation validation. Video 4 shows soma detection and tracking validation. Video 5 shows HDS-modeled graph representations of five global phenotypical classes. Video 6 shows HDS-modeled graph representations of MDSs of dynamic short neurite phenotypes in the LS map. Video 7 shows HDS-modeled graph representations of MDSs of dynamic long and branched neurite phenotypes in the LS map. Video 8 shows RhoA activation dynamics in advancing and collapsing growth cone in N1E-115 cells. Video 9 is high-resolution time-lapse imaging of DLC1 and ARH GAP5 KD growth cones in N1E-115 cells. Table S1 lists a description of all siRNAs in the RNAi library. Online supplemental material is available at http ://www .jcb .org /cgi /content /full /jcb .201506018 /DC1.
Acknowledgments
We are grateful to Chris Bakal for constructive comments on the manuscript.
This work was supported by a Swiss National Science Foundation Sinergia grant to O. Pertz, P. Fua, and F. Fleuret and by Swiss Na-tional Science Foundation and International Foundation for Research in Paraplegia grants to O. Pertz.
The authors declare no competing financial interests.
Author contributions: O. Pertz and K. Smith initially conceived the study; L. Fusco performed all experiments; K. Smith, F. Benmansour, G. Gonzalez, and P. Fua led the image segmentation effort; R. Lefort and F. Fleuret led the statistical analysis effort; C. Barillari and B. Rinn designed the OpenBis-based image database; O. Pertz and L. Fusco designed and interpreted the FRET validation experiments. O. Pertz, K. Smith, L. Fusco, and R. Lefort wrote the paper.
Submitted: 3 June 2015Accepted: 8 December 2015
ReferencesAmano, M., M. Ito, K. Kimura, Y. Fukata, K. Chihara, T. Nakano, Y. Matsuura,
and K. Kaibuchi. 1996. Phosphorylation and activation of myosin by Rho-associated kinase (Rho-kinase). J. Biol. Chem. 271:20246–20249. http ://dx .doi .org /10 .1074 /jbc .271 .34 .20246
Arthur, W.T., and K. Burridge. 2001. RhoA inactivation by p190RhoGAP regulates cell spreading and migration by promoting membrane protrusion and polarity. Mol. Biol. Cell. 12:2711–2720. http ://dx .doi .org /10 .1091 /mbc .12 .9 .2711
Bakal, C., J. Aach, G. Church, and N. Perrimon. 2007. Quantitative morphological signatures define local signaling networks regulating cell morphology. Science. 316:1753–1756. http ://dx .doi .org /10 .1126 /science .1140324
Banzai, Y., H. Miki, H. Yamaguchi, and T. Takenawa. 2000. Essential role of neural Wiskott-Aldrich syndrome protein in neurite extension in PC12 cells and rat hippocampal primary culture cells. J. Biol. Chem. 275:11987–11992. http ://dx .doi .org /10 .1074 /jbc .275 .16 .11987
Bauch, A., I. Adamczyk, P. Buczek, F.J. Elmer, K. Enimanev, P. Glyzewski, M. Kohler, T. Pylak, A. Quandt, C. Ramakrishnan, et al. 2011. openBIS: a flexible framework for managing and analyzing complex data in biology research. BMC Bioinformatics. 12:468. http ://dx .doi .org /10 .1186 /1471 -2105 -12 -468
on January 6, 2016jcb.rupress.org
Dow
nloaded from
Published January 4, 2016

rho GTPase signaling complexity in neurite outgrowth • Fusco et al. 111
Bellanger, J.M., C. Astier, C. Sardet, Y. Ohta, T.P. Stossel, and A. Debant. 2000. The Rac1- and RhoG-specific GEF domain of Trio targets filamin to remodel cytoskeletal actin. Nat. Cell Biol. 2:888–892. http ://dx .doi .org /10 .1038 /35046533
Bement, W.M., and G. von Dassow. 2014. Single cell pattern formation and transient cytoskeletal arrays. Curr. Opin. Cell Biol. 26:51–59. http ://dx .doi .org /10 .1016 /j .ceb .2013 .09 .005
Benmansour, F., and L. Cohen. 2009. Fast object segmentation by growing minimal paths from a single point on 2D or 3D images. J. Math. Imaging Vis. 33:209–221. http ://dx .doi .org /10 .1007 /s10851 -008 -0131 -0
Borisoff, J.F., C.C. Chan, G.W. Hiebert, L. Oschipok, G.S. Robertson, R. Zamboni, J.D. Steeves, and W. Tetzlaff. 2003. Suppression of Rho-kinase activity promotes axonal growth on inhibitory CNS substrates. Mol. Cell. Neurosci. 22:405–416. http ://dx .doi .org /10 .1016 /S1044 -7431(02)00032 -5
Bradley, W.D., and A.J. Koleske. 2009. Regulation of cell migration and morphogenesis by Abl-family kinases: emerging mechanisms and physiological contexts. J. Cell Sci. 122:3441–3454. http ://dx .doi .org /10 .1242 /jcs .039859
Braun, A.C., and M.A. Olayioye. 2015. Rho regulation: DLC proteins in space and time. Cell. Signal. 27:1643–1651. http ://dx .doi .org /10 .1016 /j .cellsig .2015 .04 .003
Chen, J.Y., J.R. Lin, K.A. Cimprich, and T. Meyer. 2012. A two-dimensional ERK-AKT signaling code for an NGF-triggered cell-fate decision. Mol. Cell. 45:196–209. http ://dx .doi .org /10 .1016 /j .molcel .2011 .11 .023
Chen, X.Q., I. Tan, T. Leung, and L. Lim. 1999. The myotonic dystrophy kinase-related Cdc42-binding kinase is involved in the regulation of neurite outgrowth in PC12 cells. J. Biol. Chem. 274:19901–19905. http ://dx .doi .org /10 .1074 /jbc .274 .28 .19901
Chong, K.W., A.Y. Lee, E.S. Koay, S.J. Seet, and N.S. Cheung. 2006. pH dependent high transfection efficiency of mouse neuroblastomas using TransFectin. J. Neurosci. Methods. 158:56–63. http ://dx .doi .org /10 .1016 /j .jneumeth .2006 .05 .017
Cuntz, H., F. Forstner, A. Borst, and M. Häusser. 2010. One rule to grow them all: a general theory of neuronal branching and its practical application. PLOS Comput. Biol. 6:e1000877. http ://dx .doi .org /10 .1371 /journal .pcbi .1000877
da Silva, J.S., and C.G. Dotti. 2002. Breaking the neuronal sphere: regulation of the actin cytoskeleton in neuritogenesis. Nat. Rev. Neurosci. 3:694–704. http ://dx .doi .org /10 .1038 /nrn918
Echeverri, C.J., P.A. Beachy, B. Baum, M. Boutros, F. Buchholz, S.K. Chanda, J. Downward, J. Ellenberg, A.G. Fraser, N. Hacohen, et al. 2006. Minimizing the risk of reporting false positives in large-scale RNAi screens. Nat. Methods. 3:777–779. http ://dx .doi .org /10 .1038 /nmeth1006 -777
Feltrin, D., L. Fusco, H. Witte, F. Moretti, K. Martin, M. Letzelter, E. Fluri, P. Scheiffele, and O. Pertz. 2012. Growth cone MKK7 mRNA targeting regulates MAP1b-dependent microtubule bundling to control neurite elongation. PLoS Biol. 10:e1001439. http ://dx .doi .org /10 .1371 /journal .pbio .1001439
Fritz, R.D., M. Letzelter, A. Reimann, K. Martin, L. Fusco, L. Ritsma, B. Ponsioen, E. Fluri, S. Schulte-Merker, J. van Rheenen, and O. Pertz. 2013. A versatile toolkit to produce sensitive FRET biosensors to visualize signaling in time and space. Sci. Signal. 6:rs12. http ://dx .doi .org /10 .1126 /scisignal .2004135
Goh, W.I., K.B. Lim, T. Sudhaharan, K.P. Sem, W. Bu, A.M. Chou, and S. Ahmed. 2012. mDia1 and WAVE2 proteins interact directly with IRSp53 in filopodia and are involved in filopodium formation. J. Biol. Chem. 287:4702–4714. http ://dx .doi .org /10 .1074 /jbc .M111 .305102
Govek, E.E., S.E. Newey, and L. Van Aelst. 2005. The role of the Rho GTPases in neuronal development. Genes Dev. 19:1–49. http ://dx .doi .org /10 .1101 /gad .1256405
Hirose, M., T. Ishizaki, N. Watanabe, M. Uehata, O. Kranenburg, W.H. Moolenaar, F. Matsumura, M. Maekawa, H. Bito, and S. Narumiya. 1998. Molecular dissection of the Rho-associated protein kinase (p160ROCK)-regulated neurite remodeling in neuroblastoma N1E-115 cells. J. Cell Biol. 141:1625–1636. http ://dx .doi .org /10 .1083 /jcb .141 .7 .1625
Kim, T.Y., D. Vigil, C.J. Der, and R.L. Juliano. 2009. Role of DLC-1, a tumor suppressor protein with RhoGAP activity, in regulation of the cytoskeleton and cell motility. Cancer Metastasis Rev. 28:77–83. http ://dx .doi .org /10 .1007 /s10555 -008 -9167 -2
Lefort, R., L. Fusco, O. Pertz, and F. Fleuret. 2015. Machine learning-based tools to model and to remove the off-target effect. Pattern Anal. Appl. http ://dx .doi .org /10 .1007 /s10044 -015 -0469 -z
Leung, T., X.Q. Chen, I. Tan, E. Manser, and L. Lim. 1998. Myotonic dystrophy kinase-related Cdc42-binding kinase acts as a Cdc42 effector in promoting cytoskeletal reorganization. Mol. Cell. Biol. 18:130–140. http ://dx .doi .org /10 .1128 /MCB .18 .1 .130
Lin, Q., W. Yang, D. Baird, Q. Feng, and R.A. Cerione. 2006. Identification of a DOCK180-related guanine nucleotide exchange factor that is capable
of mediating a positive feedback activation of Cdc42. J. Biol. Chem. 281:35253–35262. http ://dx .doi .org /10 .1074 /jbc .M606248200
Machesky, L.M., R.D. Mullins, H.N. Higgs, D.A. Kaiser, L. Blanchoin, R.C. May, M.E. Hall, and T.D. Pollard. 1999. Scar, a WASp-related protein, activates nucleation of actin filaments by the Arp2/3 complex. Proc. Natl. Acad. Sci. USA. 96:3739–3744. http ://dx .doi .org /10 .1073 /pnas .96 .7 .3739
Matas, J., D.A. Kaiser, L. Blanchoin, R.C. May, M.E. Hall, and T.D. Pollard. 2004. Robust Wide baseline Stereo from Maximally Stable Extremal Regions. British Machine Vision Computing. 22:761–767. http ://dx .doi .org /10 .1016 /j .imavis .2004 .02 .006
Matsui, T., M. Amano, T. Yamamoto, K. Chihara, M. Nakafuku, M. Ito, T. Nakano, K. Okawa, A. Iwamatsu, and K. Kaibuchi. 1996. Rho-associated kinase, a novel serine/threonine kinase, as a putative target for small GTP binding protein Rho. EMBO J. 15:2208–2216.
Moon, S.Y., and Y. Zheng. 2003. Rho GTPase-activating proteins in cell regulation. Trends Cell Biol. 13:13–22. http ://dx .doi .org /10 .1016 /S0962 -8924(02)00004 -1
Nadarajah, B., and J.G. Parnavelas. 2002. Modes of neuronal migration in the developing cerebral cortex. Nat. Rev. Neurosci. 3:423–432. http ://dx .doi .org /10 .1038 /nrn845
Pertz, O. 2010. Spatio-temporal Rho GTPase signaling—Where are we now? J. Cell Sci. 123:1841–1850. http ://dx .doi .org /10 .1242 /jcs .064345
Pertz, O.C., Y. Wang, F. Yang, W. Wang, L.J. Gay, M.A. Gristenko, T.R. Clauss, D.J. Anderson, T. Liu, K.J. Auberry, et al. 2008. Spatial mapping of the neurite and soma proteomes reveals a functional Cdc42/Rac regulatory network. Proc. Natl. Acad. Sci. USA. 105:1931–1936. http ://dx .doi .org /10 .1073 /pnas .0706545105
Pinheiro, E.M., and F.B. Gertler. 2006. Nervous Rac: DOCK7 regulation of axon formation. Neuron. 51:674–676. http ://dx .doi .org /10 .1016 /j .neuron .2006 .08 .020
Ridley, A.J., A.J. Self, F. Kasmi, H.F. Paterson, A. Hall, C.J. Marshall, and C. Ellis. 1993. rho family GTPase activating proteins p190, bcr and rhoGAP show distinct specificities in vitro and in vivo. EMBO J. 12:5151–5160.
Riedl, J., A.H. Crevenna, K. Kessenbrock, J.H. Yu, D. Neukirchen, M. Bista, F. Bradke, D. Jenne, T.A. Holak, Z. Werb, et al. 2008. Lifeact: a versatile marker to visualize F-actin. Nat. Methods. 5:605–607. http ://dx .doi .org /10 .1038 /nmeth .1220
Rossman, K.L., C.J. Der, and J. Sondek. 2005. GEF means go: turning on RHO GTPases with guanine nucleotide-exchange factors. Nat. Rev. Mol. Cell Biol. 6:167–180. http ://dx .doi .org /10 .1038 /nrm1587
Schmidt, A., and A. Hall. 2002. Guanine nucleotide exchange factors for Rho GTPases: turning on the switch. Genes Dev. 16:1587–1609. http ://dx .doi .org /10 .1101 /gad .1003302
Schneider, C.A., W.S. Rasband, and K.W. Eliceiri. 2012. NIH Image to ImageJ: 25 years of image analysis. Nat. Methods. 9:671–675. http ://dx .doi .org /10 .1038 /nmeth .2089
Sethian, J., P.S. Linsley, L. Lum, Y. Ma, B. Mathey-Prevot, D.E. Root, and D.M. Sabatini. 1999. Level Set Methods and Fast Marching Methods Evolving Interfaces in Computational Geometry, Fluid Mechanics, Computer Vision, and Materials Science. Cambridge University Press, Cambridge, UK. 400 pp.
Smith, K., S. Ba, D. Gatica-Perez, and J.M. Odobez. 2008. Tracking the visual focus of attention for a varying number of wandering people. IEEE Trans. Pattern Anal. Mach. Intell. 30:1212–1229.
Tahirovic, S., F. Hellal, D. Neukirchen, R. Hindges, B.K. Garvalov, K.C. Flynn, T.E. Stradal, A. Chrostek-Grashoff, C. Brakebusch, and F. Bradke. 2010. Rac1 regulates neuronal polarization through the WAVE complex. J. Neurosci. 30:6930–6943. http ://dx .doi .org /10 .1523 /JNE UROSCI .5395 -09 .2010
ten Klooster, J.P., Z.M. Jaffer, J. Chernoff, and P.L. Hordijk. 2006. Targeting and activation of Rac1 are mediated by the exchange factor beta-Pix. J. Cell Biol. 172:759–769. http ://dx .doi .org /10 .1083 /jcb .200509096
Tsuji, T., C. Higashida, Y. Yoshida, M.S. Islam, M. Dohmoto, K. Koizumi, and H. Higashida. 2011. Ect2, an ortholog of Drosophila’s pebble, negatively regulates neurite outgrowth in neuroblastoma × glioma hybrid NG108-15 cells. Cell. Mol. Neurobiol. 31:663–668. http ://dx .doi .org /10 .1007 /s10571 -011 -9668 -3
Wilkinson, S., H.F. Paterson, and C.J. Marshall. 2005. Cdc42-MRCK and Rho-ROCK signalling cooperate in myosin phosphorylation and cell invasion. Nat. Cell Biol. 7:255–261. http ://dx .doi .org /10 .1038 /ncb1230
Yin, Z., A. Sadok, H. Sailem, A. McCarthy, X. Xia, F. Li, M.A. Garcia, L. Evans, A.R. Barr, N. Perrimon, et al. 2013. A screen for morphological complexity identifies regulators of switch-like transitions between discrete cell shapes. Nat. Cell Biol. 15:860–871. http ://dx .doi .org /10 .1038 /ncb2764
on January 6, 2016jcb.rupress.org
Dow
nloaded from
Published January 4, 2016

Table S1. All siRNAs in the RNAi library
Sample lot siRNA name Sense sequence Antisense sequence
154653A01 Arhgef1/MSS205912 GGAGAUUCUGCACCAUGUCAAUCAA UUGAUUGACAUGGUGCAGAAUCUCC
154653A03 Arhgef1/MSS205911 GCGAGUGACCAAAGACAAAGCUAUA UAUAGCUUUGUCUUUGGUCACUCGC
154653A05 Arhgef1/MSS205910 CCCUGUUCCUCGAUCGCUUGAUGAA UUCAUCAAGCGAUCGAGGAACAGGG
154653A07 Kalrn/MSS285208 CGGAACGCCGAGGUGUUCCUCAAAU AUUUGAGGAACACCUCGGCGUUCCG
154653A09 Kalrn/MSS285209 GAAACAGGAGAAUAUUACCUCUCAA UUGAGAGGUAAUAUUCUCCUGUUUC
154653A11 Kalrn/MSS285210 GAUGGCUUCUCAGGGCGCAACUGCA UGCAGUUGCGCCCUGAGAAGCCAUC
154653B01 Arhgef11/MSS277794 GGACCUGCUGGAGAGUGACAGUUCA UGAACUGUCACUCUCCAGCAGGUCC
154653B03 Arhgef11/MSS277793 CACAUCCAGCUUACUUGGUAGUAUU AAUACUACCAAGUAAGCUGGAUGUG
154653B05 Arhgef11/MSS210532 GCAAGGAGAGUCGAUUCCAGCUCUU AAGAGCUGGAAUCGACUCUCCUUGC
154653B07 Arhgef18/MSS272159 CACUAAAGAUCAUGCUGAAAGUAUA UAUACUUUCAGCAUGAUCUUUAGUG
154653B09 Arhgef18/MSS200224 GCAGAUUCUCAGAUCGGCCAUGAGU ACUCAUGGCCGAUCUGAGAAUCUGC
154653B11 Arhgef18/MSS200223 CCACUGUCCUGGAAUUAGAGCUGGU ACCAGCUCUAAUUCCAGGACAGUGG
154653C01 BC067047/MSS219653 GCCAUGAAGACUGUCUGCUCCAACA UGUUGGAGCAGACAGUCUUCAUGGC
154653C03 BC067047/MSS219654 CCAUGUCCCACUACGAGUUCCAUAA UUAUGGAACUCGUAGUGGGACAUGG
154653C05 BC067047/MSS282431 CCUUCUCCUUUAAGCAGCUGGAUGA UCAUCCAGCUGCUUAAAGGAGAAGG
154653C07 Rgnef/MSS201356 GGUAACCGACUUGGCAGUCUCUGAU AUCAGAGACUGCCAAGUCGGUUACC
154653C09 Rgnef/MSS201357 GAGAUGUACGAAAUCCACACCAAUU AAUUGGUGUGGAUUUCGUACAUCUC
154653C11 Rgnef/MSS201358 CCAACAGAACUGAAGAUAGACAUUU AAAUGUCUAUCUUCAGUUCUGUUGG
154653D01 Arhgef2/MSS205909 GGAUUCCAGCCAGAAGGAUCGGAAU AUUCCGAUCCUUCUGGCUGGAAUCC
154653D03 Arhgef2/MSS205908 ACCCGGAACUUUGUCAUCCAUCGUU AACGAUGGAUGACAAAGUUCCGGGU
154653D05 Arhgef2/MSS205907 CACUGCUUUGCAGUCUGUCUCCCUU AAGGGAGACAGACUGCAAAGCAGUG
154653D07 Arhgef3/MSS230875 GGCUCAACUGUAUCCGUCAGGCAAA UUUGCCUGACGGAUACAGUUGAGCC
154653D09 Arhgef3/MSS230874 CCAGCAGCACCUGGAAGAAGCUAUA UAUAGCUUCUUCCAGGUGCUGCUGG
154653D11 Arhgef3/MSS230873 GAGAAAUCCUGAGGCAUACACCAAA UUUGGUGUAUGCCUCAGGAUUUCUC
154653E01 Sos1/MSS209264 GAAAGGAAUAUAUUCAGCCUGUGCA UGCACAGGCUGAAUAUAUUCCUUUC
154653E03 Sos1/MSS209266 GAGUUCAUAAUGGAAGGAACUCUUA UAAGAGUUCCUUCCAUUAUGAACUC
154653E05 Sos1/MSS277177 CCUCCCACAGUUGAGUGGCACAUAA UUAUGUGCCACUCAACUGUGGGAGG
154653E07 Swap70/MSS277502 CAAUCAGGGCUACAUGCCAUAUUUA UAAAUAUGGCAUGUAGCCCUGAUUG
154653E09 Swap70/MSS277503 CAGAGGACAAGUAUCCACUAAUUAU AUAAUUAGUGGAUACUUGUCCUCUG
154653E11 Swap70/MSS277504 CAGAAGAGAUUGAAUACCUGCUUAA UUAAGCAGGUAUUCAAUCUCUUCUG
154653F01 Arhgef7/MSS285069 GAGUUCAGCAAACACUUCAUAUUUA UAAAUAUGAAGUGUUUGCUGAACUC
154653F03 Arhgef7/MSS225490 CCAACUGGUAGUACGAGCCAAGUUU AAACUUGGCUCGUACUACCAGUUGG
154653F05 Arhgef7/MSS225488 GAGGACCUAGGAGAGUUCAUGGAAA UUUCCAUGAACUCUCCUAGGUCCUC
154653F07 Def6/MSS215619 AGGAGCUGCUCAAGUCUAUCUGGUA UACCAGAUAGACUUGAGCAGCUCCU
154653F09 Def6/MSS280278 GCUUUCCGUCUAUGGUGCCUCUUCA UGAAGAGGCACCAUAGACGGAAAGC
154653F11 Def6/MSS215620 UGCAUCCGAUCGAGCCAGGAGAUAA UUAUCUCCUGGCUCGAUCGGAUGCA
154653G01 Trio/MSS278694 CAGCGUGCCCAAGCGAGCCAAUGAU AUCAUUGGCUCGCUUGGGCACGCUG
154653G03 Trio/MSS278695 CCUCAGGAGGCUCAUUUCCUAUUUA UAAAUAGGAAAUGAGCCUCCUGAGG
154653G05 Trio/MSS278696 GAGAAAGCUGUAGAAGUCAUGUGCA UGCACAUGACUUCUACAGCUUUCUC
154653G07 Tsc1/MSS227144 GGAGGAACACAAUGCAGCAAUGAAA UUUCAUUGCUGCAUUGUGUUCCUCC
154653G09 Tsc1/MSS227145 UGGAACUGGAGAUCCUAGACUUGUA UACAAGUCUAGGAUCUCCAGUUCCA

154653G11 Tsc1/MSS227146 GACACCAUGGUGACCCAACUGCAUA UAUGCAGUUGGGUCACCAUGGUGUC
154653H01 Dock10/MSS210019 CCAGGAAGAACUGAGGUCCCAUUAU AUAAUGGGACCUCAGUUCUUCCUGG
154653H03 Dock10/MSS210018 GCACAGGUCUCAGACUUUACCUAUA UAUAGGUAAAGUCUGAGACCUGUGC
154653H05 Dock10/MSS210017 CCAGAGGUGUCAGACUUCUUCAGCA UGCUGAAGAAGUCUGACACCUCUGG
154653H07 Vav2/MSS238640 GACAAAUGGGCGGAUCGGUUGGUUU AAACCAACCGAUCCGCCCAUUUGUC
154653H09 Vav2/MSS238641 CCUCAAAGUCUGCCAUGACAAAUUU AAAUUUGUCAUGGCAGACUUUGAGG
154653H11 Vav2/MSS238642 GGUACAACUUUGCUGCUCGAGACAU AUGUCUCGAGCAGCAAAGUUGUACC
154654A01 Dock4/MSS280225 CAGAUAGACAUUAUCAGCAACUUCU AGAAGUUGCUGAUAAUGUCUAUCUG
154654A03 Dock4/MSS280226 GAGCAAAGAAGGAGUGGCAACUUUA UAAAGUUGCCACUCCUUCUUUGCUC
154654A05 Dock4/MSS280227 UAUCACCGAGAUGACAUCAACUUUA UAAAGUUGAUGUCAUCUCGGUGAUA
154654A07 Dock7/MSS228219 CCACGGUACUCUGACCCUCAGAUAA UUAUCUGAGGGUCAGAGUACCGUGG
154654A09 Dock7/MSS289303 CCGUAGUCCGGUUUCUUCAUCUUCU AGAAGAUGAAGAAACCGGACUACGG
154654A11 Dock7/MSS289304 CGUCAAUUAUAAAUCGACUUCACAA UUGUGAAGUCGAUUUAUAAUUGACG
154654B01 Vav3/MSS226475 GGUGGGCUGGUUUCCAUCCACAUAU AUAUGUGGAUGGAAACCAGCCCACC
154654B03 Vav3/MSS226477 GGGAGCUCUCCCUAUUGAAAGGAGA UCUCCUUUCAAUAGGGAGAGCUCCC
154654B05 Vav3/MSS285951 GGAAAGAUUGCAGGCAGAAACUGAA UUCAGUUUCUGCCUGCAAUCUUUCC
154654B07 Centd2/MSS229844 GGCCUGUCAAGAGCCUCAAAGUCUA UAGACUUUGAGGCUCUUGACAGGCC
154654B09 Centd2/MSS229845 UCCACGAUCGCUACUUCAUUCUCAA UUGAGAAUGAAGUAGCGAUCGUGGA
154654B11 Centd2/MSS290899 AGGUGGAGACUGAACAGCAUGUUAA UUAACAUGCUGUUCAGUCUCCACCU
154654C01 Dock9/MSS200569 GCAUGCUCAAGAACCUGCUGAUAAA UUUAUCAGCAGGUUCUUGAGCAUGC
154654C03 Dock9/MSS272388 GAUCUCCAGCUUGACUACUCCUUAA UUAAGGAGUAGUCAAGCUGGAGAUC
154654C05 Dock9/MSS272389 UGGAUAUGAUCAAACUGCAGCUCAA UUGAGCUGCAGUUUGAUCAUAUCCA
154654C07 Ect2/MSS203768 CCUUCCAUUCGAACCUUCAAAGAAA UUUCUUUGAAGGUUCGAAUGGAAGG
154654C09 Ect2/MSS203769 GGGAUGAAAGGUGCACUCACCUUAU AUAAGGUGAGUGCACCUUUCAUCCC
154654C11 Ect2/MSS274062 CAGAUAUCUUUGAUGUGCAUAUGAA UUCAUAUGCACAUCAAAGAUAUCUG
154654D01 Arhgap1/MSS238961 GCUAAAGAUGCUGCCAUCACCCUCA UGAGGGUGAUGGCAGCAUCUUUAGC
154654D03 Arhgap1/MSS238962 CCAACACUAACUUGGCUGUAGUCUU AAGACUACAGCCAAGUUAGUGUUGG
154654D05 Arhgap1/MSS238963 UGACACAGCAGGUUCUCCAAACUCU AGAGUUUGGAGAACCUGCUGUGUCA
154654D07 Arhgap10/MSS234252 GCGAGGGCUGAUUCCACAGAAUUAU AUAAUUCUGUGGAAUCAGCCCUCGC
154654D09 Arhgap10/MSS234253 ACAUUCAGAAUACACGGAAUCGAUU AAUCGAUUCCGUGUAUUCUGAAUGU
154654D11 Arhgap10/MSS294204 CAAGUCACUCGAAGCAGAAUCUAAU AUUAGAUUCUGCUUCGAGUGACUUG
154654E01 Fgd2/MSS218495 CCUGCUACACAUUUCUCACUGGAAA UUUCCAGUGAGAAAUGUGUAGCAGG
154654E03 Fgd2/MSS218496 GACCCAAUGGAACGCUACCUGGUUU AAACCAGGUAGCGUUCCAUUGGGUC
154654E05 Fgd2/MSS218497 CCCUACUGGGCUAUCAGGUGAUUUC GAAAUCACCUGAUAGCCCAGUAGGG
154654E07 Itsn1/MSS275155 CAGCUGGCUUCAAUAUGGAAUCUUU AAAGAUUCCAUAUUGAAGCCAGCUG
154654E09 Itsn1/MSS275156 CAGAAGAAUUUAUCCUAGCUAUGCA UGCAUAGCUAGGAUAAAUUCUUCUG
154654E11 Itsn1/MSS275157 CAGGCAAGAACUAUUCUCAUGCAAU AUUGCAUGAGAAUAGUUCUUGCCUG
154654F01 Arhgap17/MSS230246 CCUGGAGAGGUAGAAUUCAAUGUAU AUACAUUGAAUUCUACCUCUCCAGG
154654F03 Arhgap17/MSS230247 ACUGUGCGUUCAAUGUGCCACCAUU AAUGGUGGCACAUUGAACGCACAGU
154654F05 Arhgap17/MSS230248 CAACUUGCAGCAGACAUGUACAACU AGUUGUACAUGUCUGCUGCAAGUUG
154654F07 Arhgap21/MSS230777 CCAUCCCAAGGAAUGGAGAUAUAAA UUUAUAUCUCCAUUCCUUGGGAUGG
154654F09 Arhgap21/MSS230778 CCACCACAGUCACCUGACCAAAUAA UUAUUUGGUCAGGUGACUGUGGUGG

154654F11 Arhgap21/MSS230779 ACGAUGCACGCAGAGAGGUCCAUAU AUAUGGACCUCUCUGCGUGCAUCGU
154654G01 Arhgap26/MSS230710 ACAAAUUCAUCAAGGAGCUCAUCAA UUGAUGAGCUCCUUGAUGAAUUUGU
154654G03 Arhgap26/MSS291522 CAGGAGCAGAGGAACAGCAUCAUCA UGAUGAUGCUGUUCCUCUGCUCCUG
154654G05 Arhgap26/MSS291523 CGGGCACCGUCUUCGAUAAUGUUCA UGAACAUUAUCGAAGACGGUGCCCG
154654G07 Rhog/MSS225960 CCUCCUAUGAGAACGUGAGGCACAA UUGUGCCUCACGUUCUCAUAGGAGG
154654G09 Rhog/MSS225961 ACCCUCAGACCAACGUCUUCGUCAU AUGACGAAGACGUUGGUCUGAGGGU
154654G11 Rhog/MSS285643 CCUGAGAGCCCAGCCUGAUACCCUA UAGGGUAUCAGGCUGGGCUCUCAGG
154654H01 Arhgap30/MSS213146 CCACAGAUCCGACCCUACCAUACUA UAGUAUGGUAGGGUCGGAUCUGUGG
154654H03 Arhgap30/MSS213147 GGAGGUUCGAGUGCAGUCCAUUGUU AACAAUGGACUGCACUCGAACCUCC
154654H05 Arhgap30/MSS213148 CCUGUCUCUGGAUGAUACUCAGUAU AUACUGAGUAUCAUCCAGAGACAGG
154654H07 Arhgap5/MSS202178 UCGAGAGUUUCUGUCUACCACUAAA UUUAGUGGUAGACAGAAACUCUCGA
154654H09 Arhgap5/MSS273270 GCGAUCCAUUUAGUGUGGAUCUCAU AUGAGAUCCACACUAAAUGGAUCGC
154654H11 Arhgap5/MSS273271 GCCGGAUCCUUUGAUUCCAUAUUCA UGAAUAUGGAAUCAAAGGAUCCGGC
154656A01 Arhgdia/MSS208259 GAAGGAAGGUGUGGAGUACCGGAUA UAUCCGGUACUCCACACCUUCCUUC
154656A03 Arhgdia/MSS208260 GGAGAGCUUCAAGAAACAGUCGUUU AAACGACUGUUUCUUGAAGCUCUCC
154656A05 Arhgdia/MSS208261 GACUGACUACAUGGUCGGGAGCUAU AUAGCUCCCGACCAUGUAGUCAGUC
154656A07 Crmp1/MSS203237 CCCGGUGGCAUUGAUGUCAACACUU AAGUGUUGACAUCAAUGCCACCGGG
154656A09 Crmp1/MSS203238 CCAGGAAGAAAGGCCCUCUUGUCUU AAGACAAGAGGGCCUUUCUUCCUGG
154656A11 Crmp1/MSS203239 ACUGUCCCUACAGUACUGCUCAGAA UUCUGAGCAGUACUGUAGGGACAGU
154656B01 Bcr/MSS201314 GGACUGUCAUCGACAUGAAUGGAAU AUUCCAUUCAUGUCGAUGACAGUCC
154656B03 Bcr/MSS201315 CCCAGACCCUGCGGAUACUAUGUUA UAACAUAGUAUCCGCAGGGUCUGGG
154656B05 Bcr/MSS272842 CCAGGCACUGAAGGCAGCCUUUGAU AUCAAAGGCUGCCUUCAGUGCCUGG
154656B07 Chn2/MSS245507 CCCUGAAACUGUACUUCCGAGACUU AAGUCUCGGAAGUACAGUUUCAGGG
154656B09 Chn2/MSS245508 CCAAUGACUGCCAGCCAGAUCUCAA UUGAGAUCUGGCUGGCAGUCAUUGG
154656B11 Chn2/MSS245509 GCGCUACCUGAUGAUCCACCUGAAA UUUCAGGUGGAUCAUCAGGUAGCGC
154656C01 Diap1/MSS203555 UGCCACUGACGAGAAGGACAAGUUU AAACUUGUCCUUCUCGUCAGUGGCA
154656C03 Diap1/MSS203556 GCCAUCCUCUUCAAGCUACAGUUCA UGAACUGUAGCUUGAAGAGGAUGGC
154656C05 Diap1/MSS203557 ACCUGCAGAAGAGCUUAGAUCAGAU AUCUGAUCUAAGCUCUUCUGCAGGU
154656C07 Dpysl2/MSS203240 CCAACCACUCCAGACUUUCUCAACU AGUUGAGAAAGUCUGGAGUGGUUGG
154656C09 Dpysl2/MSS203241 CCAGCUGACGGAUUCCCAGAUCUAU AUAGAUCUGGGAAUCCGUCAGCUGG
154656C11 Dpysl2/MSS203242 GACUCCAGCCUCAUCAGCUAAGACA UGUCUUAGCUGAUGAGGCUGGAGUC
154656D01 Dlc1/MSS224945 GCUUAUGAUGUGGCAGACAUGUUAA UUAACAUGUCUGCCACAUCAUAAGC
154656D03 Dlc1/MSS224946 GCAGCCGCCUGAGCAUCUAUGAUAA UUAUCAUAGAUGCUCAGGCGGCUGC
154656D05 Dlc1/MSS224947 GGUUGAUCAUCAGUGCUCCCAUUCU AGAAUGGGAGCACUGAUGAUCAACC
154656D07 Ralbp1/MSS208646 UGCAGAUCAGCAAUCGGGUCCUGUA UACAGGACCCGAUUGCUGAUCUGCA
154656D09 Ralbp1/MSS208647 GGGCGGGAUAAAGGACUUAUCUAAA UUUAGAUAAGUCCUUUAUCCCGCCC
154656D11 Ralbp1/MSS208648 GAGAUCAGGAGACAGGAGUUCCUUU AAAGGAACUCCUGUCUCCUGAUCUC
155026A03 Pkn1/MSS241556 CCUAUCUGCUCAUCCACCAACCUGA UCAGGUUGGUGGAUGAGCAGAUAGG
155026A04 Pkn1/MSS282993 CAGUCCCAAUGCAUCUCCAGGUGCU AGCACCUGGAGAUGCAUUGGGACUG
154656E05 Pkn1/MSS282994 GAGCUGCCUUCAGAGACCCAGGAGA UCUCCUGGGUCUCUGAAGGCAGCUC
154656E07 Pkn2/MSS201191 GGAUAACUUGUUGCUAGAUACAGAA UUCUGUAUCUAGCAACAAGUUAUCC
154656E09 Pkn2/MSS201193 CACUAGAGCAAAGGUUAAAUGAGCU AGCUCAUUUAACCUUUGCUCUAGUG
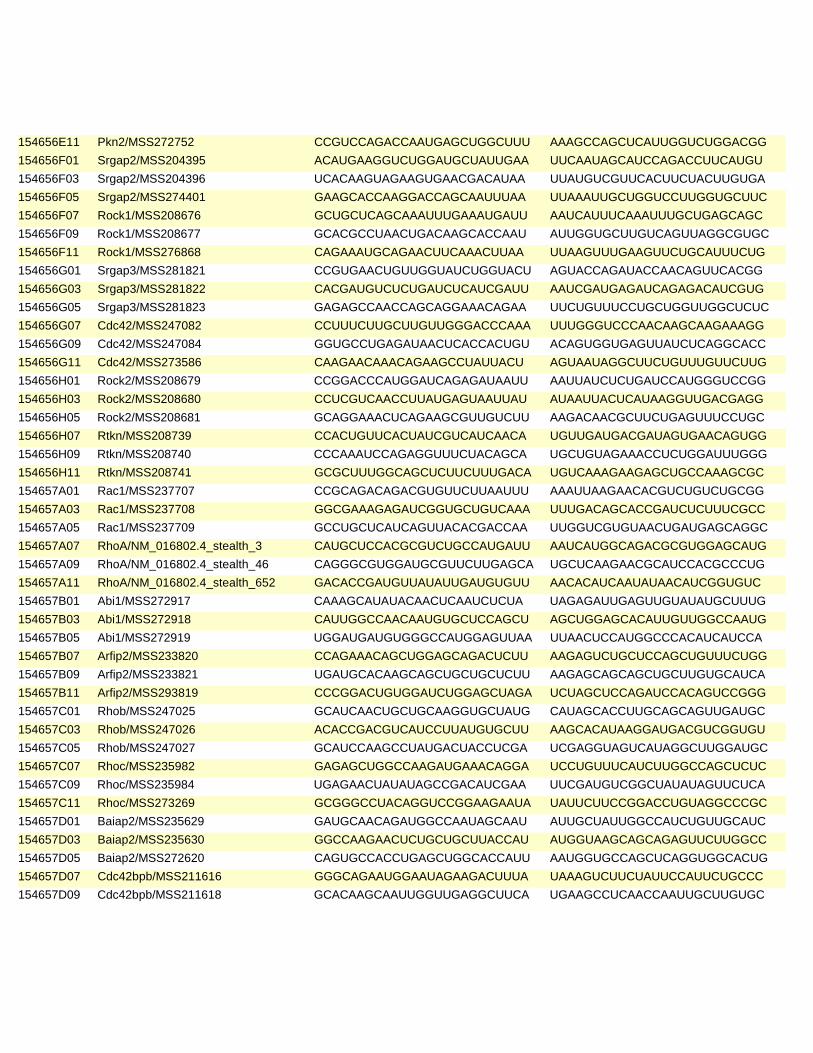
154656E11 Pkn2/MSS272752 CCGUCCAGACCAAUGAGCUGGCUUU AAAGCCAGCUCAUUGGUCUGGACGG
154656F01 Srgap2/MSS204395 ACAUGAAGGUCUGGAUGCUAUUGAA UUCAAUAGCAUCCAGACCUUCAUGU
154656F03 Srgap2/MSS204396 UCACAAGUAGAAGUGAACGACAUAA UUAUGUCGUUCACUUCUACUUGUGA
154656F05 Srgap2/MSS274401 GAAGCACCAAGGACCAGCAAUUUAA UUAAAUUGCUGGUCCUUGGUGCUUC
154656F07 Rock1/MSS208676 GCUGCUCAGCAAAUUUGAAAUGAUU AAUCAUUUCAAAUUUGCUGAGCAGC
154656F09 Rock1/MSS208677 GCACGCCUAACUGACAAGCACCAAU AUUGGUGCUUGUCAGUUAGGCGUGC
154656F11 Rock1/MSS276868 CAGAAAUGCAGAACUUCAAACUUAA UUAAGUUUGAAGUUCUGCAUUUCUG
154656G01 Srgap3/MSS281821 CCGUGAACUGUUGGUAUCUGGUACU AGUACCAGAUACCAACAGUUCACGG
154656G03 Srgap3/MSS281822 CACGAUGUCUCUGAUCUCAUCGAUU AAUCGAUGAGAUCAGAGACAUCGUG
154656G05 Srgap3/MSS281823 GAGAGCCAACCAGCAGGAAACAGAA UUCUGUUUCCUGCUGGUUGGCUCUC
154656G07 Cdc42/MSS247082 CCUUUCUUGCUUGUUGGGACCCAAA UUUGGGUCCCAACAAGCAAGAAAGG
154656G09 Cdc42/MSS247084 GGUGCCUGAGAUAACUCACCACUGU ACAGUGGUGAGUUAUCUCAGGCACC
154656G11 Cdc42/MSS273586 CAAGAACAAACAGAAGCCUAUUACU AGUAAUAGGCUUCUGUUUGUUCUUG
154656H01 Rock2/MSS208679 CCGGACCCAUGGAUCAGAGAUAAUU AAUUAUCUCUGAUCCAUGGGUCCGG
154656H03 Rock2/MSS208680 CCUCGUCAACCUUAUGAGUAAUUAU AUAAUUACUCAUAAGGUUGACGAGG
154656H05 Rock2/MSS208681 GCAGGAAACUCAGAAGCGUUGUCUU AAGACAACGCUUCUGAGUUUCCUGC
154656H07 Rtkn/MSS208739 CCACUGUUCACUAUCGUCAUCAACA UGUUGAUGACGAUAGUGAACAGUGG
154656H09 Rtkn/MSS208740 CCCAAAUCCAGAGGUUUCUACAGCA UGCUGUAGAAACCUCUGGAUUUGGG
154656H11 Rtkn/MSS208741 GCGCUUUGGCAGCUCUUCUUUGACA UGUCAAAGAAGAGCUGCCAAAGCGC
154657A01 Rac1/MSS237707 CCGCAGACAGACGUGUUCUUAAUUU AAAUUAAGAACACGUCUGUCUGCGG
154657A03 Rac1/MSS237708 GGCGAAAGAGAUCGGUGCUGUCAAA UUUGACAGCACCGAUCUCUUUCGCC
154657A05 Rac1/MSS237709 GCCUGCUCAUCAGUUACACGACCAA UUGGUCGUGUAACUGAUGAGCAGGC
154657A07 RhoA/NM_016802.4_stealth_3 CAUGCUCCACGCGUCUGCCAUGAUU AAUCAUGGCAGACGCGUGGAGCAUG
154657A09 RhoA/NM_016802.4_stealth_46 CAGGGCGUGGAUGCGUUCUUGAGCA UGCUCAAGAACGCAUCCACGCCCUG
154657A11 RhoA/NM_016802.4_stealth_652 GACACCGAUGUUAUAUUGAUGUGUU AACACAUCAAUAUAACAUCGGUGUC
154657B01 Abi1/MSS272917 CAAAGCAUAUACAACUCAAUCUCUA UAGAGAUUGAGUUGUAUAUGCUUUG
154657B03 Abi1/MSS272918 CAUUGGCCAACAAUGUGCUCCAGCU AGCUGGAGCACAUUGUUGGCCAAUG
154657B05 Abi1/MSS272919 UGGAUGAUGUGGGCCAUGGAGUUAA UUAACUCCAUGGCCCACAUCAUCCA
154657B07 Arfip2/MSS233820 CCAGAAACAGCUGGAGCAGACUCUU AAGAGUCUGCUCCAGCUGUUUCUGG
154657B09 Arfip2/MSS233821 UGAUGCACAAGCAGCUGCUGCUCUU AAGAGCAGCAGCUGCUUGUGCAUCA
154657B11 Arfip2/MSS293819 CCCGGACUGUGGAUCUGGAGCUAGA UCUAGCUCCAGAUCCACAGUCCGGG
154657C01 Rhob/MSS247025 GCAUCAACUGCUGCAAGGUGCUAUG CAUAGCACCUUGCAGCAGUUGAUGC
154657C03 Rhob/MSS247026 ACACCGACGUCAUCCUUAUGUGCUU AAGCACAUAAGGAUGACGUCGGUGU
154657C05 Rhob/MSS247027 GCAUCCAAGCCUAUGACUACCUCGA UCGAGGUAGUCAUAGGCUUGGAUGC
154657C07 Rhoc/MSS235982 GAGAGCUGGCCAAGAUGAAACAGGA UCCUGUUUCAUCUUGGCCAGCUCUC
154657C09 Rhoc/MSS235984 UGAGAACUAUAUAGCCGACAUCGAA UUCGAUGUCGGCUAUAUAGUUCUCA
154657C11 Rhoc/MSS273269 GCGGGCCUACAGGUCCGGAAGAAUA UAUUCUUCCGGACCUGUAGGCCCGC
154657D01 Baiap2/MSS235629 GAUGCAACAGAUGGCCAAUAGCAAU AUUGCUAUUGGCCAUCUGUUGCAUC
154657D03 Baiap2/MSS235630 GGCCAAGAACUCUGCUGCUUACCAU AUGGUAAGCAGCAGAGUUCUUGGCC
154657D05 Baiap2/MSS272620 CAGUGCCACCUGAGCUGGCACCAUU AAUGGUGCCAGCUCAGGUGGCACUG
154657D07 Cdc42bpb/MSS211616 GGGCAGAAUGGAAUAGAAGACUUUA UAAAGUCUUCUAUUCCAUUCUGCCC
154657D09 Cdc42bpb/MSS211618 GCACAAGCAAUUGGUUGAGGCUUCA UGAAGCCUCAACCAAUUGCUUGUGC

154657D11 Cdc42bpb/MSS278290 CAAACUGAAGGAAUCGGAAGCGAAA UUUCGCUUCCGAUUCCUUCAGUUUG
154657E01 Cdc42SE2/NM_178626.3_stealth_559 UGAGUGAAUUCUGGUUGUGUUUCAA UUGAAACACAACCAGAAUUCACUCA
154657E03 Cdc42SE2/NM_178626.3_stealth_564 GAAUUCUGGUUGUGUUUCAACUGCU AGCAGUUGAAACACAACCAGAAUUC
154657E05 Cdc42SE2/NM_178626.3_stealth_570 UGGUUGUGUUUCAACUGCUGUAUUG CAAUACAGCAGUUGAAACACAACCA
154657E07 Pak4/MSS245585 GCAAAGACGUGAACUGCUCUUCAAU AUUGAAGAGCAGUUCACGUCUUUGC
154657E09 Pak4/MSS245586 ACCGUGACAUCAAGAGUGACUCUAU AUAGAGUCACUCUUGAUGUCACGGU
154657E11 Pak4/MSS291252 AACUAGCAGCUGGCAGGCCCUUUAA UUAAAGGGCCUGCCAGCUGCUAGUU
154657F01 Clip1/MSS226157 CCGAAGAAGGCUAGAGUCCAGUAAA UUUACUGGACUCUAGCCUUCUUCGG
154657F03 Clip1/MSS226158 GGAGCUGAAGGUGUCCUUUAGCAAA UUUGCUAAAGGACACCUUCAGCUCC
154657F05 Clip1/MSS226159 GGCCAAGCUGAUGAAGAUCAUUAAA UUUAAUGAUCUUCAUCAGCUUGGCC
154657F07 Copg/MSS249938 GGGUCUUUAACGAAACUCCCAUCAA UUGAUGGGAGUUUCGUUAAAGACCC
154657F09 Copg/MSS249939 ACCACGGAAGCAACUGAGGCUUUCU AGAAAGCCUCAGUUGCUUCCGUGGU
154657F11 Copg/MSS249940 UCCUGCAUCGCUGAGGAUGUCAUCA UGAUGACAUCCUCAGCGAUGCAGGA
154657G01 Pard3/MSS234950 CGACAGCUGGCUUUCUCAAGCAGAA UUCUGCUUGAGAAAGCCAGCUGUCG
154657G03 Pard3/MSS294614 GACCCAGCUUUAACUGGCCUUUCCA UGGAAAGGCCAGUUAAAGCUGGGUC
154657G05 Pard3/MSS294615 CGCAGGAUCUCACACUCCCUCUACA UGUAGAGGGAGUGUGAGAUCCUGCG
154657G07 Pip5k1a/MSS237569 GGGCUUCUCAGAAAGAACGAGAGAA UUCUCUCGUUCUUUCUGAGAAGCCC
154657G09 Pip5k1a/MSS237570 GGCGCUCUAUUCCACAGCUAUGGAA UUCCAUAGCUGUGGAAUAGAGCGCC
154657G11 Pip5k1a/MSS237571 CCUCAGACUCCACCUUUGGAGGAAA UUUCCUCCAAAGGUGGAGUCUGAGG
154657H01 Cyfip1/MSS208988 CCAACCGGUUUGUUCGGACAGUAUU AAUACUGUCCGAACAAACCGGUUGG
154657H03 Cyfip1/MSS208989 GGCAAUUGGACGGUUUGAAAGUGAA UUCACUUUCAAACCGUCCAAUUGCC
154657H05 Cyfip1/MSS277058 CAGGAUGUACUUGACACCCAGCGAA UUCGCUGGGUGUCAAGUACAUCCUG
154657H07 Cyfip2/MSS233795 CCAUCCUGUUCUGCCUCCUCAUAGA UCUAUGAGGAGGCAGAACAGGAUGG
154657H09 Cyfip2/MSS233796 GCCAUGUUCCGAGAAGCCAAUCAUA UAUGAUUGGCUUCUCGGAACAUGGC
154657H11 Cyfip2/MSS233797 ACAACAUCUGUGAGCAGAUGGUUCA UGAACCAUCUGCUCACAGAUGUUGU
154658A01 Pip5k3/MSS207627 GCCUUCAUCAAAGAGUCCUUAUUUA UAAAUAAGGACUCUUUGAUGAAGGC
154658A03 Pip5k3/MSS207628 UGGCAGUGUUCAGGCCAAGUCUAUU AAUAGACUUGGCCUGAACACUGCCA
154658A05 Pip5k3/MSS276330 CCGAAGAUGAUAGAUUCAUUCUGAA UUCAGAAUGAAUCUAUCAUCUUCGG
154658A07 Prkci/MSS207677 GGACAAUGUACUGCUAGACUCUGAA UUCAGAGUCUAGCAGUACAUUGUCC
154658A09 Prkci/MSS207678 GCAUCCCGCGUUCUCUGUCUGUAAA UUUACAGACAGAGAACGCGGGAUGC
154658A11 Prkci/MSS207679 CCAAAGUACUGUUGGUUCGGUUAAA UUUAACCGAACCAACAGUACUUUGG
154658B01 Fmnl1/MSS226608 UCCGACUUCAGAGUCUGGAUGCGUU AACGCAUCCAGACUCUGAAGUCGGA
154658B03 Fmnl1/MSS226609 GGAAACAGACGUUGUUGCACUACUU AAGUAGUGCAACAACGUCUGUUUCC
154658B05 Fmnl1/MSS286071 CAGAGACUUCCGGAGCGCAUGAACA UGUUCAUGCGCUCCGGAAGUCUCUG
154658B07 Fnbp1l/MSS210755 GGUAAUUCCUCAGAUUUACAAGCAA UUGCUUGUAAAUCUGAGGAAUUACC
154658B09 Fnbp1l/MSS210756 UGAGGCAUGGCUCUCUGAAGUUGAA UUCAACUUCAGAGAGCCAUGCCUCA
154658B11 Fnbp1l/MSS210757 GCAGUAAAGGUGCAGUAACUUAUAU AUAUAAGUUACUGCACCUUUACUGC
154658C01 Trip10/MSS246881 GCUGAGCGCCUAGAUCAGGACAUUA UAAUGUCCUGAUCUAGGCGCUCAGC
154658C03 Trip10/MSS246882 ACGACUCACAGGUCCUCAUCGAAUU AAUUCGAUGAGGACCUGUGAGUCGU
154658C05 Trip10/MSS246883 UGGAGCAGGCUUAUGCUAAGCAACU AGUUGCUUAGCAUAAGCCUGCUCCA
154658C07 Wasf1/MSS234749 CCCUUACAGGGAUGAUGGUAAGGAA UUCCUUACCAUCAUCCCUGUAAGGG
154658C09 Wasf1/MSS234750 ACCCUGCCUGUAAUCAGUGACGCAA UUGCGUCACUGAUUACAGGCAGGGU

154658C11 Wasf1/MSS234751 CCCUGGCAAAUAUAAUUAGACAACU AGUUGUCUAAUUAUAUUUGCCAGGG
154658D01 Inpp5a/MSS238163 UCGACUACUUCAACCAGGAUGUCUU AAGACAUCCUGGUUGAAGUAGUCGA
154658D03 Inpp5a/MSS238164 CCUCCAUGUCCCAUGUGGACAAAUU AAUUUGUCCACAUGGGACAUGGAGG
154658D05 Inpp5a/MSS238165 UCCAACUUAGUGGCCUGGGAGACAA UUGUCUCCCAGGCCACUAAGUUGGA
154658D07 Wasf2/MSS216650 CCUAGCGAUACAAGCGAGCUGGAAU AUUCCAGCUCGCUUGUAUCGCUAGG
154658D09 Wasf2/MSS216651 CCUCUUAACAAUCUCAGUCCUUACA UGUAAGGACUGAGAUUGUUAAGAGG
154658D11 Wasf2/MSS216652 GCAGGACACCAAGGAUAUCAUGAAA UUUCAUGAUAUCCUUGGUGUCCUGC
154658E01 Iqgap1/MSS219911 GACCCUGUGGAUAUUUACAAGUCUU AAGACUUGUAAAUAUCCACAGGGUC
154658E03 Iqgap1/MSS219912 CCAACAAGAUGUUUCUGGGCGAUAA UUAUCGCCCAGAAACAUCUUGUUGG
154658E05 Iqgap1/MSS219913 UGAACAAGCCUUGUCUCAUGAAGAA UUCUUCAUGAGACAAGGCUUGUUCA
154658E07 Iqgap2/MSS285190 CAGCAAACCCUGAACGCACUUAAUA UAUUAAGUGCGUUCAGGGUUUGCUG
155026B07 Iqgap2/MSS285191 GAUGACCUUCAAACCAACCAGUUUA UAAACUGGUUGGUUUGAAGGUCAUC
154658E11 Iqgap2/MSS285192 CAUAGCUAUUAAUGAGGCUAUUGAA UUCAAUAGCCUCAUUAAUAGCUAUG
154658F01 Wasl/MSS292313 GCAGUGGUGUCGCUUGUCUGGUUAA UUAACCAGACAAGCGACACCACUGC
154658F03 Wasl/MSS292314 GAACAAGAGCUAUACAAUAACUUUG CAAAGUUAUUGUAUAGCUCUUGUUC
154658F05 Wasl/MSS292315 GAGAUACUUGUCAAGUAGCUCUUAA UUAAGAGCUACUUGACAAGUAUCUC
154658F07 Abl2/MSS201506 CCACUGAGAGUGACCCUAAUCUCUU AAGAGAUUAGGGUCACUCUCAGUGG
154658F09 Abl2/MSS201507 CCGACUUUGGUUUAAGUAGACUGAU AUCAGUCUACUUAAACCAAAGUCGG
154658F11 Abl2/MSS272920 UACGUGACAGCUGAGAGCCGCUUUA UAAAGCGGCUCUCAGCUGUCACGUA
154658G01 Map3k4/MSS218531 CCUCCUUCCUCAGAGCAGAAGUGUA UACACUUCUGCUCUGAGGAAGGAGG
154658G03 Map3k4/MSS218532 GCUCGAGUCAGAGGAAGAUUCCAUA UAUGGAAUCUUCCUCUGACUCGAGC
154658G05 Map3k4/MSS218533 GCCAGCAGGCAUUGUUUGACUUCUA UAGAAGUCAAACAAUGCCUGCUGGC
154658G07 Mapk8/MSS218561 GCGCCUACCGAGAACUAGUUCUUAU AUAAGAACUAGUUCUCGGUAGGCGC
154658G09 Mapk8/MSS218563 CCUCUUUCCAGGAAGGGACUAUAUU AAUAUAGUCCCUUCCUGGAAAGAGG
154658G11 Mapk8/MSS281895 CAAGCACCUUCACUCUGCUGGAAUU AAUUCCAGCAGAGUGAAGGUGCUUG
154658H01 Ap2m1/MSS202076 GACGGAGAGUUUGAACUCAUGAGAU AUCUCAUGAGUUCAAACUCUCCGUC
154658H03 Ap2m1/MSS273197 CAAGCAAGAGUGGUAAGCAGUCGAU AUCGACUGCUUACCACUCUUGCUUG
154658H05 Ap2m1/MSS273198 GCGACUCAGCAAGUUUGACUCUGAG CUCAGAGUCAAACUUGCUGAGUCGC
154658H07 Ddef1/MSS273948 GACUACAACUCGCCCACCACGUCCA UGGACGUGGUGGGCGAGUUGUAGUC
154658H09 Ddef1/MSS273949 ACGCGGCUGCACAACUGCAGGAACA UGUUCCUGCAGUUGUGCAGCCGCGU
154658H11 Ddef1/MSS273950 UCACGCUGCUGGAGGAGGCUCUAGA UCUAGAGCCUCCUCCAGCAGCGUGA
154659A01 Nckap1/MSS284790 CAGUGUACUCUUAGUGACCAGUUAU AUAACUGGUCACUAAGAGUACACUG
154659A03 Nckap1/MSS284791 GGCGUUGUAUUACUUUACAUUUGUA UACAAAUGUAAAGUAAUACAACGCC
154659A05 Nckap1/MSS284792 GCAAUAGAAGGACACUGCAACAAUA UAUUGUUGCAGUGUCCUUCUAUUGC
154659A07 Pak1/MSS237494 GGAAUGGAUGGCUCUGUCAAGUUAA UUAACUUGACAGAGCCAUCCAUUCC
154659A09 Pak1/MSS237495 UGUGCCGAGAGUGUCUACAAGCUUU AAAGCUUGUAGACACUCUCGGCACA
154659A11 Pak1/MSS237496 GGGCAUUAUGGCAAUUGAAAUGAUU AAUCAUUUCAAUUGCCAUAAUGCCC
154659B01 Rala/MSS225866 GGUAACAAGUCAGAUCUAGAAGAUA UAUCUUCUAGAUCUGACUUGUUACC
154659B03 Rala/MSS225868 ACAGAGCUGACCAGUGGAACGUUAA UUAACGUUCCACUGGUCAGCUCUGU
154659B05 Rala/MSS285599 GCAGGAGGACUAUGCUGCAAUUAGA UCUAAUUGCAGCAUAGUCCUCCUGC
154659B07 Ralb/MSS287585 CCCACCAAAGCUGACAGUUACAGAA UUCUGUAACUGUCAGCUUUGGUGGG
154659B09 Ralb/MSS287586 CAUCACAGAGCACGAGUCUUUCACA UGUGAAAGACUCGUGCUCUGUGAUG

154659B11 Ralb/MSS287587 CAGCCGAGUUCAGGGAACAGAUUCU AGAAUCUGUUCCCUGAACUCGGCUG
154659C01 Reps1/MSS208601 GGAAAUACCGUAGAUGGGUACAGUA UACUGUACCCAUCUACGGUAUUUCC
154659C03 Reps1/MSS208602 CCAGUGGAUGCAGAUGGUCUAAUAA UUAUUAGACCAUCUGCAUCCACUGG
154659C05 Reps1/MSS208603 CCAUUCAGCCUGACCUAAACGGAUU AAUCCGUUUAGGUCAGGCUGAAUGG
154659C07 Gna13/MSS204752 CCAGCUGGGUGAGUCUGUAAAGUAU AUACUUUACAGACUCACCCAGCUGG
154659C09 Gna13/MSS204753 GGCAUCCAUGAGUACGACUUUGAAA UUUCAAAGUCGUACUCAUGGAUGCC
154659C11 Gna13/MSS274579 UGGAGACAAGUUGAUGGCAUUUGAU AUCAAAUGCCAUCAACUUGUCUCCA
154659D01 Rras/MSS276892 CCUCCGGUCUGAAGCCUCCUCUUUC GAAAGAGGAGGCUUCAGACCGGAGG
154659D03 Rras/MSS276893 GACUUACUUUGAGGCCUCAGCCAAA UUUGGCUGAGGCCUCAAAGUAAGUC
154659D05 Rras/MSS276894 GCGCUGUCCGGAAAUACCAGGAACA UGUUCCUGGUAUUUCCGGACAGCGC
154659D07 Sh3glb1/MSS225755 GCUAAUGGGAGAGAGAGGAAAUCAA UUGAUUUCCUCUCUCUCCCAUUAGC
154659D09 Sh3glb1/MSS225757 ACCAGUGCCAUAUGCUUUGUCAAAU AUUUGACAAAGCAUAUGGCACUGGU
155026B10 Sh3glb1/MSS285450 CAAUUACCUACUUAGAACUUCUCAA UUGAGAAGUUCUAAGUAGGUAAUUG
154659E01 Gnaq/MSS204770 CCCUUCCUAUCUGCCUACACAACAA UUGUUGUGUAGGCAGAUAGGAAGGG
154659E03 Gnaq/MSS204772 CCCUUUGACUUACAAAGUGUCAUUU AAAUGACACUUUGUAAGUCAAAGGG
154659E05 Gnaq/MSS274590 CGCUUAGCGAAUAUGAUCAAGUUCU AGAACUUGAUCAUAUUCGCUAAGCG
154659E07 Hip1/MSS238296 ACUACACUGUCAAGCUGCUCUUCAA UUGAAGAGCAGCUUGACAGUGUAGU
154659E09 Hip1/MSS238297 UGGCUGCAUCCAAGGUGAAAGCGAA UUCGCUUUCACCUUGGAUGCAGCCA
154659E11 Hip1/MSS277974 CAGAAGAUAUUAGUGAGCUUCUGCA UGCAGAAGCUCACUAAUAUCUUCUG
154659F01 Traf2/MSS212078 CCCUGAGUAACAAGGUGCAACAGCU AGCUGUUGCACCUUGUUACUCAGGG
154659F03 Traf2/MSS212079 GGACCAUGUUAGAGCAUGCAGCAAA UUUGCUGCAUGCUCUAACAUGGUCC
154659F05 Traf2/MSS212080 GGAAGAUCUCUGACUUCACCAGAAA UUUCUGGUGAAGUCAGAGAUCUUCC
154659F07 Amph/MSS211646 GGAAAGCACGGAGCUUGCAAUCAGU ACUGAUUGCAAGCUCCGUGCUUUCC
154659F09 Amph/MSS211647 GCGCAGCAGGAAGCUUGUGGAUUAU AUAAUCCACAAGCUUCCUGCUGCGC
154659F11 Amph/MSS211648 GGAUAUUUAGCAGCAAUCAAAGGUA UACCUUUGAUUGCUGCUAAAUAUCC
154659G01 Igf1r/MSS205378 ACCACGGUAGCUGACACCUACAAUA UAUUGUAGGUGUCAGCUACCGUGGU
154659G03 Igf1r/MSS275035 UCCUGAAGGGCAAUCUGCUUAUUAA UUAAUAAGCAGAUUGCCCUUCAGGA
154659G05 Igf1r/MSS275036 CGGAAAGAUGUACUUUGCUUUCAAU AUUGAAAGCAAAGUACAUCUUUCCG
154659G07 Kif1a/MSS205763 CCGAGACUCCGUAUUGACAUGGCUU AAGCCAUGUCAAUACGGAGUCUCGG
154659G09 Kif1a/MSS205764 GAGCUGGAAGCCAAUGGCGAUUACA UGUAAUCGCCAUUGGCUUCCAGCUC
154659G11 Kif1a/MSS205765 GAGGUGACCAAGUCCUUCAUCGAAU AUUCGAUGAAGGACUUGGUCACCUC
154659H01 Ddef2/MSS277636 GAACAGAGAGGAACGGGAACCUCUA UAGAGGUUCCCGUUCCUCUCUGUUC
154659H03 Ddef2/MSS277637 GAGAAGAAGUGUUUCGACCUCAUAU AUAUGAGGUCGAAACACUUCUUCUC
154659H05 Ddef2/MSS277638 CAGACUUAGGAAGCGCGUUUCUGAA UUCAGAAACGCGCUUCCUAAGUCUG
154659H07 Atp6v1e1/MSS202278 UAAGCACAUGAUGGCUUUCAUUGAA UUCAAUGAAAGCCAUCAUGUGCUUA
154659H09 Atp6v1e1/MSS202279 GAAAUAGCUGGUGGCGUUGAGAUCU AGAUCUCAACGCCACCAGCUAUUUC
154659H11 Atp6v1e1/MSS273322 AGCAGAGACUCAGUAAGGUGGUAAA UUUACCACCUUACUGAGUCUCUGCU
154660A01 Kif5a/MSS205791 CCUCCGGGAUGAGAUUAAUGAGAAA UUUCUCAUUAAUCUCAUCCCGGAGG
154660A03 Kif5a/MSS205792 ACAACCUUCGCAAGCUGUUCGUUCA UGAACGAACAGCUUGCGAAGGUUGU
154660A05 Kif5a/MSS275221 GAUGAGAACCUUGAAUUCCACAUUA UAAUGUGGAAUUCAAGGUUCUCAUC
154660A07 Macf1/MSS201569 GGAGAACCAACUUUCUGCAUCUAAA UUUAGAUGCAGAAAGUUGGUUCUCC
154660A09 Macf1/MSS272959 CAGGCUUUAGUUGACUGGUUGUACA UGUACAACCAGUCAACUAAAGCCUG

154660A11 Macf1/MSS272960 GAGUUCCAGGAAAGCUUCAAGAAUA UAUUCUUGAAGCUUUCCUGGAACUC
154660B01 Bin1/MSS220005 GAUGACGCAUUUGUCCCUGAGAUCA UGAUCUCAGGGACAAAUGCGUCAUC
154660B03 Bin1/MSS220006 CCUGGCAGGGAUGAAGCAAACAAGA UCUUGUUUGCUUCAUCCCUGCCAGG
154660B05 Bin1/MSS282617 UCGGACCUAUCUGGCUUCUGUUAAA UUUAACAGAAGCCAGAUAGGUCCGA
154660B07 Mtap1a/MSS206790 CCUCCACUCUGACACUCCAACGUUU AAACGUUGGAGUGUCAGAGUGGAGG
154660B09 Mtap1a/MSS206791 CCACUCUGGAGAUCAUGAAGCUAAU AUUAGCUUCAUGAUCUCCAGAGUGG
154660B11 Mtap1a/MSS275827 CAGAACACAGAAGCAAGGUUGAUAA UUAUCAACCUUGCUUCUGUGUUCUG
154660C01 Cask/MSS202616 GGCCUUACUUCAGACUCAUGAUGUA UACAUCAUGAGUCUGAAGUAAGGCC
154660C03 Cask/MSS202617 CCUUCAGUGUUGUACGGCGAUGUAU AUACAUCGCCGUACAACACUGAAGG
154660C05 Cask/MSS202618 GGAGCGGGAUCGUUAUGCCUACAAA UUUGUAGGCAUAACGAUCCCGCUCC
154660C07 Cblb/MSS209651 GGUCUUGUGAUAAUGGUCAUUGUAU AUACAAUGACCAUUAUCACAAGACC
154660C09 Cblb/MSS209652 GGAAUCUCACAAAGCUGUCCCUUAU AUAAGGGACAGCUUUGUGAGAUUCC
154660C11 Cblb/MSS277402 CGAAGCGAGCGAUCCGGCUCUUUAA UUAAAGAGCCGGAUCGCUCGCUUCG
154660D01 Ndel1/MSS234683 ACUCUGGACUGUGAGAAGAUGGAUU AAUCCAUCUUCUCACAGUCCAGAGU
154660D03 Ndel1/MSS234685 GAACGAAAUGCAUUCUUAGAAAGUG CACUUUCUAAGAAUGCAUUUCGUUC
154660D05 Ndel1/MSS294501 CAACAGGAAGUGACCCGCAAGUCUG CAGACUUGCGGGUCACUUCCUGUUG
154660D07 Pam/MSS207392 CCAGUGUUUCAAGACUGACACCAAA UUUGGUGUCAGUCUUGAAACACUGG
154660D09 Pam/MSS207393 GAGUACUGGGAAGACUCCGAGGAAA UUUCCUCGGAGUCUUCCCAGUACUC
154660D11 Pam/MSS207394 CCAGCAUGGACACUGUCCACCAUAU AUAUGGUGGACAGUGUCCAUGCUGG
154660E01 Cd2ap/MSS273555 CAGAGAAGAAAGCUUUCCCUCUAAA UUUAGAGGGAAAGCUUUCUUCUCUG
154660E03 Cd2ap/MSS273556 GAUGCCUUUGUAGCCAGGAACUCAA UUGAGUUCCUGGCUACAAAGGCAUC
154660E05 Cd2ap/MSS273557 CCAAGGAUGACAAUUUGCCCAUCAA UUGAUGGGCAAAUUGUCAUCCUUGG
154660E07 Eps15/MSS203951 CCCUUAAACUGAAUGAUCCAUUUCA UGAAAUGGAUCAUUCAGUUUAAGGG
154660E09 Eps15/MSS203952 CCCAGGCAAUGAUAGUCCCAAAGAA UUCUUUGGGACUAUCAUUGCCUGGG
154660E11 Eps15/MSS203953 AGAUGAAGUUCAAAGGGAGAGUAUU AAUACUCUCCCUUUGAACUUCAUCU
154660F01 Pdgfrb/MSS207503 GAGAGUGACGGUGGCUACAUGGAUA UAUCCAUGUAGCCACCGUCACUCUC
154660F03 Pdgfrb/MSS207504 GAGCAAGGAUGAAUCUAUAGAUUAC GUAAUCUAUAGAUUCAUCCUUGCUC
154660F05 Pdgfrb/MSS207505 GCCUCUACACCACUUUGAGUGAUGU ACAUCACUCAAAGUGGUGUAGAGGC
154660F07 Ptprf/MSS237674 GCCAACCCAUCAUCCAGGAUGUCAU AUGACAUCCUGGAUGAUGGGUUGGC
154660F09 Ptprf/MSS237675 CGCCCAUGCCGUAUGUGAAAUGGAU AUCCAUUUCACAUACGGCAUGGGCG
154660F11 Ptprf/MSS237676 GCACUGAGACCUAUGGCCUCAUUCA UGAAUGAGGCCAUAGGUCUCAGUGC
154660G01 Exoc1/MSS229985 GAAGACCUGGAUGGAGGCUCGUUAU AUAACGAGCCUCCAUCCAGGUCUUC
154660G03 Exoc1/MSS229986 GGAGGUGGACCAGAUUGAACUGAAA UUUCAGUUCAAUCUGGUCCACCUCC
154660G05 Exoc1/MSS229987 GGUCGACGCCAAAGAUGCCAUCAAA UUUGAUGGCAUCUUUGGCGUCGACC
154660G07 Gna12/MSS204749 CCAUCGUCAACAACAAGCUCUUCUU AAGAAGAGCUUGUUGUUGACGAUGG
154660G09 Gna12/MSS204750 GGGAAUCGUGGAACAUGACUUCGUU AACGAAGUCAUGUUCCACGAUUCCC
154660G11 Gna12/MSS204751 GGAGAAGGUGAAGUCUGUGAGCAUU AAUGCUCACAGACUUCACCUUCUCC
154660H01 Rheb/NM_053075.3_stealth_184 CCUCAUUGACAAUUCAGUUUGUUGA UCAACAAACUGAAUUGUCAAUGAGG
154660H03 Rheb/NM_053075.3_stealth_478 GAAAUAAGAAGGACCUGCAUAUGGA UCCAUAUGCAGGUCCUUCUUAUUUC
154660H05 Rheb/NM_053075.3_stealth_1013 UACUAUUAACUAGGCUUCAAUAUAU AUAUAUUGAAGCCUAGUUAAUAGUA
154660H07 Scrib/MSS200606 GACCCUACAGAUGAGGGCAUCUUUA UAAAGAUGCCCUCAUCUGUAGGGUC
154660H09 Scrib/MSS200607 CCAGCCAAUGUGAAGCAGGCGUAUA UAUACGCCUGCUUCACAUUGGCUGG
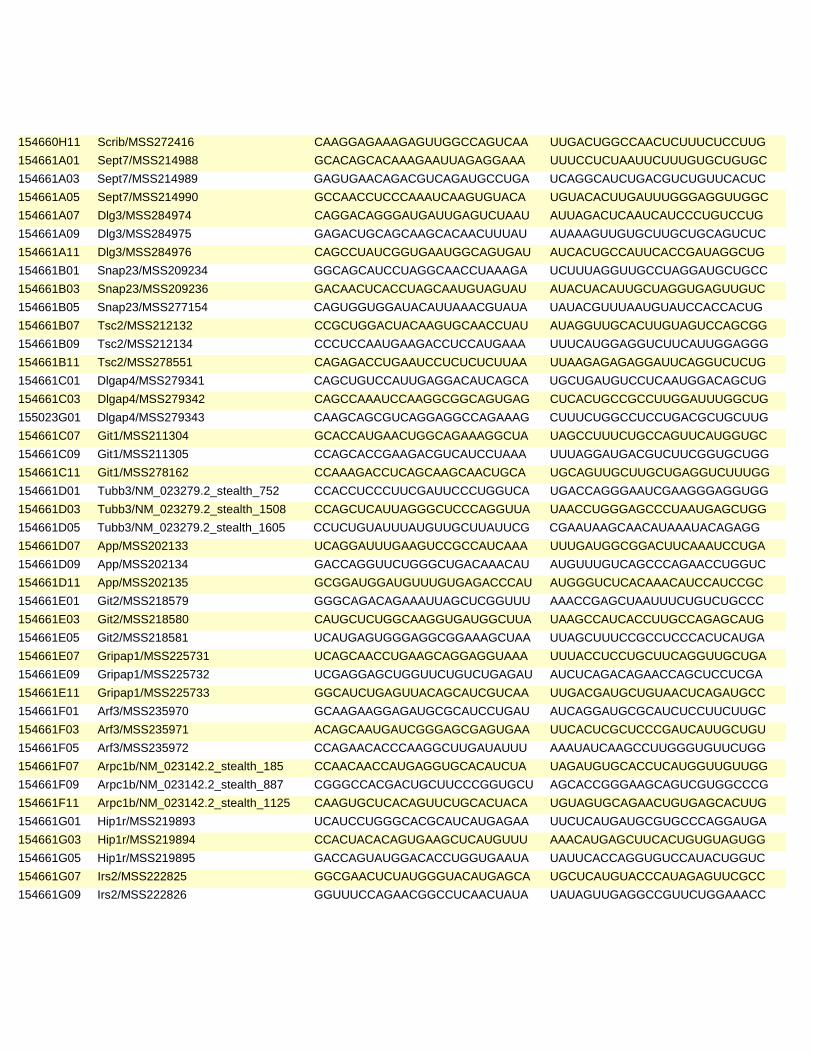
154660H11 Scrib/MSS272416 CAAGGAGAAAGAGUUGGCCAGUCAA UUGACUGGCCAACUCUUUCUCCUUG
154661A01 Sept7/MSS214988 GCACAGCACAAAGAAUUAGAGGAAA UUUCCUCUAAUUCUUUGUGCUGUGC
154661A03 Sept7/MSS214989 GAGUGAACAGACGUCAGAUGCCUGA UCAGGCAUCUGACGUCUGUUCACUC
154661A05 Sept7/MSS214990 GCCAACCUCCCAAAUCAAGUGUACA UGUACACUUGAUUUGGGAGGUUGGC
154661A07 Dlg3/MSS284974 CAGGACAGGGAUGAUUGAGUCUAAU AUUAGACUCAAUCAUCCCUGUCCUG
154661A09 Dlg3/MSS284975 GAGACUGCAGCAAGCACAACUUUAU AUAAAGUUGUGCUUGCUGCAGUCUC
154661A11 Dlg3/MSS284976 CAGCCUAUCGGUGAAUGGCAGUGAU AUCACUGCCAUUCACCGAUAGGCUG
154661B01 Snap23/MSS209234 GGCAGCAUCCUAGGCAACCUAAAGA UCUUUAGGUUGCCUAGGAUGCUGCC
154661B03 Snap23/MSS209236 GACAACUCACCUAGCAAUGUAGUAU AUACUACAUUGCUAGGUGAGUUGUC
154661B05 Snap23/MSS277154 CAGUGGUGGAUACAUUAAACGUAUA UAUACGUUUAAUGUAUCCACCACUG
154661B07 Tsc2/MSS212132 CCGCUGGACUACAAGUGCAACCUAU AUAGGUUGCACUUGUAGUCCAGCGG
154661B09 Tsc2/MSS212134 CCCUCCAAUGAAGACCUCCAUGAAA UUUCAUGGAGGUCUUCAUUGGAGGG
154661B11 Tsc2/MSS278551 CAGAGACCUGAAUCCUCUCUCUUAA UUAAGAGAGAGGAUUCAGGUCUCUG
154661C01 Dlgap4/MSS279341 CAGCUGUCCAUUGAGGACAUCAGCA UGCUGAUGUCCUCAAUGGACAGCUG
154661C03 Dlgap4/MSS279342 CAGCCAAAUCCAAGGCGGCAGUGAG CUCACUGCCGCCUUGGAUUUGGCUG
155023G01 Dlgap4/MSS279343 CAAGCAGCGUCAGGAGGCCAGAAAG CUUUCUGGCCUCCUGACGCUGCUUG
154661C07 Git1/MSS211304 GCACCAUGAACUGGCAGAAAGGCUA UAGCCUUUCUGCCAGUUCAUGGUGC
154661C09 Git1/MSS211305 CCAGCACCGAAGACGUCAUCCUAAA UUUAGGAUGACGUCUUCGGUGCUGG
154661C11 Git1/MSS278162 CCAAAGACCUCAGCAAGCAACUGCA UGCAGUUGCUUGCUGAGGUCUUUGG
154661D01 Tubb3/NM_023279.2_stealth_752 CCACCUCCCUUCGAUUCCCUGGUCA UGACCAGGGAAUCGAAGGGAGGUGG
154661D03 Tubb3/NM_023279.2_stealth_1508 CCAGCUCAUUAGGGCUCCCAGGUUA UAACCUGGGAGCCCUAAUGAGCUGG
154661D05 Tubb3/NM_023279.2_stealth_1605 CCUCUGUAUUUAUGUUGCUUAUUCG CGAAUAAGCAACAUAAAUACAGAGG
154661D07 App/MSS202133 UCAGGAUUUGAAGUCCGCCAUCAAA UUUGAUGGCGGACUUCAAAUCCUGA
154661D09 App/MSS202134 GACCAGGUUCUGGGCUGACAAACAU AUGUUUGUCAGCCCAGAACCUGGUC
154661D11 App/MSS202135 GCGGAUGGAUGUUUGUGAGACCCAU AUGGGUCUCACAAACAUCCAUCCGC
154661E01 Git2/MSS218579 GGGCAGACAGAAAUUAGCUCGGUUU AAACCGAGCUAAUUUCUGUCUGCCC
154661E03 Git2/MSS218580 CAUGCUCUGGCAAGGUGAUGGCUUA UAAGCCAUCACCUUGCCAGAGCAUG
154661E05 Git2/MSS218581 UCAUGAGUGGGAGGCGGAAAGCUAA UUAGCUUUCCGCCUCCCACUCAUGA
154661E07 Gripap1/MSS225731 UCAGCAACCUGAAGCAGGAGGUAAA UUUACCUCCUGCUUCAGGUUGCUGA
154661E09 Gripap1/MSS225732 UCGAGGAGCUGGUUCUGUCUGAGAU AUCUCAGACAGAACCAGCUCCUCGA
154661E11 Gripap1/MSS225733 GGCAUCUGAGUUACAGCAUCGUCAA UUGACGAUGCUGUAACUCAGAUGCC
154661F01 Arf3/MSS235970 GCAAGAAGGAGAUGCGCAUCCUGAU AUCAGGAUGCGCAUCUCCUUCUUGC
154661F03 Arf3/MSS235971 ACAGCAAUGAUCGGGAGCGAGUGAA UUCACUCGCUCCCGAUCAUUGCUGU
154661F05 Arf3/MSS235972 CCAGAACACCCAAGGCUUGAUAUUU AAAUAUCAAGCCUUGGGUGUUCUGG
154661F07 Arpc1b/NM_023142.2_stealth_185 CCAACAACCAUGAGGUGCACAUCUA UAGAUGUGCACCUCAUGGUUGUUGG
154661F09 Arpc1b/NM_023142.2_stealth_887 CGGGCCACGACUGCUUCCCGGUGCU AGCACCGGGAAGCAGUCGUGGCCCG
154661F11 Arpc1b/NM_023142.2_stealth_1125 CAAGUGCUCACAGUUCUGCACUACA UGUAGUGCAGAACUGUGAGCACUUG
154661G01 Hip1r/MSS219893 UCAUCCUGGGCACGCAUCAUGAGAA UUCUCAUGAUGCGUGCCCAGGAUGA
154661G03 Hip1r/MSS219894 CCACUACACAGUGAAGCUCAUGUUU AAACAUGAGCUUCACUGUGUAGUGG
154661G05 Hip1r/MSS219895 GACCAGUAUGGACACCUGGUGAAUA UAUUCACCAGGUGUCCAUACUGGUC
154661G07 Irs2/MSS222825 GGCGAACUCUAUGGGUACAUGAGCA UGCUCAUGUACCCAUAGAGUUCGCC
154661G09 Irs2/MSS222826 GGUUUCCAGAACGGCCUCAACUAUA UAUAGUUGAGGCCGUUCUGGAAACC

154661G11 Irs2/MSS284072 CAUCGGGCUUGAAGCGGCUAAGUCU AGACUUAGCCGCUUCAAGCCCGAUG
154661H01 Bcar1/MSS273814 GACCGCACCUUGCAUGCCAAGCUUA UAAGCUUGGCAUGCAAGGUGCGGUC
154661H03 Bcar1/MSS273815 ACAGAUGCAGUGGACGCCUUCUUCA UGAAGAAGGCGUCCACUGCAUCUGU
154661H05 Bcar1/MSS273816 CCUCAAGAUUCUGGUUGGCAUGUAU AUACAUGCCAACCAGAAUCUUGAGG
154661H07 Itgav/MSS205547 GGUGUGGAUCGAGCUGUCUUAUACA UGUAUAAGACAGCUCGAUCCACACC
154661H09 Itgav/MSS205548 CAGACCCGUUGUCACUGUAAAUGCU AGCAUUUACAGUGACAACGGGUCUG
154661H11 Itgav/MSS205549 CCAAGUGGCAGAAAUCAUAUCUAAA UUUAGAUAUGAUUUCUGCCACUUGG
154662A01 Capn1/MSS236087 ACCAAACUGGAAAUCUGCAACCUUA UAAGGUUGCAGAUUUCCAGUUUGGU
154662A03 Capn1/MSS236088 CCCUGAUGAGAAAGUUCUCUCUGAA UUCAGAGAGAACUUUCUCAUCAGGG
154662A05 Capn1/MSS236089 CCGAUAUCCGUGAUUUAGAGGCUAU AUAGCCUCUAAAUCACGGAUAUCGG
154662A07 Ccdc88a/MSS201023 CCCAGGAAGUGAAGUUGUUACUCUA UAGAGUAACAACUUCACUUCCUGGG
154662A09 Ccdc88a/MSS201024 ACACCAAGCACUCAAGGAAAGAUAA UUAUCUUUCCUUGAGUGCUUGGUGU
154662A11 Ccdc88a/MSS201025 GGCCAGGUCAGUAAGUGGAAAGACU AGUCUUUCCACUUACUGACCUGGCC
154662B01 Itgb5/MSS205565 GGACUAUCCAUCGCUUGCCUUGCUU AAGCAAGGCAAGCGAUGGAUAGUCC
154662B03 Itgb5/MSS205566 GCCUACAAUUGCACAUGCGGCUGUA UACAGCCGCAUGUGCAAUUGUAGGC
154662B05 Itgb5/MSS275142 CAGGAGGCUGUGCUUUGCUUCUACA UGUAGAAGCAAAGCACAGCCUCCUG
154662B07 Kif3a/MSS205781 CAGGACUCCUUAGGAGGGAACUCAA UUGAGUUCCCUCCUAAGGAGUCCUG
154662B09 Kif3a/MSS205782 GGGUAAAGAUCAGACCCAGAGGUUA UAACCUCUGGGUCUGAUCUUUACCC
154662B11 Kif3a/MSS205783 UCGGUGCGACUAAUAUGAACGAGCA UGCUCGUUCAUAUUAGUCGCACCGA
154662C01 Cd47/MSS205575 GAGAAAGGAGGUUGCAAAUUAGUUU AAACUAAUUUGCAACCUCCUUUCUC
154662C03 Cd47/MSS205576 GAUCAUAGCUCUAGCAGAACUACUU AAGUAGUUCUGCUAGAGCUAUGAUC
154662C05 Cd47/MSS275144 CGCGAUGCCAUGGUGGGAAACUACA UGUAGUUUCCCACCAUGGCAUCGCG
154662C07 Clip2/MSS219153 GAAGACCGGUGUGGUGCGAUAUGUU AACAUAUCGCACCACACCGGUCUUC
154662C09 Clip2/MSS282161 CGGGUGGAAGAAGAAUCCAUCACCA UGGUGAUGGAUUCUUCUUCCACCCG
154662C11 Clip2/MSS282162 UGCCCGGCUCUACAGGGCAUCUUCA UGAAGAUGCCCUGUAGAGCCGGGCA
154662D01 Kif3b/MSS275218 CAGCAGGAGGUAGACAUCAAGACCA UGGUCUUGAUGUCUACCUCCUGCUG
154662D03 Kif3b/MSS275219 AGCUAAAGCUCAAGCAUCUUAUUAU AUAAUAAGAUGCUUGAGCUUUAGCU
154662D05 Kif3b/MSS275220 CAGCUCACGGUCGCAUGCAAUCUUU AAAGAUUGCAUGCGACCGUGAGCUG
154662D07 Llgl1/MSS237065 GCCACACAGUCUGUGGACAACGUUU AAACGUUGUCCACAGACUGUGUGGC
154662D09 Llgl1/MSS237066 GCGAGAAGCUUAAGCAGGAGCUCUU AAGAGCUCCUGCUUAAGCUUCUCGC
154662D11 Llgl1/MSS275350 CAGAAGGUUGCGCUUUGCAAGUACA UGUACUUGCAAAGCGCAACCUUCUG
154662E01 Ctnna1/MSS202658 UCCUGGAGACCAAUGUCCCUCUAUU AAUAGAGGGACAUUGGUCUCCAGGA
154662E03 Ctnna1/MSS202659 GCUGAAAGUUGUGGAAGAUGGUAUA UAUACCAUCUUCCACAACUUUCAGC
154662E05 Ctnna1/MSS273499 CAAUAGUAAAGGGCCGUCUAAUAAA UUUAUUAGACGGCCCUUUACUAUUG
154662E07 Dixdc1/MSS221126 GCACCUGCACUAAGGUGCUCUAUUU AAAUAGAGCACCUUAGUGCAGGUGC
154662E09 Dixdc1/MSS221127 UCGGAUGCAUCAGACGUCAGCGAAA UUUCGCUGACGUCUGAUGCAUCCGA
154662E11 Dixdc1/MSS221128 GCGGGCUCUUGUGCAGCAAUAUGAA UUCAUAUUGCUGCACAAGAGCCCGC
154662F01 Map2k7/MSS218514 UGAUGGACCUGGAUGUAGUACUCAA UUGAGUACUACAUCCAGGUCCAUCA
154662F03 Map2k7/MSS218515 CCAGUCAUUUGUCAAAGACUGCCUU AAGGCAGUCUUUGACAAAUGACUGG
154662F05 Map2k7/MSS281882 CCAGCGUUAUCAGGCAGAAAUCAAU AUUGAUUUCUGCCUGAUAACGCUGG
154662F07 Map3k12/MSS218522 GACCUGAAGUCACCCAACAUGCUAA UUAGCAUGUUGGGUGACUUCAGGUC
154662F09 Map3k12/MSS218523 GACUCAGACUGUGACAGCACUGAAU AUUCAGUGCUGUCACAGUCUGAGUC

154662F11 Map3k12/MSS281884 CAACACUGAUGAGCGACCAGAUGAA UUCAUCUGGUCGCUCAUCAGUGUUG
154662G01 Rab4a/MSS208367 GGCUUUCAUGCAGUGUGCAAGGAAA UUUCCUUGCACACUGCAUGAAAGCC
154662G03 Rab4a/MSS208368 GGAAAUGCGGGAACUGGCAAAUCUU AAGAUUUGCCAGUUCCCGCAUUUCC
154662G05 Rab4a/MSS276696 GGAGUGGAAUUUGGCUCAAAGAUAA UUAUCUUUGAGCCAAAUUCCACUCC
154662G07 Map4k5/MSS223262 GGCUGCCACAAAUGCUGCAUAGUUA UAACUAUGCAGCAUUUGUGGCAGCC
154662G09 Map4k5/MSS223263 CCCACGCAAUCAUUCGUCAUACCAU AUGGUAUGACGAAUGAUUGCGUGGG
154662G11 Map4k5/MSS223264 GGAAAUGUACGUGGCUCUACGUCAU AUGACGUAGAGCCACGUACAUUUCC
154662H01 Mapk8ip3/MSS220022 CAUCCGCUGCAUGGCUGUUGUGAAU AUUCACAACAGCCAUGCAGCGGAUG
154662H03 Mapk8ip3/MSS220023 GCCACAUGAAGAGGACUCUAGCAAU AUUGCUAGAGUCCUCUUCAUGUGGC
154662H05 Mapk8ip3/MSS220024 AGGAAAUGUGCUGGCCACUCUCAAU AUUGAGAGUGGCCAGCACAUUUCCU
154662H07 Raph1/MSS293907 CAAAUCUCACUGUGGCUACAGUUUA UAAACUGUAGCCACAGUGAGAUUUG
154662H09 Raph1/MSS293908 CCACUCUAAUCAGUCUGACAGCGGA UCCGCUGUCAGACUGAUUAGAGUGG
154662H11 Raph1/MSS293909 CAGCAUGGAUUCUCUGGAUAUUGAU AUCAAUAUCCAGAGAAUCCAUGCUG
154663A01 Rela/MSS208587 GCAGUAUCCAUAGCUUCCAGAACCU AGGUUCUGGAAGCUAUGGAUACUGC
154663A03 Rela/MSS208588 GCAGAAAGAAGACAUUGAGGUGUAU AUACACCUCAAUGUCUUCUUUCUGC
154663A05 Rela/MSS276820 CCGAGCUCAAGAUCUGCCGAGUAAA UUUACUCGGCAGAUCUUGAGCUCGG
154663A07 Myo18a/MSS221405 CCUUCUGACGAUGGCAGCUUGAAGA UCUUCAAGCUGCCAUCGUCAGAAGG
154663A09 Myo18a/MSS221406 UCGAGUCCCUGAGCUGGUGACUAAA UUUAGUCACCAGCUCAGGGACUCGA
154663A11 Myo18a/MSS221407 CAGCUGUAAAGGCACGGAAAGCGAU AUCGCUUUCCGUGCCUUUACAGCUG
154663B01 Sh3kbp1/MSS226688 GGAGAUAUAGUGACUCUCAUCAAUA UAUUGAUGAGAGUCACUAUAUCUCC
154663B03 Sh3kbp1/MSS226689 ACUGGAUUUACAGAAGCCUUCAGUU AACUGAAGGCUUCUGUAAAUCCAGU
154663B05 Sh3kbp1/MSS226690 GGUUGCAGAUGGAAGUGAACGACAU AUGUCGUUCACUUCCAUCUGCAACC
154663B07 Smg1/MSS279870 GAGGACUGUCUUAUCCCACUCUUUA UAAAGAGUGGGAUAAGACAGUCCUC
154663B09 Smg1/MSS279871 CGGAAAGUUGUGGACAGAAUCUUCA UGAAGAUUCUGUCCACAACUUUCCG
154663B11 Smg1/MSS279872 CCUCAUAUUAUAUCCUGCAAUAGUA UACUAUUGCAGGAUAUAAUAUGAGG
154663C01 Nfkb2/MSS207035 CCAAGGACAUGACUGCUCAAUUUAA UUAAAUUGAGCAGUCAUGUCCUUGG
154663C03 Nfkb2/MSS207036 CCCAAAUAUUGCACAUGCCUGAUUU AAAUCAGGCAUGUGCAAUAUUUGGG
154663C05 Nfkb2/MSS207037 CCAACUCUUACUCGCCUCCUUCUAA UUAGAAGGAGGCGAGUAAGAGUUGG
154663C07 Pacsin1/MSS239516 CCAUGACCCGGGAGAUGAACAGUAA UUACUGUUCAUCUCCCGGGUCAUGG
154663C09 Pacsin1/MSS239517 GCAGCUAUGACCGAGGCCAAACAUA UAUGUUUGGCCUCGGUCAUAGCUGC
154663C11 Pacsin1/MSS239518 AGGAGCAGGAUGAGCUCAGCUUCAA UUGAAGCUGAGCUCAUCCUGCUCCU
154663D01 Snap25/MSS237950 GCAAGGCGAACAACUGGAACGCAUU AAUGCGUUCCAGUUGUUCGCCUUGC
154663D03 Snap25/MSS237952 GGGCAAUAAUCAGGAUGGAGUAGUG CACUACUCCAUCCUGAUUAUUGCCC
154663D05 Snap25/MSS277146 GCCAUCAGUGGUGGCUUCAUCCGCA UGCGGAUGAAGCCACCACUGAUGGC
154663D07 Snx5/MSS229554 GGAAUAUGAUCAGGAUCUAAGUGUU AACACUUAGAUCCUGAUCAUAUUCC
154663D09 Snx5/MSS229555 UCAAACGGAAGAGAGUGGCAGCAUU AAUGCUGCCACUCUCUUCCGUUUGA
154663D11 Snx5/MSS290594 CCCAUCGCUUCAGAUCGACAUACCU AGGUAUGUCGAUCUGAAGCGAUGGG
154663E01 Pacsin2/MSS215933 GCUGGUAGAGAAGGGACCACAGUAU AUACUGUGGUCCCUUCUCUACCAGC
154663E03 Pacsin2/MSS215934 ACAGGGUUGGUGCAAGGGACGUUUA UAAACGUCCCUUGCACCAACCCUGU
154663E05 Pacsin2/MSS215935 GAGCAUCAAAGCAGCAGAUGCGGUA UACCGCAUCUGCUGCUUUGAUGCUC
154663E07 Spnb3/MSS277255 CCCAAUGUCAAUGUGCACAACUUUA UAAAGUUGUGCACAUUGACAUUGGG
154663E09 Spnb3/MSS277256 CCCACUGACUUUGACAGCUUGGAGA UCUCCAAGCUGUCAAAGUCAGUGGG

154663E11 Spnb3/MSS277257 CAGUCAAGAUAUGAUUGACCAUGAA UUCAUGGUCAAUCAUAUCUUGACUG
154663F01 Pacsin3/MSS294410 CCAGUAGCGACAAGUUCCAUGAACU AGUUCAUGGAACUUGUCGCUACUGG
154663F03 Pacsin3/MSS294411 CCGUAAAGCUCAGAAGCCCUGGCUA UAGCCAGGGCUUCUGAGCUUUACGG
154663F05 Pacsin3/MSS294412 GAGGCUGAAGGAGGUUGAGGCUUCU AGAAGCCUCAACCUCCUUCAGCCUC
154663F07 Pak2/MSS212562 GCAGUGCUGGAUGUCUUGAAGUUCU AGAACUUCAAGACAUCCAGCACUGC
154663F09 Pak2/MSS212563 CCAGUUCGGAUGAGCAGUACCAUUU AAAUGGUACUGCUCAUCCGAACUGG
154663F11 Pak2/MSS278828 CAGCCAAUCACAGUUUGAAACCUUU AAAGGUUUCAAACUGUGAUUGGCUG
154663G01 Stmn1/NM_019641.4_stealth_2 CAGCCAAUGCGGAGCGCCUGGUCUG CAGACCAGGCGCUCCGCAUUGGCUG
154663G03 Stmn1/NM_019641.4_stealth_10 GCGGAGCGCCUGGUCUGGGUCACGU ACGUGACCCAGACCAGGCGCUCCGC
154663G05 Stmn1/NM_019641.4_stealth_705 GACAGAUAGUCUAGAAGCCGAUGUA UACAUCGGCUUCUAGACUAUCUGUC
154663G07 Stmn2/MSS237848 GCAGGAACAAGGAACUGCAGGUUGA UCAACCUGCAGUUCCUUGUUCCUGC
154663G09 Stmn2/MSS237849 UCCACGAACUCUAGCUUCUCCAAAG CUUUGGAGAAGCUAGAGUUCGUGGA
154663G11 Stmn2/MSS237850 CCUGUCUCUGGAGGAGAUUCAGAAA UUUCUGAAUCUCCUCCAGAGACAGG
154663H01 Pin1/NM_023371.3_stealth_1262 CCUCAGCACACAGACAGACUGCUUA UAAGCAGUCUGUCUGUGUGCUGAGG
154663H03 Pin1/NM_023371.3_stealth_1302 CACCCAGCAUCUGCCACCCACUUCU AGAAGUGGGUGGCAGAUGCUGGGUG
154663H05 Pin1/NM_023371.3_stealth_1365 UCUCCAGGUGCUGUUUCCAUGGUAA UUACCAUGGAAACAGCACCUGGAGA
154663H07 Plcb3/MSS207740 CGGCGCGGGAGUAAGUUCAUCAAAU AUUUGAUGAACUUACUCCCGCGCCG
154663H09 Plcb3/MSS207741 GGAUACCACUAUGUCUGCCUGCGAA UUCGCAGGCAGACAUAGUGGUAUCC
154663H11 Plcb3/MSS276375 CAGGACUAUGCGGAGGCCUUGAUUA UAAUCAAGGCCUCCGCAUAGUCCUG
154664A01 Stmn3/NM_009133.3_stealth_343 UCGCUCAUUUGCUCCUGCUUCUACU AGUAGAAGCAGGAGCAAAUGAGCGA
154664A03 Stmn3/NM_009133.3_stealth_440 GCCAGAGCUUCGAGGUCAUCCUCAA UUGAGGAUGACCUCGAAGCUCUGGC
154664A05 Stmn3/NM_009133.3_stealth_807 GCAGCGGGAGGAAAUGUCUGGCUAA UUAGCCAGACAUUUCCUCCCGCUGC
154664A07 Stx4a/MSS238052 GGGAGAUGAUCAACCGCAUCGAGAA UUCUCGAUGCGGUUGAUCAUCUCCC
154664A09 Stx4a/MSS238053 GCAGUAUCCGAGAGCUCCAUGAGAU AUCUCAUGGAGCUCUCGGAUACUGC
154664A11 Stx4a/MSS238054 GCAGAACCUGCGAGAGGAGAUCAAA UUUGAUCUCCUCUCGCAGGUUCUGC
154664B01 Prkcd/MSS207669 CCCUUCCUGCGCAUCUCCUUCAAUU AAUUGAAGGAGAUGCGCAGGAAGGG
154664B03 Prkcd/MSS207670 GGACACAACAGAGUCUGUCGGAAUA UAUUCCGACAGACUCUGUUGUGUCC
154664B05 Prkcd/MSS276343 CAUGAACCGUCGUGGAGCCAUUAAA UUUAAUGGCUCCACGACGGUUCAUG
154664B07 Pstpip1/MSS276532 GCAAUGCCCUGUGGGUGCACUGUAA UUACAGUGCACCCACAGGGCAUUGC
154664B09 Pstpip1/MSS276533 GAGAGAGACAGAAAGAGCAGCGGAA UUCCGCUGCUCUUUCUGUCUCUCUC
154664B11 Pstpip1/MSS276534 GAGGCAGAAAGAGUGUACAGGCAAA UUUGCCUGUACACUCUUUCUGCCUC
154664C01 Tjp1/MSS211847 GCACGCAUCACAGCCUGGUUGUUUA UAAACAACCAGGCUGUGAUGCGUGC
154664C03 Tjp1/MSS211848 GCAAAGAGAUGAGCGGGCUACCUUA UAAGGUAGCCCGCUCAUCUCUUUGC
154664C05 Tjp1/MSS211849 GGGCCUACACUGAUCAAGAACUAGA UCUAGUUCUUGAUCAGUGUAGGCCC
154664C07 Tpm1/MSS247946 GAGAGAGGCAUGAAAGUCAUUGAAA UUUCAAUGACUUUCAUGCCUCUCUC
154664C09 Tpm1/MSS247947 GGCUGAGUUUGCAGAGAGAUCAGUA UACUGAUCUCUCUGCAAACUCAGCC
154664C11 Tpm1/MSS278512 UGGAUCAGACUUUACUGGAGCUAAA UUUAGCUCCAGUAAAGUCUGAUCCA
154664D01 Vac14/MSS214907 GGAUCUGGAAGUGUUGGCAGAAAUU AAUUUCUGCCAACACUUCCAGAUCC
154664D03 Vac14/MSS214908 CACUCCCACCAUGAACUCCUACUUU AAAGUAGGAGUUCAUGGUGGGAGUG
154664D05 Vac14/MSS214909 UCUUCCAGCUGAGGAACCAGCUCAA UUGAGCUGGUUCCUCAGCUGGAAGA
154664D07 NM_146100.4_stealth_89 CCGCCUCCUCCUACCGCAAGGUGUU AACACCUUGCGGUAGGAGGAGGCGG
154664D09 NM_146100.4_stealth_1646 CCGCUAUAGAAUGUCUGCAAGGCUU AAGCCUUGCAGACAUUCUAUAGCGG

154664D11 NM_146100.4_stealth_2138 CGUAUGCCCUUUAGCUAGCUCUUCU AGAAGAGCUAGCUAAAGGGCAUACG
154664E01 Wasf3/MSS217310 UCCCAACCCUGUUGCUGACAUUUAU AUAAAUGUCAGCAACAGGGUUGGGA
154664E03 Wasf3/MSS217311 GGCCACCAUCUUGUCUAGACGCAUU AAUGCGUCUAGACAAGAUGGUGGCC
154664E05 Wasf3/MSS217312 GCCAGGAGUGGAAUAUGAUGGCGUA UACGCCAUCAUAUUCCACUCCUGGC
154664E07 Zyx/MSS238955 CCCACCAGUUGCCACUCCAUUUGUU AACAAAUGGAGUGGCAACUGGUGGG
154664E09 Zyx/MSS238956 GGCUCCUAAAUUUACUCCCGUGGUU AACCACGGGAGUAAAUUUAGGAGCC
154664E11 Zyx/MSS238957 CAGAUGACAACGGCUGUUUCCCUCU AGAGGGAAACAGCCGUUGUCAUCUG
154664F01 Kif5c/MSS275222 CCGGGACAGCAAGAUGACUCGGAUU AAUCCGAGUCAUCUUGCUGUCCCGG
154664F03 Kif5c/MSS275223 CAAGGCCUUGGAGAGUGCGCUGAAA UUUCAGCGCACUCUCCAAGGCCUUG
154664F05 Kif5c/MSS275224 GGAAGUUACAUGAUCCUCAGCUUAU AUAAGCUGAGGAUCAUGUAACUUCC
154664F07 Klc1/MSS205817 GAGCACAACUCCAUCCUGCAGAGUU AACUCUGCAGGAUGGAGUUGUGCUC
154664F09 Klc1/MSS205818 UCACGCAGGAUGAGAUCAUCUCUAA UUAGAGAUGAUCUCAUCCUGCGUGA
154664F11 Klc1/MSS205819 GCCGUUGGAUGAUCUCUUCCCAAAU AUUUGGGAAGAGAUCAUCCAACGGC
154664G01 Actn3/MSS201671 CCAAUGUCAAUAAAGCCCUAGACUU AAGUCUAGGGCUUUAUUGACAUUGG
154664G03 Actn3/MSS201672 CCUCUAUGGAGAGAGUGACCUCUGA UCAGAGGUCACUCUCUCCAUAGAGG
154664G05 Actn3/MSS201673 GCUCUGGACUACGUGGCUUUCUCUA UAGAGAAAGCCACGUAGUCCAGAGC
154664G07 Add1/MSS201758 GGGAGCAGGAAUUUGAAGCUCUUAU AUAAGAGCUUCAAAUUCCUGCUCCC
154664G09 Add1/MSS201759 GAAGAAGAGGGUGUCUAUGAUUCUA UAGAAUCAUAGACACCCUCUUCUUC
154664G11 Add1/MSS201760 GCCAAGUGUAUUGUGCACAUCCACA UGUGGAUGUGCACAAUACACUUGGC
154664H01 Klc2/MSS236981 CGACCCUCAACAAUCUGGCUGUUCU AGAACAGCCAGAUUGUUGAGGGUCG
154664H03 Klc2/MSS236982 GAGGAGGUGGAAUACUACUACCGGA UCCGGUAGUAGUAUUCCACCUCCUC
154664H05 Klc2/MSS236983 GAGACCCUGUACAAGGAGAUCCUUA UAAGGAUCUCCUUGUACAGGGUCUC
154664H07 NM_008634.2_stealth_203 CACCGCUUCCUAGACAGCAAGUUCU AGAACUUGCUGUCUAGGAAGCGGUG
154664H09 NM_008634.2_stealth_7616 CAGUUAUUACCUGCCAGAUGCUAUA UAUAGCAUCUGGCAGGUAAUAACUG
154664H11 NM_008634.2_stealth_8228 CACACGGCAUAAUGUAGCAAGUGUA UACACUUGCUACAUUAUGCCGUGUG
154665A01 Arrb1/MSS201215 GGAAAGCUCACUGUCUACCUGGGAA UUCCCAGGUAGACAGUGAGCUUUCC
154665A03 Arrb1/MSS201216 CCUUCACCUUUGAGAUCCCGCCAAA UUUGGCGGGAUCUCAAAGGUGAAGG
154665A05 Arrb1/MSS272777 GACACCAAUGAUGACGACAUUGUAU AUACAAUGUCGUCAUCAUUGGUGUC
154665A07 Cdk5/MSS247085 GGAGGGACCUGUUGCAGAACCUAUU AAUAGGUUCUGCAACAGGUCCCUCC
154665A09 Cdk5/MSS247086 GGGAGAUCUGUCUACUCAAAGAACU AGUUCUUUGAGUAGACAGAUCUCCC
154665A11 Cdk5/MSS247087 CCAUGACCAAGCUGCCAGACUAUAA UUAUAGUCUGGCAGCUUGGUCAUGG
154665B01 Map2k3/MSS240938 GGAUCAACCCUGAACUGAAUCAGAA UUCUGAUUCAGUUCAGGGUUGAUCC
154665B03 Map2k3/MSS240939 ACCUUCAUCACUAUCGGAGACAGAA UUCUGUCUCCGAUAGUGAUGAAGGU
154665B05 Map2k3/MSS281881 UGGAGCUGAUGGAACACCCAUUCUU AAGAAUGGGUGUUCCAUCAGCUCCA
154665B07 Mapre1/MSS274053 CCGAAGAAACCUCUCGGCUCCAGUA UACUGGAGCCGAGAGGUUUCUUCGG
154665B09 Mapre1/MSS274054 CAUUGCAACACAGAGGACUACUGCA UGCAGUAGUCCUCUGUGUUGCAAUG
154665B11 Mapre1/MSS274055 CAGCAGGUCAAAGUACUGAAGCUUA UAAGCUUCAGUACUUUGACCUGCUG
154665C01 Cttn/MSS247133 GGAGAAGCAUGAGUCUCAGAAAGAU AUCUUUCUGAGACUCAUGCUUCUCC
154665C03 Cttn/MSS247134 GGUGGAUCAGUCUGCUGUAGGCUUU AAAGCCUACAGCAGACUGAUCCACC
154665C05 Cttn/MSS247135 GGCCAUGAGUACCAGUCGAAGCUUU AAAGCUUCGACUGGUACUCAUGGCC
154665C07 Mapt/MSS275836 CAGUCGAAGAUUGGCUCCUUGGAUA UAUCCAAGGAGCCAAUCUUCGACUG
154665C09 Mapt/MSS275837 CAGGAGGUGGCAAGGUGCAGAUAAU AUUAUCUGCACCUUGCCACCUCCUG

154665C11 Mapt/MSS275838 CAGGAGGUGGCCAGGUGGAAGUAAA UUUACUUCCACCUGGCCACCUCCUG
154665D01 Dpysl3/MSS238620 AGGGAAUGACCACAGUGGACGAUUU AAAUCGUCCACUGUGGUCAUUCCCU
154665D03 Dpysl3/MSS278607 CAGCUCUCUGGAAGUGCCCACUGUA UACAGUGGGCACUUCCAGAGAGCUG
154665D05 Dpysl3/MSS278608 CCUCUGGUGGUUAUCUGCCAGGGCA UGCCCUGGCAGAUAACCACCAGAGG
154665D07 Dpysl4/MSS218676 GCCAGUGUACUGACGGUCAGAUAUA UAUAUCUGACCGUCAGUACACUGGC
154665D09 Dpysl4/MSS218677 CGUGCAUCCUGUUCAGGCAAGAUCU AGAUCUUGCCUGAACAGGAUGCACG
154665D11 Dpysl4/MSS281959 CCAAGAGCCAUAACCUGAAUGUAGA UCUACAUUCAGGUUAUGGCUCUUGG
154665E01 Nck1/MSS206957 GAGAGAGGAUGAGUUGUCAUUGAUA UAUCAAUGACAACUCAUCCUCUCUC
154665E03 Nck1/MSS206958 UCGUGACAGUGAAUCUUCGCCAAAU AUUUGGCGAAGAUUCACUGUCACGA
154665E05 Nck1/MSS275938 UGGCGAGUUCGAAAUUCCAUGAAUA UAUUCAUGGAAUUUCGAACUCGCCA
154665E07 NM_010904.3_stealth_17 CGGACCGGGCCACCGCGGAUAUAAA UUUAUAUCCGCGGUGGCCCGGUCCG
154665E09 NM_010904.3_stealth_1032 CAGCCAAAGUGAACACAGAUGCUAU AUAGCAUCUGUGUUCACUUUGGCUG
154665E11 NM_010904.3_stealth_3945 CCACUUUCAAUUGCUUCCAUGCAAU AUUGCAUGGAAGCAAUUGAAAGUGG
154665F01 Dpysl5/MSS227180 GAAUCGAGAUCAGCCAUCCAGAGGA UCCUCUGGAUGGCUGAUCUCGAUUC
154665F03 Dpysl5/MSS227181 GGCAAGGUGGUGAACGAUGACUGUA UACAGUCAUCGUUCACCACCUUGCC
154665F05 Dpysl5/MSS227182 AGGCAGGUCGAGCGGUAUUUGGUAA UUACCAAAUACCGCUCGACCUGCCU
154665F07 1110012M11Rik/MSS246023 ACGUGAAGCUGAGUGGGAAGACUAA UUAGUCUUCCCACUCAGCUUCACGU
154665F09 1110012M11Rik/MSS246025 UGGACAUGCAGAUCGUGAUGGACAA UUGUCCAUCACGAUCUGCAUGUCCA
154665F11 1110012M11Rik/MSS292510 CAGACAUUGAGAAGGAGUAUAACUA UAGUUAUACUCCUUCUCAAUGUCUG
154665G01 Numb/MSS207221 ACUGGAAAGUGUAGCUUCCCAGUUA UAACUGGGAAGCUACACUUUCCAGU
154665G03 Numb/MSS207222 GGCGAUGGAUCUGUCAUUGUUUCAU AUGAAACAAUGACAGAUCCAUCGCC
154665G05 Numb/MSS207223 GGCCACGUAGAAGUUGAUGAGUCAA UUGACUCAUCAACUUCUACGUGGCC
154665G07 Pfn2/MSS207567 GACUGCACAAUGGACAUCCGGACAA UUGUCCGGAUGUCCAUUGUGCAGUC
154665G09 Pfn2/MSS207568 UCCAGAGCAUCACGCCAGUAGAAAU AUUUCUACUGGCGUGAUGCUCUGGA
154665G11 Pfn2/MSS276301 CCGGGAGAGUCUUGGUCUUUGUAAU AUUACAAAGACCAAGACUCUCCCGG
154665H01 Hgs/MSS205115 UGGAGGUGCAGAGACAGCUAGCUAU AUAGCUAGCUGUCUCUGCACCUCCA
154665H03 Hgs/MSS205116 GGAGUCAGACUGGGAGUCCAUUCUA UAGAAUGGACUCCCAGUCUGACUCC
154665H05 Hgs/MSS205117 CCUGCUAUGAGCAGCUGAACAAGAA UUCUUGUUCAGCUGCUCAUAGCAGG
154665H07 Htt/MSS205084 GGUUCGACAUGUUGCUGCAACAUCA UGAUGUUGCAGCAACAUGUCGAACC
154665H09 Htt/MSS274794 GAUGGCUGUGAAGGCAGCUUCUAUA UAUAGAAGCUGCCUUCACAGCCAUC
154665H11 Htt/MSS274795 CAUCAAAGCUUUGAUGGAUUCUAAU AUUAGAAUCCAUCAAAGCUUUGAUG
154666A01 Ppp1r8/MSS200043 GGAACCUCACAAGCCUCAACAGAUU AAUCUGUUGAGGCUUGUGAGGUUCC
154666A03 Ppp1r8/MSS200044 UCAGACAUUGCCAUCGGCUGUGAAA UUUCACAGCCGAUGGCAAUGUCUGA
154666A05 Ppp1r8/MSS272038 CGAGGGCAUACACUCUGCGAGAGAA UUCUCUCGCAGAGUGUAUGCCCUCG
154666A07 Prkce/MSS207671 GGACGUUAUCCUACAAGACGAUGAU AUCAUCGUCUUGUAGGAUAACGUCC
154666A09 Prkce/MSS207672 GCGGGAAGAGCCAAUACUUACACUU AAGUGUAAGUAUUGGCUCUUCCCGC
154666A11 Prkce/MSS207673 GGACGACUUGUUCGAAUCCAUCCUU AAGGAUGGAUUCGAACAAGUCGUCC
154666B01 Raf1/MSS235712 GGAGAUGUUGCAGUAAAGAUCCUAA UUAGGAUCUUUACUGCAACAUCUCC
154666B03 Raf1/MSS235713 CCCACAUCAACAACCGAGACCAGAU AUCUGGUCUCGGUUGUUGAUGUGGG
154666B05 Raf1/MSS235714 GGUGUGAAGGCAGCAGUCUCUACAA UUGUAGAGACUGCUGCCUUCACACC
154666B07 Pitpnm1/MSS207644 GGGAAACAAGCGGAUCGACUAUUCA UGAAUAGUCGAUCCGCUUGUUUCCC
154666B09 Pitpnm1/MSS207645 UCAUCCUCCCGUUCCUCCUACUCAU AUGAGUAGGAGGAACGGGAGGAUGA
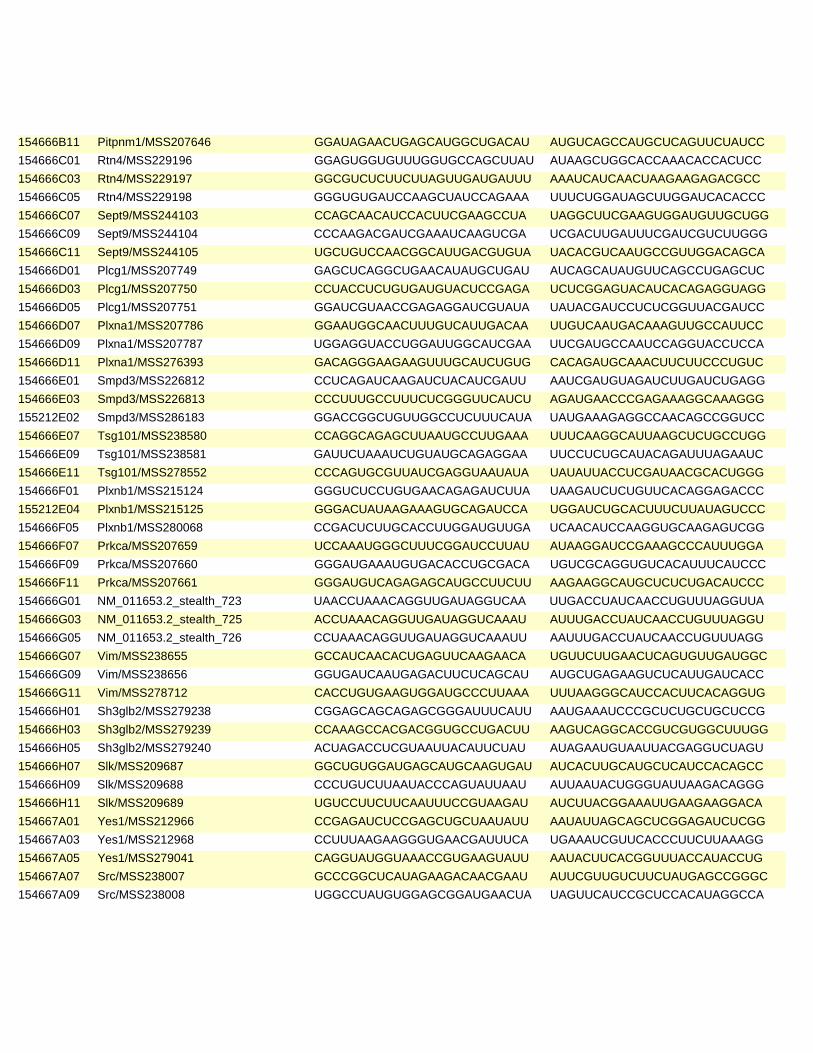
154666B11 Pitpnm1/MSS207646 GGAUAGAACUGAGCAUGGCUGACAU AUGUCAGCCAUGCUCAGUUCUAUCC
154666C01 Rtn4/MSS229196 GGAGUGGUGUUUGGUGCCAGCUUAU AUAAGCUGGCACCAAACACCACUCC
154666C03 Rtn4/MSS229197 GGCGUCUCUUCUUAGUUGAUGAUUU AAAUCAUCAACUAAGAAGAGACGCC
154666C05 Rtn4/MSS229198 GGGUGUGAUCCAAGCUAUCCAGAAA UUUCUGGAUAGCUUGGAUCACACCC
154666C07 Sept9/MSS244103 CCAGCAACAUCCACUUCGAAGCCUA UAGGCUUCGAAGUGGAUGUUGCUGG
154666C09 Sept9/MSS244104 CCCAAGACGAUCGAAAUCAAGUCGA UCGACUUGAUUUCGAUCGUCUUGGG
154666C11 Sept9/MSS244105 UGCUGUCCAACGGCAUUGACGUGUA UACACGUCAAUGCCGUUGGACAGCA
154666D01 Plcg1/MSS207749 GAGCUCAGGCUGAACAUAUGCUGAU AUCAGCAUAUGUUCAGCCUGAGCUC
154666D03 Plcg1/MSS207750 CCUACCUCUGUGAUGUACUCCGAGA UCUCGGAGUACAUCACAGAGGUAGG
154666D05 Plcg1/MSS207751 GGAUCGUAACCGAGAGGAUCGUAUA UAUACGAUCCUCUCGGUUACGAUCC
154666D07 Plxna1/MSS207786 GGAAUGGCAACUUUGUCAUUGACAA UUGUCAAUGACAAAGUUGCCAUUCC
154666D09 Plxna1/MSS207787 UGGAGGUACCUGGAUUGGCAUCGAA UUCGAUGCCAAUCCAGGUACCUCCA
154666D11 Plxna1/MSS276393 GACAGGGAAGAAGUUUGCAUCUGUG CACAGAUGCAAACUUCUUCCCUGUC
154666E01 Smpd3/MSS226812 CCUCAGAUCAAGAUCUACAUCGAUU AAUCGAUGUAGAUCUUGAUCUGAGG
154666E03 Smpd3/MSS226813 CCCUUUGCCUUUCUCGGGUUCAUCU AGAUGAACCCGAGAAAGGCAAAGGG
155212E02 Smpd3/MSS286183 GGACCGGCUGUUGGCCUCUUUCAUA UAUGAAAGAGGCCAACAGCCGGUCC
154666E07 Tsg101/MSS238580 CCAGGCAGAGCUUAAUGCCUUGAAA UUUCAAGGCAUUAAGCUCUGCCUGG
154666E09 Tsg101/MSS238581 GAUUCUAAAUCUGUAUGCAGAGGAA UUCCUCUGCAUACAGAUUUAGAAUC
154666E11 Tsg101/MSS278552 CCCAGUGCGUUAUCGAGGUAAUAUA UAUAUUACCUCGAUAACGCACUGGG
154666F01 Plxnb1/MSS215124 GGGUCUCCUGUGAACAGAGAUCUUA UAAGAUCUCUGUUCACAGGAGACCC
155212E04 Plxnb1/MSS215125 GGGACUAUAAGAAAGUGCAGAUCCA UGGAUCUGCACUUUCUUAUAGUCCC
154666F05 Plxnb1/MSS280068 CCGACUCUUGCACCUUGGAUGUUGA UCAACAUCCAAGGUGCAAGAGUCGG
154666F07 Prkca/MSS207659 UCCAAAUGGGCUUUCGGAUCCUUAU AUAAGGAUCCGAAAGCCCAUUUGGA
154666F09 Prkca/MSS207660 GGGAUGAAAUGUGACACCUGCGACA UGUCGCAGGUGUCACAUUUCAUCCC
154666F11 Prkca/MSS207661 GGGAUGUCAGAGAGCAUGCCUUCUU AAGAAGGCAUGCUCUCUGACAUCCC
154666G01 NM_011653.2_stealth_723 UAACCUAAACAGGUUGAUAGGUCAA UUGACCUAUCAACCUGUUUAGGUUA
154666G03 NM_011653.2_stealth_725 ACCUAAACAGGUUGAUAGGUCAAAU AUUUGACCUAUCAACCUGUUUAGGU
154666G05 NM_011653.2_stealth_726 CCUAAACAGGUUGAUAGGUCAAAUU AAUUUGACCUAUCAACCUGUUUAGG
154666G07 Vim/MSS238655 GCCAUCAACACUGAGUUCAAGAACA UGUUCUUGAACUCAGUGUUGAUGGC
154666G09 Vim/MSS238656 GGUGAUCAAUGAGACUUCUCAGCAU AUGCUGAGAAGUCUCAUUGAUCACC
154666G11 Vim/MSS278712 CACCUGUGAAGUGGAUGCCCUUAAA UUUAAGGGCAUCCACUUCACAGGUG
154666H01 Sh3glb2/MSS279238 CGGAGCAGCAGAGCGGGAUUUCAUU AAUGAAAUCCCGCUCUGCUGCUCCG
154666H03 Sh3glb2/MSS279239 CCAAAGCCACGACGGUGCCUGACUU AAGUCAGGCACCGUCGUGGCUUUGG
154666H05 Sh3glb2/MSS279240 ACUAGACCUCGUAAUUACAUUCUAU AUAGAAUGUAAUUACGAGGUCUAGU
154666H07 Slk/MSS209687 GGCUGUGGAUGAGCAUGCAAGUGAU AUCACUUGCAUGCUCAUCCACAGCC
154666H09 Slk/MSS209688 CCCUGUCUUAAUACCCAGUAUUAAU AUUAAUACUGGGUAUUAAGACAGGG
154666H11 Slk/MSS209689 UGUCCUUCUUCAAUUUCCGUAAGAU AUCUUACGGAAAUUGAAGAAGGACA
154667A01 Yes1/MSS212966 CCGAGAUCUCCGAGCUGCUAAUAUU AAUAUUAGCAGCUCGGAGAUCUCGG
154667A03 Yes1/MSS212968 CCUUUAAGAAGGGUGAACGAUUUCA UGAAAUCGUUCACCCUUCUUAAAGG
154667A05 Yes1/MSS279041 CAGGUAUGGUAAACCGUGAAGUAUU AAUACUUCACGGUUUACCAUACCUG
154667A07 Src/MSS238007 GCCCGGCUCAUAGAAGACAACGAAU AUUCGUUGUCUUCUAUGAGCCGGGC
154667A09 Src/MSS238008 UGGCCUAUGUGGAGCGGAUGAACUA UAGUUCAUCCGCUCCACAUAGGCCA

154667A11 Src/MSS238009 UCACUACCGUAUGUCCCACAUCCAA UUGGAUGUGGGACAUACGGUAGUGA
154667B01 Akap1/MSS201872 CAGGUCAAAGGUAGCAGCAAUACUU AAGUAUUGCUGCUACCUUUGACCUG
154667B03 Akap1/MSS201873 CCAACCCUAAGAAGGUUGACCUUAU AUAAGGUCAACCUUCUUAGGGUUGG
154667B05 Akap1/MSS201874 GCAGUGCUCAGAUCCUGUCAGUACU AGUACUGACAGGAUCUGAGCACUGC
154667B07 Aplp2/MSS202122 GGACAGGGUAAAGAAGGAAUGGGAA UUCCCAUUCCUUCUUUACCCUGUCC
154667B09 Aplp2/MSS202123 GGGAGGAUUUCAGUUUGAGCAGCAA UUGCUGCUCAAACUGAAAUCCUCCC
154667B11 Aplp2/MSS273224 CAAGUGUCUUGUGGGUGAAUUUGUA UACAAAUUCACCCACAAGACACUUG
154667C01 Stx1a/MSS277458 GCGAACAAAGUUCGCUCCAAGCUAA UUAGCUUGGAGCGAACUUUGUUCGC
154667C03 Stx1a/MSS277459 GGACCACGACCAGUGAGGAAUUGGA UCCAAUUCCUCACUGGUCGUGGUCC
154667C05 Stx1a/MSS277460 GGGAGAUGAUUGACAGGAUCGAGUA UACUCGAUCCUGUCAAUCAUCUCCC
154667C07 Unc119/MSS247961 CCGCAUGAUCGAGAGGCACUACUUU AAAGUAGUGCCUCUCGAUCAUGCGG
154667C09 Unc119/MSS247962 UCAGUGAGAUGAUUCGUCACCCGUA UACGGGUGACGAAUCAUCUCACUGA
154667C11 Unc119/MSS247963 UCUACAAGAUUGACUUCGUCAGGUU AACCUGACGAAGUCAAUCUUGUAGA
154667D01 Ctnnd1/MSS202667 GGGCACCCAGUAGACAAGAUGUCUA UAGACAUCUUGUCUACUGGGUGCCC
154667D03 Ctnnd1/MSS202668 GAAGCAGUGUGGACCUGCAUCGUUU AAACGAUGCAGGUCCACACUGCUUC
154667D05 Ctnnd1/MSS202669 CCCAGGAUCACAACCACCUUCUGUA UACAGAAGGUGGUUGUGAUCCUGGG
154667D07 Lgals1/MSS275330 GCAACAACCUGUGCCUACACUUCAA UUGAAGUGUAGGCACAGGUUGUUGC
154667D09 Lgals1/MSS275331 AGCUGCCAGACGGACAUGAAUUCAA UUGAAUUCAUGUCCGUCUGGCAGCU
154667D11 Lgals1/MSS275332 UGGUCGCCAGCAACCUGAAUCUCAA UUGAGAUUCAGGUUGCUGGCGACCA
154667E01 Vamp2/MSS278658 CCUCCAAACCUUACUAGUAACAGGA UCCUGUUACUAGUAAGGUUUGGAGG
154667E03 Vamp2/MSS278659 GGACCAGAAGUUGUCGGAGCUGGAU AUCCAGCUCCGACAACUUCUGGUCC
154667E05 Vamp2/MSS278660 UCAUCCUCAUCAUCAUCAUCGUUUA UAAACGAUGAUGAUGAUGAGGAUGA
154667E07 Myo9b/MSS237347 CCUCCUUCCUGAAGAGUAAAGGUAU AUACCUUUACUCUUCAGGAAGGAGG
154667E09 Myo9b/MSS237348 UGACUGAAGCCAACCUGCUGCAGAA UUCUGCAGCAGGUUGGCUUCAGUCA
154667E11 Myo9b/MSS237349 ACAGGCAGAACUACCAGAUUGGAAA UUUCCAAUCUGGUAGUUCUGCCUGU
154667F01 Pik3r1/MSS207624 CCAGCAGGAUCAAGUUGUCAAAGAA UUCUUUGACAACUUGAUCCUGCUGG
154667F03 Pik3r1/MSS276325 CCCACUACUGUAGCCAACAACAGCA UGCUGUUGUUGGCUACAGUAGUGGG
154667F05 Pik3r1/MSS276326 GAGACAUCUCAAGGGAAGAAGUGAA UUCACUUCUUCCCUUGAGAUGUCUC
154667F07 Actin_(Mouse) ACGUUGACAUCCGUAAAGACCUCUA UAGAGGUCUUUACGGAUGUCAACGU
154667F09 Srgap1/MSS202046 GAUCAUAGCCGAGUAUGAAAGUCAA UUGACUUUCAUACUCGGCUAUGAUC
154667F11 Srgap1/MSS202047 GACUGACCGCCAUUCUGAUAGCUAU AUAGCUAUCAGAAUGGCGGUCAGUC
154667G01 Srgap1/MSS202048 ACCAACGCCUCCGUGUUCAAGUAUU AAUACUUGAACACGGAGGCGUUGGU
154667G03 Actin_(Mouse).1 ACGUUGACAUCCGUAAAGACCUCUA UAGAGGUCUUUACGGAUGUCAACGU
154667G05 NM_007664_stealth_2727 CCAACAUUUCCAUCCUGCGUGUGAA UUCACACGCAGGAUGGAAAUGUUGG
154667G07 NM_007664_stealth_2097 CAGCCACUGUGUCUGUGACAGUUAU AUAACUGUCACAGACACAGUGGCUG
154667G09 NM_007664_stealth_1029 CAACCCUGACUGAGGAGCCUAUGAA UUCAUAGGCUCCUCAGUCAGGGUUG
154667G11 Srgap2/MSS204395 ACAUGAAGGUCUGGAUGCUAUUGAA UUCAAUAGCAUCCAGACCUUCAUGU
154667H01 Srgap2/MSS204396 UCACAAGUAGAAGUGAACGACAUAA UUAUGUCGUUCACUUCUACUUGUGA
154667H03 Srgap2/MSS274401 GAAGCACCAAGGACCAGCAAUUUAA UUAAAUUGCUGGUCCUUGGUGCUUC
154667H05 Srgap3/MSS281821 CCGUGAACUGUUGGUAUCUGGUACU AGUACCAGAUACCAACAGUUCACGG
154667H07 Srgap3/MSS281822 CACGAUGUCUCUGAUCUCAUCGAUU AAUCGAUGAGAUCAGAGACAUCGUG
154667H09 Srgap3/MSS281823 GAGAGCCAACCAGCAGGAAACAGAA UUCUGUUUCCUGCUGGUUGGCUCUC

154667H11 Clasp1/MSS293730 CGGCACAGUGUUGCCAAGUCUAAUA UAUUAGACUUGGCAACACUGUGCCG
154668D02 Clasp1/MSS293731 CACUAAGCAAGAUUGUGCCACAUAU AUAUGUGGCACAAUCUUGCUUAGUG
154668D04 Clasp1/MSS293732 CAGAACUUACUGAAGAGCCAAAGAA UUCUUUGGCUCUUCAGUAAGUUCUG
154668D06 Clasp2/MSS233612 CCCAAACGCCAAGCUUGAAGGUAAA UUUACCUUCAAGCUUGGCGUUUGGG
154668D08 Clasp2/MSS233613 UCUCAGUCAACUCACUGGUAGUAAA UUUACUACCAGUGAGUUGACUGAGA
154668D10 Clasp2/MSS233614 GGGUCUAAUACAGGGUUAUGAUAAU AUUAUCAUAACCCUGUAUUAGACCC
154668D12 Robo1/MSS208673 CAGCCAUGGUGAAUCGGAGUGGUUA UAACCACUCCGAUUCACCAUGGCUG
154668E02 Robo1/MSS208674 GGUGGACCAACAAUCUCAAUAUAUU AAUAUAUUGAGAUUGUUGGUCCACC
154668E04 Robo1/MSS208675 CAACGCAUCGCUGGAGGUAGCUAUA UAUAGCUACCUCCAGCGAUGCGUUG
154668E06 Robo2/MSS241004 CCACAUUUCUCAGGAGGCCAAUUAA UUAAUUGGCCUCCUGAGAAAUGUGG
154668E08 Robo2/MSS241005 CCCUGCAGAGCUCACUGUCUUUGAA UUCAAAGACAGUGAGCUCUGCAGGG
154668E10 Robo2/MSS282032 AGGCCCAACACAAUCUACUUGUUUA UAAACAAGUAGAUUGUGUUGGGCCU
154668E12 Wasf1/MSS234749 CCCUUACAGGGAUGAUGGUAAGGAA UUCCUUACCAUCAUCCCUGUAAGGG
154668F02 Wasf1/MSS234750 ACCCUGCCUGUAAUCAGUGACGCAA UUGCGUCACUGAUUACAGGCAGGGU
154668F04 Wasf1/MSS234751 CCCUGGCAAAUAUAAUUAGACAACU AGUUGUCUAAUUAUAUUUGCCAGGG
154668F06 Wasf2/MSS216650 CCUAGCGAUACAAGCGAGCUGGAAU AUUCCAGCUCGCUUGUAUCGCUAGG
154668F08 Wasf2/MSS216651 CCUCUUAACAAUCUCAGUCCUUACA UGUAAGGACUGAGAUUGUUAAGAGG
154668F10 Wasf2/MSS216652 GCAGGACACCAAGGAUAUCAUGAAA UUUCAUGAUAUCCUUGGUGUCCUGC
154668F12 Robo3/MSS276804 CCACAUGGAAUAGCUGGCUUAGGAA UUCCUAAGCCAGCUAUUCCAUGUGG
154668G02 Robo3/MSS276805 CCUGAUCCAGAUGAUAGAUACUACA UGUAGUAUCUAUCAUCUGGAUCAGG
154668G04 Robo3/MSS276806 CAAGCCUGUACAAAUGCCAUCUUUG CAAAGAUGGCAUUUGUACAGGCUUG
154668G06 Robo4/MSS232364 CCAGCCAAGAUGAGGUGCAGAUCAU AUGAUCUGCACCUCAUCUUGGCUGG
154668G08 Robo4/MSS232365 GCCAUAAUGGUGUCAUCCGUGGUUA UAACCACGGAUGACACCAUUAUGGC
154668G10 Robo4/MSS232366 GGUCUCAUGGUGGAAAGACGGGAAA UUUCCCGUCUUUCCACCAUGAGACC
154668G12 Wasf3/MSS217310 UCCCAACCCUGUUGCUGACAUUUAU AUAAAUGUCAGCAACAGGGUUGGGA
154668H02 Wasf3/MSS217311 GGCCACCAUCUUGUCUAGACGCAUU AAUGCGUCUAGACAAGAUGGUGGCC
154668H04 Wasf3/MSS217312 GCCAGGAGUGGAAUAUGAUGGCGUA UACGCCAUCAUAUUCCACUCCUGGC
154668H06 NM_001167745.1_stealth_448 CAAGAAAUGUGUGACUAUGUCUUCA UGAAGACAUAGUCACACAUUUCUUG
154668H08 NM_001167745.1_stealth_622 GCUAUACAAUAACUUUGUAUAUAAU AUUAUAUACAAAGUUAUUGUAUAGC
154668H10 NM_001167745.1_stealth_678 GAGAUACUUGUCAAGUAGCUCUUAA UUAAGAGCUACUUGACAAGUAUCUC
154668H12 Actin_(Mouse).2 ACGUUGACAUCCGUAAAGACCUCUA UAGAGGUCUUUACGGAUGUCAACGU
154669A02 Slit1/MSS209183 CCAGGUGUGAGUGCAUGCUAGGUUA UAACCUAGCAUGCACUCACACCUGG
154669A04 Slit1/MSS209184 CCAGGGCCAUGUCCGUGUUAGUUAU AUAACUAACACGGACAUGGCCCUGG
154669A06 Slit1/MSS209185 CCGCCUGGAGUUGAACGGUAUCAAA UUUGAUACCGUUCAACUCCAGGCGG
154669A08 NM_009515_stealth_206 UGGCUACCACAGUUGUUCAGCUCUA UAGAGCUGAACAACUGUGGUAGCCA
154669A10 NM_009515_stealth_734 CAACUGAUAAGAAACGCUCAGGGAA UUCCCUGAGCGUUUCUUAUCAGUUG
154669A12 NM_009515_stealth_1540 CAGAAGAGGAGUAGAGUCAUCCAUU AAUGGAUGACUCUACUCCUCUUCUG
154669B02 Slit2/MSS209186 CAUCACACUUCAGAUUGCCACAGAU AUCUGUGGCAAUCUGAAGUGUGAUG
154669B04 Slit2/MSS209187 CCGACUGGGUGAAGUCGGAAUAUAA UUAUAUUCCGACUUCACCCAGUCGG
154669B06 Slit2/MSS209188 CGCGUCUGGUGUGAAUGAAAUUCUU AAGAAUUUCAUUCACACCAGACGCG
154669B08 Slit3/MSS209189 ACUGUGACUGCAGUCUGCGUUGGUU AACCAACGCAGACUGCAGUCACAGU
154669B10 Slit3/MSS209190 UGGUGAUGCUAAACCAGACCCUGAA UUCAGGGUCUGGUUUAGCAUCACCA

154669B12 Slit3/MSS209191 GGCUCUGAGGAUUAUCGCAACAGAU AUCUGUUGCGAUAAUCCUCAGAGCC
154669C02 Sdc4/MSS238085 UCGGAUGACUUUGAGCUCUCGGGUU AACCCGAGAGCUCAAAGUCAUCCGA
154669C04 Sdc4/MSS238086 GAGAGUCGAUUCGAGAGACAGAGGU ACCUCUGUCUCUCGAAUCGACUCUC
154669C06 Sdc4/MSS238087 GGAACUGGAAGAGAAUGAGGUCAUU AAUGACCUCAUUCUCUUCCAGUUCC
154669C08 Abl1/MSS235748 ACCACUUGGUGAAGGUGGCUGAUUU AAAUCAGCCACCUUCACCAAGUGGU
154669C10 Abl1/MSS235749 UGACCUAUGGGAACCUGCUGGACUA UAGUCCAGCAGGUUCCCAUAGGUCA
154669C12 Abl1/MSS235750 GGAAUGGUGUGAAGCCCAAACGAAA UUUCGUUUGGGCUUCACACCAUUCC
154669D02 Cables1/MSS226994 UCCGACUGAACAGACGAGAACUGAU AUCAGUUCUCGUCUGUUCAGUCGGA
154669D04 Cables1/MSS226995 GGAGACUUUGUGGACUACGACCCAA UUGGGUCGUAGUCCACAAAGUCUCC
154669D06 Cables1/MSS226996 GGCCAUGAGCCUGAAGGAGAUCAUU AAUGAUCUCCUUCAGGCUCAUGGCC
154669D08 Cables2/MSS217424 UCCCUCAUAUCAAACUGACAUUGAG CUCAAUGUCAGUUUGAUAUGAGGGA
154669D10 Cables2/MSS217426 GCGUGUACUCAUCUUUGCUUCAUAC GUAUGAAGCAAAGAUGAGUACACGC
154669D12 Cables2/MSS281084 CAAAGAACAGCAGGAUUGUACUCAU AUGAGUACAAUCCUGCUGUUCUUUG

Rho GTPase signaling complexity in neurite outgrowth • Fusco et al.
JCB
TH
E J
OU
RN
AL
OF
CE
LL
BIO
LO
GY
S23
Supplemental material
Fusco et al., http ://www .jcb .org /cgi /content /full /jcb .201506018 /DC1
Figure S1. High-content live-cell imaging platform and RNAi pipeline. (a) Neurite outgrowth representative images of untransfected, phalloidin-stained versus Lifeact-GFP/NLS-mCherry transfected, unstained cells. Inverted black-and-white contrast is shown. Bar, 100 µm. (b) Total neurite outgrowth quantifi-cation of a. Images were segmented and quantified using the Metamorph neurite outgrowth plugin using phalloidin stainings (nontransfected cells) or the Lifeact-GFP signal (reporter-transfected cells). Population mean ± standard deviations are shown for 20% cells with highest total neurite outgrowth (n = 50 cells). t test was used. Ns, nonsignificant. (c) Schematic representation of transfection and cell differentiation during the siRNA screen. In brief, cells are seeded on day 1, transfected with siRNAs or reporter plasmids on day 2, differentiated by serum starvation on day 3, and replated on laminin-coated coverslips on day 4 for 20 h (time-lapse experiments) or 24 h (steady-state neurite outgrowth measurements). (d) Western blot and quantitative PCR quan-tification of Mkk7, RhoA, and SrGAP2 KD efficiencies. Mean ± standard deviations from at least three experiments are shown for quantitative PCR data. (e) Representative images of α-tubulin-stained Mkk7, RhoA, and SrGAP2 KD cells. Bar, 100 µm. (f) Total neurite outgrowth quantification of Mkk7, RhoA, and SrGAP2 KD experiments. Images were segmented and quantified using the Metamorph neurite outgrowth plugin. (g) Total neurite outgrowth quanti-fications of nontransfected cells, cells transfected with a nontargeting control siRNA with medium GC content, or Mkk7 siRNA. (f and g) Population mean ± standard deviation is shown for 20% cells with longest total neurite outgrowth are shown (n = 50 cells). One-way ANO VA with Bonferroni’s multiple comparison test was used. ***, P < 0.0001. (h) Schematics of field-of-view selection with appropriate cell numbers and fluorescence intensities. 3 h after replating of reporter- or siRNA-transfected cells, a Metamorph macro was used to comprehensively scan multiple fields of view of each well of the 24-well plate. On each field of view, cell somata were then automatically segmented, and their area and mean fluorescence intensity were computed. 10 fields of view with appropriate cell number and fluorescence intensities were then selected (represented by a dashed red outline). (i and j) Fluorescence intensity (i) and cell area (j) criteria used to select appropriate fields of view. Occurrence plots of fluorescence intensity (i) and cell area (j) values are shown. Fields of view containing cells with values denoted by multiple asterisks were selected.

JCB • 2016S24
Figure S2. Evaluation of the automatic soma and neurite segmentation and soma tracking. (a) Nucleus segmentation evaluation. The ability of our method to segment nuclei was evaluated using a set of three hand-annotated movies from the screen. A total of 790 cells were annotated and then compared with the corresponding automatic segmentation. The annotation is shown as a red area in the left panel, and the automatic segmentation is depicted by the blue area. The overlap between the two areas is considered correct (the gray bar in the right panel). False positives occur in areas where the detection is present but without an annotation (blue bar in the right panel). False negatives occur where the annotation is not covered by a detection (red in the right panel). (b) Soma segmentation evaluation. The ability of our method to segment somata was evaluated using a set of three hand-annotated movies from the screen. A total of 790 cells were annotated and then compared with the corresponding automatic segmentation. The annotation is shown as a red area in the left panel, and the automatic segmentation is depicted by the blue area. The overlap between the two areas is considered correct (the gray bar in the right panel). False positives occur in areas where the detection is present but without an annotation (blue bar in right panel). False negatives occur where the annotation is not covered by a detection (red in the right panel). (c) Tracking validation. The ability of our method to detect and identify cells over time was evaluated using a set of 20 hand-annotated movies from the screen. A total of 58,064 detections were annotated (gray bounding box surrounding the soma) if the cell was tracked for more than five frames. Automatic detections are color-coded according to the evaluation result: blue indicates correctly detected; red, false positive; orange, false negative; brown, the tracker covered multiple annotations; magenta, the annotation was covered by multiple trackers; and green, an error occurred in maintaining the identity of the annotation. In the right panel, the results show that 90.3% of annotated cells were correctly tracked. Videos of the 20 evaluation sequences appear in Video 4. Bar, 100 µm (a–c). (d–l) Segmentations for nine example cells. Raw images are shown in inverted black/white contrast. In each panel, the first image shows the neurites annotated by expert 1 in red. The shaded region denotes the area where a matching annotation is considered valid (tolerance 4.5 pixels = 9 μm). In the second image, the annotations recovered using our automatic algorithm are shown in cyan. The third image shows the neurite annotation from a second expert. Bars: (d–f) 30 µm; (g–i) 20 µm; (j–l) 50 µm. (m) Bar graph demonstrating the ability of the algorithm to recover segmentations provided by annotator 1. (n) Bar graph showing the disagreement between annotator 1 and annotator 2 on the same set of cells. The level of disagreement between the two annotators is similar to that between the automatic method and annotator 1.
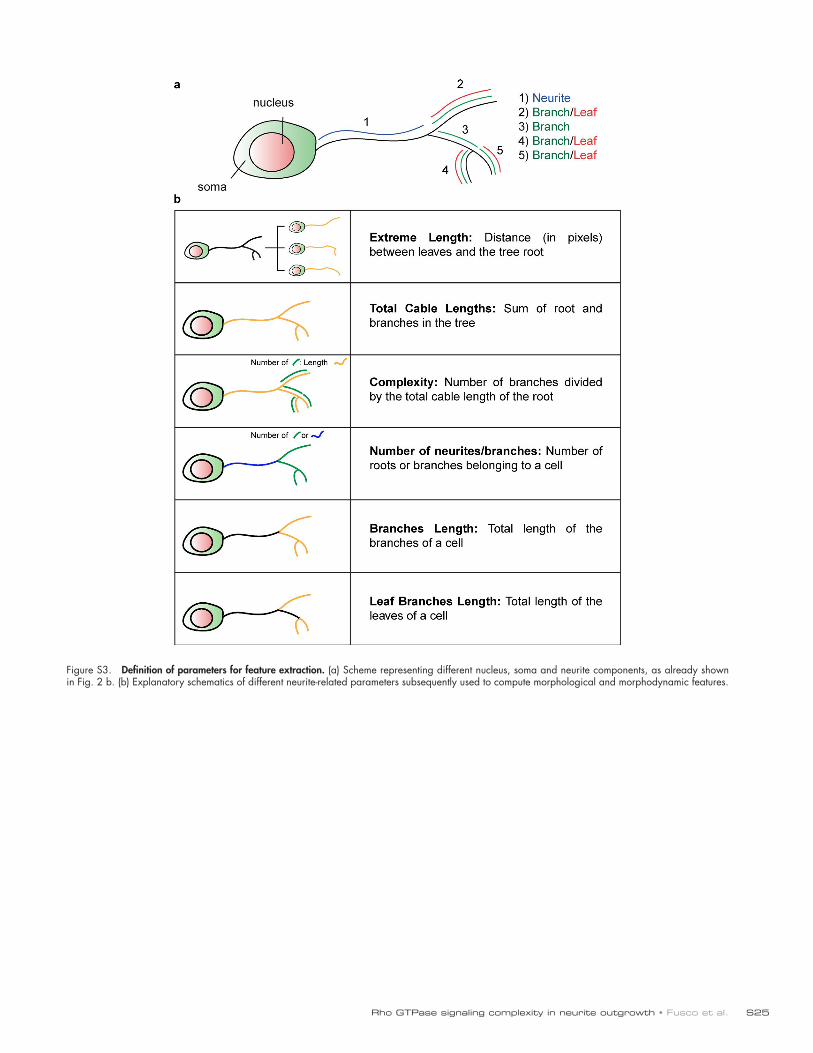
Rho GTPase signaling complexity in neurite outgrowth • Fusco et al. S25
Figure S3. Definition of parameters for feature extraction. (a) Scheme representing different nucleus, soma and neurite components, as already shown in Fig. 2 b. (b) Explanatory schematics of different neurite-related parameters subsequently used to compute morphological and morphodynamic features.

JCB • 2016S26
Figure S4. PC-12 cell neuronal differentiation tracking and segmentation and hierarchical clustering of MDSs using the HS feature sets. (a) Schematics of PC-12 Lifeact-GFP channel with superimposed nucleus, soma, and neurite segmentations color-coded according to cell identity. Bar, 100 µm. (b) Example of segmentation of two cells (from insets 1 and 2, shown in panel a). Nucleus, soma, and neurite segmentations are color-coded for cell identity. Time, h:min. Bar, 50 µm. (c) Temporal evolution of a set of features for the two cells shown in panel b. (d) Hierarchical clustering of MDSs using the HS feature set. Phenotypic clusters and representative images were extracted as described in Fig. 6.

Rho GTPase signaling complexity in neurite outgrowth • Fusco et al. S27
Figure S5. Summary of workflow and statistics of the RNAi screen.
Video 1. Raw movies of Lifeact-GFP/NLS-mCherry channels in N1E-115 cells. Time-lapse video of N1E-115 cells cotrans-fected with control siRNA and Lifeact-GFP/NLS-mCherry is shown in inverted black-and-white contrast. Left: Lifeact-GFP channel; right: NLS-mCherry channel. Time scale is in h:min. Bar, 100 µm.
Video 2. Dynamic visualization of different steps of the computer vision pipeline. Different steps of the computer vision pipeline. From top left to bottom right: Lifeact-GFP channel, NLS-mCherry channel, detected nuclei marked in red, soma segmentation by region growing, cell identification over time using graph-based tracking, neurite-like structures detected using Hessian-based filter, calibrated likelihood of cell bodies, cell body segmentations after thresholding, backtracing neurite structures from candidate terminals, and final HDS-model graph representation. Bar, 100 µm.
Video 3. Nuclei and somata segmentation evaluation. The ability of our method to segment nuclei and somata was evaluated using a set of three hand-annotated movies from the screen. A total of 790 cells were annotated and then compared with the corresponding automatic segmentation. The annotation is shown as a red area, and the automatic segmentation is depicted by the blue area. Quantifications of correct detections, false positives, and false negatives are shown in Fig. S2.

JCB • 2016S28
Video 4. Soma detection and tracking validation. The ability of our method to detect and identify cells over time was evalu-ated using a series of 20 hand-annotated movies from the screen. A total of 58,064 hand annotations appear as gray boxes surrounding the soma. Results of the automatic detection and tracking are color coded according to the result: blue, correctly detected; red, false positive; orange, false negative; brown, the tracker covered multiple annotations; magenta, the annotation was covered by multiple trackers; green, an error occurred in maintaining the identity of the annotation.
Video 5. HDS-modeled graph representations of five global phenotypical classes. HDS-modeled graph representations time-lapse video of the five phenotypical classes extracted from Fig. 6 is shown in inverted black-and-white contrast. From top left to bottom right: control siRNA, short neurite phenotype, spread soma/multiple and/or branched short neurites phenotype, long and unbranched neurite phenotype, and long and branched neurite phenotype. Bar, 100 µm.
Video 6. HDS-modeled graph representations of MDSs of dynamic short neurite phenotypes in the LS map. HDS-modeled graph representations time-lapse video of the short neurite phenotypes extracted from Fig. 6 is shown in contrast. Left: control siRNA; middle: short neurite with low neurite dynamic phenotype (cluster 1); left: short neurite with normal neurite dynamic phenotype (cluster 3). Bar, 100 µm.
Video 7. HDS-modeled graph representations of MDSs of dynamic long and branched neurite phenotypes in the LS map. HDS-modeled graph representations time-lapse video of the dynamic long and branched neurite phenotypes extracted from Fig. 6 is shown in inverted black-and-white contrast. Left: control siRNA; middle: long and branched neurite with normal neurite dynamic phenotype (cluster 18); left: long and branched neurite with high neurite dynamic phenotype (cluster 19). Bar, 100 µm.
Video 8. RhoA activation dynamics in advancing and collapsing growth cone in N1E-115 cells. RhoA activation (ratio images) and Lifeact-mCherry (F-actin) were acquired by time-lapse epifluorescence microcopy using a Nikon Eclipse Ti microscope at one frame every 1 min. Movie plays at 5 fps. Bar, 10 µm. Time scale, min:s. Movie corresponds to Fig. 8 (a and b).
Video 9. High-resolution time-lapse imaging of Dlc1 and p190RhoGAP KD growth cones in N1E-115 cells. Lifeact-mCherry (F-actin) was acquired by time-lapse epifluorescence microcopy using a Nikon Eclipse Ti microscope at one frame every 5 s. Movie plays at 2 fps. Bar, 5 µm. Time scale, min:s.
Provided online is Table S1, which is a description of all siRNAs in the RNAi library.