computer automated radioactive particle tracking … automated radioactive particle tracking (carpt)...
TRANSCRIPT

Computer Automated Radioactive Particle Tracking (CARPT) and Gamma Ray Computed Tomography (CT) for Opaque Multiphase Flows
NERL-DOE Workshop on Multiphase Flow ResearchMorgantown, WV, June 6-7, 2006
Power Point Presentation with Notes
Being unable to attend this important workshop, I would like to share with attendees some of my thoughts and suggestions via this presentation.
Understanding multiphase flows on all scales, from nano to very large equipment scale, and being able to model them quantitatively is essential for a myriad of technologies, including generation of liquid fuels and energy from novel sources. While both accurate experimentation and mathematical models are needed on all scales and for all types of flows (e.g., gas-solid, gas-liquid, liquid solid, gas-liquid-solid, gas-liquid-liquid-solid, etc) I will focus here on a subset of problems that deal with quantification of fluid dynamics in multiphase reactor systems. This requires the development of codes that can effectively handle large systems of complex geometry, the improved understanding and better physical models of inter-phase interaction and turbulence, and the experimental validation of these codes.
In our Chemical Reaction Engineering Laboratory (CREL) at Washington University (WUSTL) we have developed and implemented two unique facilities for determination of velocity and holdup (volume fraction) fields in opaque systems of large volume fraction of dispersed phase. Our Computer Automated Radioactive Particle Tracking (CARPT) and Gamma Ray Computed Tomography (CT) have been used successfully to map bubble columns, stirred tanks, fluidized beds, etc.
The enclosed power point slides and notes (please read the document in Notes format) illustrate some of the successful uses of these techniques and continued remaining challenges for which we hope to attract collaborators from the workshop attendees.
Please see our last slide 33 for areas in which we seek partners for collaboration

Computer Automated Radioactive Particle Tracking (CARPT) and Gamma Ray Computed Tomography (CT)
for Opaque Multiphase Flows
M. P. DudukovicChemical Reaction Engineering Laboratory (CREL)
Washington University, St. Louis, MO 63130 – 4899, USAhttp://crelonweb.che.wustl.edu
NETL Workshop on Multiphase Flow ResearchMorgantown, WV, June 6-7, 2006
Importance of multiphase reactors and flowsFlow pattern and phase distribution determination - Conventional tracer technique and densitometry- Particle tracking and tomography- Computational fluid dynamics (CFD)Improved engineering modelsConclusions
S
S1
G
G
G
G
L
S
L
L
L
S
G
G L+S
G
G
L
L
G
G
S
S
G
G
L
Outline
Chaouki, Larachi, Dudukovic, I & EC Res., 36(11), 4476-4503 (1997)Dudukovic, Mills, Larachi, Catalysis Reviews, 44(1), 123-246 (2002) S1
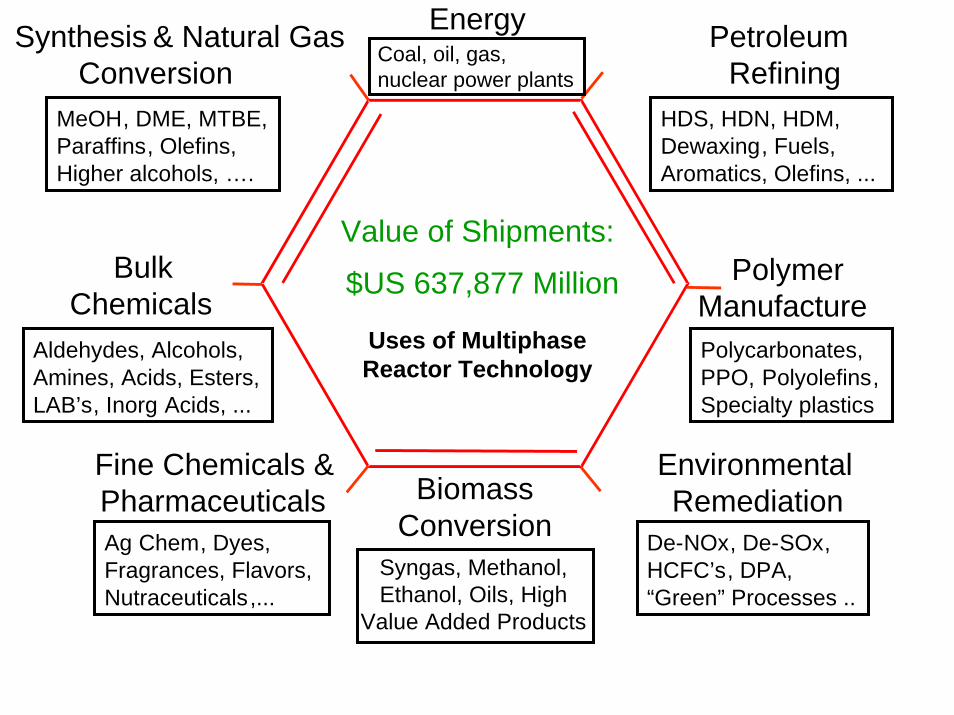
Petroleum Refining
PolymerManufacture
EnvironmentalRemediation
Synthesis & Natural Gas Conversion
BulkChemicals
Fine Chemicals &Pharmaceuticals
HDS, HDN, HDM,Dewaxing, Fuels,Aromatics, Olefins, ...
MeOH, DME, MTBE,Paraffins, Olefins,Higher alcohols, ….
Aldehydes, Alcohols,Amines, Acids, Esters,LAB’s, Inorg Acids, ...
Ag Chem, Dyes,Fragrances, Flavors,Nutraceuticals,...
Polycarbonates,PPO, Polyolefins,Specialty plastics
De-NOx, De-SOx,HCFC’s, DPA,“Green” Processes ..
Value of Shipments:
$US 637,877 Million
Uses of Multiphase Reactor Technology
BiomassConversion
Syngas, Methanol, Ethanol, Oils, High
Value Added Products
EnergyCoal, oil, gas, nuclear power plants

ADVANCES IN MULTIPHASE REACTORS REQUIRE:Flow Mapping and Modeling of Opaque Multiphase Systems
S3
G
G
S
S
G
G
LS
G
G
G
G L+S
G
G
L
L
Dudukovic, AICHE Symposium Ser., 321, 30-50 (1999)
Dudukovic, Larachi, Mills, Catalysis Reviews (2002), 44(1), 123-246
REACTOR SCALE MODELS FOR CONTACTING OF TWO MOVING PHASESIdeal Reactor Concepts:
A) Plug Flow (PFR)
B) Stirred Tank (CSTR)U1
U2
K1
2C) Axial Dispersion Model
D) Need More Accurate Flow & Mixing Description ViaPhenomenological models based on: 1) CFD Models (Euler-Euler Formulation)2) Experimental Validation: Holdup Distribution and Velocity Field
U1
U2K
1
2

Photons of Visible light fail to pass through opaque objects
Transparent
OpaqueVisible light Photons
Visible light Photons
Gamma Ray Photons
Eye
Eye
Gamma Ray detector
High energy gamma ray can pass through opaque objects
This concept is used:
•To determine chordal densities via gamma ray densitometry and
global flow patterns (RTD) by radioactive tracer studies
•To quantify phase distributions with the aid of Computer Tomography
•To monitor the motion of a single radioactive particle which mimics
the density and flow behavior of a particular phase in order to obtain
velocity fields and mixing patterns
S4

Radioactive Techniques in Reactor Model Development
t
2σ
Reactor
Input
Response
reactor Source Detector
t
Tracer impulse response
Mean holdup
2σ Dispersion coefficient
Match dispersion model or CSTR in series model or some other compartmental model to observed response
Line averaged holdup
Gamma Ray Densitometry
From a number of line measurements obtain an approximate assessment of density and phase holdup distribution
Classic Methods for trouble shooting and “blackbox” model development
Modern methods for CFD validation and flow and mixing model development.
Tomography and single particle tracking.S5

S2 CHEMICAL REACTION ENGINEERING LABORATORY
Single source CT is a technique for measurement of the cross-sectional density distribution of two phase flow by measuring the attenuation distribution in two phase systems ( e.g. G-L, …).
Computed Tomography (CT)
∑=−=l
ijij,eff0
l)(IIlnA ρμ
Experimental Result
∑=K
ij,Kij,Kij,eff )()( ερμρμ
S6
Kumar (1994), Kumar et al., (1995)
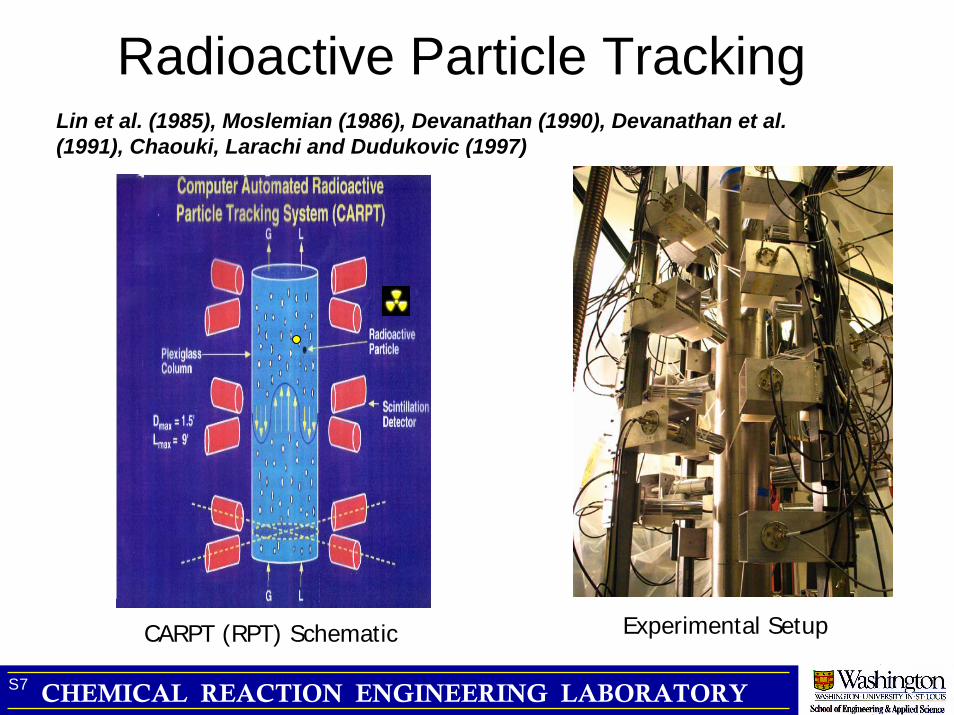
Radioactive Particle Tracking
CARPT (RPT) Schematic Experimental Setup
Lin et al. (1985), Moslemian (1986), Devanathan (1990), Devanathan et al. (1991), Chaouki, Larachi and Dudukovic (1997)
CHEMICAL REACTION ENGINEERING LABORATORYS7

Computer Automated Radioactive Particle Tracking (CARPT)Computer Automated Radioactive Particle Tracking (CARPT)
1.In-situ calibration 2. Particle Tracking
The tracer particle Lagrangian trajectory
embedded in 0.5 to 2.3 mm
Counts from Detectors (t)+
Distance - Count Map
Instantaneous Positions(x, y, z, t)
Filtered Instantaneous Positions (x, y, z, t)
Instantaneous Velocities (x, y, z, t)
Mean Velocities(x, y, z)
Fluctuating Velocities(x, y, z, t)
Regression / Monte-Carlo Search
Filter
Time-Difference Between Successive Locations
Ensemble (Time) Average
Turbulent Parameters, Reynolds Stresses,
TKE, Eddy diffusivities, etc.
S8
Moslemian (1986);Devanathan (1990); Degaleesan ( 1996);Chaouki, Larachi, Dudukovic (1997);

Particle tracking in multiphase systems
S2 CHEMICAL REACTION ENGINEERING LABORATORYS9

Example of information gained from particle tracking
Portion of Particle Lagrangian Trajectory from CARPT in a 6” Bubble Column
Radial position, cm
(UG = 12 cm/s)(UG = 2.4 cm/s)
Ensemble Averaged Velocity Vectors
S10
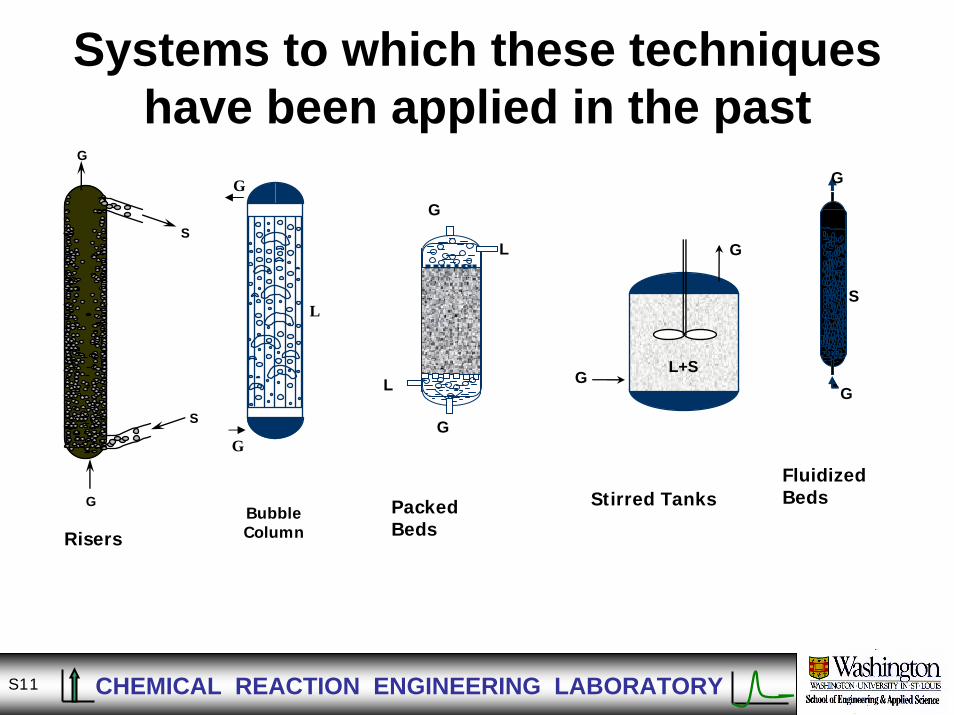
Systems to which these techniques have been applied in the past
G
G
L
L
G
G
S
S
S
G
GG
G
L
G
G L+S
Bubble Column
Packed BedsRisers
Stirred TanksFluidized Beds
S2 CHEMICAL REACTION ENGINEERING LABORATORYS11
CHEMICAL REACTION ENGINEERING LABORATORYS12

Bubble Column ExampleCARPT-CT and other measurements are used to develop an appropriate phenomenological reactor flow and mixing model. CFD generated data are used to assess model parameters at pilot plant or plant conditions. Reactor flow and mixing model are coupled with the kinetic information.Degaleesan et al., Chem. Eng. Sci., 51, 1967(1996); I&EC Research, 36,4670 (1997); Gupta et al., Chem. Eng. Sci., 56, 1117 (2001)
Dzz
Drr
uz(r)
1-εL(r)
0-R R
CT CT SCAN
CARPT
FLOWPATTERN
CFD + CARPT + CT
AFDU
0 100 200 300 400
1
0.8
0.6
0.4
0.20
Detector Level 1
0 100 200 300 400
1
0.8
0.6
0.4
0.20
Detector Level 6
Run 14.6
0.0
0.2
0.4
0.6
0.8
1.0
0 20 40 60 80 100
Time (sec)
Norm
aliz
ed R
espo
nse
Sim_L1Exp_L1Sim_L4Exp_L4Sim_L7Exp_L7
Pressure = 50 atmTemperature =250 Deg. CUg = 25 cm/s
0 20 40 60 80 100
1
0.8
0.6
0.4
0.20
7
6
5
4
3
2
1
Liquid Tracer
Gas TracerGas
Gas
DET.
Data
ModelPrediction
time (s)
time (s)
time (s)
S13

Ensemble Averaged Equations for TwoEnsemble Averaged Equations for Two--Phase FlowPhase Flow
( ) 0=ε+∂ε∂
ccc .t
u∇ ( ) 0=ε+∂ε∂
ddd .t
u∇
( ) ( ) ( )bccccvmdccccc
ccc p
tσ∇.σ∇.∇.∇ ε+ε++−ε−ερ=⎟
⎠
⎞⎜⎝
⎛ +∂
∂ερ MMguuu ( )vmdddddd
ddd p
tMMguuu
++ε−ερ=⎟⎠
⎞⎜⎝
⎛ +∂
∂ερ ∇.∇
Liquid Phase Gas Phase
CLOSURESCLOSURES
⎟⎠
⎞⎜⎝
⎛ −εε=Dt
DDt
DC dc
vmdcvmuuM
21
InterInter--Phase Momentum ExchangePhase Momentum Exchange StressesStresses
)(O.C ddvm23231 ε+ε+=
;d
6d3
p
dcd FM
πεε
=
( )dcdcD2pcd Cd
81 uuuuF −−πρ=
( ) ⎥⎦⎤
⎢⎣⎡
++=
438150124 6870
EoEof,Re.
RemaxC .
D
2
23
79
671867171
⎭⎬⎫
⎩⎨⎧
εε+
=c
c
..f
( ) )(O; ddc
*c
c*cc ε+ε+=
μμ
+μ=251T
cuu ∇∇σ
'u'u cccbc ρ−=σ
( ) dcpdbtbc
tbc
bc dk; uuuu T
c −ε=ν+νρ= ∇∇σ
)ttanConsEmpirical(2.1k b =
τρ≡≡ 2pcdgNumberEotvosEo
cdcpcdNumberynoldsReBubbleRe μ−ρ≡≡ uu
Input Parameter : Bubble Size, dp
S52S2 CHEMICAL REACTION ENGINEERING LABORATORYS14

S2 CHEMICAL REACTION ENGINEERING LABORATORY
Two-Fluid CFD of 3D Bubble Columns Using FLUENT
Sanyal et al., Chem. Eng. Sci., 55, 5071 (1999)
-40
-30
-20
-10
0
10
20
30
40
50
0 0.2 0.4 0.6 0.8 1
Dimensionless Radius
Axia
l Liq
uid
Velo
city
, cm
/s
CARPT DataTwo-FluidASMM
0
0.05
0.1
0.15
0.2
0.25
0.3
0.35
0.4
0.45
0 0.2 0.4 0.6 0.8 1Dimensionless Radius
Gas
Hol
dup
CT DataTwo-FluidASMM
S15
Multiphase k-εImplementation of Breakup and Coalescence Models ; Chen (2004)
19 cm – ID12 cm/s
1.00 0.95 0.90 0.85 0.80 0.75 0.70 0.65 0.60 0.55 0.50 0.45 0.40 0.35 0.30 0.25 0.20 0.15 0.10 0.05 0.00
(a) (b) (c) (d) (e)
-60.0
-40.0
-20.0
0.0
20.0
40.0
60.0
0.0 0.1 0.2 0.3 0.4 0.5 0.6 0.7 0.8 0.9 1.0
Dimensionless Radius
Tim
e-av
erag
ed L
iqui
d A
xial
Vel
ocity
, cm
/s
CARPTTwo-fluidASMM, DVASMM, SV
0.00
0.05
0.10
0.15
0.20
0.25
0.30
0.0 0.1 0.2 0.3 0.4 0.5 0.6 0.7 0.8 0.9 1.0
Dimensionless Radius
Tim
e-av
erag
ed H
oldu
p
CTTwo-fluidASMM, DVASMM, SV
44 cm – IDUg = 10 cm/s
Ug, cm/s 10 14 30 30 30P, Bar 1 1 1 4 10

S2 CHEMICAL REACTION ENGINEERING LABORATORYS16
Time Evolution of the Gas Tracer Time Evolution of the Gas Tracer ConcentrationConcentration
D = 14D = 14--cm; cm; UUgg = 2.4 cm/s= 2.4 cm/s
Time Evolution of the Liquid Tracer Time Evolution of the Liquid Tracer ConcentrationConcentration
D = 14D = 14--cm; cm; UUgg = 2.4 cm/s= 2.4 cm/s
Time,Time,secsec 22 44 66 99 191900 Time,Time,
secsec 11 22 33 55 7700

S2 CHEMICAL REACTION ENGINEERING LABORATORY
COMPARISON OF COMPUTED (CFDLIB) AND MEASURED COMPARISON OF COMPUTED (CFDLIB) AND MEASURED DDzzzz
Dzz
(cm
2/s
)
τ (sec)
Ug = 12 cm/sDc = 8”
S17
Dzz
(cm
2/s
)
τ (sec)
Ug = 10 cm/sDc = 18”

Radioactive Particle Tracking (CARPT) Provides Solids
Velocity and Mixing Information
High Pressure Side(80-100 psi)
Low Pressure Side( <80 psi)
HOPPER
R
I
S
E
R
EDUCTOR
Computer Tomography (CT)Provides Solids Density Distribution
S18
WATER TANK
PUMP
RECYCLE LINE
6′11"
6′′
PP
P
P
9′11"
Cold Flow Model
Tracer Studies Confirm Liquid In Plug Flow (N > 20)
(Devanathan, 1990; Kumar, 1994; Roy, 2000)
0.2to1.025,20,155.25.2 3 ==== LSscmLcmgmmd pp ρ
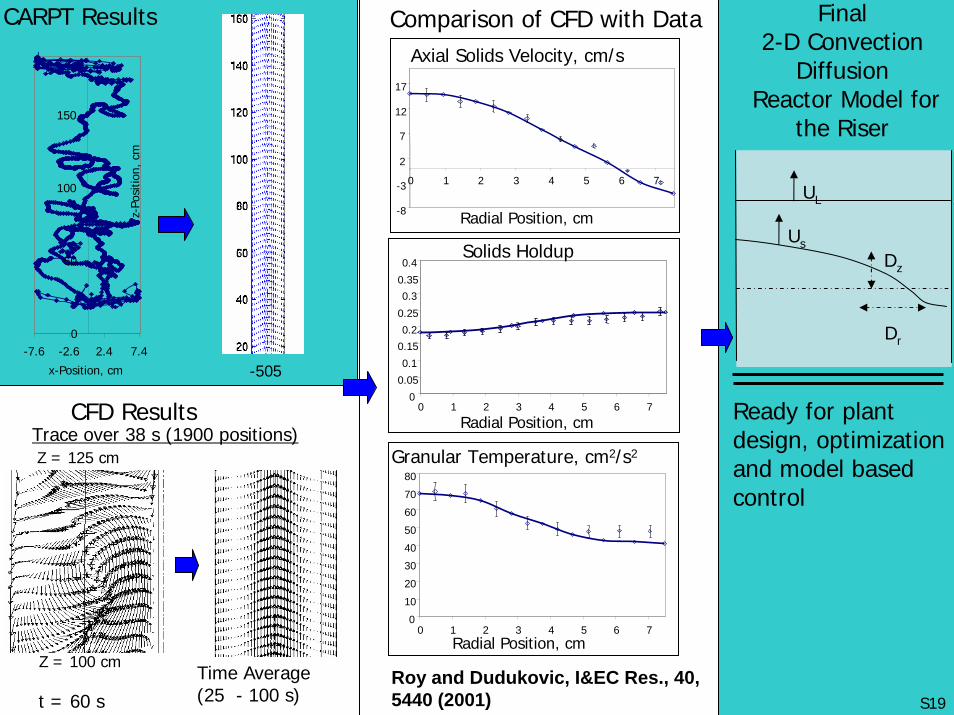
Trace over 38 s (1900 positions)
CARPT Results
-505
t = 60 sTime Average(25 - 100 s)
Z = 100 cm
Z = 125 cm
0
50
100
150
-7.6 -2.6 2.4 7.4
x-Position, cm
z-Po
sitio
n, c
m
-8
-3
2
7
12
17
0 1 2 3 4 5 6 7
Radial Position, cm
Axial Solids Velocity, cm/s
0
0.05
0.1
0.150.2
0.25
0.30.35
0.4
0 1 2 3 4 5 6 7
Radial Position, cm
Solids Holdup
0
10
20
30
40
50
60
70
80
0 1 2 3 4 5 6 7Radial Position, cm
Granular Temperature, cm2/s2
CFD Results
Comparison of CFD with Data
Ready for plant design, optimization and model based control
Final2-D Convection
DiffusionReactor Model for
the Riser
UL
Us
Dz
Dr
S19
Roy and Dudukovic, I&EC Res., 40, 5440 (2001)

CHEMICAL REACTION ENGINEERING LABORATORY
Circulating Fluid Bed (CFB) Reactor
Maleic Anhydride
Inert Gas
Air
Off-gas (COx, H2O,..)
ButaneFeed GasReoxidized
Catalyst
ReducedCatalyst
O2 O2V+3 V+4 V+5
HC HC
RiserRiser
Regen Riser
Catalyst Catalyst RedoxRedox
O OO
O2
Main ReactionMain Reaction
SolidsFlow
Direction
V+5
S20

GAS-SOLID RISER Gas-Solid Riser
Gas-Liquid or Liquid Fluidized Bed CARPT Detectors on Gas-Solid Riser
S21CHEMICAL REACTION ENGINEERING LABORATORY

OVERALL SOLIDS FLUX - TIME-OF-FLIGHT MEASUREMENTS
H= 2.2 m
Downcomer
Detectors to get RTD’s of the sections in the loop
ΔH = 40 cm
Solid flux from the hopper
Scintillation detectors
Sc-46 radioactive particle ( 150 μm , 2.55 g.cc-3 )
• Solids Mass Flux (Gs) in the downcomer is :
[ ] sssA A
sssss
s dAdAA
G ενρενενρ⋅⋅≈+⋅= ∫ ∫ ''
tHv s
Δ= t average time of flight obtained for number of particle visits
• Mean velocity can be calculated as
59.0=sε
Radial Solids Hold Profile (Downcomer)
0.4
0.5
0.6
0.7
0.8
0.9
-1 -0.5 0 0.5 1Dimensionless Radius
Solid
s ho
ld u
p
CHEMICAL REACTION ENGINEERING LABORATORYS22
CHEMICAL REACTION ENGINEERING LABORATORY
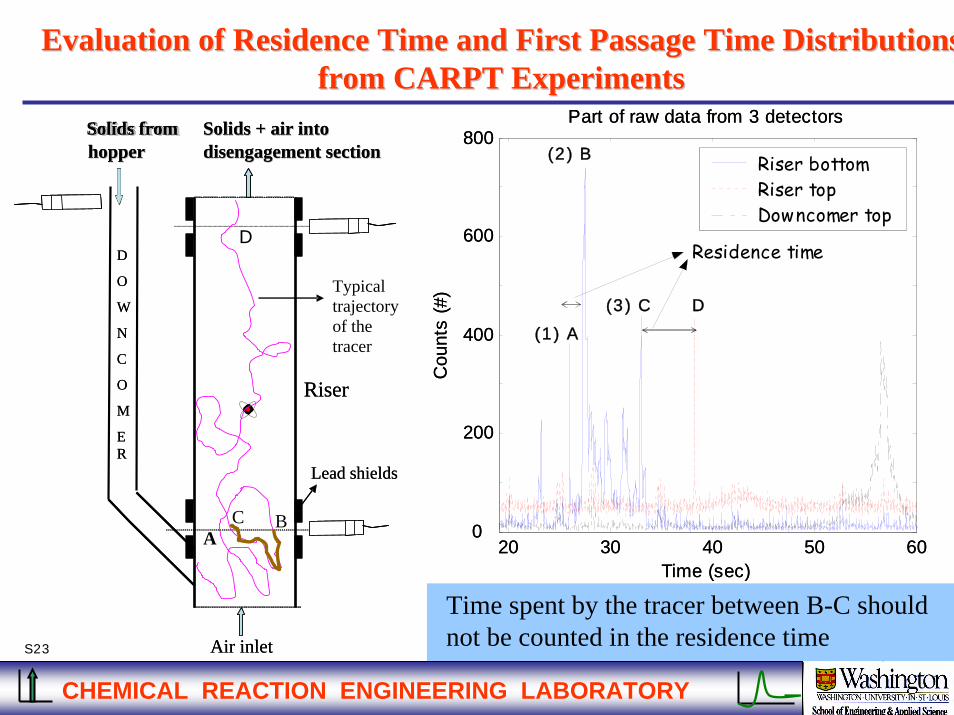
Evaluation of Residence Time and First Passage Time DistributionEvaluation of Residence Time and First Passage Time Distributionssfrom CARPT Experimentsfrom CARPT Experiments
Time spent by the tracer between B-C should not be counted in the residence time
20 30 40 50 600
200
400
600
800
Time (sec)
Cou
nts
(#)
Part of raw data from 3 detectors
Riser bottomRiser topDowncomer top
(1 ) A
(2 ) B
(3 ) C D
Residence time
20 30 40 50 600
200
400
600
800
Time (sec)
Cou
nts
(#)
Part of raw data from 3 detectors
Riser bottomRiser topDowncomer top
(1 ) A
(2 ) B
(3 ) C D
Residence time
Solids from Solids from hopperhopper
Air inlet
Riser
Solids + air into Solids + air into disengagement sectiondisengagement section
D
O
W
N
C
O
M
ER
Lead shields
Solids from Solids from hopperhopper
Air inlet
Riser
Solids + air into Solids + air into disengagement sectiondisengagement section
D
O
W
N
C
O
M
ER
Lead shields
Typical trajectory of the tracer
BCA
D
S23

Solids RTD & FPTD Results Solids RTD & FPTD Results –– Dilute Phase Transport RegimeDilute Phase Transport Regime
CHEMICAL REACTION ENGINEERING LABORATORY
1.55 1.56 1.57 1.58 1.59 1.6
x 104
0
250
500
750
1000
1250
1500Part of the RTD rawcount data at Ug(riser) =4.5 m/s, Gs = 36.8 kg/m2/s
Time (sec)
Det.1 -Riser topDet.2 - Riser bottomDet.3 - Downcomer top
1.69 sec
248.52 sec
Very long solids internal recirculation
0 1 2 4 50
0.05
0.1
0.14Solids RTD with "open" system analysis
θ ( τ = 17 )0
0.5
1
F- C
urve
0
0.2
0.3
()
0 1 2 3 4 50
0.5
1Solids FPTD with "closed" system analysis
θ ( τ = 10 )
F-C
urve
Mean of FPTD = 10 secStdev of FPTD = 41.2 sec
Mean of RTD = 17 sec Stdev of RTD = 42.3 sec
sec
sec
σ2 = 6.2, Dz = 4 m2.s-1
σ2 = 17, Dz = 7.3 m2.s-1
Co
un
ts
E(θ
)f(
θ)
Ugriser = 3.2 m.s-1 ; Gs = 33.7 kg.m-2.s-1; dp = 150 μm; ρp = 2,550 kg/m3
S24 Bhusarapu (2004)
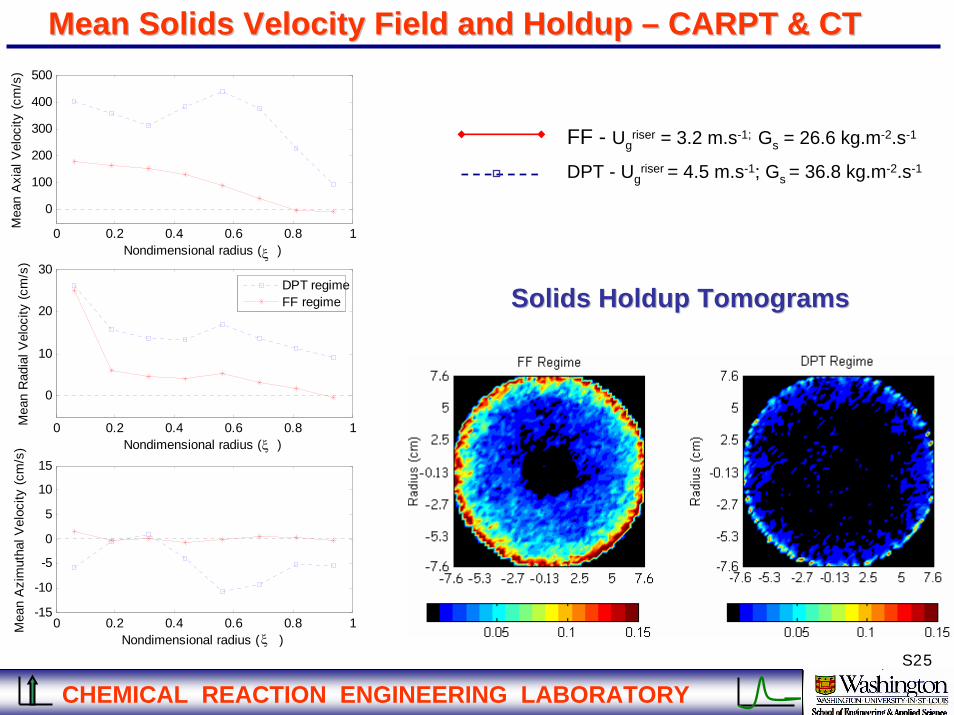
Mean Solids Velocity Field and Holdup Mean Solids Velocity Field and Holdup –– CARPT & CTCARPT & CT
CHEMICAL REACTION ENGINEERING LABORATORY
FF - Ugriser = 3.2 m.s-1; Gs = 26.6 kg.m-2.s-1
DPT - Ugriser = 4.5 m.s-1; Gs = 36.8 kg.m-2.s-1
0 0.2 0.4 0.6 0.8 1
0
100
200
300
400
500
Nondimensional radius ( )
Mea
n A
xial
Vel
ocity
(cm
/s)
0 0.2 0.4 0.6 0.8 1
0
10
20
30
Nondimensional radius ( )
Mea
n R
adia
l Vel
ocity
(cm
/s)
0 0.2 0.4 0.6 0.8 1-15
-10
-5
0
5
10
15
Nondimensional radius ( )
Mea
n A
zim
utha
l Vel
ocity
(cm
/s)
ξ
ξ
ξ
DPT regimeFF regime Solids Holdup TomogramsSolids Holdup Tomograms
S25
CHEMICAL REACTION ENGINEERING LABORATORY
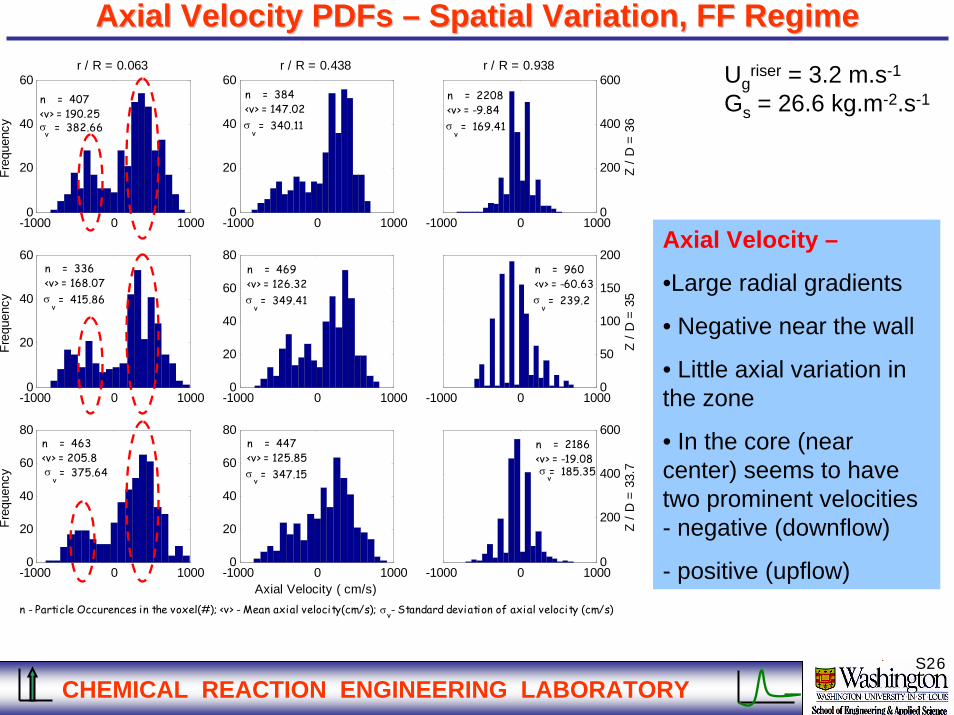
Axial Velocity Axial Velocity PDFsPDFs –– Spatial Variation, FF RegimeSpatial Variation, FF Regime
-1000 0 10000
20
40
60r / R = 0.063
Freq
uenc
y
-1000 0 10000
20
40
60r / R = 0.438
-1000 0 10000
200
400
600r / R = 0.938
Z / D
= 3
6
-1000 0 10000
20
40
60
Freq
uenc
y
-1000 0 10000
20
40
60
80
-1000 0 10000
50
100
150
200
Z / D
= 3
5
-1000 0 10000
20
40
60
80
Freq
uenc
y
-1000 0 10000
20
40
60
80
Axial Velocity ( cm/s)-1000 0 1000
0
200
400
600
Z / D
= 3
3.7
n = 407<v> = 190.25 = 382.66
v σ
n = 384<v> = 147.02
= 340.11 σ v
n = 2208<v> = -9.84
= 169.41 σ v
n = 336<v> = 168.07
= 415.86 σ v
n = 469<v> = 126.32
= 349.41 σ v
n = 960<v> = -60.63
= 239.2 σ v
n = 463<v> = 205.8 = 375.64 σ
v
n = 447<v> = 125.85
= 347.15 σ v
n = 2186<v> = -19.08σ
v = 185.35
n - Particle Occurences in the voxel(#); <v> - Mean axial velocity(cm/s); - Standard deviation of axial velocity (cm/s) σ v
Axial Velocity –
•Large radial gradients
• Negative near the wall
• Little axial variation in the zone
• In the core (near center) seems to have two prominent velocities - negative (downflow)
- positive (upflow)
Ugriser = 3.2 m.s-1
Gs = 26.6 kg.m-2.s-1
S26

Motor
Detector
Calibration Rod
Radioactive Particle
Particle trajectories Azimuthally Averaged Velocity vector plot :
zr V,V
Plane including baffles
Plane including baffleszr VV x
Single phase flow in STR : Single phase flow in STR :
results at a glanceresults at a glance
Plane at bottom of the tank
θV,Vr
Disc
Blades
BafflesRammohan et al., Chem. Eng. Research & Design (2001), 79(18), 831-844.S27

HT=D T
DT=200mm
DT/3
DT/10
Gas Jets from
Sparger with 8 holes
Time Averaged Gas Holdup Profile
0
0.01
0.02
0.03
0.04
0.05
0 2 4 6 8 10
Radial Location (cms)
Frac
tiona
l Gas
Hol
dup
eg
Impeller
Region
Shaft + Hex Nut
Wall Region
CTCT CARPTCARPT
Two phase flow in STR : Two phase flow in STR :
results at a glanceresults at a glance
S28
Rammohan et al. I&EC Research, 42, 2589 (2003)

Liquid Distribution in Study Trickle Bed Reactors - Experimental Setup
• Exit Liquid Distribution
• Computed Tomography
DISTRIBUTOR
Single point10mm diameter
liquid inlet
PACKING6’’ (14 cm)
Column
1<L/D<4
3mm diameterglass beads
COLLECTINGTRAY
25 crosssectional areas
x/R
y/R
-1 -0.5 0 0.5 1-1
-0.5
0
0.5
1
0.400.360.320.280.240.200.160.120.080.040.00
εL
x/D=0.34 Hbed= 2D
x (mm)
y(m
m)
-60 -40 -20 0 20 40 60
-60
-40
-20
0
20
40
60
6.56.05.55.04.54.03.53.02.52.01.51.00.50.0
Exit liquid distribution, % of total flux (FT)
L/D = 2, FT = 85 kg.m-2.s-1, Mf = 0.054UL = 4 mm.s-1, UG = 0 m.s-1
• Computed TomographyLiquid holdup
Cross-sectional liquid holdup and exit liquid distribution are compared in the region close to the reactor bottom. Figures show that results are in good qualitative agreement even though two different parameters (i.e. liquid holdup and exit liquid fluxes) are compared.
• Exit Liquid Distribution
S29

-101
1
2
3
4
x/D
-10
1
r/R
1.000.960.920.880.840.800.760.720.680.640.60
-101
1
2
3
4
x/D
-10
1
r/R
1.000.960.920.880.840.800.760.720.680.640.60
-101
1
2
3
4
x/D
-10
1
r/R
1.000.960.920.880.840.800.760.720.680.640.60
CT in Structured Packing under Counter-current flow
Gas holdup profiles at ZEROgas flow in a 12 inch column
Vl = 1.3 cm/sec
Vl = 0.63 Vl = 2.17
Corrugated Structured Packing
Results at a glance
S30
Conclusions
• Development of fundamentally based phenomenological models for reactors with two (three) moving phases is possible (e.g. bubble columns, riser, stirred tank, etc.)
• CARPT-CT provide a unique tool for evaluation of holdup and velocity distribution in these systems and for validation of CFD codes.
• CFD codes based on Euler-Euler interpenetrating fluid model with appropriate closures, upon validation, provide the means for effective calculation of reactor flow and mixing parameters.
• Phenomenological reactor models are capable of predicting tracer impulse responses. Thus they can predict reactor performance for linear kinetics exactly.
• Radioactive techniques have a major role to play in such model development.
S31

Acknowledgement of Financial Support and Effort in Advancing Multiphase Reaction Engineering and
Establishing Unique CARPT/CT Technologies
Department of Energy: DE-FC22 95 95051DE-FG22 95 P 95512
CREL Industrial Sponsors: ABB Lummus, Air Products, Bayer, Chevron, Conoco, Dow Chemicals, DuPont, Elf Atofina, Exxon, ENI Technologie, IFP, Intevep, MEMC, Mitsubishi, Mobil, Monsanto, Sasol, Shell, Solutia, Statoil, Synetix, Union Carbide, UOP
CREL Colleagues and M.H. Al-Dahhan, J. Chen, S. Degaleesan, Graduate Students: N. Devanathan, P. Gupta, A. Kemoun, B.C. Ong, Y.
Pan, N. Rados, S. Roy, A. Rammohan, Y. Jiang, M. KhadilkarY. Jiang, A. Kemoun, B.C. Ong, Y. Pan, N. Rados, S. Roy
Special Thanks to: B.A. Toseland, Air Products and ChemicalsM. Chang, ExxonMobilJ. Sanyal, FLUENT, USAB. Kashiwa, CFDLib, Los AlamosV. Ranade, NCL, Pune, India
S32

Chemical ReactionEngineering Laboratory (CREL)http://crelonweb.che.wustl.edu
Objectives
M. Al-DahhanCo-Director
M. DudukovicDirector
• Education and training of students• Advancement of reaction engineering methodology• Transfer of state-of-the-art reaction engineering to industrial practice
Sponsors
SponsorsPartners
S33
ABB LummusAir Products
BayerBP Amoco
Chevron TexacoConocoCorning
Dow ChemicalDupont
Enitechnologie
Exxon - MobilIFP
IntevepMitsubishi
PraxairSasolShell
StatoilSynetix
TotalfinaelfUOP