computer-assisted design for scaling up systems based … · hagiya m, rondelez y. 2014...
TRANSCRIPT

on January 29, 2014rsif.royalsocietypublishing.orgDownloaded from
rsif.royalsocietypublishing.org
ResearchCite this article: Aubert N, Mosca C, Fujii T,
Hagiya M, Rondelez Y. 2014 Computer-assisted
design for scaling up systems based on DNA
reaction networks. J. R. Soc. Interface 11:
20131167.
http://dx.doi.org/10.1098/rsif.2013.1167
Received: 13 December 2013
Accepted: 2 January 2014
Subject Areas:biochemistry, computational biology
Keywords:molecular programming, computer-assisted
design, in silico to in vitro
Author for correspondence:Nathanael Aubert
e-mail: [email protected]
Electronic supplementary material is available
at http://dx.doi.org/10.1098/rsif.2013.1167 or
via http://rsif.royalsocietypublishing.org.
& 2014 The Author(s) Published by the Royal Society. All rights reserved.
Computer-assisted design for scaling upsystems based on DNA reaction networks
Nathanael Aubert1, Clement Mosca2, Teruo Fujii2, Masami Hagiya1
and Yannick Rondelez2
1Graduate School of Information Science and Technology, and 2LIMMS/CNRS-IIS, Institute of Industrial Science,University of Tokyo, Tokyo, Japan
In the past few years, there have been many exciting advances in the field
of molecular programming, reaching a point where implementation of
non-trivial systems, such as neural networks or switchable bistable net-
works, is a reality. Such systems require nonlinearity, be it through signal
amplification, digitalization or the generation of autonomous dynamics
such as oscillations. The biochemistry of DNA systems provides such
mechanisms, but assembling them in a constructive manner is still a difficult
and sometimes counterintuitive process. Moreover, realistic prediction
of the actual evolution of concentrations over time requires a number of
side reactions, such as leaks, cross-talks or competitive interactions, to be
taken into account. In this case, the design of a system targeting a given
function takes much trial and error before the correct architecture can be
found. To speed up this process, we have created DNA Artificial Circuits
Computer-Assisted Design (DACCAD), a computer-assisted design software
that supports the construction of systems for the DNA toolbox. DACCAD is
ultimately aimed to design actual in vitro implementations, which is made
possible by building on the experimental knowledge available on the
DNA toolbox. We illustrate its effectiveness by designing various systems,
from Montagne et al.’s Oligator or Padirac et al.’s bistable system to new
and complex networks, including a two-bit counter or a frequency divider
as well as an example of very large system encoding the game Mastermind.
In the process, we highlight a variety of behaviours, such as enzymatic sat-
uration and load effect, which would be hard to handle or even predict with
a simpler model. We also show that those mechanisms, while generally seen
as detrimental, can be used in a positive way, as functional part of a design.
Additionally, the number of parameters included in these simulations can be
large, especially in the case of complex systems. For this reason, we included
the possibility to use CMA-ES, a state-of-the-art optimization algorithm that
will automatically evolve parameters chosen by the user to try to match a
specified behaviour. Finally, because all possible functionality cannot be
captured by a single software, DACCAD includes the possibility to export
a system in the synthetic biology markup language, a widely used language
for describing biological reaction systems. DACCAD can be downloaded
online at http://www.yannick-rondelez.com/downloads/.
1. Introduction1.1. GeneralityComputer-assisted design (CAD) has helped many fields reach their full poten-
tial by scaling up designs, making error-prone or repetitive tasks automated
and allowing easy simulation and verification of systems. As such CAD has
proved to be a necessary tool to develop any advanced technology, examples
of which include areas as varied as integrated circuits, aeronautics or program-
ming. The case of DNA computing, a field that uses the interactions between
various DNA molecules and enzymes to perform meaningful operations, is no
exception: while DNA computing systems have shown great promise [1–4],
advances are still considerably limited by the trial-and-error process, and many

rsif.royalsocietypublishing.orgJ.R.Soc.Interface
11:20131167
2
on January 29, 2014rsif.royalsocietypublishing.orgDownloaded from
such systems are often left at the proof-of-concept stage. Com-
puter assistance could remove this limitation and help
designers take the next step towards actual applications. In
this study, we present DNA Artificial Circuits Computer-
Assisted design (DACCAD), a CAD program for designing
systems using Montagne et al.’s [3] dynamic networks assem-
bly (DNA) toolbox, a set of DNA-and-enzyme-based
modules that can be arbitrarily combined into chemical
reaction networks (CRNs).
CRNs are assemblies of cross-interacting chemical reactions
where each molecular compound can affect the formation
and degradation rate of the others. CRNs, when kept out of
equilibrium, can display a variety of nonlinear behaviours,
including oscillations and multistability. They are very power-
ful systems in terms of information processing, as shown by the
variety of complex cellular processes that are controlled by
CRNs in vivo [5]. The recent demonstrations that they possess
Turing universality [1,6–9] also advocates for their use in a var-
iety of control tasks at the molecular level. However, CRNs
tend to resist rational design. A link between the properties
of the network and its dynamic functions can be obtained
from dynamical systems theory, including linear stability
analysis [10], Lyapunov stability analysis [11] or CRN theory
[12], but such analytical approaches are generally restricted
to idealized systems with simple mathematical models.
Actual implementations are generally much more intricate in
terms of chemical kinetics.
In recent years, great efforts have been invested in the
exploration of the class of reaction networks relying on in vitroDNA chemistry and biochemistry. These systems are based
on the predictability of DNA–DNA interactions using sim-
ple Watson–Crick base-pairing rules as well as on the rich
repertoire of possible enzymatic transformations. Using DNA-
based molecular programming, it is possible to build simple
computing systems based on Boolean logic [6,13,14] but also
neural networks [2] and CRNs [7]. Enzymatic systems are
of particular interest because they can be maintained out of
equilibrium for an extended period of time (for instance by
having a large amount of deoxyribonucleotide triphosphate
or nucleoside 50-triphosphate in the solution, acting as a
generic fuel) and thus are suited to explore emergent beha-
viours. We focus on the DNA toolbox, a recent framework to
assemble out-of-equilibrium networks of arbitrary topology,
whose dynamics are powered by three enzymes (polymerase,
exonuclease and nickase). This framework has been used
to build oscillators [3], bistable systems [4], a push–push
memory circuit [4] or even molecular ecosystems reproducing
predator–prey cycles in bulk [15], spatially [16,17] or in droplets
[18]. Spatial implementations of those systems display waves
[16,17], showing they can be used for two-dimensional reac-
tion–diffusion systems. All these circuits were simple enough
to be designed and tuned by hand, but doing so was still
an arduous process of trial and error that cannot be exten-
ded to larger systems. Indeed, in well-mixed solutions, any
molecular element can potentially interact with many others
at any given time, and keeping track of all of these interactions
and their kinetic consequences quickly becomes impossible
for a human. It gets worse when counterintuitive effects,
such as competition and saturation [19–21], have to be taken
into account.
However, a quite unique feature of DNA as a molecular
material is the possibility to find simple rules and kinetic
parameters describing its global behaviour [7,22,23]. The
dependence of each nucleotide on the global environmental
conditions (salt concentration, temperature) is thus averaged
through those parameters. While those rules are simple in
essence, complexity emerges from their intrinsic nonlinearity.
Similarly, the biochemistry of DNA can be described by
simple models, such as the Michaelis–Menten equation or
competitive inhibition. Therefore, DNA-based CRNs can be
both implemented in test tubes and described by quantitative
or semi-quantitative ordinary differential equation (ODE)
models based on standard kinetics. Compared with previous
experimental studies on CRNs, the availability of such math-
ematical models is the true benefit of DNA systems. It puts
the molecular programming approach in stark contrast to
‘classic’ nonlinear reaction networks, such as those observed
in chemistry (such as the Belousov–Zhabotinsky reaction
[24]) and in biology (gene regulation networks [25,26], signal-
ling cascades in metabolic networks [27], etc.). Note that in
these last two cases, it is generally possible to infer high-
level models of interaction among the molecular members
of the reaction network, such as Hill equation for the coopera-
tive binding of ligands [28]. However, it is much more
difficult to obtain precise mathematical forms describing
these interactions, let alone accurate numerical parameters
needed for predictive simulations. This last point thus
makes those systems harder to use in an engineering context.
DNA-based systems thus provide the chemical tools to
implement any computation or dynamic behaviour at the
molecular scale. While the construction of complex systems
quickly becomes intractable for the human brain, these accu-
rate mechanistic models allow us to numerically simulate
them with reasonable accuracy, justifying CAD. For those
reasons, we expect that this approach will be the only way
to push the complexity of experimentally accessible systems
further. In DACCAD, the services offered by the machine
are fourfold:
— it provides a straightforward graphical interface to create
the network and assess its dynamic behaviour;
— it eliminates routine and error-prone tasks such as ODE
writing and solving;
— it helps in simple optimization tasks such as adjusting the
parameters to tune the behaviour of the network towards
a quantitative target, once a qualitative agreement has
been obtained; and
— it can display an animated version of the network,
giving a better understanding of the evolution of the
system over time.
DACCAD was written entirely in Java1 to make it as easy
to deploy as possible. This software allows the user to set the
reaction parameters, such as enzymatic activities, to be as
close as possible to real-life experiment. Users can also refer
to the electronic supplementary material of Montagne et al.[3] to fit these parameters to their own experimental settings.
It comes with preset parameters from Padirac et al.’s work, so
that only a general knowledge of CRNs is necessary to start
designing complex systems. DACCAD thus makes it quick
to test designs based on the user’s intuition. Designed sys-
tems can then be built in vitro, using Baccouche et al.’s [29]
protocol. Finally, DACCAD can convert any such designed
system to synthetic biology markup language (SBML) to
ensure compatibility with other simulation tools that the
user would like to use.

activation+ +
+
+ +
inhibition
autocatalysis
Figure 1. Modules of the DNA toolbox: activation, inhibition and the special caseof autocatalysis. The black domain in the inhibition strand represents the finalmismatch preventing the action of the polymerase. (Online version in colour.)
rsif.royalsocietypublishing.orgJ.R.Soc.Interface
11:20131167
3
on January 29, 2014rsif.royalsocietypublishing.orgDownloaded from
1.2. Related workThe basic operations that can be executed by DNA, such as
two complementary strands attaching to form a double helix,
toehold-mediated strand displacement and enzymatic trans-
formations, are well known. However, there are multiple
paradigms that use those mechanisms in very different ways.
One such paradigm, DNA strand displacement (DSD), already
benefits from its own software for CAD, VISUALDSD [30],
demonstrating the effectiveness of the CAD approach.
Recently, Kwiatkowska and co-workers [31] were able to
prove the incorrectness of a basic DSD system by coupling
VISUALDSD with a verification software and then propose
a corrected version. VISUALDSD is also useful to highlight
counterintuitive phenomena such as the winner-take-all
effect [19,32,33].
DSD is also the foundation of Qian and Winfree’s seesaw
gate [1,2], which they used to build complex logical circuits.
However, the translation is hard to do by hand, and so is
the design of the actual hundreds of DNA sequences making up
the system. This is why they designed a compiler (http://www.
dna.caltech.edu/SeesawCompiler/) which takes a description
of a logical circuit and outputs the DNA sequences to
implement it. The compiler can also export the system in the
MATHEMATICA and SBML [34,35] format for simulation of
the system at the molecular level, and VISUALDSD format for
simulation at the toehold level.
The motivation to automatically design DNA sequences
is that unwanted interactions at the molecular level are
very common. While simulation might show no problem
with abstract sequences, actual implementation, if done
incorrectly, can lead to unexpected secondary structures.
In particular, because sequences are made up of only four
nucleotides, it is hard to prevent partial complementarity.
NUPACK [36] and DINAMelt [37,38] are online tools
designed to check how specific sequences will interact
together and output the most stable configurations. They
also compute many characteristics of such structures, such
as melting temperature. NUPACK focuses more on the sec-
ondary structures of systems with multiple kinds of DNA
strands, whereas DINAMelt provides various data on the
interaction of two sequences.
For broader applications, COPASI [39] is a very complete
tool for analysing and simulating biological systems. It has
the advantage of being able to perform mass action, stochastic
and hybrid simulations of any system described in SBML and
is also able to handle parameter fitting and optimization,
which makes it very powerful. However, it has the inconveni-
ence of requiring the user to provide the SBML file describing
the system, or input each and every single molecules, inter-
actions and reaction rates by hand through the graphical user
interface, a long process for realistic systems. For this reason,
we gave the option to export systems designed with
DACCAD in the SBML format, so that the user can perform
additional operations with COPASI, or any other software
supporting this format.
Furthermore, DNA possibilities are not limited only to
computation. Because DNA molecules can be considered flex-
ible when long enough, but locally rigid, they can be used to
build complex structures, for instance by using a long scaffold
strand held in place by short ‘staple’ strands [40], or by using
directly specific short strands [41,42]. Such approaches have
to rely heavily on CAD software, such as CADNANO [43] and
CANDO [44], as the number of different sequences necessary
to create complex structures is very large.
Note that those programs work at different levels, ranging
from abstract species in COPASI to DNA strands in VISUALDSD
or DACCAD to actual DNA sequences in NUPACK or
DINAMelt, depending on the application.
1.3. The dynamic networks assembly toolboxThe DNA toolbox was introduced by Montagne et al. [3] to
help rationally design DNA-based molecular programs, and
demonstrated its effectiveness through multiple systems
such as the Oligator. It has the advantage of using very
simple modules (activation and inhibition) which can be
combined to form, in theory, arbitrarily complex systems.
Moreover, it was described both from the theoretical [45]
and experimental point of view [29]. In the toolbox, two
kinds of DNA strands have to be distinguished: short DNA
strands are used as signals, and longer strands are used as
templates to generate new strands (figure 1). Activation is
done by short strands being extended by a DNA polymerase
enzyme along a compatible template, after which both signal
and output strands are cleaved apart by nickase. Both signal
and output are too short to form stable duplexes and are
eventually released. Inhibition is done by slightly longer
strands that are complementary to most of their target, but
do not trigger polymerization or nicking, thus inactivating
the template. Both signal and inhibition strands are degra-
ded over time by the action of an exonuclease enzyme, to
keep the system out of equilibrium. Templates are chemically
protected against such degradation.
Any system using this paradigm can be easily represented
as a graph: signal and inhibition strands are the nodes while
templates are represented by an arrow from their signal to
their output. A second kind of arrow (‘bar-headed’ arrow)
is also used to represent which template is inhibited by a
given inhibition strand. Simple examples of such represen-
tation are shown in figure 2. Conversely, any such graph
can be directly converted to a DNA implementation.
DACCAD can simulate both autonomous and non-
autonomous systems. The latter are simulated by adding a
given amount of a specific species to the system at a set
time in the simulation. This allows us to simulate inputs
coming from outside the system, such as injections made
by the experimenter or signal coming from another DNA
system present in the environment. Spikes, either unique or
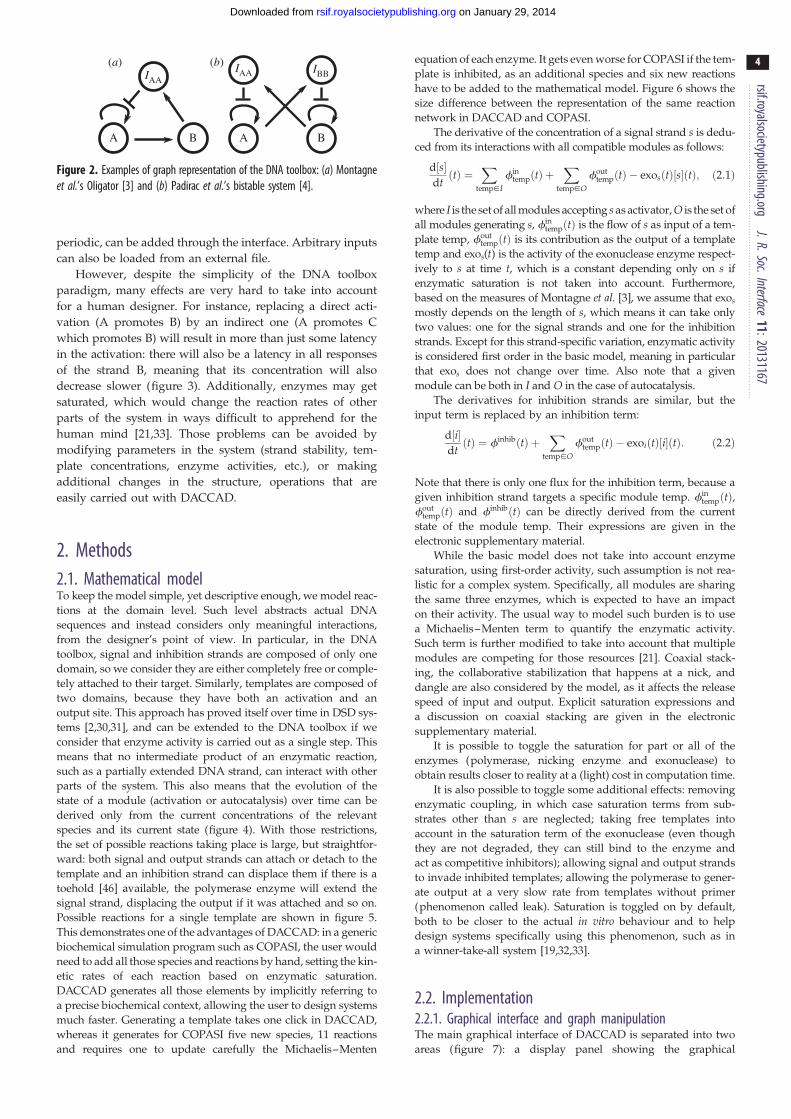
A
(a) (b)IAA
IAA IBB
B A B
Figure 2. Examples of graph representation of the DNA toolbox: (a) Montagneet al.’s Oligator [3] and (b) Padirac et al.’s bistable system [4].
rsif.royalsocietypublishing.orgJ.R.Soc.Interface
11:20131167
4
on January 29, 2014rsif.royalsocietypublishing.orgDownloaded from
periodic, can be added through the interface. Arbitrary inputs
can also be loaded from an external file.
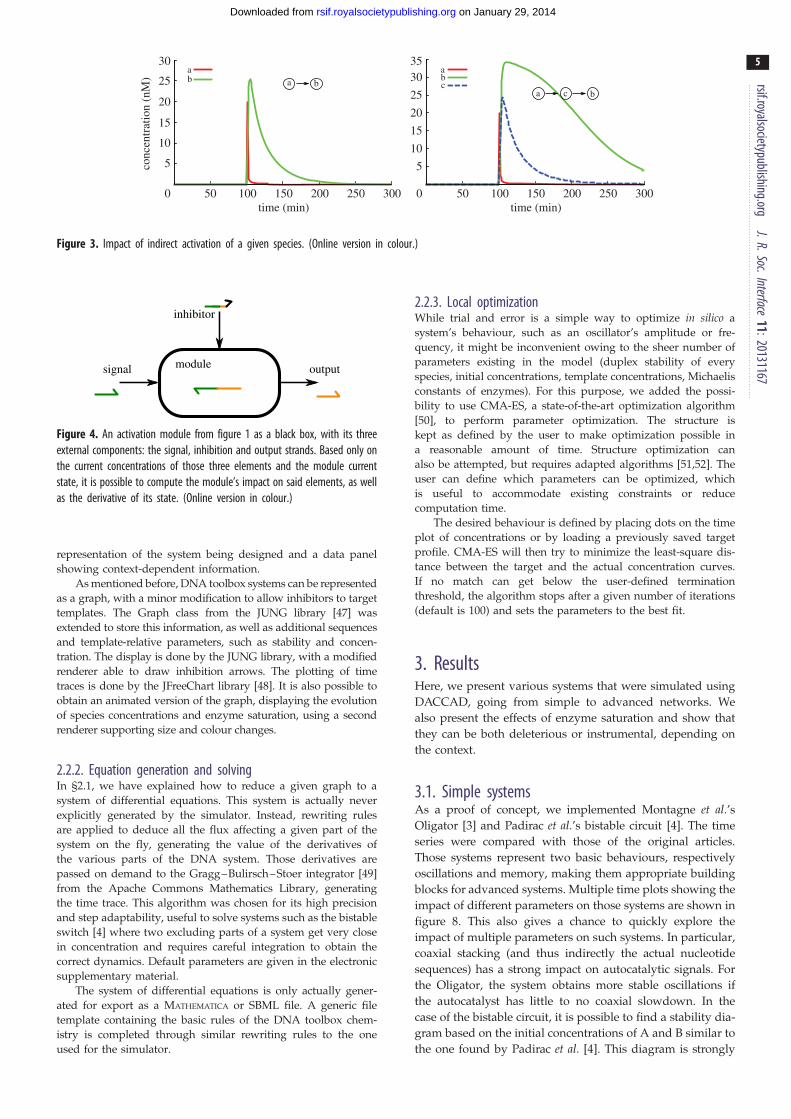
However, despite the simplicity of the DNA toolbox
paradigm, many effects are very hard to take into account
for a human designer. For instance, replacing a direct acti-
vation (A promotes B) by an indirect one (A promotes C
which promotes B) will result in more than just some latency
in the activation: there will also be a latency in all responses
of the strand B, meaning that its concentration will also
decrease slower (figure 3). Additionally, enzymes may get
saturated, which would change the reaction rates of other
parts of the system in ways difficult to apprehend for the
human mind [21,33]. Those problems can be avoided by
modifying parameters in the system (strand stability, tem-
plate concentrations, enzyme activities, etc.), or making
additional changes in the structure, operations that are
easily carried out with DACCAD.
2. Methods2.1. Mathematical modelTo keep the model simple, yet descriptive enough, we model reac-
tions at the domain level. Such level abstracts actual DNA
sequences and instead considers only meaningful interactions,
from the designer’s point of view. In particular, in the DNA
toolbox, signal and inhibition strands are composed of only one
domain, so we consider they are either completely free or comple-
tely attached to their target. Similarly, templates are composed of
two domains, because they have both an activation and an
output site. This approach has proved itself over time in DSD sys-
tems [2,30,31], and can be extended to the DNA toolbox if we
consider that enzyme activity is carried out as a single step. This
means that no intermediate product of an enzymatic reaction,
such as a partially extended DNA strand, can interact with other
parts of the system. This also means that the evolution of the
state of a module (activation or autocatalysis) over time can be
derived only from the current concentrations of the relevant
species and its current state (figure 4). With those restrictions,
the set of possible reactions taking place is large, but straightfor-
ward: both signal and output strands can attach or detach to the
template and an inhibition strand can displace them if there is a
toehold [46] available, the polymerase enzyme will extend the
signal strand, displacing the output if it was attached and so on.
Possible reactions for a single template are shown in figure 5.
This demonstrates one of the advantages of DACCAD: in a generic
biochemical simulation program such as COPASI, the user would
need to add all those species and reactions by hand, setting the kin-
etic rates of each reaction based on enzymatic saturation.
DACCAD generates all those elements by implicitly referring to
a precise biochemical context, allowing the user to design systems
much faster. Generating a template takes one click in DACCAD,
whereas it generates for COPASI five new species, 11 reactions
and requires one to update carefully the Michaelis–Menten
equation of each enzyme. It gets even worse for COPASI if the tem-
plate is inhibited, as an additional species and six new reactions
have to be added to the mathematical model. Figure 6 shows the
size difference between the representation of the same reaction
network in DACCAD and COPASI.
The derivative of the concentration of a signal strand s is dedu-
ced from its interactions with all compatible modules as follows:
d½s�dtðtÞ ¼
X
temp[I
fintempðtÞ þ
X
temp[O
fouttempðtÞ � exosðtÞ½s�ðtÞ; ð2:1Þ
where I is the set of all modules accepting s as activator, O is the set of
all modules generating s, fintempðtÞ is the flow of s as input of a tem-
plate temp, fouttempðtÞ is its contribution as the output of a template
temp and exos(t) is the activity of the exonuclease enzyme respect-
ively to s at time t, which is a constant depending only on s if
enzymatic saturation is not taken into account. Furthermore,
based on the measures of Montagne et al. [3], we assume that exos
mostly depends on the length of s, which means it can take only
two values: one for the signal strands and one for the inhibition
strands. Except for this strand-specific variation, enzymatic activity
is considered first order in the basic model, meaning in particular
that exos does not change over time. Also note that a given
module can be both in I and O in the case of autocatalysis.
The derivatives for inhibition strands are similar, but the
input term is replaced by an inhibition term:
d½i�dtðtÞ ¼ finhibðtÞ þ
X
temp[O
fouttempðtÞ � exoiðtÞ½i�ðtÞ: ð2:2Þ
Note that there is only one flux for the inhibition term, because a
given inhibition strand targets a specific module temp. fintempðtÞ,
fouttempðtÞ and finhibðtÞ can be directly derived from the current
state of the module temp. Their expressions are given in the
electronic supplementary material.
While the basic model does not take into account enzyme
saturation, using first-order activity, such assumption is not rea-
listic for a complex system. Specifically, all modules are sharing
the same three enzymes, which is expected to have an impact
on their activity. The usual way to model such burden is to use
a Michaelis–Menten term to quantify the enzymatic activity.
Such term is further modified to take into account that multiple
modules are competing for those resources [21]. Coaxial stack-
ing, the collaborative stabilization that happens at a nick, and
dangle are also considered by the model, as it affects the release
speed of input and output. Explicit saturation expressions and
a discussion on coaxial stacking are given in the electronic
supplementary material.
It is possible to toggle the saturation for part or all of the
enzymes (polymerase, nicking enzyme and exonuclease) to
obtain results closer to reality at a (light) cost in computation time.
It is also possible to toggle some additional effects: removing
enzymatic coupling, in which case saturation terms from sub-
strates other than s are neglected; taking free templates into
account in the saturation term of the exonuclease (even though
they are not degraded, they can still bind to the enzyme and
act as competitive inhibitors); allowing signal and output strands
to invade inhibited templates; allowing the polymerase to gener-
ate output at a very slow rate from templates without primer
(phenomenon called leak). Saturation is toggled on by default,
both to be closer to the actual in vitro behaviour and to help
design systems specifically using this phenomenon, such as in
a winner-take-all system [19,32,33].
2.2. Implementation2.2.1. Graphical interface and graph manipulationThe main graphical interface of DACCAD is separated into two
areas (figure 7): a display panel showing the graphical
30
25
20
15
10
5
3035
25
20
15
10co
ncen
trat
ion
(nM
)
5
0
aa
bba
a c b
bc
50 100 150time (min)
200 250 300 0 50 100 150time (min)
200 250 300
Figure 3. Impact of indirect activation of a given species. (Online version in colour.)
inhibitor
modulesignal output
Figure 4. An activation module from figure 1 as a black box, with its threeexternal components: the signal, inhibition and output strands. Based only onthe current concentrations of those three elements and the module currentstate, it is possible to compute the module’s impact on said elements, as wellas the derivative of its state. (Online version in colour.)
rsif.royalsocietypublishing.orgJ.R.Soc.Interface
11:20131167
5
on January 29, 2014rsif.royalsocietypublishing.orgDownloaded from
representation of the system being designed and a data panel
showing context-dependent information.
As mentioned before, DNA toolbox systems can be represented
as a graph, with a minor modification to allow inhibitors to target
templates. The Graph class from the JUNG library [47] was
extended to store this information, as well as additional sequences
and template-relative parameters, such as stability and concen-
tration. The display is done by the JUNG library, with a modified
renderer able to draw inhibition arrows. The plotting of time
traces is done by the JFreeChart library [48]. It is also possible to
obtain an animated version of the graph, displaying the evolution
of species concentrations and enzyme saturation, using a second
renderer supporting size and colour changes.
2.2.2. Equation generation and solvingIn §2.1, we have explained how to reduce a given graph to a
system of differential equations. This system is actually never
explicitly generated by the simulator. Instead, rewriting rules
are applied to deduce all the flux affecting a given part of the
system on the fly, generating the value of the derivatives of
the various parts of the DNA system. Those derivatives are
passed on demand to the Gragg–Bulirsch–Stoer integrator [49]
from the Apache Commons Mathematics Library, generating
the time trace. This algorithm was chosen for its high precision
and step adaptability, useful to solve systems such as the bistable
switch [4] where two excluding parts of a system get very close
in concentration and requires careful integration to obtain the
correct dynamics. Default parameters are given in the electronic
supplementary material.
The system of differential equations is only actually gener-
ated for export as a MATHEMATICA or SBML file. A generic file
template containing the basic rules of the DNA toolbox chem-
istry is completed through similar rewriting rules to the one
used for the simulator.
2.2.3. Local optimizationWhile trial and error is a simple way to optimize in silico a
system’s behaviour, such as an oscillator’s amplitude or fre-
quency, it might be inconvenient owing to the sheer number of
parameters existing in the model (duplex stability of every
species, initial concentrations, template concentrations, Michaelis
constants of enzymes). For this purpose, we added the possi-
bility to use CMA-ES, a state-of-the-art optimization algorithm
[50], to perform parameter optimization. The structure is
kept as defined by the user to make optimization possible in
a reasonable amount of time. Structure optimization can
also be attempted, but requires adapted algorithms [51,52]. The
user can define which parameters can be optimized, which
is useful to accommodate existing constraints or reduce
computation time.
The desired behaviour is defined by placing dots on the time
plot of concentrations or by loading a previously saved target
profile. CMA-ES will then try to minimize the least-square dis-
tance between the target and the actual concentration curves.
If no match can get below the user-defined termination
threshold, the algorithm stops after a given number of iterations
(default is 100) and sets the parameters to the best fit.
3. ResultsHere, we present various systems that were simulated using
DACCAD, going from simple to advanced networks. We
also present the effects of enzyme saturation and show that
they can be both deleterious or instrumental, depending on
the context.
3.1. Simple systemsAs a proof of concept, we implemented Montagne et al.’sOligator [3] and Padirac et al.’s bistable circuit [4]. The time
series were compared with those of the original articles.
Those systems represent two basic behaviours, respectively
oscillations and memory, making them appropriate building
blocks for advanced systems. Multiple time plots showing the
impact of different parameters on those systems are shown in
figure 8. This also gives a chance to quickly explore the
impact of multiple parameters on such systems. In particular,
coaxial stacking (and thus indirectly the actual nucleotide
sequences) has a strong impact on autocatalytic signals. For
the Oligator, the system obtains more stable oscillations if
the autocatalyst has little to no coaxial slowdown. In the
case of the bistable circuit, it is possible to find a stability dia-
gram based on the initial concentrations of A and B similar to
the one found by Padirac et al. [4]. This diagram is strongly

signal
(a) (b)
pol
nick
tempalone
tempouttempin
tempext tempboth
poldispl
inhib
+
tempinhib
loutlin
Figure 5. All the possible reactions between a template and its various inputs. The respective concentrations of the different configurations of template representthe state of a module: temp, noted tempalone (template alone), tempin (signal strand attached), tempout (output strand attached), tempboth (both signal and outputstrands attached), tempext (template completely double-stranded) and tempinhib (inhibited template). (a) Working of an activation template without inhibition.(b) Reactions related to inhibition. Toe represents the fact that signal and output strands invade an inhibited template at a slower rate, because they have avery short toehold. (Online version in colour.)
s1
s1
tboth1to1
text1to1
tin1to1
tout1to1 talone1to1
Figure 6. Comparison between the representation of a simple DNA toolboxautocatalytic module in DACCAD, and the same chemical system in COPASI.The latter graph was created through the interface of COPASI from theSBML file exported by DACCAD. (Online version in colour.)
rsif.royalsocietypublishing.orgJ.R.Soc.Interface
11:20131167
6
on January 29, 2014rsif.royalsocietypublishing.orgDownloaded from
influenced by the coaxial stacking values of the various
templates (see the electronic supplementary material).
3.2. Simple system optimizationThe Oligator oscillates only on a restricted area of the
complete parameter space [3]. To find a working set with
specific properties in terms of amplitude and frequency, we
used the optimization tool of DACCAD, leading to the results
shown in figure 9. In this particular case, a very good match
was found, but specific behaviours may be impossible. In the
case of troubles with the evolution, it is recommended to
reduce the number of evolved parameters and go through
multiple intermediary behaviours, so that the system evolves
progressively in the good direction. As an example, when
trying to optimize the frequency divider (figure 11), the opti-
mizer was not explicitly allowed to modify the behaviour of
the oscillator. However, by increasing the concentration of the
template connecting the oscillator to the rest of the circuit and
using the load effect, the optimizer found a ‘good’ match: the
additional templates sequester an intermediary species of
the oscillator, making it actually twice slower. Good par-
ameters were found by excluding this parameter from the
optimization as well.
3.3. Combined systemsUsing the two previous building blocks, we can build
advanced systems that would require hundreds of lines if
the ODEs were written by the user. By cascading two bistable
systems, we can obtain a two-bit counter (figure 10). If
instead we chose to combine an extended Oligator and a bis-
table circuit, we can obtain a frequency divider (figure 11).
The systems presented here are perfect examples of the pro-
blems that might arise when combining two circuits. While
the modularity of the DNA toolbox makes it simple to use
multiple systems in parallel, such as in the two-bit counter,
many factors have to be taken into account when cascading
systems. The most important is the load effect [53]: when
adding a template taking a given strand as input, the seques-
tering of this strand will change the behaviour of the system of
which it is part. In the frequency divider, for instance, the tem-
plate connecting the oscillator to the bistable system will change
the oscillator’s frequency or even prevent anything more than
damped oscillations. This phenomenon is strongly dependent
on the strand used as input: any perturbation to the autocatalyst
will prevent true oscillations, but the intermediate species are
more robust. The optimal course of action is then to create a
link to a new species that will in turn bear the full load of the
connection to the other part of the system.
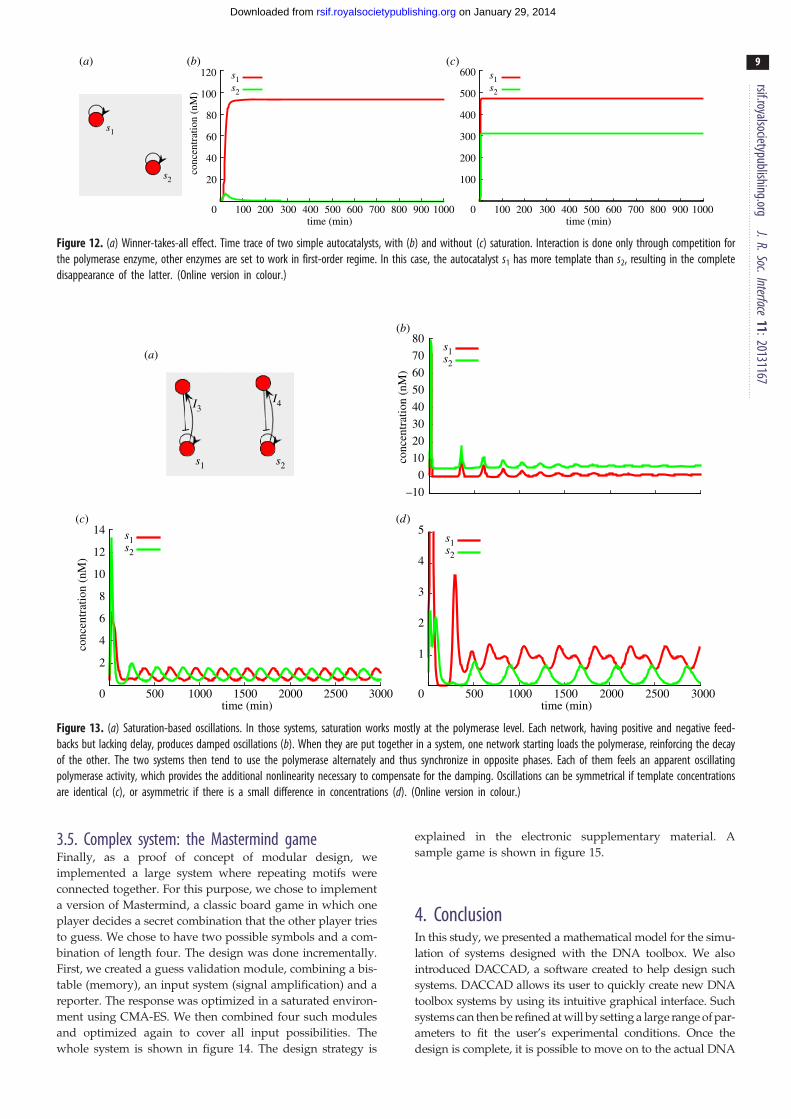
3.4. Saturation-based effectsKim et al. [19] presented a biochemical phenomenon named
winner-take-all that arises when there is competition for a
common resource in which the species that reproduces the
fastest using this resource will eliminate all competitors.
This phenomenon was leveraged by Genot et al. to perform
efficient computation [32]. In the DNA toolbox, enzymes
are perfect examples of such shared resources [33]. Because
the standard experimental parameters are set to avoid satur-
ation (and thus competition) as much as possible, the activity
of one enzyme has to be reduced by an order of magnitude.

number of species: 2
number of autocatalysts: 1number of selected nodes: 1
K (dissociation constant) (nM)initial concentration (nM)
including 0 inhibitor
template 1 1 (nM)
Figure 7. 1. Display panel. 2. Data panel. 3. Parameters area. Sets species and template-relative parameters. 4. Graph of the system. Selected nodes are displayed inblue. 5. File menu. 6. Species menu. 7. Options. Sets general and enzymatic parameters. 8. Plot. Simulates and displays the behaviour of the system. (Online versionin colour.)
8(a) (b)
(c) (d)
7
6
5
4
3
2
1
0
conc
entr
atio
n (n
M)
5
10
15
20
25
conc
entr
atio
n (n
M)
AB
AB
IAA89
10
76543210
161820
1412108642
0 100 200 300 400 500time (min)
600 700 800 900 1000 0 100 200 300 400 500time (min)
600 700 800 900 1000
AB
IAA
AB
Figure 8. (a,b) The Oligator [3], simulated with first-order enzymatic activity (a) and with enzymatic saturation and competitive coupling (b). With the chosenparameters, the amplitude and frequency of oscillation are modified, but the behaviour is otherwise unchanged. (c,d) Simulation of Padirac’s bistable circuit. Onlythe time plot of the autocatalytic species is shown. The initial concentration of A is higher than that of B, forcing the system into the A state. If the concentration ofautocatalytic templates is too high (d ), the system saturates the enzymes and loses its bistable properties. Performing some optimizations on the enzyme par-ameters gives us some insights into this phenomenon: it turns out that with Padirac et al.’s [4] parameters, the nicking enzyme saturates first, causing this loss ofbistability. (Online version in colour.)
rsif.royalsocietypublishing.orgJ.R.Soc.Interface
11:20131167
7
on January 29, 2014rsif.royalsocietypublishing.orgDownloaded from

AB
IAA
AB
IAA89
10
7654321
0 100 200 300 400 500time (min)
conc
entr
atio
n (n
M)
5
10
15
20
25
30
600 700 800 900 1000 0 100 200 300 400 500time (min)
600 700 800 900 1000
(a) (b)
Figure 9. Optimization of an oscillator. (a) At first, the system displays only damped oscillations. The user can describe the desired behaviour through the interface(the dots represent the user-defined behaviour). (b) CMA-ES then performs some rounds of optimization until a result close enough is achieved. Note that theconcentration scale is different between the two panels. (Online version in colour.)
(a) (b)
I10
I11
I13
I2I1
I12
I5I6
12
00 01 10 11
lsbmsb
clock10
8
6
4
2
0
–20 500 1000 1500
time (min)
conc
entr
atio
n (n
M)
2000 2500 3000s9
s8s4
s3s7
Figure 10. A two-bit counter made of two push – push memory circuits [4], with (a) the actual circuit of the system and (b) the time plot of the relevant species.Switches come from an input of species 9 (clock), making this a non-autonomous system. Note that the spike of species 9 when switching the least relevant bit isdifferent when going from 0 (species 3 high) to 1 (species 4 high) than when going from 1 to 0. This is due to the load effect: when species 3 is high, moretemplates that can capture species 9 are inhibited, so the free concentration of species 9 is higher.
35 s3s5s6
30
25
20
15
10
5
s6
I14
I12s2
s3s15
s16 I8I7I4
I13
s11
s10 s5s1
s90 500 1000 1500
time (min)
conc
entr
atio
n (n
M)
2000 2500 3000
Figure 11. A frequency divider. The original oscillator (s1 to I4, a version of Montagne et al.’s Oligator [3] with a two species delay) is connected to a push – pushmemory (s5 to I11). The two species delay has the double effect of making the oscillator more robust to the connection load and slowing the oscillations to giveenough time to the bistable circuit to switch. To produce spike-like activation of the switch, an additional species (I12) is used to form an incoherent feed-forwardloop. Species s13 and s14 are used to initially inhibit the switch, giving enough time to the bistable switch to reach a valid state. Both state species from the bistablecircuit can then be used as oscillators of half the original frequency, in opposition of phase. (Online version in colour.)
rsif.royalsocietypublishing.orgJ.R.Soc.Interface
11:20131167
8
on January 29, 2014rsif.royalsocietypublishing.orgDownloaded from
This can be achieved in an actual experiment by reducing the
actual quantity of enzyme introduced in the system. Each of
the three enzymes creates different behaviours when they are
set to be the bottleneck of the reaction system, leading to
interesting dynamics. For instance, very low exonuclease
means that a dominating species will receive most of the
degradation, thus protecting other species that would not
survive otherwise. Conversely, very low polymerase enables
the winner-takes-all effect described by Kim et al. as shown in
figure 12. Saturation can also be harnessed to generate var-
ious behaviours, such as oscillations (figure 13) in a system
that would be stable otherwise.
s2
s1
(a) (b) (c)
0 100 200 300 400 500 600 700 800 900 1000time (min)
0 100 200 300 400 500 600 700 800 900 1000time (min)
100
200
300
400
500
600
20
40
60
80
100
120
conc
entr
atio
n (n
M)
s1s2
s1s2
Figure 12. (a) Winner-takes-all effect. Time trace of two simple autocatalysts, with (b) and without (c) saturation. Interaction is done only through competition forthe polymerase enzyme, other enzymes are set to work in first-order regime. In this case, the autocatalyst s1 has more template than s2, resulting in the completedisappearance of the latter. (Online version in colour.)
s2
I4I3
s1
(a)
(b)
(c) (d)
0 30002500200015001000500time (min)
s1s2
s1s2
0 30002500200015001000500time (min)
1
2
3
4
5
–10
0
10
20
30
40
50
60
70
80
2
4
6
8
10
12
14
conc
entr
atio
n (n
M)
conc
entr
atio
n (n
M)
s1s2
Figure 13. (a) Saturation-based oscillations. In those systems, saturation works mostly at the polymerase level. Each network, having positive and negative feed-backs but lacking delay, produces damped oscillations (b). When they are put together in a system, one network starting loads the polymerase, reinforcing the decayof the other. The two systems then tend to use the polymerase alternately and thus synchronize in opposite phases. Each of them feels an apparent oscillatingpolymerase activity, which provides the additional nonlinearity necessary to compensate for the damping. Oscillations can be symmetrical if template concentrationsare identical (c), or asymmetric if there is a small difference in concentrations (d). (Online version in colour.)
rsif.royalsocietypublishing.orgJ.R.Soc.Interface
11:20131167
9
on January 29, 2014rsif.royalsocietypublishing.orgDownloaded from
3.5. Complex system: the Mastermind gameFinally, as a proof of concept of modular design, we
implemented a large system where repeating motifs were
connected together. For this purpose, we chose to implement
a version of Mastermind, a classic board game in which one
player decides a secret combination that the other player tries
to guess. We chose to have two possible symbols and a com-
bination of length four. The design was done incrementally.
First, we created a guess validation module, combining a bis-
table (memory), an input system (signal amplification) and a
reporter. The response was optimized in a saturated environ-
ment using CMA-ES. We then combined four such modules
and optimized again to cover all input possibilities. The
whole system is shown in figure 14. The design strategy is
explained in the electronic supplementary material. A
sample game is shown in figure 15.
4. ConclusionIn this study, we presented a mathematical model for the simu-
lation of systems designed with the DNA toolbox. We also
introduced DACCAD, a software created to help design such
systems. DACCAD allows its user to quickly create new DNA
toolbox systems by using its intuitive graphical interface. Such
systems can then be refined at will by setting a large range of par-
ameters to fit the user’s experimental conditions. Once the
design is complete, it is possible to move on to the actual DNA

I36
s47
s25s22
s35
s8s42
s54
s55
s31
s28
s21
s46
s10s32
s40
s33s37
s30
s9 s7s39
s17s34
s11s18
s49
s12s27
s20
s52
s51s1
s19
s15
I23
I5
I45
I4I29
I53I2
I13I43
I56
I26 I3
I44 I24
I41
I16
I38 I48 I14 I6
Figure 14. Implementation of the Mastermind game. State bistable circuits are shown in blue, possible inputs in green, reporter species in yellow and lock speciesin red.
0 3000 3500 4000
BABABAAAAAAAAAAB
output (s55)I56
45002500200015001000500time (min)
–5
0
5
10
15
20
25
30
conc
entr
atio
n (n
M)
Figure 15. Mastermind game. The state of a given position can be either A or B. Each attempt improves the guess until the correct answer, BABA, is found on thefourth trial.
rsif.royalsocietypublishing.orgJ.R.Soc.Interface
11:20131167
10
on January 29, 2014rsif.royalsocietypublishing.orgDownloaded from
sequence design, using tools such as NUPACK [36] or DINA-
Melt [37,38] and the design rules presented in Baccouche et al.[29]. While the value of some parameters, such as the release
slowdown owing to coaxial stacking, can be hard to predict,
the actual value can be measured through some basic exper-
iments and then updated in DACCAD, allowing the quick
correction of a design. Such parameters can also be slightly
modified from their actual experimental value to encompass
more specific or sequence-dependent effects [54,55]. Finding
a way to fit such experimental parameters directly from
fluorescence data could be an important future application.
Note also that the very strength of DACCAD, i.e. its black
box handling of kinetic complexities, brings along a limit-
ation: it can only work with pure polymerase–nickase
activator–inhibitor systems, and other reactions, such as
hairpin formation from the predator–prey system [15], are
forbidden. However, handling of additional operations can
be performed through external software as DACCAD
models can be exported in the widely used SBML format.
In particular, it is possible to quickly generate the DNA tool-
box part of a system and then move on to another software to
add operations. In that sense, DACCAD can be seen as a
compiler graph to SBML, allowing the algorithmic generation
of DNA toolbox systems (for example, systems trying to solve
instances of the 3-SAT problem [56]). Moreover, this gener-
ation is facilitated by its simple graph description file format.
We then showed how the software can be used to design
systems of increasing complexity. In particular, one can also
observe different behaviours, such as saturation-based oscil-
lation or the winner-takes-all effect. Local optimization can
also be performed by using the state-of-the-art algorithm
CMA-ES. Moreover, the mathematical model can be easily
re-used with other design techniques, such as evolutionary
algorithms, which may help optimizing systems following
multiple possible objectives [57], or find new design patterns
to create complex systems [51,52]. It would also be interesting
to investigate two-dimensional reaction–diffusion implemen-
tations of the DNA toolbox [16,17], which would prove
beneficial to develop smart materials or create particular
spatio-temporal patterns. To do so, DACCAD could be extended
to add diffusion terms to the current equations, and then export
them to be solved by fast off-the-shelf reaction–diffusion simula-
tion software, such as READY (https://code.google.com/p/
reaction-diffusion/).
rsif.royalsocietypublishing
11
on January 29, 2014rsif.royalsocietypublishing.orgDownloaded from
It is our hope that this software will speed up the creation of
novel networks as well as spread the usage of molecular pro-
gramming to a broader audience. The mathematical model of
the DNA toolbox presented here might also give new theoreti-
cal insights on its power, such as whether it would be possible
to approximate arbitrary CRNs. The executable file and all
examples from this article can be found at http://www.yan-
nick-rondelez.com/downloads/. The code can be obtained
by contacting the first author.
Acknowledgements. We thank Prof. Nicolas Bredeche, Dr AnthonyGenot, Dr Adrien Padirac and Alexandre Baccouche for usefuldiscussions, the anonymous reviewers and all the DACCAD beta tes-ters, who provided useful insights into the organization of thesoftware and priceless bug reports.
Endnote1Java 6 is required. Minimum specifications are available online onOracle’s website at http://www.oracle.com/technetwork/java/javase/config-417990.html.
.orgJ.R.
ReferencesSoc.Interface11:20131167
1. Qian L, Winfree E. 2011 A simple DNA gate motif forsynthesizing large-scale circuits. J. R. Soc. Interface 8,1281 – 1297. (doi:10.1098/rsif.2010.0729)
2. Qian L, Winfree E. 2011 Scaling up digital circuitcomputation with DNA strand displacementcascades. Science 332, 1196 – 1201. (doi:10.1126/science.1200520)
3. Montagne K, Plasson R, Sakai Y, Fujii T, Rondelez Y.2011 Programming an in vitro DNA oscillator usinga molecular networking strategy. Mol. Syst. Biol. 7,466. (doi:10.1038/msb.2010.120)
4. Padirac A, Fujii T, Rondelez Y. 2012 Bottom-upconstruction of in vitro switchable memories. Proc.Natl Acad. Sci. USA 109, E3212 – E3220. (doi:10.1073/pnas.1212069109)
5. Wagner A, Fell DA. 2001 The small world insidelarge metabolic networks. Proc. R. Soc. Lond. B 268,1803 – 1810. (doi:10.1098/rspb.2001.1711)
6. Soloveichik D, Seelig G, Winfree E. 2010 DNA as auniversal substrate for chemical kinetics. Proc. NatlAcad. Sci. USA 107, 5393 – 5398. (doi:10.1073/pnas.0909380107)
7. Seelig G, Soloveichik D, Zhang DY, Winfree E. 2006Enzyme-free nucleic acid logic circuits. Science 314,1585 – 1588. (doi:10.1126/science.1132493)
8. Magnasco MO. 1997 Chemical kinetics is Turinguniversal. Phys. Rev. Lett. 78, 1190 – 1193. (doi:10.1103/PhysRevLett.78.1190)
9. Winfree E. 1998 Algorithmic self-assembly of DNA.Doctoral dissertation. California Institute ofTechnology.
10. Murray JD. 2002 Mathematical biology I: anintroduction, 3rd edn. Berlin, Germany: Springer.
11. Branicky MS. 1998 Multiple Lyapunov functions andother analysis tools for switched and hybridsystems. IEEE Automat. Control 43, 475 – 482.(doi:10.1109/9.664150)
12. Tyson JJ, Chen KC, Novak B. 2003 Sniffers,buzzers, toggles and blinkers: dynamics ofregulatory and signaling pathways in the cell.Curr. Opin. Cell Biol. 15, 221 – 231. (doi:10.1016/S0955-0674(03)00017-6)
13. Chiniforooshan E, Doty D, Kari L, Seki S. 2011Scalable, time-responsive, digital, energy-efficientmolecular circuits using DNA strand displacement. InDNA computing and molecular programming (eds YSakakibara, Y Mi). Lecture Notes in ComputerScience, no. 6518, pp. 25 – 36. Berlin, Germany:Springer. (doi:10.1007/978-3-642-18305-8_3)
14. Genot AJ, Bath J, Turberfield AJ. 2011 Reversiblelogic circuits made of DNA. J. Am. Chem. Soc. 133,20 080 – 20 083. (doi:10.1021/ja208497p)
15. Fujii T, Rondelez Y. 2012 Predator – prey molecularecosystems. ACS Nano 7, 27 – 34. (doi:10.1021/nn3043572)
16. Padirac A, Fujii T, Estevez-Torres A, Rondelez Y. 2013Spatial waves in synthetic biochemical networks.J. Am. Chem. Soc. 135, 14 586 – 14 592. (doi:10.1021/ja403584p)
17. Padirac A. 2012 Tailoring spatiotemporal dynamicswith DNA circuits. Doctoral dissertation, Universityof Lyon.
18. Hasatani K, Leocmach M, Genot AJ, Estevez-TorresA, Fujii T, Rondelez Y. 2013 High-throughputobservation of compartmentalized biochemicaloscillators. Chem. Commun. 49, 8090 – 8092.(doi:10.1039/c3cc44323j)
19. Kim J, Hopfield JJ, Winfree E. 2004 Neural networkcomputation by in vitro transcriptional circuits. Adv.Neural Inf. 17, 681 – 688.
20. Wong WW, Tsai TY, Liao JC. 2007 Single-cell zeroth-order protein degradation enhances the robustnessof synthetic oscillator. Mol. Syst. Biol. 3, 130.(doi:10.1038/msb4100172)
21. Rondelez Y. 2012 Competition for catalyticresources alters biological network dynamics.Phys. Rev. Lett. 108, 018102. (doi:10.1103/PhysRevLett.108.018102)
22. Zhang DY, Winfree E. 2009 Control of DNA stranddisplacement kinetics using toehold exchange.J. Am. Chem. Soc. 131, 17 303 – 17 314. (doi:10.1021/ja906987s)
23. Kim J, Winfree E. 2011 Synthetic in vitrotranscriptional oscillators. Mol. Syst. Biol. 7, 465.(doi:10.1038/msb.2010.119)
24. Zaikin AN, Zhabotinsky AM. 1970 Concentrationwave propagation in two-dimensional liquid-phaseself-oscillating system. Nature 225, 535 – 537.(doi:10.1038/225535b0)
25. Goodwin BC. 1965 Oscillatory behavior in enzymaticcontrol processes. Adv. Enzyme Regul. 3, 425 – 437.(doi:10.1016/0065-2571(65)90067-1)
26. Elowitz MB, Leibler S. 2000 A synthetic oscillatorynetwork of transcriptional regulators. Nature 403,335 – 338. (doi:10.1038/35002125)
27. Barabasi AL, Oltvai ZN. 2004 Network biology:understanding the cell’s functional organization. Nat.Rev. Genet. 5, 101 – 113. (doi:10.1038/nrg1272)
28. Hill AV. 1910 The possible effects of the aggregationof the molecules of haemoglobin on its dissociationcurves. J. Physiol. 40, 4 – 7.
29. Baccouche A, Montagne K, Padirac A, Rondelez Y.Submitted. Dynamic DNA-toolbox reaction circuits: awalkthrough.
30. Lakin MR, Youssef S, Polo F, Emmott S, Phillips A.2011 Visual DSD: a design and analysis tool for DNAstrand displacement systems. Bioinformatics 27,3211 – 3213. (doi:10.1093/bioinformatics/btr543)
31. Lakin MR, Parker D, Cardelli L, Kwiatkowska M,Phillips A. 2012 Design and analysis of DNA stranddisplacement devices using probabilistic modelchecking. J. R. Soc. Interface 9, 1470 – 1485. (doi:10.1098/rsif.2011.0800)
32. Genot AJ, Fujii T, Rondelez Y. 2012 Computing withcompetition in biochemical networks. Phys. Rev.Lett. 109, 208102. (doi:10.1103/PhysRevLett.109.208102)
33. Genot AJ, Fujii T, Rondelez Y. 2013 Scaling downDNA circuits with competitive neural networks.J. R. Soc. Interface 10, 20130212. (doi:10.1098/rsif.2013.0212)
34. Hucka M et al. 2003 The systems biology markuplanguage (SBML): a medium for representation andexchange of biochemical network models.Bioinformatics 19, 524 – 531. (doi:10.1093/bioinformatics/btg015)
35. Finney A, Hucka M. 2003 Systems biology markuplanguage: level 2 and beyond. Biochem. Soc. Trans.31, 1472 – 1473. (doi:10.1042/BST0311472)
36. Zadeh JN, Steenberg CD, Bois JS, Wolfe BR, PierceMB, Khan AR, Dirks RM, Pierce NA. 2011 NUPACK:analysis and design of nucleic acid systems.J. Comput. Chem. 32, 170 – 173. (doi:10.1002/jcc.21596)
37. Markham NR, Zuker M. 2005 DINAMelt web serverfor nucleic acid melting prediction. Nucleic AcidsRes. 33, W577 – W581. (doi:10.1093/nar/gki591)
38. Markham NR, Zuker M. 2008 UNAFold: software fornucleic acid folding and hybridization. Methods Mol.Biol. 453, 3 – 31. (doi:10.1007/978-1-60327-429-6_1)
39. Hoops S et al. 2006 COPASI: a complex pathwaysimulator. Bioinformatics 22, 3067 – 3074. (doi:10.1093/bioinformatics/btl485)
40. Rothemund PW. 2006 Folding DNA to createnanoscale shapes and patterns. Nature 440,297 – 302. (doi:10.1038/nature04586)
rsif.royalsocietypublishing.orgJ.R.Soc.Interface
11:20131167
12
on January 29, 2014rsif.royalsocietypublishing.orgDownloaded from
41. Wei B, Dai M, Yin P. 2012 Complex shapesself-assembled from single-stranded DNAtiles. Nature 485, 623 – 626. (doi:10.1038/nature11075)
42. Ke Y, Ong LL, Shih WM, Yin P. 2012 Three-dimensional structures self-assembled from DNAbricks. Science 338, 1177 – 1183. (doi:10.1126/science.1227268)
43. Douglas SM, Marblestone AH, Teerapittayanon S,Vazquez A, Church GM, Shih WM. 2009 Rapidprototyping of 3D DNA-origami shapes withcaDNAno. Nucleic Acids Res. 37, 5001 – 5006.(doi:10.1093/nar/gkp436)
44. Castro CE, Kilchherr F, Kim D-N, Shiao EL, Wauer T,Wortmann P, Bathe M, Dietz H. 2011 A primer toscaffolded DNA origami. Nat. Methods 8, 221 – 229.(doi:10.1038/nmeth.1570)
45. Plasson R, Rondelez Y. 2013 Synthetic biochemicaldynamic circuits. In Multiscale analysis andnonlinear dynamics: from genes to the brain,pp. 113 – 145. Weinheim, Germany: Wiley-VCH.(doi:10.1002/9783527671632.ch05)
46. Zhang DY, Turberfield AJ, Yurke B, Winfree E. 2007Engineering entropy-driven reactions and networks
catalyzed by DNA. Science 318, 1121 – 1125.(doi:10.1126/science.1148532)
47. O’Madadhain J, Fisher D, Smyth P, White S, Boey YB.2005 Analysis and visualization of network data usingJUNG. J. Stat. Softw. 10, 1 – 25.
48. Gilbert D. 2002 The JFreeChart class library,developer guide. Harpenden, UK: Object Refinery.
49. Hairer E, Nørsett SP, Wanner G. 1987 Solvingordinary differential equations I. Nonstiff problems.Berlin, Germany: Springer.
50. Hansen N, Ostermeier A. 1996 Adapting arbitrarynormal mutation distributions in evolutionstrategies: the covariance matrix adaptation. In Proc.IEEE Int. Conf. on Evolutionary Computation, Nagoya,Japan, 20 – 22 May 1996, pp. 312 – 317. (doi:10.1109/ICEC.1996.542381)
51. Dinh QH et al. In press. An effective method forevolving reaction network in synthetic biochemicalsystems. IEEE Trans. Evolut. Comput.
52. Aubert N et al. 2013 Evolving cheating DNAnetworks: a case study with the rock-paper-scissors game. In Advances in artificial life,ECAL, vol. 12, pp. 1143 – 1150. Cambridge, MA:MIT Press.
53. Franco E, Friedrichs E, Kim J, Jungmann R, MurrayR, Winfree E, Simmel FC. 2011 Timing molecularmotion and production with a synthetictranscriptional clock. Proc. Natl Acad. Sci. USA 108,E784 – E793. (doi:10.1073/pnas.1100060108)
54. Pyshnyi DV, Ivanova EM. 2004 The influence ofnearest neighbours on the efficiency of coaxialstacking at contiguous stacking hybridization ofoligodeoxyribonucleotides. Nucleos. Nucleot. Nucl.Acids 23, 1057 – 1064. (doi:10.1081/NCN-200026071)
55. Qian J, Ferguson TM, Shinde DN, Ramirez-Borrero AJ,Hintze A, Adami C, Niemz A. 2012 Sequencedependence of isothermal DNA amplification via EXPAR.Nucleic Acids Res. 40, e87. (doi:10.1093/nar/gks230)
56. Hagiya M, Kawamata I, Aubert N. 2013 Towardspersistent molecular computers for molecularrobots. In Proc. 19th Int. Conf. on DNA Computingand Molecular Programming, Tempe, AZ, USA,22 – 27 September 2013.
57. Warmflash A, Francois P, Siggia ED. 2012 Paretoevolution of gene networks: an algorithm tooptimize multiple fitness objectives. Phys. Biol. 9,056001. (doi:10.1088/1478-3975/9/5/056001)

Computer Assisted Design for Scaling Up Systems based on
DNA Reaction Networks
Supplementary materials
Nathanael Aubert1, Clement Mosca2, Teruo Fujii2, Masami Hagiya1, Yannick Rondelez2
1 Graduate School of Information Science and Technology, University of Tokyo, Japan2 LIMMS/CNRS-IIS, Institute of Industrial Science, University of Tokyo, Japan
naubert, hagiya{@is.s.u-tokyo.ac.jp}, [email protected]
S1 In vitro implementation of the DNA toolbox
In Padirac et al.’s implementation, on which the default parameters of DACCAD are based,signal strands are 11-mers, while inhibition is done by 15-mers. Inhibitors strands is madeof three parts: the first seven nucleotides are complementary to the end of the input strand,the next six are complementary to the beginning of the output strand and the last two aremismatched with the target template to prevent elongation by the polymerase. Note that itcould be possible to make the inhibitors occupy the target template in different locations, aslong as the nicking recognition/cutting sites are not produced. This inhibition strategy alsomakes it hard to have inhibition of templates generating inhibitors, since the output of suchtemplates, being inhibitors themselves, will have a long toehold to displace their inhibitor. Usingspecific (longer) inhibitors was not deemed a good solution, since those inhibitors, in turn, willrequire even longer strands, and so on. Instead, it is possible to use an intermediate activationof inhibitor (A generates B which generates the inhibitor) and inhibit the first step (A generatesB). See Baccouche et al. [28] for additional details.
S2 Default parameters
Association constants and strand-displacement speeds are based on Zhang et al.’s values [22].Strands dissociation constants and Michaelis-Menten parameters for the enzymes are taken fromPadirac et al.’s measurements [4]. The value of enzyme activities are also taken from Padiracet al.’s experiment, except for the nickase activity, for which the fitted value was taken instead.The slowdown due to coaxial stacking is computed following a simple two-state model: whenthe bases at the nick are stacked, the DNA complex is considered stable and, as such, does notdenature; when the bases are not stacked, the release happens without at the normal speed(actually, faster, because there is no dangle stabilization). The reactions going from one stateto the other are considered at equilibrium, which allows us to use the equilibrium constants asthe slowdown ratio. Values for this ratio were trickier, as there is not only a strong sequencedependence [S1], but this dependence is not even limited to the nearest-neighbours [54]. To getrealistic values, we considered the opening/stacking energy described by Frank-Kamenetskii’sgroup [S2], with salt and temperature (42◦C) corrections [S3] to match the experimental valuesof the DNA toolbox. Since we only care about the relative increase in stability compared toa single-stranded input or output present on the template, we have to reduce those values totake into account the stability increase of dangles [S4] (those values were also corrected for thetemperature, and averaged in the same way that Frank-Kamenetskii’s group [S2] to be able to
1
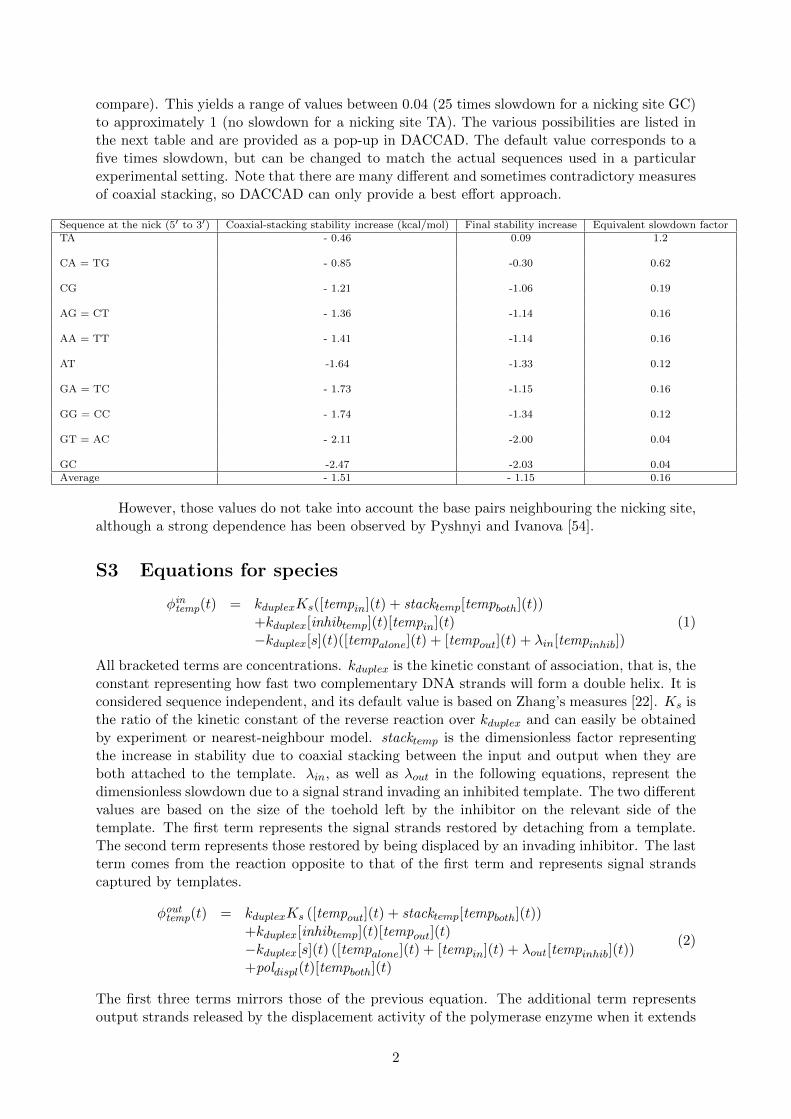
compare). This yields a range of values between 0.04 (25 times slowdown for a nicking site GC)to approximately 1 (no slowdown for a nicking site TA). The various possibilities are listed inthe next table and are provided as a pop-up in DACCAD. The default value corresponds to afive times slowdown, but can be changed to match the actual sequences used in a particularexperimental setting. Note that there are many different and sometimes contradictory measuresof coaxial stacking, so DACCAD can only provide a best effort approach.
Sequence at the nick (5′ to 3′) Coaxial-stacking stability increase (kcal/mol) Final stability increase Equivalent slowdown factorTA - 0.46 0.09 1.2
CA = TG - 0.85 -0.30 0.62
CG - 1.21 -1.06 0.19
AG = CT - 1.36 -1.14 0.16
AA = TT - 1.41 -1.14 0.16
AT -1.64 -1.33 0.12
GA = TC - 1.73 -1.15 0.16
GG = CC - 1.74 -1.34 0.12
GT = AC - 2.11 -2.00 0.04
GC -2.47 -2.03 0.04Average - 1.51 - 1.15 0.16
However, those values do not take into account the base pairs neighbouring the nicking site,although a strong dependence has been observed by Pyshnyi and Ivanova [54].
S3 Equations for species
φintemp(t) = kduplexKs([tempin](t) + stacktemp[tempboth](t))
+kduplex[inhibtemp](t)[tempin](t)−kduplex[s](t)([tempalone](t) + [tempout](t) + λin[tempinhib])
(1)
All bracketed terms are concentrations. kduplex is the kinetic constant of association, that is, theconstant representing how fast two complementary DNA strands will form a double helix. It isconsidered sequence independent, and its default value is based on Zhang’s measures [22]. Ks isthe ratio of the kinetic constant of the reverse reaction over kduplex and can easily be obtainedby experiment or nearest-neighbour model. stacktemp is the dimensionless factor representingthe increase in stability due to coaxial stacking between the input and output when they areboth attached to the template. λin, as well as λout in the following equations, represent thedimensionless slowdown due to a signal strand invading an inhibited template. The two differentvalues are based on the size of the toehold left by the inhibitor on the relevant side of thetemplate. The first term represents the signal strands restored by detaching from a template.The second term represents those restored by being displaced by an invading inhibitor. The lastterm comes from the reaction opposite to that of the first term and represents signal strandscaptured by templates.
φouttemp(t) = kduplexKs ([tempout](t) + stacktemp[tempboth](t))
+kduplex[inhibtemp](t)[tempout](t)−kduplex[s](t) ([tempalone](t) + [tempin](t) + λout[tempinhib](t))+poldispl(t)[tempboth](t)
(2)
The first three terms mirrors those of the previous equation. The additional term representsoutput strands released by the displacement activity of the polymerase enzyme when it extends
2

a nicked duplex. poldispl represents the polymerase activity when displacing a substrate. Whenthis substrate is long enough (for instance an inhibitor), this activity is slowed down by anadditional factor, specific to the length of the substrate. If not, the increased affinity for thepolymerase is considered to be offset by the slowdown, so that poldispl ' pol. Note that thepolymerase activity pol only appears in the equations relative to the internal update of templates(see next Section).
φinhib(t) = αkduplexKi[tempinhib](t)−kduplex[i](t) ([tempalone](t) + [tempin](t) + [tempout](t))+kduplex[tempinhib](t) (λin[sin](t) + λout[sout](t))
(3)
Where α represents the fact that an inhibition strand is less stable on its target than on thetemplate that created it due to sequence mismatch (see Figure 1).
S4 Equation set for templates
The equations for the update of a module temp taking sin as input, sout as output and sinhibas inhibitor are as follow:
d[tempalone]
dt(t) = kduplex (Kin[tempin](t) +Kout[tempout](t) + αKinhib[tempinhib](t))
−kduplex[tempalone](t) ([sin](t) + [sout](t) + [sinhib](t))
d[tempin]
dt(t) = kduplex[sin](t) ([tempalone](t) + λin[tempinhib](t)) + kduplexKout[tempboth]
−kduplex[tempin](t) (Kin + [sout](t) + [sinhib](t))− pol(t)[tempin](t)
d[tempout]
dt(t) = kduplex[sout](t) ([tempalone](t) + λout[tempinhib](t)) + kduplexKin[tempboth]
−kduplex[tempout](t) (Kout + [sin](t) + [sinhib](t))
d[tempboth]
dt(t) = kduplex ([sin](t)[tempout](t) + [sout](t)[tempin](t)) + nick(t)[tempext](t)
−kduplexstack[tempboth](t) (Kin +Kout)− poldispl(t)[tempboth](t)
d[tempext]
dt(t) = pol(t)[tempin](t) + poldispl(t)[tempboth](t)− nick(t)[tempext](t)
d[tempinhib]
dt(t) = kduplex[sinhib](t) ([tempalone](t) + [tempin](t) + [tempout](t))
−kduplex[tempinhib](t) (αKinhib + λin[sin](t) + λout[sout](t))
S5 Equation set for enzymes
While the basic model does not take into account enzyme saturation, preferring first orderactivity, this assumption is not realistic for complex systems. Specifically, all modules aresharing the same three enzymes, which is expected to have an impact on their activity. Theusual way to model such burden is to use a Michaelis-Menten term to quantify the enzymaticactivity. Such term is further modified to take into account that multiple modules are competingfor those resources [21].
The exonuclease term becomes:
exos(t) =Vm,exo
Ksm,exo
(1 +
∑s′∈seq
[s′](t)
Ks′m,exo
) (4)
3

where Vm,exo is the maximum theoretical rate and Ksm,exo the Michaelis constant for the
species s. Note than in our model Vm,exo is independent of s and Ksm,exo can only take one
of two values, depending on whether s is an inhibition species or not.The polymerase activity is separated in two terms: pol for templates with input alone and
poldispl in the case where both input and output are present. We consider that the polymerasedoes not interact noticeably with other states of the template.
pol(t) =Vm,pol
Km,pol
(1 +
∑temp
[tempin](t)
Km,pol+
[tempboth](t)
Km,displ
)
poldispl(t) =Vm,displ
Km,displ
(1 +
∑temp
[tempin](t)
Km,pol+
[tempboth](t)
Km,displ
) (5)
Note that Vm,displ depends on the length of the output.The nickase term is the simplest. We consider that only fully double stranded templates
can capture this enzyme, yielding:
nick(t) =Vm,nick
Km,nick
(1 +
∑temp
[tempext](t)
Km,nick
) (6)
4

S6 Full equation set for an autocatalytic module
In the case of a simple autocatalytic module s→ s, we get the following equations:
d[s]
dt(t) = kduplex · Ks · ([tempin](t) + [tempout](t) + 2 stack · [tempboth](t))
− kduplex · [s](t) · (2 [tempalone](t) + [tempin](t) + [tempout](t))
+ pol(t) · [tempboth](t) − exos(t) · [s](t)
d[tempalone]
dt(t) = kduplex · ([tempin](t) + [tempout](t))
− 2 kduplex · [s](t) · [tempalone](t)
d[tempin]
dt(t) = kduplex · ([s](t) · [tempalone](t) + stack · Ks · [tempboth](t))
− kduplex · [tempin](t) · ([s](t) +Ks) − pol · [tempin](t)
d[tempout]
dt(t) = kduplex · ([s](t) · [tempalone](t) + stack · Ks · [tempboth](t))
− kduplex · [tempout](t) · ([s](t) +Ks)
d[tempboth]
dt(t) = kduplex · [s](t) · ([tempin](t) + [tempout](t))
− 2 stack · kduplex · Ks · [tempboth](t)
+nick · [tempext](t) − pol · [tempboth](t)
d[tempext]
dt(t) = pol · ([tempin](t) + [tempout](t))
−nick · [tempext](t)
exos(t) =Vm,exo
Km,short ·(
1 + [s](t)Km,short
+ [tempalone](t)Km,temp
)pol(t) =
Vm,pol
Km,pol ·(
1 + [tempin](t)Km,pol
+ [tempboth]Km,displ
)nick =
Vm,nick
Km,nick + [tempext](t)
5

Figure S1: Graph animation, relative to the time trace. The simulated system is a three-switchoscillator [17] without enzymatic saturation.
S7 Dynamic graph display
Linking structure and behaviour of a toolbox system can be challenging, especially with largesystems. For this reason, we implemented a module displaying a dynamic representation ofthe network. This module provides an animated version of the graph, in which the radiusesof the nodes are updated to be proportional to the logarithm of the concentration of theircorresponding species at a particular time. We chose to use a logarithmic representation to beable to see variations of concentrations at multiple orders of magnitude. The edges are alsoupdated, using a gradient of colour to represent the concentration of corresponding templatesbeing occupied by a signal strand (i.e. a completely inhibited connection would appear in grey).Furthermore, to make the graph easier to read, it is drawn using a standard spring-electricalgraph drawing algorithm [S6] (each node is given a repulsive force for all other nodes and anattractive force which applies specifically to the nodes with which it is connected). This hasproven to be satisfying in terms of display results and computing time.
Enzymatic saturation is also displayed, giving the user a better understanding of the underthe hood mechanisms going on at a given time.
As an example, we show some variations of the grapho of Padirac’s switch oscillator, asystem that uses three autocatalitic modules inhibiting each other in a circular pattern (FigureS1). Interestingly, the oscillations occur in the reverse order of inhibition, a fact that might becounter-intuitive. It can be hard to find this property by only reading the time plot, if one isnot looking for it. On the other hand, the activation order is obvious when watching the graphanimation.
6

Figure S2: Bistability domains of Padirac et al.’s experiments [4] (top left) and of simulationswith various template concentration bonuses: 15% (bottom left), 20% (top right) and 25%.Without bonus, α always win over the considered range, which could be explained by incorrectcoaxial stack slowdown.
S8 Comparison of stability diagram between Padirac et al.’sexperiment and DACCAD simulation
Simulation of the bistable circuit was done using the parameters measured by Padirac et al. [4].Coaxial stacking values were set using the nucleotide sequences described in their work and thetable from Section S2. Finally, based on their discussion of possible difference in activity of thepolymerase and the experimental values of Qian et al. [S5], templates relative to β were givena concentration bonus, due to their expected higher affinity with the polymerase. Simulationresults for different bonus are shown alongside Padirac et al.’s experimental results (Figure S2).Without template correction, the system is still bistable, but the attraction basin of the high βstate is too small to appear on the Figure.
7

S9 Design of the Mastermind system
In the Mastermind game, one player decides of a secret combination and a second player triesto guess it in the least amount of attempts. A combination is a sequence of symbols (usuallycolours) in which order is important. After each guess from the second player, the first playerannounce how many symbols are correctly placed (correct guess) and how many symbols amongthe remaining do appear in the combination, but at a different position (misplaced guess). Forinstance, if the combination was red-green-blue-black, a guess of red-red-red-red would giveone correct, zero misplaced and a guess of black-blue-green-red would yield zero correct, fourmisplaced. While, in the original game, there are multiple possibilities for each position, wesimplify it to use only two different symbols (A and B). For this reason, we also don’t give theamount of misplaced guesses, as it would make the game too easy.
We designed a simple version of this game using DACCAD. In our version, we use fourbistable motifs to store the secret code decided by one player. The opponent may inject oneof two possible species per position. If the correct species was selected, a downstream speciesis activated that we call “reporter” species. If all “reporter” species are present, then theconcentration of the “lock” species falls to zero, indicating victory. To determine the number ofcorrect guesses, the concentration of the reporter species may be measured through fluorescencein a real implementation. By using the same fluorophore for all of them, the only relevantinformation is the level of fluorescence which is equivalent to the number of correct guesses. Itis also possible to use the drop of the “lock” species as a hint, although this modification is notlinear with the number of correct results, which might be confusing.
The design of this system was done step by step, starting from a single bistable circuit (bluesubsystem in Figure 14). This circuit was then complemented to prevent the expression of thereporter species (yellow in Figure 14). Then the two possible inputs were added. DACCAD wasnot only useful to adjust the various template concentrations until the behaviour was correct,it also showed that inputs strands where not surviving long enough to have an impact on thesystem. This prompted the development of the specialised input module (green in Figure 14).The indirect activation generates a large amount of intermediary species (see Figure 3), which inturn has enough strength to allow the creation of reporter species (yellow in Figure 14). Finally,a direct activation is also added to counter the delay induced through the indirect activation.Saturations were then turned on and templates concentrations were optimized using CMA-ESuntil reaching a satisfying response to input. To do so, the reporter circuit was simulated forabout 2000 minutes. To get a saturation similar to that of the final system, dummy autocatalyticand activation templates were also included in the system. At 500 and 1500 minutes inputswere added; first the input corresponding to the state of the bistable circuit, then the onecorresponding to the other possible state. The long delay was used to ensure that the steady-state is reached at the time of input. The optimization target was then set to have a largeresponse when the correct input is added and no answer otherwise. Once the optimization wasdone, template concentrations were adjusted so that the system would be symmetrical. Wealso rounded those concentrations to the nearest integer, to take into account the maximumprecision of the experimental material.
Once the complete reporter circuit was considered correct, it was duplicated and the tworesulting circuits were connected, forwarding information about the correctness of the guess.Then this whole system was duplicated once more and connected through an inhibition of thelock species (red in Figure 14). Concentrations of the connecting templates were then optimizedso that the behaviour of the system, that is the level of the lock species and reporters reflectedroughly linearly the amount of correct guesses. Restriction to those templates is necessary tolimit the number of evolved parameters. This is important due to the simulation time requiredfor the complete system, in all possible configurations. Particular attention was given to thecase with only two correct guesses, which can result in two possible configurations: either both
8

guesses are on the same “side” (that is on two directly connected bistable circuits) or on theopposite sides. In the first attempts at creating the system, there was a strong asymmetrybetween those two cases, due to the fact that the first case would saturate the template goingfrom the connection species (like s42 in Figure 14) to the final inhibitor, so that inhibition wasstronger when distributed. Through optimization, the concentrations were adjusted so thatthe production of both connection species would always stay in the linear response zone of thetemplates connecting them to the final inhibitor. Finally, we edited the concentrations againfollowing the guidelines from the previous paragraph.
As mentioned, this system does not include misplaced guesses, since they would provide toomuch information and spoil the fun in this version of the game. In a more complex versionof this game, one way to encode those alternative reporters is to use an indirect activationgoing from all state species, inhibited if that position was correctly guessed, to a state-specificglobal reporter, representing how many positions have yet to be matched. The last activationis inhibited by compatible guesses that do not match locally. The difference between the twospecies concentration would then represent the number of misplaced matches.
References
[S1] Vasiliskov, V. A., Prokopenko, D. V., & Mirzabekov, A. D. (2001). Parallel multiplex ther-modynamic analysis of coaxial base stacking in DNA duplexes by oligodeoxyribonucleotidemicrochips. Nucleic acids research, 29(11), 2303-2313.
[S2] Yakovchuk, P., Protozanova, E., & Frank-Kamenetskii, M. D. (2006). Base-stacking andbase-pairing contributions into thermal stability of the DNA double helix. Nucleic acidsresearch, 34(2), 564-574.
[S3] Protozanova, E., Yakovchuk, P., & Frank-Kamenetskii, M. D. (2004). Stacked–unstackedequilibrium at the nick site of DNA. Journal of molecular biology, 342(3), 775-785.
[S4] Bommarito, S., Peyret, N., & SantaLucia Jr, J. (2000). Thermodynamic parameters forDNA sequences with dangling ends. Nucleic Acids Research, 28(9), 1929-1934.
[S5] Qian, J., Ferguson, T. M., Shinde, D. N., Ramırez-Borrero, A. J., Hintze, A., Adami, C.,& Niemz, A. (2012). Sequence dependence of isothermal DNA amplification via EXPAR.Nucleic acids research, 40(11), e87-e87.
[S6] Hu, Y. (2005). Efficient, high-quality force-directed graph drawing. Mathematica Journal,10(1), 37-71.
9