computational accuracy in dsp implementationsmece493.cankaya.edu.tr/uploads/files/sensors.pdf ·...
TRANSCRIPT

INTRODUCTION
Dimensonal changes may be measured by variations in Resistance
Inductance
Capacitance
Piezoelectric effect
Thermistors and thermocouples are employed to measure body temperatures.
Electromagnetic radiation sensors include thermal and photon detectors.

2.1 Displacement Measurements
The physican and biomedical researcher are interested in measuring the size, shape and position of the organs and tissues of the body.
Variations in these parameters are important in discriminating normal from abnormal function
Displacement sensors can be used in both direct and indirect systems of the measurement.
Direct measurements of the displacement are used to determine the change in diameter of blood vessels and the changes in volume and shape pf cardiac chambers.
Indirect measurements of displacement are used to quantify movements of liquids through heart valves. An example is the movement of a microphone diaphram that detects the movement of the heart indirectly and the resulting heart murmurs.

Potentiometer
A potentiometer is a manually adjustable variable resistor with 3 terminals. Two terminals are connected to both ends of a resistive element, and the third terminal connects to a sliding contact, called a wiper, moving over the resistive element.
The position of the wiper determines the output voltage of the potentiometer.
V = I R
It produces linear output (0.01% of full scale) in response to displacement.
Resolution is a function of construction.

Potentiometer
The potentiometer shown in Figure 2.1(a) measures translational displacements from 2 to 500 mm.
Rotational displacements ranging from 10 to more than 50 are detected as shown in single-turn pot and multi-turn pot (mostly 5, 10 or 20).
Multi-turn pots are used where high precision and resolution is required.

STRAIN GAGES
When a fine wire (25 m) is strained within its
elastic limit, the wire's resistance changes because of changes in the
diameter,
length,
and resistivity.
The resulting strain gages may be used to measure extremely small displacements, on the order of nanometers.

STRAIN GAGES
R of a wire with resistivity (ohm.meter), length L
(meters), and cross-sectional area A (meter squared) is given by:
The total differential change in R is found by summing the differential changes resulted in R due to differential changes in , L and A.
Divide 2.2 by 2.1 results in
(2.1)
(2.2)
(2.3)

STRAIN GAGES
Poisson's ratio relates the change in diameter D to the change in length L:
Substitute this formula in (2.3)
the change in resistance is a function of changes in dimension length,
plus the change in resistivity due to strain-induced changes in the lattice structure of the material,
(2.4)

STRAIN GAGES
The gage factor G, found by dividing (2.4)by L/L, is useful in comparing various strain-gage materials.
In practical existence, there is a metal strain gauge and also semiconductor strain gauge.
The gage factor for semiconductor materials is approximately 50 to 70 times that of the metals.
Gage factor for metals is primarily a function of dimensional effects.
For most metals, =0.3 and thus G is at least 1.6
For semiconductors, the piezoresistive effect is dominant.
The desirable feature of higher gage factors for semiconductor devices is offset by their greater resistivity-temperature coefficient.
Designs for instruments that use semiconductor materials must incorporate temperature compensation.
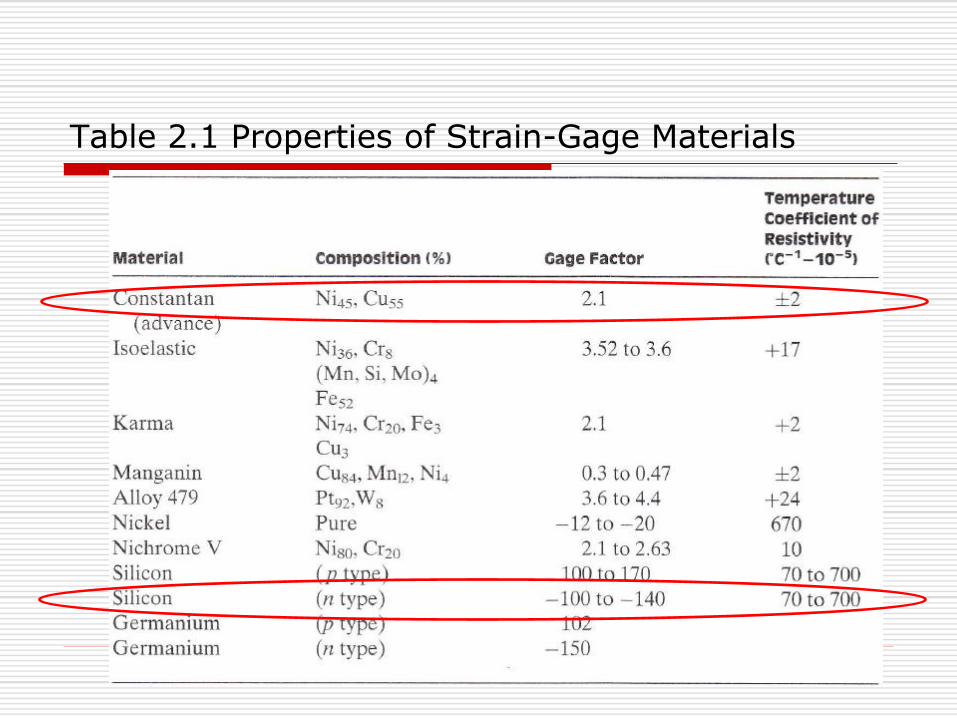
Table 2.1 Properties of Strain-Gage Materials
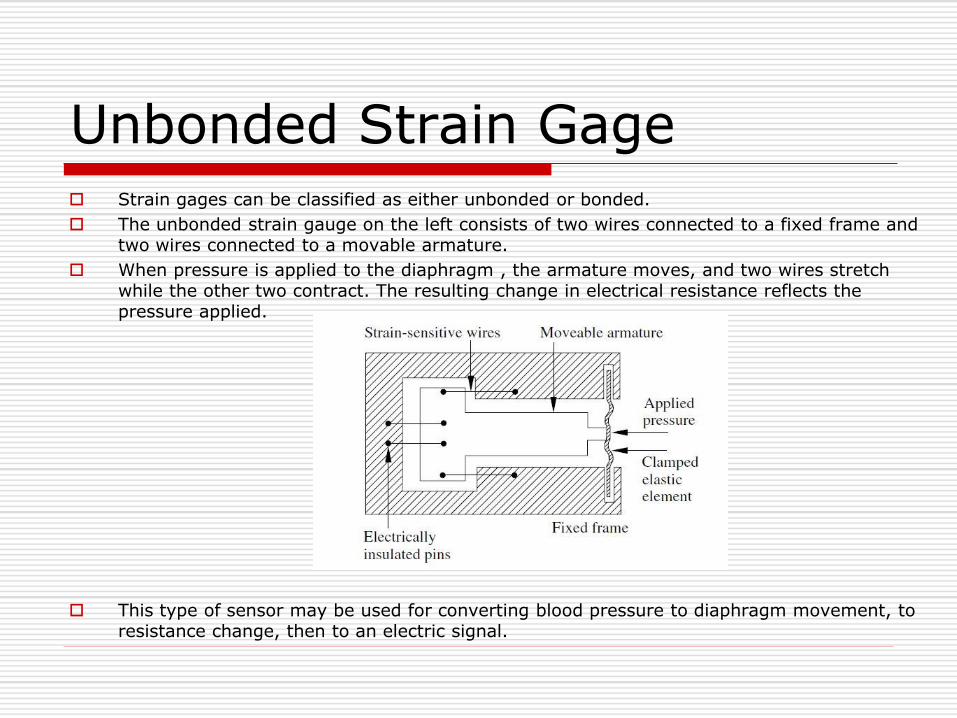
Unbonded Strain Gage Strain gages can be classified as either unbonded or bonded.
The unbonded strain gauge on the left consists of two wires connected to a fixed frame and two wires connected to a movable armature.
When pressure is applied to the diaphragm , the armature moves, and two wires stretch while the other two contract. The resulting change in electrical resistance reflects the pressure applied.
This type of sensor may be used for converting blood pressure to diaphragm movement, to resistance change, then to an electric signal.
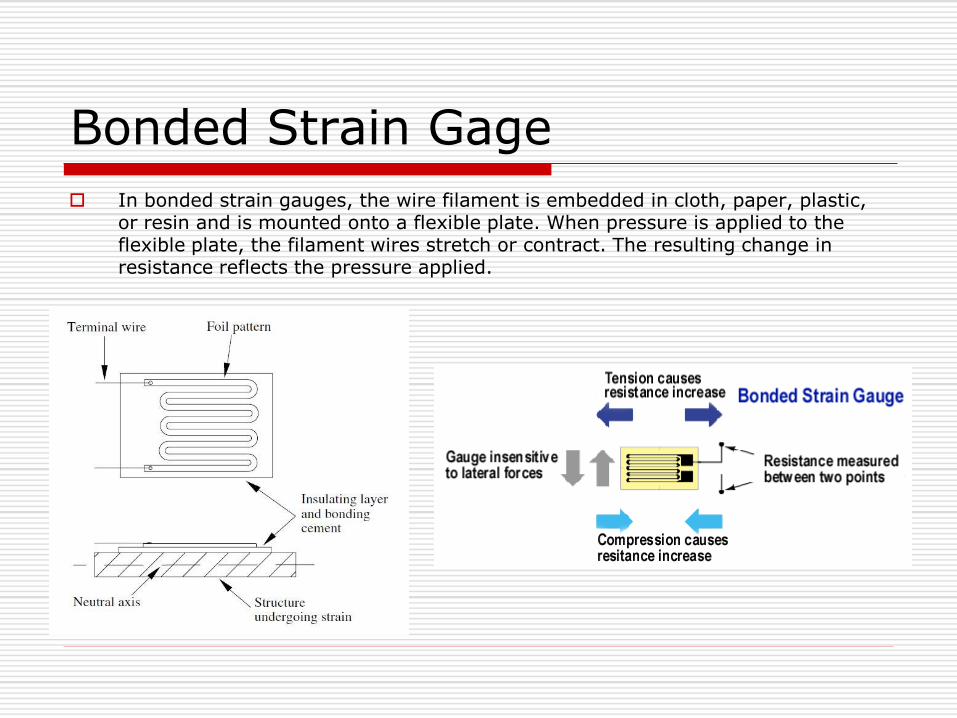
Bonded Strain Gage
In bonded strain gauges, the wire filament is embedded in cloth, paper, plastic, or resin and is mounted onto a flexible plate. When pressure is applied to the flexible plate, the filament wires stretch or contract. The resulting change in resistance reflects the pressure applied.

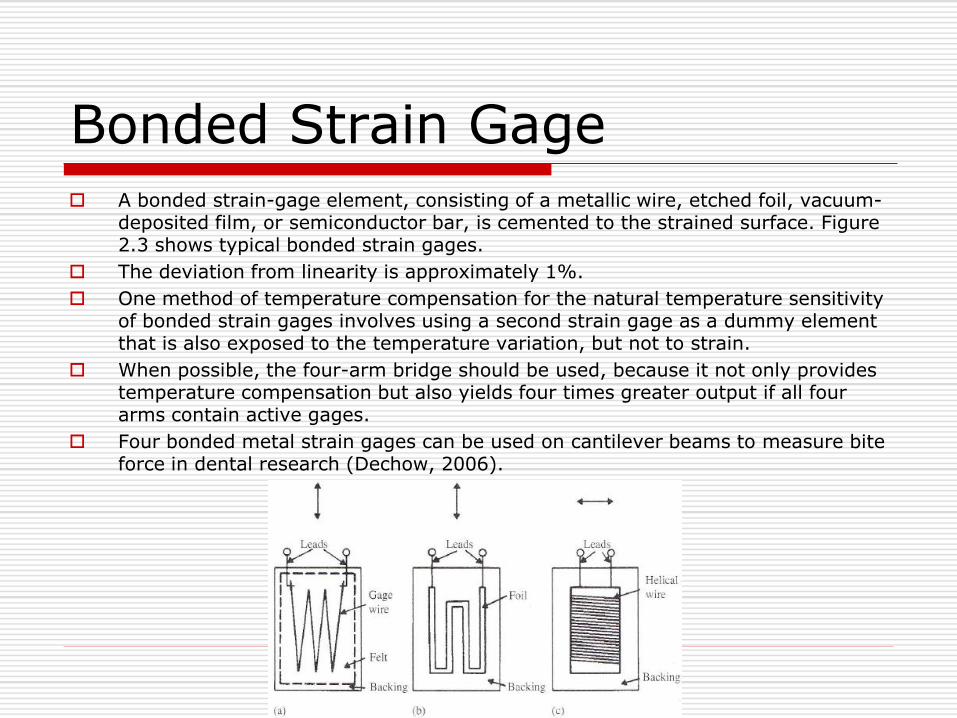
Bonded Strain Gage A bonded strain-gage element, consisting of a metallic wire, etched foil, vacuum-
deposited film, or semiconductor bar, is cemented to the strained surface. Figure 2.3 shows typical bonded strain gages.
The deviation from linearity is approximately 1%.
One method of temperature compensation for the natural temperature sensitivity of bonded strain gages involves using a second strain gage as a dummy element that is also exposed to the temperature variation, but not to strain.
When possible, the four-arm bridge should be used, because it not only provides temperature compensation but also yields four times greater output if all four arms contain active gages.
Four bonded metal strain gages can be used on cantilever beams to measure bite force in dental research (Dechow, 2006).


Semiconductor Integrated Strain Gages
Strain-gage technology advanced in the 1960s with the introduction of the semiconductor strain-gage element, which has the advantage of having a high gage factor.
Semiconductor strain gages use the same principles as the wire/foil gages.
Foil gages are selected over semiconductor gages only for macroscopic applications where significant pressure or displacement/velocity must be recorded.
Semiconductor strain gages are more temperature sensitive and inherently more nonlinear than metal strain gages because the piezoresistive effect varies with strain.
(a) unbonded, uniformly doped, (b) diffused p-type gage

Semiconductor Integrated Strain Gages
The integrated-type sensor has an advantage in that a pressure sensor can be fabricated by using a silicon substrate for the structural member of the diaphragm. The gages are diffused directly onto the diaphragm.
When pressure is applied to the diaphragm, a radial stress component occurs at the edge. The sign of this component is opposite to that of the tangential stress component near the center.
The placement of the eight diffused strain-gage units shown in Figure (c) gives high sensitivity and good temperature compensation (Cobbold, 1974).
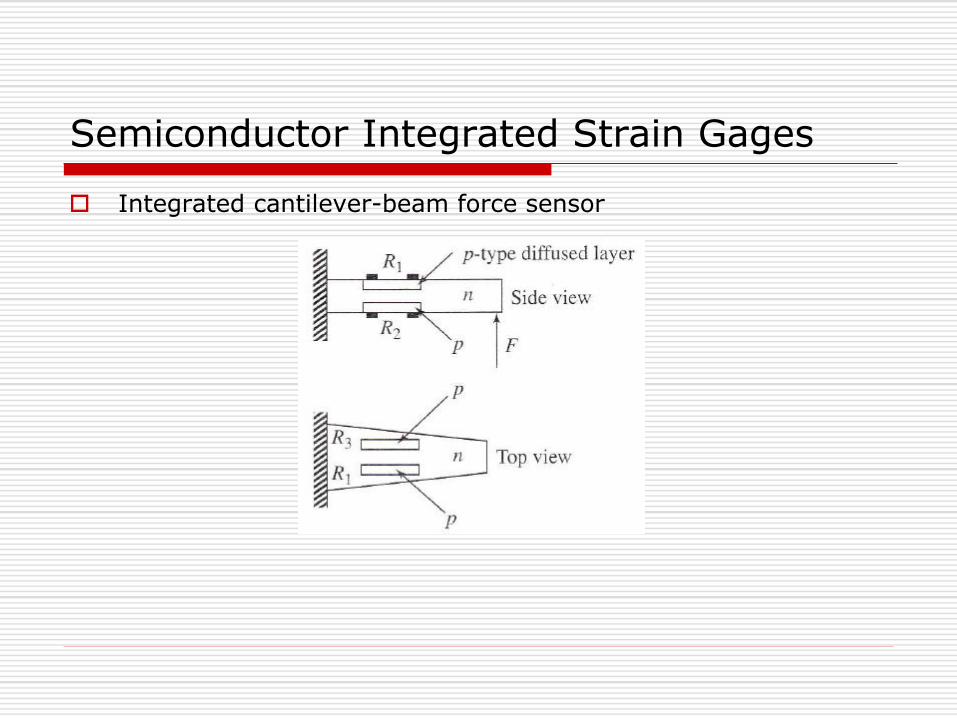
Semiconductor Integrated Strain Gages
Integrated cantilever-beam force sensor

Example: Isolation in a disposable blood-pressure sensor
Below figure shows a disposable blood-pressure sensor that uses an integrated silicon chip. Silicon strain-gage pressure sensors can be placed on the tip of a catheter and inserted directly into the blood, resulting in more accurate measurements and faster response times
Disposable blood pressure sensors are made of clear plastic so air bubbles are easily seen. Saline flows from an intravenous (IV) bag through the clear IV tubing and the sensor to the patient. This flushes blood out of the tip of the indwelling catheter to prevent clotting. A lever can open or close the flush valve. The silicon chip has a silicon diaphragm with a four-resistor Wheatstone bridge diffused into it. Its electrical connections are protected from the saline by a compliant silicone elastomer gel, which also provides electrical isolation. This prevents electric shock from the sensor to the patient and prevents destructive currents during defibrillation from the patient to the silicon chip.

Elastic-Resistance Strain Gages
Elastic-resistance strain gages are extensively used in biomedical applications, especially in cardiovascular and respiratory dimensional and plethysmographic (volume-measuring) determinations.
These systems normally consist of a narrow silicone-rubber tube [0.5 mm inner diameter (ID), 2 mm outer diameter (OD)] from 3 to 25 cm long and fillled with mercury or with an electrolyte or conductive paste. The ends of the tube are sealed with electrodes (amalgamated copper, silver, or platinum).
As the tube stretches, the diameter of the tube decreases and the length increases, causing the resistance to increase. The resistance per unit length of typical gages is approximately 0.A to 2 0/cm. These units measure much higher displacements than other gages.
•The elastic strain gage is linear within 1% for 10% of maximal extension. •As the extension is increased to 30% of maximum, the nonlinearity reaches 4% of full scale.

BRIDGE CIRCUITS
The Wheatstone bridge is ideal to measure small changes in resistance.
Assume that all values of resistance of the bridge are initially equal to R0
An increase in resistance, R, of all resistances still results in a balanced bridge.
This way assures that the sensor is temperature compensated if all four sensors in the bridge have the same temperature coefficient of resistivity.
However, if R1 and R3 increase by R, and R2 and R4 decrease by R, then

Full bridge configuration: all bridge elements are variable (sensors).
The four sets of strain-sensitive wires, A, B, C and D are connected to form a Wheatstone bridge.
The diaphragm is directly coupled by an armature to an unbonded strain-gage system.
With increasing pressure, the strain on gage pair B and C is increased, while that on gage pair A and D is decreased.
Wheatstone bridge with four active elements. R1 = A, R2 = B, R3 = D, and R4 = C.
When the unbonded strain gage is connected for translation motion. Resistor Ry and potentiometer Rx are used to initially balance the bridge.
vi is the applied voltage and v0 is the output voltage on a voltmeter or similar device with an internal resistance of Ri.
Inductive Sensors
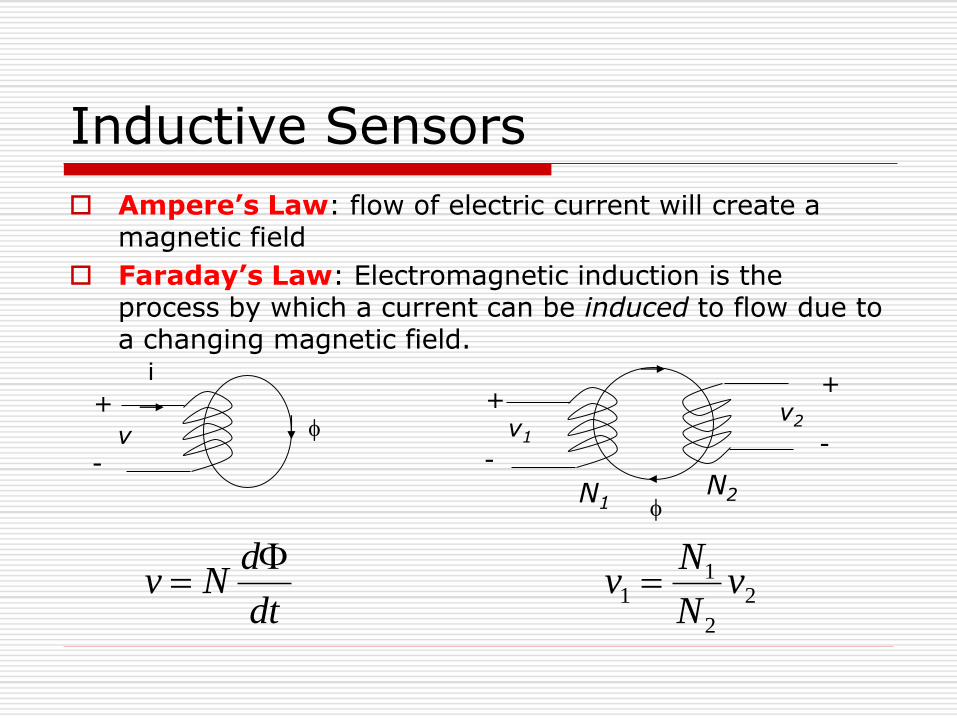
Ampere’s Law: flow of electric current will create a magnetic field
Faraday’s Law: Electromagnetic induction is the process by which a current can be induced to flow due to a changing magnetic field.
i
v
+
-
v1
v2 +
-
+
-
N1 N2
dt
dNv
2
2
11 v
N
Nv

Inductive Sensors
Inductive Sensors are non-contact type of devices used for precision measurement of a target position if the target is conductive in nature.
Capacitive sensors make use of electric field for sensing the surface of a conducting target. Inductive sensors make use of electromagnetic field that penetrates through the target.
An inductive sensor has an advantage in not being affected by the dielectric properties of its environment.
However, it may be affected by external magnetic fields due to the proximity of magnetic materials.
Unlike capacitive sensors, inductive sensors are independent of the material in the gap between the probe and the target. Hence, they can be used in hostile environment where oil or other liquids may appear in the gap.

Inductive Sensors
Inductance L measures displacement by varying any three of the coil parameters.
n : Number of turns of coil
G : Geometric form factor
μ : Effective permeability of medium
Each parameter can be changed by mechanical means.

Types of Inductive Sensors
Self-inductance Mutual inductance Differential transformer

Self-Induction Transducers
Only a single coil is employed. This coil is activated by an AC supply voltage.
This device works on the principle that alterations in the self-inductance of a coil may be produced by changing the geometric form factor or the movement of a magnetic core within the coil.
The current produces a magnetic flux, which is linked with the coil. The level of flux linkage (or selfinductance) can be varied by moving a ferromagnetic object within the magnetic field. This changes the reluctance of the flux path and the inductance of the coil. This change is a measure of the displacement of the ferromagnetic object. The change in inductance is measured using an inductance measuring circuit.

Self-Induction Transducer Using Eddy Current
When a coil is placed near to coil carrying alternating current, a circulating current is induced in it which in turn produces its own flux which try to reduce the flux of the coil carrying the current and hence inductance of the coil changes. Nearer the plate is to the coil, higher will be eddy current and higher is the reduction in inductance and vice versa. Thus inductance of coil varied with the variation of distance between coil and plate. Thus the movement of the plate can be calibrated in terms of inductance change to measure the quantity like displacement.

Self-Induction Transducer Using Eddy Current An inductive sensor probe consists of an oscillator that generates a high frequency electromagnetic
field. This field is radiates from the sensing face of the probe.
When this field contacts a conducting metal target, a small current is induced within the metal target. These currents will generate their own electromagnetic field that interferes with the field originating from the probe. This causes a change in the amplitude of the oscillations of the signals from the probe.
As the target approaches the sensor head, the eddy current loss increases and oscillation amplitude becomes smaller accordingly. This oscillation amplitude is rectified to obtain DC voltage variations.
The rectified signal and distance have an approximate proportional relationship. The linearization circuit corrects the linearity to obtain a linear output that is proportional to the distance.

Mutual-Inductance sensor The mutual-inductance sensor employs two
separate coils and uses the variation in their mutual magnetic coupling to measure displacement.
The primary winding carries an AC excitation that induces a steady AC voltage in the secondary winding.
The level of the induced voltage depends on the flux linkage between the coils.
Flux linkage is effected by one of two common techniques. to move an object made of ferromagnetic material within the flux
path. This changes the reluctance of the flux path, with an associated change of the flux linkage in the secondary coil.
The other common way to change the flux linkage is to move one coil with respect to the other.
There are applications of these devices in measuring cardiac dimensions, monitoring infant respiration, and ascertaining arterial diameters.
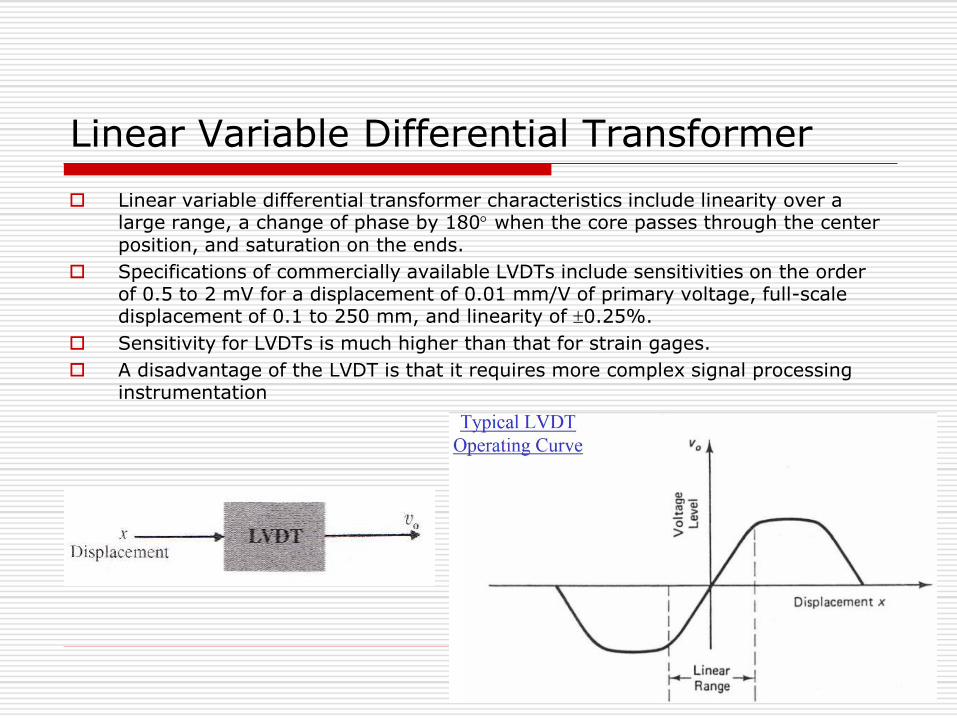
Linear Variable Differential Transformer
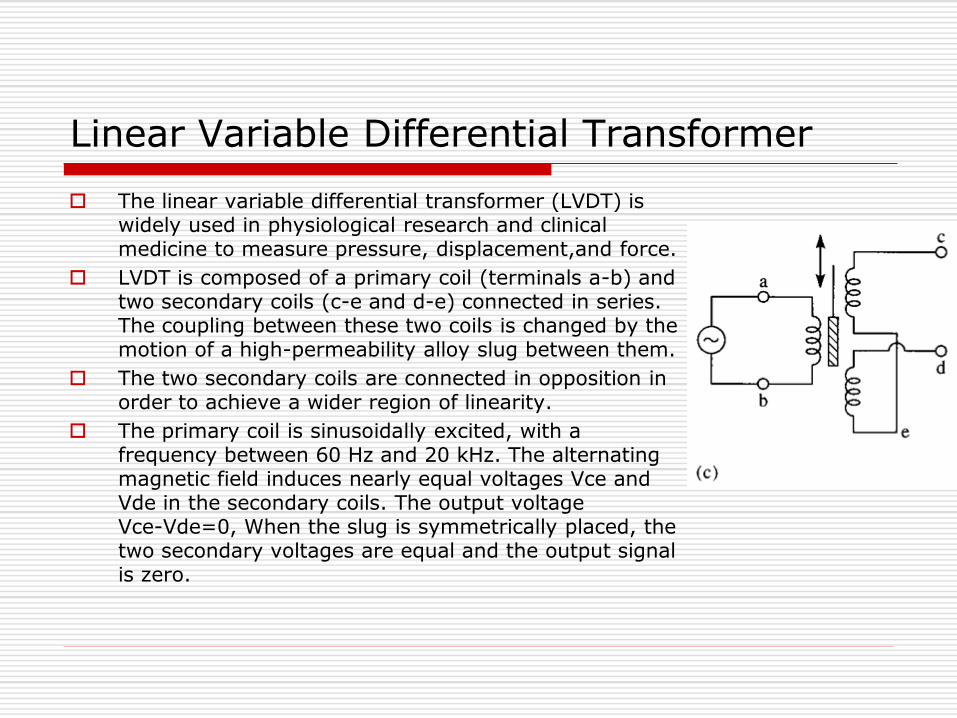
The linear variable differential transformer (LVDT) is widely used in physiological research and clinical medicine to measure pressure, displacement,and force.
LVDT is composed of a primary coil (terminals a-b) and two secondary coils (c-e and d-e) connected in series. The coupling between these two coils is changed by the motion of a high-permeability alloy slug between them.
The two secondary coils are connected in opposition in order to achieve a wider region of linearity.
The primary coil is sinusoidally excited, with a frequency between 60 Hz and 20 kHz. The alternating magnetic field induces nearly equal voltages Vce and Vde in the secondary coils. The output voltage Vce-Vde=0, When the slug is symmetrically placed, the two secondary voltages are equal and the output signal is zero.
Linear Variable Differential Transformer
Linear variable differential transformer characteristics include linearity over a large range, a change of phase by 180 when the core passes through the center position, and saturation on the ends.
Specifications of commercially available LVDTs include sensitivities on the order of 0.5 to 2 mV for a displacement of 0.01 mm/V of primary voltage, full-scale displacement of 0.1 to 250 mm, and linearity of 0.25%.
Sensitivity for LVDTs is much higher than that for strain gages.
A disadvantage of the LVDT is that it requires more complex signal processing instrumentation

Capacitive Sensors
The capacitance between two parallel plates of area A separated by a distance x is:
0 = dielectric constant of free space
r = relative dielectric constant of the insulator
In principle it is possible to measure change in displacement by changing 3 parameters r , A or x.
The most practical is by changing separation between the plates.
Displacement is commonly sensed with a capacitor by measuring capacitance changes as the plate separation is changed.
x
AC r0
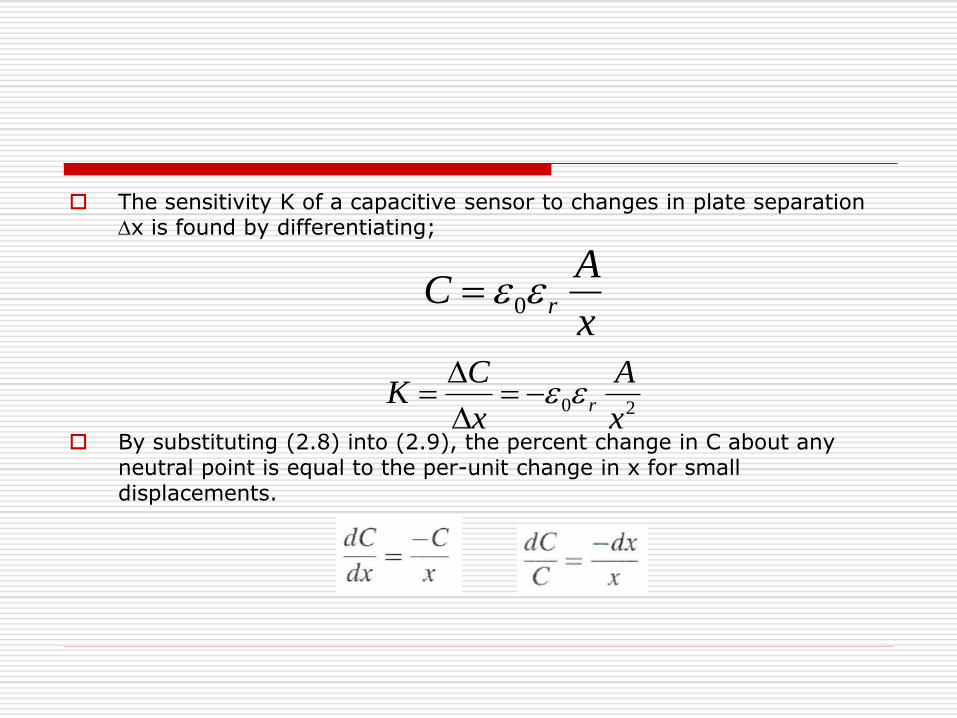
The sensitivity K of a capacitive sensor to changes in plate separation x is found by differentiating;
By substituting (2.8) into (2.9), the percent change in C about any neutral point is equal to the per-unit change in x for small displacements.
20x
A
x
CK r
x
AC r0
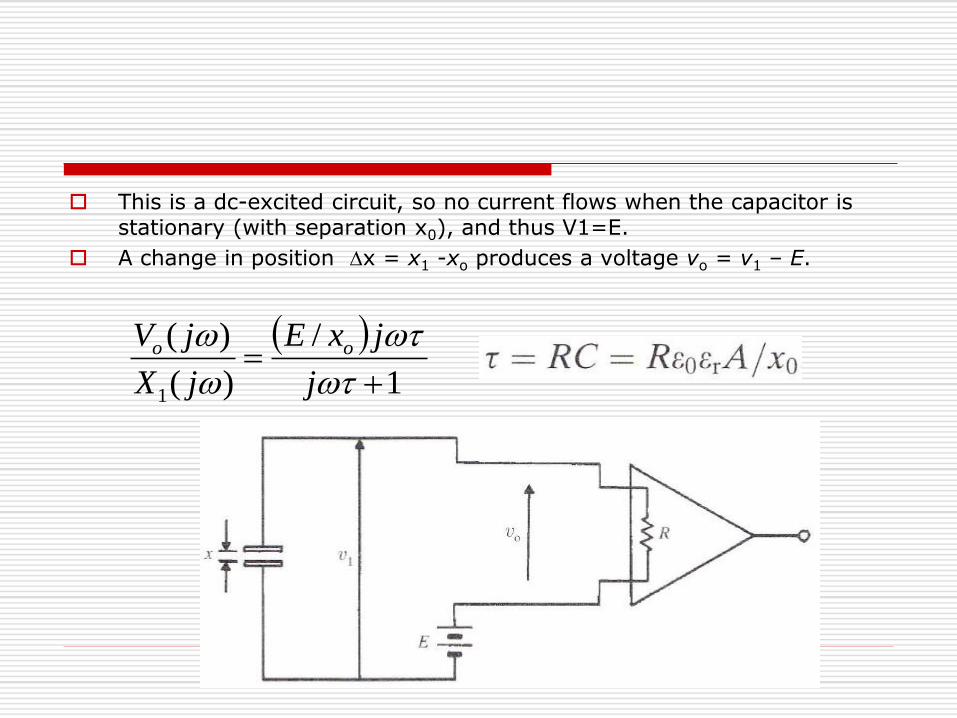
This is a dc-excited circuit, so no current flows when the capacitor is stationary (with separation x0), and thus V1=E.
A change in position x = x1 -xo produces a voltage vo = v1 – E.
1
/
)(
)(
1
j
jxE
jX
jV oo

For a 1 cm2 capacitance sensor, R is 100 MΩ. Calculate x, the plate spacing required to pass sound frequencies above 20 Hz.
Answer:
From the corner frequency, C =1/2πfR=1/(2π20×108)= 80 pF.
x can be calculated as follows:
μm11.1m1011.1
1080
)101)(10854.8(
5
12
412
0
x
C
Ax r

Applications
Compliant plastics of different dielectric constants may be placed between foil layers to form a capacitive mat to be placed on a bed. Patient movement generates charge, which is amplified and filtered to display respiratory movements from the lungs and ballistographic movements from the heart (Alihanka et al,1982).
A capacitance sensor can be fabricated from layers of mica insulators sandwiched between corrugated metal layers. Applied pressure flattens the corrugations and moves the metallic plates closer to each other, thus increasing the capacitance. The sensor is not damaged by large overloads, because flattening of the corrugations does not cause the metal to yield. The sensor measures the pressure between the foot and the shoe (Patel et aL.,1989).
Tsoukalas et al. (2006) describe micromachined silicon capacitive sensors and their electronic interfaces.
PIEZOELECTRIC SENSORS
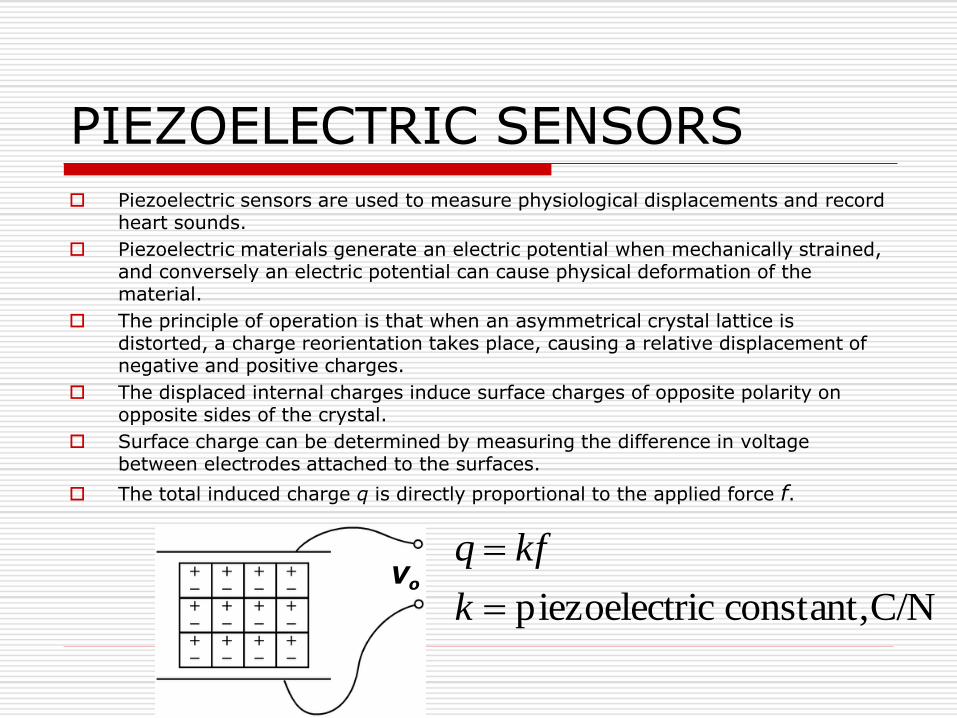
Piezoelectric sensors are used to measure physiological displacements and record heart sounds.
Piezoelectric materials generate an electric potential when mechanically strained, and conversely an electric potential can cause physical deformation of the material.
The principle of operation is that when an asymmetrical crystal lattice is distorted, a charge reorientation takes place, causing a relative displacement of negative and positive charges.
The displaced internal charges induce surface charges of opposite polarity on opposite sides of the crystal.
Surface charge can be determined by measuring the difference in voltage between electrodes attached to the surfaces.
The total induced charge q is directly proportional to the applied force f.
Vo
C/Nconstant,ricpiezoelect
k
kfq

The change in voltage can be found by assuming that the system acts like a parallel-plate capacitor where the voltage VO across the capacitor is charge q divided by capacitance C .
Typical values for k are 2.3 pC/N for quartz and 140 pC/N for barium titanate.
For a piezoelectric sensor of 1 cm2 area and 1 mm thickness with an applied force due to a 10 g weight, the output voltage VO is 0.23 mV and 14 mV for the qrtartz and barium titanate crystals, respectively.
Vo
A
kfx
C
kf
C
qV
r
o0
x
AC r0
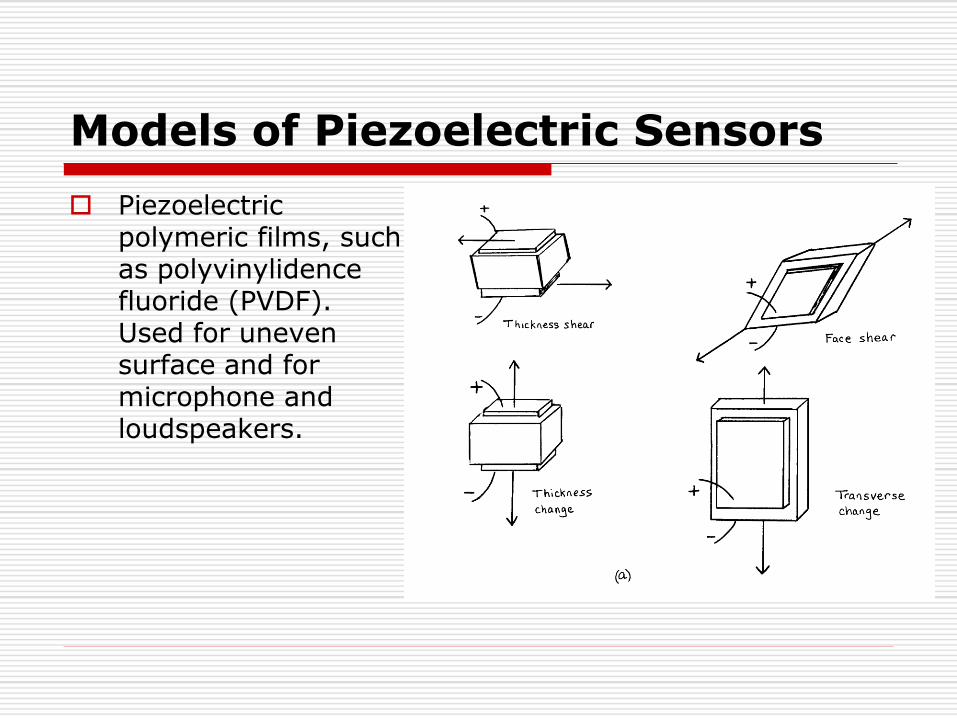
Models of Piezoelectric Sensors
Piezoelectric polymeric films, such as polyvinylidence fluoride (PVDF). Used for uneven surface and for microphone and loudspeakers.

Equivalent circuit for the piezoelectric sensor is required in order to quantify its dynamic-response characteristics.
This circuit has a charge generator q=Kx where K is proportionality constant C/m and x is deflection.
Rs: sensor leakage resistance Cs: sensor capacitance Cc: cable capacitance Ca: amplifier input capacitance Ra: amplifier input resistance

The circuit may be simplified by converting the charge generator to a current generator, iS
Current Generator
dt
dxK
dt
dqis Kxq
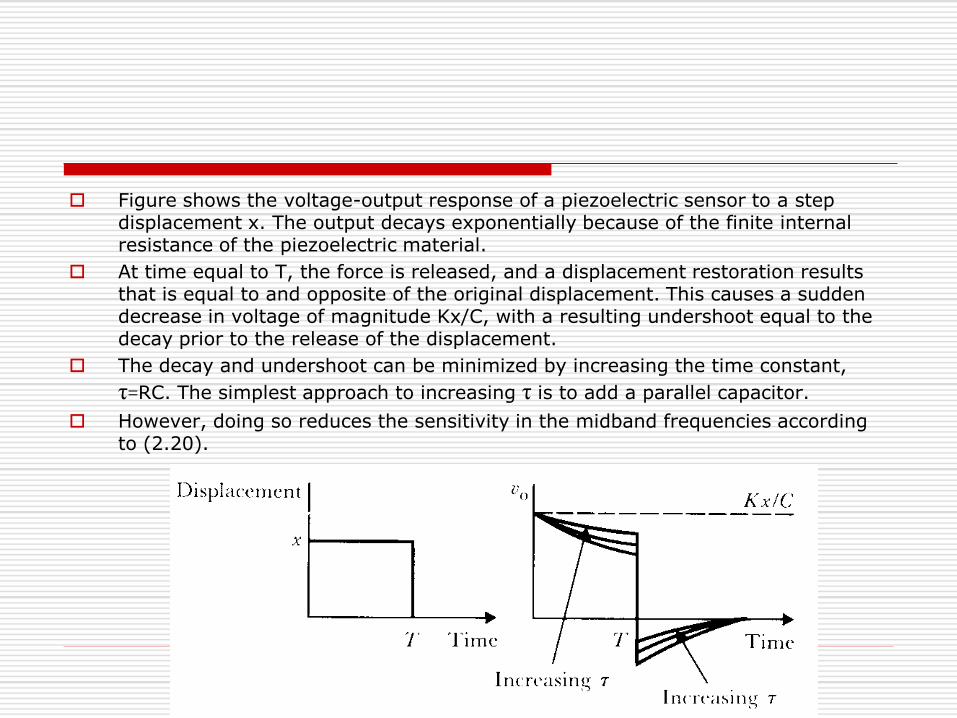
Figure shows the voltage-output response of a piezoelectric sensor to a step displacement x. The output decays exponentially because of the finite internal resistance of the piezoelectric material.
At time equal to T, the force is released, and a displacement restoration results that is equal to and opposite of the original displacement. This causes a sudden decrease in voltage of magnitude Kx/C, with a resulting undershoot equal to the decay prior to the release of the displacement.
The decay and undershoot can be minimized by increasing the time constant,
τ=RC. The simplest approach to increasing τ is to add a parallel capacitor.
However, doing so reduces the sensitivity in the midband frequencies according to (2.20).

Example
A piezoelectric sensor has C = 500 pF. Sensor leakage resistanse is 10 GΩ. The amplifier input impedance is 5 MΩ. What is the low corner frequency?

C = 500 pF Rleak = 10 G Ra = 5 M What is fc,low ?
Hz64)10500)(105(2
1
2
1126,
RCf lowc
Hz64.0)10500)(10500(2
1126,
lowcf
If input impedance is increased 100 times: (Ra = 500 M ), then
Current
Piezoelectric Sensor Applications
Piezoelectric sensors are used quite extensively in cardiology for external (body-surface) and internal (intracardiac) phonocardiography.
They are also used in the detection of Korotkoff sounds in blood-pressure measurements (Chapter 7).
Additional applications of piezoelectric sensors involve their use in measurements of physiological accelerations. A piezoelectric sensor and circuit can measure the acceleration due to human movements and provide an estimate of energy expenditure (Servais et al., 1984).
Section 8.4 describes ultrasonic blood-flow meters in which the piezoelectric element operating at mechanical resonance emits and senses high-frequency sounds.
Li and Su (2006) describe piezoelectric sensors as sensitive mass sensors to detect and measure a broad variety of biomedical analytes in both gas and liquid phases based on the adsorption (yüzeye tutma) and/or desorption (yüzeyden bırakma) of target analyte(s) on the sensor surface.
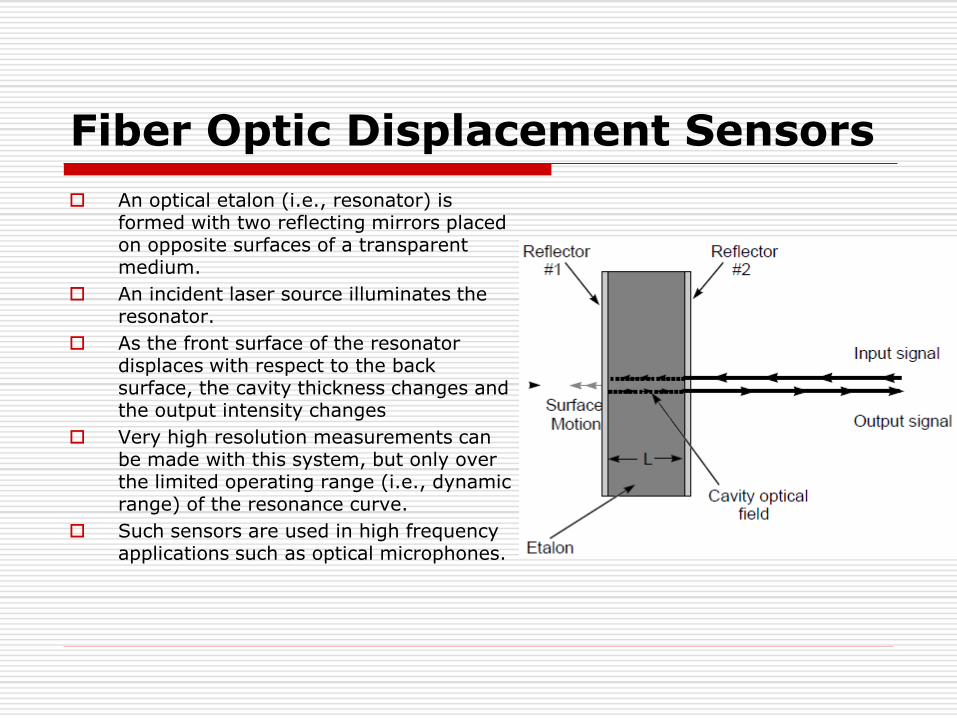
Fiber Optic Displacement Sensors
An optical etalon (i.e., resonator) is formed with two reflecting mirrors placed on opposite surfaces of a transparent medium.
An incident laser source illuminates the resonator.
As the front surface of the resonator displaces with respect to the back surface, the cavity thickness changes and the output intensity changes
Very high resolution measurements can be made with this system, but only over the limited operating range (i.e., dynamic range) of the resonance curve.
Such sensors are used in high frequency applications such as optical microphones.
2.7 TEMPERATURE MEASUREMENTS
A patient's body temperature gives the physician important information about the physiological state of the individual.
External body temperature is one of many parameters used to evaluate patients in shock, because the reduced blood pressure of a person in circulatory shock results in low blood flow to the periphery. A drop in the big-toe temperature is a good early clinical warning of shock.
Infections, on the other hand, are usually reflected by an increase in body temperature, with a hot, flushed skin and loss of fluids.
Increased ventilation, perspiration, and blood flow to the skin result when high fevers destroy temperature-sensitive enzymes and proteins.
Anesthesia decreases body temperature by depressing the thermal regulatory center. In fact, physicians routinely induce hypothermia in surgical cases in which they wish to decrease a patient's metabolic processes and blood circulation.
In pediatrics, special heated incubators are used for stabilizing the body temperature of infants.
In the study of arthritis, physicians have shown that temperatures of joints are closely correlated with the amount of local inflammation. The increased blood flow due to arthritis and chronic inflammation can be detected by thermal measurements.
Temperature sensors type
Thermocouples
Thermistors
Radiation and fiber-optic detectors
p-n junction semiconductor (2 mV/oC)

2.8 THERMOCOUPLES
A thermocouple is a device made by two different wires joined at one end, called junction end or measuring end. The two wires are called thermoelements or legs of the thermocouple: the two thermoelements are distinguished as positive and negative ones. The other end of the thermocouple is called tail end or reference end (Figure). The junction end is immersed in the enviroment whose temperature T2 has to be measured, which can be for instance the temperature of a furnace at about 500°C, while the tail end is held at a different temperature T1, e.g. at ambient temperature.
Because of the temperature difference between junction end and tail end a voltage difference can be measured between the two thermoelements at the tail end: so the thermocouple is a temperature-voltage transducer.

The temperature vs voltage relationship is given by:
where Emf is the Electro-Motive Force or Voltage produced by the thermocople at the tail end, T1 and T2 are the temperatures of reference and measuring end respectively, S12 is called Seebeck coefficient of the thermocouple and S1 and S2 are the Seebeck coefficient of the two thermoelements; the Seebeck coefficient depends on the material the thermoelement is made of.
Looking at equation it can be noticed that:
a null voltage is measured if the two thermoelements are made of the same materials: different materials are needed to make a temperature sensing device,
a null voltage is measured if no temperature difference exists between the tail end and the junction end: a temperature difference is needed to operate the thermocouple,
the Seebeck coefficient is temperature dependent.

When a temperature difference is applied between the two ends of a single Ni wire, a voltage drop is developed across the wire itself. The end of the wire at the highest temperature, T2, is called hot end, while the end at the lowest temperature, T1, is called cold end.
When a voltmeter, with Cu connection wires, is used to measure the voltage drop across the Ni wire, two junctions need to be made at the hot and cold ends between the Cu wire and the Ni wire; assuming that the voltmeter is at room temperature T1, one of the Cu wires of the voltmeter will experience along it the same temperature drop from T2 to T1 the Ni wire is experiencing. In the attempt to measure the voltage drop on the Ni wire a Ni-Cu thermocouple has been made and so the measured voltage is in reality the voltage drop along the Ni wire plus the voltage drop along the Cu wire.
The Emf along a single thermoelement cannot be measured: the Emf measured at the tail end in previous figure is the sum of the voltage drop along each of the thermoelements. As two thermoelements are needed, the temperature measurement with thermocuoples is a differential measurement.
Note: if the wire in figure was a Cu wire a null voltage would have been measured at the voltmeter.

The temperature measurement with thermocouples is also a differential measurement because two different temperatures, T1 and T2, are involved. The desired temperature is the one at the junction end, T2. In order to have a useful transducer for measurement, a monotonic “Emf versus junction end temperature T2 relationship” is needed, so that for each temperature at the junction end, a unique voltage is produced at the tail end.
However, from the integral in Equation1 it can be understood that the Emf depends on both T1 and T2: as T1 and T2can change independently, a monotonic “Emf vs T2 relationship” cannot be defined if the tail end temperature is not constant. For this reason the tail end is maintained in an ice bath made by crushed ice and water in a Dewar flask: this produces a reference temperature of 0°C. All the voltage versus temperature relationships for thermocouples are referenced to 0°C.

The ice bath is usually replaced in industrial application with an integrated circuit called cold junction compensator: in this case the tail end is at ambient temperature and the temperature fluctuations at the tail end are tolerated; in fact the cold junction compensator produces a voltage equal to the thermocouple voltage between 0°C and ambient temperature, which can be added to the voltage of the thermocouple at the tail end to reproduce the voltage versus temperature relationship of the thermocouple.
It should be underlined that the cold junction compensation cannot reproduce exactly the voltage versus temperature relationship of the thermocouple, but can only approximate it: for this reason the cold junction compensation introduces an error in the temperature measurement.
Figure shows also the filtering and amplification of the thermocouple. Being the thermocouple voltage a DC signal, removal of AC noise through filtering is beneficial; furthermore the thermocouples produce voltage of few tens of mV and for this reason amplification is required.

The small voltage range for some of the most common thermocouples (letter designated thermocouples) is shown in Figure, where their voltage versus temperature relationship is reported.
All the voltage-temperature relationships of the letter designated thermocouples are monotonic, but not linear. For instance the type N thermocouple voltage output is defined by the following 10 degree polynomials

Thermistors
Thermistors are semiconductors made of ceramic materials whose resistance decreases as temperature increases.
Advantages
Small in size (0.5 mm in diameter)
Large sensitivity to temperature changes (-3 to -5% /oC)
Blood velocity
Temperature differences in the same organ
Excellent long-term stability characteristics (R=0.2% /year)
Disadvantages
Nonlinear portion exists in
Self heating occurs after a certain amount of current passes
Limited range but suitable for biomedical applications
Circuit Connections of Thermistors
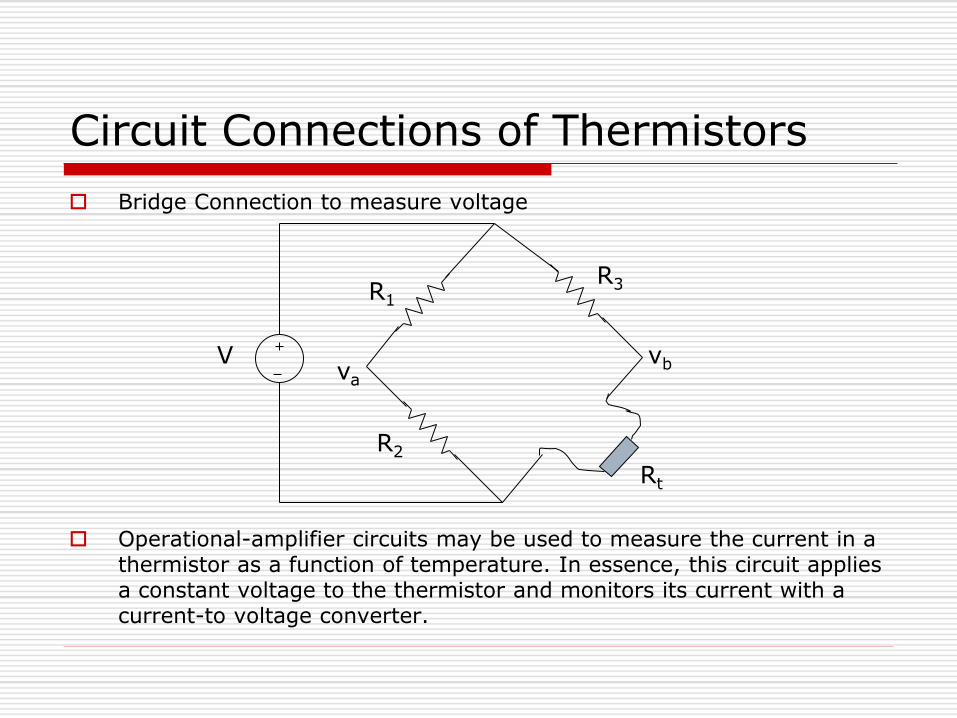
Bridge Connection to measure voltage
Operational-amplifier circuits may be used to measure the current in a thermistor as a function of temperature. In essence, this circuit applies a constant voltage to the thermistor and monitors its current with a current-to voltage converter.
R1
R2
R3
Rt
va
vb V
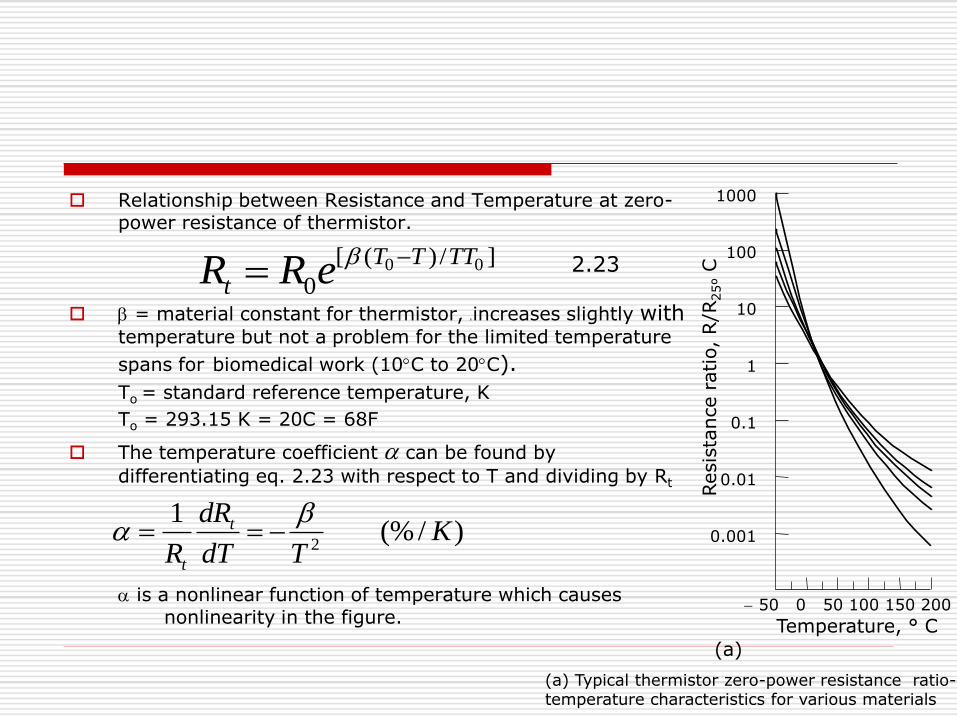
Relationship between Resistance and Temperature at zero-power resistance of thermistor.
= material constant for thermistor, B increases slightly with temperature but not a problem for the limited temperature
spans for biomedical work (10C to 20C).
To = standard reference temperature, K
To = 293.15 K = 20C = 68F
The temperature coefficient can be found by
differentiating eq. 2.23 with respect to T and dividing by Rt
is a nonlinear function of temperature which causes nonlinearity in the figure.
50 0 50 100 150 200
0.001
0.01
0.1
1
10
100
1000
Temperature, ° C
(a)
Resis
tance r
atio, R/R
25º C
]/)([
000 TTTT
t eRR
)/(%1
2K
TdT
dR
R
t
t
(a) Typical thermistor zero-power resistance ratio-temperature characteristics for various materials
2.23

Voltage-Versus-Current Characteristics
The voltage-versus-current characteristics of thermistors, as shown in Figure are linear up to the point at which self-heating becomes a problem.
The temperature of the thermistor is that of its surroundings. However, above specific current, current flow generates heat that make the temperature of the thermistor above the ambient temperature.
(b) Thermistor voltage-versus-current characteristic for a thermistor in air and water. The diagonal lines with a positive slope give linear resistance values and show the degree of thermistor linearity at low currents. The intersection of the thermistor curves and the diagonal lines with the negative slope give the device power dissipation. Point A is the maximal current value for no appreciable self-heat. Point B is the peak voltage. Point C is the maximal safe continuous current in air.
0.1
1.0
10
100
0.10 1.0
Water
Air
A C
B
Current, mA
(b)
10.0 100.0
Voltage, V

Radiation Thermometry
Radiation thermometry uses the relationship between the surface temperature of an object and its radiant power to measure the temperature of a body without physical contact with it.
Medical thermography is a technique whereby the temperature distribution of the body is mapped with a sensitivity of a few tenths of a kelvin. It is based on the recognition that skin temperature can vary from place to place depending on the cellular or circulatory processes occurring at each location in the body.
The higher the temperature of a body the higher is the electromagnetic radiation (EM).
Electromagnetic Radiation Transducers convert energy in the form of EM radiation into an electrical current or potential, or modify an electrical current or potential.
Application
Breast cancer, determining location and extent of arthritic disturbances,
measure the depth of tissue destruction from frostbite and burns,
detecting various peripheral circulatory disorders (venous thrombosis (toplar damarda pıhıtılaşma)
carotid artery occlusions (şah damarı tıkanıklığı))
All bodies above absolute zero emit thermal radiation.
The quantity of power emitted is measured by the radiative intensity.
Energy is distributed across the electromagnetic spectrum and the intensity of emission and the shape of the distribution is dependent on the temperature.
Conversely, the temperature of a body can be measured by the quantity and spectral distribution of energy it emits.

Radiation thermometers measure radiation in the ultra-violet (UV), visible, and infra-red (IR) ranges of the electromagnetic spectrum. These comprise the regions in the spectrum from about 0.1 to 5000 m.

Radiation Temperature Measurement
By measuring the radiation intensity or distribution, the temperature of a blackbody or black surface can uniquely be obtained.
This is the basic principle of radiation temperature measurement.
A blackbody is an ideal thermal radiator; as such, it absorbs all incident radiation and emits the maximal possible thermal radiation.
The intensity and distribution of energy is governed by Planck’s law and is determined by the wavelength of light, and the temperature, T.
is the relative emissivity (i.e., the extent which a surface deviates from a black body - for a true black body, =1).
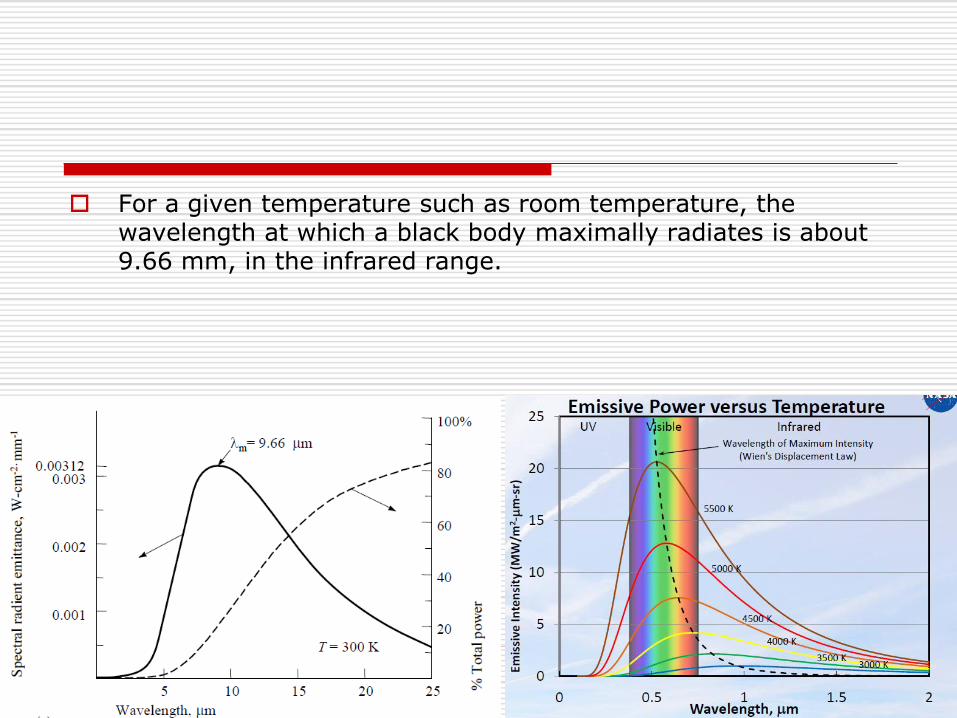
For a given temperature such as room temperature, the wavelength at which a black body maximally radiates is about 9.66 mm, in the infrared range.
Real surfaces do not emit radiation like an idealized blackbody
Instead, real surfaces emit at a lower rate
The fraction of radiation a surface emits relative to a blackbody is known as the emissivity
The emissivity of a surface varies with direction, wavelength, and temperature.
Determining the effect of changes in surface emissivity with wavelength is important to accurately determine the temperature of a given source.
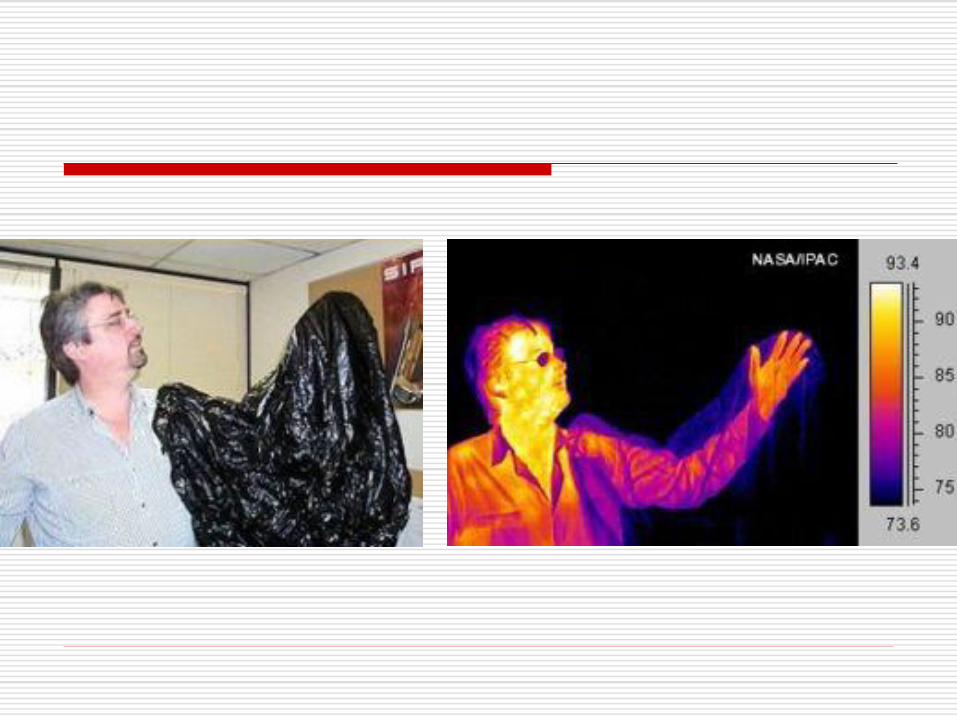
For example, at 300 °K and =3m, a 5% change in is equivalent to a temperature change of about 1 °C.
To detect IR emissivity for an object, IR cameras are used.

Chopped-Beam Radiation-Thermometer System A typical IR camera system used for temperature sensing is illustrated in the figure below.
A mirror focuses the radiant energy from the source onto a photodiode detector.
The output of the detector circuit is a series of pulses with amplitude dependent on the strength of the radiation source. This ac signal is amplified, while the mean value, which is subject to drift, is blocked.
A reference-phase signal, used to synchronize the phase-sensitive demodulator, is generated in a special circuit consisting of a light source and detector. Phase-sensitive detection is performed for optimal sensitivity.
The signal is then filtered to provide a dc signal proportional to the target temperature.
This signal can then be displayed or recorded. Infrared microscopes have also been designed using these techniques.

The Infrared Thermometer Figure shows one application of radiation thermometry is an instrument that determines the
internal or core body temperature of the human by measuring the magnitude of infrared radiation emitted from the tympanic membrane and surrounding ear canal.
The tympanic membrane is in close relation with hypothalamus which is body's main thermostat regulating the core body temperature.
This approach has advantages over using mercury thermometers, thermocouples, or thermistors.
The other type of thermometers must be in contact with the patient long enough for its temperature to become the same as, or close to, that of the subject
Infrared thermometry device measures almost instantly and does not require contact with the patient.

2.11 FIBER OPTIC TEMPERATURE SENSORS
Figure below light is coupled from an input fiber into an output fiber through a double mirror constructed from a III-IV semiconductor (typically GaAs).
One fiber transmits light from a light-emitting diode source to the sensor, where it is passed through the GaAs and collected by the other fiber for detection in the readout instrument.
Some of the optical power traveling through the semiconductor is absorbed, by the process of raising valence-band electrons, across the forbidden energy gap into the conduction band.
Because the forbidden energy gap is a sensitive function of the material's temperature, the amount of power absorbed increases with temperature.
By monitoring changes in the transmitted intensity, the temperature of the medium in thermal contact with the GaAs sensor is measured.
This nonmetallic probe is particularly suited for temperature measurement in the strong electromagnetic heating fields used in heating tissue for cancer therapy or in patient rewarming.

2.12 Optical Measurements
All optical sensors have the same 3 general components: optical source, filter, optical detector.
The filter is the primary sensing element, where some optical property is changed in response to a physical or chemical characteristic of the system.
Applications:
Clinical-chemistry lab (analyze sample of blood and tissue)
Cardiac Catheterization (measure oxygen saturation of hemoglobin and cardiac output)
(a) General block diagram of an optical instrument. (b) Highest efficiency is obtained by using an intense lamp, lenses to gather and focus the light on the sample in the cuvette, and a sensitive detector. (c) Solid-state lamps and detectors may simplify the system.

2.12 Optical Measurements
(a) General block diagram of an optical instrument.
b)Highest efficiency is obtained by using an intense lamp, lenses to gather and focus the light on the sample in the cuvette, and a sensitive detector
c) Solid-state lamps and detectors may simplify the system.
2.13 RADIATION SOURCES
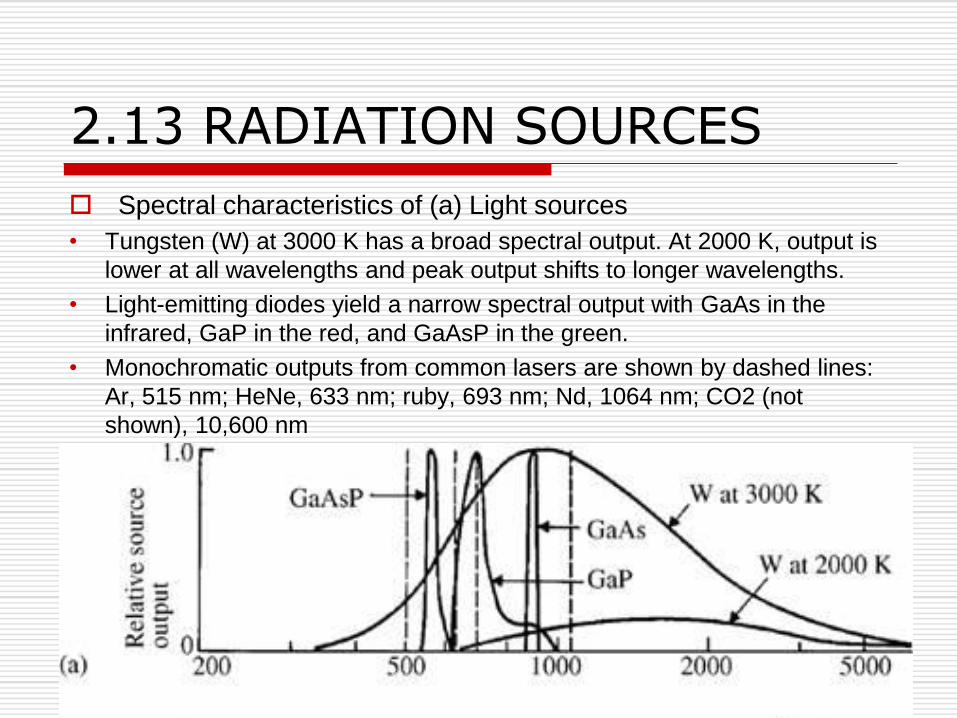
Spectral characteristics of (a) Light sources
• Tungsten (W) at 3000 K has a broad spectral output. At 2000 K, output is
lower at all wavelengths and peak output shifts to longer wavelengths.
• Light-emitting diodes yield a narrow spectral output with GaAs in the
infrared, GaP in the red, and GaAsP in the green.
• Monochromatic outputs from common lasers are shown by dashed lines:
Ar, 515 nm; HeNe, 633 nm; ruby, 693 nm; Nd, 1064 nm; CO2 (not
shown), 10,600 nm
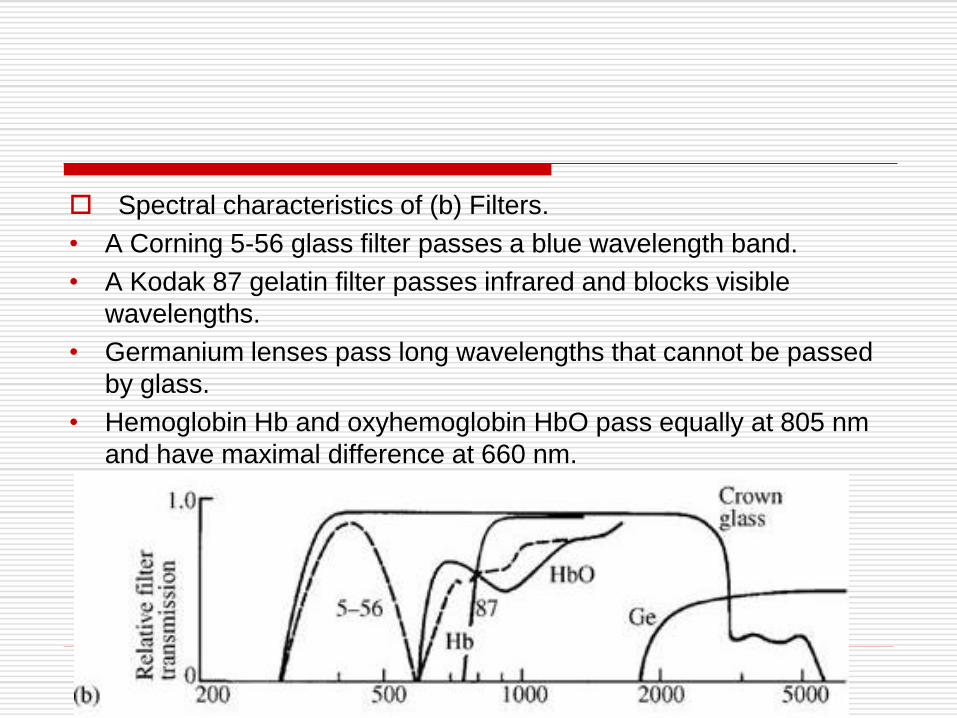
Spectral characteristics of (b) Filters.
• A Corning 5-56 glass filter passes a blue wavelength band.
• A Kodak 87 gelatin filter passes infrared and blocks visible
wavelengths.
• Germanium lenses pass long wavelengths that cannot be passed
by glass.
• Hemoglobin Hb and oxyhemoglobin HbO pass equally at 805 nm
and have maximal difference at 660 nm.
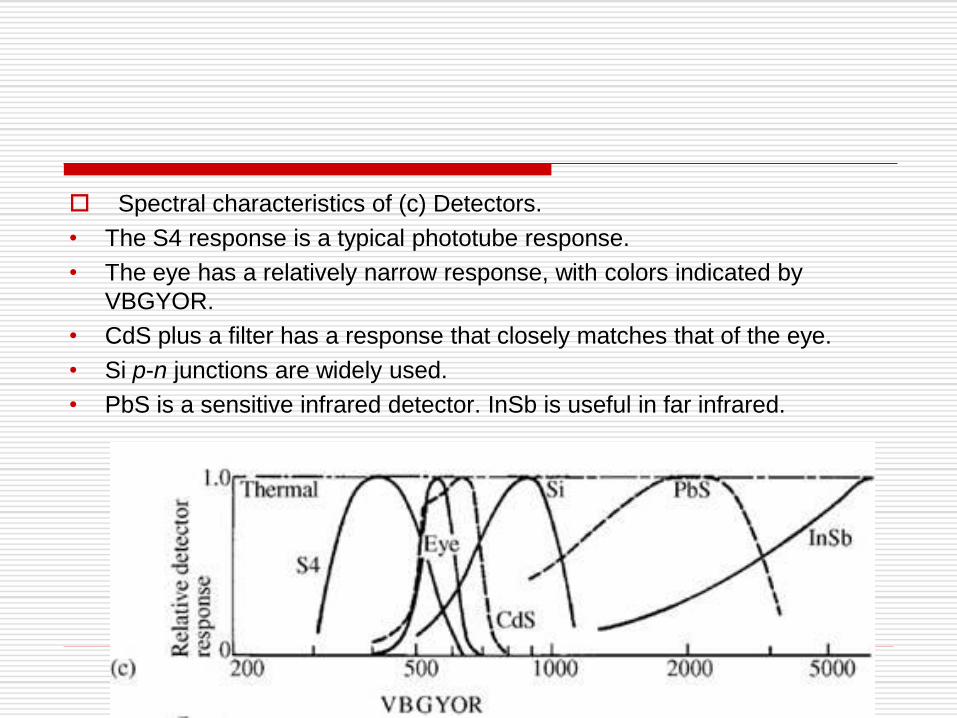
Spectral characteristics of (c) Detectors.
• The S4 response is a typical phototube response.
• The eye has a relatively narrow response, with colors indicated by
VBGYOR.
• CdS plus a filter has a response that closely matches that of the eye.
• Si p-n junctions are widely used.
• PbS is a sensitive infrared detector. InSb is useful in far infrared.
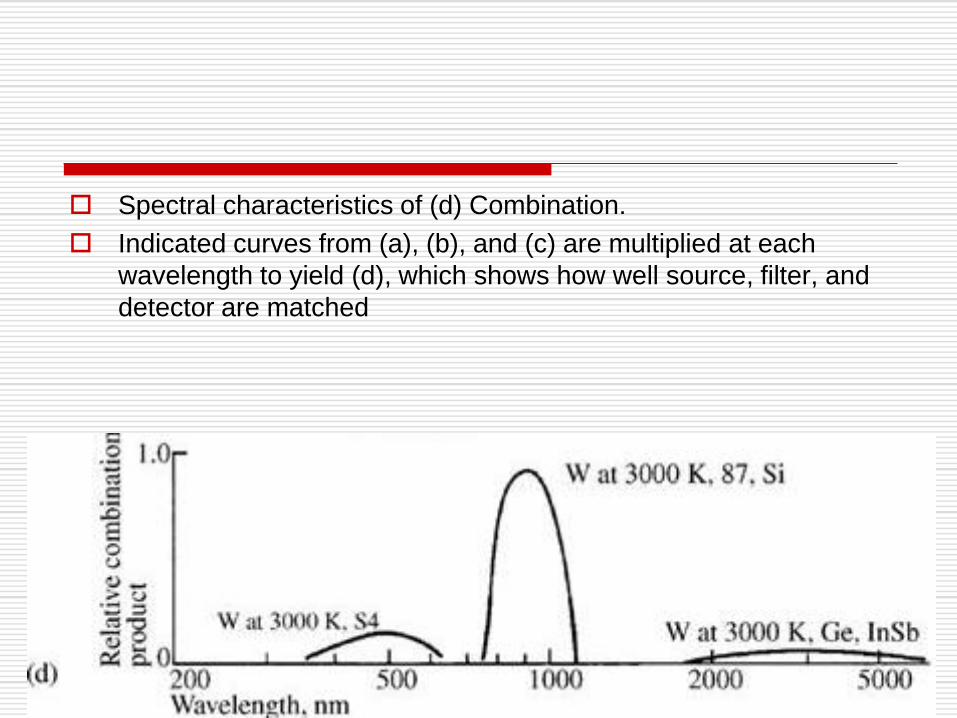
Spectral characteristics of (d) Combination.
Indicated curves from (a), (b), and (c) are multiplied at each
wavelength to yield (d), which shows how well source, filter, and
detector are matched
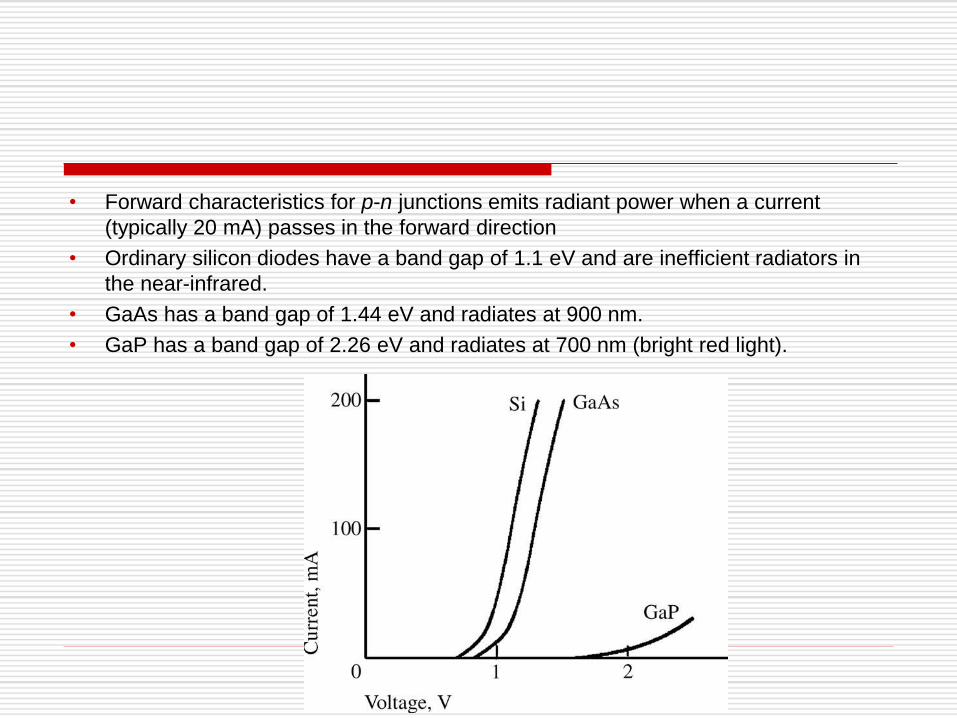
• Forward characteristics for p-n junctions emits radiant power when a current
(typically 20 mA) passes in the forward direction
• Ordinary silicon diodes have a band gap of 1.1 eV and are inefficient radiators in
the near-infrared.
• GaAs has a band gap of 1.44 eV and radiates at 900 nm.
• GaP has a band gap of 2.26 eV and radiates at 700 nm (bright red light).

A photothermal optical sensor enables measurement of hemoglobin concentration in unprocessed, nanoliter blood sample.
Fig. 1. Schematic of the PT-AS sensor for rapid and direct [Hb] measurement. 650-nm probe light from a commercial laser pointer is directed to a blood-containing capillary tube. The interference of the scattered light from the tube produces a distinct pattern on a webcam. Under the illumination of 532nm light, where Hb exhibits high absorption, Hb absorbs the light energy and converts it into heat, leading to a change in the refractive index of blood. This photothermal change in refractive index results in a shift in the scattering pattern. Quantification of this shift in the scattering pattern enables high-accuracy [Hb] measurement in unprocessed blood sample.
https://atlasofscience.org/a-photothermal-optical-sensor-enables-measurement-of-hemoglobin-concentration-in-unprocessed-nanoliter-blood-sample/
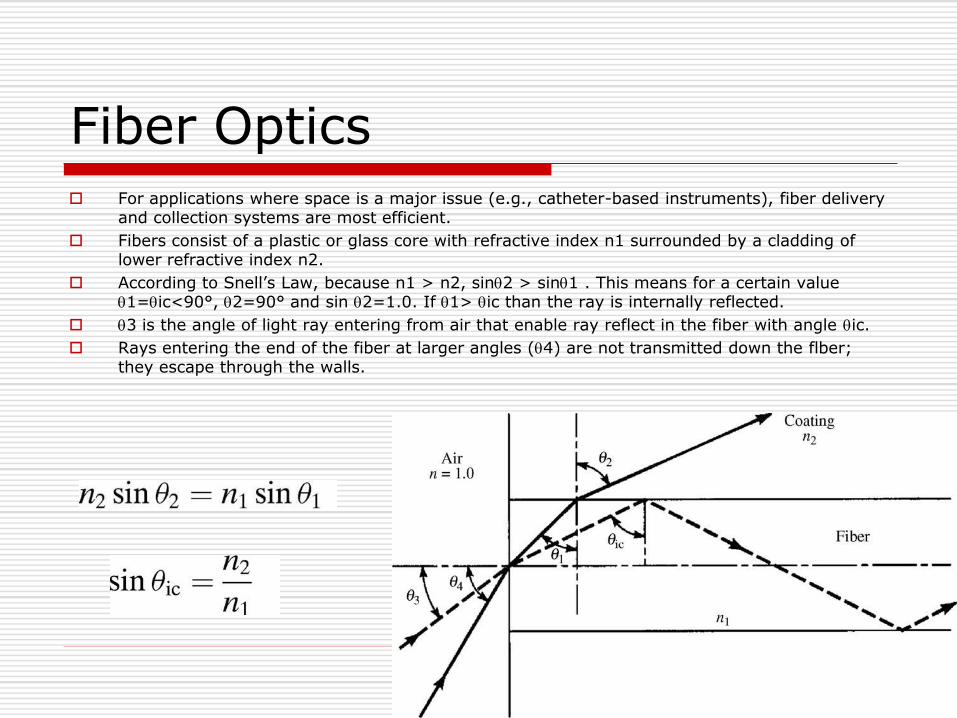
Fiber Optics For applications where space is a major issue (e.g., catheter-based instruments), fiber delivery
and collection systems are most efficient.
Fibers consist of a plastic or glass core with refractive index n1 surrounded by a cladding of lower refractive index n2.
According to Snell’s Law, because n1 > n2, sin2 > sin1 . This means for a certain value 1=ic<90°, 2=90° and sin 2=1.0. If 1> ic than the ray is internally reflected.
3 is the angle of light ray entering from air that enable ray reflect in the fiber with angle ic.
Rays entering the end of the fiber at larger angles (4) are not transmitted down the flber; they escape through the walls.
Fiber optics can be used in two ways:
Noncoherent: There is no correlation between a fiber's spatial position at the input and at the output. These fibers are useful only for transmitting radiation.
Coherent: the fibers occupy the same relative position at both end faces. An image at one end is faithfully transmitted to the other end.
Noncoherent applications:
Light transmissions for viewing internal organs
Measuring blood oxygen saturation by transmitting radiation at two wavelengths down one bundle and analyzing backscattered radiation through a second bundle by the red-blood cells
Coherent Applications:
Endoscope: A small lens focuses the image of the lining onto the end of a coherent bundle, which transmits the image in such a way that it may be viewed or photographed.
Electronic thermometers
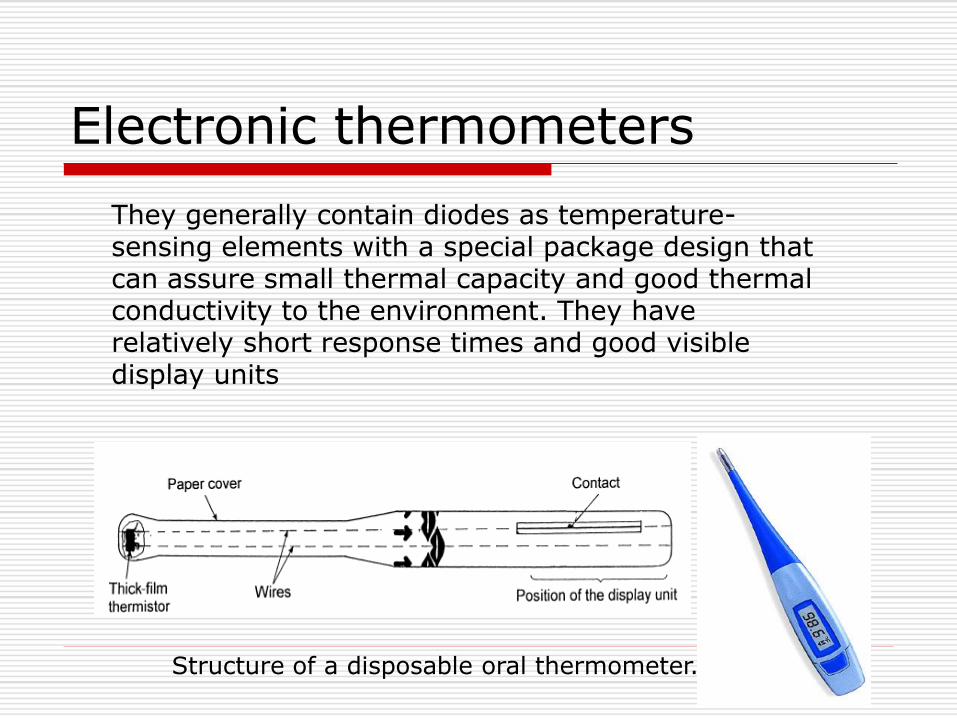
They generally contain diodes as temperature-sensing elements with a special package design that can assure small thermal capacity and good thermal conductivity to the environment. They have relatively short response times and good visible display units
Structure of a disposable oral thermometer.

Radiation Ear Thermometer
This version is based on a pyroelectric sensor. Thermal radiation flux from the auditory canal is channeled by the optical waveguide toward the pyroelectric sensor. When pressing the start button, the shutter opens momentarily, exposing the sensor to thermal radiation and replacing the radiation coming from the shutter itself. An ambient temperature sensor element is behind the shutter. The radiation reaches the sensor where it is converted into electric current impulse due to the pyroelectric effect
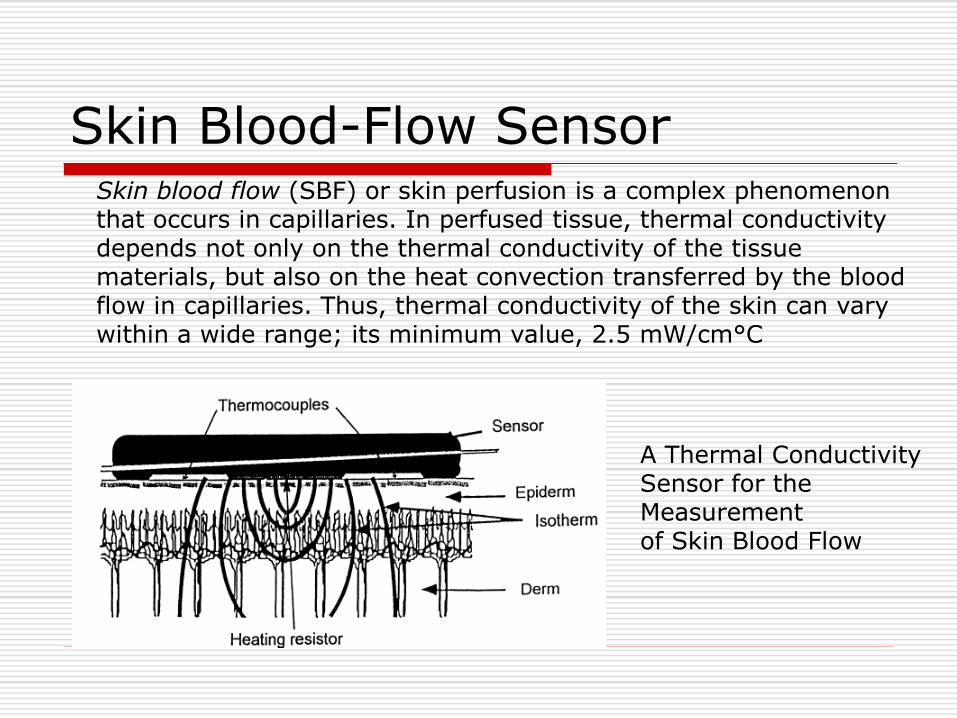
Skin Blood-Flow Sensor Skin blood flow (SBF) or skin perfusion is a complex phenomenon that occurs in capillaries. In perfused tissue, thermal conductivity depends not only on the thermal conductivity of the tissue materials, but also on the heat convection transferred by the blood flow in capillaries. Thus, thermal conductivity of the skin can vary within a wide range; its minimum value, 2.5 mW/cm°C
A Thermal Conductivity Sensor for the Measurement of Skin Blood Flow

Sensors for Pressure Pulses and Movement
Pulse sensing is a convenient and efficient way of acquiring important physiological information concerning the cardiovascular system. Finger pulse pickups can be employed in systems that measure blood pressure, heart rate, and blood flow
The pulse-wave signal is sent through the buffer to the signal-processing electronics. The PVDF film is in direct contact with the finger therefore, its metallized surfaces have to be shielded on both sides with thin metallized protecting polymer films and sealed with highly insulating silicone rubber to avoid damage to the surface electrodes

SENSORS IN ULTRASOUND IMAGING
The first and simplest ultrasound imaging systems applied the A-mode (amplitude modulation) imaging illustrated in Figure

ULTRASOUND IMAGING In B-mode (brightness modulation) imaging, all echo impulses are represented by a pixel on the display, and the brightness corresponds to the amplitude of the echo. To get a two-dimensional cross-sectional image, an appropriate scanning of the desired cross section is necessary
Scanning methods in B-mode ultrasound imaging: (a) sequential linear array scanner, (b) mechanical sector scanner, and (c) phased array sector scanne

The Doppler Blood-Flow Measurement
Doppler blood flow detectors operate by means of continuous sinusoidal excitation. The frequency difference calibrated for flow velocity can be displayed or transformed by a loudspeaker into an audio output.

X-ray Imaging System
In optically coupled CCD X-ray imaging system, X rays are impinged into a fluorescent screen and the image produced is then transferred onto the surface of an individual CCD by optical lenses

Optical Coherence Tomography
The technique of optical coherence tomography (OCT) provides a micronscale resolution cross-sectional image from the overall eyeball, not only from the retina. OCT is similar to B-scan ultrasonic imaging
Schematic diagram of optical coherence tomography instrumentation